
Exhibit 99.48
Cerro Prieto
Project, Heap Leach Project
Magdalena de Kino, State of Sonora, Mexico
Prepared for:
Goldgroup Mining Inc.
Suite 410 - 1111, Melville Street
Vancouver, BC V6E 3V6, Canada
Signed By Qualified Persons:
José Antonio Olmedo MSc, P. Eng. Geo, QP, SME Registered Member
Cristian Garcia, P. Eng., QP, Registered at Engineers and Geoscientists of British Columbia
Rodrigo R Carneiro MSc, QP, SME Registered Member
Report Effective Date: 4 April 2025
NI 43-101 Technical Report – Cerro Prieto Project
TABLE OF CONTENTS
| Page | |
| 1.0 SUMMARY | 2 |
| 1.1 Location, Access and Climate | 2 |
| 1.2 Terms of Reference and Purpose of this Technical Report | 3 |
| 1.3 Land Status | 4 |
| 1.4 Geology and Mineralization | 4 |
| 1.4.1 Regional and Local Geology | 4 |
| 1.4.2 Mineralization at Esperanzas Deposit | 4 |
| 1.4.3 Exploration Targets | 5 |
| 1.5 Deposit Types | 6 |
| 1.5.1 Deposit Type at Cerro Prieto | 6 |
| 1.5.2 Geological and Mineralizing Conditions | 7 |
| 1.5.3 Mineralization Characteristics | 7 |
| 1.5.4 Exploration Insights and Recommendations | 7 |
| 1.6 Exploration | 7 |
| 1.6.1 Historical Exploration | 7 |
| 1.6.2 Esperanzas Deposit Exploration (2023–2024) | 8 |
| 1.6.3 Exploration Targets | 10 |
| 1.6.4 2025 Exploration Program | 11 |
| 1.6.5 2025 Exploration Budget | 11 |
| 1.7 Drilling | 12 |
| 1.7.1 Drilling Methodology | 12 |
| 1.7.2 Drill Core Logging | 12 |
| 1.7.3 Drill Core Recovery and Quality | 12 |
| 1.7.4 Drill Survey | 12 |
| 1.8 Sampling Preparation, Analysis, and Security | 12 |
| 1.8.1 Introduction | 13 |
| 1.8.2 Sample Preparation and Analytical Methods | 13 |
| 1.8.3 Quality Assurance and Quality Control (QA/QC) | 13 |
| 1.8.4 Sample Security | 15 |
| 1.9 Data Verification | 15 |
Page i
NI 43-101 Technical Report – Cerro Prieto Project
| 1.9.1 Field Visit | 15 |
| 1.9.2 Statement of Confidence | 16 |
| 1.10 Mineral Resource Estimation | 16 |
| 1.10.1 Introduction | 16 |
| 1.10.2 Exploration Database Analysis | 16 |
| 1.10.3 Geological Model | 16 |
| 1.10.4 Assay Capping & Compositing | 18 |
| 1.10.5 Density | 18 |
| 1.10.6 Variography | 19 |
| 1.10.7 Block Model & Estimation | 19 |
| 1.10.8 Model Validation | 20 |
| 1.10.9 Resource Classification | 22 |
| 1.10.10 Mineral Resource Statement | 22 |
| 1.10.11 Mineral Resource Statement (Base Case at 0.2 g/t Au cutoff) | 25 |
| 1.10.12 Sensitivity Analysis | 25 |
| 1.10.13 Constraints Affecting MRE | 26 |
| 1.10.14 Conclusions | 26 |
| 1.10.15 Recommendations | 26 |
| 1.11 Mining Method | 26 |
| 1.11.1 Esperanzas Deposit Pit Optimization | 26 |
| 1.11.2 Mine Design for the Esperanzas Deposit | 27 |
| 1.12 Metallurgical Test Work | 29 |
| 1.12.1 Metallurgical Test Work Conducted in a Certified Commercial Laboratory | 30 |
| 1.13 Adjacent Properties | 33 |
| 1.13.1 Nearby Projects to Cerro Prieto Project | 33 |
| 1.13.2 Cerro Caliche Project Overview (Sonoro Gold Corp.) | 33 |
| 1.13.3 Cautionary Note | 34 |
| 1.14 Capital and Operating Costs | 34 |
| 1.14.1 Capital Costs | 34 |
| 1.14.2 Operating Costs | 35 |
| 1.15 Other Relevant Data and Information | 35 |
| 1.16 Interpretation and Conclusions | 35 |
| 1.16.1 Geology and Mineralization | 35 |
| 1.16.2 Exploration and Drilling | 36 |
Page ii
NI 43-101 Technical Report – Cerro Prieto Project
| 1.16.3 Mineral Resource Estimation | 36 |
| 1.16.4 Database Concern | 36 |
| 1.16.5 Forward-Looking Caution | 36 |
| 1.17 Recommendations | 37 |
| 1.17.1 Data and Infrastructure Improvements | 37 |
| 1.17.2 Heap Leaching Process Optimization | 38 |
| 2.0 INTRODUCTION | 39 |
| 2.1 Terms of Reference | 39 |
| 2.2 Qualified Persons | 39 |
| 2.3 Site Visits and Scope of Personal Inspections | 40 |
| 2.4 Information Sources and References | 42 |
| 2.5 Economic Analysis | 42 |
| 2.6 Units of Measure and Abbreviations | 43 |
| 3.0 RELIANCE ON OTHER EXPERTS | 45 |
| 3.1 Mineral Tenure and Royalties | 45 |
| 3.2 Surface and Water Rights | 45 |
| 3.3 Environmental Studies and Approvals and Permits | 45 |
| 4.0 PROPERTY DESCRIPTION AND LOCATION | 47 |
| 4.1 Location | 47 |
| 4.2 Land Holdings | 47 |
| 4.3 Mineral Tenure and Mining Lease Agreements | 47 |
| 4.4 Freedom to Operation Across Property | 48 |
| 5.0 ACCESSIBILITY, CLIMATE, LOCAL RESOURCES, INFRASTRUCTURE AND PHYSIOGRAPHY | 50 |
| 5.1 Access | 50 |
| 5.2 Climate | 50 |
| 5.3 Local Resources | 50 |
| 5.4 Comments | 50 |
| 6.0 HISTORY | 51 |
| 6.1 Historical Production of Cerro Prieto Mine (2017-2023) | 51 |
| 7.0 GEOLOGICAL SETTING AND MINERALIZATION | 53 |
| 7.1 Regional | 53 |
Page iii
NI 43-101 Technical Report – Cerro Prieto Project
| 7.2 Local Geology | 56 |
| 7.3 Mineralization at Esperanzas | 57 |
| 7.4 Significant Mineralized Zones | 60 |
| 7.4.1 Geological Overview of the Reyna Deposit | 60 |
| 7.4.2 Geological Overview of the Cata-Coatí Deposits | 62 |
| 7.4.3 Geological Overview of the Cascabel Deposit | 65 |
| 8.0 DEPOSIT TYPES | 67 |
| 8.1 Mineral Deposit | 67 |
| 9.0 EXPLORATION | 70 |
| 9.1 Historical Exploration | 70 |
| 9.2 Esperanzas Deposit Exploration Program | 70 |
| 9.2.1 Coordinate System | 70 |
| 9.2.2 Surface Sampling | 71 |
| 9.3 Exploration Targets | 73 |
| 9.3.1 Reyna Deposit Exploration | 74 |
| 9.3.2 Cata, Coatí, and Cascabel Deposits Exploration | 75 |
| 9.4 2025 Exploration Program | 76 |
| 9.5 2025 Exploration Budget | 77 |
| 10.0 DRILLING | 78 |
| 10.1 Drilling Methodology | 78 |
| 10.2 Drill Core Logging Methodology | 79 |
| 10.3 Drill Core Recovery | 79 |
| 10.4 Drill Survey | 80 |
| 11.0 SAMPLE PREPARATION, ANALYSIS AND SECURITY | 82 |
| 11.1 Introduction | 82 |
| 11.2 Sample Analytical Methods | 82 |
| 11.2.1 Sample Preparation | 83 |
| 11.2.2 Analytical Method | 84 |
| 11.3 Quality Assurance and Quality Control (QA/QC) | 84 |
| 11.3.1 Cerro Prieto Lab Analytical Check | 84 |
| 11.3.2 Blanks, Standards, and Duplicates | 96 |
| 11.3.3 Blanks | 97 |
Page iv
NI 43-101 Technical Report – Cerro Prieto Project
| 11.3.4 Standards | 98 |
| 11.3.5 Duplicates | 101 |
| 11.3.6 Opinion of Results on ALS Chemex Certified Lab | 101 |
| 11.4 Sample Security | 101 |
| 11.5 Adequacy of Results | 102 |
| 12.0 DATA VERIFICATION | 103 |
| 12.1 Mine Reconciliation | 103 |
| 12.2 Site Inspections | 103 |
| 12.2.1 Site Inspection by a QP in Geology | 103 |
| 12.2.2 Site Inspection by a QP in Mining | 105 |
| 12.2.3 Site Inspection by a QP in Metallurgy | 106 |
| 13.0 MINERAL PROCESSING AND METALLURGICAL TESTING | 107 |
| 13.1 Metallurgical Test Work Conducted in a Certified Commercial Laboratory | 107 |
| 14.0 MINERAL RESOURCES ESTIMATES | 112 |
| 14.1 Introduction | 112 |
| 14.2 Exploration Database Analysis | 113 |
| 14.2.1 Coordinate Systems | 113 |
| 14.2.2 Drilling Database | 114 |
| 14.2.3 Exploratory Data Analysis | 115 |
| 14.2.4 Topography | 117 |
| 14.3 Geological Model | 117 |
| 14.4 Assay Capping and Compositing Analysis | 120 |
| 14.4.1 Capping Analysis | 120 |
| 14.4.2 Assay Compositing | 121 |
| 14.5 Density | 123 |
| 14.6 Variogram Analysis and Modeling | 127 |
| 14.6.1 Variography | 127 |
| 14.7 Block Model and Estimation Methodology | 129 |
| 14.8 Model Validation | 130 |
| 14.8.1 Visual Validation | 130 |
| 14.8.2 Global Bias | 132 |
| 14.8.3 Swath Plots | 135 |
| 14.9 Resource Classification | 136 |
Page v
NI 43-101 Technical Report – Cerro Prieto Project
| 14.10 Mineral Resource Statement | 138 |
| 14.11 Mineral Resource Sensitivity | 141 |
| 14.12 Constraints (Factors) that may Affect the Mineral Resource Estimate | 142 |
| 14.13 Conclusions | 142 |
| 14.14 Recommendations | 143 |
| 15.0 MINERAL RESERVE ESTIMATES | 144 |
| 16.0 MINING METHOD | 145 |
| 16.1 Overview | 145 |
| 16.2 Open Pit Mine Design | 145 |
| 16.3 Key Design Criteria | 145 |
| 16.4 Geotechnical Considerations | 145 |
| 16.5 Haul Roads | 145 |
| 16.3 Pit Optimization | 146 |
| 16.3.1 Optimization Parameters | 146 |
| 16.3.2 Whittle Pit Selection | 146 |
| 16.3.3 Mining Loss and Dilution | 147 |
| 16.3.4 Detailed Pit Design | 147 |
| 16.3.5 Ore Material Stockpiles | 150 |
| 16.3.6 Waste Rock Storage Facilities | 151 |
| 16.4 Production Schedule | 151 |
| 16.5 Mine Operations and Equipment Selection | 151 |
| 17.0 EXISTING CERRO PRIETO RECOVERY METHODS | 153 |
| 17.1 Ore Handling, Crushing and Screening | 153 |
| 17.2 Crushing Plant | 153 |
| 17.3 Sampler | 154 |
| 17.4 Manpower Required | 154 |
| 17.4.1 Crushing Plant and ADR Plant | 154 |
| 17.4.2 Heap Leaching: | 155 |
| 17.5 Adsorption, Desorption and Recovery Plant (ADR Plant) | 155 |
| 17.5.1 ADR Process | 155 |
| 17.5.2 Historical Reagent and Power Consumptions | 156 |
| 17.6 Cerro Prieto Mine Smelter Terms | 156 |
| 17.7 Cerro Prieto Mine Heap Leach Operation | 156 |
Page vi
NI 43-101 Technical Report – Cerro Prieto Project
| 17.7.1 Design of the Facility | 156 |
| 17.7.2 Existing Backup Systems | 156 |
| 17.8 Existing Conveying and Stacking | 157 |
| 17.8.1 Support Equipment | 157 |
| 17.9 Heap Leach Solution Management | 157 |
| 17.9.1 Solution Application Practice | 157 |
| 17.9.2 Water Required | 158 |
| 18.0 EXISTING PROJECT INFRASTRUCTURE | 159 |
| 18.1 Site Access | 159 |
| 18.2 Communication | 159 |
| 18.3 Buildings | 159 |
| 18.4 Waste Disposal | 159 |
| 18.5 Water Required and Water Supply | 159 |
| 18.6 Power Required and Power Supply | 159 |
| 18.7 Workshop Warehouse, Offices and Wash Bay | 160 |
| 18.8 Security | 160 |
| 18.9 Assay Laboratory | 160 |
| 19.0 EXISTING MARKET STUDIES AND CONTRACTS | 161 |
| 19.1 Market Studies and Commodity Price Analyses | 161 |
| 19.2 Material Contracts for Property Development and Operations | 161 |
| 20.0 ENVIRONMENTAL STUDIES, PERMITTING AND COMMUNITY IMPACT | 162 |
| 20.1 Environmental Studies and Issues | 162 |
| 20.2 Waste, Tailings, and Water Management | 162 |
| 20.3 Permitting Status | 162 |
| 20.4 Community Relations | 163 |
| 20.5 Mine Closure and Reclamation | 164 |
| 20.6 Reliance and Cautionary Statement | 164 |
| 21 CAPITAL AND OPERATING COSTS | 165 |
| 21.2 Capital Costs | 165 |
| 21.3 Operating Costs | 166 |
| 22.0 ECONOMIC ANALYSIS | 167 |
| 22.1 Methodology | 167 |
Page vii
NI 43-101 Technical Report – Cerro Prieto Project
| 22.2 Financial Model Parameters | 167 |
| 22.2.1 Basic Parameters | 167 |
| 22.2.2 Gold and Silver Prices | 167 |
| 22.2.3 Gold and Silver Production | 167 |
| 22.3 Financial Model | 167 |
| 22.3.1 Net Smelter Returns | 167 |
| 22.3.2 Sales Taxes | 167 |
| 22.3.3 Property Taxes | 167 |
| 22.3.4 Reclamation and Closure Costs | 167 |
| 22.3.5 NSR Royalty and State Fees | 168 |
| 22.4 Capital Cost Estimates | 168 |
| 22.5 Cash Flow Analysis | 168 |
| 22.5.1 After-tax Cash Flow Analysis | 168 |
| 22.5.2 Sensitivity Analysis | 171 |
| 23.0 ADJACENT PROPERTIES | 173 |
| 23.1 Cerro Caliche Project Overview (Sonoro Gold Corp.) | 173 |
| 23.2 Cautionary Note | 173 |
| 24.0 OTHER RELEVANT DATA AND INFORMATION | 174 |
| 25.0 INTERPRETATION AND CONCLUSIONS | 175 |
| 25.1 Geology and Mineralization | 175 |
| 25.2 Exploration and Drilling | 175 |
| 25.3 Mineral Resource Estimation | 175 |
| 25.4 Forward-Looking Caution | 176 |
| 26.0 RECOMMENDATIONS | 177 |
| 26.1 Recommendation on Mineral Resources | 177 |
| 26.2 Recommendations on Mine Design | 178 |
| 26.3 Recommendations on Mineral Processing | 179 |
| 27.0 REFERENCES | 180 |
Page viii
NI 43-101 Technical Report – Cerro Prieto Project
List of Tables
Page
| Table 1 - 2025 Exploration Budget | 11 | |
| Table 2 - Estimates of the Esperanzas Deposit’ Inferred Mineral Resources Using Oroco’s Assays Database. Source: JAO 2025 | 23 | |
| Table 3 - Estimates of the Esperanzas Deposit’ Inferred Mineral Resources using Oroco’s assays database. Source: JAO 2025 | 23 | |
| Table 4 - Technical Parameters of the Esperanzas Deposit Pit Optimization | 27 | |
| Table 5 - Mine Design for the Esperanzas Deposit | 27 | |
| Table 6 - Summary of the Detailed Esperanzas Deposit Pit Shell | 28 | |
| Table 7 - Opportunity to Bring Forward a Pocket of High-Grade Ore from a Small Pit North of the Esperanzas Deposit. Period April 2025 Through April 2026 | 29 | |
| Table 8 - Cyanide Boll Roll Leach Testing on the Esperanza Composites | 30 | |
| Table 9 - Budget Capital Costs from April 2025 through April 2026 | 34 | |
| Table 10 - 2025 Exploration Budget | 35 | |
| Table 11 - QPs Areas of Responsibility and Site Visits | 38 | |
| Table 12 - Summary of Economic Analysis (April 2025 through April 2026) | 40 | |
| Table 13 - Units of Measure and Abbreviations | 42 | |
| Table 14 - Cerro Prieto Mining Concessions | 43 | |
| Table 15 - Historical Ore Processed in the Crushing Plant | 49 | |
| Table 16 - Historical Ore Processed in Heap Leaching | 52 | |
| Table 17 - Historical Gold and Silver Recovered in the ADR Plant | 52 | |
| Table 18 - Highlights of recent surface chip sampling at the Cata. Coati and Cascabel Deposits. Source: Oroco, 2025 | 52 | |
| Table 19 - 2025 Exploration Budget | 75 | |
| Table 20 - DDH Program Conducted from March to April 2023 | 76 | |
| Table 21 - DDH Program Conducted in May 2023 | 79 | |
| Table 22 - DDH Program Conducted in July 2023 | 80 | |
| Table 23 - DDH Program Conducted in September 2023 | 80 | |
| Table 24 -DDH: CP384, Coordinates: 3366693.15 N, 532700.72 E, Elevation: 1,179.15 m | 80 | |
| Table 25 - DDH: CP386, Coordinates: 3366657.113 N, 532677.33 E, Elevation: 1,165.7 m | 84 | |
| Table 26 - DDH: CP390, Coordinates: 3366649.87 N, 532571.47 E, Elevation: 1,144.9 m | 84 | |
| Table 27 - DDH: CP209, Coordinates: 3367049.026 N, 532521.57 E, Elevation: 1,091 m | 84 | |
| Table 28 - DDH: CP210, Coordinates: 3367059.165 N, 532500.963 E, Elevation: 1,078.3 m | 84 |
Page ix
NI 43-101 Technical Report – Cerro Prieto Project
| Table 29 - DDH: CP211, Coordinates: 3366830.49 N, 532544.069 E; Elevation: 1,158 m | 85 | |
| Table 30 - DDH: CP212, Coordinates: 3366951.691 N, 532621.792 E, Elevation: 1,173 m | 85 | |
| Table 31 - DDH: CP214, Coordinates: 3367020.246 N, 532571.02 E, Elevation: 1,118.8 m | 85 | |
| Table 32 - DDH: CP215, Coordinates: 3366921.672 N, 532520.72 E, Elevation: 1,128 m | 85 | |
| Table 33 - DDH: CP220, Coordinates: 366730.907 N, 532581.525 E, Elevation: 1,156.03 m | 85 | |
| Table 34 - DDH: CP221, Coordinates: 366704 N, 532591 E, Elevation: 1,150 m | 86 | |
| Table 35 - DDH: CP222, Coordinates: 3366959.05 N., 532580.5 E., Elevation: 1,154 m | 86 | |
| Table 36 - DDH: CP223, Coordinates: 3366740.383 N., 532612.79 E., Elevation: 1,170 m | 86 | |
| Table 37 - DDH: CP224, Coordinates: 3366759.432 N., 532589.122 E., Elevation: 1170.7 m | 86 | |
| Table 38 - DDH: CP225, Coordinates: 3366636 N., 532611 E., Elevation: 1,148 m | 87 | |
| Table 39 - DDH: CP362, Coordinates: 3366839.536 N, 532682.951 E, Elevation: 1,247.982 m | 87 | |
| Table 40 - DDH: CP363, Coordinates: 3366829.044 N, 532717.833 E, Elevation: 1,226 m | 87 | |
| Table 41 - DDH: CP364, Coordinates: 3366866.743 N, 532687.48 E, Elevation: 1,245.897 m | 88 | |
| Table 42 -DDH: CP365, Coordinates: 3366969 N., 532663 E., Elevation: 1,187 m | 88 | |
| Table 43 - DDH: CP366, Coordinates: 3366862.8 N., 532674.73 E., Elevation: 1,246 m | 88 | |
| Table 44 -Table 11.21 DDH: CP367, Coordinates: 3366850 N., 532707 E., Elevation: 1,236.2 m | 88 | |
| Table 45 - DDH: CP370, Coordinates: 3366822.166 N., 532688.87 E., Elevation: 1,242.39 m | 89 | |
| Table 46 - DDH: CP371, Coordinates: 3366873.763 N, 532707.12 E, Elevation: 1,246.3 m | 89 | |
| Table 47 - DDH: CP372, Coordinates: 3366860.76 N, 532742.66 E, Elevation: 1,227.72 m | 89 | |
| Table 48 - DDH: CP373, Coordinates: 3366860.76 N, 532742.66 E, Elevation: 1,227.72 m | 90 | |
| Table 49 - DDH: CP374; Coordinates: 3366791.41 N, 532695.63 E; Elevation: 1,224 m | 90 | |
| Table 50 - DDH: CP375, Coordinates: 3366687.685 N., 532653.179 E., Elevation: 1,180.61 m | 90 | |
| Table 51 - DDH: CP376, Coordinates: 366968.56 N, 532678.612 E, Elevation: 1,186 m | 90 | |
| Table 52 -DDH: CP377, Coordinates: 3367055.917 N, 532585.5 E, Elevation: 1,116 m | 91 | |
| Table 53 - DDH: CP378, Coordinates: 3367081.469 N., 532545.41 E., Elevation: 1,091 m | 91 | |
| Table 54 - DDH: CP382, Coordinates: 366617.88 N., 532539.136 E., Elevation: 1,138 m | 91 | |
| Table 55 - DDH: CP384, Coordinates: 3366693.15 N., 532700.72 E., Elevation: 1,179.15 m | 91 | |
| Table 56 - DDH: CP387, Coordinates: 3366725.656 N., 532563.2 E., Elevation: 1,145 m | 92 | |
| Table 57 - DDH: CP388, Coordinates: 3366683.51 N., 532597.49 E., Elevation: 1,154 m | 92 | |
| Table 58 - DDH: CP389, Coordinates: 3366663.65 N., 532614.616 E., Elevation: 1,155 m | 92 | |
| Table 59 - DDH: CP405, Coordinates: 333366879.014 N, 532708.93 E, Elevation: 1,245.1 m | 92 | |
| Table 60 - DDH: CP406, Coordinates: 3366889.46 N, 532725.54 E, Elevation: 1,245 m | 92 |
Page x
NI 43-101 Technical Report – Cerro Prieto Project
| Table 61 - DDH: CP412; Coordinates: 3366866.74 N, 532687.48 E; Elevation: 1245.89 m | 93 | |
| Table 62 - Blanks and Standards ALS Chemex | 93 | |
| Table 63 - Blank ALS Analysis Data. Source: JAO, 2025 | 95 | |
| Table 64 - Standard Rock Lab Code: OxL159, ALS Analysis Data. Source: JAO, 2025 | 96 | |
| Table 65 - Standard Rock Lab Code: OxG141, ALS Analysis Data. Source: JAO, 2025 | 97 | |
| Table 66 - Standard Rock Lab Code: OxC152, ALS Analysis Data. Source: JAO, 2025 | 98 | |
| Table 67 - Gold and Silver Assays on the Esperanza and Nueva Esperanza Composites | 99 | |
| Table 68 - 32-Element ICP-OES on Composite Samples | 106 | |
| Table 69 - Cyanide Bottle Boll Roll Leach Testing on Composite Samples | 107 | |
| Table 70 - Locked Cycle Cyanide Column Testing on the Esperanza Composite | 108 | |
| Table 71 - Locked Cycle Cyanide Column Testing on the Nueva Esperanza Composite | 109 | |
| Table 72 - Central Tendency Statistics of Drill Holes and Trenches (Uncapped). Source: JAO 2025 | 109 | |
| Table 73 - Statistical Dispersion of Drill Holes and Trenches (Uncapped). Source: JAO 2025 | 114 | |
| Table 74 - Confidence Intervals for the Gold Dataset. Source: JAO 2025 | 114 | |
| Table 75 - Summary Statistics and Quantities. Source: JAO 2025 | 115 | |
| Table 76 - Quantile Range Exploration. Source: JAO 2025 | 115 | |
| Table 77 - Statistics Summary for raw assays and composite datasets. Source: JAO 2025 | 119 | |
| Table 78 - Estimates of the Esperanzas Deposit's Measured and Indicated Mineral Resources Using Oroco’s Assays Database. Source: JAO 2025 | 121 | |
| Table 79 - Estimates of the Esperanzas Deposit’s Inferred Mineral Resources Using Oroco’s Assays Database. Source: JAO 2025 | 138 | |
| Table 80 - Key Design Criteria | 138 | |
| Table 81 - Optimization Parameters | 144 | |
| Table 82 - Mineable Resources | 145 | |
| Table 83 - Production Plan Details | 146 | |
| Table 84 - Production Equipment Fleet | 150 | |
| Table 85 - Manpower Requirement Per Process Area | 151 | |
| Table 86 - Historical Reagents and Power Consumptions | 153 | |
| Table 87 - Permitting | 155 | |
| Table 88 - Summary Budget 2025 Capital Costs (Crushing Plant, Heavy Equipment, Light Vehicles, Exploration, IT and Metallurgy) | 162 | |
| Table 89 - Summary Budget 2025 Capital Costs, Continue (ADR Plant, Chemical Laboratory, Medical Service and HR, Contingency and Back UPS) | 164 | |
| Table 90 - Budget Operating Costs (USD) April 2025 Through April 2026 | 164 |
Page xi
NI 43-101 Technical Report – Cerro Prieto Project
| Table 91 - Total Production Cost in USD, April 2025 Through April 2026 | 165 | |
| Table 92 - Cash Flow in USD, April 2025 Through April 2026 | 168 |
List of Figures
Page
| Figure 1 - Aerial Photograph Showing Estimated Block Model Mineral Resources of the Esperanzas Deposit | 3 | |
| Figure 2 - Geological Interpretation of the Esperanzas Deposit. A) Fault Core Compression; B) Puma Imbricated Thrust – Ramp; C) Nueva Esperanza Imbricated Thrust-Fault; D) Esperanza Tensile Opening in Trans-Tensional Wedge (Soft Boundary); E) Fault Core Compression and Riedels; F) Splay Fracturing along Compression Edges. Source: JAO, 2025 | 5 | |
| Figure 3 - Cerro Prieto Historical Mining Zones. Source: Oroco, 2025 | 8 | |
| Figure 4 - Esperanzas’ Leapfrog 3D Scene Section Showing Drill Holes and Surface Samples: Source: JAO, 2025 | 9 | |
| Figure 5 - Cerro Prieto Mineralized Zones. Source: Oroco, 2025 | 10 | |
| Figure 6 - Dispersion Graph. The graph compares samples analysed at Cerro Prieto (CoP) and ALS labs. CoP prepared and tested the samples, while the rejects were sent to ALS for verification. Source: JAO, 2025 | 14 | |
| Figure 7 -This shows a 3D orthographic view of the Esperanza digital terrain and underlying domain models. The black line indicates the section depicted in Figure 7. Source: JAO 2025 | 17 | |
| Figure 8 - This section displays the current topographic profile, drill holes, and domain solid; the section's location is indicated in Figure - 9. Source: JAO 2025 | 17 | |
| Figure 9 - Geological Interpretation of the Esperanzas Deposit. A) Fault Core Compression; B) Puma Imbricated Thrust – Ramp; C) Nueva Esperanza Imbricated Thrust-Fault; D) Esperanza Tensile Opening in Trans-Tensional Wedge (Soft Boundary); E) Fault Core Compression and Riedels; F) Splay Fracturing along Compression Edges. Source: JAO 2025 | 18 | |
| Figure 10 - The block model is evaluated against the 3D density model. The density values (in g/cm³) are displayed on the color scale. Source: JAO 2025 | 19 | |
| Figure 11 - The final interpolated Au block model is enclosed within the 3D density model (gray body). Source: JAO 2025 | 20 | |
| Figure 12 - Section view (left) and plan view (right) at the Esperanzas Deposit (drill holes display 2-meter composite samples; the Au ppm color scale applies to both the block model and drill holes). Source: JAO 2025 | 20 | |
| Figure 13 - Box plots comparing the statistical values of block values and drill composites. Source: JAO 2025 | 21 | |
| Figure 14 - Block Models: Plan View, Longitudinal View (Looking East), and Cross-Section View (Looking North). Source JAO 2025 | 21 | |
| Figure 15 - The sample section shows the Esperanzas block model, indicating the number of samples used to evaluate each block (cyan 1 to 5, orange >5 to 20, and red more than 20 samples). Red and green outlines indicate the distance to samples (red = 25 m, green >25 and ≤ 40 m). The gray shadow behind the block model indicates the mineralized domain limit. Source: JAO, 2025 | 22 |
Page xii
NI 43-101 Technical Report – Cerro Prieto Project
| Figure 16 - Esperanzas Block Model Au Grade and Tonnage Graph. Sensitivity of the Esperanzas Deposit Mineral Resource Estimate to variations in the Au cutoff grade. Source: JAO 2025 | 25 | |
| Figure 17 - Mine Design for the Esperanzas Deposit | 28 | |
| Figure 18 - Production Schedule for the Esperanzas Deposit | 29 | |
| Figure 19 - Gold Extraction on the Esperanza Composite | 31 | |
| Figure 20 - Silver Extraction on the Esperanza Composite | 31 | |
| Figure 21 - Gold Extraction on the Nueva Esperanza Composite | 32 | |
| Figure 22 - Silver Extraction on the Nueva Esperanza Composite | 32 | |
| Figure 23 - Location of the Cerro Prieto Project in the State of Sonora, Mexico. Source Duncan Bain Consulting LTD | 47 | |
| Figure 24 – Locations of Pits, Office & Camp, Mined Zones, Esperanza Deposit, Advanced Exploration Zones, Early Exploration Zones, Crushing Plant, Heap Leach, ADR Plant (Chemical Plant). Source: Goldgroup 2025 | 48 | |
| Figure 25 - Regional Geological Map. Source: Mexican Geological Service (SGM) | 54 | |
| Figure 26 - Regional Stratigraphic Column. Source: Mexican Geological Service (SGM) 56 | 55 | |
| Figure 27 - Local geology showing the Esperanzas geological setting. Source: Goldgroup, 2025 | 56 | |
| Figure 28 - Schematic diagram illustrating the compression and tension quadrants associated with the orientations of the principal stress directions. Observed fault zones, fractures, and veins in pit walls and along exploration road cuts align with the orientation of the Cerro Prieto fault zone | 57 | |
| Figure 29 - Esperanzas Deposit Geological Map. It displays exploration drill holes, with the stratigraphy legend identical to that in Figure 32. Source: Goldgroup, 2024 | 58 | |
| Figure 30 - Esperanzas’ Zones Typical Vein Mineralization | 59 | |
| Figure 31 - Geological Interpretation of the Esperanzas Deposit. A) Fault Core Compression; B) Puma Imbricated Thrust – Ramp; C) Nueva Esperanza Imbricated Thrust-Fault; D) Esperanza Tensile Opening in Trans-Tensional Wedge (Soft Boundary); E) Fault Core Compression and Riedels; F) Splay Fracturing along Compression Edges. Source: JAO, 2025 | 59 | |
| Figure 32 - Location of Cerro Prieto Exploration Targets. Source: Goldgroup, 2025 | 60 | |
| Figure 33 - Reyna Deposit Geological Map. Source: Goldgroup, 2025 | 61 | |
| Figure 34 - Cata-Coatí Deposits Geological Map. Source: Goldgroup, 2025 | 62 | |
| Figure 35 - The Cascabel Deposit Geological Map displays old mining works, preliminary drilling, and gold values above 0.1 g/t Au. Source: Goldgroup, 2025 | 66 | |
| Figure 36 - Low and High Sulfidation Systems. Source: J. Hedenquist, 1994 | 68 | |
| Figure 37 - Schematic Reconstruction Low-Sulfidation Deposit. Source: J. Hedenquist, A. Arribas, E, González, 2000 | 68 |
Page xiii
NI 43-101 Technical Report – Cerro Prieto Project
| Figure 38 - Cerro Prieto Historical Mining Zones. Source: Oroco, 2025 | 70 | |
| Figure 39 - DDH Location, Mineralization, Planned Open Pit Shell, Structures, Lithology, and Au Grade >0.1 g/t. Source: Oroco, 2025 | 71 | |
| Figure 40 - Esperanzas’ Section 1000 – CP362, CP367, PBEE13, displaying values greater than 2.0 g/t Au. Source: Oroco, 2025 | 72 | |
| Figure 41 - Esperanzas’ Leapfrog 3D Scene Section showing drill holes and trench samples: Source: JAO, 2025 | 72 | |
| Figure 42 - Cerro Prieto Mineralized Zones. Source: Oroco, 2025 | 73 | |
| Figure 43 - Reyna Exploration Target. Source: Oroco, 2025 | 74 | |
| Figure 44 - Reyna Deposit Trench Sampling Results. Source: Oroco, 2025 | 74 | |
| Figure 45 - Cata, Coatí, and Cascabel Deposits Trench Sampling Results. Source: Oroco, 2025 | 75 | |
| Figure 46 - Caterpillar D-9 Tractor. Source: Oroco, 2025 | 78 | |
| Figure 47 - Dispersion Graph. The graph compares samples analyzed at Cerro Prieto (CoP) and ALS labs. CoP prepared and tested the samples, while the rejects were sent to ALS for verification | 95 | |
| Figure 48 - Blanks vs Previous Sample Au ppm. Pulp blank samples sent to ALS (17). Source: JAO, 2025 | 98 | |
| Figure 49 - Statistics Control Standard Rock Labs OxL159. Source, JAO, 2025 | 99 | |
| Figure 50 - Statistics Control Standard Rock Labs OxG141. Source, José Antonio Olmedo MSc, P. Eng. Geo, QP, SME Registered Member, 2025 | 100 | |
| Figure 51 - Statistics Control Standard Rock Labs OxG141. Source, JAO, 2025 | 101 | |
| Figure 52 - Aerial photograph showing estimated block model mineral resources of the Esperanzas Deposit. Source: JAO 2025 | 113 | |
| Figure 53 - Histogram Plot Au-ppm. Source: JAO. 2024 | 117 | |
| Figure 54 - This shows a 3D orthographic view of the Esperanza digital terrain and underlying domain models. The black line indicates the section depicted in Figure 55. Source: JAO 2025 | 118 | |
| Figure 55 - This section displays the current topographic profile, drill holes, and domain solid; the section's location is indicated in Figure 56. Source: JAO 2025 | 119 | |
| Figure 56 - Mean Au values (red line) related to the domain solid | 119 | |
| Figure 57 - Inflection Points from Probability CFD Plot. Source: JAO 2025 | 120 | |
| Figure 58 - Shadowgram, Outlier Box Plot, and Normal Quantile Plot. Source: JAO 2025 | 121 | |
| Figure 59 - Statistical analysis of the length interval of raw assays (zoomed from 0 to 20 meters). Source: JAO 2025 | 122 | |
| Figure 60 - Esperanzas Deposit drill holes display the measured samples for density. The density values are presented on a color scale in the upper right corner of the figure. Source: JAO 2025 | 123 |
Page xiv
NI 43-101 Technical Report – Cerro Prieto Project
| Figure 61 - The final interpolated Au block model is enclosed within the 3D density model (gray body). Source: JAO 2025 | 124 | |
| Figure 62 -This section displays the Au-interpolated block model within the 3D representation of interpolated density (black outline). For blocks outside the density-interpolated body (for example, in the mid-section area), a value of 2.09005 g/cm3 (minimum database linear value) was assigned. Source: JAO 2025 | 124 | |
| Figure 63 - The block model is evaluated against the 3D density model. The density values (in g/cm³) are displayed on the color scale. Source: JAO 2025 | 125 | |
| Figure 64 - Shows a block model filtered to display density values equal to or greater than the mean density value (2.41656 gr/cm3) in the dataset. Source: JAO 2025 | 126 | |
| Figure 65 -The block model displays values corresponding to the minimum density value based on the dataset. Source: JAO 2025 | 127 | |
| Figure 66 - illustrates the transformed variogram for Au, highlighting the major, semi-major, and minor axes. Source: JAO 2025 | 128 | |
| Figure 67 - A Hermite Fit Graph Displays Back-Transformed Data in Red and the Original Linear (raw) Data in Blue. Source: JAO 2025 | 129 | |
| Figure 68 - Geological Interpretation of the Esperanzas Deposit. A) Fault Core Compression; B) Puma Imbricated Thrust – Ramp; C) Nueva Esperanza Imbricated Thrust-Fault; D) Esperanza Tensile Opening in Trans-Tensional Wedge (Soft Boundary); E) Fault Core Compression and Riedels; F) Splay Fracturing along Compression Edges. Source: JAO 2025 | 130 | |
| Figure 69 - Section View (left) and Plan View (right) at the Esperanzas Deposit (Drill Holes Display 2-meter Composite Samples; the Au ppm Color Scale Applies to Both the Block Model and Drill Holes). Source: JAO 2025 | 131 | |
| Figure 70 - Section View (Left) and Plan View (Right) of the Esperanzas Deposit (Drill Holes Displaying 2-meter Composite Samples; the Au ppm Color Scale Applies to Both the Block Model and the Drill Holes). Source: JAO 2025 | 131 | |
| Figure 71 - Section View (Left) and Plan View (Right) of the Esperanzas Deposit (Drill Holes Indicate 2-meter Composite Samples; the Au ppm Color Scale Applies to Both the Block Model and Drill Holes). Source: JAO 2025 | 132 | |
| Figure 72 - Section View (Left) and Plan View (Right) of the Esperanzas Deposit (Drill Holes Indicate 2-meter Composite Samples; the Au ppm Color Scale Applies to Both the Block Model and Drill Holes). Source JAO 2025 | 132 | |
| Figure 73 - Box Plots Comparing the Statistical Values of Block Values and Drill Composites. Source: JAO 2025 | 133 | |
| Figure 74 - Drill Composites: Plan View, Longitudinal View (Looking East), and Cross Section View (Looking North). Source: JAO 2025 | 134 | |
| Figure 75 - Block Models: Plan View, Longitudinal View (Looking East), and Cross-Section View (Looking North). Source JAO 2025 | 134 | |
| Figure 76 - Au ppm Swath Plot in X Space for OKrg and IDW3 Estimators of the Esperanza Deposit. Source: JAO 2025 | 135 | |
| Figure 77 - Au ppm Swath Plot in Y-Space for OKrg and IDW3 Estimators of the Esperanzas Deposit. Source: JAO 2025 | 135 |
Page xv
NI 43-101 Technical Report – Cerro Prieto Project
| Figure 78 - Au ppm Swath Plot in Z Space for OKrg and IDW3 Estimators Regarding the Esperanzas Deposit. Source: JAO, 2025 | 136 | |
| Figure 79 - The sample section shows the Esperanzas block model, indicating the number of samples used to evaluate each block (cyan 1 to 5, orange >5 to 20, and red more than 20 samples). Red and green outlines indicate the distance to samples (red = 25 m, green >25 and ≤ 40 m). The gray shadow behind the block model indicates the mineralized domain limit. Source: JAO, 2025 | 138 | |
| Figure 80 - Esperanzas Block Model Au Grade and Tonnage Graph. Sensitivity of the Esperanzas Mineral Resource Estimate to variations in the Au cutoff grade. Source: JAO 2025 | 142 | |
| Figure 81 - Pit by Pit Graph | 147 | |
| Figure 82 - Cross Section of Whittle Pit and Design Pit | 148 | |
| Figure 83 - Plan view of Whittle Shell (brown outline) and Detailed Design Boundary (red line) | 149 | |
| Figure 84 - Plan View of Ultimate Pit Design | 150 | |
| Figure 85 - Production Plan | 151 | |
| Figure 86 - Time Usage Model | 152 | |
| Figure 87 - Plan View of the Crushing Plant Circuit, Heap Leach Area & ADR Plant. Source: Mina de Oroco 2024 | 153 | |
| Figure 88 – Project Pre-Tax NPV Sensitivity | 172 | |
| Figure 89 – Project After-Tax NPV Sensitivity | 173 |
Page xvi
NI 43-101 Technical Report – Cerro Prieto Project
FORWARD LOOKING INFORMATION
This Technical Report contains “forward-looking information” and “forward-looking statements” within the meaning of applicable Canadian and the United States securities legislation which involve a number of risks and uncertainties. Forward-looking information and forward-looking statements include, but are not limited to, statements with respect to the future prices of gold, the estimation of Mineral Resources and reserves, the realization of mineral estimates, the timing and amount of estimated future production, costs of production, capital expenditures, costs (including capital costs, operating costs and other costs) and timing of the life of mine, rates of production, annual revenues, requirements for additional capital and government regulation of mining operations.
Often, but not always, forward-looking statements can be identified by the use of words such as “plans”, “expects”, or “does not expect”, “is expected”, “budget”, “scheduled”, “estimates”, “forecasts”, “intends”, “anticipates”, or “does not anticipate”, or “believes”, or variations of such words and phrases or state that certain actions, events or results “may”, “could”, “would”, “might” or “will” be taken, occur or be achieved.
Forward-looking statements are based on the opinions, estimates and assumptions of contributors to this report. Certain key assumptions are discussed in more detail. Forward-looking statements involve known and unknown risks, uncertainties and other factors which may cause the actual results, performance or achievements of the Company to be materially different from any other future results, performance or achievements expressed or implied by the forward-looking statements. Such factors include, among others: the actual results of current development activities; conclusions of economic evaluations; capital and operating cost forecasts; changes in project parameters as plans continue to be refined; future prices of gold and other metals; possible variations in mineral grade or recovery rates; failure of plant, equipment or processes to operate as anticipated; accidents, labor disputes, climate change risks and other risks of the mining industry; delays in obtaining governmental approvals or financing or in the completion of development or construction activities; shortages of labor and materials; changes to regulatory or governmental royalty and tax rates; environmental risks and unanticipated reclamation expenses; the impact on the supply chain and other complications associated with pandemics, including global health crises; title disputes or claims, and timing and possible outcome of pending legal or regulatory proceedings; as well as those risk factors discussed or referred to in this Technical Report and in the Company’s documents filed from time to time with the securities regulatory authorities.
There may be other factors than those identified that could cause actual actions, events or results to differ materially from those described in forward-looking statements, there may be other factors that cause actions, events or results not to be anticipated, estimated or intended. There can be no assurance that forward-looking statements will prove to be accurate, as actual results and future events could differ materially from those anticipated in such statements. Accordingly, readers are cautioned not to place undue reliance on forward-looking statements. Unless required by securities laws, the authors undertake no obligation to update the forward-looking statements if circumstances or opinions should change.
1
NI 43-101 Technical Report – Cerro Prieto Project
| 1.0 | SUMMARY |
Minas Oroco Resources S.A de C.V., (Oroco) a wholly subsidiary of Goldgroup Mining Inc. (Goldgroup or the Company) and holds the Cerro Prieto Project located 50 kilometers southeast of the town of Magdalena de Kino, State of Sonora, in northwestern Mexico.
Goldgroup Mining Inc., requested that José Antonio Olmedo MSc, P. Eng. Geo, QP, SME Registered Member, Cristian Garcia, P. Eng., QP, Registered at Engineers and Geoscientists of British Columbia and Rodrigo R Carneiro MSc, QP, SME Registered Member independent consultants to prepare a technical report with results in accordance with NI 43-101 from updated mineral resources based on new and historical drilling data, updated metallurgical results and costs based on the current operation.
| 1.1 | Location, Access and Climate |
Rodrigo R Carneiro MSc, QP, SME Registered Member independent consultants is responsible for the preparation of this section. The Cerro Prieto Project is located in Cucurpe, Municipality of Sonora State in northwestern Mexico, approximately 240 km northwest of the capital city of Hermosillo and approximately 160 km south of Tucson, Arizona.
The Cerro Prieto mining property is located 50 kilometers southeast of the town of Magdalena de Kino, state of Sonora, in northwestern Mexico. The project is contained within six concessions. The San Francisco concession of 10 hectares hosts the workings of the old Cerro Prieto Mine. Access to the property is along a paved two-lane highway southeast from Magdalena de Kino for 40 kilometers, and then by a secondary gravel road, which often follows local arroyos (dry riverbeds), for an additional 12 kilometers north from the highway.
The region is part of the northwest portion of the Sierra Madre Occidental, and within this the Sierras y Valles Parallelos which were produced by regional normal block faulting. The host rocks are a series of interbedded siltstones and sandstones (arenites), overlain by basalt flows and rhyolite/dacite pyroclastics, cut by andesite dykes, all Tertiary age. Sediments dip moderately (30o to 45o) to the northwest.
The mineralized zone is contained in a major north trending, near vertical shear zone up to 65 meters wide which cuts all units from Jurassic to Lower Tertiary in age. Within this shear zone are a series of major veins near the edges of the zone, secondary veins, stringers zones, breccia zones and silicification which, with the veins, forms a mineralized system from 15 to 65 meters thick.
The area is typically arid to semi-arid, with daytime temperatures ranging from extremes of 50°C in the summer to 20°C in the winter, although nights can reach as low as –5°C. Rainfall is in the form of thunderstorms during the late summer months, with some short periods of a gentler cold rain in the winter. Thunderstorms may produce flash floods in the arroyos and creeks and may cause washouts of the local roads and trails. The Company, in conjunction with the ranch owner, has a program of regular maintenance of the roads.
Topography in the area is rugged, and consists of a series of block faulted, low angle dipping sedimentary layers capped by relatively impermeable volcanic flows and pyroclastics. This produces a series of sharp ridges that rise abruptly to a height of 200 to 300 meters above local canyon floors and arroyos. The maximum local elevation is approximately mean 1200 meters above sea level (masl).
2
NI 43-101 Technical Report – Cerro Prieto Project
Electrical power is present in Magdalena de Kino, and in fact a power line runs down the paved road and along the off-road access to within five kilometers of the Project. It continues through the village of Cucurpe, which lies approximately five kilometers southeast of the access road from the highway.
The town of Magdalena de Kino and the surrounding region has a population of approximately 40,000 people. There is a large labor force, and several people were in fact trained for the exploration programs. Land surveyors are available in Hermosillo, and mining personnel and equipment, as well as exploration equipment and supplies, can be found in the Hermosillo-Magdalena de Kino region. The village of Cucurpe lies approximately 17.5 km by road to the southeast and could supply a small labor force.
| 1.2 | Terms of Reference and Purpose of this Technical Report |
This Technical Report is an independent estimation of Mineral Resources updated on 4 April 2025 and prepared by Cristian Garcia, P. Eng., QP, Registered at Engineers and Geoscientists of British Columbia and Rodrigo R Carneiro MSc, QP, Registered Member of SME Member on the Esperanzas Deposit included inside the Cerro Prieto Mine, located in the State of Sonora, Municipality of Cucurpe, Mexico, approximately 150 km Northeast of Hermosillo.
The Cerro Prieto Project is an open-pit mining development in progress owned and operated by Minas de Oroco Resources, S.A. de C.V. (Oroco), a wholly owned subsidiary of Goldgroup Mining, Inc., a Canadian mining company listed on the TSX Venture Exchange under the symbol GGA and on OTC under the symbol GGAZF.
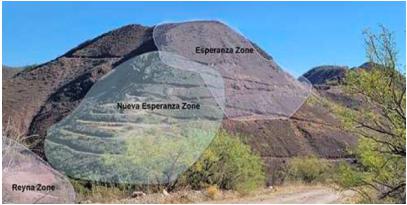
This Technical Report provides independent assessment of the Mineral Resources Estimates of the Esperanzas Deposit, which includes the La Esperanza and Nueva Esperanza contiguous areas shown in Figure 1 below.
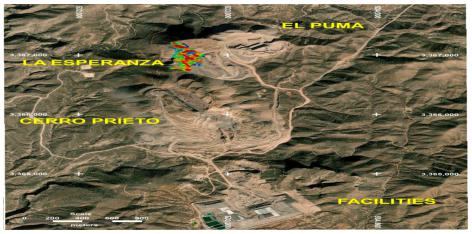
Figure 1 - Aerial Photograph Showing Estimated Block Model Mineral Resources of the Esperanzas Deposit.
3
NI 43-101 Technical Report – Cerro Prieto Project
The quality of information, conclusions, and estimates contained herein are consistent with the level of effort involved in the QPs services, based on (i) information available at the time of preparation, (ii) data supplied by outside sources, and (iii) the assumptions, conditions, and qualifications outlined in this Technical Report.
Mineral Resources are reported in accordance with the Canadian Institute of Mining, Metallurgy and Petroleum (CIM) Definition Standards for Mineral Resources and Mineral Reserves (May 19, 2014) and the CIM Estimation of Mineral Resources and Mineral Reserves Best Practice Guidelines (November 29, 2019). Unless otherwise stated, the metric system has been used throughout the Technical Report.
The mineral resource estimate reported herein is a reasonable representation of the Mineral Resources as found in the Esperanzas Deposit at the current level of drilling and sampling.
| 1.3 | Land Status |
Rodrigo R Carneiro MSc, QP, SME Registered Member independent consultants is responsible for the preparation of this section. Oroco owns 100% of the 6,980 hectares of mining concessions and has been in production since 2013. Oroco has produced over 120,000 ounces of gold over 11 years up to March 31, 2024. Current annual production is approximately 11,500 ounces of gold.
| 1.4 | Geology and Mineralization |
José Antonio Olmedo MSc, P. Eng. Geo, QP, Registered Member of SME is responsible for the preparation of this section.
| 1.4.1 | Regional and Local Geology |
| § | The Magdalena de Kino–Cucurpe region transitions from a Jurassic shallow magmatic arc to a Cretaceous marine embayment. |
| § | The area includes sedimentary and volcanic sequences from the Jurassic to Cretaceous periods, which have been weakly metamorphosed by tectonic and volcanic activity. |
| § | The Cerro Prieto Project is situated atop Tertiary marine and volcanic rocks, including conglomerates, arenites, and volcanic flows (andesite, basalt, rhyolite). |
| § | The local geology includes the Baucarit Formation, intrusive tonalites from the Cretaceous age, and andesitic to rhyolitic volcanic rocks that exhibit hydrothermal alteration. |
| 1.4.2 | Mineralization at Esperanzas Deposit |
Mineralization at Esperanzas Deposit is restricted to geological structures displaying approximately 345° Az in the primary structure and 313° Az in the secondary structure. The main structure extends about 700 meters in length and has a semi-vertical dip, while the dip of the secondary structure ranges from 65° SW in its northern section to approximately 50° SW in its southern portion.
In addition to these two prominent veins, the shear zone includes subsidiary zones of mineralization, such as disseminations, veins, and stringers, allowing for a wide range of low-grade mineralization. As a result, Oroco implemented an open-pit mining method to extract maximum-scale gold values.
4
NI 43-101 Technical Report – Cerro Prieto Project
Oroco’s drilling campaign at Esperanzas Deposit confirmed that the mineralization comprises quartz veins, chalcedonic quartz veinlets, micro veinlets, amorphous silica, black calcite, manganese lenses, and argillic alteration.
Geological model interpretation encompasses fault zones, imbricated thrusts, and extensional wedges. No significant thrust faults have been observed in the ongoing open-pit operation.
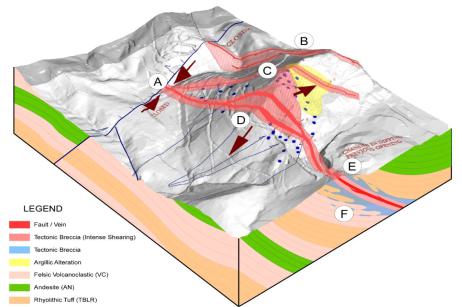
Figure 2 - Geological Interpretation of the Esperanzas Deposit. A) Fault Core Compression; B) Puma Imbricated Thrust – Ramp; C) Nueva Esperanza Imbricated Thrust-Fault; D) Esperanza Tensile Opening in Trans-Tensional Wedge (Soft Boundary); E) Fault Core Compression and Riedels; F) Splay Fracturing along Compression Edges. Source: JAO, 2025.
| 1.4.3 | Exploration Targets |
| 1.4.3.1 | Reyna Deposit |
| § | Lithology: Tertiary volcaniclastic breccias and Baucarit Formation rocks. |
| § | Structures: Multiple shear zones and veins (e.g., Puma-type). |
| § | Alteration: Silicification, argillic alteration, and oxidation with manganese and iron oxides. |
| § | Mineralization: Gold anomalies (0.25 to 25.27 g/t) in shear zones with supergene enrichment and leached sulfides. |
5
NI 43-101 Technical Report – Cerro Prieto Project
| 1.4.3.2 | Cata and Coatí Deposits |
| § | Lithology: sequences of shale and sandstone, clastic limestone, Late Jurassic Cucurpe Formation. |
| § | Structures include NW-SE normal faults, folds, and foliation. |
| § | Mineralization: Gold anomalies (Cata: 0.2–18.83 g/t; Coatí: 0.2–6.65 g/t) are associated with milky quartz, quartz druses, and oxidized sulfides. |
| § | Alteration includes silicification, oxidation, argillic alteration, and weak carbonatization. |
| 1.4.3.3 | Cascabel Deposit |
| § | Structure: Breccia-type vein-fault system (N30–45°W, dipping northeast). |
| § | Host Rocks: Shale–sandstone units. |
| § | Mineralization includes milky and crystalline quartz, MnO₂, iron oxides, oxidized sulfides, and pervasive silicification. |
| § | Surface Sampling: |
| o | Gold: 0.18 - 1.66 g/t |
| o | Silver: 0 -18.13 g/t |
| o | Lead: 0.20 - 6.77% |
| o | Zinc: 0.12 - 1.82% |
| § | The structure measures 8 to 10 meters in width and extends 40 to 50 meters in length. |
| 1.5 | Deposit Types |
José Antonio Olmedo MSc, P. Eng. Geo, QP, Registered Member of SME is responsible for the preparation of this section.
| 1.5.1 | Deposit Type at Cerro Prieto |
| § | The Cerro Prieto Project, which includes the Esperanzas Deposit which is classified as a low to intermediate-sulfidation epithermal silver-gold system. |
| § | The types of deposits are common in northeastern Sonora, with nearby analogs including: |
| o | Santa Elena (First Majestic Silver) |
| o | Cerro Caliche (Sonoro Gold) |
| o | Las Chispas (Silvercrest Mines) |
| o | Mercedes (Equinox Gold) |
| § | Other similar systems are found in Chihuahua, such as: |
| o | Dolores (Pan American Silver) |
| o | Pinos Altos (Agnico-Eagle Mine |
6
NI 43-101 Technical Report – Cerro Prieto Project
| 1.5.2 | Geological and Mineralizing Conditions |
| § | These deposits occur in felsic volcanic complexes under extensional or strike-slip tectonic regimes. |
| § | Hydrothermal brines combine with local groundwater, resulting in episodic mineral deposition in: |
| o | Veins |
| o | Stockworks |
| o | Breccias |
| § | Depth and temperature range: |
| o | Form near-surface (200–600 m), sometimes up to 1 km deep |
| o | Temperatures between 150°C and 300°C |
| 1.5.3 | Mineralization Characteristics |
| § | Gold and silver precipitate due to: |
| o | Changes in pressure |
| o | pH fluctuations |
| o | Fluid dynamics |
| § | Alteration is strongest near major veins and includes: |
| o | Silicification (most prominent) |
| o | Sericite-illite-kaolinite mineral assemblages |
| 1.5.4 | Exploration Insights and Recommendations |
| § | Geological evidence from the Esperanzas Deposit supports classifying it as a low-sulfidation epithermal deposit. |
| § | Diagrams from Hedenquist (1994 and 2000) were utilized to validate the conceptual model. |
| § | Key economic control: The range of the boiling zone, affected by fluid temperature, groundwater mixing, flow rate, and system duration. |
| § | Recommendation: Conduct spectrographic and petrographic studies in future explorations to enhance understanding of the deposit. |
| 1.6 | Exploration |
José Antonio Olmedo MSc, P. Eng. Geo, QP, Registered Member of SME is responsible for the preparation of this section.
| 1.6.1 | Historical Exploration |
| § | Cerro Prieto Mine was developed based on a 2013 NI 43-101 report detailing 8.2 million tonnes of measured and indicated resources. |
7
NI 43-101 Technical Report – Cerro Prieto Project
| § | Mining occurred in the Centro, Unión, South Pit, and later in the Puma Zone (2019–2023). |
| § | These resources were fully exploited by mid-2023. |
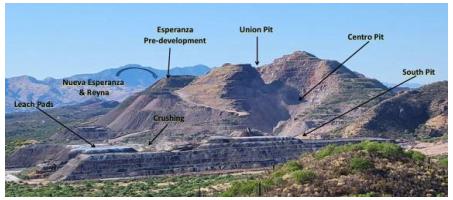
Figure 3 - Cerro Prieto Historical Mining Zones. Source: Oroco, 2025.
| 1.6.2 | Esperanzas Deposit Exploration (2023–2024) |
| § | The exploration adhered to industry standards, including mapping, sampling, geophysics (IP and resistivity), and drilling. |
| § | Used NAD27 UTM Zone 12N as the coordinate system. |
| § | Surface Sampling: 1,265 samples were used for mineral resource estimation (Section 14). |
| § | Drilling Campaigns (2023): |
| o | Conducted in March, May, July, and September 2023. |
| o | Total drilling: 4,285 meters. |
| o | Included diamond drill holes (DDH), trench sampling, and modeling via Leapfrog 3D. |
| § | Production Status: Open-pit mining at Esperanzas Deposit began in February 2024 and continued through April 2025. |
8
NI 43-101 Technical Report – Cerro Prieto Project
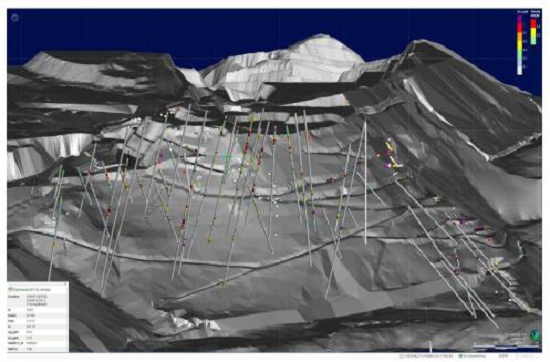
Figure 4 - Esperanzas’ Leapfrog 3D Scene Section Showing Drill Holes and Surface Samples: Source: JAO, 2025.
9
NI 43-101 Technical Report – Cerro Prieto Project
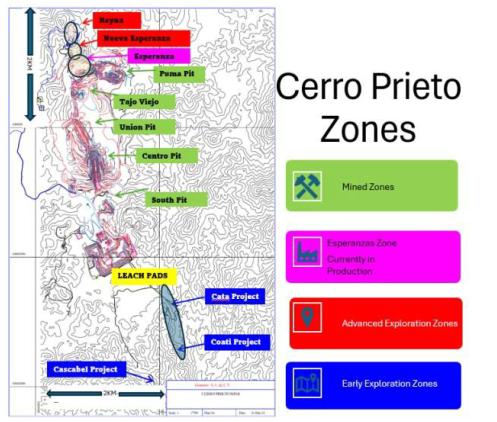
Figure 5 - Cerro Prieto Mineralized Zones. Source: Oroco, 2025.
| 1.6.3 | Exploration Targets |
| 1.6.3.1 | Reyna Deposit |
| § | Situated north of the Esperanza zone. |
| § | Exposed to over 90 meters through trenching. |
| § | Chip samples indicate significant gold grades. |
| § | Further drilling is planned to confirm economic viability. |
| 1.6.3.2 | Cata, Coatí, Cascabel Deposits |
| § | Located as far as 1.7 km south of the heap leach pad. |
| § | Identify target extensions of the Cerro Prieto Shear Zone and its parallel structures. |
| § | Surface sampling was conducted; however, the results come from an uncertified mine lab, and independent lab verification is still pending. |
10
NI 43-101 Technical Report – Cerro Prieto Project
| § | QA/QC protocols will be applied in upcoming campaigns. |
| 1.6.4 | 2025 Exploration Program |
| § | Announced by Goldgroup Mining Inc. on March 26, 2025. |
| § | Scope: |
| o | ~6,000 meters of diamond drilling. |
| o | Induced polarization surveys. |
| o | Surface trenching. |
| § | Targets: |
| o | Expansion of Nueva Esperanza and Reyna Deposits. |
| o | Reactivating the potential of the South Pit through a small pit pushback. |
| o | New zones have been discovered 1 km south along the Cerro Prieto Shear. |
| 1.6.5 | 2025 Exploration Budget |
| § | Outlined in Table. |
| § | The Qualified Person (JAO) endorses the 2025 exploration program as a sound strategy to evaluate the mine’s remaining economic potential. |
Table 1 - 2025 Exploration Budget
Runtime (Days) |
Deposit |
Geophysics (USD) |
Roads, Trenches & Drilling Pads (USD) |
Drillings (USD) |
Total (USD) |
|
| 15 | Nueva Esperanza | 64,152 | 64,152 | Diamond Drilling | ||
48 |
Punta de Fecha & Puma Norte |
9,997 |
13,784 |
88,592 |
112,373 | |
| 52 | Reyna | 10,496 | 6,014 | 278,837 | 295,347 | |
| 17 | Sureste Extension Puma | 57,094 | 57,094 | |||
| 30 | Sur Patios | 59,566 | 59,566 | RC Drilling | ||
| 5 | Cata | 8,997 | 6,892 | 22,667 | 38,556 | |
| 35 | Coati | 8,997 | 8,048 | 35,283 | 52,328 | |
| 22 | Cascabel | 5,998 | 6,892 | 22,667 | 35,557 | |
| Other Direct Exploration Costs | 36,172 | 36,172 | ||||
| Total (USD) | 44,485 | 41,630 | 665,030 | 751,145 | ||
11
NI 43-101 Technical Report – Cerro Prieto Project
| 1.7 | Drilling |
| 1.7.1 | Drilling Methodology |
| § | Oroco employed diamond drilling, with vertical and inclined holes arranged according to sectional layouts spaced 25 meters apart. |
| § | Preparation for the drill site included access roads, pads (8x8 m), and sumps, using Caterpillar D9 tractors. |
| § | Drill paths were measured using high-precision tools (Reflex or ReflexGyro). |
| § | Water for drilling was sourced from two 30,000 m³ modular ponds lined with geomembrane. |
| 1.7.2 | Drill Core Logging |
José Antonio Olmedo MSc, P. Eng. Geo, QP, Registered Member of SME is responsible for the preparation of this section. Drill core logging includes Daily logs documented hole ID, coordinates, elevation, azimuth, angle, dates, contractor, lithology, mineralogy, texture, grain size, alteration, faults, core recovery, low recovery zones, and assay results.
| 1.7.3 | Drill Core Recovery and Quality |
| § | Cores reconstructed and verified for depth at the site. |
| § | Core recovery = (Core length ÷ Drill run length) × 100. |
| § | RQD (Rock Quality Designation) is calculated as the percentage of core pieces greater than 100 mm. |
| § | Overall core recovery exceeds 71% across 334 mineralized intercepts, which is considered moderate and acceptable for sheared zones. |
| § | No negative correlation was found between core recovery and gold grade. |
| 1.7.4 | Drill Survey |
A total of 127 drill hole survey data values were used to establish the 3D orientation model for mineral resource estimation.
| 1.7.4.1 | Drilling Highlights (2023) |
Significant gold intercepts consist of:
| § | DDH CP362: 19.70m at 1.03 g/t Au; 20.98m at 1.02 g/t Au. |
| § | DDH CP374: 13.20m at 2.05 g/t Au; 1.55m at 4.78 g/t Au. |
| § | DDH CP367: 24.96m at 0.69 g/t Au; 17.97m at1.13 g/t Au. |
| § | DDH CP371: 11.67m at 1.16 g/t Au. |
| § | DDH CP384 to CP406: Up to 43.89m at 0.43 g/t Au and 13.20m at 1.33 g/t Au |
| 1.8 | Sampling Preparation, Analysis, and Security |
José Antonio Olmedo MSc, P. Eng. Geo, QP, Registered Member of SME is responsible for the preparation of this section.
12
NI 43-101 Technical Report – Cerro Prieto Project
| 1.8.1 | Introduction |
| § | This section details Oroco's 2023 sampling methodologies and analytical procedures employed to support mineral resource estimation. |
| § | Due to suspended field operations, the author could not validate Oroco’s protocols in person. |
| 1.8.2 | Sample Preparation and Analytical Methods |
| § | Core samples were split, and half of the cores were retained, and half of the cores were sent for analysis. |
| § | Primary preparation and analysis were conducted at Oroco’s non-certified Cerro Prieto laboratory, with selected high-grade samples sent to ALS Chemex for fire assay. |
| § | Cerro Prieto’s methods emulate ALS’s Prep-31 Code which specified crushing to 70% below 2mm and pulverizing to 85% below 200 mesh. |
| § | The primary method employed was fire assay with atomic absorption finish on 30g samples. |
| § | Cautionary Statement: The Cerro Prieto lab (CoP) is not ISO-certified and lacks formal QA/QC systems, which raises serious concerns about the reliability of its analytical database. |
| 1.8.3 | Quality Assurance and Quality Control (QA/QC) |
Oroco lacks a comprehensive QA/QC program, contrary to CIM 2018 guidelines. José Antonio Olmedo MSc, P. Eng. Geo, QP, SME Registered Member (JAO) recommends including control samples (blanks, standards, duplicates) for all analyses.
| 1.8.3.1 | Analytical Check with ALS |
| § | 268 pulp samples (approximately 5% of the database) and 41 standards/blanks were re-analyzed at ALS (ISO/IEC 17025:2017 accredited). |
| § | ALS methods utilized include Au-AA23 (fire assay) and ME-ICP41 (aqua regia for 32+ elements). |
| § | Correlation analysis between Cerro Prieto (CoP) and ALS results yielded R² = 0.786, indicating moderate agreement. See Figure 6 shown below. |
| § | Critical Issue: No retained duplicates, coarse rejects, or pulp rejects are available from Oroco, which severely limits reanalysis and audit capabilities. |
13
NI 43-101 Technical Report – Cerro Prieto Project
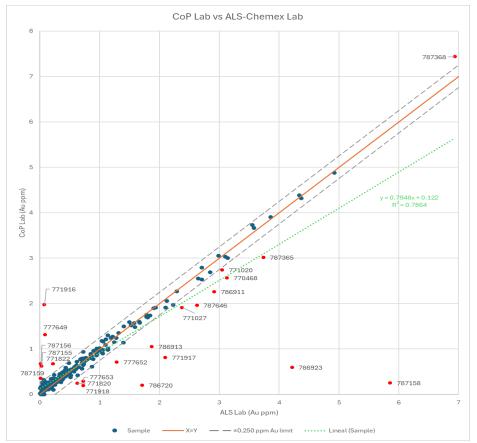
Figure 6 - Dispersion Graph. The graph compares samples analysed at Cerro Prieto (CoP) and ALS labs. CoP prepared and tested the samples, while the rejects were sent to ALS for verification. Source: JAO, 2025.
A determination coefficient of 0.786 (dotted green line) indicates a moderate correlation between the results of both labs. Red dots represent samples with a ±0.250 ppm difference, possibly signalling instrumentation issues at one of the labs.
For quality control of the ALS Chemex geochemistry lab, blanks and standards were randomly inserted for every 15 samples, and duplicates were excluded from the sample stream.
| § | Blanks (17) were used but were assigned zero value without lab testing, risking bias. |
| § | Standards (22) from ROCKLABS showed acceptable performance overall: |
| o | OxL159: Mostly within limits. |
| o | OxG141: Some below lower limits, but within tolerances. |
14
NI 43-101 Technical Report – Cerro Prieto Project
| o | OxC152: Within defined QA limits. |
| § | Duplicates were not submitted to ALS. JAO recommends submitting at least one duplicate for every 15 samples in future programs. |
| § | Opinion on ALS QA/QC, despite the absence of duplicates, the analysis of ALS Lab analytical results for blanks and standards was precise and accurate within acceptable limits. |
| 1.8.4 | Sample Security |
Core transport and sample delivery were handled only by authorized personnel using Oroco’s vehicles.
| 1.8.4.1 | Adequacy of Results |
| § | José Antonio Olmedo MSc, P. Eng. Geo, QP, SME Registered Member (JAO) expresses significant concern regarding the validity of assay data due to: |
| o | Extensive reliance (95%) on the non-certified Cerro Prieto lab (CoP) database. |
| o | Lack of thorough QA/QC procedures. |
| § | Recommendation: conduct re-assay using ISO-certified laboratories and implement a comprehensive QA/QC program following CIM best practices. |
| 1.9 | Data Verification |
José Antonio Olmedo MSc, P. Eng. Geo, QP, Registered Member of SME is responsible for the preparation of this section.
| 1.9.1 | Field Visit |
José Antonio Olmedo MSc, P. Eng. Geo, QP, SME Registered Member (JAO) conducted an on-site field visit from May 28 to 31, 2024.
| § | The main activities included: |
| o | Reviewing Oroco’s protocols regarding geology, sampling, QA/QC, drilling, bulk density, logging, and database verification. |
| o | Visiting exploration targets, old mine workings, leach pad, mill plant, lab, and core shack. |
| § | Most of the information reviewed was historical, since JAO was not present during active drilling campaigns. |
| § | Key personnel consulted included Omar Tadeo Nevarez (Chief of Exploration) and Rafael Alexandri (Director). |
Observations:
| § | Topographic inconsistencies in northern Esperanzas led to a new topographic survey that was completed and delivered on June 4, 2024. |
| § | No collar monuments were found to validate the locations of the drill holes platforms were removed after drilling. |
15
NI 43-101 Technical Report – Cerro Prieto Project
| § | Geological logging for certain holes (e.g., CP205 and CP412) corresponds with JAO’s observations. |
| § | No physical core evidence of mineralized intervals was found; only photos of wet cores were available. |
| § | The remaining core material was divided for analysis and metallurgical testing, leaving no duplicates or rejects for third-party QA. |
Database and Lab Review:
| § | Oroco’s drillhole database, which includes 3,955 drill holes and 1,231 surface samples, was reviewed. |
| § | ALS Chemex assay certificates for 268 check samples were received on April 24, 2025. |
| 1.9.2 | Statement of Confidence |
| § | The use of a non-certified lab, the lack of retained mineralized core material, and the absence of sample rejects or pulps limit verification and introduce uncertainty in the assay data. |
| § | These limitations were considered in the mineral resource estimation for the Esperanzas Deposit. |
| 1.10 | Mineral Resource Estimation |
José Antonio Olmedo MSc, P. Eng. Geo, QP, Registered Member of SME is responsible for the preparation of this section.
| 1.10.1 | Introduction |
| § | Project: Open-pit gold project in Sonora, Mexico; part of the Cerro Prieto mining property owned by Oroco (Goldgroup subsidiary). |
| § | Data used: 51 drill holes, 3,955 core samples, and 1,231 surface samples. |
| § | Effective date: April 4, 2025. |
| § | Methodology complies with CIM (2014) definitions and 2019 best practices. |
| 1.10.2 | Exploration Database Analysis |
| § | Verified datasets include collars, surveys, lithology, assays, and density. |
| § | Issues: |
| o | 95% of assay data from Oroco's non-certified lab. |
| o | Lack of QA/QC program undermines confidence in assay precision. |
| § | Assays and lithological data were spot verified; missing certificate values were confirmed with logs. |
| 1.10.3 | Geological Model |
| § | Gold mineralization is controlled by two structural trends at 345° and 313° azimuths. |
16
NI 43-101 Technical Report – Cerro Prieto Project
| § | Modeled as 3D domains using Leapfrog Geo with a 0.1 ppm Au cut-off. |
| § | Hard boundaries are established to limit grade interpolation. |
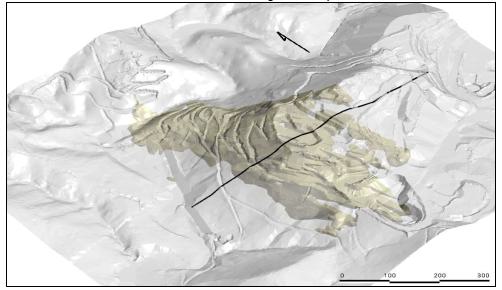
Figure 7 -This shows a 3D orthographic view of the Esperanza digital terrain and underlying domain models. The black line indicates the section depicted in Figure 7. Source: JAO 2025.
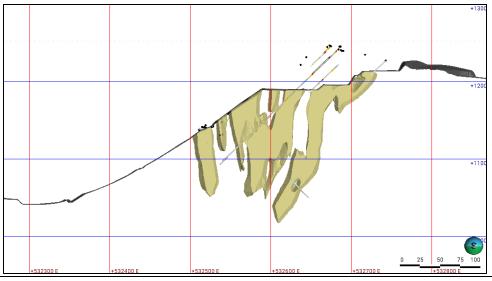
Figure 8 - This section displays the current topographic profile, drill holes, and domain solid; the section's location is indicated in Figure - 9. Source: JAO 2025.
17
NI 43-101 Technical Report – Cerro Prieto Project
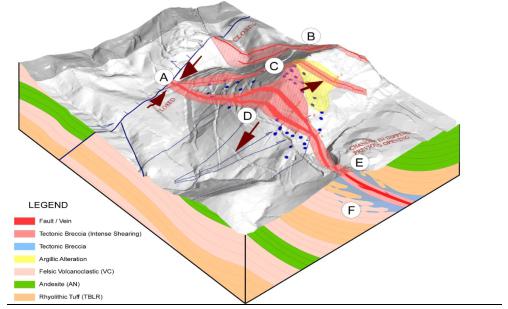
Figure 9 - Geological Interpretation of the Esperanzas Deposit. A) Fault Core Compression; B) Puma Imbricated Thrust – Ramp; C) Nueva Esperanza Imbricated Thrust-Fault; D) Esperanza Tensile Opening in Trans-Tensional Wedge (Soft Boundary); E) Fault Core Compression and Riedels; F) Splay Fracturing along Compression Edges. Source: JAO 2025.
| 1.10.4 | Assay Capping & Compositing |
| § | The capping threshold is set at 2 ppm Au, based on statistical outlier analysis. |
| § | Composites: 2-meter intervals chosen as optimal, minimizing variance and preserving the integrity of gold grade distribution. |
| 1.10.5 | Density |
| § | A 3D density model created using 102 measurements from 40 drill holes. |
| § | Minimum density: 2.09005 g/cm³ applies when interpolation is not feasible. |
| § | All blocks in the model were assigned interpolated or fallback densities. |
18
NI 43-101 Technical Report – Cerro Prieto Project
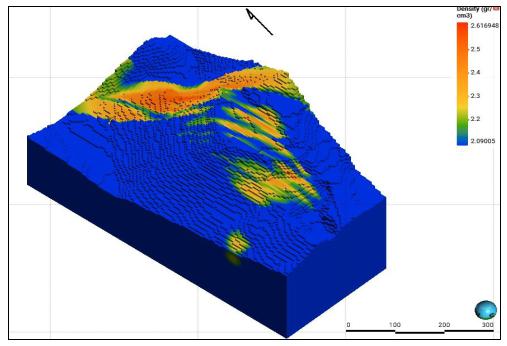
Figure 10 - The block model is evaluated against the 3D density model. The density values (in g/cm³) are displayed on the color scale. Source: JAO 2025.
| 1.10.6 | Variography |
| § | Experimental variograms generated using capped 2m composite data. |
| § | Variogram modeled with exponential and spheroidal structures. |
| § | Applied to Ordinary Kriging (OK) estimator. |
| 1.10.7 | Block Model & Estimation |
| § | Model details: |
| o | Dimensions: 5x5x5 m. |
| o | Blocks: ~1 million. |
| o | Estimators: OK used for MRE; IDW³ used for validation. |
| § | Block attributes include Au, density, classification, and drill/sample counts. |
19
NI 43-101 Technical Report – Cerro Prieto Project
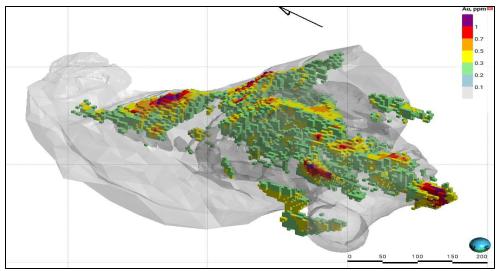
Figure 11 - The final interpolated Au block model is enclosed within the 3D density model (gray body). Source: JAO 2025.
| 1.10.8 | Model Validation |
| § | Visual validation: Strong match between block grades and composites. |
| § | Global bias: No significant deviation from composite mean grades. |
| § | Swath plots: Confirmed spatial consistency between estimators (OK vs IDW³). |
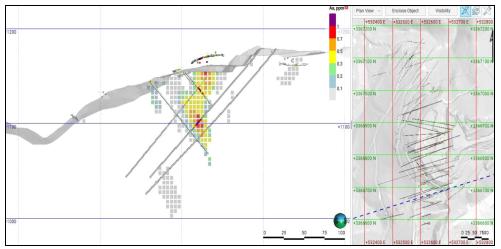
Figure 12 - Section view (left) and plan view (right) at the Esperanzas Deposit (drill holes display 2-meter composite samples; the Au ppm color scale applies to both the block model and drill holes). Source: JAO 2025.
20
NI 43-101 Technical Report – Cerro Prieto Project
In the Esperanzas Block Model, the quality of the resource grades closely matches the average grades of the composite drill holes, as illustrated in Figure 13. and analyzed with Python. This is essential for building confidence in estimating mineral resources.
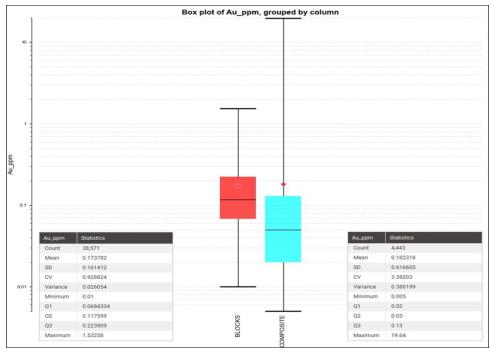
Figure 13 - Box plots comparing the statistical values of block values and drill composites. Source: JAO 2025.
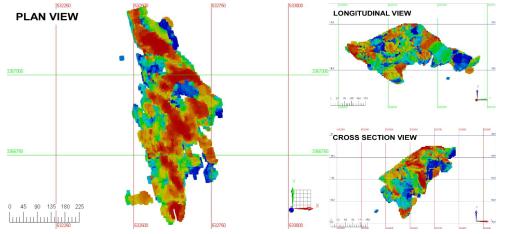
Figure 14 - Block Models: Plan View, Longitudinal View (Looking East), and Cross-Section View (Looking North). Source JAO 2025.
21
NI 43-101 Technical Report – Cerro Prieto Project
| 1.10.9 | Resource Classification |
| § | Measured: ≤25m from sample, ≥1 drill hole, >5 samples. |
| § | Indicated: 25–40m from sample, ≥1 drill hole, >5 samples. |
| § | Inferred: >40m from sample, same other conditions. |
| § | Classification based on CIM Definition Standards (2014) guidelines. |
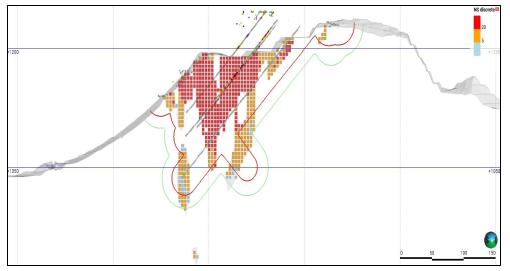
Figure 15 - The sample section shows the Esperanzas block model, indicating the number of samples used to evaluate each block (cyan 1 to 5, orange >5 to 20, and red more than 20 samples). Red and green outlines indicate the distance to samples (red = 25 m, green >25 and ≤ 40 m). The gray shadow behind the block model indicates the mineralized domain limit. Source: JAO, 2025.
| 1.10.10 | Mineral Resource Statement |
The Mineral Resources mentioned herein were estimated by J José Antonio Olmedo MSc, P. Eng. Geo, QP, SME Registered Member (JAO), as defined by the Canadian Institute of Mining (CIM) Standards on Mineral Resources and Reserves, Definitions and Guidelines from the CIM Standing Committee on Reserve Definitions (2014).
Drilling and further exploration may impact mineral resources, potentially altering future resource estimates. Subsequent assessments of mining, environmental, processing, licensing, financial, social, economic, and other factors may also impact mineral resources. Mineral resources are distinct from mineral reserves and have not proven economic viability. Table 2 summarizes mineral resources for various cutoff grades, while Table 2 displays Inferred Resources separately.
As the Cerro Prieto mine is currently in production, JAO is presenting the Mineral Resource Estimate for various cutoff values. Oroco can either continue with the existing operations or explore potential changes.
22
NI 43-101 Technical Report – Cerro Prieto Project
Table 2 - Estimates of the Esperanzas Deposit’ Inferred Mineral Resources Using Oroco’s Assays Database. Source: JAO 2025.
As of April 04, 2025
| Cut-Off Grade Au (g/t) |
Class | Volume
(m3) |
Density (g/cm3) |
Mass
(t) |
Average Au Value (g/t) |
Material Content Au (Oz) |
| ≥ 0.100 | Measured | 2,285,000 | 2.30 | 5,265,942 | 0.270 | 45,251 |
| Indicated | 314,125 | 2.24 | 702,723 | 0.220 | 5,036 | |
| Measured + Indicated | 2,599,125 | 2.30 | 5,968,665 | 0.260 | 50,288 | |
| ≥ 0.150 | Measured | 1,653,750 | 2.32 | 3,830,444 | 0.320 | 39,564 |
| Indicated | 191,625 | 2.26 | 433,914 | 0.290 | 3,984 | |
| Measured + Indicated | 1,845,375 | 2.31 | 4,264,358 | 0.320 | 43,548 | |
| ≥ 0.200 | Measured | 1,212,375 | 2.33 | 2,826,313 | 0.370 | 33,954 |
| Indicated | 133,750 | 2.26 | 302,530 | 0.330 | 3,255 | |
| Measured + Indicated | 1,346,125 | 2.32 | 3,128,843 | 0.370 | 37,209 | |
| ≥ 0.300 | Measured | 656,750 | 2.35 | 1,544,070 | 0.480 | 23,866 |
| Indicated | 54,375 | 2.24 | 121,995 | 0.480 | 1,863 | |
| Measured + Indicated | 711,125 | 2.34 | 1,666,064 | 0.480 | 25,729 | |
| ≥ 0.500 | Measured | 219,625 | 2.39 | 523,935 | 0.670 | 11,340 |
| Indicated | 14,875 | 2.22 | 32,995 | 0.760 | 808 | |
| Measured + Indicated | 234,500 | 2.37 | 556,930 | 0.680 | 12,148 | |
| ≥ 0.700 | Measured | 73,625 | 2.40 | 176,572 | 0.860 | 4,881 |
| Indicated | 9,250 | 2.16 | 19,948 | 0.890 | 572 | |
| Measured + Indicated | 82,875 | 2.37 | 196,520 | 0.860 | 5,453 | |
| ≥ 1.000 | Measured | 14,375 | 2.38 | 34,216 | 1.100 | 1,211 |
| Indicated | 3,000 | 2.10 | 6,306 | 1.100 | 224 | |
| Measured + Indicated | 17,375 | 2.33 | 40,521 | 1.100 | 1,435 |
Table 3 - Estimates of the Esperanzas Deposit’ Inferred Mineral Resources using Oroco’s assays database. Source: JAO 2025.
As of April 04, 2025
| Cut-off Au Grade (g/t) |
Volume (m3) |
Density (g/cm3) |
Mass (t) | Average Au Value (g/t) |
Material Au Content (Oz) |
| ≥ 0.100 | 133,500 | 2.16 | 288,421 | 0.240 | 2,214 |
| ≥ 0.150 | 84,500 | 2.17 | 183,783 | 0.300 | 1,798 |
| ≥ 0.200 | 60,750 | 2.17 | 131,536 | 0.360 | 1,504 |
| ≥ 0.300 | 29,500 | 2.13 | 62,958 | 0.480 | 968 |
| ≥ 0.500 | 8,000 | 2.10 | 16,767 | 0.810 | 438 |
| ≥ 0.700 | 5,625 | 2.09 | 11,772 | 0.900 | 342 |
| ≥ 1.000 | 2,250 | 2.09 | 4,706 | 1.090 | 165 |
| Observation: Differences may occur in total due to rounding | |||||
23
NI 43-101 Technical Report – Cerro Prieto Project
Oroco notified the Qualified Person that the current operational cut-off grade for the Esperanzas deposit is 0.20 g/t Au. This value represents the economic limit used in the ongoing open-pit mining operation. The cut-off grade reflects current mining and processing practices and was determined by considering the actual mining method, metallurgical recovery, operating costs, metal prices, and the overall economic performance of the operation. The cut-off grade was calculated using the following general formula:
| Cut-off (g/t) = | Total Cost (US$/t) | x | (Conversion Factor) |
| Gold Price (US$/oz) x Recovery (%) |
Where:
Total Cost (US$/t) = 11.76
| § | Crushing Plant: (US $/t) = 2.59 | |
| § | Heap Leach (US/t) = 2.88 | |
| § | ADR Plant (US $/t) = 1.56 | |
| § | Indirect Costs (US $/t) = 1.27 | |
| § | Administration Costs (US $/t) = 1.12 | |
| § | Average Mining Cost (US/t) = 2.29 |
Gold Price (US $/Oz) = 2,400
Recovery (%) = 72
Overall Slope Angles = 44°
Calculation:
| Au Cut-off (g/t) = | 11.71 (US$/t) | x | (31.1035) = 0.2117 g/t |
| 2,400 (US$/oz) x 71 (%) |
The cut-off grade was rounded up to 0.2 g/t Au. JAO has reviewed the cut-off grade calculation and confirms that the assumptions are consistent with industry practice and are considered appropriate for the current scale and configuration of the open-pit operation. The cut-off grade, therefore, provides a reasonable basis for defining material with reasonable prospects for eventual economic extraction.
José Antonio Olmedo MSc, P. Eng. Geo, QP, SME Registered Member (JAO) stated that the Inferred Mineral Resources for the Esperanzas Deposit, above the cut-off gold grade of 0.2 Au g/t within the mineralized domain, amount to 131,536 tonnes at a gold grade of 0.36 g/t.
Notes: JAO’s methodology utilized the Canadian Institute of Mining (CIM) Definition Standards for Mineral Resources and Mineral Reserves, published by the CIM MRMR Committee on May 19, 2014, along with the CIM Estimation of Mineral Resources and Mineral Reserves: Best Practice Guidelines, published by the CIM MRMR Committee on November 29, 2019.
| § | Errors in the totals result from rounding. |
| § | The Mineral Resource was modelled using a licensed copy of Seequent’s Leapfrog Geo® software and the EDGE extension. |
| § | Only gold (Au) values are considered here. The metallurgical-qualified person for Oroco will determine whether Silver (Ag) values should be included; if so, the author will immediately consider them in the final Mineral Resource Statement. |
| § | The author developed a new structural model for shearing and lateral displacement. |
24
NI 43-101 Technical Report – Cerro Prieto Project
| § | A 3D grade-shell interpolation was matched with the structural model to increase confidence and accuracy. |
| § | An external dilution factor was not considered during this resource estimation. Internal dilution within 5 m x 5 m x 5 m has been included in this estimation. |
| § | This estimate assumes 100% mining recovery. |
| § | Quantities and grades in a mineral resource estimate are rounded to an appropriate number of significant figures to reflect their approximations. |
| § | Mineral resources are not mineral reserves as they have not yet demonstrated economic viability. |
| § | All data used to elaborate on this report was provided to Oroco in separate files. |
| 1.10.11 | Mineral Resource Statement (Base Case at 0.2 g/t Au cutoff) |
| § | Measured & Indicated: 3.13 million tonnes @ 0.370 g/t Au. |
| § | Inferred: 131,536 tonnes @ 0.360 g/t Au. |
| § | Software used: Leapfrog Geo & EDGE (Seequent) |
? Note: Only gold was modeled. Silver inclusion awaits metallurgical review. No external dilution or mining recovery factor applied.
| 1.10.12 | Sensitivity Analysis |
| § | The cutoff grade sensitivity was evaluated (see Figure 16 below). The resource is responsive to the Au cut-off variation. |
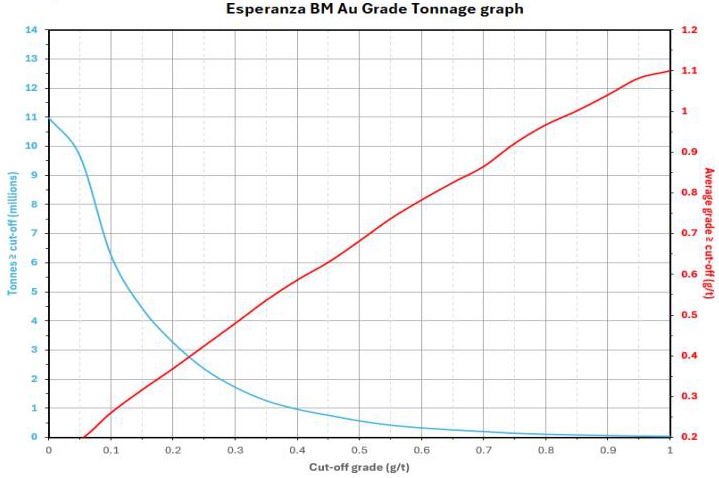
Figure 16 - Esperanzas Block Model Au Grade and Tonnage Graph. Sensitivity of the Esperanzas Deposit Mineral Resource Estimate to variations in the Au cutoff grade. Source: JAO 2025.
25
NI 43-101 Technical Report – Cerro Prieto Project
| 1.10.13 | Constraints Affecting MRE |
| § | Primary risks: |
| o | Non-certified lab usage. |
| o | Absence of QA/QC. |
| o | Data gaps, geological continuity uncertainty. |
| § | No known environmental, permitting, legal, or political risks reported. |
| 1.10.14 | Conclusions |
| § | The MRE is robust, supported by geological understanding and standard modeling software. |
| § | Future exploration and QA/QC improvements may enhance data reliability and classification confidence. |
| 1.10.15 | Recommendations |
| § | Establish collar markers and enhance core storage facilities. |
| § | Implement a thorough QA/QC program according to CIM standards. |
| § | Utilize certified labs and keep coarse/pulp rejects. |
| § | Submit about 5% of rejections to an independent umpire lab. |
| § | Enhance topographic resolution (≤50 cm/pixel). |
| § | Perform geotechnical and open-pit optimization studies. |
| § | Continue exploring satellite targets: Reyna, Cata, Coatí, Cascabel, Zona Sur, and Socorro. |
| 1.11 | Mining Method |
Cristian Garcia, P. Eng., QP, Registered at Engineers and Geoscientists of British Columbia this section of the technical report. The Cerro Prieto project is an operating hard-rock open pit mine in the State of Sonora, Mexico. Ore production to the crushing plant has a planned maximum capacity of 4,200 tpd (1,643 kt/y). The mine’s production schedule was developed to fill the crushing plant and maximize the project's return on investment (ROI).
The total material mining rate is tied to equipment productivity and fluctuates by period. The total material mining rate varies with equipment productivity and changes over time, reaching a peak of 370,000 tonnes per month. The mine operates continuously, 7 days per week, with two 12-hour shifts each day, employing two local mining contractors.
| 1.11.1 | Esperanzas Deposit Pit Optimization |
Cristian Garcia, P. Eng., QP, Registered at Engineers and Geoscientists of British Columbia utilized the GEOVIA Whittle™ software for developing the pit optimization of the Esperanzas Deposit. The optimization and mining schedule included blocks classified as Measured, Indicated, and Inferred resources. Mining dilution was not considered during optimization, as dilution was already accounted for during the construction of the resource model. The main parameters for this optimization are detailed in the table below, with economic assumptions agreed upon by the parent company. Table 4. It shows the technical economical parameters of the pit optimization.
26
NI 43-101 Technical Report – Cerro Prieto Project
Table 4 - Technical Parameters of the Esperanzas Deposit Pit Optimization
| Description | Resources 2024 |
| Metal Prices ($US) | |
| Gold ($/Ounce) | 2,400 |
| Overall Metallurgical Recoveries | |
| Gold Recovery | 72% |
| Processing Cost | |
| Crushing Plant (US$/t) | 2.59 |
| Heap Leach (US$/t) | 2.88 |
| ADR Plant (US$/t) | 1.56 |
| Indirect Costs (US$/t) | 1.27 |
| Administration Costs (US$/t) | 1.12 |
| Total Processing Costs (US$/t) | 9.42 |
| Average Mining Cost (US$/t) | 2.29 |
| Total Costs (US$/t) | 11.76 |
| Geotechnical | |
| Overall Slope Angles | 44 |
| 1.11.2 | Mine Design for the Esperanzas Deposit |
The mine design incorporated typical parameters for a conventional truck and shovel operation, along with geotechnical recommendations from the Cerro Prieto operations team. The resulting mine design criteria is presented in Table 5 below:
Table 5 - Mine Design for the Esperanzas Deposit
| Parameters | Value |
| Ramp Width | 12 m |
| Maximum ramp grade | 10% |
| Minimum mining width | 50 m |
| Bench face angle | 62o |
| Bench height | 6 m (double Bench 12 m) |
| Berm width | 5 m |
The Whittle shell used for the design included a total of 3.5 million tonnes of material, including 1.65 million tons of economic ore and 1.9 million tonnes of waste, resulting in a strip ratio of 1.15 waste to ore (W:O). Applying the mine design criteria, the ultimate pit design was designed as a single final pit with no intermediate phases. This single-phase design contains 3.7 million tonnes of material, including 1.52 million tonnes of ore and 2.18 million tonnes of waste. This provides for a strip ratio of 1.43 (W:O).
27
NI 43-101 Technical Report – Cerro Prieto Project
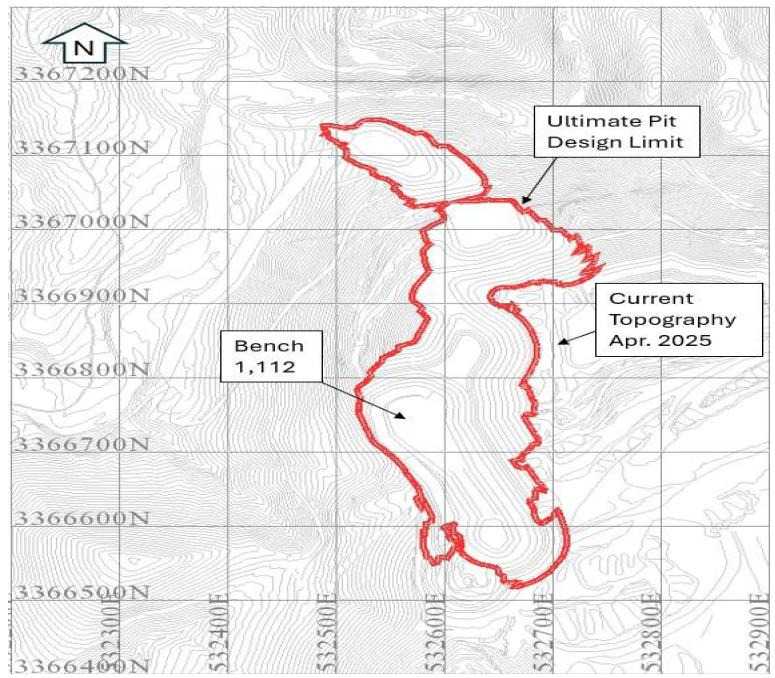
Figure 17 - Mine Design for the Esperanzas Deposit
Moving from Whittle shell to detailed design shell resulted in a loss in total contained ore of 80 thousand tonnes. The decrease in ore and increase in waste is due to the addition of ramps and berms and the removal of non-operational areas at the bottom of the Whittle shells. A summary of the detailed pit shell is shown in the table below.
Table 6 - Summary of the Detailed Esperanzas Deposit Pit Shell
| Phase 1 | Ore (kt) |
Au Grade (g/t) |
Waste (kt) |
Strip Ratio (W:O) |
Total (kt) |
| 1,524 | 0.43 | 2,184 | 1.43 | 3,709 |
A monthly production plan was established from this single mining phase, using a fixed cut-off grade of 0.2 g/t (cut-off grade optimization was not considered). An opportunity has been identified to bring forward a pocket of high-grade ore from a small pit north of the deposit. It should be evaluated to determine the economic impact. The table below shows the monthly production plan.
28
NI 43-101 Technical Report – Cerro Prieto Project
Table 7 - Opportunity to Bring Forward a Pocket of High-Grade Ore from a Small Pit North of the Esperanzas Deposit. Period April 2025 Through April 2026.
| Mine Life (Month & Year) | |||||||||||||||
| Mining | Units | Qty | 4/25 | 5/25 | 6/25 | 7/25 | 8/25 | 9/25 | 10/25 | 11/25 | 12/25 | 01/26 | 02/26 | 03/26 | 04/26 |
| Total Material Moved | kt | 3,709 | 467 | 355 | 284 | 264 | 270 | 296 | 331 | 360 | 360 | 343 | 204 | 161 | 14 |
| Waste | kt | 2,184 | 341 | 229 | 158 | 138 | 144 | 170 | 205 | 234 | 234 | 217 | 78 | 35 | 2 |
| Processing | |||||||||||||||
| Total Ore Processed | kt | 1,524 | 126 | 126 | 126 | 126 | 126 | 126 | 126 | 126 | 126 | 126 | 126 | 126 | 12 |
| Au Grade | g/t | 0.43 | 0.37 | 0.39 | 0.42 | 0.44 | 0.45 | 0.43 | 0.41 | 0.40 | 0.40 | 0.43 | 0.54 | 0.48 | 0.35 |
| Au Recovery | % | 72 | 72 | 72 | 72 | 72 | 72 | 72 | 72 | 72 | 72 | 72 | 72 | 72 | 72 |
| Metal Recovery | |||||||||||||||
| Gold | Koz | 15.1 | 1.1 | 1.1 | 1.2 | 1.3 | 1.3 | 1.2 | 1.2 | 1.2 | 1.2 | 1.3 | 1.6 | 1.4 | 0.1 |
The Esperanzas Deposit mine production plan including tonnages of material (ore and waste) and gold grade to be mined in 13 months are depicted in the following figure.
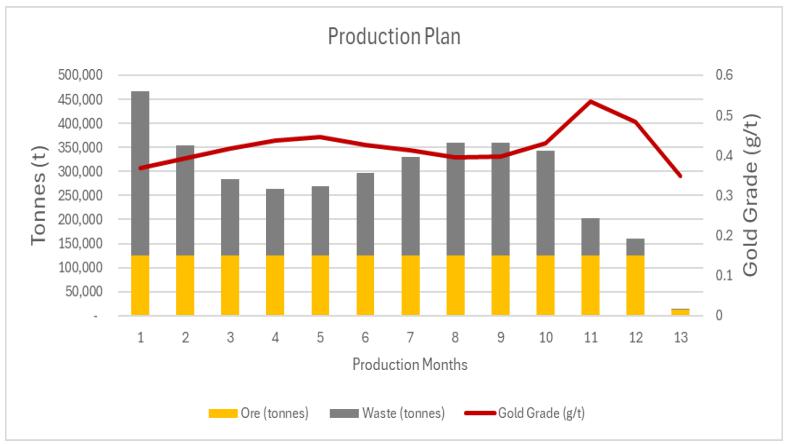
Figure 18 - Production Schedule for the Esperanzas Deposit
| 1.12 | Metallurgical Test Work |
Rodrigo R Carneiro MSc, QP, SME Registered Member prepared this section of the Technical Report. A metallurgical study was conducted on two composite samples of the Esperanzas Deposit which is included inside the Cerro Prieto Mine. The personnel of Cerro Prieto Mine prepared two composite representing the mineral resources included in the Esperanzas Project.
Rodrigo R Carneiro MSc, QP, SME Registered Member specified a metallurgical study which was conducted at Laboratorio Tecnológico de Metalurgia (LTM) S.A de C.V which is an independent ISO certified commercial laboratory located in Hermosillo, Sonora, Mexico.
29
NI 43-101 Technical Report – Cerro Prieto Project
The metallurgical test work conducted on two composite samples of the Esperanzas Deposit included cyanide agitated bottle roll testing and locked cycle column leach testing on the composite samples identified as Esperanza Composite and Nueva Esperanza Composite.
| 1.12.1 | Metallurgical Test Work Conducted in a Certified Commercial Laboratory |
On May 2024, the personnel of Minas de Oro Resources, S.A de C.V prepared two composites representing the mineral resources of the Esperanzas Deposit and identified as Esperanza and Nueva Esperanza Composites. The composites were prepared using 1/4 diameter of HQ drill core reject samples for conducting a metallurgical study specified by an independent metallurgical consultant Rodrigo R Carneiro MSc, QP, SME Registered Member, which included:
| § | Sample preparation and head screen assays (Au, Ag & Cu) at two crush sizes of P80 of 5/8” and P80 of 3/8”, |
| § | Agitated cyanide bottle roll testing on each composite crushed to 100% minus 10 Mesh for 72 hours, |
| § | Locked cycle column testing on each composite at two crush sizes of P80 of 5/8” and P80 of 3/8”. |
In June 2024, a metallurgical study on the Esperanza Composite and Nueva Esperanza Composite representing the mineral resource of the Esperanzas Deposit started and the results achieved in the cyanide bottle roll tests and locked cycle column leach tests on the Esperanza and Nueva Esperanza Composites are included in the following table.
Table 8 - Cyanide Boll Roll Leach Testing on the Esperanza Composites
| Summary of Results | ||||||
| Sample ID | Calculated Head (g/t) |
Cumulative Extraction (%) |
Reagents Consumption (kg/t) | |||
| Au | Ag | Au | Ag | NaCN | CaO | |
| Esperanza | 0.611 | 1.011 | 78.91 | 50.72 | 0.637 | 2.022 |
| Esperanza* | 0.632 | 2.055 | 77.15 | 75.52 | 0.883 | 1.893 |
| Average | 0.622 | 1.533 | 78.03 | 63.12 | 0.760 | 1.958 |
| Nueva Esperanza | 0.815 | 2.861 | 83.23 | 89.49 | 1.009 | 2.224 |
| Nueva Esperanza* | 0.831 | 3.490 | 80.90 | 91.35 | 0.888 | 2.016 |
| Average | 0.823 | 3.176 | 82.07 | 90.42 | 0.949 | 2.120 |
*Duplicate Test
The following comments relate to the summary of results obtained on the cyanide bottle roll leach testing conducted on the Esperanza Composite samples at a particle size of 100% minus 10 Mesh.
| § | Average gold, silver and copper extractions of 78.03%, 63.12 and 4.79% respectively were obtained after 72 hours of retention time. |
| § | Average NaCN and CaO consumptions were 0.760 kg/t and 1.958 kg/t respectively. NaCN and CaO consumptions can be considered in the medium range for an agitated leach testing at a particle size of 100% minus 10 Mesh. |
30
NI 43-101 Technical Report – Cerro Prieto Project
| § | Average gold, silver and copper calculated head of 0.622 g/t, 1.533 g/t and 50.10 g/t respectively were obtained on the Esperanza Composite. |
The following comments relate to the summary of results obtained on the cyanide bottle roll leach testing conducted on the Nueva Esperanza Composite samples at a particle size of 100% minus 10 Mesh.
| § | Average gold, silver and copper extractions of 82.07%, 90.42 and 7.72% respectively were obtained after 72 hours of retention time. |
| § | Average NaCN and CaO consumptions were 0.949 kg/t and 2.120 kg/t respectively, NaCN and CaO consumptions can be considered in the medium range for an agitated leach at a particle size of 100% minus 10 Mesh. |
| § | Average gold, silver and copper calculated head of 0.823 g/t, 3.176 g/t and 66.42 g/t respectively were obtained on the Esperanza Composite. |
Four (4) locked cycle column tests were conducted on the Esperanza Composite at the crush sizes of P80 of 5/8” and P80 of 3/8” using two sodium cyanide concentrations of 300 ppm and 600 ppm for 78 days of leach followed by 4 days of wash cycle and 2 days of drain cycle. The study was conducted at LTM which is a commercial ISO certified metallurgical & analytical laboratory. The results obtained are depicted in Figure 19 and Figure 20 below.
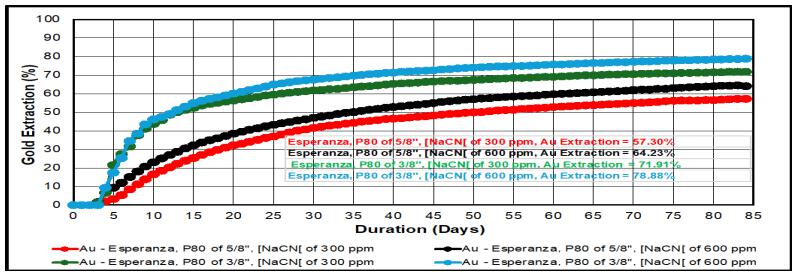
Figure 19 - Gold Extraction on the Esperanza Composite
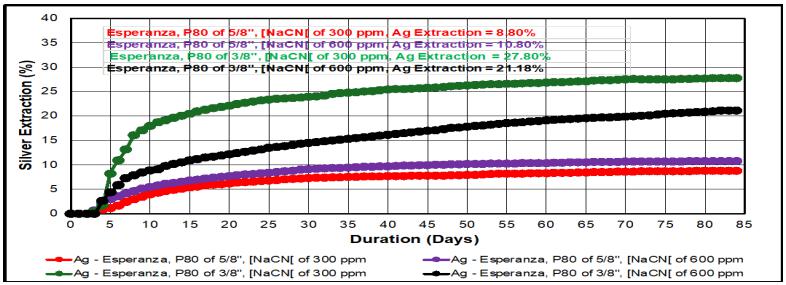
Figure 20 - Silver Extraction on the Esperanza Composite
31
NI 43-101 Technical Report – Cerro Prieto Project
The following comments relate to the column tests conducted on the Esperanza Composite at crush sizes of P80 of 5/8” and P80 of 3/8” using sodium cyanide concentrations in the feed solution of 300 ppm and 600 ppm.
| § | The results obtained showed that the crush size of P80 of 3/8” and sodium cyanide concentration of 600 ppm did impact gold extraction reported gold extraction of 78.88%. |
| § | The crush size of P80 of 3/8” and using 600 ppm of sodium cyanide achieved additional incremental of gold extraction of 14.65% versus the crush size of P80 of 5/8” and using 600 ppm of sodium cyanide. |
| § | Crush size of P80 of 3/8” reported higher silver extraction versus the crush size of 5/8” and it seems that the sodium cyanide concentrations of 300 ppm and 600 ppm did not have a significant impact upon silver extraction. |
Two (2) locked cycle column tests were conducted on the Nueva Esperanza Composite at the crush sizes of P80 of 5/8” and P80 of 3/8” at a sodium cyanide concentration of 600 ppm for 78 days of leach followed by 4 days of wash cycle and 2 days of drain cycle at LTM which is an independent commercial ISO certified metallurgical laboratory, and the results obtained are depicted in Figures 21 and 22 below.
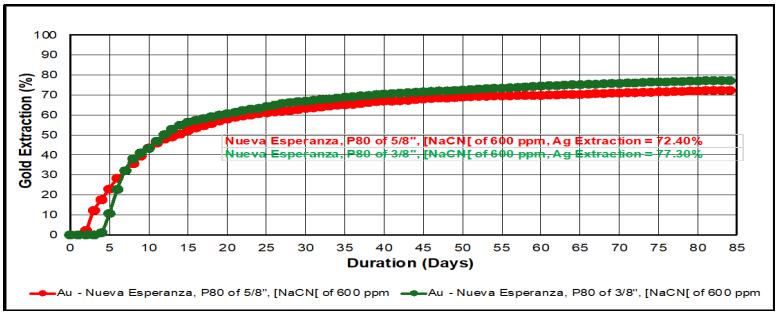
Figure 21 - Gold Extraction on the Nueva Esperanza Composite
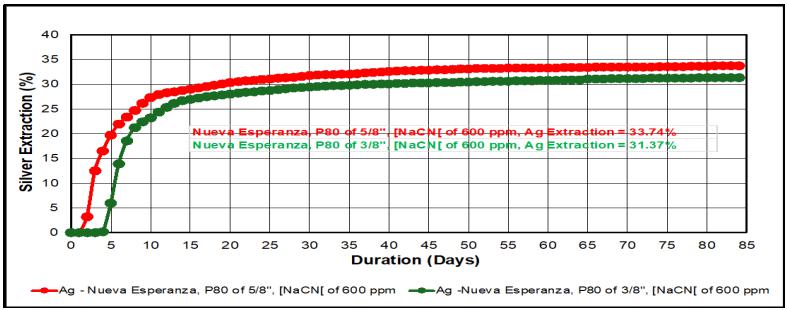
Figure 22 - Silver Extraction on the Nueva Esperanza Composite
32
NI 43-101 Technical Report – Cerro Prieto Project
The following comments relate to the column tests conducted on the Nueva Esperanza Composite at two crush sizes of P80 of 5/8” and P80 of 3/8”.
| § | The crush sizes of P80 of 5/8” and P80 of 3/8” achieved gold extraction of 72.40% and 77.30% respectively. The additional incremental of gold extraction of 4.65% obtained at the crush size of P80 of 3/8” should justify crushing the sample to a finer crush size. |
| § | Crush sizes of P80 of 5/8” and P80 of 3/8” did not have a significant impact upon silver extraction. |
| § | There was not enough sample weight to conduct two column tests using sodium cyanide concentration of 300 ppm. |
| 1.13 | Adjacent Properties |
José Antonio Olmedo MSc, P. Eng. Geo, QP, SME Registered Member prepared the information included in this section of the Technical Report.
| 1.13.1 | Nearby Projects to Cerro Prieto Project: |
| § | Cerro Caliche Project, Sonoro Gold Corp. Located at approximately 2 km east from the Cerro Prieto Project. |
| § | Mercedes Mine Project, Bear Creek Mining Corp. Located at approximately 10 km southwest from the Cerro Prieto Project. |
| § | Santa Gertrudis Project, Agnico-Eagle Mines Ltd. Located at approximately 20 km north from the Cerro Prieto Project. |
| 1.13.2 | Cerro Caliche Project Overview (Sonoro Gold Corp.) |
| § | Acquired: September 2018. |
| § | Area: 1,400 hectares. |
| § | Mineralization: Low-sulfidation epithermal veins, NW-trending, near-surface Au-Ag quartz veins often associated with rhyolitic dikes. |
| § | On March 24, 2023, Sonoro Gold Corp., published a NI 43-101 Technical Report, Mineral Resource Estimate for the Cerro Caliche Project and reported: |
| o | Indicated: 19.9 Mt at 0.44 g/t Au and 3.5 g/t Ag including approximately 280,000 oz Au and 2.24 Moz Ag |
| o | Inferred: 10.5 Mt @ 0.42 g/t Au and 4.0 g/t Ag including approximately140,000 oz Au and 1.345 Moz Ag |
| § | On October 10, 2023, Sonoro Gold Corp., published a NI 43-101 Technical Report for Preliminary Economic Assessment (PEA) and reported: |
| o | Mine Life: 9 years (heap leach, open pit). |
| o | Production Rate: 4,000 tpd (initial), increasing to 12,000 tpd. |
| o | Gold Recovery: 72%. |
| o | After-Tax NPV (5%): USD 47.7 million. |
33
NI 43-101 Technical Report – Cerro Prieto Project
| o | After-Tax IRR: 45%. |
| o | Initial Capex: USD 15.5 million. |
| o | AISC: USD $1,395 per gold equivalent oz. |
| o | Payback Period: ~2.9 years. |
| 1.13.3 | Cautionary Note |
| § | José Antonio Olmedo MSc, P. Eng. Geo, QP, SME Registered Member has not verified the Cerro Caliche data. |
| § | Proximity does not imply similar mineralization at the Esperanzas (Cerro Prieto Project). |
| 1.14 | Capital and Operating Costs |
Rodrigo R Carneiro MSc, QP, SME Registered Member (RRC) an independent consultant prepared the information included in this section of the Technical Report using the information provided by Company personneland RRC verified the information received associated to Operation Capital and Operation Costs.
| 1.14.1 | Capital Costs |
The capital budget prepared by Company personnel for investment from April 2025 to April 2026 is USD 2,764,585 for installing a vibrating screen in the existing crushing circuit, install a second crushing circuit to achieve a crush size of P80 of 3/8", acquisition of loading equipment, acquisition of light vehicles, new core shack, acquisition of computers, plotter and printer, new concrete slab for metallurgy, investment in the chemical plant and yards, equipment for the chemical laboratory, computer equipment for medical and HR services, contingency and back up equipment. Details of the Budget Capital for the Esperanzas Deposit is included in Section 21.1. Table 9 summarizes the Budget Capital Costs.
Table 9 - Budget Capital Costs from April 2025 through April 2026
| Areas | Total Budget (USD) |
| Crushing Circuit 1 Cerro Prieto | 90,000 |
| Crushing Circuit 2 Cerro Prieto | 798,700 |
| Heavy Equipment | 404,000 |
| Light Vehicles | 105,100 |
| Exploration | 21,500 |
| Computer Equipment for Exploration, Crushing and Purchasing | 6,000 |
| Metallurgy | 14,700 |
| ADR Plant and Pads | 713,509 |
| Chemical Laboratory | 55,500 |
| Medical and HR Services | 1,500 |
| Contingency (15%) | 331,576 |
| Back Up (Tertiary Crusher 3 & 988 loader Engine | 222,500 |
| Total (USD) | 2,764,585 |
34
NI 43-101 Technical Report – Cerro Prieto Project
| 1.14.2 | Operating Costs |
Company personnel provided the budget operating costs per from April 2025 through April 2026. Details of the Budget Operating Costs per Area are included in Section 21.2. Table 10 depicts a summary of the Budget Operating Costs per Operation Areas.
Table 10 - Estimated Operating Costs from April 2025 through April 2026
| Areas | Average April 2025 to April 2026 | ||
| USD | USD/tonne | USD/oz | |
| Mining and Exploration | 544,326 | 7.43 | 870 |
| Crushing Plant | 186,892 | 2.68 | 870 |
| Leaching Pads | 243,126 | 3.61 | 392 |
| ADR Plant | 182,880 | 2.21 | 234 |
| Indirect Cost | 144,346 | 2.14 | 238 |
| Administrative Costs | 61,356 | 1.12 | 435 |
| Overall Total Cost | 1,362,926 | 19.19 | 3,039 |
| 1.15 | Other Relevant Data and Information |
José Antonio Olmedo MSc, P. Eng. Geo, QP, SME Registered Member prepared the information included in this section of the Technical Report.
| § | Goldgroup Mining Inc. issued a cautionary statement on a press release dated April 17, 2024, regarding its decision to put the Cerro Prieto Mine into production without completing a feasibility study. |
| § | Key Points: |
| o | No feasibility study or independent technical report confirming the mine's economic or technical viability was conducted before production began. |
| o | Consequently, there is: |
| i. | Increased risk and uncertainty about future economic outcomes. |
| ii. | Greater technical risk of failure than decisions based on completed feasibility studies. |
| 1.16 | Interpretation and Conclusions |
José Antonio Olmedo MSc, P. Eng. Geo, QP, SME Registered Member prepared the information included in this section of the Technical Report.
| 1.16.1 | Geology and Mineralization |
| § | The Esperanzas Deposit is located within a Tertiary volcanic sequence (felsic volcanoclastic, andesitic-basaltic flows, rhyolite/dacite tuffs). |
| § | Mineralization is structurally controlled: |
35
NI 43-101 Technical Report – Cerro Prieto Project
| o | Primary vein (Az 345°): approximately 700 m long, semi-vertical. |
| o | Secondary vein (Az 313°): dips 50–65° to the southwest. |
| § | Mineralization consists of quartz veins, chalcedony, amorphous silica, black calcite, and manganese within a low-sulfidation epithermal system. |
| 1.16.2 | Exploration and Drilling |
| § | Protocols adhered to industry standards, including mapping, geochemical and geophysical surveys, and chip sampling. |
| § | Drilling was completed prior to JAO’s site visit, so the drilling performance could not be verified. |
| § | Adjacent exploration targets (Reyna, Cata, Coatí, Cascabel) exhibit significant Au anomalies ranging from 0.18 to 25.27 g/t. |
| 1.16.3 | Mineral Resource Estimation |
| § | This analysis is based on 51 drill holes, 3,955 core samples, and 1,231 surface samples. |
| § | The estimation methodology follows CIM 2014 definitions and the best practice guidelines from 2019. |
| § | Modeled using Leapfrog Geo and EDGE software; only gold values are included at this stage. |
| § | Assumes: |
| o | 100% mining recovery. |
| o | No external dilution. |
| o | Internal dilution is included (5x5x5 m blocks). |
| 1.16.4 | Database Concern |
| § | About 95% of assays originate from the non-certified Cerro Prieto lab, which lacks a formal QA/QC program, highlighting a critical data integrity issue. |
| § | Recommendation: Reassess samples using certified laboratories and implement comprehensive QA/QC procedures. |
| 1.16.5 | Forward-Looking Caution |
| § | Goldgroup moved Cerro Prieto into production without conducting a pre-feasibility or feasibility study. |
| § | This raises: |
| o | Higher risk of technical failure. |
| o | Greater economic uncertainty. |
| § | Decisions were made without verifying the economic or technical viability of reserves and resources. |
36
NI 43-101 Technical Report – Cerro Prieto Project
| 1.17 | Recommendations |
| 1.17.1 | Data and Infrastructure Improvements |
José Antonio Olmedo MSc, P. Eng. Geo, QP, SME Registered Member (JAO) prepared this section of the Technical Report to support Oroco’s current exploration and development plans and has provided the following technical recommendations to enhance the Cerro Prieto Project.
| § | Install markers at all drilling locations. |
| § | Enhance the project database and data management system. |
| § | Obtain a high-resolution topographic survey (at least 50 cm/pixel). |
| § | Reconstruct the core storage facility, including the ceiling, walls, and security features. |
| § | Retain half of the core from mineralized intervals. |
| § | Organize coarse and pulp rejects separately from both local and ALS rejects. |
Laboratory and QA/QC Enhancements
| § | Choose a certified and accredited lab to analyze all gold-bearing samples. |
| § | Implement QA/QC procedures following CIM Best Practice Guidelines. |
| § | Submit pulp or coarse reject duplicates in place of field duplicates. |
| § | Send at least 5% of rejections to an independent umpire lab, excluding ALS or local labs, to monitor assay reliability and implement any necessary corrective actions. |
Exploration and Mining Studies
| § | Systematically measure and document specific gravity (SG) during future drilling. |
| § | Conduct open-pit optimization studies to more accurately estimate mineable resources. |
| § | Conduct geotechnical studies to ensure the stability of mine slopes and operations. |
Target Area Development
| § | Explore additional high-potential zones: |
| o | Reyna, Cascabel, Cata, Coatí, Zona Sur, Punta Flecha-Puma Norte, and Sureste Extensión Puma. |
Budget and Planning
JAO supports the proposed 2025 exploration program designed to assess the economic viability of the Cerro Prieto mineralize zones. The following table summarized the 2025 Exploration Budget.
37
NI 43-101 Technical Report – Cerro Prieto Project
Table 11 - 2025 Exploration Budget
| Runtime (Days) |
Deposit | Geophysics (USD) |
Roads, Trenches & Drilling Pads (USD) |
Drillings (USD) |
Total (USD) |
|
| 15 | Nueva Esperanza | 64,152 | 64,152 | Diamond Drilling | ||
| 48 | Punta de Fecha & Puma Norte | 9,997 | 13,784 | 88,592 | 112,373 | |
| 52 | Reyna | 10,496 | 6,014 | 278,837 | 295,347 | |
| 17 | Sureste Extension Puma | 57,094 | 57,094 | |||
| 30 | Sur Patios | 59,566 | 59,566 | RC Drilling | ||
| 5 | Cata | 8,997 | 6,892 | 22,667 | 38,556 | |
| 35 | Coati | 8,997 | 8,048 | 35,283 | 52,328 | |
| 22 | Cascabel | 5,998 | 6,892 | 22,667 | 35,557 | |
| Other Direct Exploration Costs | 36,172 | 36,172 | ||||
| Total (USD) | 44,485 | 41,630 | 665,030 | 751,145 | ||
| 1.17.2 | Heap Leaching Process Optimization |
Rodrigo R Carneiro MSc, QP, SME Registered Member based on the results obtained on the metallurgical study conducted on the composite samples (Esperanza and Nueva Esperanza) evaluated under locked cycle cyanide column testing and assuming the composites evaluated represent the mineral resources of the Esperanzas Deposit provides the following recommendations which should be considered for maximize the gold recovery under heap leaching process:
| § | Before heap leaching process, the sample should be stage crushed to 80% passing through a 3/8” sieve to maximize the gold recovery. |
| § | The sodium cyanide concentration of barren feed solution should be kept at 600 ppm at a pH in the range from 10.5 to 11.0 units. |
38
NI 43-101 Technical Report – Cerro Prieto Project
| 2.0 | INTRODUCTION |
This report has been prepared at the request of Goldgroup Mining Inc. (“Goldgroup” or “the Company”) and is intended to document the results of the historical Cerro Prieto Project operation performance from 2017 through 2023 work prior to 2008, as well as metallurgical programs and mineral resource estimates carried out by Minas Oroco Resource S.A de C.V. It is also intended to provide an updated Mineral Resource Estimate for Goldgroup on the Cerro Prieto Project.
This section of the Technical Report was prepared by José Antonio Olmedo MSc, P. Eng. Geo, QP, SME Registered Member, Rodrigo R Carneiro MSc, QP, SME Registered Member and Cristian Garcia, P. Eng., QP, Registered at Engineers and Geoscientists of British Columbia, who are independent Qualified Persons in accordance with National Instrument 43-101 and as defined in the CIM Standards on Mineral Resources and Reserves.
| 2.1 | Terms of Reference |
Goldgroup has been operating the Cerro Prieto Mine heap leach operations since January 2017 in Cucurpe, Sonora, Mexico and has engaged José Antonio Olmedo MSc, P. Eng. Geo, QP, SME Registered Member, Rodrigo R Carneiro MSc, QP, SME Registered Member and Cristian Garcia, P. Eng., QP, Registered at Engineers and Geoscientists of British Columbia to prepare an NI 43-101 Technical Report for a preliminary assessment of mineral resources for the Esperanza Deposit, which is located inside the Cerro Prieto Mine, based on technical work completed up to April 4, 2025.
The geological model for the project was developed by José Antonio Olmedo MSc, P. Eng. Geo, QP, SME Registered Member and it has used this model as a basis for pit optimization and the development of the mining plan for developing the Esperanzas Deposit Resources.
The mining method and the pit optimization of the Esperanzas Deposit was prepared by Cristian Garcia, P. Eng., QP, Registered at Engineers and Geoscientists of British Columbia.
Rodrigo R Carneiro MSc, QP, SME Registered Member specified a preliminary metallurgical study on two composite samples identified as Esperanza Composite and Nueva Esperanza Composite from the Esperanzas Deposit which is located inside the Cerro Prieto Project. The preliminary metallurgical study included locked cycle cyanide column testing at two crush sizes and two sodium cyanide concentrations to evaluate the impact upon gold recovery. The study was conducted at an independent commercial ISO certified metallurgical laboratory in Hermosillo, Sonora, Mexico.
| 2.2 | Qualified Persons |
The following people served as the Qualified Persons (QPs) as defined in National Instrument 43-101, Standards of Disclosure for Mineral Projects, and in compliance with Form 43-101F1:
| § | Rodrigo R Carneiro MSc, QP, SME Registered Member in good standing of the Society for Mining, Metallurgy & Exploration (SME) USA. Qualified Person as defined by NI 43-101, SEC, JORC, and SAMREC Codes. Principal Director, Project Director and Owner of RCarneiro Mineral Engineering & Consulting LLC., Irvine, California. |
39
NI 43-101 Technical Report – Cerro Prieto Project
| § | José Antonio Olmedo MSc, P. Eng. Geo, QP, SME Registered Member in good standing of the Society for Mining, Metallurgy & Exploration (SME) USA and QP Member of the Mining and Metallurgical Society of America (MMSA) USA. Qualified Person as defined by NI 43-101, SEC, JORC Codes, and SAMREC Codes. |
| § | Cristian García, P. Eng., QP, Registered at Engineers and Geoscientists of British Columbia. (Registration No. 58399). |
| 2.3 | Site Visits and Scope of Personal Inspections |
José Antonio Olmedo MSc, P. Eng. Geo, QP, SME Registered Member, Rodrigo R Carneiro MSc, QP, SME Registered Member and Cristian Garcia, P. Eng., QP, Registered at Engineers and Geoscientists of British Columbia conducted the site visits on the last week of May 2024. QPs areas of responsibility are detailed in Table No. 11 below:
Table 12 - QPs Areas of Responsibility and Site Visits
| Qualified Person | Site Visit | Report Sections of Responsibility |
| Rodrigo R Carneiro MSc, QP, SME Registered Member. (RRC) | 28 and 29 May 2024 | RRC is responsible for Sections 1.0, 1.1, 1.2, 1.3, 1.12, 1.14, 1.17.2, 2.0, 2.1, 2.2, 2.3, 2.4, 2.5, 2.6, 3.0, 3.1, 3.2, 4.1, 4.2, 4.3. 4.4 5.1, 5.2, 5.3, 6.0, 12.0, 12.1,12.2, 12.2.3, 13.0, 17.0, 18.0, 19.0, 21.0, 22.0 and 26.3. RRC accepts professional responsibility for my contributions to the Technical Report.
During the site visit RRC visited the crushing plant, heap leaching operation area, ADR Plant, analytical laboratory in the ADR Plant and main metallurgical and analytical laboratories of the mine. |
| José Antonio Olmedo MSc, P. Eng. Geo, QP, SME Registered Member. (JAO) | 28 and 31 May 2024 | JAO completed the following tasks during his field I visited Geological Appraisal, Sample Selection, Sample Preparation, Geochemical Analysis Methods, Quality Assurance / Quality Control Protocols, Sampling Techniques, Drilling Method, Local and Project Geology, Logging, Bulk Density, Data Base VS Analysis Certificates, Location of Data Points, Downhole Surveys, Sample Security, take some Pulses to be analyzed in a third-party certified lab and Visit Targets for Further Exploration. JAO is responsible for Sections 1.4. 1.5, 1.6, 1.7, 1.8, 1.9, 1.10, 1.13, 1.15, 1.16, 1.17.1, 2.1, 3.3, 5.4, 7.0, 8.0, 9.0, 10.0, 11.0, 12.2.1, 14.0, 15.0, 20.0, 23.0, 24.0, 25.0, 26.1 and 27.0. JAO accepts professional responsibility for my contributions to the Technical Report. |
40
NI 43-101 Technical Report – Cerro Prieto Project
| Qualified Person | Site Visit | Report Sections of Responsibility |
| Cristian Garcia, P. Eng., QP, Registered (CG) at Engineers and Geoscientists of British Columbia. (Registration No. 58399). (CG) | 28 May 2024 | CG visited the property on May 28, 2024. Access to the site is in good condition. During the visit, we met with the operations team and toured the main mining areas, including the waste dumps, crusher facility, and heap leach areas. We were able to visually confirm the good geotechnical conditions in the existing open pit areas. I am a co-author of the Technical Report, responsible for Sections 1.0, 1.2, 1.11, 2.1, 2.2, 2.3, 2.4, 3.0, 12.2.2, 16.0, and 26.2. CG accepts professional responsibility for my contributions to the Technical Report. |
José Antonio Olmedo MSc, P. Eng. Geo, QP, SME Registered Member (JAO) conducted a site visit from 28 May through 31 May 2024, and the following tasks were completed in Geological Appraisal, Sample Selection, Sample Preparation, Geochemical Analysis Methods, Quality Assurance / Quality Control Protocols, Sampling Techniques, Drilling Method, Local and Project Geology, Logging, Bulk Density, Data Base VS Analysis Certificates, Location of Data Points, Downhole Surveys, Sample Security, Take some Pulses to be analyzed in a third-party certified lab., and Visit Targets for Further Exploration,
JAO reviewed the available data, including drill logs, assay certificates, and additional supporting information sources supplied by Oroco, in the field; he also visited the old mining sites, the lech pad and the Esperanza mining project with Mr. Ralph Shearing (CEO) and Eng: Omar Tadeo Nevarez and the Reyna exploration target.
JAO reviewed Oroco's protocols on sample selection, sample preparation, geochemical analysis methods, sampling techniques, drilling methods, logging, bulk density, sample security, quality assurance, and quality control (QA/QC).
Cristian Garcia, P. Eng., QP, Registered at Engineers and Geoscientists of British Columbia (CG) visited the property on May 28, 2024, and the access to the mine site is in good conditions. During the visit, Cristian met with the operations team and toured the main mining areas, including the waste dumps, crushing facility, and heap leach areas. He was able to visually confirm the good geotechnical conditions in the existing open pit areas.
Rodrigo R Carneiro MSc, QP, SME Registered Member (RRC) Rodrigo R Carneiro (RRC) visited the Cerro Prieto property on 28 and 29 May 2024. While onsite, he toured the crushing plant, heap leaching operations, metallurgical and analytical laboratories and the ADR Plant operations, he also discussed with plant management the opportunities to improve operation performance. A standard protocol for conducting agitated bottle roll and locked cycle column testing was provided to the metallurgical engineer in charge of the metallurgical laboratory.
The crushing plant was shut down on 28 and 29 May 2024 due to a scheduled shutdown of the plant for the installation of a new feeder to the primary crusher and general maintenance of crushing plant equipment.
41
NI 43-101 Technical Report – Cerro Prieto Project
Prior to the site visit, RRC reviewed the onsite metallurgical test work conducted in 2021 and 2024 including metallurgical testing protocols and discussed the results with the Company personnel.
| 2.4 | Information Sources and References |
Reports and documents listed in Section 3, Reliance on Other Experts and Section 27.0; References were also used to support the preparation of this Technical Report. Additional information was provided by Company personnel where required.
| 2.5 | Economic Analysis |
Rodrigo R Carneiro MSc, QP, SME Registered Member (RRC) an independent consultant prepared this section of the Technical Report and stated that Company personnel provided the information included in this section and RRC trusts that Company personnel who prepared the economic analysis have the expertise to prepare this type of analysis.
RRC verified the information received associated to economic analysis which covers the period from April 2025 through April 2026. The complete economic analysis including a sensitivity analysis for the Esperanzas Deposit located inside the Cerro Prieto Project is included in Section 21 in this Technical Report.
RRC prepared a summary of the economic analysis based on the information provided by Company personnel reported that from April 2025 through April 2026, 1,524,000 tonnes of mineralized material in the measured mineral resources containing 25,263 ounces of gold are placed in the leach pads. A summary of an economic analysis of the Cerro Prieto Project for processing the mineral resource of Esperanzas Deposit is included in Table 13 below:
Table 13 - Summary of Economic Analysis (April 2025 through April 2026)
| Cash Cost and G&A | USD |
| Mine | 9,927,688 |
| Crushing | 3,947,160 |
| Leaching Pads | 5,114,880 |
| ADR Plant | 2,770,560 |
| General Expenses | 2,255,520 |
| Administration & Corporate | 1,989,120 |
| NSR Royalty | 834,290 |
| Total Cost (USD) | 26,839,218 |
| EBITDA Summary | USD |
| Capital injection | 0 |
| Revenue | 41,714,504 |
| Operation Costs | 26,839,218 |
| Operating Profit | 14,875,286 |
| EBITDA | 14,875,286 |
| Cash Flow Summary - | USD |
| EBITDA | 14,875,286 |
| Investment | 2,764,585 |
| Cumulative Cash flow | 12,110,701 |
42
NI 43-101 Technical Report – Cerro Prieto Project
| NPV - 8% Discount Rate | 11,199,031 |
| IRR | 35% |
| After Tax Cash Flow | USD |
| EBITDA | 14,875,286 |
| Depreciation | 838,053 |
| Tax - 30% | 4,211,170 |
| Net Profit After Tax | 11,502,170 |
| Investment | 2,764,585 |
| Cumulative Cash flow After | 8,737,584 |
| NPV - 8% Discount Rate | 8,064,004 |
| IRR | 32% |
| § | Value of Doré gold of USD 2,400/oz and Doré silver of USD 30/oz. |
| § | The Esperanzas Deposit has pre-taxed and after-tax net present cumulative values of USD12,110,701 and USD 8,737,584 respectively. |
| § | By comparison, at an 8% discount rate, the pre-tax and after tax NPV are USD 11,199,031 at an IRR of 35% and USD 8,064,004 at an IRR of 32% respectively. |
| § | The Esperanzas Deposit generates positive cash flow through the end of April 2026. |
| 2.6 | Units of Measure and Abbreviations |
Rodrigo R Carneiro MSc, QP, SME Registered Member (RRC) an independent consultant prepared this section of the Technical Report. All references to dollars in this report are US dollars (US$) unless otherwise noted. Distance, areas, volumes and masses are expressed in metric system unless indicated otherwise.
For this report, common measurements are given in metric units. All tonnages shown are in tonne of 1,000 kilograms, and precious metal grade values are given in grams per tonne (g/t), precious metal quantity values are given in troy ounces (oz). Units of measure and abbreviations that may occur in this Technical Report are listed in Table 14.
Table 14 - Units of Measure and Abbreviations
| Abbreviation | Description |
| AQ | Core diameter (usually ~ 2.70 cm diameter) |
| Au | Gold |
| Ag | Silver |
| AuEq | Gold equivalent |
| BWI | Bond ball mill work index |
| Ca(OH)2 | Calcium hydroxide, hydrated lime |
| CaO | Calcium oxide |
| Cu | Copper |
| cm3 | Cubic centimeter |
| cm2/s | Centimeter per second |
| CV | Coefficient of variation |
| DDH | Diamond drill hole (core) |
| EBITDA | Earnings Before Interest, Taxes, Depreciation and Amortization |
| g | Gram |
| g/L | Grams per liter |
| g/t or g/mt | Grams per metric ton |
43
NI 43-101 Technical Report – Cerro Prieto Project
| Abbreviation | Description |
| Ha | Hectare |
| HDPE | High-density polyethylene |
| hp | Horsepower |
| HQ | Drill core diameter (~ 63.5 mm diameter) |
| IRR | Rate of Return |
| kg/t or kg/mt | Kilogram per metric ton |
| km | kilometer |
| km2 | Square kilometers |
| km/h | Kilometer per hour |
| kW | Kilowatt |
| kN | Kilonewton |
| kWh | Kilowatt-hour |
| LLDPE | Low-density polyethylene |
| Lph/m2 or L/h/m2 | Irrigation rate, liters per hour per square meter |
| L/t or L/tone | Liters per metric ton |
| m | Meter |
| M | Million |
| µm | Micrometers or microns |
| m2 | Square meter |
| m3 | Cubic meter |
| m3/h | Cubic meters per hour |
| masl | Mean elevation above sea level |
| mm | Millimeter |
| mg | Milligram |
| mg/L | Milligram per liter |
| NaCN | Sodium cyanide |
| NPV | Net Present Value |
| NQ | Drill core diameter (~ 47.6 mm diameter) |
| NSR | Net smelters return |
| oz | Troy ounce approximately (31.1035 grams) |
| oz/t | Troy ounces per metric ton |
| PEA | Preliminary economic assessment |
| ppb | Part per billion |
| ppm | Part per million |
| PQ | Drill core diameter (~ 85.0 mm diameter) |
| PROFEPA | “Procuradoria Federal de Proteccion al Ambiente” which |
| QA/QC | Quality assurance/quality control |
| Quantile-quantile plot | |
| SERMARNAT | “Secretaria de Medio Ambiente y Recursos Naturales” which |
| t, mt, or tonne | Metric ton (1,000 kg) |
| t/h | Metric ton per hour |
| t/m3 | Metric ton per cubic meter |
| US$ or USD | US currency (dollars) |
| % | Percent |
44
NI 43-101 Technical Report – Cerro Prieto Project
| 3.0 | RELIANCE ON OTHER EXPERTS |
Cristian Garcia, P. Eng., QP, (CG) Registered at Engineers and Geoscientists of British Columbia and Rodrigo R Carneiro MSc, QP, (RRC) SME Registered Member have relied upon and disclaim responsibility for information derived from reports pertaining to mineral tenure, surface rights, water rights, and environmental approvals and permits. The authors have reviewed the status of the current environmental permits, and everything is in good standing.
| 3.1 | Mineral Tenure and Royalties |
Rodrigo R Carneiro MSc, QP, (RRC) SME Registered Member have not independently verified the legal status of ownership of land within the Approved Project Boundary. RRC have fully relied upon and disclaims responsibility for information provided by Company staff and experts retained by the Company for information relating to mineral tenure, landholders’ title to properties, and mining lease agreements the Company has with landholders.
| 3.2 | Surface and Water Rights |
Rodrigo R Carneiro MSc, QP, SME Registered Member (RRC) prepared this section of the Technical Report and have fully relied upon information provided by Company personnel for information relating to surface rights and water rights in Cerro Prieto Project.
RRC has fully relied upon information provided by Company staff and experts retained by the Company for information relating to surface rights and water rights in the Cerro Prieto Project. The Company personnel reported that the main water supply for the process at Minas de Oroco Resources, S.A. de C.V., Cerro Prieto mining unit comes from an underground mining working water well, specifically from the existing, currently inactive, tunnels. The well is located near Tajo Centro and Tajo Sur, at coordinates (N3364985.835; E533124.342), with a flow rate of 350 m³/day. Under the 1975 Mining Law, mining workings wells did not require registration or payment of fees; the 2024 Mining Law requires registration and payment of fees. This well is already in the process of being recognized as mining workings water by CONAGUA. CONAGUA’s Technical Directorate is requesting the Water Administration Directorate to issue a working water concession for 350,000 m³. The Company is awaiting the release of this process through a water permit.
Another source of water supply is located at coordinates N3363675.46 and E3363676.46 within the mine property, called Patio 7 and provides a flow rate of approximately 2 Liters per second from an exploration well.
There is a 3,704 m² rented land at the "La Puente" Ranch, located 8 km northwest of the mine, where the transfer of 500,000 m³ of water rights acquired by Oroco's legal representative from the San Miguel River basin is underway.
| 3.3 | Environmental Studies and Approvals and Permits |
José Antonio Olmedo MSc, P. Eng. Geo, QP, SME Registered Member prepared this section of the Technical Report, and the following summary has been prepared for the Cerro Prieto Project, located in Cucurpe, Sonora, Mexico. The author, acting as a Qualified Person for geology and mineral resources, is not an expert in environmental and permitting matters and relies on the work of Oroco and its environmental advisors for the content of this section. Details containing of the environmental studies, pertaining and community impact are included in section 20 in this Technical Report.
45
NI 43-101 Technical Report – Cerro Prieto Project
The information is based on documentation provided by Minas de Oroco Resources and its environmental consultants, Cambiens, S.A. de C.V., in the study “Environmental Situation,” dated June 16, 2025, signed by Eng. Jorge Alberto Martínez de Anda, and publicly available government filings.
Between 2009 and 2024, numerous environmental studies were carried out for the Cerro Prieto Project. These studies found no major environmental obstacles that would hinder mineral resource extraction within the project area.
46
NI 43-101 Technical Report – Cerro Prieto Project
| 4.0 | PROPERTY DESCRIPTION AND LOCATION |
| 4.1 | Location |
Rodrigo R Carneiro MSc, QP, SME Registered Member (RRC) prepared this section of the Technical Report. The Esperanzas Deposit is located inside the Cerro Prieto mining property which is located 50 kilometers southeast of the town of Magdalena de Kino, state of Sonora. Access to the property is along a paved two-lane highway southeast from Magdalena de Kino for 40 kilometers, and then by a secondary gravel road, which often follows local arroyos (dry riverbeds), for an additional 12 kilometers north from the highway.
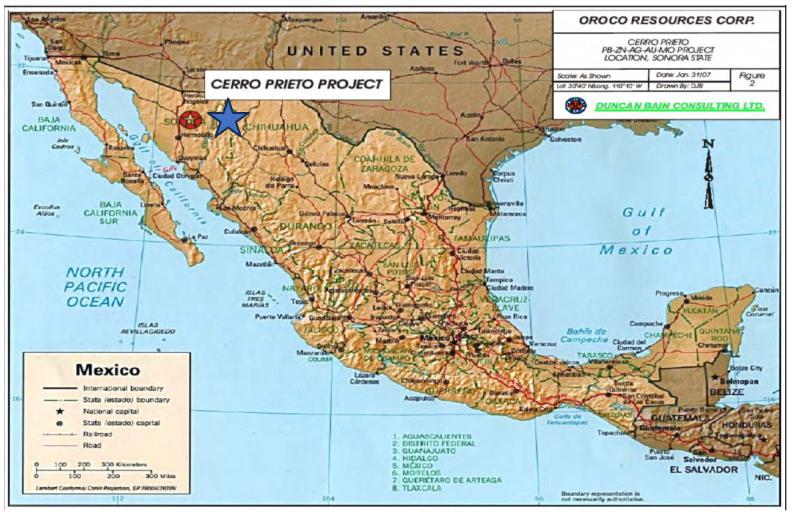
Figure 23 - Location of the Cerro Prieto Project in the State of Sonora, Mexico. Source Duncan Bain Consulting LTD.
| 4.2 | Land Holdings |
Rodrigo R Carneiro MSc, QP, SME Registered Member prepared this section of the Technical Report. The Company owns 100% of the 6,980 hectares of Cerro Prieto mine, consisting of private (fee land and patented lode mining claims and millsites) and federal lands (unpatented mining claims and millsites) collectively referred to as the Property. The total area of the project includes mining, waste rock disposal, the heap leach pads, ADR Plant, mine truck maintenance building and office facility.
| 4.3 | Mineral Tenure and Mining Lease Agreements |
Rodrigo R Carneiro MSc, QP, SME Registered Member (RRC) prepared the information included in this section of the Technical Report. The Company holds directly or controls via agreement a total of 6,980 hectares which together make up the property. Additional land is held by the company which may be incorporated into the project area in the future if required.
47
NI 43-101 Technical Report – Cerro Prieto Project
The Company believes that all the land required for the project has been secured under a mining lease or is held by the company through ownership of the land in fee or via unpatented mining claims. The Company is continuing to add to its land position in the area.
| 4.4 | Freedom to Operation Across Property |
Rodrigo R Carneiro MSc, QP, SME Registered Member (RRC) prepared the information included in this section of the Technical Report. The Company has unimpaired ability to operate across all land that comprises the Cerro Prieto Project. The Company is not in default on any mining lease agreement. All leases have an "evergreen" clause extending them if the Project operates.
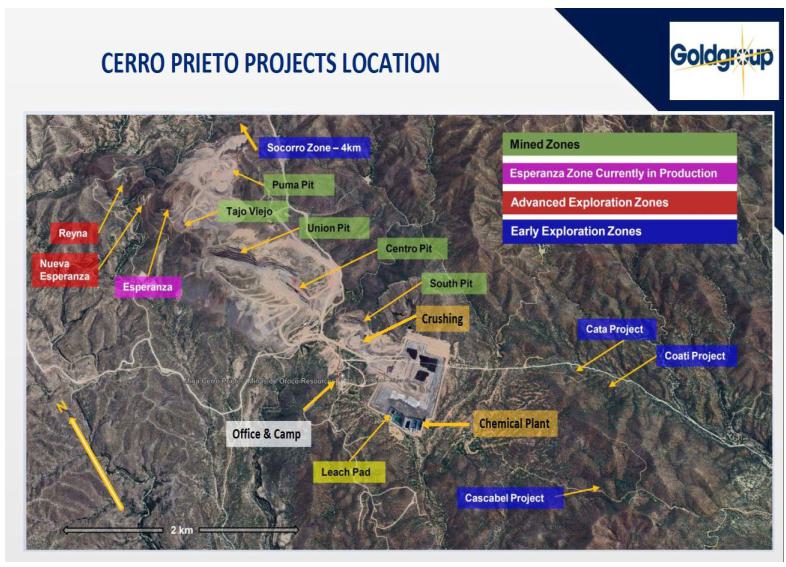
Figure 24 – Locations of Pits, Office & Camp, Mined Zones, Esperanza Deposit, Advanced Exploration Zones, Early Exploration Zones, Crushing Plant, Heap Leach, ADR Plant (Chemical Plant). Source: Goldgroup 2025.
The company entered into an agreement to purchase all the issued and outstanding shares of Minera Polimetalicos Mexicanos S.A. (Polimetalicos), a Panamanian company which holds 98% (49 out of 50) of the issued and outstanding shares of Minas de Oroco Resources S.A. de C.V., a Mexican company which has acquired 100% interest in the Cerro Prieto mining property. Pursuant to this agreement, as amended on September 24, 2007, the Company had the right to purchase the issued and outstanding shares of Polimetalicos in consideration for US$ 2,500,000, which has been paid in full. The agreement also includes a 2% NSR (Net Smelter Return) royalty.
48
NI 43-101 Technical Report – Cerro Prieto Project
The Company also entered into an agreement with Yamana to acquire a 4,120 hectares portion of the Argonauta 6 concession that surrounds the original San Francisco and San Felix concessions. The agreement with Yamana stipulates that the Company will conduct 1500 meters of drilling on the concession and will give Yamana 1,000,000 shares of the Company by January 1, 2011. At the date of this report the drilling requirement has been completed, and 500,000 shares have been given to Yamana. In 2007 the Cerro Prieto concession was added to the project. It covers the area north of the main area of mineralization and contains an extension of the structure. Table 15 presents the details of the Cerro Prieto concessions.
Table 15 - Cerro Prieto Mining Concessions
| Concession Name |
Certificate Number |
Area (Hectares) |
Staking Date |
Expiration Date |
Owner of Record |
| San Feliz | 176213 | 205.1784 | 08/26/1985 | 08/25/2025 | Minas de Oroco Resources S.A. de C.V. |
| San Francisco | 182330 | 10.00 | 02/01/1989 | 06/12/2038 | Minas de Oroco Resources S.A. de C.V. |
| Argonauta 6 Fraction | 236194 | 4120 | 05/19/2010 | 03/15/2057 | Minas de Oroco Resources S.A. de C.V. |
| Cerro Prieto | 229932 | 2508.0 | 07- 03/2007 | 07/02/2057 | Minas de Oroco Resources S.A. de C.V. |
| Elba | 177302 | 5.82 | 03/18/1989 | 03/17/2036 | Minas de Oroco Resources S.A. de C.V. |
| Huerto de Oro | 172314 | 20 | 11/23/1983 | 11/22/2033 | Minas de Oroco Resources S.A. de C.V. |
| Reyna de Plata | 177266 | 9.79 | 03/17/1986 | 03/16/2036 | Minas de Oroco Resources S.A. de C.V. |
To the authors’ knowledge, there are no further obligations, liens or encumbrances on the property. The authors are also unaware of any environmental liabilities to which the property is subject. As the proposed work has not been initiated the author is unaware of whether all necessary permits have been obtained. The work is a continuation of drilling and therefore the authors do not anticipate any issues with obtaining those permits. To the author’s knowledge there are no other significant factors and risks that may affect access, title, or the right or ability to perform work on the property.
49
NI 43-101 Technical Report – Cerro Prieto Project
| 5.0 | ACCESSIBILITY, CLIMATE, LOCAL RESOURCES, INFRASTRUCTURE AND PHYSIOGRAPHY |
| 5.1 | Access |
Rodrigo R Carneiro MSc, QP, SME Registered Member prepared the information included in this section. The Esperanzas Deposit is located inside the Cerro Prieto mining property which is located 50 kilometers southeast of the town of Magdalena de Kino, state of Sonora, in northwestern Mexico. The project is contained within six concessions. The San Francisco concession of 10 hectares hosts the workings of the old Cerro Prieto Mine. Access to the property is along a paved two-lane highway southeast from Magdalena de Kino for 40 kilometers, and then by a secondary gravel road, which often follows local arroyos (dry riverbeds), for an additional 12 kilometers north from the highway.
| 5.2 | Climate |
Rodrigo R Carneiro MSc, QP, SME Registered Member prepared the information included in this section. The area is typically arid to semi-arid, with daytime temperatures ranging from extremes of 50°C in the summer to 20°C in the winter, although nights can reach as low as –5°C. Rainfall is in the form of thunderstorms during the late summer months, with some short periods of a gentler cold rain in the winter. Thunderstorms may produce flash floods in the arroyos and creeks and may cause washouts of the local roads and trails. The Company, in conjunction with the ranch owner, has a program of regular maintenance of the roads.
| 5.3 | Local Resources |
Rodrigo R Carneiro MSc, QP, SME Registered Member prepared the information included in this section. The town of Magdalena de Kino and the surrounding region has a population of approximately 40,000 people and town has a large labor force trained in exploration programs, mining, and heap leach operations. Land surveyors are available in Hermosillo, and mining personnel and equipment, as well as exploration equipment and supplies, can be found in the Hermosillo and Magdalena de Kino region. The village of Cucurpe lies approximately 17.5 km by road to the southeast and could supply a small labor force.
| 5.4 | Comments |
In the opinion of José Antonio Olmedo MSc, P. Eng. Geo, QP, SME Registered Member and based on actual existing Cerro Prieto Mine operations, the Esperanza Deposit is inside this mine in an area with access and services that supports the existing and future operations of the mine and process facilities.
The area is typically arid to semi-arid, with daytime temperatures ranging from extremes of 50°C in the summer to 20°C in the winter, although nights can reach as low as –5°C. Rainfall is in the form of thunderstorms during the late summer months, with some short periods of a more gentle cold rain in the winter. Thunderstorms may produce flash floods in the arroyos and creeks and may cause washouts of the local roads and trails. The Company, in conjunction with the ranch owner, has a program of regular maintenance of the roads.
Topography in the area is rugged, and consists of a series of block faulted, low angle dipping sedimentary layers capped by relatively impermeable volcanic flows and pyroclastics. This produces a series of sharp ridges that rise abruptly to a height of 200 to 300 meters above local canyon floors and arroyos. The maximum local elevation is approximately 1200 meters above sea level (asl). From the arroyo at the south end of the San Francisco concession (Arroyo Las Rastras) the topography slopes steeply upwards to the north. This has allowed a series of open cuts to be constructed during the period of active mining in the early 1900s.
50
NI 43-101 Technical Report – Cerro Prieto Project
| 6.0 | HISTORY |
Rodrigo R Carneiro MSc, QP, SME Registered Member prepared the information included in this section of the Technical Report. The following information was extracted from a Preliminary Economic Assessment ("PEA") published on December 15, 2010, Minas Oroco Resources Corp. S.A de C.V (Oroco) prepared in accordance with NI 43-101 for the Cerro Prieto Project.
Oroco Resource Corp., a Vancouver based exploration company, acquired rights to the San Francisco and San Felix concessions through an option agreement with the Panamanian company Minera Polimetalicos Mexicanos S.A. Under the terms of the Agreement Oroco earned a 100% interest in the property, subject to a 2% net smelter return royalty by making staged payments totaling USD 2.5 million.
The original Project consists of three Mining Concessions covering a total area of approximately 4335 hectares. These are the Cerro Prieto, the San Francisco and the San Felix concessions. During 2009 the Company optioned a 4120 hectares portion of a claim (Argonauta 6 Fraccion) from Yamana Gold Inc. Argonauta 6 Fraccion surrounds the San Francisco and San Felix claims and hosts extensions to the mineralized structure on Oroco’s claims 1.75 kilometres to the north and 7.5 kilometres to the south. In January 2012 Oroco acquired three additional mineral concessions which are Elba, Huerto de Oro and Reyna de Plata.
| § | The 5.82 hectares of the Elba concession lies directly south of the southern boundary of the original property and hosts approximately 250 meters of strike length of the main mineralized structure. |
| § | The 20 hectares of the Huerto de Oro mineral concession and 9.79 hectares of the Reyna de Plata mineral concession are located approximately four kilometers east of Cerro Prieto Project. |
On June 10, 2013, Goldgroup Mining Inc., published a Technical Report on the 2011-2012 Exploration Program including an updated Resource Estimation on the Cerro Prieto Project
| 6.1 | Historical Production of Cerro Prieto Mine (2017-2023) |
Rodrigo R Carneiro MSc, QP, SME Registered Member prepared the information included in this section of the Technical Report using the information provided by Company personnel. Cerro Prieto Mine has been continuously in operation since 2017 and the historical ore crushed, ore processed in the heap leach pads and gold and silver recoveries in the ADR Plant are summarized in Table 16, Table 17 and Table 18.
Table 16 - Historical Ore Processed in the Crushing Plant
| Year | Ore
Crushed (tonne) |
Gold & Silver Assays | Gold (Oz) |
Silver (Oz) | |
| Au (g/t) | Ag (g/t) | ||||
| 2017 | 732,047 | 1.068 | 51.52 | 25,134 | 1,212,669 |
| 2018 | 808,879 | 0.874 | 29.44 | 22,717 | 765,589 |
| 2019 | 741,080 | 1.037 | 26.50 | 24,706 | 631,356 |
| 2020 | 835,460 | 0.866 | 18.09 | 23,265 | 485,786 |
| 2021 | 729,677 | 0.846 | 33.07 | 19,854 | 775,885 |
51
NI 43-101 Technical Report – Cerro Prieto Project
| Year | Ore
Crushed (tonne) |
Gold & Silver Assays | Gold (Oz) |
Silver (Oz) | |
| Au (g/t) | Ag (g/t) | ||||
| 2022 | 720,748 | 0.688 | 21.95 | 15,937 | 508,547 |
| 2023 | 767,382 | 0.889 | 19.43 | 21,937 | 479,410 |
Table 17 - Historical Ore Processed in Heap Leaching
| Year | Crushed Ore Placed in the Heap Pads (tonne) |
Assays | Oz
of Gold Placed in the Heap Pads |
Oz of Silver Placed in the Heap Pads | |
| Au (g/t) | Ag (g/t) | ||||
| 2017 | 732,047 | 1.068 | 51.52 | 25,134 | 1,212,669 |
| 2018 | 808,879 | 0.874 | 29.44 | 22,717 | 765,589 |
| 2019 | 741,080 | 1.037 | 26.50 | 24,706 | 631,356 |
| 2020 | 931,041 | 0.815 | 17.95 | 24,396 | 537,365 |
| 2021 | 1,087,119 | 0.679 | 30.96 | 23,749 | 1,082,174 |
| 2022 | 1,354,825 | 0.571 | 21.92 | 24,890 | 954,621 |
| 2023 | 1,054,938 | 0.871 | 18.19 | 29,545 | 616,855 |
Table 18 - Historical Gold and Silver Recovered in the ADR Plant
| Year | Gold and Silver Recovered (oz) | Overall % Recovery of Gold and Silver | ||
| Au | Ag | Au | Ag | |
| 2017 | 14,480 | 52,955 | 57.61 | 4.37 |
| 2018 | 15,776 | 34,490 | 69.45 | 4.51 |
| 2019 | 13,644 | 20,519 | 55.22 | 3.25 |
| 2020 | 11,410 | 16,102 | 46.77 | 3.00 |
| 2021 | 12,932 | 36,036 | 54.45 | 3.33 |
| 2022 | 11,414 | 13,598 | 45.86 | 1.42 |
| 2023 | 12,562 | 9,707 | 45.86 | 1.57 |
52
NI 43-101 Technical Report – Cerro Prieto Project
| 7.0 | GEOLOGICAL SETTING AND MINERALIZATION |
José Antonio Olmedo MSc, P. Eng. Geo, QP, SME Registered Member prepared the information included in this Section of the Technical Report.
| 7.1 | Regional |
Jurassic and Cretaceous rocks in the Magdalena de Kino-Cucurpe region illustrate the transition from a shallow-level magmatic arc to a northwest-trending marine embayment (Nourse, 1995). The stratigraphy is divided into:
| § | Lower or Middle Jurassic rhyolite porphyry and quartz arenite/conglomerate. |
| § | Upper Jurassic to Lower Cretaceous Glance Conglomerate, along with minor sandstone and siltstone. |
| § | Lower Cretaceous basial marine clastic and carbonate sediments of the Bisbee Group, and |
| § | Lower-Middle Tertiary shallow marine siliciclastic deposits from the Baucarit Formation. |
The lower three series were weakly metamorphosed by compression during the Laramide Orogeny and/or by mid-Tertiary volcanism, mylonitization, and detachment faulting. Felsic intrusions from the Upper Cretaceous/Lower Tertiary may represent remnants of a metamorphic core complex.
The area surrounding the Cerro Prieto Project is underlain by Lower to Middle Tertiary shallow marine, shoreline, and deltaic deposits of conglomerate and quartz arenite. These deposits are capped by Middle Tertiary volcanic flows composed of andesite, basalt, and rhyolite-dacite ash flow tuffs. The resistant volcanic “caps” create rugged topography and sharp elevation changes are depicted in Figures 26 and 27.
53
NI 43-101 Technical Report – Cerro Prieto Project
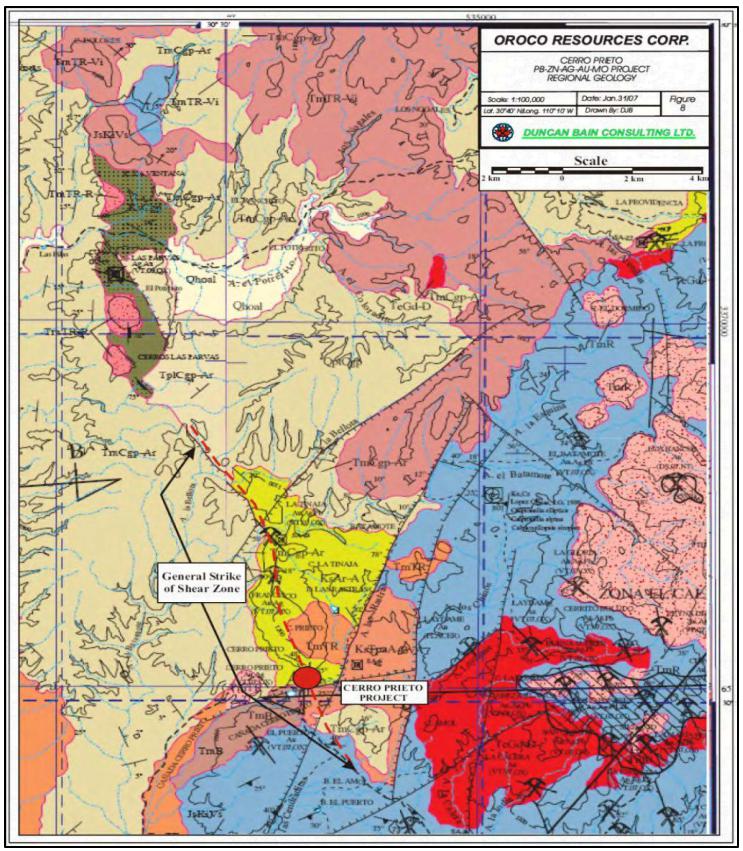
Figure 25 - Regional Geological Map. Source: Mexican Geological Service (SGM).
54
NI 43-101 Technical Report – Cerro Prieto Project
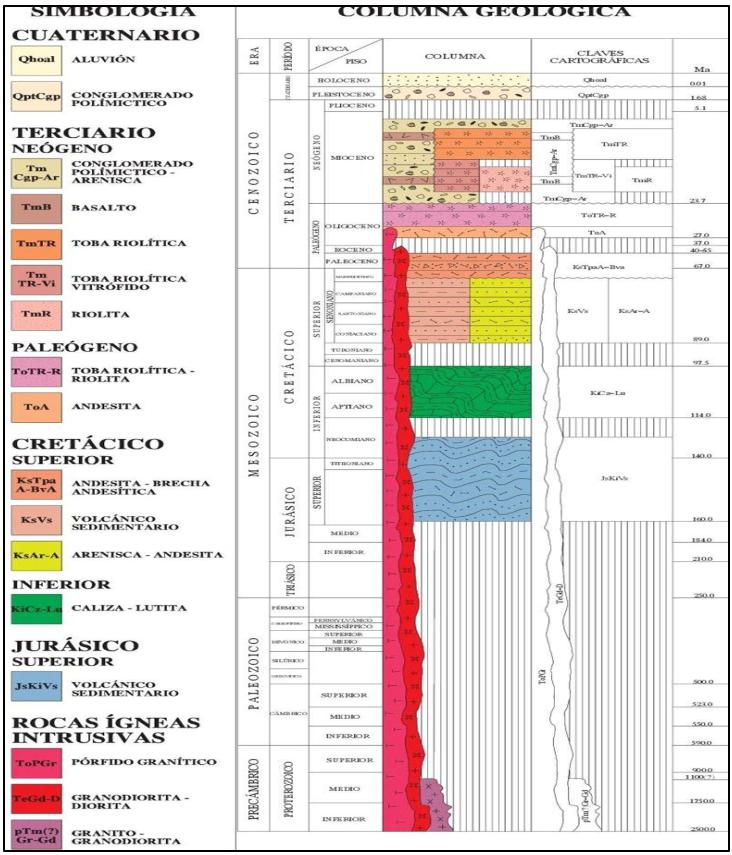
Figure 26 - Regional Stratigraphic Column. Source: Mexican Geological Service (SGM).
55
NI 43-101 Technical Report – Cerro Prieto Project
| 7.2 | Local Geology |
The local area, including the Project, consists of terrigenous shallow marine to deltaic clastic sediments equivalent to the Baucarit Formation (Nourse, 1995). Generally, this formation comprises polymictic conglomerates that are partly consolidated and cemented within a medium-grained matrix. These rocks can be observed on the north side of Cerro Prieto, where they form a discordant contact with the Cretaceous sediments and intrusions; however, they are otherwise rare in the Project area. Within the Project, these Tertiary sediments consist of thinly bedded fine to medium-grained arenites, exhibiting a general strike of 55° and a general dip of 30° to 45° to the northwest. Additionally, they are weakly metamorphosed and highly silicified. See below Figures 28 and 29.
Tonalite intrusions are present in the area, although they are not observed within the old mine. They range from red to gray, indicating alteration due to hydrothermal activity. The complete kaolinization of feldspar phenocrysts suggests that the alteration was intense. These intrusions are considered Middle or Upper Cretaceous age and are comparable to a granite/granodiorite batholith located east of the property.
Within the Project, Tertiary volcanic rocks include felsic volcanoclastics and andesitic to basaltic flows with minor rhyolite. They are disconformable located between the Tertiary arenites and polymictic conglomerates. In some areas, extensive rhyolite and dacite tuff beds have been deposited. Dyke rocks composed of andesite porphyry are present in the central part of the Project area. This is reported by Smith (1987); however, to the author’s knowledge, no detailed surface map of the Project exists that shows the exact location of these.
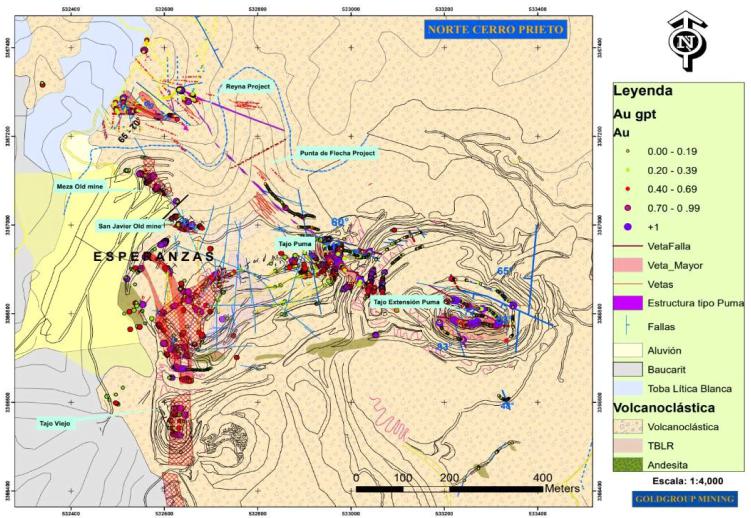
Figure 27 - Local geology showing the Esperanzas geological setting. Source: Goldgroup, 2025.
56
NI 43-101 Technical Report – Cerro Prieto Project
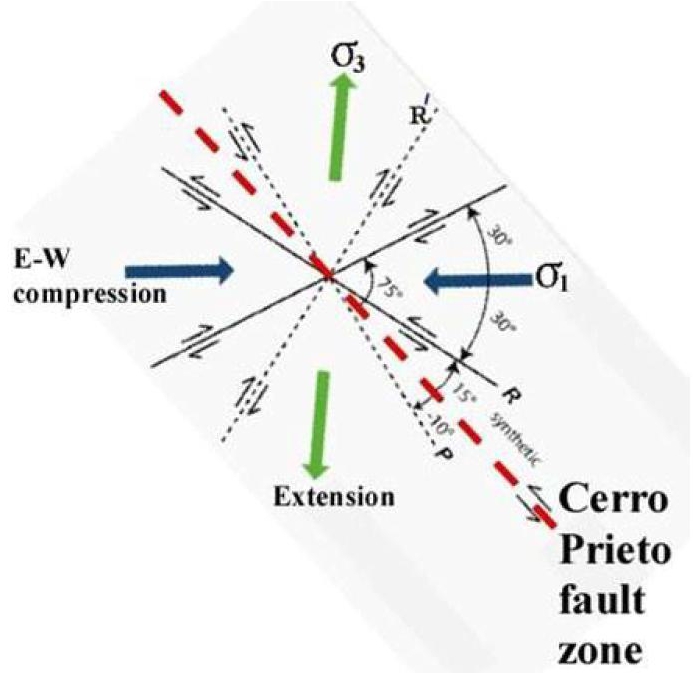
Figure 28 - Schematic diagram illustrating the compression and tension quadrants associated with the orientations of the principal stress directions. Observed fault zones, fractures, and veins in pit walls and along exploration road cuts align with the orientation of the Cerro Prieto fault zone.
| 7.3 | Mineralization at Esperanzas |
Mineralization at Esperanzas Deposit is confined to geological structures exhibiting approximately 345° Az in the primary structure and 313° Az in the secondary one. The main structure measures about 700 meters in length and features a semi-vertical dip, while the secondary structure's dip ranges from 65° SW in its northern section to around 50° SW in its southern portion. Figure 30.
In addition to these two prominent veins, the shear zone contains subsidiary zones of mineralization, including disseminations, veins, and stringers, which permit a wide range of low-grade mineralization. Consequently, Oroco designed an open-pit mining method to extract gold values at maximum scale.
57
NI 43-101 Technical Report – Cerro Prieto Project
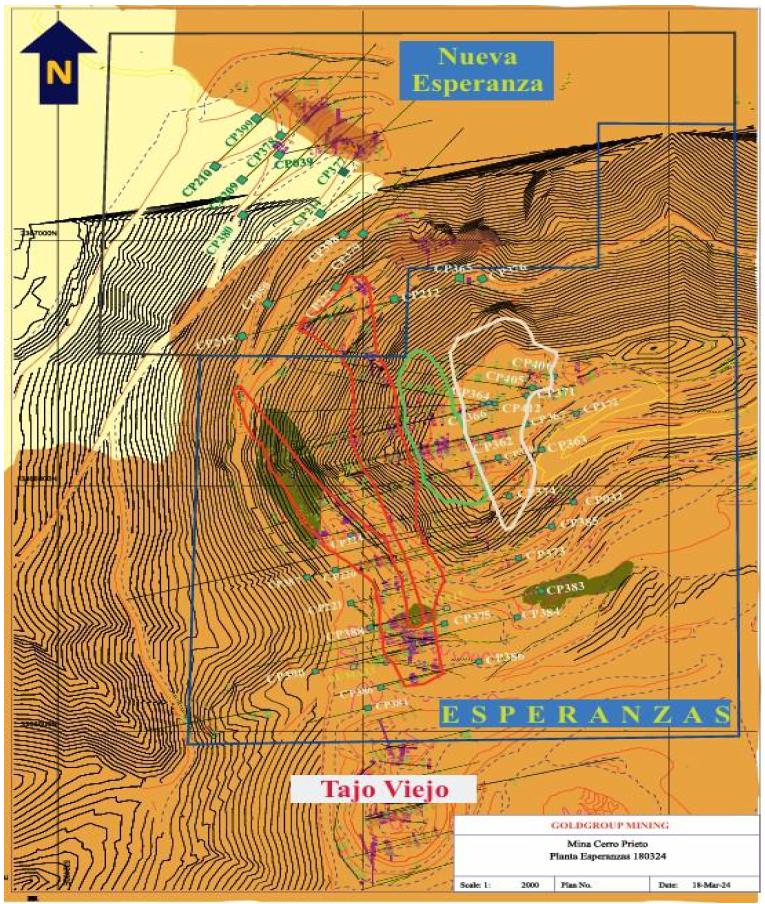
Figure 29 - Esperanzas Deposit Geological Map. It displays exploration drill holes, with the stratigraphy legend identical to that in Figure 32. Source: Goldgroup, 2024.
Oroco’s drilling campaign at Esperanzas Deposit confirmed that the mineralization consists of quartz veins, chalcedonic quartz veinlets, micro veinlets, amorphous silica, black calcite, and manganese lenses with argillic alteration as it is depicted in Figure 31.
58
NI 43-101 Technical Report – Cerro Prieto Project
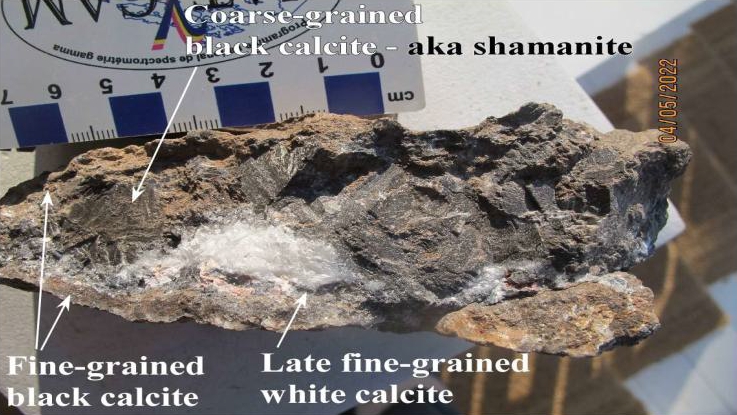
Figure 30 - Esperanzas’ Zones Typical Vein Mineralization.
José Antonio Olmedo MSc, P. Eng. Geo, QP, SME Registered Member (JAO) interprets a geological model by visually comparing the input data for block modeling with geological and structural interpretation (see Figure 33). Details are provided in Section 14. Mineral Resource Estimates, specifically in Subsections: 14.3. Geological Model, and 14.8. Model Validation.
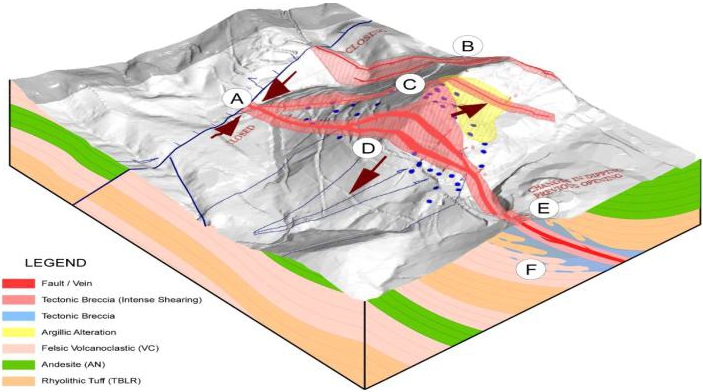
Figure 31 - Geological Interpretation of the Esperanzas Deposit. A) Fault Core Compression; B) Puma Imbricated Thrust – Ramp; C) Nueva Esperanza Imbricated Thrust-Fault; D) Esperanza Tensile Opening in Trans-Tensional Wedge (Soft Boundary); E) Fault Core Compression and Riedels; F) Splay Fracturing along Compression Edges. Source: JAO, 2025.
59
NI 43-101 Technical Report – Cerro Prieto Project
| 7.4 | Significant Mineralized Zones |
Oroco has four potential exploration targets in progress, as illustrated in Figure 33: Cerro Prieto Exploration Targets Location.
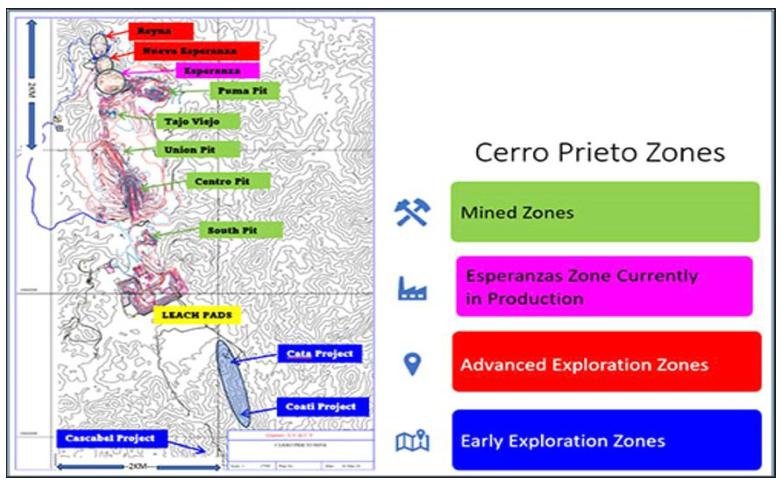
Figure 32 - Location of Cerro Prieto Exploration Targets. Source: Goldgroup, 2025.
The following summarizes the geological characteristics of the Reyna, Cata-Coatí, and Cascabel exploration Deposits.
| 7.4.1 | Geological Overview of the Reyna Deposit |
| 7.4.1.1 | Lithology |
The Reyna Deposit consists of a volcaniclastic breccia containing angular to sub-rounded clasts within an andesitic ash matrix of Tertiary age. The rock exhibits colors ranging from ochre-brown to light brown and reddish gray, with darker brown shades in areas enriched with manganese oxides. The Baucarit Formation spans from the Oligocene to the Miocene epochs and is also exposed at the surface. Figure 35.
| 7.4.1.2 | Structural Geology |
| § | Multiple fault and vein systems characterize the project's structural framework. |
| § | Primary Shear Zone and Veins: Exhibit a dominant strike of N75–80°W, dipping 70–80°SW. |
| § | Puma-Type Vein System: This system, situated in the central-northeastern sector, comprises black calcite, chalcedonic quartz, and late-stage anhedral to subhedral white crystalline calcite. It trends N20–30°W, with dips varying from 50° to 70°SW. |
| § | Central Normal Fault: Strikes N50–60°W with variable dips of 60–70° SW, featuring a gouge zone and apparent block displacement toward the southwest. |
60
NI 43-101 Technical Report – Cerro Prieto Project
| § | NE–SW Fracture System: These fractures dip at 65–75° NW and define the boundaries of down-dropped blocks displaced to the southwest. |
| 7.4.1.3 | Alteration |
The hydrothermal alterations observed include:
| § | Silicification: strong yet not pervasive. |
| § | Argillic alteration: Moderate, potentially involving kaolinite and montmorillonite. |
| § | Oxidation: Manganese oxides, hematite, and limonite are plentiful. |
| 7.4.1.4 | Mineralization |
The Reyna Deposit is situated along the northern extension of the active Esperanza Deposit open pit. Exploration has identified gold mineralization within a shear zone trending NW75–85°SE, extending for at least 150 meters. This zone exhibits intense supergene alteration, high concentrations of iron oxides, and hematized points that indicate leached sulfides, primarily sphalerite (ZnS) and pyrite (FeS₂). Moderate amounts of crustiform and chalcedonic quartz represent the most recent SiO₂ event. Gold anomalies range from 0.25 to 25.27 g/t.
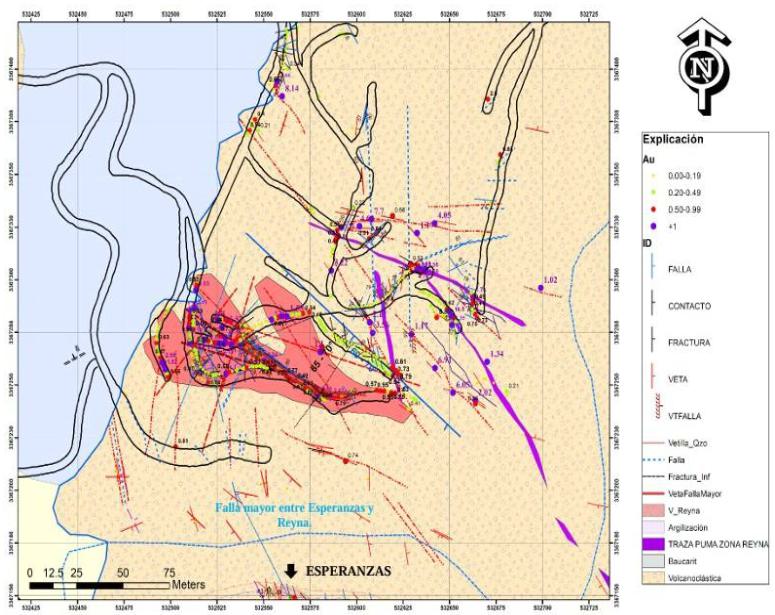
Figure 33 - Reyna Deposit Geological Map. Source: Goldgroup, 2025.
61
NI 43-101 Technical Report – Cerro Prieto Project
| 7.4.2 | Geological Overview of the Cata-Coatí Deposits |
Due to their proximity, the Cata and Coatí exploration Deposits exhibit similar geological characteristics, with minor variations in mineralization, alteration, and structural geology. Figure 35.
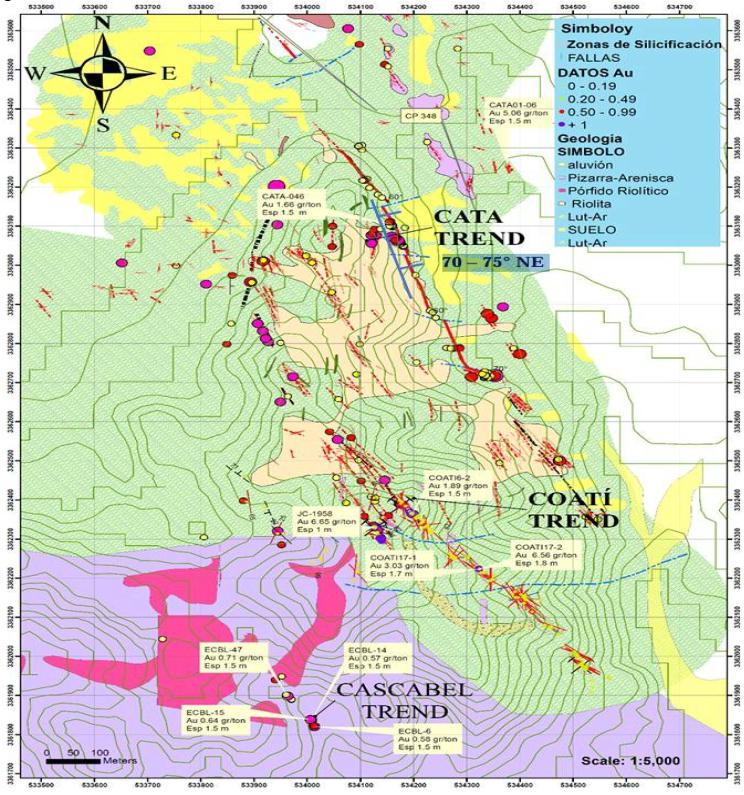
Figure 34 - Cata-Coatí Deposits Geological Map. Source: Goldgroup, 2025.
| 7.4.2.1 | Lithology |
Shale–Sandstone Sequence:
| § | Distribution: Observed in outcrops across the Cata-Coati Deposits. |
| § | Composition includes interbedded red, ochre, and greenish shale in massive to thick layers, featuring thin gray to reddish-gray sandstone beds. |
62
NI 43-101 Technical Report – Cerro Prieto Project
| § | Characteristics: Fissile shale exhibits lamination with silt to medium grain sizes. Red coloration indicates an oxidizing depositional environment. ◦ Hematite and manganese oxides are present along bedding planes. ◦ Localized folding and foliation have been observed. |
| 7.4.2.2 | Limestone |
| § | Occurrence: Mainly in low- to medium-thickness horizons above the shale–sandstone sequence. |
| § | Type: Arenaceous/clastic limestone, gray with karst weathering. |
| § | Composition: Well-cemented calcareous material. |
| § | Alteration: Epigenetic silicification and recrystallization of quartz and calcite, with occasional quartz and calcite veining. |
These lithological units correspond to the Late Jurassic Cucurpe Formation, dating back approximately 145 million years.
| 7.4.2.3 | Sills and Dikes |
| § | Composition: Rhyolitic and andesitic intrusive bodies. |
| § | Rhyolitic sills are more abundant and thicker. |
| § | Host rocks primarily intrude into the shale–sandstone unit along bedding planes. |
| § | Alteration: |
| o | Local dynamic metamorphism. |
| o | Argillic alteration and silicification occur, especially at the interfaces with host rocks. |
| o | Not all sills show metamorphism or alteration. |
| o | Age correlation: Likely equivalent to Late Cretaceous volcanic rocks. |
| 7.4.2.4 | Mineralization |
Gold anomalies at the Coatí Deposit range from 0.2 to 6.65 grams per ton (g/t), while the Cata Zone exhibits anomalies between 0.2 and 18.83 g/t.
| § | Two mineralization stages have been identified, Amorphous Milky Quartz and Quartz Druses. |
| § | Oxidation features include hematite, manganese, fine sulfides, and oxidized pyrite box-works. |
| § | Orientation: NW-trending structures dipping 50°–75° NE. |
| § | Gold Anomalies: |
| o | Coatí: 0.2 to 6.65 g/t Au. |
| o | Cata: 0.2 to 18.83 g/t Au. |
| 7.4.2.5 | Structural Geology |
| § | NW–SE vergence. |
| § | Dips range from 38° to 78°. |
63
NI 43-101 Technical Report – Cerro Prieto Project
| § | The major fault plane corresponds to the Cerro Prieto Fault in the Cata area. |
| § | Deformation features: |
| o | Folding in small and large scales. |
| o | Foliation and occasional schistosity. |
| o | Hematite, goethite, manganese, and minor traces of sulfides are found along bedding planes. |
| 7.4.2.6 | Alterations |
Alteration primarily occurs in mineralized structures, with some localized instances in other regions. Recognized types of hydrothermal alteration:
| § | Silicification is common in mineralized zones. |
| § | Weak carbonatization. |
| § | Weak propylitization |
| § | Oxidation, often associated with mineralization. |
| 7.4.3 | Geological Overview of the Cascabel Deposit |
| 7.4.3.1 | Structural Geometry |
| § | The Cascabel structure is described as a breccia-type vein-fault system. |
| § | It indicates a general strike of N30–45°W, with a dip of 65–70° to the northeast. |
| § | A specific fault plane within the structure trends at N10° W and dips at 75° NE. |
| 7.4.3.2 | Host Lithology |
| § | The mineralized structure is located within shale–sandstone sequences (Js Pz-Ar). See Figure 34. |
| § | The mineralization includes: |
| o | Residual milky quartz is very porous. |
| o | Crystalline quartz occurs in small drusy cavities. |
| o | Manganese dioxide (MnO₂). |
| o | Oxides of hematite, goethite, and limonite. |
| o | Hematized areas. |
| o | Oxidized fine sulfides may form boxwork textures. |
| o | Strong, pervasive silicification modifies the original texture and matrix of the host rocks. |
| o | Brecciation and branching of milky quartz veins exhibit yellowish-green hues due to a moderate presence of chlorite and epidote. |
| 7.4.3.3 | Surface Sampling Results |
| § | Gold (Au): 0.18 to 1.66 g/t. |
| § | Silver (Ag): 0 to 18.13 g/t. |
| § | Lead (Pb): 0.20% to 6.77%. |
| § | Zinc (Zn): 0.12% to 1.82%. |
64
NI 43-101 Technical Report – Cerro Prieto Project
| 7.4.3.4 | Dimensions |
The observable mineralized structure measures from 8 to 10 meters wide and extends from 40 to 50 meters from its outcrop to the boundary between Rancho Padres and Ejido Cucurpe.
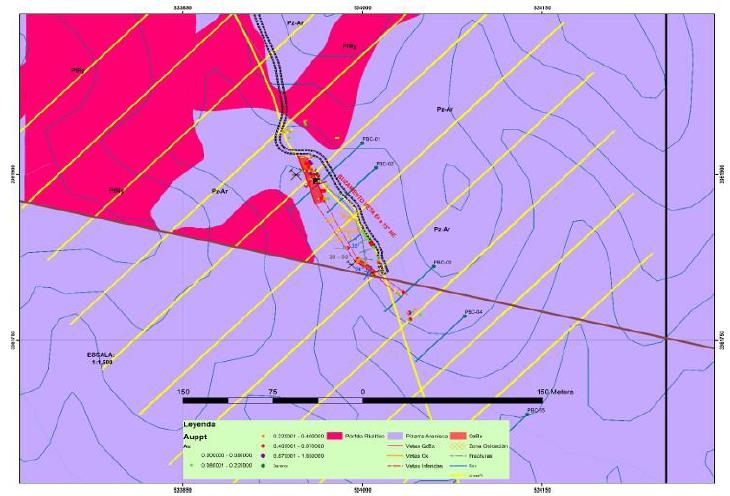
Figure 35 - The Cascabel Deposit Geological Map displays old mining works, preliminary drilling, and gold values above 0.1 g/t Au. Source: Goldgroup, 2025.
65
NI 43-101 Technical Report – Cerro Prieto Project
| 8.0 | DEPOSIT TYPES |
José Antonio Olmedo MSc, P. Eng. Geo, QP, SME Registered Member prepared the information included in this Section of the Technical Report.
| 8.1 | Mineral Deposit |
Mineral deposits at the Cerro Prieto mine site and surrounding areas are classified as low to intermediate sulfidation epithermal systems of silver and gold. These deposits are typical of many local occurrences in northeastern Sonora, including the nearby Santa Elena silver/gold mine (First Majestic Silver Corp.), Cerro Caliche (Sonoro Gold, Corp.), Las Chispas silver/gold mine (Silvercrest Mines), and the Mercedes mine (Equinox Gold Corp.). To the east in Chihuahua, other low-sulfidation epithermal deposits include the Dolores silver/gold mine (Pan American Silver) and the Pinos Altos silver/gold mine (Agnico-Eagle Mines Ltd.). These low-sulfidation epithermal deposits primarily form in brittle and/or porous subaerial felsic volcanic complexes within extensional and strike-slip structural regimes.
Local groundwater dilutes and cools, mixing with upwelling magmatic-derived hydrothermal brines in an extensional setting related to local rifts or detachment faulting associated with evolving metamorphic complex formation. Due to episodic events, mineralization typically deposits as multi-zoned veins, stockwork, and breccia. Deposit formation occurs in near-surface environments, usually between 200 m and 600 m, extending to a one-kilometer depth from the surface, within temperature gradients of 150°C to 300°C.
Minerals containing silver and gold can form deposits under these conditions, depending on the concentration of the metals in the brines and sudden changes in local pressure gradients, pH levels, and fluid flow dynamics. The alteration intensity of the Cerro Prieto deposits varies from weak to strongly pervasive textures, with the structure being most pronounced near larger veins. Silicification is generally extensive near mineralization, followed by sericite-illite-kaolinite assemblages.
The geological setting of the Esperanzas Deposit, described in section 7 of this report, classifies the gold-silver-bearing deposit as a low-sulfidation epithermal type. Figure 38 presents a theoretical model proposed by J. Hedenquist in 1994 for this type of deposit.
66
NI 43-101 Technical Report – Cerro Prieto Project
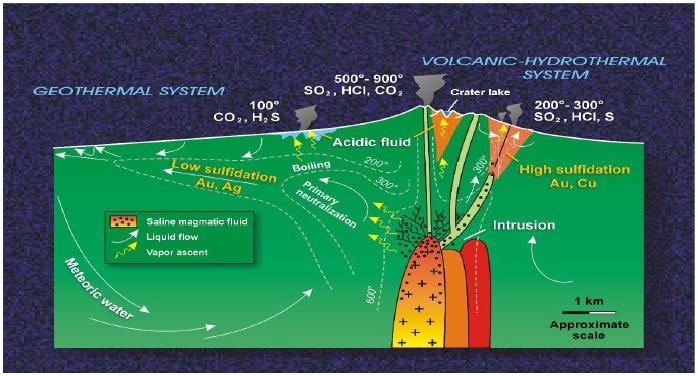
Figure 36 - Low and High Sulfidation Systems. Source: J. Hedenquist, 1994.
Additionally, Jeffrey Hedenquist, Antonio Arribas, and Eliseo González proposed a systematically reconstructed model of low-sulfidation epithermal deposits in 2000. Refer to Figure 38. Based on this theoretical diagram, José Antonio Olmedo MSc, P. Eng. Geo, QP, SME Registered Member (JAO) interviews with Oroco’s technical staff aligned with the exploration conducted at the Esperanza Deposit.
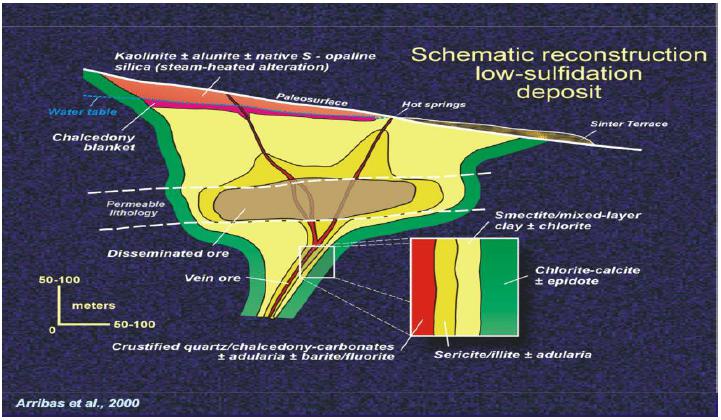
Figure 37 - Schematic Reconstruction Low-Sulfidation Deposit. Source: J. Hedenquist, A. Arribas, E, González, 2000.
67
NI 43-101 Technical Report – Cerro Prieto Project
It’s critical to the economics of the deposit that the boiling zone has a wide or narrow vertical extent, which depends on several inputs, including:
| § | Temperature of the fluids |
| § | Amount of groundwater mixing |
| § | Rate of flow |
| § | Longevity of the system |
José Antonio Olmedo MSc, P. Eng. Geo, QP, SME Registered Member recommends conducting spectrographic and petrographic studies for further exploration campaigns.
68
NI 43-101 Technical Report – Cerro Prieto Project
| 9.0 | EXPLORATION |
José Antonio Olmedo MSc, P. Eng. Geo, QP, SME Registered Member prepared the information included in this Section of the Technical Report.
| 9.1 | Historical Exploration |
Historical exploration of Cerro Prieto Mine gave Oroco the basis to start mining operations upon a measured and indicated resource of 8,200,000 metric tons of 0.81 g/t Au, 17.22 g/t Ag, 0.21% Pb, and 0.54% Zn, published in an NI 43-101 Technical Report 2013. These resources have been fully exploited as of mid-2023. Reports and documents listed in Section 3, Reliance on Other Experts and Section 27.0; References were also used to support preparation of the Report. Additional information was provided by Company personnel where required.
Mining was focused within the Centro, Union, and South Pit zones along a mineralized, structurally controlled shear zone, the “Cerro Prieto Shear.” Refer to Figure 39.
A fourth zone, Puma, offset from the Cerro Prieto shear, was discovered and drilled from 2019 to 2023 and mined from 2020 to 2023.
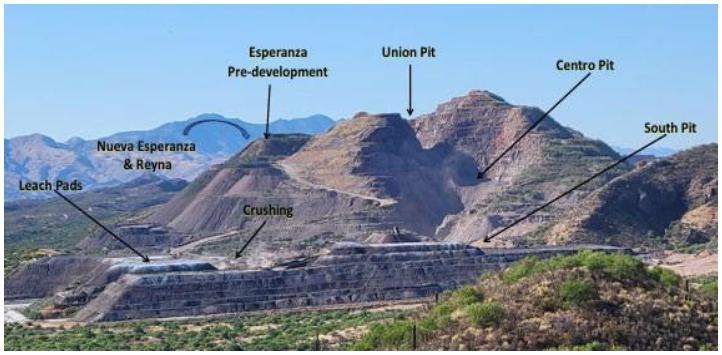
Figure 38 - Cerro Prieto Historical Mining Zones. Source: Oroco, 2025.
| 9.2 | Esperanzas Deposit Exploration Program |
Oroco’s exploration protocols comply with industry standards. They include geological reconnaissance, detailed mapping, and the identification of mineral pathfinders (such as iron oxides, manganese, and silica alterations), surface chip sampling, preliminary geochemical analysis, and geophysical surveys using induced polarization and resistivity methods.
| 9.2.1 | Coordinate System: |
The Esperanzas Deposit uses the NAD27 Mexico coordinate system and the UTM Zone 12N projection as the datum.
69
NI 43-101 Technical Report – Cerro Prieto Project
| 9.2.2 | Surface Sampling |
The exploration program at the Esperanzas Deposit was conducted from March 2023 to September 2023. Oroco took surface samples. Lab results from 1265 surface samples were used in the resource estimation (Section 14).
The following figure depicts the locations of the DDH and shows a gold grade greater than 0.1 g/t.
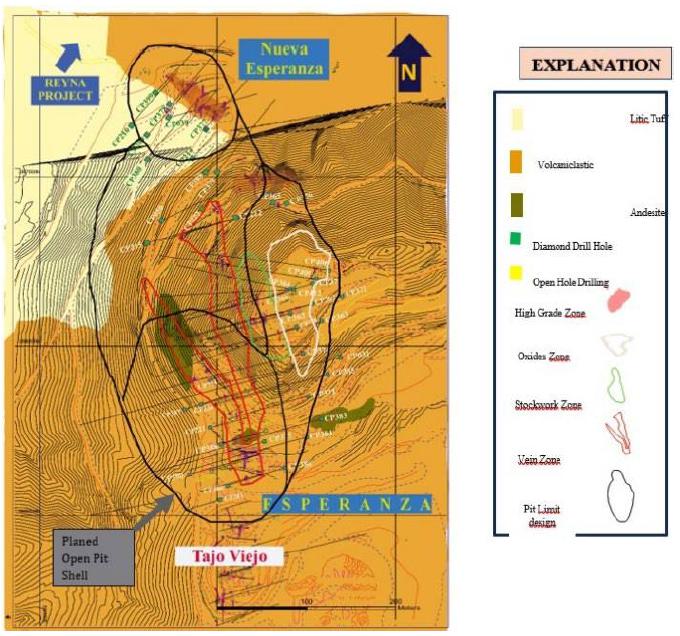
Figure 39 - DDH Location, Mineralization, Planned Open Pit Shell, Structures, Lithology, and Au Grade >0.1 g/t. Source: Oroco, 2025.
70
NI 43-101 Technical Report – Cerro Prieto Project
The following figure illustrates a standard drill section conducted by Oroco’s technical staff:
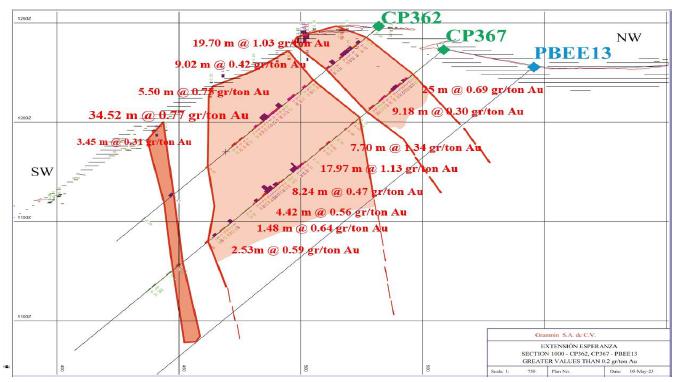
Figure 40 - Esperanzas’ Section 1000 – CP362, CP367, PBEE13, displaying values greater than 2.0 g/t Au. Source: Oroco, 2025.
In Figure 42, José Antonio Olmedo MSc, P. Eng. Geo, QP, SME Registered Member (JAO) provides a Leapfrog 3D section of an underground scene that illustrates the drill holes and trench samples (colored dots) used in the mineral resource estimation (Section 14).
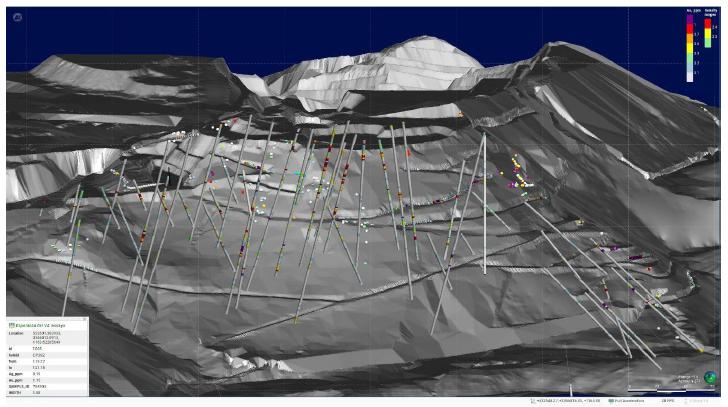
Figure 41 - Esperanzas’ Leapfrog 3D Scene Section showing drill holes and trench samples: Source: JAO, 2025.
71
NI 43-101 Technical Report – Cerro Prieto Project
The Company has developed an internal model of an open pit shell that encompasses the identified mineralization and has decided to advance these two zones into production. Mine ramp preparation and waste stripping were completed in January and February 2024, and production blasting and mining of mineralized material commenced at the end of February 2024. As of April 4, 2025, mining at Esperanzas Deposit continues.
| 9.3 | Exploration Targets |
Mined zones and recently discovered mineralization, depicted in Figure 44 below, are located within or near the Cerro Prieto Shear, a major north-trending, near-vertical shear zone that is up to 65 meters wide. This shear zone contains a series of major veins near its margins, along with secondary veins and zones of stringers, breccias, and silicification, which, together with the veins, form a mineralized system ranging from 15 to 65 meters in thickness. Recent exploration has led to significant mineralization in several new zones along the Cerro Prieto Shear trend, both north and south of the existing mine.
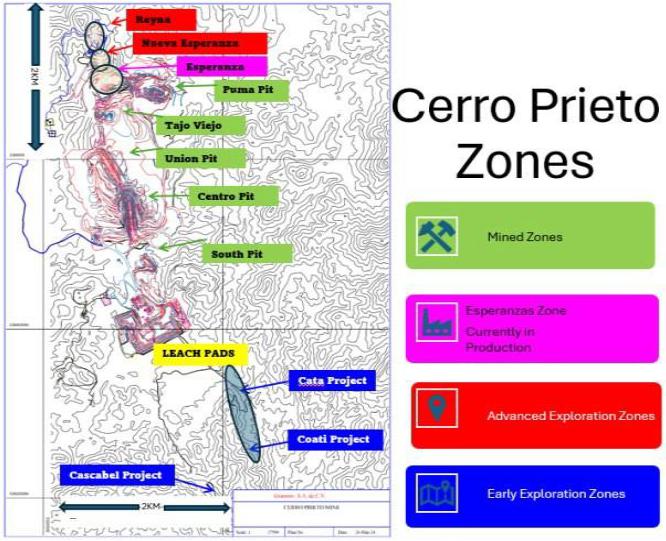
Figure 42 - Cerro Prieto Mineralized Zones. Source: Oroco, 2025.
72
NI 43-101 Technical Report – Cerro Prieto Project
| 9.3.1 | Reyna Deposit Exploration |
Surface trench sampling of the Reyna Zone is situated directly north of the Nueva Esperanza Deposit mentioned above (see Figure 44 for location). Surface trenching has exposed this zone over a length of more than 90 meters, as shown in Figure 45 below, and chip sampling assay results indicate significant gold values, as illustrated in Figure 44 above. Along with Nueva Esperanza, this zone necessitates further drilling to determine whether the contained mineralization meets the minimum tonnage and cut-off grades required for future mining. Nevertheless, considering the geology, initial drilling and trenching results, and their position directly along strike to the north of the Esperanza Zone, management is optimistic that these zones will yield future mine resources.
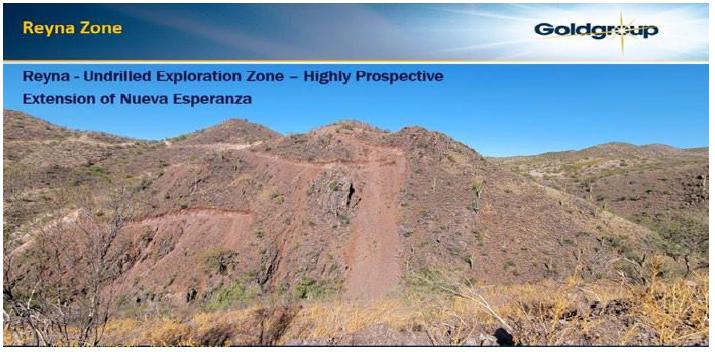
Figure 43 - Reyna Exploration Target. Source: Oroco, 2025
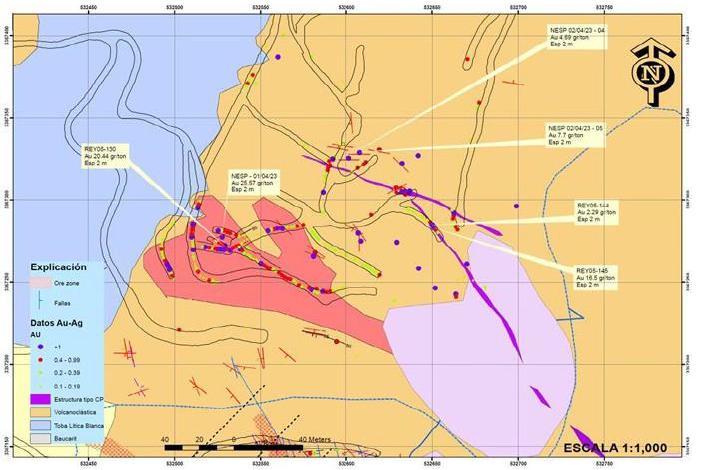
Figure 44 - Reyna Deposit Trench Sampling Results. Source: Oroco, 2025.
73
NI 43-101 Technical Report – Cerro Prieto Project
| 9.3.2 | Cata, Coatí, and Cascabel Deposits Exploration |
Cata, Coati & Cascabel Zones Recent surface exploration, conducted up to 1.7 km south of the mine’s heap leach pads, has identified the potential extension of the Cerro Prieto Shear in the Cata and Coati Deposits, as well as in the Cascabel Deposit, which is a parallel mineralized structure. Chip and grab sample analytical results for these surface samples, assayed at the Cerro Prieto mine lab, are presented in Figure 46 and Table 19 below.
Note that independent laboratory verification has not been conducted on exploration surface samples from these three zones and the Reyna Deposit mentioned above. The reader is cautioned that the Company’s mine lab lacks certification; therefore, results may differ from those obtained at an independent certified lab. The Company plans to send future samples collected during intended trenching and drilling for analysis at an independent certified lab. At that time, a standard industry quality assurance and quality control program will be implemented for these targeted exploration deposits.
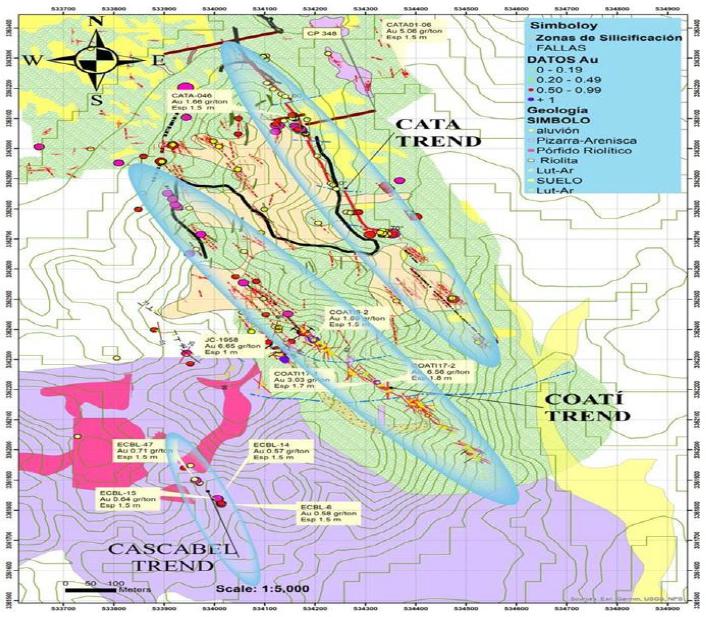
Figure 45 - Cata, Coatí, and Cascabel Deposits Trench Sampling Results. Source: Oroco, 2025.
74
NI 43-101 Technical Report – Cerro Prieto Project
Table 19 - Highlights of recent surface chip sampling at the Cata. Coati and Cascabel Deposits. Source: Oroco, 2025.
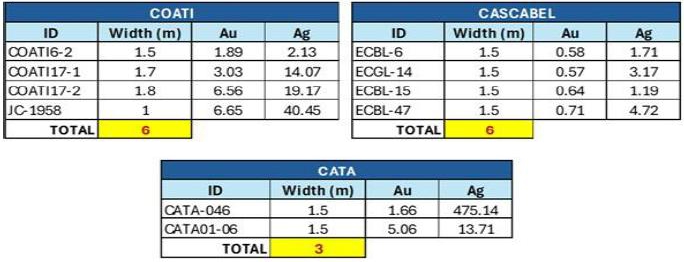
| 9.4 | 2025 Exploration Program |
José Antonio Olmedo MSc, P. Eng. Geo, QP, SME Registered Member had reviewed and endorsed the 2025 Cerro Prieto Project Exploration Program which involves approximately 6,000 meters of diamond core drilling. The exploration test program approximately 6,000 meters of diamond core drilling, an induced polarization geophysical survey, and surface trenching.
The drilling program focuses on the Nuevo Esperanza and Reyna mineralized zones adjacent to the currently producing Esperanza zone, which remains open to the north and west. Additionally, some test drilling will be allocated to the previously mined South Pit, where an opportunity has been identified to potentially reactivate mining in this area at a low cost to extract remaining accessible resources via a small pit pushback. Furthermore, one kilometer south of the mine along the major Cerro Prieto shear zone, several newly discovered mineralized zones will be further examined through surface trenching and possible geophysical surveying during the campaign.
Cerro Prieto encompasses a large 4,300-hectare project area along a prolific shear zone. The project features low-sulfidation epithermal quartz-gold veins that exhibit excellent leach kinetics and larger-scale mineralized stockwork targets.”
75
NI 43-101 Technical Report – Cerro Prieto Project
| 9.5 | 2025 Exploration Budget |
José Antonio Olmedo MSc, P. Eng. Geo, QP, SME Registered Member (JAO) had reviewed and endorsed the 2025 exploration program as a sound strategy to evaluate the mine’s remaining economic potential. The detail of the 2025 exploration budget includes in the following table:
Table 20 - 2025 Exploration Budget
|
Runtime |
Zone |
Geophysics |
Roads, (USD) |
Drillings |
Total |
|
| 15 | Nueva Esperanza | 64,152 | 64,152 | Diamond Drilling | ||
| 48 | Punta de Fecha & Puma Norte | 9,997 | 13,784 | 88,592 | 112,373 | |
| 52 | Reyna | 10,496 | 6,014 | 278,837 | 295,347 | |
| 17 | Sureste Extension Puma | 57,094 | 57,094 | |||
| 30 | Sur Patios | 59,566 | 59,566 | RC Drilling | ||
| 5 | Cata | 8,997 | 6,892 | 22,667 | 38,556 | |
| 35 | Coati | 8,997 | 8,048 | 35,283 | 52,328 | |
| 22 | Cascabel | 5,998 | 6,892 | 22,667 | 35,557 | |
| Other Direct Exploration Costs | 36,172 | 36,172 | ||||
| Total (USD) | 44,485 | 41,630 | 665,030 | 751,145 | ||
76
NI 43-101 Technical Report – Cerro Prieto Project
| 10.0 | DRILLING |
José Antonio Olmedo MSc, P. Eng. Geo, QP, SME Registered Member (JAO) prepared this section of the technical report. Oroco’s drilling campaign ended before the site visit of JAO, so he could not verify drilling performance at the Esperanzas Deposit. The following was taken from Oroco’s drilling protocol.
| 10.1 | Drilling Methodology |
The following was taken from Oroco’s drilling protocol:
Diamond Drilling Methodology, Exploration Geology Department at Cerro Prieto Mine “During this stage, a drilling plan is developed using sectional layouts. The distribution and optimal number of drill holes are planned to provide the necessary information for conducting mineral resource studies of the mine:
| § | The drill holes in the mine are primarily executed in vertical and inclined orientations. |
| § | Section lines are established at 25-meter intervals. |
| § | The Topography Department is responsible for identifying the drill holes and measuring the bearing of each section. |
| § | A Caterpillar D9 tractor prepares the drilling site by constructing access roads, drill pads, and sumps. |
| § | Drill pads consist of a horizontal area measuring 8m x 8m, designed to provide a stable base for installing the drill rig. |
| § | Drill hole trajectories are verified using high-precision measurement systems (e.g., Reflex or ReflexGyro) to determine inclination and azimuth. |
| § | Water storage ponds consist of two modular structures, each with a capacity of 30,000 m³, lined with geomembrane to prevent water infiltration into the ground. These ponds are designed to supply water for drilling operations”. |
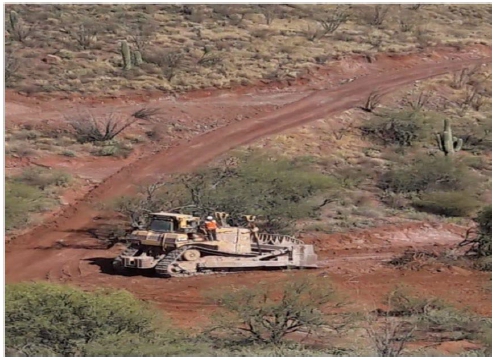
Figure 46 - Caterpillar D-9 Tractor. Source: Oroco, 2025.
77
NI 43-101 Technical Report – Cerro Prieto Project
| 10.2 | Drill Core Logging Methodology |
A daily record is maintained for drilling operations, documenting the specifics of each executed drill hole. The logging information includes the following details:
| § | Drill Hole Identifier: Unique number assigned to each drill hole. |
| § | Coordinates: Precise spatial location of the drill hole. |
| § | Elevation and Azimuth: Altitude and compass bearing of the drill hole. |
| § | Drilling Angle: Inclination of the drill hole from the horizontal plane. |
| § | Drilling Timeline: Start and end dates of drilling activities for each hole. |
| § | Contractor Information: Details of the drilling company responsible for operations. |
| § | Geological Characteristics of Core: Observations and descriptions of geological features encountered. |
| § | Lithology: Identification of types of rock present. |
| § | Mineralogical Composition: Constituent minerals within the rock samples. |
| § | Texture: Description of the rock's surface and structural features. |
| § | Grain Size: Measurement of the size of individual mineral grains. |
| § | Alteration Features: Significant changes in mineralogy or texture caused by hydrothermal or other processes. |
| § | Sample Intervals: Length of each collected sample segment. |
| § | Structural Disruptions: Identification and description of faults and fractures. |
| § | Core Recovery: Percentage of core successfully retrieved during drilling. |
| § | Zones of Low Recovery: Specific intervals where core recovery was insufficient. |
| § | Assay Results: Laboratory analysis outcomes for each sample. |
| 10.3 | Drill Core Recovery |
From Oroco’s drill core recovery:
The diamond core is reconstructed at the drilling site within the core box and then entered continuous runs using plastic markups. Depths are checked against the driller's blocks, and the drillers routinely conduct drill-rod counts.
Drill recovery is calculated by dividing the measured core length by the total length of the drill run.
The RQD was developed to provide a quantitative estimate of rock mass quality. It represents the percentage of intact core pieces longer than 100 mm relative to the total length of the core: RQD = (Length of core pieces > 100 mm) / (Drilled length) × 100. Measurements for core recoveries are logged and recorded at the drilling site. Database software calculates recovery percentages and RQD values. All data is stored in the Company database.
78
NI 43-101 Technical Report – Cerro Prieto Project
The overall core recovery percentage exceeds 71%, with 334 intercepts in the mineralized zones. For the Esperanzas, where the mineralization style is associated with structural shear zones, JAO considers this moderate core recovery average to be normal. To date, no adverse relationship between recovery and grade has been identified.
| 10.4 | Drill Survey |
José Antonio Olmedo MSc, P. Eng. Geo, QP, SME Registered Member (JAO) included 127 survey data values to define a 3D drill core orientation for estimating mineral resources included in this report.
| 10.5. | Drilling Highlights |
The Cumbre and Esperanzas Deposits 2023, exploration drilling highlights of some significant drill hole intersections:
| § | DDH CP362 o 19.70 meters @ 1.03 g/t Gold and, o 5.5 meters @ 0.75 g/t gold o 20.98 meters @ 1.02 g/t gold. |
| § | DDH CP374 o 13.20 meters @ 2.05 g/t Gold and, o 4.50 meters @ 1.16 g/t gold and, o 1.55 meters @4.78 g/t gold. |
| § | DDH CP367 – o 24.96 meters @ 0.69 g/t Gold and, o 7.70 meters @1.35 g/t gold and, o 17.97 meters @ 1.13 g/t Gold and, o 11.80 meters @ 0.61 g/t Gold. |
| § | DDH CP 371 o 4.25 meters @ 1.07 g/t Gold and, o 7.78 meters @ 0.98 g/t Gold and, o 11.67 meters @ 1.16 g/t Gold and, o 9.22 meters @ 0.92 g/t Gold. |
| § | DDH CP384 – o 13.70 meters @ 1.15 g/t gold. |
| § | DDH CP 388 o 13.20 meters @ 1.33 g/t gold. |
| § | DDH CP 389 o 12,20 meters @ 0.77 g/t gold. |
| § | DDH CP 406 o 43.89 meters @ 0.43 g/t gold and, o 9.05 meters @ 0.93 g/t gold. |
The initial diamond drill hole (DDH) program aimed to drill 3,505 meters of HQ diamond drill holes, totaling 4,285.25 meters. The following tables summarize the drilling results from each campaign carried out in 2023.
Table 21 - DDH Program Conducted from March to April 2023
Section |
Location |
Plan DDH |
DDH |
AZ |
Inclination |
Planned Depth (m) |
Drilled
Depth (m) | ||
| North | East | Elevation
(m) | |||||||
| 975 | 3366829.04 | 532717.833 | 1226 | PBEE-01 | CP-363 | 253 | -45 | 185 | 216.55 |
| 1000 | 3366839.54 | 532682.951 | 1247.982 | PBEE-02 | CP-362 | 253 | -45 | 150 | 152.50 |
| 1025 | 3366866.74 | 532687.48 | 1245.897 | PBEE-03 | CP-364 | 280 | -45 | 165 | 195.20 |
| N-S | 3366970.65 | 532654.185 | 1186 | PBEE-04 | CP-365 | 0 | -90 | 130 | 131.15 |
| 3366862.8 | 532674.73 | 1245.89 | PBEE-07 | CP-366 | 253 | -45 | 150 | 183.00 | |
| 1025 | 3366850 | 532707 | 1239 | PBEE-08 | CP-367 | 253 | -45 | 150 | 213.50 |
| Total (m) | 930 | 1,091.90 | |||||||
79
NI 43-101 Technical Report – Cerro Prieto Project
Table 22 - DDH Program Conducted in May 2023
Section |
Location |
Plan DDH |
DDH |
AZ |
Inclination |
Planned Depth (m) |
Drilled Depth (m) | ||
| North | East | Elevation (m) | |||||||
| 975 | 3366822.17 | 532688.87 | 1242.39 | PBEE-12 | CP370 | 253° | -45° | 200 | 239.40 |
| 1000 | 3366860.76 | 532742.66 | 1227.72 | PBEE-13 | CP372 | 253° | -45° | 220 | 274.50 |
| 1025 | 3366873.76 | 532707.12 | 1246.32 | PBEE-14 | CP371 | 253° | -45° | 140 | 208.90 |
| 950 | 3366791.41 | 532695.63 | 1224 | PBEE-16 | CP374 | 253° | -45° | 150 | 247.05 |
| 900 | 3366741.4 | 532701.73 | 1198.73 | PBEE-18 | CP373 | 253° | -45° | 155 | 138.75 |
| 875 | 3366687.69 | 532653.179 | 1176.61 | PBEE-20 | CP375 | 253° | -45° | 170 | 189.10 |
| Total (m) | 865 | 1,297.70 | |||||||
Table 23 - DDH Program Conducted in July 2023
Section |
Location |
Plan DDH |
DDH |
AZ |
Inclination |
Planned Depth (m) |
Drilled Depth (m) | ||
| North | East | Elevation (m) | |||||||
| 800 | 3366618.97 | 532603.18 | 1147.92 | PBEE-26 | CP381 | 253 | -45° | 80 | 59.45 |
| 925 | 3366766.95 | 532723.646 | 1201 | PBEE-28 | CP385 | 253 | -45° | 170 | 155.55 |
| 825 | 3366617.88 | 532539.136 | 1138 | PBEE-29 | CP382 | 253 | -50° | 120 | 125.05 |
| 875 | 3366714.11 | 532716.38 | 1178.8 | PBEE-30 | CP383 | 253 | -45° | 165 | 228.75 |
| 850 | 3366693.15 | 532700.72 | 1172 | PBEE-31 | CP384 | 253 | -45° | 150 | 189.10 |
| 825 | 3366657.11 | 532677.33 | 1165.7 | PBEE-32 | CP386 | 253 | -45 | 125 | 137.50 |
| 925 | 3366725.66 | 532563.2 | 1145 | PBEE-34 | CP387 | 73° | -45 | 100 | 115.20 |
| 875 | 3366683.51 | 532597.49 | 1154 | PBEE-36 | CP388 | 73° | -45 | 70 | 70.15 |
| 850 | 336663.198 | 532616 | 1159 | PBEE-37 | CP389 | 73° | -45 | 50 | 50.30 |
| 850 | 3366649.87 | 532571.47 | 1142 | PBEE-38 | CP390 | 73° | -45 | 80 | 108.25 |
| Total (m) | 1,110 | 1,239.30 | |||||||
Table 24 - DDH Program Conducted in September 2023
Section |
Location |
Plan DDH |
DDH |
AZ |
Inclination |
Planned Depth (m) |
Drilled Depth (m) | ||
| North | East | Elevation (m) | |||||||
| BR1025- F1100 | 3366866.74 | 532687.48 | 1245.89 | PBEC-68 | CP412 | 267° | -45° | 200 | 181.00 |
| BR1025- F1100 | 3366879.01 | 532708.93 | 1245.1 | PBEC-69 | CP405 | 280° | -45° | 200 | 253.15 |
| BR1025- F1100 | 3366889.46 | 532725.54 | 1245 | PBEC-70 | CP406 | 280° | -45° | 200 | 219.20 |
| Total (m) | 600 | 653.35 | |||||||
80
NI 43-101 Technical Report – Cerro Prieto Project
| 11.0 | SAMPLE PREPARATION, ANALYSIS AND SECURITY |
| 11.1 | Introduction |
José Antonio Olmedo MSc, P. Eng. Geo, QP, SME Registered Member (JAO) prepared this section of the Technical Report. This section describes the methodology and analytical assay results for exploration activities conducted by Oroco during its Exploration Program 2023, which serves as the basis for the disclosure of estimated mineral resources detailed in Section 14.
JAO reviewed Oroco's protocols on sample selection, sample preparation, geochemical analysis methods, sampling techniques, drilling methods, logging, bulk density, sample security, and quality assurance and quality control (QA/QC) procedures.
JAO could not validate these protocols in person because drilling and surface sampling were halted before his field visit. The following was taken from Oroco’s technical sampling protocol:
Exploration Drilling Sampling and Exploration Geology Department at Cerro Prieto Mine is described in the following paragraphs:
Each drill hole offers new insights into geological structures; therefore, the drilling campaign is meticulously supervised. All extracted samples are collected and stored appropriately.
| § | Rock cores are collected through diamond drilling. |
| § | The recovered drill core is placed in core boxes to store samples systematically for subsequent examination. |
| § | Core segments to sample are selected based on structural features (faults, veins, etc.), lithological contacts, zones of poor recovery, alteration zones, and observed mineralization during logging. |
| § | Sampling must accurately represent the geological variations of the deposit. |
| § | The core is longitudinally split in half using a diamond saw; one half is retained in the core box for reference. |
| § | The other half is placed in a plastic bag labeled with the corresponding sample ID. |
| § | Collected samples are sent to Oroco’s sample preparation laboratory and analyzed at the mine site’s chemical laboratory. |
| § | Drill intervals and intersections containing anomalous gold values and/or significant mineralized zones identified in the diamond drilling samples are sent to an external laboratory (ALS) for fire assay analysis. |
| 11.2 | Sample Analytical Methods |
This section describes the methodology and analytical assay results for exploration activities conducted by Oroco during its Exploration Program 2023, which serves as the basis for the disclosure of estimated mineral resources detailed in Section 14.
The author reviewed Oroco's protocols on sample selection, sample preparation, geochemical analysis methods, sampling techniques, drilling methods, logging, bulk density, sample security, and quality assurance and quality control (QA/QC) procedures.
81
NI 43-101 Technical Report – Cerro Prieto Project
The author could not validate these protocols in person because drilling and surface sampling were halted before his field visit. The following was taken from Oroco’s technical sampling protocol:
Exploration Drilling Sampling and Exploration Geology Department at Cerro Prieto Mine:
Each drill hole offers new insights into geological structures; therefore, the drilling campaign is meticulously supervised. All extracted samples are collected and stored appropriately.
| § | Rock cores are collected through diamond drilling. |
| § | The recovered drill core is placed in core boxes to store samples systematically for subsequent examination. |
| § | Core segments to sample are selected based on structural features (faults, veins, etc.), lithological contacts, zones of poor recovery, alteration zones, and observed mineralization during logging. |
| § | Sampling must accurately represent the geological variations of the deposit. |
| § | The core is longitudinally split in half using a diamond saw; one half is retained in the core box for reference. |
| § | The other half is placed in a plastic bag labeled with the corresponding sample ID. |
| § | Collected samples are sent to Oroco’s sample preparation laboratory and analyzed at the mine site’s chemical laboratory. |
| § | Drill intervals and intersections containing anomalous gold values and/or significant mineralized zones identified in the diamond drilling samples are sent to an external laboratory (ALS) for fire assay analysis. |
Cautionary Statement:
Readers are advised that the Cerro Prieto mine geochemistry laboratory is not certified. According to the CIM Mineral Exploration Best Practice Exploration Guidelines, 2018, “Analysis and testing of samples should be completed by a reputable and preferably ISO-accredited laboratory qualified for the particular element or material to be analyzed or tested.” All analytical laboratories involved in preparing the report should be independent and accredited to ensure the reliability and credibility of the data. Users of the report must be aware of the potential risks associated with relying on data from non-certified laboratories.
Once described and tagged, samples are sealed at the sampling site and taken to Oroco’s sample warehouse for review and final inventory. Preparation and analytical methods were performed at the Cerro Prieto laboratory as follows:
| 11.2.1 | Sample Preparation |
The Cerro Prieto lab preparation method is as follows: the sample is crushed and pulverized before quartering to ensure maximum release and representativeness of gold particles. It is crushed to 70% finer than 2 mm, riffle-split to 250 g, and pulverized to better than 85% passing through 200 mesh. The preparation method of the Cerro Prieto lab is similar to the ALS preparation code Prep-31.
82
NI 43-101 Technical Report – Cerro Prieto Project
| 11.2.2 | Analytical Method |
At Cerro Prieto lab, gold assays consisted of a conventional fire assay of a 30-gram split of pulverized material, finished by AA spectrometry.
| 11.3 | Quality Assurance and Quality Control (QA/QC) |
The author has reviewed Oroco's QA/QC surface sampling description and core logging, which have been deemed adequate for sustaining audits from any international code examination.
Cautionary Statement:
Readers are advised that Oroco has not yet implemented an industry-standard Quality Assurance/Quality Control (QA/QC) system to test its Cerro Prieto geochemistry lab (CoP), utilizing control samples to monitor the accuracy and precision of analytical results. “According to the CIM Mineral Exploration Best Practice Exploration Guidelines, 2018, Throughout the process of mineral exploration, the geoscientist should ensure that a quality assurance (QA) program is in place and that required quality control (QC) measures are implemented to confirm and document the accuracy and precision of results received from an analytical facility.” Users of the report must be aware of the potential risks associated with relying on data from non-QA/QC procedures applied in Oroco’s Cerro Prieto geochemistry lab.
José Antonio Olmedo MSc, P. Eng. Geo, QP, SME Registered Member (JAO) recommends adhering to this QA/QC procedure by submitting control samples for all database analytical results to ensure reliable information for investors and stakeholders.
| 11.3.1 | Cerro Prieto Lab Analytical Check |
Oroco reviewed its analytical results, sending 268 representative drill core pulp samples (5% of Oroco’s database) and 41 pulp sample standards and blanks to ALS Chemex, a certified independent laboratory in Hermosillo, Sonora, Mexico.
ALS Geochemistry laboratories are accredited under ISO/IEC 17025:2017, ensuring compliance with international standards for testing and calibration laboratories. Several national bodies, including the Standards Council of Canada (SCC), recognize this accreditation.
ALS Preparation Methods: LOG-24 (Pulp Registration) and WEI-21 (Weight of Received Sample) were conducted at ALS Hermosillo, located at Ignacio Salazar 688, Local 5, Fraccionamiento Los Viñedos, Hermosillo, Sonora.
ALS Analytical Methods: Au-AA23 (Au 30g Fire Assay-Atomic Absorption Finish) and ME-ICP41 (36 Elements Aqua Regia) were carried out at ALS Vancouver, located at 2103 Dollarton Hwy, North Vancouver, BC, Canada.
Some samples were assayed for 32 elements using Code MEICP41. This method analyzes 32 elements, including silver, through inductively coupled plasma.
A list of analytical results from both laboratories is provided in Tables 24 to 61 below.
At gold grades, different results from both labs were calculated. JAO examined sample gold results from Oroco’s database and ALS lab certificates for all samples listed above.
83
NI 43-101 Technical Report – Cerro Prieto Project
Table 25 -DDH: CP384, Coordinates: 3366693.15 N, 532700.72 E, Elevation: 1,179.15 m
| Sample ID |
Weight Received (kg) |
Assays
by: (ALS) Au (ppm) |
Assays
by: (CoP) Au (ppm) |
Difference |
| 770466 | 0.09 | 1.84 | 1.74 | 0.10 |
| 770467 | 0.10 | 0.38 | 0.49 | -0.11 |
| 770468 | 0.10 | 3.13 | 2.56 | 0.57 |
| 770469 | 0.07 | 0.73 | 0.94 | -0.21 |
| 770470 | 0.09 | 0.82 | 0.79 | 0.03 |
| 770470-1 | 0.06 | 0.06 | 0.00 | 0.06 |
| 770471 | 0.08 | 0.71 | 0.69 | 0.02 |
| 770472 | 0.09 | 0.32 | 0.31 | 0.01 |
| 770473 | 0.09 | 0.71 | 0.79 | -0.08 |
| 770474 | 0.10 | 0.19 | 0.13 | 0.06 |
Table 26 - DDH: CP386, Coordinates: 3366657.113 N, 532677.33 E, Elevation: 1,165.7 m
| Sample ID |
Weight Received (kg) |
Assays
by: (ALS) Au (ppm) |
Assays
by: (CoP) Au (ppm) |
Difference |
| 777738 | 0.05 | 1.135 | 0.99 | 0.15 |
| 777739 | 0.08 | 1.035 | 1.18 | -0.15 |
| 777740 | 0.05 | 0.036 | 0.00 | 0.04 |
| 777741 | 0.08 | 1.40 | 1.14 | 0.26 |
| 777742 | 0.07 | 0.478 | 0.49 | -0.01 |
| 777742-1 | 0.04 | 5.93 | 5.83 | 0.10 |
| 777743 | 0.11 | 0.891 | 0.78 | 0.11 |
| 777744 | 0.09 | 0.492 | 0.52 | -0.03 |
| 777745 | 0.09 | 0.219 | 0.22 | 0.00 |
Table 27 - DDH: CP390, Coordinates: 3366649.87 N, 532571.47 E, Elevation: 1,144.9 m
| Sample ID |
Weight Received (kg) |
Assays
by: (ALS) Au (ppm) |
Assays
by: (CoP) Au (ppm) |
Difference |
| 777754 | 0.10 | 0.731 | 0.66 | 0.07 |
| 777754-1 | 0.09 | 0.009 | 0.00 | 0.01 |
| 777755 | 0.13 | 0.186 | 0.14 | 0.05 |
Table 28 - DDH: CP209, Coordinates: 3367049.026 N, 532521.57 E, Elevation: 1,091 m
| Sample ID |
Weight Received (kg) |
Assays
by: (ALS) Au (ppm) |
Assays
by: (CoP) Au (ppm) |
Difference |
| 771020 | 0.14 | 3.050 | 2.74 | 0.31 |
| 771021 | 0.16 | 1.900 | 1.90 | 0.00 |
| 771022 | 0.16 | 1.095 | 1.09 | 0.00 |
| 771024 | 0.16 | 3.100 | 3.03 | 0.07 |
| 771025 | 0.15 | 0.073 | 0.00 | 0.07 |
| 771025-1 | 0.04 | 5.710 | 5.82 | -0.11 |
| 771026 | 0.16 | 0.030 | 0.00 | 0.03 |
| 771027 | 0.15 | 2.380 | 1.91 | 0.47 |
| 771028 | 0.14 | 2.850 | 2.69 | 0.16 |
84
NI 43-101 Technical Report – Cerro Prieto Project
Table 29 - DDH: CP210, Coordinates: 3367059.165 N, 532500.963 E, Elevation: 1,078.3 m
| Sample ID |
Weight Received (kg) |
Assays
by: (ALS) Au (ppm) |
Assays
by: (CoP) Au (ppm) |
Difference |
| 771136 | 0.14 | 0.173 | 0.23 | -0.06 |
| 771137 | 0.12 | 0.166 | 0.24 | -0.07 |
| 771138 | 0.17 | 0.022 | 0.17 | -0.15 |
| 771138- | 0.03 | 0.915 | 0.93 | -0.02 |
| 771139 | 0.11 | 0.044 | 0.03 | 0.01 |
Table 30 - DDH: CP211, Coordinates: 3366830.49 N, 532544.069 E; Elevation: 1,158 m
| Sample ID |
Weight Received (kg) |
Assays
by: (ALS) Au (ppm) |
Assays
by: (CoP) Au (ppm) |
Difference |
| 771245 | 0.15 | 0.424 | 0.45 | -0.03 |
| 771246 | 0.16 | 0.521 | 0.42 | 0.10 |
| 771248 | 0.14 | 0.604 | 0.56 | 0.04 |
| 771248-1 | 0.04 | 5.710 | 5.82 | -0.11 |
| 771249 | 0.07 | 0.099 | 0.10 | 0.00 |
| 771250 | 0.08 | 0.153 | 0.15 | 0.00 |
Table 31 - DDH: CP212, Coordinates: 3366951.691 N, 532621.792 E, Elevation: 1,173 m
| Sample ID |
Weight Received (kg) |
Assays
by: (ALS) Au (ppm) |
Assays
by: (CoP) Au (ppm) |
Difference |
| 771353 | 0.09 | 1.245 | 1.15 | 0.10 |
| 771354 | 0.09 | 0.330 | 0.29 | 0.04 |
| 771355 | 0.09 | 0.047 | 0.21 | -0.16 |
| 771356 | 0.09 | 0.024 | 0.00 | 0.02 |
| 771356-1 | 0.08 | 0.014 | 0.00 | 0.01 |
| 771357 | 0.09 | 0.240 | 0.35 | -0.11 |
| 771358 | 0.09 | 0.165 | 0.18 | -0.02 |
| 771359 | 0.10 | 1.050 | 0.90 | 0.15 |
| 771360 | 0.09 | 0.286 | 0.28 | 0.01 |
Table 32 - DDH: CP214, Coordinates: 3367020.246 N, 532571.02 E, Elevation: 1,118.8 m
| Sample ID |
Weight Received (kg) |
Assays
by: (ALS) Au (ppm) |
Assays
by: (CoP) Au (ppm) |
Difference |
| 771394 | 0.16 | 0.245 | 0.33 | -0.09 |
| 771395 | 0.17 | 0.042 | 0.06 | -0.02 |
| 771395-1 | 0.04 | 0.213 | 0.21 | 0.00 |
| 771396 | 0.14 | 0.080 | 0.08 | 0.00 |
Table 33 - DDH: CP215, Coordinates: 3366921.672 N, 532520.72 E, Elevation: 1,128 m.
| Sample ID |
Weight Received (kg) |
Assays
by: (ALS) Au (ppm) |
Assays
by: (CoP) Au (ppm) |
Difference |
| 771443 | 0.15 | 0.097 | 0.17 | -0.07 |
| 771444 | 0.11 | 0.124 | 0.22 | -0.10 |
| 771445 | 0.14 | 0.184 | 0.18 | 0.00 |
| 771446 | 0.04 | 0.214 | 0.26 | -0.05 |
| 771447 | 0.12 | 0.138 | 0.16 | -0.02 |
85
NI 43-101 Technical Report – Cerro Prieto Project
| Sample ID |
Weight Received (kg) |
Assays
by: (ALS) Au (ppm) |
Assays
by: (CoP) Au (ppm) |
Difference |
| 771447-1 | 0.04 | 1.785 | 1.31 | 0.48 |
| 771448 | 0.13 | 0.138 | 0.11 | 0.03 |
| 771449 | 0.17 | 0.037 | 0.11 | -0.07 |
Table 34 - DDH: CP220, Coordinates: 366730.907 N, 532581.525 E, Elevation: 1,156.03 m
| Sample ID |
Weight Received (kg) |
Assays
by: (ALS) Au (ppm) |
Assays
by: (CoP) Au (ppm) |
Difference |
| 771787 | 0.13 | 0.335 | 0.42 | -0.09 |
| 771788 | 0.10 | 0.093 | 0.27 | -0.18 |
| 771789 | 0.13 | 0.082 | 0.14 | -0.06 |
| 771790 | 0.07 | 4.340 | 4.38 | -0.04 |
| 771790-1 | 0.06 | 0.020 | 0.00 | 0.02 |
| 771791 | 0.09 | 0.952 | 1.01 | -0.06 |
| 771792 | 0.13 | 0.349 | 0.35 | 0.00 |
| 771793 | 0.09 | 0.704 | 0.78 | -0.08 |
Table 35 - DDH: CP221, Coordinates: 366704 N, 532591 E, Elevation: 1,150 m
| Sample ID |
Weight Received (kg) |
Assays
by: (ALS) Au (ppm) |
Assays
by: (CoP) Au (ppm) |
Difference |
| 771818 | 0.11 | 0.299 | 0.32 | -0.02 |
| 771819 | 0.12 | 0.749 | 0.80 | -0.05 |
| 771820 | 0.10 | 0.630 | 0.24 | 0.39 |
| 771820-1 | 0.06 | 0.019 | 0.00 | 0.02 |
| 771821 | 0.13 | 0.996 | 1.02 | -0.02 |
| 771822 | 0.12 | 0.222 | 0.67 | -0.45 |
| 771823 | 0.14 | 0.164 | 0.23 | -0.07 |
| 771824 | 0.12 | 0.090 | 0.12 | -0.03 |
| 771825 | 0.10 | 0.427 | 0.42 | 0.01 |
Table 36 - DDH: CP222, Coordinates: 3366959.05 N., 532580.5 E., Elevation: 1,154m
| Sample ID |
Weight Received (kg) |
Assays
by: (ALS) Au (ppm) |
Assays
by: (CoP) Au (ppm) |
Difference |
| 771853 | 0.11 | 0.054 | 0.10 | -0.05 |
| 771854 | 0.13 | 0.208 | 0.24 | -0.03 |
| 771854-1 | 0.04 | 5.710 | 5.82 | -0.11 |
| 771855 | 0.12 | 0.115 | 0.27 | -0.16 |
Table 37 - DDH: CP223, Coordinates: 3366740.383 N., 532612.79 E., Elevation: 1,170m
| Sample ID |
Weight Received (kg) |
Assays
by: (ALS) Au (ppm) |
Assays
by: (CoP) Au (ppm) |
Difference |
| 771881 | 0.14 | 0.091 | 0.12 | -0.03 |
| 771882 | 0.11 | 0.071 | 0.12 | -0.05 |
| 771882-1 | 0.04 | 0.908 | 0.93 | -0.02 |
| 771883 | 0.14 | 0.036 | 0.11 | -0.07 |
86
NI 43-101 Technical Report – Cerro Prieto Project
Table 38 - DDH: CP224, Coordinates: 3366759.432 N., 532589.122 E., Elevation: 1170.7m
| Sample ID |
Weight Received (kg) |
Assays
by: (ALS) Au (ppm) |
Assays
by: (CoP) Au (ppm) |
Difference |
| 771914 | 0.11 | 0.038 | 0.26 | -0.22 |
| 771915 | 0.12 | 0.226 | 0.10 | 0.13 |
| 771916 | 0.14 | 0.077 | 1.97 | -1.89 |
| 771917 | 0.14 | 2.100 | 0.81 | 1.29 |
| 771917-1 | 0.07 | 0.023 | 0.00 | 0.02 |
| 771918 | 0.17 | 0.728 | 0.19 | 0.54 |
Table 39 - DDH: CP225, Coordinates: 3366636 N., 532611 E., Elevation: 1,148m
| Sample ID |
Weight Received (kg) |
Assays
by: (ALS) Au (ppm) |
Assays
by: (CoP) Au (ppm) |
Difference |
| 771962 | 0.09 | 0.115 | 0.26 | -0.15 |
| 771963 | 0.10 | 0.178 | 0.15 | 0.03 |
| 771964 | 0.08 | 0.054 | 0.12 | -0.07 |
| 771964-1 | 0.04 | 5.690 | 5.83 | -0.14 |
| 771965 | 0.11 | 0.150 | 0.27 | -0.12 |
| 771966 | 0.09 | 1.140 | 0.98 | 0.16 |
| 771968 | 0.10 | 0.195 | 0.23 | -0.04 |
Table 40 - DDH: CP362, Coordinates: 3366839.536 N, 532682.951 E, Elevation: 1,247.982 m
| Sample ID |
Weight Received (kg) |
Assays
by: (ALS) Au (ppm) |
Assays
by: (CoP) Au (ppm) |
Difference |
| 784767 | 0.10 | 0.228 | 0.27 | -0.04 |
| 784768 | 0.07 | 2.290 | 2.27 | 0.02 |
| 784769 | 0.07 | 0.738 | 0.77 | -0.03 |
| 784770 | 0.09 | 0.945 | 0.86 | 0.09 |
| 784771 | 0.08 | 0.771 | 0.81 | -0.04 |
| 784772 | 0.05 | 2.650 | 2.55 | 0.10 |
| 784773 | 0.07 | 2.710 | 2.53 | 0.18 |
| 784774 | 0.07 | 0.520 | 0.55 | -0.03 |
| 784775 | 0.06 | 0.415 | 0.41 | 0.01 |
| 784776 | 0.06 | 0.725 | 0.65 | 0.08 |
| 784777 | 0.07 | 0.950 | 0.88 | 0.07 |
| 784777-1 | 0.07 | 0.019 | 0.00 | 0.02 |
| 784778 | 0.06 | 0.432 | 0.40 | 0.03 |
| 784779 | 0.06 | 0.334 | 0.34 | -0.01 |
| 784780 | 0.06 | 0.183 | 0.16 | 0.02 |
| 784781 | 0.06 | 0.374 | 0.33 | 0.04 |
| 784782 | 0.06 | 0.652 | 0.60 | 0.05 |
| 784783 | 0.06 | 0.485 | 0.45 | 0.04 |
| 784784 | 0.07 | 0.746 | 0.72 | 0.03 |
| 784785 | 0.08 | 0.350 | 0.27 | 0.08 |
| 784786 | 0.10 | 0.145 | 0.16 | -0.02 |
87
NI 43-101 Technical Report – Cerro Prieto Project
Table 41 - DDH: CP363, Coordinates: 3366829.044 N, 532717.833 E, Elevation: 1,226 m
| Sample ID |
Weight Received (kg) |
Assays
by: (ALS) Au (ppm) |
Assays
by: (CoP) Au (ppm) |
Difference |
| 784937 | 0.09 | 2.120 | 2.06 | 0.06 |
| 784938 | 0.07 | 0.036 | 0.03 | 0.01 |
| 784939 | 0.04 | 0.008 | 0.02 | -0.01 |
| 784940 | 0.09 | 0.008 | 0.02 | -0.01 |
| 784941 | 0.10 | 0.256 | 0.27 | -0.01 |
| 784941-1 | 0.04 | 0.914 | 0.93 | -0.02 |
| 784942 | 0.16 | 0.324 | 0.36 | -0.04 |
| 784943 | 0.18 | 0.191 | 0.19 | 0.00 |
| 784944 | 0.15 | 0.265 | 0.26 | 0.01 |
Table 42 - DDH: CP364, Coordinates: 3366866.743 N, 532687.48 E, Elevation: 1,245.897 m.
| Sample ID |
Weight Received (kg) |
Assays
by: (ALS) Au (ppm) |
Assays
by: (CoP) Au (ppm) |
Difference |
| 786070 | 0.10 | 0.181 | 0.19 | -0.01 |
| 786071 | 0.08 | 1.060 | 0.98 | 0.08 |
| 786072 | 0.11 | 1.275 | 1.24 | 0.03 |
| 786072-1 | 0.05 | 0.213 | 0.22 | -0.01 |
| 786073 | 0.16 | 0.488 | 0.43 | 0.06 |
| 786074 | 0.09 | 0.395 | 0.39 | 0.01 |
| 786075 | 0.15 | 2.230 | 1.97 | 0.26 |
| 786076 | 0.07 | 0.268 | 0.26 | 0.01 |
Table 43 -DDH: CP365, Coordinates: 3366969 N., 532663 E., Elevation: 1,187 m
| Sample ID |
Weight Received (kg) |
Assays
by: (ALS) Au (ppm) |
Assays
by: (CoP) Au (ppm) |
Difference |
| 786175 | 0.10 | 0.014 | 0.35 | -0.34 |
Table 44 - DDH: CP366, Coordinates: 3366862.8 N., 532674.73 E., Elevation: 1,246 m
| Sample ID |
Weight Received (kg) |
Assays
by: (ALS) Au (ppm) |
Assays
by: (CoP) Au (ppm) |
Difference |
| 786274 | 0.11 | 0.572 | 0.57 | |
| 786275 | 0.06 | <0.005 | 0.60 | |
| 786276 | 0.10 | 0.272 | 0.26 | 0.01 |
| 786277 | 0.12 | 0.203 | 0.35 | -0.15 |
| 786278 | 0.11 | 0.706 | 0.69 | 0.02 |
| 786279 | 0.13 | 0.837 | 0.80 | 0.04 |
| 786279-1 | 0.06 | 0.019 | 0.00 | 0.02 |
| 786280 | 0.09 | 1.220 | 1.27 | -0.05 |
| 786281 | 0.08 | 0.515 | 0.38 | 0.14 |
| 786282 | 0.07 | 0.866 | 0.84 | 0.03 |
| 786283 | 0.11 | 0.465 | 0.45 | 0.02 |
| 786284 | 0.10 | 0.491 | 0.49 | 0.00 |
| 786285 | 0.09 | 0.212 | 0.20 | 0.01 |
88
NI 43-101 Technical Report – Cerro Prieto Project
Table 45 -Table 11.21 DDH: CP367, Coordinates: 3366850 N., 532707 E., Elevation: 1,236.2m
| Sample ID |
Weight Received (kg) |
Assays
by: (ALS) Au (ppm) |
Assays
by: (CoP) Au (ppm) |
Difference |
| 786413 | 0.08 | 0.454 | 0.44 | 0.01 |
| 786414 | 0.08 | 0.618 | 0.72 | -0.10 |
| 786415 | 0.06 | 1.405 | 1.50 | -0.10 |
| 786416 | 0.10 | 0.401 | 0.45 | -0.05 |
| 786417 | 0.10 | 2.100 | 1.91 | 0.19 |
| 786417-1 | 0.07 | 0.021 | 0.00 | 0.02 |
| 786418 | 0.07 | 3.860 | 3.90 | -0.04 |
| 786419 | 0.07 | 1.590 | 1.48 | 0.11 |
| 786420 | 0.07 | 0.687 | 0.78 | -0.09 |
| 786421 | 0.07 | 0.374 | 0.44 | -0.07 |
| 786422 | 0.06 | 0.431 | 0.53 | -0.10 |
| 786423 | 0.08 | 1.140 | 1.30 | -0.16 |
| 786424 | 0.10 | 0.335 | 0.45 | -0.12 |
Table 46 - DDH: CP370, Coordinates: 3366822.166 N., 532688.87 E., Elevation: 1,242.39m
| Sample ID |
Weight Received (kg) |
Assays
by: (ALS) Au (ppm) |
Assays
by: (CoP) Au (ppm) |
Difference |
| 786716 | 0.11 | 0.426 | 0.39 | 0.04 |
| 786717 | 0.10 | 0.287 | 0.28 | 0.01 |
| 786718 | 0.10 | 1.670 | 1.58 | 0.09 |
| 786718-1 | 0.08 | 0.011 | 0 | 0.01 |
| 786719 | 0.11 | 1.525 | 1.52 | 0.00 |
| 786720 | 0.07 | 1.715 | 0.20 | 1.52 |
| 786722 | 0.09 | 0.188 | 0.34 | -0.15 |
| 786723 | 0.10 | 0.385 | 0.34 | 0.05 |
Table 47 - DDH: CP371, Coordinates: 3366873.763 N, 532707.12 E, Elevation: 1,246.3 m
| Sample ID |
Weight Received (kg) |
Assays
by: (ALS) Au (ppm) |
Assays
by: (CoP) Au (ppm) |
Difference |
| 786909 | 0.16 | 0.430 | 0.59 | -0.16 |
| 786910 | 0.16 | 1.140 | 1.01 | 0.13 |
| 786911 | 0.14 | 2.920 | 2.26 | 0.66 |
| 786912 | 0.17 | 0.848 | 0.89 | -0.04 |
| 786913 | 0.16 | 1.875 | 1.05 | 0.83 |
| 786914 | 0.1 | 0.500 | 0.46 | 0.04 |
| 786914-1 | 0.05 | 0.212 | 0.21 | 0.00 |
| 786915 | 0.09 | 0.105 | 0.12 | -0.02 |
| 786916 | 0.12 | 0.074 | 0.09 | -0.02 |
| 786917 | 0.14 | 0.419 | 0.53 | -0.11 |
| 786919 | 0.12 | 2.990 | 3.05 | -0.06 |
| 786920 | 0.13 | 0.201 | 0.21 | -0.01 |
| 786921 | 0.10 | 0.237 | 0.43 | -0.19 |
| 786922 | 0.15 | 1.495 | 1.59 | -0.10 |
| 786923 | 0.13 | 4.220 | 0.59 | 3.63 |
89
NI 43-101 Technical Report – Cerro Prieto Project
| Sample ID |
Weight Received (kg) |
Assays
by: (ALS) Au (ppm) |
Assays
by: (CoP) Au (ppm) |
Difference |
| 786924 | 0.11 | 0.969 | 0.95 | 0.02 |
Table 48 - DDH: CP372, Coordinates: 3366860.76 N, 532742.66 E, Elevation: 1,227.72 m
| Sample ID |
Weight Received (kg) |
Assays
by: (ALS) Au (ppm) |
Assays
by: (CoP) Au (ppm) |
Difference |
| 787155 | 0.17 | 0.032 | 0.62 | -0.59 |
| 787156 | 0.15 | 0.018 | 0.67 | -0.65 |
| 787157 | 0.13 | 0.006 | 0.14 | -0.13 |
| 787157-1 | 0.04 | 0.900 | 0.93 | -0.03 |
| 787158 | 0.04 | 5.860 | 0.25 | 5.61 |
| 787159 | 0.15 | 0.069 | 0.32 | -0.25 |
Table 49 - DDH: CP373, Coordinates: 3366860.76 N, 532742.66 E, Elevation: 1,227.72 m
| Sample ID |
Weight Received (kg) |
Assays
by: (ALS) Au (ppm) |
Assays
by: (CoP) Au (ppm) |
Difference |
| 787217 | 0.09 | 1.315 | 1.35 | -0.04 |
| 787218 | 0.05 | 0.487 | 0.52 | -0.03 |
| 787218-1 | 0.04 | 0.216 | 0.21 | 0.01 |
| 787219 | 0.07 | 0.146 | 0.18 | -0.03 |
Table 50 - DDH: CP374; Coordinates: 3366791.41 N, 532695.63 E; Elevation: 1,224 m
| Sample ID |
Weight Received (kg) |
Assays
by: (ALS) Au (ppm) |
Assays
by: (CoP) Au (ppm) |
Difference |
| 787365 | 0.12 | 3.740 | 3.01 | 0.73 |
| 787366 | 0.13 | 1.660 | 1.60 | 0.06 |
| 787367 | 0.12 | 0.259 | 0.28 | -0.02 |
| 787367-1 | 0.08 | 0.019 | 0.00 | 0.02 |
| 787368 | 0.12 | 6.940 | 7.43 | -0.49 |
| 787369 | 0.14 | 0.388 | 0.49 | -0.10 |
| 787370 | 0.13 | 0.896 | 0.96 | -0.06 |
| 787371 | 0.10 | 0.246 | 0.28 | -0.03 |
Table 51 - DDH: CP375, Coordinates: 3366687.685 N., 532653.179 E., Elevation: 1,180.61m
| Sample ID |
Weight Received (kg) |
Assays
by: (ALS) Au (ppm) |
Assays
by: (CoP) Au (ppm) |
Difference |
| 787449 | 0.06 | 0.645 | 0.60 | 0.05 |
| 787450 | 0.06 | 0.374 | 0.32 | 0.05 |
| 787452 | 0.06 | 1.785 | 1.71 | 0.08 |
| 787453 | 0.14 | 0.171 | 0.14 | 0.03 |
| 787454 | 0.06 | 0.702 | 0.57 | 0.13 |
| 787455 | 0.08 | 0.870 | 0.61 | 0.26 |
| 787455-1 | 0.04 | 0.211 | 0.21 | 0.00 |
| 787456 | 0.04 | 1.575 | 1.57 | 0.00 |
90
NI 43-101 Technical Report – Cerro Prieto Project
Table 52 - DDH: CP376, Coordinates: 366968.56 N, 532678.612 E, Elevation: 1,186 m
| Sample ID |
Weight Received (kg) |
Assays
by: (ALS) Au (ppm) |
Assays
by: (CoP) Au (ppm) |
Difference |
| 787645 | 0.11 | 1.780 | 1.75 | 0.03 |
| 787646 | 0.08 | 2.630 | 1.96 | 0.67 |
| 787647 | 0.06 | 0.084 | 0.10 | -0.02 |
| 787648 | 0.11 | 0.172 | 0.17 | 0.00 |
| 787648-1 | 0.07 | 0.015 | 0.00 | 0.02 |
| 787649 | 0.10 | 0.631 | 0.42 | 0.21 |
| 787650 | 0.07 | 0.055 | 0.07 | -0.02 |
Table 53 -DDH: CP377, Coordinates: 3367055.917 N, 532585.5 E, Elevation: 1,116 m
| Sample ID |
Weight Received (kg) |
Assays
by: (ALS) Au (ppm) |
Assays
by: (CoP) Au (ppm) |
Difference |
| 787723 | 0.07 | 1.025 | 0.94 | 0.09 |
| 787724 | 0.12 | 0.252 | 0.21 | 0.04 |
| 787726 | 0.08 | 0.678 | 0.77 | -0.09 |
| 787727 | 0.12 | 0.202 | 0.20 | 0.00 |
| 787728 | 0.10 | 0.059 | 0.06 | 0.00 |
| 787728-1 | 0.03 | 0.910 | 0.93 | -0.02 |
| 787729 | 0.11 | 0.170 | 0.15 | 0.02 |
| 787730 | 0.11 | 3.580 | 3.66 | -0.08 |
| 787731 | 0.15 | 1.935 | 1.91 | 0.03 |
| 787732 | 0.15 | 0.213 | 0.23 | -0.02 |
Table 54 - DDH: CP378, Coordinates: 3367081.469 N., 532545.41 E., Elevation: 1,091m
| Sample ID |
Weight Received (kg) |
Assays
by: (ALS) Au (ppm) |
Assays
by: (CoP) Au (ppm) |
Difference |
| 787816 | 0.09 | 0.430 | 0.46 | -0.03 |
| 787817 | 0.09 | 0.209 | 0.22 | -0.01 |
| 787818 | 0.09 | 0.077 | 0.09 | -0.01 |
| 787818-1 | 0.04 | 0.884 | 0.93 | -0.05 |
| 787819 | 0.08 | 0.082 | 0.12 | -0.04 |
| 787820 | 0.10 | 1.105 | 1.21 | -0.11 |
| 787821 | 0.11 | 0.068 | 0.08 | -0.01 |
Table 55 - DDH: CP382, Coordinates: 366617.88 N., 532539.136 E., Elevation: 1,138 m
| Sample ID |
Weight Received (kg) |
Assays
by: (ALS) Au (ppm) |
Assays
by: (CoP) Au (ppm) |
Difference |
| 770180 | 0.07 | 0.124 | 0.11 | 0.01 |
| 770181 | 0.06 | 0.145 | 0.16 | -0.02 |
| 770182 | 0.07 | 0.473 | 0.53 | -0.06 |
| 770182-1 | 0.04 | 0.208 | 0.23 | -0.02 |
| 770183 | 0.07 | 0.328 | 0.39 | -0.06 |
91
NI 43-101 Technical Report – Cerro Prieto Project
Table 56 - DDH: CP384, Coordinates: 3366693.15 N., 532700.72 E., Elevation: 1,179.15 m
| Sample ID |
Weight Received (kg) |
Assays
by: (ALS) Au (ppm) |
Assays
by: (CoP) Au (ppm) |
Difference |
| 777569 | 0.11 | 3.140 | 3.00 | 0.14 |
| 777570 | 0.09 | 2.710 | 2.79 | -0.08 |
| 777570-1 | 0.10 | 0.018 | 0.00 | 0.02 |
| 777571 | 0.09 | 1.190 | 1.24 | -0.05 |
| 777572 | 0.11 | 0.049 | 0.06 | -0.01 |
Table 57 - DDH: CP387, Coordinates: 3366725.656 N., 532563.2 E., Elevation: 1,145 m
| Sample ID |
Weight Received (kg) |
Assays
by: (ALS) Au (ppm) |
Assays
by: (CoP) Au (ppm) |
Difference |
| 777649 | 0.19 | 0.089 | 1.31 | -1.22 |
| 777650 | 0.15 | 0.483 | 0.69 | -0.21 |
| 777651 | 0.16 | 0.098 | 0.19 | -0.09 |
| 777651-1 | 0.08 | 0.012 | 0.00 | 0.01 |
| 777652 | 0.09 | 1.290 | 0.71 | 0.58 |
| 777653 | 0.10 | 0.727 | 0.29 | 0.44 |
| 777654 | 0.11 | 0.199 | 0.16 | 0.04 |
| 777655 | 0.08 | 0.729 | 0.70 | 0.03 |
Table 58 - DDH: CP388, Coordinates: 3366683.51 N., 532597.49 E., Elevation: 1,154 m
| Sample ID |
Weight Received (kg) |
Assays
by: (ALS) Au (ppm) |
Assays
by: (CoP) Au (ppm) |
Difference |
| 777702 | 0.09 | 0.478 | 0.48 | 0.00 |
| 777703 | 0.09 | 0.423 | 0.39 | 0.03 |
| 777704 | 0.09 | 0.553 | 0.56 | -0.01 |
| 777704-1 | 0.04 | 0.216 | 0.21 | 0.01 |
| 777705 | 0.09 | 0.502 | 0.50 | 0.00 |
| 777706 | 0.05 | 0.014 | 0.01 | 0.00 |
| 777707 | 0.07 | 4.370 | 4.32 | 0.05 |
| 777708 | 0.06 | 0.420 | 0.43 | -0.01 |
| 777709 | 0.09 | 0.026 | 0.06 | -0.03 |
Table 59 - DDH: CP389, Coordinates: 3366663.65 N., 532614.616 E., Elevation: 1,155 m
| Sample ID |
Weight Received (kg) |
Assays
by: (ALS) Au (ppm) |
Assays
by: (CoP) Au (ppm) |
Difference |
| 778978 | 0.11 | 0.615 | 0.64 | -0.03 |
| 778978-1 | 0.09 | 0.016 | 0.00 | 0.02 |
| 778979 | 0.10 | 4.920 | 4.88 | 0.04 |
| 778980 | 0.10 | 0.783 | 0.76 | 0.02 |
Table 60 - DDH: CP405, Coordinates: 333366879.014 N, 532708.93 E, Elevation: 1,245.1 m
| Sample ID |
Weight Received (kg) |
Assays
by: (ALS) Au (ppm) |
Assays
by: (CoP) Au (ppm) |
Difference |
| 24396 | 0.11 | 0.434 | 0.50 | -0.07 |
| 24397 | 0.13 | 1.805 | 1.69 | 0.12 |
| 24398 | 0.12 | 0.580 | 0.60 | -0.02 |
92
NI 43-101 Technical Report – Cerro Prieto Project
| Sample ID |
Weight Received (kg) |
Assays
by: (ALS) Au (ppm) |
Assays
by: (CoP) Au (ppm) |
Difference |
| 24398-1 | 0.07 | 0.024 | 0.00 | 0.02 |
| 24399 | 0.13 | 0.702 | 0.68 | 0.02 |
| 24400 | 0.10 | 0.155 | 0.15 | 0.01 |
| 24401 | 0.10 | 0.578 | 0.58 | 0.00 |
Table 61 - DDH: CP406, Coordinates: 3366889.46 N, 532725.54 E, Elevation: 1,245 m
| Sample ID |
Weight Received (kg) |
Assays
by: (ALS) Au (ppm) |
Assays
by: (CoP) Au (ppm) |
Difference |
| 24563 | 0.12 | 0.341 | 0.33 | 0.01 |
| 24564 | 0.17 | 0.178 | 0.16 | 0.02 |
| 24565 | 0.12 | 0.344 | 0.37 | -0.03 |
| 24565-1 | 0.04 | 5.470 | 5.82 | -0.35 |
| 24566 | 0.07 | 3.550 | 3.73 | -0.18 |
| 24567 | 0.07 | 0.228 | 0.30 | -0.07 |
Table 62 - DDH: CP412; Coordinates: 3366866.74 N, 532687.48 E; Elevation: 1245.89 m.
| Sample ID |
Weight Received (kg) |
Assays
by: (ALS) Au (ppm) |
Assays
by: (CoP) Au (ppm) |
Difference |
| 25102 | 0.06 | 0.286 | 0.27 | 0.02 |
| 25103 | 0.09 | 0.203 | 0.23 | -0.03 |
| 25104 | 0.09 | 0.423 | 0.45 | -0.03 |
| 25105 | 0.10 | 0.853 | 0.87 | -0.02 |
| 25105-1 | 0.04 | 0.898 | 0.93 | -0.03 |
| 25106 | 0.07 | 0.694 | 0.76 | -0.07 |
| 25107 | 0.08 | 0.271 | 0.34 | -0.07 |
| 25108 | 0.06 | 1.060 | 1.16 | -0.10 |
A dispersion graph comparing Cerro’s Prieto lab results with ALS Chemex results is shown in Figure 48.
93
NI 43-101 Technical Report – Cerro Prieto Project
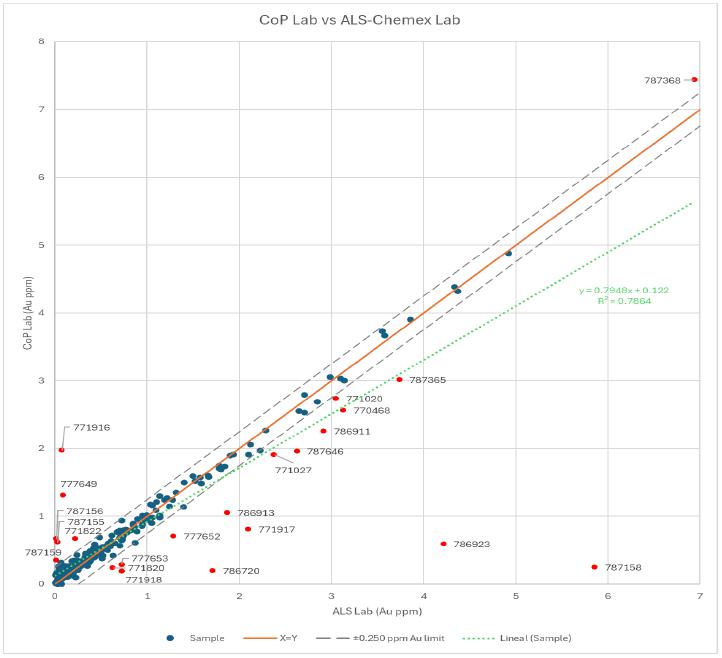
Figure 47 - Dispersion Graph. The graph compares samples analyzed at Cerro Prieto (CoP) and ALS labs. CoP prepared and tested the samples, while the rejects were sent to ALS for verification.
A determination coefficient of 0.786 (dotted green line) indicates a moderate correlation between the results of both labs. Red dots represent samples with a ±0.250 ppm difference, possibly signaling instrumentation issues at one of the labs.
José Antonio Olmedo MSc, P. Eng. Geo, QP, SME Registered Member (JAO) requested that a certified laboratory analyze duplicate samples to enhance the reliability of assay correlations. However, as detailed in Section 12 of this report, Oroco lacks retained sample materials from the Cerro Prieto and ALS laboratories, such as mineralized interval duplicates, coarse rejects, or pulp rejects. This absence of retained samples prevents the execution of standard Quality Assurance/Quality Control (QA/QC) procedures, which typically involve reanalysis of duplicates to assess analytical precision and accuracy. Consequently, the ability to validate the original assay results is significantly compromised.
94
NI 43-101 Technical Report – Cerro Prieto Project
JAO recommends optimizing Oroco’s designed open pit to include only analytical gold values within the pit envelope; this may increase the certainty of correlation between both labs.
| 11.3.2 | Blanks, Standards, and Duplicates |
For quality control of the ALS Chemex geochemistry lab, blanks and standards were inserted randomly for every 15 samples, and duplicates were excluded from the sample stream. Please refer to Table 63.
Table 63 - Blanks and Standards ALS Chemex
| Sample | Received
Weight |
Au
ALS |
DH | Type | Val | Lab Batch | Date | Batch Order |
| 770470-1 | 0,06 | 0,056 | CP384 | Blank | 0,0025 | HE24014461 | 27/1/2024 | Oser 001620 |
| 777742-1 | 0,04 | 5,93 | CP386 | OxL159 | 5,849 | HE24014461 | 27/1/2024 | Oser 001620 |
| 777754-1 | 0,09 | 0,009 | CP390 | Blank | 0,0025 | HE24014461 | 27/1/2024 | Oser 001620 |
| 771025-1 | 0,04 | 5,71 | CP209 | OxL159 | 5,849 | HE24014463 | 3/2/2024 | Oser 001626 |
| 771138-1 | 0,03 | 0,915 | CP210 | OxG141 | 0,93 | HE24014463 | 3/2/2024 | Oser 001626 |
| 771248-1 | 0,04 | 5,71 | CP211 | OxL159 | 5,849 | HE24014463 | 3/2/2024 | Oser 001626 |
| 771356-1 | 0,08 | 0,014 | CP212 | Blank | 0,0025 | HE24014463 | 3/2/2024 | Oser 001626 |
| 771395-1 | 0,04 | 0,213 | CP214 | OxC152 | 0,216 | HE24014463 | 3/2/2024 | Oser 001626 |
| 771447-1 | 0,04 | 1,785 | CP215 | OxH199 | 1,323 | HE24014463 | 3/2/2024 | Oser 001626 |
| 771790-1 | 0,06 | 0,02 | CP220 | Blank | 0,0025 | HE24014463 | 3/2/2024 | Oser 001626 |
| 771820-1 | 0,06 | 0,019 | CP221 | Blank | 0,0025 | HE24014463 | 3/2/2024 | Oser 001626 |
| 771854-1 | 0,04 | 5,71 | CP222 | OxL159 | 5,849 | HE24014463 | 3/2/2024 | Oser 001626 |
| 771882-1 | 0,04 | 0,908 | CP223 | OxG141 | 0,93 | HE24014463 | 3/2/2024 | Oser 001626 |
| 771917-1 | 0,07 | 0,023 | CP224 | Blank | 0,0025 | HE24014463 | 3/2/2024 | Oser 001626 |
| 771964-1 | 0,04 | 5,69 | CP225 | OxL159 | 5,849 | HE24014463 | 3/2/2024 | Oser 001626 |
| 784777-1 | 0,07 | 0,019 | CP362 | Blank | 0,0025 | HE24014463 | 3/2/2024 | Oser 001626 |
| 784941-1 | 0,04 | 0,914 | CP363 | OxG141 | 0,93 | HE24014463 | 3/2/2024 | Oser 001626 |
| 786072-1 | 0,05 | 0,213 | CP364 | OxC152 | 0,216 | HE24014463 | 3/2/2024 | Oser 001626 |
| 786279-1 | 0,06 | 0,019 | CP366 | Blank | 0,0025 | HE24014463 | 3/2/2024 | Oser 001626 |
| 786417-1 | 0,07 | 0,021 | CP367 | Blank | 0,0025 | HE24014463 | 3/2/2024 | Oser 001626 |
| 786718-1 | 0,08 | 0,011 | CP370 | Blank | 0,0025 | HE24014463 | 3/2/2024 | Oser 001626 |
| 786914-1 | 0,05 | 0,212 | CP371 | OxC152 | 0,216 | HE24014463 | 3/2/2024 | Oser 001626 |
| 787157-1 | 0,04 | 0,9 | CP372 | OxG141 | 0,93 | HE24014463 | 3/2/2024 | Oser 001626 |
| 787218-1 | 0,04 | 0,216 | CP373 | OxC152 | 0,216 | HE24014463 | 3/2/2024 | Oser 001626 |
| 787367-1 | 0,08 | 0,019 | CP374 | Blank | 0,0025 | HE24014463 | 3/2/2024 | Oser 001626 |
| 787455-1 | 0,04 | 0,211 | CP375 | OxC152 | 0,216 | HE24014463 | 3/2/2024 | Oser 001626 |
| 787648-1 | 0,07 | 0,015 | CP376 | Blank | 0,0025 | HE24014463 | 3/2/2024 | Oser 001626 |
| 787728-1 | 0,03 | 0,91 | CP377 | OxG141 | 0,93 | HE24014463 | 3/2/2024 | Oser 001626 |
| 787818-1 | 0,04 | 0,884 | CP378 | OxG141 | 0,93 | HE24014463 | 3/2/2024 | Oser 001626 |
| 770182-1 | 0,04 | 0,208 | CP382 | OxC152 | 0,216 | HE24014463 | 3/2/2024 | Oser 001626 |
| 777570-1 | 0,1 | 0,018 | CP384 | Blank | 0,0025 | HE24014463 | 3/2/2024 | Oser 001626 |
| 777742-1 | 0,04 | 5,93 | CP386 | OxL159 | 5,849 | HE24014463 | 3/2/2024 | Oser 001626 |
| 777651-1 | 0,08 | 0,012 | CP387 | Blank | 0,0025 | HE24014463 | 3/2/2024 | Oser 001626 |
| 777704-1 | 0,04 | 0,216 | CP388 | OxC152 | 0,216 | HE24014463 | 3/2/2024 | Oser 001626 |
95
NI 43-101 Technical Report – Cerro Prieto Project
| Sample | Received
Weight |
Au
ALS |
DH | Type | Val | Lab Batch | Date | Batch Order |
| 778978-1 | 0,09 | 0,016 | CP389 | Blank | 0,0025 | HE24014463 | 3/2/2024 | Oser 001626 |
| 777754-1 | 0,09 | 0,009 | CP390 | Blank | 0,0025 | HE24014463 | 3/2/2024 | Oser 001626 |
| 24398-1 | 0,07 | 0,024 | CP405 | Blank | 0,0025 | HE24014463 | 3/2/2024 | Oser 001626 |
| 24565-1 | 0,04 | 5,47 | CP406 | OxL159 | 5,849 | HE24014463 | 3/2/2024 | Oser 001626 |
| 25105-1 | 0,04 | 0,898 | CP412 | OxG141 | 0,93 | HE24014463 | 3/2/2024 | Oser001626 |
Using ALS Chemex Certificates lab analysis, José Antonio Olmedo MSc, P. Eng. Geo, QP, SME Registered Member (JAO) conducted the following analysis:
| 11.3.3 | Blanks |
A total of 17 blanks were inserted into the sample stream. See Table 62 and Figure 50. The location where the blanks are collected is at the coordinates: 3363242.045 N, 531016.166 E, 939.40 masl, UTM Zone North, NAD27. This corresponds to the Baucarit Formation, a rhyolitic tuff characterized by its fine ash texture due to a high clay content. The criterion for selecting blanks from this unit is based on the formation’s age, which is Miocene, approximately 23 to 7 million years ago, making it younger than the mineralization in Cerro Prieto.
Oroco did not analyze blanks in a laboratory; therefore, they assigned them a zero value. Even if blank values are close to the threshold, assigning a net-zero value may introduce bias when estimating the analytical accuracy and precision of the lab procedures. An alternative statistical method for evaluating ALS analytical procedures is incorporating the previous sample Au value in the analysis; refer to Figure 49.
Table 64 - Blank ALS Analysis Data. Source: JAO, 2025.
| Bank
Sample |
Drill Hole | Previous
Sample Number |
Blank
Au ppm |
Previous
Sample Au ppm |
| 770470-1 | CP384 | 770470 | 0,056 | 0,817 |
| 777754-1 | CP390 | 777754 | 0,009 | 0,731 |
| 771356-1 | CP212 | 771356 | 0,014 | 0,024 |
| 771790-1 | CP220 | 771790 | 0,020 | 4,340 |
| 771820-1 | CP221 | 771820 | 0,019 | 0,630 |
| 771917-1 | CP224 | 771917 | 0,023 | 2,100 |
| 784777-1 | CP362 | 784777 | 0,019 | 0,950 |
| 786279-1 | CP366 | 786279 | 0,019 | 0,837 |
| 786417-1 | CP367 | 786417 | 0,021 | 2,100 |
| 786718-1 | CP370 | 786718 | 0,011 | 1,670 |
| 787367-1 | CP374 | 787367 | 0,019 | 0,259 |
| 787648-1 | CP376 | 787648 | 0,015 | 0,172 |
| 777570-1 | CP384 | 777570 | 0,018 | 2,710 |
| 777651-1 | CP387 | 777651 | 0,012 | 0,098 |
| 778978-1 | CP389 | 778978 | 0,016 | 0,615 |
| 777754-1 | CP390 | 777754 | 0,009 | 0,731 |
| 24398-1 | CP405 | 24398 | 0,024 | 0,580 |
96
NI 43-101 Technical Report – Cerro Prieto Project
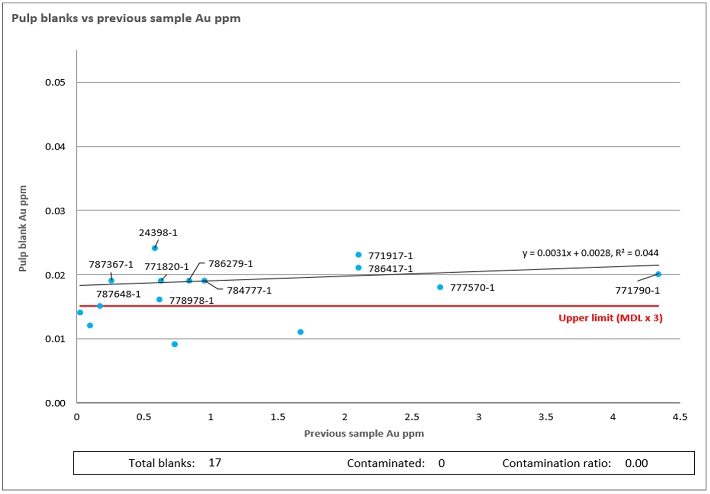
Figure 48 - Blanks vs Previous Sample Au ppm. Pulp blank samples sent to ALS (17). Source: JAO, 2025.
The analysis graph indicates that 76% of the samples exceed the upper limit of three times ALS’ MDL (red line). There is no significant variation in the Au mean value; however, the trend line (black line) suggests a growing trend that indicates slight contamination. This contamination may be attributed to mineralization in the original rock samples and the preparation of the samples.
| 11.3.4 | Standards |
A total of 22 standards were inserted. Three different standards were selected from ROCKLABS, P.O. Box 18-142, Alen Innes 1743, Auckland. The standards are displayed independently due to the differences in Au grades. Refer to tables 64 and 65 and figures 50 to 52. All standards include corresponding specification sheets compiled from round-robin assaying conducted by over 50 laboratories worldwide. The author's review of the ROCKLABS standards certificates is completed.
Table 65 - Standard Rock Lab Code: OxL159, ALS Analysis Data. Source: JAO, 2025.
| Sample Number | Rock Labs Code | Rock
Labs (Au g/t) |
ALS
AA23 |
| 777742-1 | OxL159 | 5.849 | 5.930 |
| 771025-1 | OxL159 | 5.849 | 5.710 |
| 771248-1 | OxL159 | 5.849 | 5.710 |
| 771854-1 | OxL159 | 5.849 | 5.710 |
97
NI 43-101 Technical Report – Cerro Prieto Project
| Sample Number | Rock Labs Code | Rock
Labs (Au g/t) |
ALS
AA23 |
| 771964-1 | OxL159 | 5.849 | 5.690 |
| 777742-1 | OxL159 | 5.849 | 5.930 |
| 24565-1 | OxL159 | 5.849 | 5.470 |
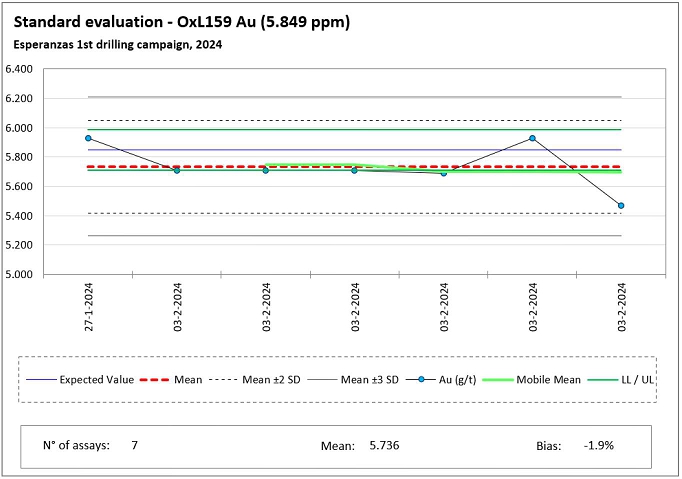
Figure 49 - Statistics Control Standard Rock Labs OxL159. Source, JAO, 2025.
Rock Labs’ OxL159 reference material was sent to ALS (7). Most samples are within tolerance limits, with only one sample (03/02/2024) close to Mean-2STD. The alignment with the mean value indicates reliable results from ALS. A thorough interpretation isn't possible at this exploration stage without historical standard samples.
Table 66 - Standard Rock Lab Code: OxG141, ALS Analysis Data. Source: JAO, 2025
| Sample Number | Rock Labs Code | Rock
Labs (Au g/t) |
ALS AA23 (Au g/t) |
| 771138-1 | OxG141 | 0.93 | 0.915 |
| 771882-1 | OxG141 | 0.93 | 0.908 |
| 784941-1 | OxG141 | 0.93 | 0.914 |
| 787157-1 | OxG141 | 0.93 | 0.9 |
| 787728-1 | OxG141 | 0.93 | 0.91 |
| 787818-1 | OxG141 | 0.93 | 0.884 |
| 25105-1 | OxG141 | 0.93 | 0.898 |
98
NI 43-101 Technical Report – Cerro Prieto Project
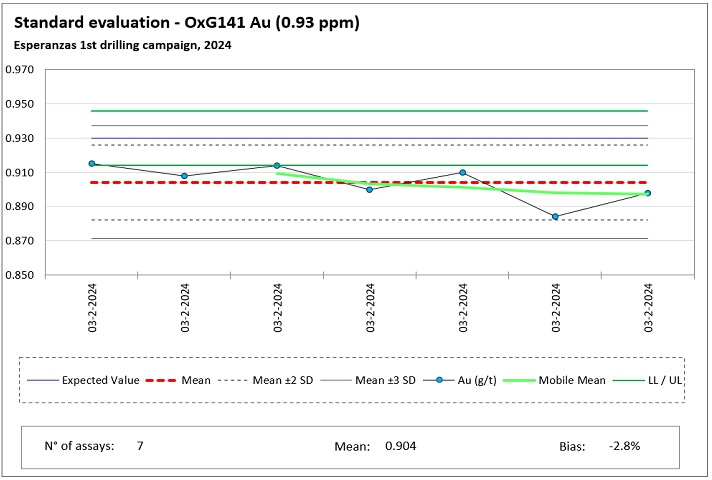
Figure 50 - Statistics Control Standard Rock Labs OxG141. Source, José Antonio Olmedo MSc, P. Eng. Geo, QP, SME Registered Member, 2025.
The analysis graph shows that, while all assays fall below the expected value, the results from ALS align with the mean Au value (red dashed line). Five of the seven samples are below the Lower Limit (LL, dark green line), but none fall beneath the tolerance limit of the mean minus 2 times the standard deviation (Mean - 2STD, black dashed line). The mobile mean line (bright green) indicates a negative trend. Proper interpretation is impossible at this exploration stage without the historical standard samples submitted to ALS.
Table 67 - Standard Rock Lab Code: OxC152, ALS Analysis Data. Source: JAO, 2025.
| Sample Number | Rock Labs Code | Rock
Labs (Au g/t) |
ALS
AA23 |
| 771395-1 | OxC152 | 0.216 | 0.213 |
| 786072-1 | OxC152 | 0.216 | 0.213 |
| 786914-1 | OxC152 | 0.216 | 0.212 |
| 787218-1 | OxC152 | 0.216 | 0.216 |
| 787455-1 | OxC152 | 0.216 | 0.211 |
| 770182-1 | OxC152 | 0.216 | 0.208 |
| 777704-1 | OxC152 | 0.216 | 0.216 |
99
NI 43-101 Technical Report – Cerro Prieto Project
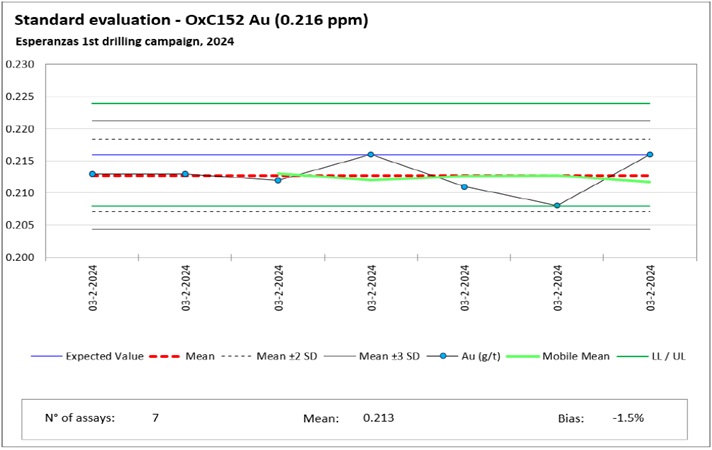
Figure 51 - Statistics Control Standard Rock Labs OxG141. Source, JAO, 2025.
Rock Labs’ OxC152 reference material was sent to ALS (7). The analysis graph demonstrates that all standards submitted to ALS are within the defined limits (dark green lines) and within the Mean ±2STD tolerance (black dashed lines). The mobile mean line (bright green line) indicates a slight bias trend towards negative values. Due to the absence of historical standard samples sent to ALS, a thorough interpretation at this exploration stage is impossible.
| 11.3.5 | Duplicates |
Duplicates were not included in the sampling stream for ALS Chemex. José Antonio Olmedo MSc, P. Eng. Geo, QP, SME Registered (JAO) Member recommends that Oroco’s further exploration proposal incorporate at least one duplicate for every 15 samples at an ISO-certified lab and suggests using a third-party ISO-certified lab for duplicates on selected drill intercepts.
| 11.3.6 | Opinion of Results on ALS Chemex Certified Lab |
Evaluating the QA/QC of ALS Chemex procedures, JAO concludes that despite the lack of duplicate analyses, the statistical analysis results for blanks and standards demonstrate strong consistency in precision and accuracy, with most samples yielding grades within the accepted limits.
| 11.4 | Sample Security |
JAO comments that Company authorized personnel or drilling operators transport core boxes to the Company’s core sampling preparation warehouse. Selected samples are then delivered to the ALS Chemex preparation lab in Hermosillo, Sonora, using Oroco’s vehicles, always driven by authorized personnel.
100
NI 43-101 Technical Report – Cerro Prieto Project
| 11.5 | Adequacy of Results |
José Antonio Olmedo MSc, P. Eng. Geo, QP, SME Registered Member expresses significant concern regarding the integrity of the analytical data from Oroco's laboratory results, primarily due to reliance on the non-accredited Cerro Prieto geochemical laboratory. Notably, this facility was responsible for approximately 95% of the assay data provided to José Antonio Olmedo MSc, P. Eng. Geo, QP, SME Registered Member for estimating the Esperanzas mineral resources.
Furthermore, Oroco has yet to implement a comprehensive Quality Assurance/Quality Control (QA/QC) program to evaluate the accuracy and precision of its laboratory analyses, as highlighted in the previously cited cautionary statements. In alignment with the CIM Estimation of Mineral Resources and Mineral Reserves Best Practice Guidelines, which emphasize the necessity of QA/QC protocols including the use of certified reference materials, blanks, duplicates, and regular monitoring by independent laboratories to ensure data reliability, the absence of such measures represents a critical oversight.
Consequently, it is recommended that Oroco undertake additional analytical work at the Esperanzas Deposit, utilizing accredited laboratories and implementing robust QA/QC procedures to enhance the confidence in and reliability of its assay database.
101
NI 43-101 Technical Report – Cerro Prieto Project
| 12.0 | DATA VERIFICATION |
Rodrigo R Carneiro MSc, QP, SME Registered Member (RRC) prepared this section of the Technical Report of data verification is the process of confirming that data has been generated with proper procedures, transcribed accurately from its original source into the Project database, and is suitable for use as described in this technical report.
| 12.1 | Mine Reconciliation |
Rodrigo R Carneiro MSc, QP, SME Registered Member prepared this section of the Technical Report, as detailed in Section 2.0, each of the Qualified Persons for this Technical Report visited the Cerro Prieto property and, regarding data verification, were provided the opportunity to review past drill programs, metallurgical results, process operations and other miscellaneous items in relation to the Cerro Prieto Heap Leach Operation.
| 12.2 | Site Inspections |
Rodrigo R Carneiro MSc, QP, SME Registered Member prepared this section of the Technical Report, while this historical auditing work could not be entirely verified, it is presented because these historical validation efforts culminated in the database that was subsequently verified and served as the basis for the current mineral resources.
| 12.2.1 | Site Inspection by a QP in Geology |
José Antonio Olmedo MSc, P. Eng. Geo, QP, SME Registered Member in Geology (JAO) visited the site from 28 through 31 May. 2024. During the site visit José Antonio Olmedo MSc, P. Eng. Geo, QP, SME Registered Member in Geology obtained information on geological appraisal, sample selection, sample preparation, geochemical analysis methods, quality assurance/quality control protocols, sampling techniques, drilling method, local and project geology, logging, bulk density, data base versus analysis certificates, location of data points, downhole surveys, sample security.
José Antonio Olmedo MSc, P. Eng. Geo, QP, SME Registered Member (JAO) requested that a certified laboratory analyze duplicate samples to enhance the reliability of assay correlations. However, as detailed in this section of this report, Oroco lacks retained sample materials from the Cerro Prieto and ALS laboratories, such as mineralized interval duplicates, coarse rejects, or pulp rejects. This absence of retained samples prevents the execution of standard Quality Assurance/Quality Control (QA/QC) procedures, which typically involve reanalysis of duplicates to assess analytical precision and accuracy. Consequently, the ability to validate the original assay results is significantly compromised. Based on the data verification JAO recommended to take duplicates and sample laboratory rejects to be analyzed in a third-party certified laboratory.
JAO also visited the heap leach pad area, the crushing plant, the laboratory facilities, and the core shack.
| § | Most of the information JAO compiled in the field is historical, as he was off-site during the drilling campaigns. |
| § | JAO reviewed the available data on regional and local geology, history, exploration, and mining programs provided by Oroco’s technical staff, particularly Omar Tadeo Nevarez, Chief of Exploration, and Rafael Alexandri, Director. |
102
NI 43-101 Technical Report – Cerro Prieto Project
| § | JAO reviewed the available data, including drill logs and additional supporting information sources provided by Oroco in the field. He also visited the old mining sites and the Esperanza mining project with Mr. Ralph Shearing (CEO) and Omar Tadeo Nevarez (Exploration Manager), as well as the Reyna exploration target. |
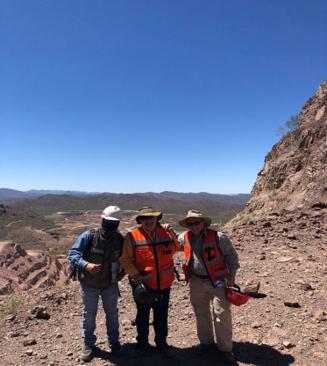
Photo 12.1. From left to right: Omar Tadeo Nevarez (Exploration Manager), José Antonio Olmedo MSc, P. Eng. Geo, QP, SME Registered Member (JAO), and Ralph Shearing (Goldgroup CEO). Source: JAO, 2024.
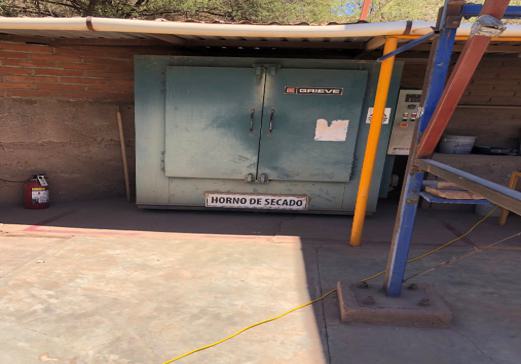
103
NI 43-101 Technical Report – Cerro Prieto Project
Photo 12.2. Cerro Prieto Oven. Source: JAO, 2024.
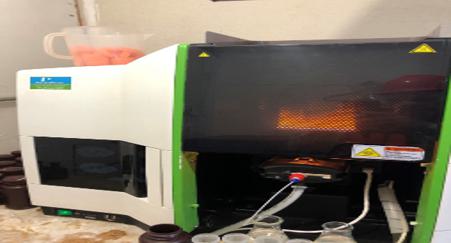
Photo 12.3. Cerro Prieto Perkins Elmer Atomic Absorption Spectroscopy. Source: JAO, 2024.
José Antonio Olmedo MSc, P. Eng. Geo, QP, SME Registered Member reviewed Oroco's protocols regarding sample selection, sample preparation, geochemical analysis methods, sampling techniques, drilling methods, logging, bulk density, sample security, and quality assurance and control (QA/QC) and he could not validate these protocols in person because he was not present during Oroco’s exploration campaigns.
José Antonio Olmedo MSc, P. Eng. Geo, QP, SME Registered Member found that the topography in the northern part of the Esperanzas project did not match previous topographic data and discussed this critical issue with Dr. Rafael Alexandri (Oroco’s Director). Consequently, Oroco subcontracted a topographical service to cover that area.
The new topographical information, delivered to José Antonio Olmedo MSc, P. Eng. Geo, QP, SME Registered Member (JAO) on June 4, 2024, aligned with the original southern topography and is ready for use in the Mineral Resource estimation presented here.
| 12.2.2 | Site Inspection by a QP in Mining |
Cristian Garcia, P. Eng., QP, Registered at Engineers and Geoscientists of British Columbia (CG) visited the property on May 28, 2024. Access to the site is in good condition. During the visit, CG met with the operations team and toured the main mining areas, including the waste dumps, crusher facility, and heap leach areas. He was able to visually confirm the good geotechnical conditions in the existing open pit areas.
During the site visit, CG obtained information regarding the mining method, operating procedures, and cost structure. He subsequently reviewed the data provided to verify that the assumptions and values were consistent with accepted industry standards for comparable open-pit operations.
The operations team provided the following supporting information:
| § | Open-Pit Designs. |
| § | Whittle (Lerchs–Grossmann) Optimization Runs and Economic Shells. |
| § | Topographic Contour Data. |
| § | Budgeted and Actual Operating Costs. |
104
NI 43-101 Technical Report – Cerro Prieto Project
This information received was used to establish a set of planning parameters for the mine design and scheduling work, including mining and processing costs, pit slope criteria, and process rates. The mining costs both budgeted and actual costs were compared with benchmark data from similar-scale operations using comparable mining methods and were found to be within the expected range.
During the field inspection, CG also observed the equipment operating in the pit and reviewed grade control and material handling procedures used by the operations team to manage ore classification (high-grade, low-grade, and direct-leach material).
| 12.2.3 | Site Inspection by a QP in Metallurgy |
Rodrigo R Carneiro MSc, QP, SME Registered Member (RRC) visited the site on 28 and 29 May 2024. The crushing plant, heap leaching operation, ADR Plant, analytical laboratory in the ADR Plant and main metallurgical and analytical laboratories of the mine areas were visited for two days. During the site visit the crushing plant was not in operation since it was under preventive maintenance and installation of a new feeder to the primary crusher. RRC reviewed and obtain copy of the historical production of Cerro Prieto, historical reagent and power consumptions from 2017 thought 2023.
RRC checked the metallurgical test procedures for conducting sample preparation, agitated cyanide bottle roll testing, locked cycle column testing, process stream sampling and the results to ensure they met the industry standards, both for the tests conducted by Cerro Prieto site personnel and an ISO independent metallurgical laboratory.
Site metallurgical sampling procedures were reviewed to ensure that there was representative material taken at the crushing plant, heap pads, ADR Plant and the samples were reasonably representative with regards to material type and grade with the material processed to continue to support the current processing method and assumptions regarding future recoveries and costs.
RRC checked and verified the Cerro Prieto Project cash flow model, detail operating costs and capital costs provided by Company personnel which were used for developing Section 21 Capital and Operating Costs and Section 22 Economic Analysis from April 1st, 2025, through to April 31, 2026.
To clarify, RRC ensured that the independent ISO certified laboratory received the same standard protocols used on site, facilitating consistency between laboratory and site procedures. This approach was taken so that both the site personnel and the independent laboratory would follow identical, industry-standard methodologies during cyanide column and agitated bottle roll testing, thereby strengthening the reliability and comparability of all metallurgical test results.
| § | RRC provided to the site personnel responsible to conduct metallurgical testing a copy of standard protocols of the industry for conducting cyanide agitated bottle roll testing and cyanide column testing were provided. |
| § | RRC recommended to Oroco’s management to evaluate crush size testing (P80 of 3/4", 1/2" and 3/8”) and NaCN concentrations of 400 ppm and 600 ppm on samples from new mine resources for determining the optimum conditions prior to process it in industrial process. |
105
NI 43-101 Technical Report – Cerro Prieto Project
| 13.0 | MINERAL PROCESSING AND METALLURGICAL TESTING |
Rodrigo R Carneiro MSc, QP, SME Registered Member (RRC) prepared this section of the Technical Report. A metallurgical study was conducted on two composite samples representing the mineral resource of the Esperanzas Deposit which is included inside the Cerro Prieto Mine. The personnel of Cerro Prieto Mine prepared two composite representing the mineral resources included in the Esperanzas Deposit.
RRC specified a metallurgical study which was conducted at Laboratorio Tecnológico de Metalurgia (LTM) S.A de C.V which is an independent ISO certified commercial laboratory located in Hermosillo, Sonora, Mexico.
The metallurgical test work conducted on two composite samples of the Esperanzas Deposit included cyanide agitated bottle roll testing and locked cycle column leach testing on the composite samples identified as Esperanza Composite and Nueva Esperanza Composite.
| 13.1 | Metallurgical Test Work Conducted in a Certified Commercial Laboratory |
On May 2024, personnel of Minas de Oro Resources, S.A de C.V prepared two composites identified as Esperanza and Nueva Esperanza representing the mineral resources of the Esperanzas Deposit using 1/4 diameter of HQ drill core samples for conducting a metallurgical study specified by an independent metallurgical consultant Rodrigo R Carneiro MS, QP., which included:
| § | Sample preparation and head screen assays (Au, Ag & Cu) at two crush sizes of P80 of 5/8” and P80 of 3/8”, |
| § | Agitated cyanide bottle roll testing on each composite crushed to 100% minus 10 Mesh for 72 hours, |
| § | Locked cycle column testing on each composite at two crush sizes of P80 of 5/8” and P80 of 3/8”. |
On June 2024, a metallurgical study on the Esperanza Composite and Nueva Esperanza Composite was started at Laboratorio Tecnológico de Metalurgia (LTM) S.A de C.V located in Hermosillo, Sonora. LTM which is an independent ISO certified commercial laboratory.
The following tables summarize gold and silver head assays on the Esperanza and Nueva Esperanzas Composites which represent the main mineralization of the Esperanzas Deposit.
Table 68 - Gold and Silver Assays on the Esperanza and Nueva Esperanza Composites
| Composite ID | Assay (g/t) | |||
| Total Au | CNs* Au | Total Ag Assay | CNs* Ag | |
| Esperanza | 0.661 | 0.526 | 1.85 | 0.85 |
| Nueva Esperanza | 0.586 | 0.536 | 4.50 | 1.83 |
| *CNs = Cyanide Soluble | ||||
| § | Esperanza Composite shows a total gold assay of 0.661 g/t and cyanide soluble gold assay of 0.526 g/t which indicates that approximately 80% of the total gold contained in the sample is soluble in cyanide. |
106
NI 43-101 Technical Report – Cerro Prieto Project
| § | Esperanza Composite shows a total silver assay of 1.85 g/t and cyanide soluble silver assay of 0.85 g/t which indicates that approximately 46% of the total silver contained in the sample is soluble in cyanide. |
| § | Nueva Esperanza Composite shows a total gold assay of 0.586 g/t and cyanide soluble gold assay of 0.536 g/t which indicates that approximately 91% of the total gold contained in the sample is soluble in cyanide. |
| § | Nueva Esperanza Composite shows a total silver assay of 4.50 g/t and cyanide soluble silver assay of 1.83 g/t which indicates that approximately 41% of the total silver contained in the sample is soluble in cyanide. |
The Esperanza and Nueva Esperanzas Composites were analyzed by 32-Element ICP-OES utilizing Aqua Regia Digestion to identify potential deleterious elements contained in the samples which negatively impact gold extraction and processing. The following table summarizes the results.
Table 69 - 32-Element ICP-OES on Composite Samples
| Element | Unit | Nueva Esperanza | Esperanza |
| Al | % | 6.413 | 7.206 |
| As | mg/L | 29.887 | 40.372 |
| Be | mg/L | 1.320 | 1.249 |
| Bi | mg/L | <1.00 | <1.00 |
| Ca | % | 0.995 | 1.894 |
| Cd | mg/L | 8.327 | 8.258 |
| Co | mg/L | 12.317 | 15.536 |
| Cu | mg/L | 79.428 | 52.379 |
| Fe | % | 3.491 | 3.288 |
| K | % | 7.575 | 8.323 |
| Hg | mg/L | <1.00 | <1.00 |
| La | mg/L | 29.410 | 32.711 |
| Li | mg/L | 53.272 | 44.813 |
| Mg | % | 0.675 | 0.844 |
| Mn | % | 0.238 | 0.208 |
| Na | % | 0.223 | 0.256 |
| Ni | mg/L | 21.320 | 25.480 |
| P | % | 0.093 | 0.119 |
| Pb | % | 0.092 | 0.057 |
| Sc | mg/L | 5.449 | 6.533 |
| Sr | mg/L | 210.848 | 267.934 |
| U | mg/L | 0.000 | 0.000 |
| V | mg/L | 72.190 | 72.960 |
| Zn | % | 0.243 | 0.159 |
| Ag | mg/L | 20.269 | 13.441 |
| Mo | mg/L | 2.251 | 1.657 |
| Sb | mg/L | 6.277 | 2.749 |
| Sn | mg/L | <1.00 | <1.00 |
| W | mg/L | 13.728 | 6.78 |
| S | mg/L | 102.6 | 94.308 |
107
NI 43-101 Technical Report – Cerro Prieto Project
It seems that the level of As, Cd, Fe, Hg, Pb and Sb contained in the Esperanza and Nueva Esperanzas Composites could negatively impact gold extraction and processing.
The results obtained in the cyanide bottle roll tests and locked cycle column leach tests on composites of the Esperanza and Nueva Esperanza Composites which represent the mineral resource of the Esperanzas Deposit are included in Table 69, Table 70 and Table 71 below.
Table 70 - Cyanide Bottle Boll Roll Leach Testing on Composite Samples
|
Sample ID |
Cumulative Extraction (%) |
Reagents Consumption (kg/t) | ||
| Au | Ag | NaCN | CaO | |
| Esperanza | 78.91 | 50.72 | 0.637 | 2.022 |
| Esperanza (Duplicate) | 77.15 | 75.52 | 0.883 | 1.893 |
| Average | 78.03 | 63.12 | 0.760 | 1.958 |
| Nueva Esperanza | 83.23 | 89.49 | 1.009 | 2.224 |
| Nueva Esperanza (Duplicate) | 80.90 | 91.35 | 0.888 | 2.016 |
| Average | 82.07 | 90.42 | 0.949 | 2.120 |
The following comments relate to the summary of results obtained on the cyanide bottle roll leach testing conducted on the Esperanza Composite samples at a particle size of 100% minus 10 Mesh.
| § | Average gold and silver extractions of 78.03% and 63.12 respectively were obtained after 72 hours of retention time. |
| § | Average NaCN and CaO consumptions were 0.760 kg/t and 1.958 kg/t respectively. NaCN and CaO consumptions can be considered in the medium range for an agitated leach testing at a particle size of 100% minus 10 Mesh. |
The following comments relate to the summary of results obtained on the cyanide bottle roll leach testing conducted on the Nueva Esperanza Composite samples at a particle size of 100% minus 10 Mesh.
| § | Average gold, silver and copper extractions of 82.07% and 90.42 respectively were obtained after 72 hours of retention time. |
| § | Average NaCN and CaO consumptions were 0.949 kg/t and 2.120 kg/t respectively, NaCN and CaO consumptions can be considered in the medium range for an agitated leach at a particle size of 100% minus 10 Mesh. |
Four (4) locked cycle column tests were conducted on the Esperanza Composite at the crush sizes of P80 of 5/8” and P80 of 3/8” for 78 days of leach using two sodium cyanide (NaCN) concentrations of 300 ppm and 600 ppm followed by 4 days of wash cycle and 2 days of drain cycle at LTM which is a commercial independent ISO certified metallurgical laboratory and the results obtained are summarized in Table 70 below.
108
NI 43-101 Technical Report – Cerro Prieto Project
Table 71 - Locked Cycle Cyanide Column Testing on the Esperanza Composite
| Crush Size |
[NaCN] (ppm) |
Extraction (%) |
Calculated Recovery* (%) |
Reagent Consumption (kg/t) | |||
| Au | Ag | Au | Ag | NaCN | CaO | ||
| P80 of 5/8” | 300 | 57.30 | 8.80 | 51.59 | 5.51 | 0.44 | 1.95 |
| P80 of 5/8” | 600 | 64.23 | 10.8 | 58.17 | 7.41 | 0.77 | 1.95 |
| P80 of 3/8” | 300 | 71.91 | 27.8 | 65.47 | 23.56 | 0.48 | 1.95 |
| P80 of 3/8” | 600 | 78.88 | 21.1 | 72.09 | 17.27 | 0.75 | 1.95 |
| *Calculated as Follows: (3% Discounted from Column Extraction) x 95% ADR | |||||||
The following comments relate to the column tests conducted on the Esperanza Composite at crush sizes of P80 of 5/8” and P80 of 3/8” using sodium cyanide concentrations in the feed solution of 300 ppm and 600 ppm.
| § | The highest gold extraction of 78.88% was obtained at a sodium cyanide concentration of 600 ppm and the lowest silver extraction of 21.18%. |
| § | It seems that an incremental sodium cyanide consumption of 0.27 g/t obtained at the crush size of P80 of 3/8” and using 600 ppm of sodium cyanide justifies the additional incremental of gold extraction of 6.97%. |
| § | Calculated gold and silver recoveries of 72.09% and 17.27% respectively were estimated discounted 3% from the column extraction and ADR Plant recovery of 95%.ted 3% from the column gold and silver extractions and ADR Plant recovery of 95%. |
Two (2) locked cycle column tests were conducted on the Nueva Esperanza Composite at the crush sizes of P80 of 5/8” and P80 of 3/8” using a sodium cyanide concentration of 600 ppm for 78 days of leach followed by 4 days of wash cycle and 2 days of drain cycle at LTM which is a commercial independent ISO certified metallurgical laboratory, and the results obtained are summarized in the following table.
Table 72 - Locked Cycle Cyanide Column Testing on the Nueva Esperanza Composite
| Crush Size |
[NaCN] (ppm) |
Extraction (%) |
Calculated Recovery* (%) |
Reagent Consumption (kg/t) | |||
| Au | Ag | Au | Ag | NaCN | CaO | ||
| P80 of 5/8” | 600 | 72.40 | 33.7 | 65.93 | 29.20 | 0.67 | 2.18 |
| P80 of 3/8” | 600 | 77.30 | 31.3 | 70.58 | 26.95 | 0.73 | 2.18 |
| *Calculated as Follows: (3% Discounted from Column Extraction) x 95% ADR | |||||||
The following comments relate to the column tests conducted on the Nueva Esperanza Composite at two crush sizes of P80 of 5/8” and P80 of 3/8”.
| § | The crush size of P80 of 5/8” shows the lowest gold extraction of approximately 72% and the highest silver extraction of approximately 34%. |
| § | The crush size of P80 of 3/8” shows the highest gold extraction of approximately 77% and the lowest silver extraction of approximately 31%. |
109
NI 43-101 Technical Report – Cerro Prieto Project
| § | The additional incremental of sodium cyanide consumption of 0.06 g/t should justify the additional incremental of gold extraction of approximately 5% obtained at the crush size of P80 of 3/8”. |
| § | Calculated gold and silver recoveries of approximately 71% and 27% respectively at a crush size of approximately P80 of 3/8” were estimated discounted 3% from the column extraction and ADR Plant recovery of 95%. |
| § | There was not enough sample weight to conduct two column tests using sodium cyanide concentration of 300 ppm. |
110
NI 43-101 Technical Report – Cerro Prieto Project
| 14.0 | MINERAL RESOURCES ESTIMATES |
| 14.1 | Introduction |
This section of the Technical Report was prepared by José Antonio Olmedo MSc, P. Eng. Geo, QP, SME Registered Member (JAO) and provides an independent estimation of Mineral Resources for the Esperanzas Deposit, located in the State of Sonora, Municipality of Cucurpe, Mexico, approximately 150 km northeast of Hermosillo.
The Esperanzas Deposit is an open-pit mining development currently in progress. It is part of the Cerro Prieto mining property owned and operated by Minas de Oroco Resources, S.A. de C.V. (Oroco), a subsidiary of Goldgroup Mining, Inc., a publicly traded Canadian mining company listed on TSX.V-GGA and OTC-GGAZF.
This report aims to provide Oroco with an independent assessment of the mineral resources contained within the Esperanzas Deposit mining, which encompasses the contiguous areas known as La Esperanza and Nueva Esperanza, as shown in Figure 54 and Subsection 14.1.
The quality of information, conclusions, and estimates presented herein reflects the level of effort involved in JAO’s services, based on i) information available at the time of preparation, ii) data supplied by outside sources, and iii) the assumptions, conditions, and qualifications outlined in this Report.
Mineral Resources methodology is reported according to the Canadian Institute of Mining, Metallurgy and Petroleum (CIM) Definition Standards for Mineral Resources and Mineral Reserves (May 19, 2014) and the CIM Estimation of Mineral Resources and Mineral Reserves Best Practice Guidelines (November 29, 2019). Unless otherwise stated, the metric system has been used throughout the report.
The Mineral Resource Estimates (MRE) prepared by JAO utilized 51 drill holes, 3,955 diamond drill core samples, and 1,231 surface channels. Samples were analyzed at Oroco’s Cerro Prieto geochemistry lab. JAO completed the resource estimate after thoroughly reviewing relevant geological information to ensure that the data incorporated within it was appropriately supported. The effective date of the Mineral Resource statement is April 04, 2025.
This estimation approach was appropriate based on several factors, including the quantity and spacing of available data, the interpreted mineralization controls, field geological work, and recognized mineralization style. The estimation was confined within mineralized geological-grade interpretations created with the assistance of Oroco geologists. The current mineral resource estimate, as updated on April 04, 2025, is shown in Table 77 on Page 128.
JAO was involved in preparing this Mineral Resource Estimation and Classification Technical Report, has no beneficial interest in Goldgroup Mining, Inc. or its subsidiaries. The results of this Report do not depend on any prior agreements regarding the conclusions to be reached. The consultant receives a fee for his work by standard professional geology and engineering practices.
José Antonio Olmedo MSc, P. Eng. Geo, QP, SME Registered Member stated that the Company is currently mining the Esperanzas deposit and the current cut-off grade or economic limit was provided to the author as 0.2 g/t Au. This value is based on the current open pit mining operation, considering the actual mining method, metallurgical processes, operating costs, and economic performance.
111
NI 43-101 Technical Report – Cerro Prieto Project
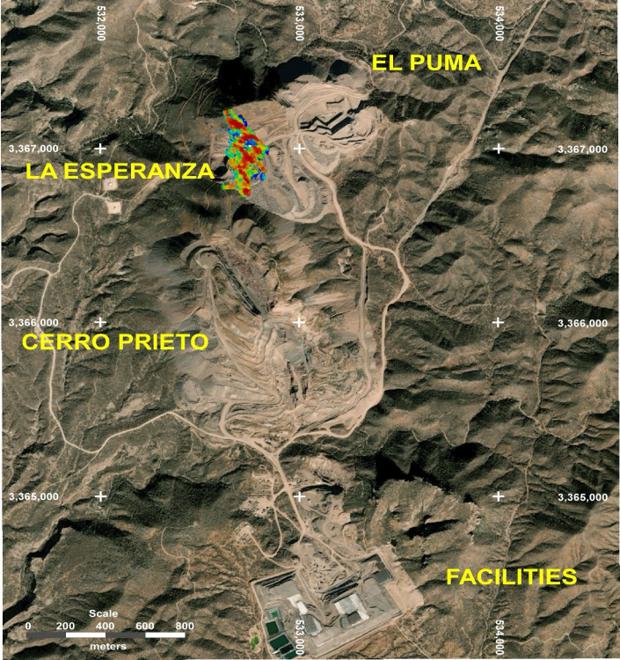
Figure 52 - Aerial photograph showing estimated block model mineral resources of the Esperanzas Deposit. Source: JAO 2025.
| 14.2 | Exploration Database Analysis |
| 14.2.1 | Coordinate Systems |
The Esperanzas Deposit utilizes NAD27 Mexico as the datum and projects UTM Zone 12N.
112
NI 43-101 Technical Report – Cerro Prieto Project
| 14.2.2 | Drilling Database |
Goldgroup’s technical staff provided to JAO with the following information:
| § | CP General Database: A central database in Access containing all drill holes and samples from the project. |
| § | CP Esperanzas Resource 2025_collar: Collar database for the Esperanza Deposit in CSV (comma-delimited). |
| § | CP Esperanzas Resource 2025_survey. The downhole survey database for the Esperanzas Deposit is in CSV (comma-delimited) format. |
| § | CP Esperanzas Resource 2025_Esp_lithology. The lithology database for the Esperanzas Deposit is in CSV (comma-delimited) format. |
| § | CP Esperanzas Resource 2025_Esp_assay: The assay database for the Esperanzas Deposit is in CSV (Comma-delimited) format. |
| § | CP Esperanzas Resource 2025_Esp_density. The density database for the Esperanza Deposit is in CSV format (comma-delimited). |
The database includes diamond drill holes and surface sampling. Statistical analyses revealed consistency among the various data types and sources.
After an initial spot check, it was determined that the database required full validation. The Cerro Prieto database was thoroughly checked using Leapfrog and Access. The following approach was adopted:
The complete list of intervals used in the estimation consisted of 51 diamond drill holes, 3,955 diamond drill core, and 1,265 surface samples.
| § | Sampled intervals average 1.7 m. |
| § | Computerized assay information was verified against laboratory certificates. If the laboratory certificate was missing or lost, the verification was conducted using the interval grade value noted on the log sheet. |
| § | The checks also included comparing the available and computerized lithology, alteration, and mineralization types to the original log sheet. |
| § | The drill hole collar coordinates and the down-the-hole survey information were checked. |
| § | The QP examined the consistency of sample intervals and the "from" and "to" meterage of each down-the-hole interval. |
| § | The names of the drill holes must remain consistent across all data tables to ensure that information can be accurately linked. |
| § | The coordinate system used for the drill holes and surface channels was also verified. |
| § | JAO also checked the values assigned to intervals with missing Au assays, those with missing or inconsistent density values, and the laboratory detection limit. |
As noted in Section 11 of this report, José Antonio Olmedo MSc, P. Eng. Geo, QP, SME Registered Member (JAO) expresses significant concern regarding the integrity of the analytical data from Oroco's laboratory results, primarily due to reliance on the non-accredited Cerro Prieto geochemical laboratory (CoP). Notably, this facility was responsible for approximately 95% of the assay data provided to JAO for estimating the Esperanzas Deposit mineral resources.
113
NI 43-101 Technical Report – Cerro Prieto Project
Furthermore, Oroco has yet to implement a comprehensive Quality Assurance/Quality Control (QA/QC) program to evaluate the accuracy and precision of laboratory analyses, as highlighted in the previously cited cautionary statements in Section 11. In alignment with the CIM Estimation of Mineral Resources and Mineral Reserves Best Practice Guidelines, which emphasize the necessity of QA/QC protocols including the use of certified reference materials, blanks, duplicates, and regular monitoring by independent laboratories to ensure data reliability, the absence of such measures represents a critical oversight. Consequently, it is recommended that Oroco undertake additional analytical work at the Esperanzas Deposit, utilizing accredited laboratories and implementing robust QA/QC procedures to enhance confidence in and the reliability of its assay database.
| 14.2.3 | Exploratory Data Analysis |
The statistical parameters were calculated using JMP Pro Software. Minimum, median, mean, and maximum measure central tendency, as shown in Table 73: Central Tendency Statistics of drill holes and trenches (Uncapped).
Table 73 - Central Tendency Statistics of Drill Holes and Trenches (Uncapped). Source: JAO 2025.
| Category | Type | Metal | Meters | ||||||||
| DDH | Trench | Au (ppm) | |||||||||
| N | % of Total |
N | % of Total |
Media | % of Total |
Mean | Std Deviation |
Min | Max | Sum | |
| CP* | 3,955 | 76.3% | 0 | 0.0% | 0.0400 | 56.6% | 0.1481 | 0.5285 | 0.005 | 23.0 | 6,524 |
| EE | 0 | 0.0% | 50 | 1.0% | 0.0500 | 0.9% | 0.1761 | 0.4270 | 0.005 | 2.2 | 100 |
| ESP | 0 | 0.0% | 273 | 5.3% | 0.0900 | 9.2% | 0.3473 | 0.9322 | 0.005 | 8.8 | 499 |
| EXPESP | 0 | 0.0% | 13 | 0.3% | 0.4200 | 1.7% | 1.3823 | 2.9503 | 0.005 | 10.9 | 26 |
| FCO | 0 | 0.0% | 7 | 0.1% | 0.1500 | 0.5% | 0.6700 | 1.0139 | 0.040 | 2.8 | 8 |
| GH | 0 | 0.0% | 723 | 13.9% | 0.0600 | 18.4% | 0.2628 | 1.0226 | 0.005 | 19.6 | 1,120 |
| JC | 0 | 0.0% | 113 | 2.2% | 0.1900 | 12.2% | 1.1142 | 2.4894 | 0.005 | 15.7 | 101 |
| JP | 0 | 0.0% | 52 | 1.0% | 0.1000 | 0.7% | 0.1315 | 0.1289 | 0.010 | 0.7 | 51 |
*CP is the prefix for diamond drill holes.
Median absolute deviation (MAD), standard deviation, variance, and coefficient of variation measure statistical dispersion, as shown in Table 74. The statistical dispersion of drill holes and trenches is uncapped.
Table 74 - Statistical Dispersion of Drill Holes and Trenches (Uncapped). Source: JAO 2025.
| Category | N | Au (ppm) | |||
| MAD | Std Deviation | Variance | CV | ||
| CP* | 3,955 | 0.03 | 0.53 | 0.2793 | 356.95148 |
| EE | 50 | 0.04 | 0.43 | 0.1823 | 242.46085 |
114
NI 43-101 Technical Report – Cerro Prieto Project
| Category | N | Au (ppm) | |||
| MAD | Std Deviation | Variance | CV | ||
| ESP | 273 | 0.05 | 0.93 | 0.8690 | 268.4287 |
| EXPESP | 13 | 0.36 | 2.95 | 8.7045 | 213.43533 |
| FCO | 7 | 0.11 | 1.01 | 1.0281 | 151.33376 |
| GH | 723 | 0.04 | 1.02 | 1.0457 | 389.15251 |
| JC | 113 | 0.16 | 2.49 | 6.1972 | 223.42591 |
| JP | 52 | 0.04 | 0.13 | 0.0166 | 97.976874 |
*CP is the prefix for diamond drill holes.
The coefficient of variation (CV) indicates the variability of the deposit when considering the entire sample.
For the entire dataset, the 95% confidence interval for the mean gold ranges from 0.1786 ppm to 0.2203 ppm, with an estimate gold of 0.1994 ppm. The 95% confidence interval for the standard deviation gold ranges from 0.7517 ppm to 0.7812 ppm, with an estimate gold of 0.7662 ppm. The confidence intervals are presented in the following table, Confidence Intervals for the Gold Dataset.
Table 75 - Confidence Intervals for the Gold Dataset. Source: JAO 2025
| Parameter | Estimate | Lower Control Limit | Upper Control Limit | 1-Apha |
| Mean | 0.199492 | 0.178633 | 0.220351 | 0.950 |
| Std Dev | 0.766222 | 0.751756 | 0.781261 | 0.950 |
This 95% confidence interval for the mean and standard deviation of the data signifies that, in repeated sampling, these intervals will contain the true mean or standard deviation of the population from which the data comes 95.0% of the time.
The Gold Dataset indicates a degree of dispersion regarding the mean; this could imply a level of heterogeneity in the mineral deposit since the mean is sensitive to atypical values, while the median is affected by gaps or missing data in the middle of the sample's distribution. Table 76 presents the summary statistics and quantiles.
Table 76 - Summary Statistics and Quantities. Source: JAO 2025
| Quantiles | Summary Statistics | |||
| 100% | Maximum | 22.97 | Mean | 0.1994 |
| 99.5% | 3.88 | Standard Deviation | 0.7662 | |
| 97.5% | 1.46 | Standard Error | 0.0106 | |
| 90.0% | 0.37 | Upper 95% Mean | 0.2203 | |
| 75.0% | Quartile | 0.12 | Lower 95% Mean | 0.1786 |
| 50.0% | Median | 0.05 | Number | 5186 |
| 25.0% | Quartile | 0.02 | Number Missing | 0 |
| 10.0% | 0.01 | Skewness | 15.1833 | |
| 2.5% | 0.005 | |||
| 0.5% | 0.005 | |||
| 0.0% | Minimum | 0.005 | ||
115
NI 43-101 Technical Report – Cerro Prieto Project
The skewness coefficient 15.18 indicates a strongly skewed distribution, characterized by a significant difference between the mean and the median. A positive bias signifies an asymmetric distribution, as illustrated in Figure 54 below.
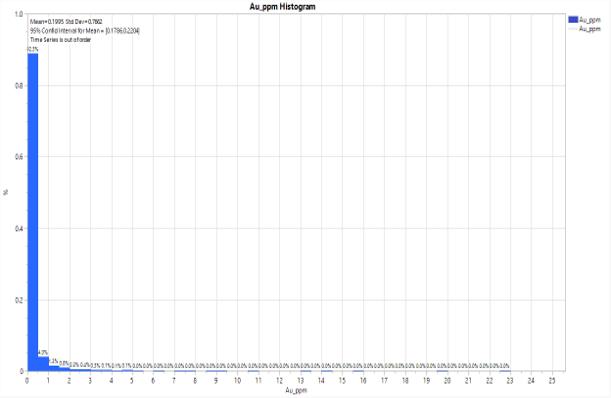
Figure 53 - Histogram Plot Au-ppm. Source: JAO. 2024.
Univariate summary statistics showed that all measured elements were positively skewed.
At Esperanzas Deposit, the dataset does not exhibit a normal distribution. Data evidence indicates a log-normal distribution with a right skew. The data is not normally distributed and is influenced by outliers. Therefore, the Au assay dataset is non-negative and positively skewed.
| 14.2.4 | Topography |
The Company provided a topographic surface model created by external surveyors. The topographic surface is considered accurate in both horizontal and vertical dimensions. The surface and pit topography were updated as of April 04, 2025.
| 14.3 | Geological Model |
Mineralization at Esperanzas Deposit is confined to geological structures bearing approximately 345° Az in a primary structure and 313° Az in a secondary one. The main structure extends about 700 meters and dips semi-vertically, while the secondary structure has a dip that varies from 65° SW in the northern part to around 50° SW in the southern portion.
Structures create a secondary porosity zone around them, allowing for low-grade disseminated mineralization. Due to the absence of lithological control and the fact that the mineralization is not confined to formal veins embedded in impermeable host rock, a grade domain solid (Figures 56 and 57) was developed using the Au composite dataset derived from the raw assays database; refer to Section 14.5. A meticulously interpreted and mapped multi-directional and multi-dipping structural trend was established and applied to the solid construction mineralization domain. Numerous sections and plan maps were utilized to confirm the reliability of the final domain solid.
116
NI 43-101 Technical Report – Cerro Prieto Project
The 3D solid domain was created using Leapfrog Geo 2024.1 software (www.seequent.com). It served as a hard boundary mineralization domain for the estimators conducted. Leapfrog Geo employs a Fast Radial Basis Function (FRBF) implicit modeling algorithm to generate 3D solids. An implicit model provides a continuous mathematical representation of an attribute throughout a volume. In its most general form, implicit modeling consists of three stages:
| 1. | Structure the data in a suitable format and ensure a flawless database. |
| 2. | Interpolation of the volumetric model (the implicit model). |
| 3. | Generation of 3D volumetric solid. |
This domain solid was constructed using an “indicator RBF interpolant” from a composite database. It was configured to use a cutoff value of Au 0.1 ppm and a 50% probability of containing that grade in the constructed solid.
The final domain was verified using several sections and plan maps. Figure 55 below presents a graph indicating Au values related to the domain limit, illustrating how Au values decline at the hard boundary limit.
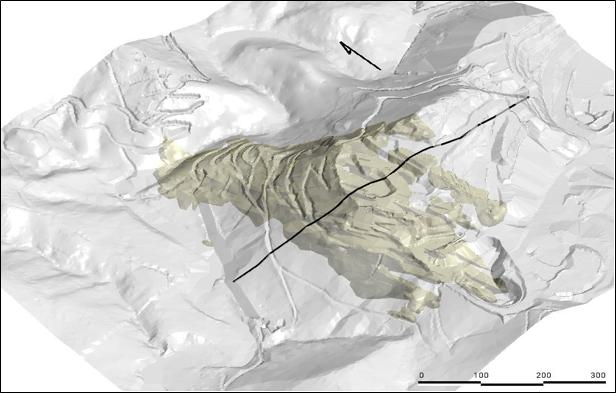
Figure 54 - This shows a 3D orthographic view of the Esperanza digital terrain and underlying domain models. The black line indicates the section depicted in Figure 55. Source: JAO 2025.
117
I 43-101 Technical Report – Cerro Prieto Project
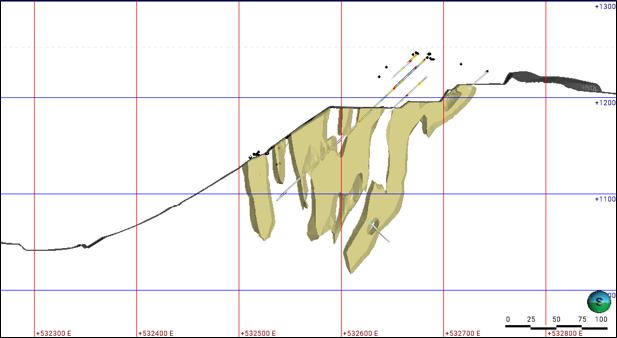
Figure 55 - This section displays the current topographic profile, drill holes, and domain solid; the section's location is indicated in Figure 56. Source: JAO 2025.
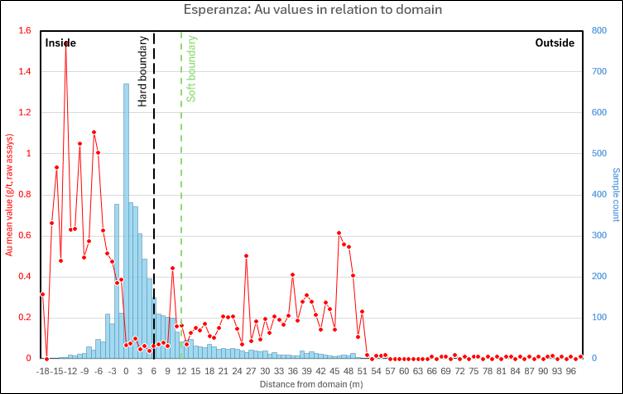
Figure 56 - Mean Au values (red line) related to the domain solid.
Figure 57 depicted black dashed line indicates the limit of the domain body, serving as a hard boundary. In contrast, the green dashed line marks the border of the soft buffer surrounding the boundary, which accounts for the dissemination zone at the domain’s edge. The blue bars represent the sample count (right axis). Relatively “high-grade” values in the middle of the graph signify samples in the already-mined sector where the domain solid no longer exists. Source: JAO2025.
118
NI 43-101 Technical Report – Cerro Prieto Project
| 14.4 | Assay Capping and Compositing Analysis |
| 14.4.1 | Capping Analysis |
Grade distributions used to define capping were selected from the inflection points on the probability plot, as shown in Figure 58. Additionally, outlier exploration was conducted using JMP software and graphics of normal quantile graphs and shadow grams to support the capping analysis.
The Cumulative Distribution Function (CDF) illustrates the probabilities of the Au-ppm variable as a cumulative function, aggregating the total likelihood up to that point. The interpreted inflection points suggest an inflection zone closer to 2 ppm Au.
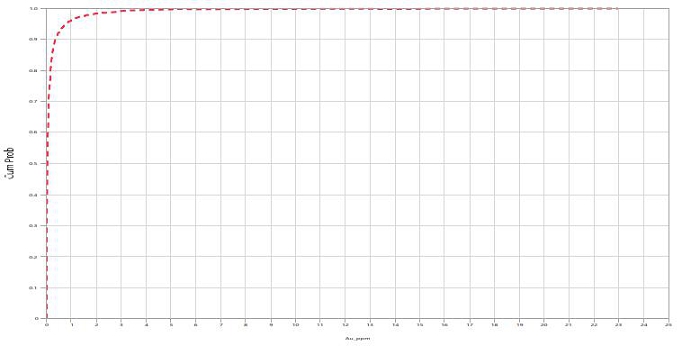
Figure 57 - Inflection Points from Probability CFD Plot. Source: JAO 2025.
The Quantile Range Outliers (QRO) exploration defines an outlier as any value that exceeds Q times the interquartile range from the lower and upper quantiles. The tail quantile used was 0.1 ppm, and the Q value was 4. The QRO exploration identified 100 atypical values above a high threshold of 1.81, as shown in Table 77 Quantile Range Exploration.
Table 77 - Quantile Range Exploration. Source: JAO 2025
| Column | 10% Quantile |
90% Quantile |
Low Threshold |
High Threshold |
Number of Outliers |
| Au-ppm | 0.01 | 0.37 | -1.43 | 1.81 | 100 |
Standard Quantile graphics illustrate the relationships among gold assays (red circle), the 95% confidence limits (blue dotted lines), the 50th percentile reference line (purple dotted line), and the diagonal reference line between the confidence limits. The plots reveal a transition zone between 1.5 ppm Au and 3.0 ppm Au, highlighting the opening of confidence intervals at 1.8 ppm Au and 2.3 ppm Au.
119
NI 43-101 Technical Report – Cerro Prieto Project
Finally, the shadowgram fitted with Log-Normal and Normal distributions showcases a gold transition from 1.5 ppm to 3.0 ppm Au, with atypical values exceeding 3.0 ppm, as illustrated in Figure 59.
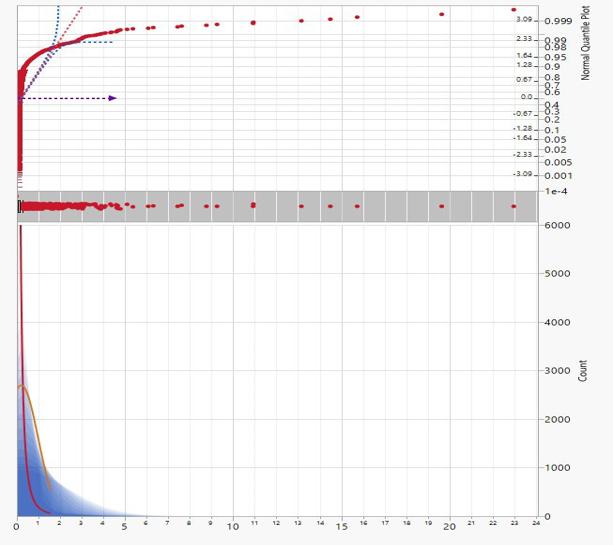
Figure 58 - Shadowgram, Outlier Box Plot, and Normal Quantile Plot. Source: JAO 2025.
According to the statistical data, JAO defined a capped gold value for Esperanza of 2 ppm Au.
| 14.4.2 | Assay Compositing |
José Antonio Olmedo MSc, P. Eng. Geo, QP, SME Registered Member (JAO) created a new composite database from the raw assay data after conducting a statistical interval analysis of the entire dataset (Figure 60). The mean from the analysis, 1.626 meters (Figure 60), indicates that a 2-meter composite is appropriate for balanced support. The final composite dataset was produced using Leapfrog Geo software.
120
NI 43-101 Technical Report – Cerro Prieto Project
The global effect of the compositing assays database had a negligible impact on the total length and resulted in a lower mean Au grade. A decrease in variance and the coefficient of variation (CV) is a natural consequence of compositing (Table 78).
The composite dataset was used in the estimators, which were then employed for the block model evaluation and resource estimation.
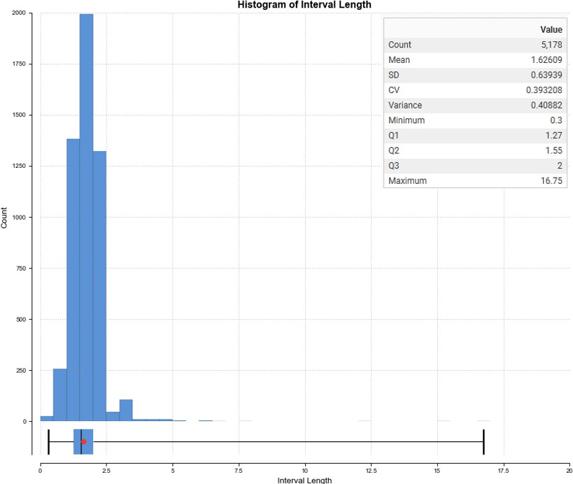
Figure 59 - Statistical analysis of the length interval of raw assays (zoomed from 0 to 20 meters). Source: JAO 2025.
Table 78 - Statistics Summary for raw assays and composite datasets. Source: JAO 2025.
| Count | Length | Mean | Std Deviation |
CV | Variance | Min | Lower Quartile |
Median | Upper Quartile |
Max | |
| Raw Au Assay (ppm) | 5178 | 8419.88 | 0.178 | 0.66 | 3.71 | 0.43910 | 0.01 | 0.02 | 0.0400 | 0.120 | 22.97 |
| 2-m Composite Au Assay (ppm) | 4443 | 8390.40 | 0.173 | 0.59 | 3.40 | 0.34536 | 0.01 | 0.02 | 0.0475 | 0.124 | 19.64 |
121
NI 43-101 Technical Report – Cerro Prieto Project
| 14.5 | Density |
Density calculations for estimating each final block of the Esperanzas Deposit were completed using a 3D density model. This model was constructed from drilling data containing 102 density measurements across 40 drill holes. The lower density boundary for the final Density 3D model was established as the minimum density value recorded in the drilling database (2.09005 g/cm³).
Since not all drill holes were measured and evaluated for density values, several holes are missing density data (Figure 61).
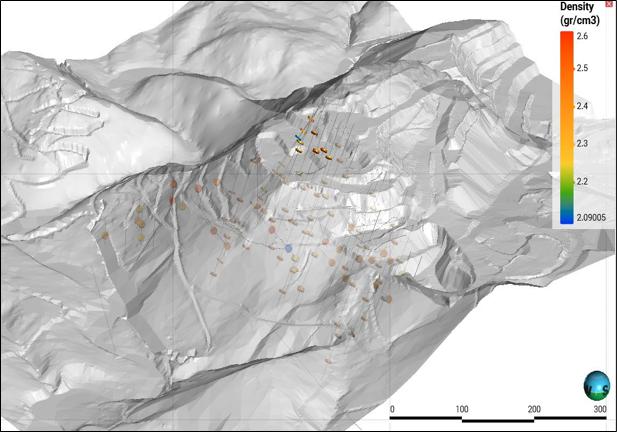
Figure 60 - Esperanzas Deposit drill holes display the measured samples for density. The density values are presented on a color scale in the upper right corner of the figure. Source: JAO 2025.
The final 3D density model was smaller than the final Au interpolated block model (Figure 62). To assign a density value to all blocks outside the interpolated density model (Figure 63), a formula states that if an evaluated block is outside the density 3D model, it will adopt the minimum density value (2.09005 g/cm³).
The block model was evaluated against the density model, and each block was assigned an interpolated density value. When interpolation values were unavailable, the minimum density value was assigned instead.
122
NI 43-101 Technical Report – Cerro Prieto Project
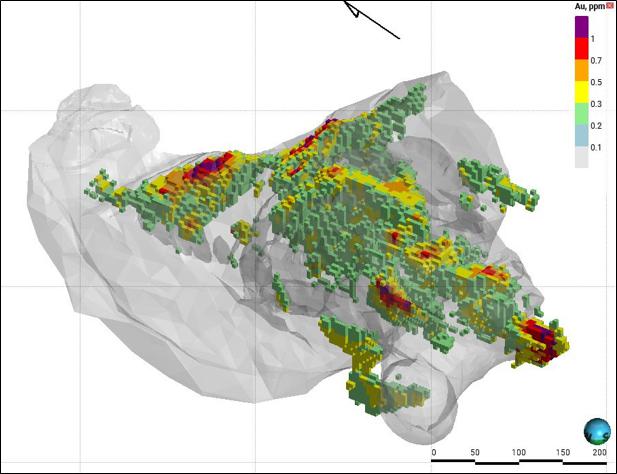
Figure 61 - The final interpolated Au block model is enclosed within the 3D density model (gray body). Source: JAO 2025.
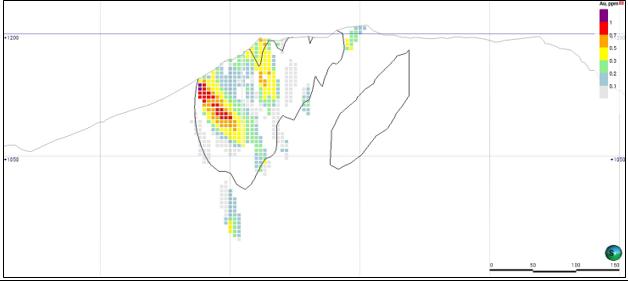
Figure 62 -This section displays the Au-interpolated block model within the 3D representation of interpolated density (black outline). For blocks outside the density-interpolated body (for example, in the mid-section area), a value of 2.09005 g/cm3 (minimum database linear value) was assigned. Source: JAO 2025.
123
NI 43-101 Technical Report – Cerro Prieto Project
Figures 64 to 66 illustrate the assigned density values for the final block model. In Figure 64, the values for all blocks outside the density model represent the minimum density value in the dataset.
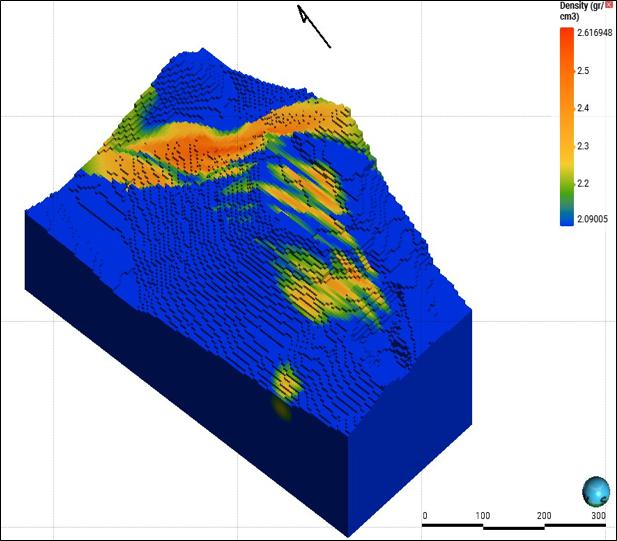
Figure 63 - The block model is evaluated against the 3D density model. The density values (in g/cm³) are displayed on the color scale. Source: JAO 2025.
124
NI 43-101 Technical Report – Cerro Prieto Project
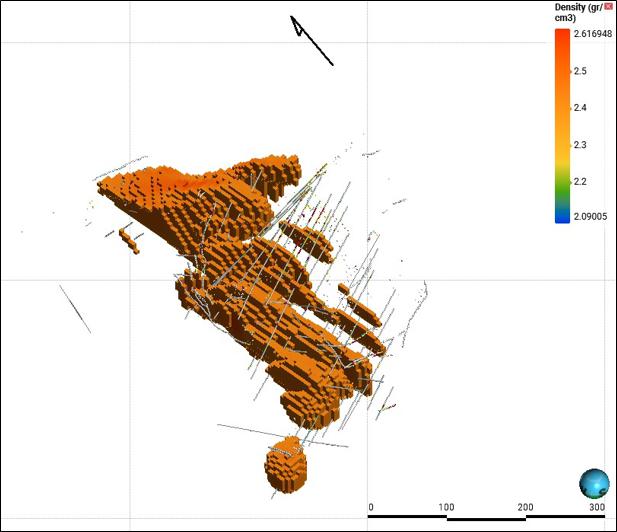
Figure 64 - Shows a block model filtered to display density values equal to or greater than the mean density value (2.41656 gr/cm3) in the dataset. Source: JAO 2025.
125
NI 43-101 Technical Report – Cerro Prieto Project
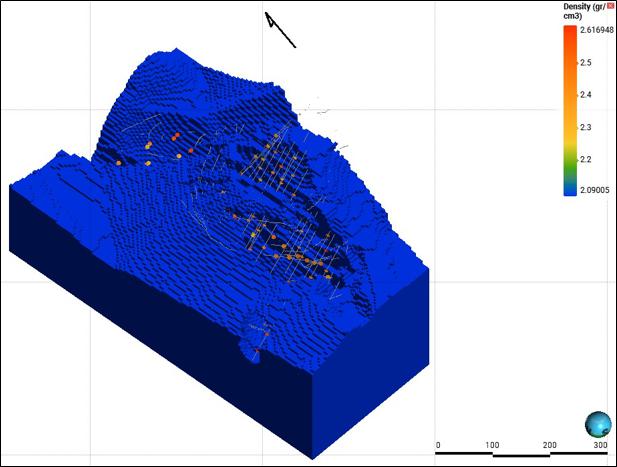
Figure 65 -The block model displays values corresponding to the minimum density value based on the dataset. Source: JAO 2025.
| 14.6 | Variogram Analysis and Modeling |
| 14.6.1 | Variography |
Variography analyzes spatial variability in grades within a region. Some metallic deposits, such as Au, exhibit high spatial variability between samples, while others, like Fe, demonstrate relatively low spatial variability. Understanding the spatial relationship of sample grades is crucial for informing block model grades. A variogram quantifies this spatial variability among samples.
Experimental variograms were calculated and modeled (Figures 68 and 69) using Leapfrog Geo's EDGE extension. The key aspects of the variography analysis in Esperanza are as follows:
| § | Experimental variograms were calculated from the Au-capped (Section 14.4.1) and 2 m composite (Section 14.4.2) databases. |
| § | Downhole and directional variograms have been created. |
| § | Variogram orientations showcased distinct strike, dip, and thickness trends throughout the data. |
126
NI 43-101 Technical Report – Cerro Prieto Project
| § | A transformed variogram (Figure 67) was created for use in the Kriging estimator during the estimation process (see Section 14.7). This variogram was modelled with two structures: Structure 1 as Exponential and Structure 2 as Spheroidal. This adjustment allows the experimental variogram to correspond with the observed variability in sample pairs. Both structures are well-suited for variables with high spatial variability, such as Au deposits, and a nugget effect value was incorporated into the variogram values. |
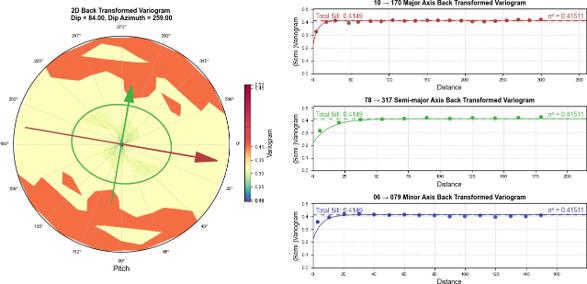
Figure 66 - illustrates the transformed variogram for Au, highlighting the major, semi-major, and minor axes. Source: JAO 2025.
The transformed variogram uses transformed Au values to model the data in Gaussian space. Transformed data cannot be applied directly in estimations; however, it is transformed solely to fit the variogram model.
After fitting the variogram model in transformed space, it is essential to back-transform it before applying Kriging to the original data space.
Figure 68 illustrates a Hermite fit graph that compares the original data to the back-transformed data to assess the outcomes. The Hermite polynomial model represents the transformation between raw (original) values and Gaussian (transformed) values.
127
NI 43-101 Technical Report – Cerro Prieto Project
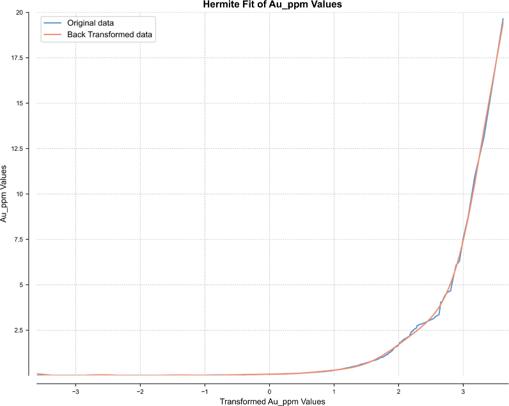
Figure 67 - A Hermite Fit Graph Displays Back-Transformed Data in Red and the Original Linear (raw) Data in Blue. Source: JAO 2025.
| 14.7 | Block Model and Estimation Methodology |
Using Leapfrog Geo and the Edge extension (Version 2024.1), a rotated, non-sub blocked block model was developed for the Esperanzas Deposit and evaluated against the estimators, density calculations, classifications, and domain models. The characteristics of block models include:
Basepoint UTMZ12 NAD27 Mx (E, N, Elev): 532495, 3366460, 1310
Block dimensions in meters (X, Y, Z): 5, 5, 5.
Number of blocks (X, Y, Z): 86 × 143 × 82 = 1,008,436
Rotation: Azimuth 345°, Dip 0°, Pitch 0° Attributes:
Density: Calculated density from the 3D density model
Class: Resource classification (Meas/Ind/Inf)
Au OKrg: Estimated Au block value (Ordinary Kriging)
NS: Number of samples used to assess the block
NDh: The number of drill holes used to evaluate the block
128
NI 43-101 Technical Report – Cerro Prieto Project
Two estimators were used at Esperanzas Deposit: Ordinary Kriging and Inverse Distance Weighting (cubed). Because the mineralized structure exhibits multi-directional and multi-dipping behavior, a variable orientation structure was applied to both estimators. A transformed variogram (Figure 69) was utilized for Ordinary Kriging. A capping value of 2 ppm Au was assigned to the estimators (see Section 2.4). The estimator applied in the final resource estimation statement was Ordinary Kriging; the Inverse Distance Weighted estimator was used solely for block model validation.
| 14.8 | Model Validation |
The validation involved visualizing the input data against geological and structural interpretation (Figure 69) and analyzing the block model’s grade across plan and cross sections. It also assessed the distribution of recorded estimation controls, including the average sample distance, number of contributing samples, and number of contributing drill holes.
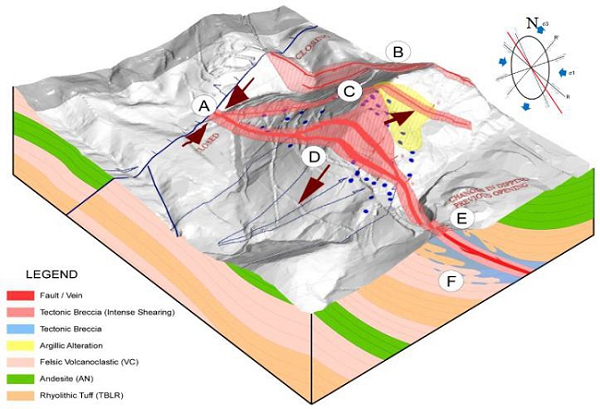
Figure 68 - Geological Interpretation of the Esperanzas Deposit. A) Fault Core Compression; B) Puma Imbricated Thrust – Ramp; C) Nueva Esperanza Imbricated Thrust-Fault; D) Esperanza Tensile Opening in Trans-Tensional Wedge (Soft Boundary); E) Fault Core Compression and Riedels; F) Splay Fracturing along Compression Edges. Source: JAO 2025.
A thorough validation was conducted for the block model of the Esperanza deposit, which included a detailed assessment of Ordinary Kriging and Inverse Distance Weighted estimations. This evaluation involved both 3D interactive analysis and statistical analysis.
| 14.8.1 | Visual Validation |
Estimated block and drill hole composite grades were visually compared in plan and section views (Figures 70 to 73), which demonstrated a strong correlation.
129
NI 43-101 Technical Report – Cerro Prieto Project
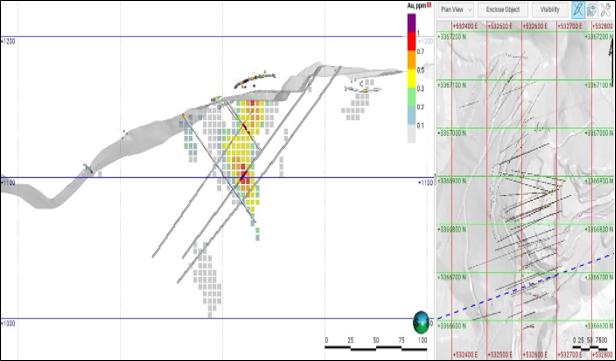
Figure 69 - Section View (left) and Plan View (right) at the Esperanzas Deposit (Drill Holes Display 2-meter Composite Samples; the Au ppm Color Scale Applies to Both the Block Model and Drill Holes). Source: JAO 2025.
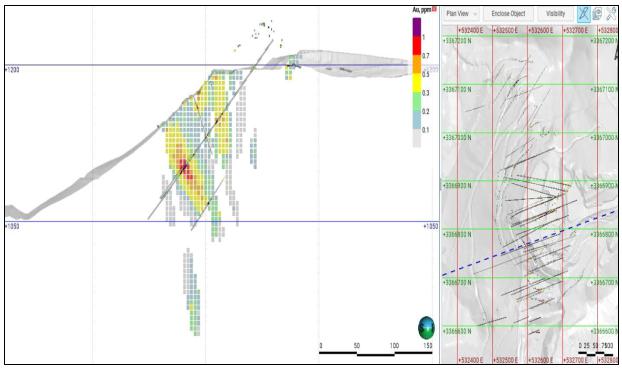
Figure 70 - Section View (Left) and Plan View (Right) of the Esperanzas Deposit (Drill Holes Displaying 2-meter Composite Samples; the Au ppm Color Scale Applies to Both the Block Model and the Drill Holes). Source: JAO 2025.
130
NI 43-101 Technical Report – Cerro Prieto Project
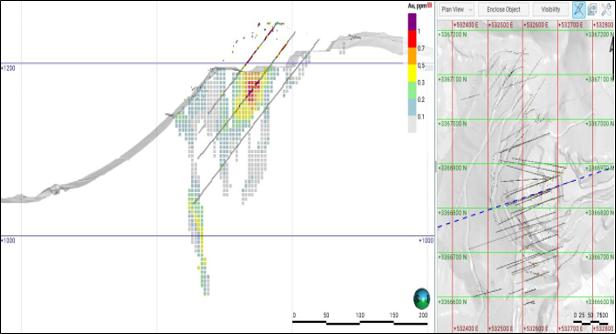
Figure 71 - Section View (Left) and Plan View (Right) of the Esperanzas Deposit (Drill Holes Indicate 2-meter Composite Samples; the Au ppm Color Scale Applies to Both the Block Model and Drill Holes). Source: JAO 2025.
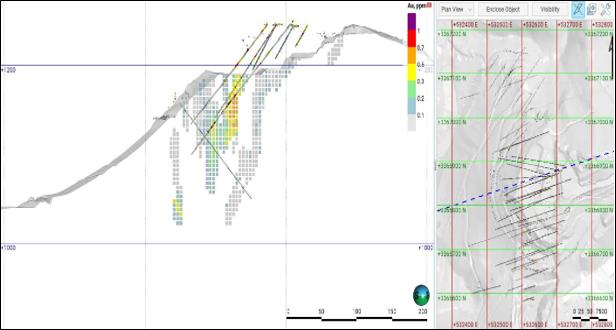
Figure 72 - Section View (Left) and Plan View (Right) of the Esperanzas Deposit (Drill Holes Indicate 2-meter Composite Samples; the Au ppm Color Scale Applies to Both the Block Model and Drill Holes). Source JAO 2025.
| 14.8.2 | Global Bias |
Technical bias refers to the difference between the averages of repeated samples and the true value. Therefore, an accurate representation of grades must align with statistical parameters such as the mean, mode, median, and other metrics derived from the input data. Additionally, the variance value should be lower than that of the samples or composites.
131
NI 43-101 Technical Report – Cerro Prieto Project
In the Esperanzas Block Model, the quality of the resource grades closely matches the average grades of the composite drill holes, as illustrated in Figure 74 and analyzed with Python. This is essential for building confidence in estimating mineral resources.
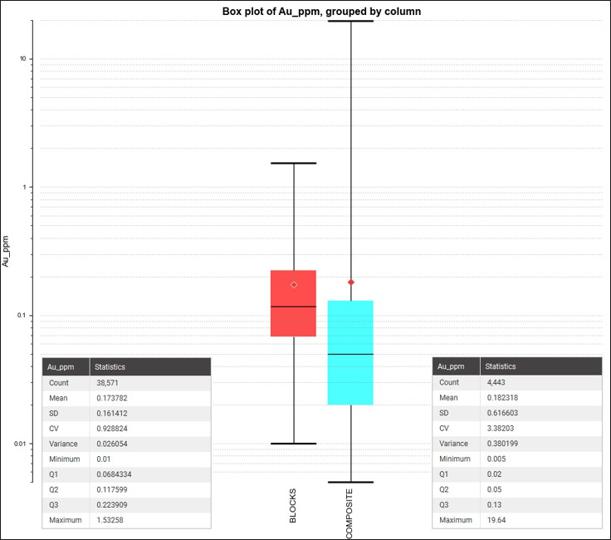
Figure 73 - Box Plots Comparing the Statistical Values of Block Values and Drill Composites. Source: JAO 2025.
132
NI 43-101 Technical Report – Cerro Prieto Project
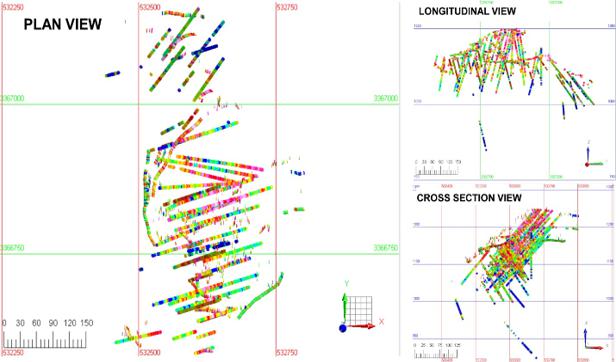
Figure 74 - Drill Composites: Plan View, Longitudinal View (Looking East), and Cross Section View (Looking North). Source: JAO 2025.
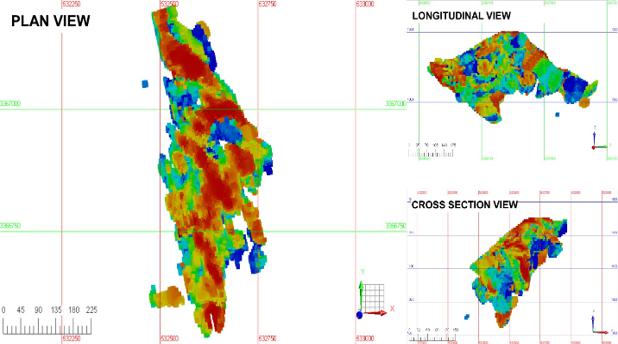
Figure 75 - Block Models: Plan View, Longitudinal View (Looking East), and Cross-Section View (Looking North). Source JAO 2025.
133
NI 43-101 Technical Report – Cerro Prieto Project
| 14.8.3 | Swath Plots |
Swath plots compare the distribution of block grades along coordinate lines and elevation, visualizing data trends for easting, northing, and elevation. They are critical for assessing spatial geological variability in block models. Figures 77 to 79 compare Ordinary Kriging (OKrg) with Inverse Distance Weighted (IDW3) estimators at X, Y, and Z swaths. These plots demonstrate that the estimators effectively honor the input data and trends.
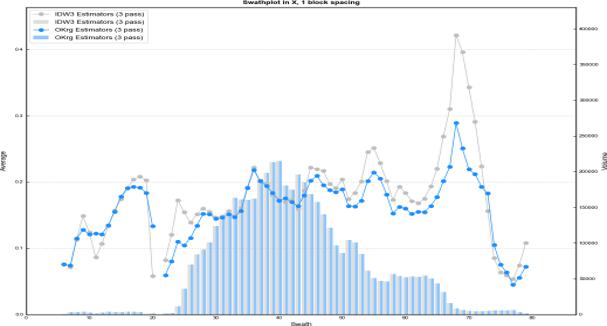
Figure 76 - Au ppm Swath Plot in X Space for OKrg and IDW3 Estimators of the Esperanza Deposit. Source: JAO 2025.
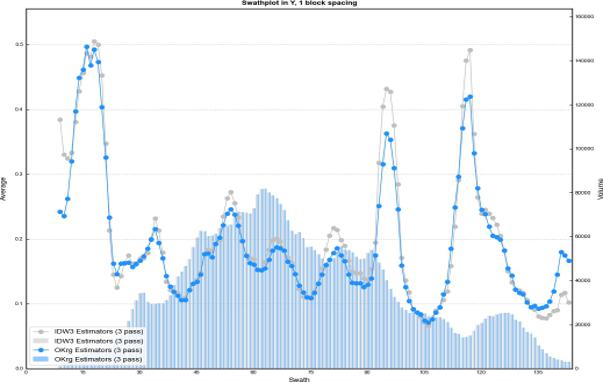
Figure 77 - Au ppm Swath Plot in Y-Space for OKrg and IDW3 Estimators of the Esperanzas Deposit. Source: JAO 2025.
134
NI 43-101 Technical Report – Cerro Prieto Project
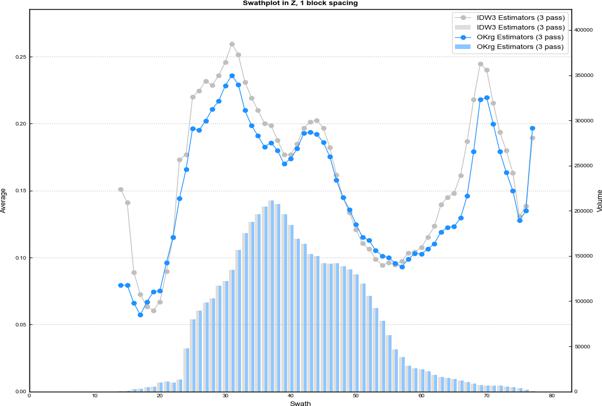
Figure 78 - Au ppm Swath Plot in Z Space for OKrg and IDW3 Estimators Regarding the Esperanzas Deposit. Source: JAO, 2025.
The estimator values are presented as lines, while block volume is presented as columns. The left and right sides of the graphs indicate a lack of blocks, so graph comparisons in those sectors are not representative.
| 14.9 | Resource Classification |
The mineral resource estimation for the Esperanzas deposit complies with the CIM Definition Standards (2014), which are as follows:
“A Mineral Resource is a concentration or occurrence of solid material of economic interest in or on the earth’s crust in such form, grade or quality and quantity that there are reasonable prospects for eventual economic extraction. The location, quantity, grade or quality, continuity and other geological characteristics of a Mineral Resource are known, estimated or interpreted from specific geological evidence and knowledge, including sampling. Material of economic interest refers to diamonds, natural solid inorganic material, or natural solid fossilized organic material including base and precious metals, coal, and industrial minerals.
The term Mineral Resource covers mineralization and natural material of intrinsic economic interest which has been identified and estimated through exploration and sampling and within which Mineral Reserves may subsequently be defined by the consideration and application of Modifying Factors. The phrase ‘reasonable prospects for eventual economic extraction’ implies a judgment by the Qualified Person in respect of the technical and economic factors likely to influence the prospect of economic extraction.
135
NI 43-101 Technical Report – Cerro Prieto Project
The Qualified Person should consider and clearly state the basis for determining that the material has reasonable prospects for eventual economic extraction. Assumptions should include estimates of cutoff grade and geological continuity at the selected cut-off, metallurgical recovery, smelter payments, commodity price or product value, mining and processing method and mining, processing and general and administrative costs. The Qualified Person should state if the assessment is based on any direct evidence and testing.
Inferred Mineral Resource an Inferred Mineral Resource is that part of a Mineral Resource for which quantity and grade or quality are estimated based on limited geological evidence and sampling. Geological evidence is sufficient to imply but not verify geological and grade or quality continuity. An Inferred Mineral Resource has a lower level of confidence than that applying to an Indicated Mineral Resource and must not be converted to a Mineral Reserve. It is reasonably expected that the majority of Inferred Mineral Resources could be upgraded to Indicated Mineral Resources with continued exploration.
Indicated Mineral Resource An Indicated Mineral Resource is that part of a Mineral Resource for which quantity, grade or quality, densities, shape, and physical characteristics are estimated with sufficient confidence to allow the application of Modifying Factors in sufficient detail to support mine planning and evaluation of the economic viability of the deposit. Geological evidence is derived from adequately detailed and reliable exploration, sampling, and testing and is sufficient to assume geological and grade or quality continuity between observation points. An Indicated Mineral Resource has a lower level of confidence than that applying to a Measured Mineral Resource and may only be converted to a Probable Mineral Reserve.
Measured Mineral Resource A Measured Mineral Resource is that part of a Mineral Resource for which quantity, grade or quality, densities, shape, and physical characteristics are estimated with confidence sufficient to allow the application of Modifying Factors to support detailed mine planning and final evaluation of the economic viability of the deposit. Geological evidence is derived from detailed and reliable exploration, sampling and testing and is sufficient to confirm geological and grade or quality continuity between points of observation. A Measured Mineral Resource has a higher level of confidence than that applying to either an Indicated Mineral Resource or an Inferred Mineral Resource. It may be converted to a Proven Mineral Reserve or to a Probable Mineral Reserve”.
The criteria used to categorize the Mineral Resources include the robustness of the input data, confidence in the structural geological interpretation, continuity of the structures and grades within the mineralized domain, distance from data, and the amount of data available for block estimation within the mineralized zone.
Confidence categories for Measured, Indicated, and Inferred Mineral Resources were developed based on factors such as distance to assays, variography ranges, geological field observations, the number of drill holes, and the number of samples used to assign values to each block, with careful adherence to the CIM (2014) categorization guidelines.
For the Esperanzas deposit, the classification of mineral resources was assigned as follows:
136
NI 43-101 Technical Report – Cerro Prieto Project
A block is considered a measured class if it falls within the solid mineralization domain, is no more than 25 meters from a sample, is evaluated using at least one drill hole, and utilizes more than five valid samples.
An indicated class is applied to a given block if it falls within the mineralization domain solid, at a distance greater than 25 meters and equal to or less than 40 meters from a sample. It is evaluated using at least one drill hole and more than five valid samples.
The inferred class applies to all blocks within the mineralization domain solid that are more than 40 meters from a sample. It was evaluated using at least one drill hole and more than five valid samples (Figure 80).
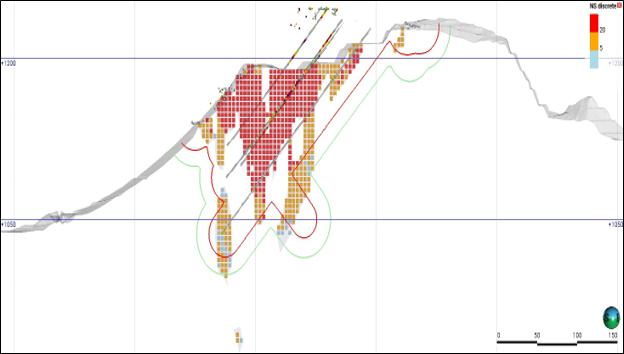
Figure 79 - The sample section shows the Esperanzas block model, indicating the number of samples used to evaluate each block (cyan 1 to 5, orange >5 to 20, and red more than 20 samples). Red and green outlines indicate the distance to samples (red = 25 m, green >25 and ≤ 40 m). The gray shadow behind the block model indicates the mineralized domain limit. Source: JAO, 2025.
| 14.10 | Mineral Resource Statement |
The Mineral Resources stated herein were estimated by José Antonio Olmedo MSc, P. Eng. Geo, QP, SME Registered Member (JAO), as defined by the Canadian Institute of Mining (CIM) Standards on Mineral Resources and Reserves, Definitions and Guidelines from the CIM Standing Committee on Reserve Definitions (2014).
Mineral resources may be affected by drilling and further exploration, which could change future mineral resource estimates.
Subsequent assessments of mining, environmental, processing, licensing, financial, social, economic, and other factors may also influence mineral resources. Mineral resources differ from mineral reserves and have not demonstrated economic viability.
137
NI 43-101 Technical Report – Cerro Prieto Project
Table 78 presents a summary of mineral resources for various cutoff grades, while a separate Table 79 displays Inferred Resources.
As the Cerro Prieto mine is currently in production, JAO is presenting the Mineral Resource Estimate for various cutoff values. Oroco can either continue with the existing operations or investigate potential changes.
Table 79 - Estimates of the Esperanzas Deposit's Measured and Indicated Mineral Resources Using Oroco’s Assays Database. Source: JAO 2025.
As of April 04, 2025
| Cut-Off Grade Au g/t |
Class | Volume
m3 |
Density g/cm3 |
Mass t |
Average Value Au g/t |
Material Content Au Oz |
| ≥ 0.100 | Measured | 2,285,000 | 2.30 | 5,265,942 | 0.270 | 45,251 |
| Indicated | 314,125 | 2.24 | 702,723 | 0.220 | 5,036 | |
| Measured + Indicated | 2,599,125 | 2.30 | 5,968,665 | 0.260 | 50,288 | |
| ≥ 0.150 | Measured | 1,653,750 | 2.32 | 3,830,444 | 0.320 | 39,564 |
| Indicated | 191,625 | 2.26 | 433,914 | 0.290 | 3,984 | |
| Measured + Indicated | 1,845,375 | 2.31 | 4,264,358 | 0.320 | 43,548 | |
| ≥ 0.200 | Measured | 1,212,375 | 2.33 | 2,826,313 | 0.370 | 33,954 |
| Indicated | 133,750 | 2.26 | 302,530 | 0.330 | 3,255 | |
| Measured + Indicated | 1,346,125 | 2.32 | 3,128,843 | 0.370 | 37,209 | |
| ≥ 0.300 | Measured | 656,750 | 2.35 | 1,544,070 | 0.480 | 23,866 |
| Indicated | 54,375 | 2.24 | 121,995 | 0.480 | 1,863 | |
| Measured + Indicated | 711,125 | 2.34 | 1,666,064 | 0.480 | 25,729 | |
| ≥ 0.500 | Measured | 219,625 | 2.39 | 523,935 | 0.670 | 11,340 |
| Indicated | 14,875 | 2.22 | 32,995 | 0.760 | 808 | |
| Measured + Indicated | 234,500 | 2.37 | 556,930 | 0.680 | 12,148 | |
| ≥ 0.700 | Measured | 73,625 | 2.40 | 176,572 | 0.860 | 4,881 |
| Indicated | 9,250 | 2.16 | 19,948 | 0.890 | 572 | |
| Measured + Indicated | 82,875 | 2.37 | 196,520 | 0.860 | 5,453 | |
| ≥ 1.000 | Measured | 14,375 | 2.38 | 34,216 | 1.100 | 1,211 |
| Indicated | 3,000 | 2.10 | 6,306 | 1.100 | 224 | |
| Measured + Indicated | 17,375 | 2.33 | 40,521 | 1.100 | 1,435 |
Table 80 - Estimates of the Esperanzas Deposit’s Inferred Mineral Resources Using Oroco’s Assays Database. Source: JAO 2025.
| As of April 04, 2025 | |||||
| Cut-off Grade Au g/t |
Volume
m3 |
Density
g/cm3 |
Mass tonne |
Average Value Au g/t |
Material Content Au Oz |
| ≥ 0.100 | 133,500 | 2.16 | 288,421 | 0.240 | 2,214 |
| ≥ 0.150 | 84,500 | 2.17 | 183,783 | 0.300 | 1,798 |
| ≥ 0.200 | 60,750 | 2.17 | 131,536 | 0.360 | 1,504 |
| ≥ 0.300 | 29,500 | 2.13 | 62,958 | 0.480 | 968 |
| ≥ 0.500 | 8,000 | 2.10 | 16,767 | 0.810 | 438 |
| ≥ 0.700 | 5,625 | 2.09 | 11,772 | 0.900 | 342 |
| ≥ 1.000 | 2,250 | 2.09 | 4,706 | 1.090 | 165 |
| Differences May Occur in Total Due to Rounding | |||||
José Antonio Olmedo MSc, P. Eng. Geo, QP, SME Registered Member (JAO) stated that the Inferred Mineral Resources for the Esperanzas deposit, above the cutoff grade of 0.2 Au g/t within the mineralized domain, amount to 131,536 tonnes at 0.36 Au g/t.
138
NI 43-101 Technical Report – Cerro Prieto Project
JAO stated that the current operational cut-off grade for the Esperanzas deposit is 0.20 g/t Au. This value represents the economic limit used in the ongoing open-pit mining operation. The cut-off grade reflects current mining and processing practices and was determined by considering the actual mining method, metallurgical recovery, operating costs, metal prices, and the overall economic performance of the operation. The cut-off grade was calculated using the following general formula:
| Cut-off (g/t) = | Total Cost (US$/t) | x | (Conversion Factor) |
| Gold Price (US$/oz) x Recovery (%) |
Where:
Total Cost (US$/t) = 11.76
| § | Crushing Plant: (US $/t) = 2.59 |
| § | Heap Leach (US/t) = 2.88 |
| § | ADR Plant (US $/t) = 1.56 |
| § | Indirect Costs (US $/t) = 1.27 |
| § | Administration Costs (US $/t) = 1.12 |
| § | Average Mining Cost (US/t) = 2.29 |
Gold Price (US $/Oz) = 2,400
Recovery (%) = 72
Overall Slope Angles = 44°
Calculation:
| Au Cut-off (g/t) = | 11.71 (US$/t) | x | (31.1035) = 0.2117 g/t |
| 2,400 (US$/oz) x 71 (%) |
The cut-off grade was rounded up to 0.2 g/t Au. JAO has reviewed the cut-off grade calculation and confirms that the assumptions are consistent with industry practice and are considered appropriate for the current scale and configuration of the open-pit operation. The cut-off grade, therefore, provides a reasonable basis for defining material with reasonable prospects for eventual economic extraction.
For Oroco, the Base Case Scenario occurs when the cut-off equals or exceeds the 0.2 Au g/t cut-off grade. The following figures are provided below:
| § | Measured and Indicated Mineral Resources for the Esperanzas deposit exceed the cutoff grade of 0.2 Au g/t within the mineralized domain, totaling 3.13 million tons at 0.370 Au g/t. |
| § | The Inferred Mineral Resources for the Esperanzas deposit, above the cut-off grade of 0.2 Au g/t within the mineralized domain, amount to 131,536 tons at 0.36 Au g/t. |
Notes:
| § | JAO’s methodology utilized the Canadian Institute of Mining (CIM) Definition Standards for Mineral Resources and Mineral Reserves, published by the CIM MRMR Committee on May 19, 2014, along with the CIM Estimation of Mineral Resources and Mineral Reserves: Best Practice Guidelines, published by the CIM MRMR Committee on November 29, 2019. |
139
NI 43-101 Technical Report – Cerro Prieto Project
| § | Errors in the totals result from rounding. |
| § | The Mineral Resource was modeled using a licensed copy of Seequent’s Leapfrog Geo® software and the EDGE extension. |
| § | Only gold (Au) values are considered here. The metallurgical-qualified person for Oroco will determine whether Silver (Ag) values should be included; if so, the author will immediately consider them in the final Mineral Resource Statement. |
| § | The author developed a new structural model for shearing and lateral displacement. |
| § | A 3D grade-shell interpolation was matched with the structural model to increase confidence and accuracy. |
| § | An external dilution factor was not considered during this resource estimation. Internal dilution within 5 m x 5 m x 5 m has been included in this estimation. |
| § | This estimate assumes 100% mining recovery. |
| § | Quantities and grades in a mineral resource estimate are rounded to an appropriate number of significant figures to reflect their approximations. |
| § | Mineral resources are not mineral reserves as they have not yet demonstrated economic viability. |
| § | All data used to elaborate on this report was provided to Oroco in separate files. |
For Oroco, the Base Case Scenario occurs when the cutoff equals or exceeds the 0.2 Au g/t cutoff grade. The following figures are provided below:
Measured and Indicated Mineral Resources for the Esperanzas deposit exceed the cutoff grade of 0.2 Au g/t within the mineralized domain, totaling 3.13 million tons at 0.370 Au g/t.
The Inferred Mineral Resources for the Esperanzas deposit, above the cut-off grade of 0.2 Au g/t within the mineralized domain, amount to 131,536 tons at 0.36 Au g/t.
Cristian Garcia, P. Eng., QP, Registered at Engineers and Geoscientists of British Columbia an independent mining consultant used the block model presented herein to estimate the extractable mining resources for further open-pit optimization.
José Antonio Olmedo MSc, P. Eng. Geo, QP, SME Registered Member, an independent consultant, elaborated and validated his resource estimation methodology on April 04, 2025.
| 14.11 | Mineral Resource Sensitivity |
Mineral resources are sensitive to constraints from pit shells, dilution, and other modifying factors and are thus excluded from this report.
Figure 81 depicts the Block Model Au Grade and Tonnage Graph and illustrates how sensitive the Esperanzas Mineral Resource Estimate is to changes in the Au cut-off grade.
140
NI 43-101 Technical Report – Cerro Prieto Project
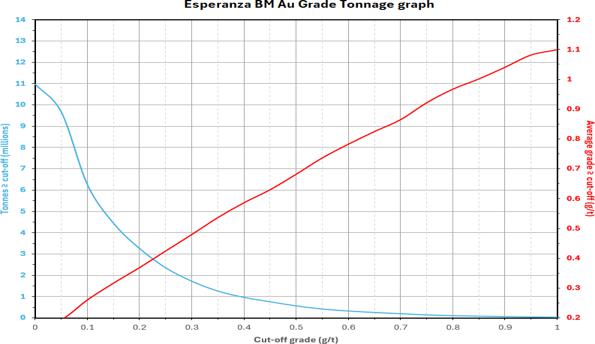
Figure 80 - Esperanzas Block Model Au Grade and Tonnage Graph. Sensitivity of the Esperanzas Mineral Resource Estimate to variations in the Au cutoff grade. Source: JAO 2025.
| 14.12 | Constraints (Factors) that may Affect the Mineral Resource Estimate |
The classification of the Esperanzas Mineral Resources considers several risk factors during implementation. These risk factors include sample representativeness, the use of non-accredited analytical laboratories, the lack of accuracy and quality controls (QA/QC), sample distribution, risks related to structural geology and geological continuity, spacing and volume continuity risks, and assessment risks inherent in the available drilling and sampling information.
Aside from what is detailed in this report and to the author’s knowledge, he is not aware of any other environmental, permitting, legal, tax, socioeconomic, or political factors that could materially impact this mineral resource estimate.
| 14.13 | Conclusions |
José Antonio Olmedo MSc, P. Eng. Geo, QP, SME Registered Member (JAO) stated that the methodology and geological knowledge of the deposit support the Mineral Resource Estimation conducted at the Esperanzas Deposit of Oroco. The software and products derived are reliable per international standards for industry best practices.
Further exploration may enhance analytical assay data, QA/QC processes, and density; consequently, resource classification and structural model applications may be updated. However, the overall geological interpretation does not anticipate any significant changes.
141
NI 43-101 Technical Report – Cerro Prieto Project
| 14.14 | Recommendations |
JAO concurs with the overall direction of Oroco’s exploration and development program for the property and offers the following additional recommendations:
| § | Create markers for drill hole locations. |
| § | Improve the database and data management system to increase the data integrity, flow, use, and management of all information related to the Project. |
| § | To estimate resources more precisely, a more exact topographic surface with a minimum resolution of 50cm per pixel is strongly recommended. |
| § | Reconstruct the core warehouse, including the entire ceiling, side protection walls, security door, and cleaning maintenance. |
| § | Keep at least ¼ of the mineralized intercepts in core boxes. |
| § | Keep coarse and pulp rejects separate from local and ALS rejects. |
| § | Use an accredited and certified geochemistry lab to analyze all mineralized intervals for gold included in Oroco’s database. |
| § | Conduct quality assurance and quality control (QA/QC) procedures as stated in CIM Exploration Best Practice Guidelines. |
| § | JAO recommends that Oroco submit lab duplicates of pulp or coarse rejects instead of field duplicates in further exploration programs. |
| § | The author recommends submitting at least 5% of coarse sample or pulp lab rejects to a certified laboratory other than local or ALS, as umpire assays periodically during drilling programs to corroborate ALS lab precision, identify any potential issues immediately, and apply corrective action. |
| § | During future core drilling programs, implement a systematic approach to measuring and recording specific gravity (SG) throughout the drilled section. |
| § | Conduct an open pit optimization study to estimate the mineral resources contained within Oroco’s designed pit envelope. |
| § | Conduct geotechnical studies to ensure the mine stability. |
| § | The exploration work on the Property, along with the initial Mineral Resource estimate at the Esperanzas target area and the numerous historical mines and workings, supports continued exploration at several target areas on the Property, including Reyna, Cascabel, Cata, Coatí, Zona Sur, and Socorro deposits. |
142
NI 43-101 Technical Report – Cerro Prieto Project
| 15.0 | MINERAL RESERVE ESTIMATES |
José Antonio Olmedo MSc, P. Eng. Geo, QP, SME Registered Member prepared this section of the Technical Report and stated that the mineral reserve estimates is not part of this Technical Report of Mineral Resource of the Esperanzas Deposit inside the Cerro Prieto Project, since Minas de Oroco S.A de C.V., has not prepared a pre-feasibility or feasibility study for the Cerro Prieto Project to convert mineral resource into mineral reserve.
143
NI 43-101 Technical Report – Cerro Prieto Project
| 16.0 | MINING METHOD |
| 16.1 | Overview |
This section of the Technical Report was prepared by Cristian Garcia, P. Eng., QP, Registered at Engineers and Geoscientists of British Columbia an independent consultant. The Cerro Prieto project is an operating hard-rock open pit mine in the State of Sonora, Mexico. Ore production to the crusher has a planned maximum capacity of 4,200 tpd (1,643 kt/yr). The mine’s production schedule was developed to fill the crusher and maximize the project's return on investment (ROI). The total material mining rate varies with equipment productivity and changes over time, reaching a peak of 370,000 tonnes per month. The mine operates continuously, 7 days a week, with two 12-hour shifts each day, employing two local mining contractors.
| 16.2 | Open Pit Mine Design |
The design process has yielded a single-phase mining operation. The design ensures a steady ore feed to the mill, eliminating the need for significant stockpiling activities over the mine operations short life. This approach reduces the overall land use of the operation and confines rehandle costs to those associated with the run-of-mine (ROM) crusher stockpile. This section of the report will detail the design criteria used in the pit design process.
| 16.3 | Key Design Criteria |
The mine design incorporated typical parameters for a conventional truck and shovel operation, along with geotechnical recommendations from the Cerro Prieto operations team. The resulting mine design criteria are presented in Table 80.
Table 81 - Key Design Criteria
| Parameters | Units | Value |
| Ramp Width | m | 12 |
| Maximum Ramp Grade | % | 10 |
| Minimum Mining Width | m | 50 |
| Bench Face Angle | degrees | 62 |
| Bench Height | m | 6 |
| Bench Berm Spacing | # | 2 |
| Berm Width | m | 5 |
| 16.4 | Geotechnical Considerations |
The calculation of inter-ramp and overall slope angles were based on a variety of input values, as outlined in Table 76. The result of the pit slope calculation was an inter-ramp angle (IRA) of 47 degrees, and an overall slope angle (OSA) of 42 degrees.
| 16.5 | Haul Roads |
Haul roads have been engineered to support a fleet of 100-ton haul trucks. The ramps, with a width of 12 meters, are designed to facilitate two-lane traffic, a safety berm, and drainage ditches. The ramps feature a maximum gradient of 10% and a rolling resistance of 2%.
144
NI 43-101 Technical Report – Cerro Prieto Project
| 16.3 | Pit Optimization |
The preliminary pits for detailed design were established using GEOVIA's Whittle optimization software. This software utilized various technical and cost parameters outlined in section 16.3.1 to produce a set of nested "Revenue Factor" shells.
| 16.3.1 | Optimization Parameters |
The GEOVIA Whittle™ software was utilized for pit optimization. The optimization and mining schedule included Measured, Indicated, and Inferred Mineral Resources. Mining dilution was not considered during optimization, as dilution was accounted for during the construction of the mineral resource model. The main parameters for this optimization are detailed in Table 81, with economic assumptions agreed upon by the parent company.
Table 82 - Optimization Parameters
| Technical and Economic Parameters Cerro Prieto | |
| Description | Mineral Resources |
| Metal Prices (USD) | |
| Gold ($/Oz) | 2,400 |
| Metallurgical Recoveries | |
| Gold | 72% |
| Processing Cost (USD) | |
| Crushing | 2.59 |
| Leach | 2.88 |
| Plant | 1.56 |
| Indirect | 1.27 |
| Administration | 1.12 |
| Total Process | 9.42 |
| Mining Cost (USD) | |
| Mining Cost (average) | 2.29 |
| Geotechnical (degrees) | |
| Overall Slope Angles | 44 |
| 16.3.2 | Whittle Pit Selection |
Using following parameters:
| § | The parameters above |
| § | The block model |
| § | A starting topography from November 2024 |
A series of ‘Revenue Factor’ (RF) pits were produced by adjusting the block gross revenue with a unitless revenue factor, which ranged from 0.1 to 1.0 in increments of 0.01. The resulting pit by pit graph is shown in Figure 82.
145
NI 43-101 Technical Report – Cerro Prieto Project
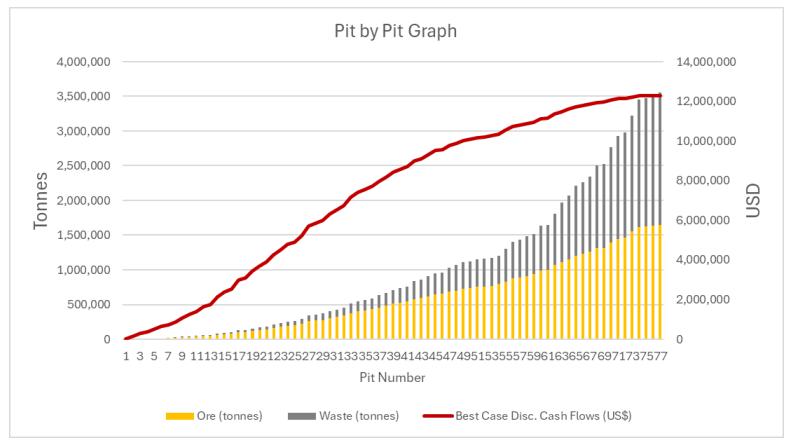
Figure 81 - Pit by Pit Graph
From this graph, the pit shell that corresponded to a revenue factor of 1.00 was selected for the detailed pit design phase.
| 16.3.3 | Mining Loss and Dilution |
No mining dilution was considered during optimization nor the production plan because dilution has been accounted for during the construction of the resource model.
| 16.3.4 | Detailed Pit Design |
The Whittle shell used for the design included 3.5 million tonnes of total material, including 1.65 million tonnes of economic ore and 1.9 million tonnes of waste, resulting in a strip ratio of 1.15 waste to ore (W:O). Applying the mine design criteria, the ultimate pit design was designed as a single final pit with no intermediate phases. This single-phase design contains 3,709 million tonnes of material, including 1.52 million tonnes of ore and 2.18 million tonnes of waste. This provides for a strip ratio of 1.43 (W:O).
Moving from Whittle shell to detailed design shell resulted in a loss in total contained ore of 126 thousand tonnes. The decrease in ore and increase in waste is due to the addition of ramps and berms and the removal of non-operational areas at the bottom of the Whittle shells. A summary of the detailed pit shell tonnages and grades are shown in Table 82. Figure 83 and Figure 84 show cross section and plan views of the detailed design versus Whittle shell boundaries respectively.
Table 83 - Mineable Resources
| Ore (kt) |
Au (g/t) |
Waste
(kt) |
Strip
Ratio (W:O) |
Total (kt) |
| 1,566 | 0.42 | 2,143 | 1.37 | 3,709 |
146
NI 43-101 Technical Report – Cerro Prieto Project
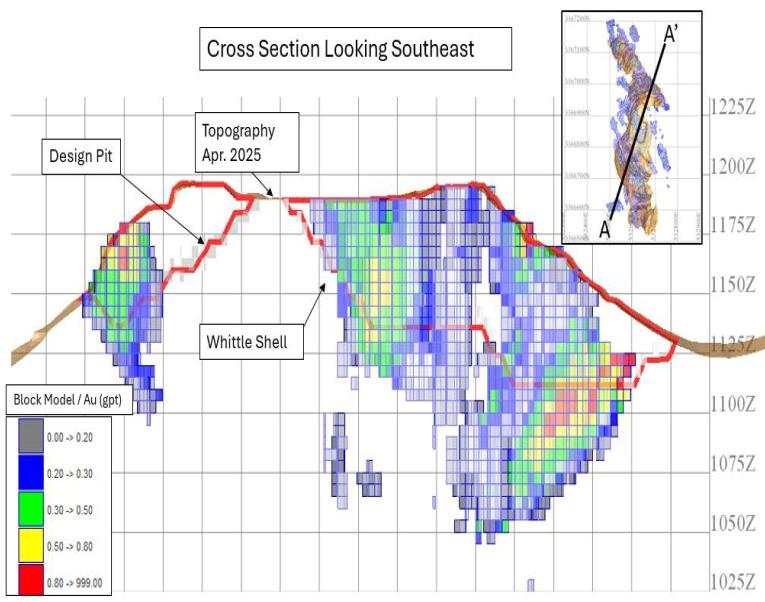
Figure 82 - Cross Section of Whittle Pit and Design Pit
147
NI 43-101 Technical Report – Cerro Prieto Project
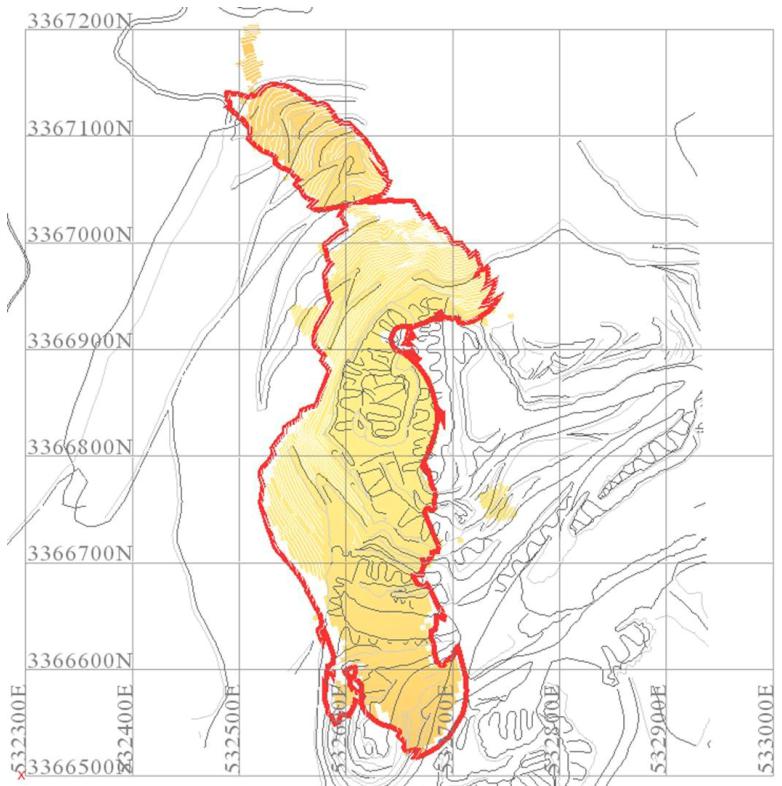
Figure 83 - Plan view of Whittle Shell (brown outline) and Detailed Design Boundary (red line)
The pit spans elevations ranging from 1112 meters above sea level to 1,195 meters, with an overall footprint of approximately 600 meters in length and 150 meters in width. For detailed spatial layouts, including toe and crest positions, refer to Figure 85 which provides a comprehensive map of the ultimate design.
148
NI 43-101 Technical Report – Cerro Prieto Project
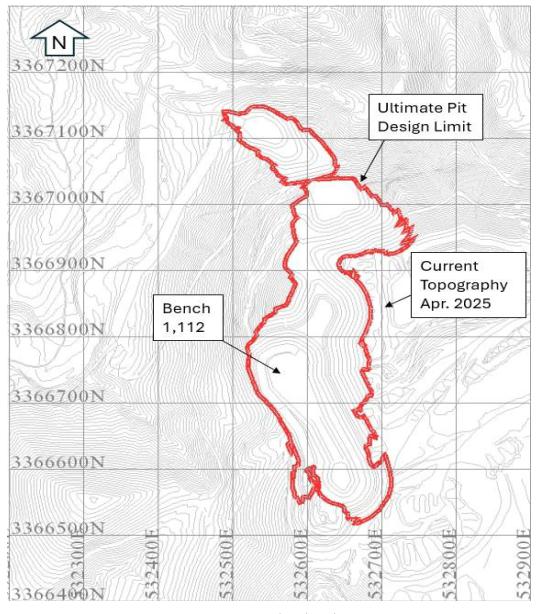
Figure 84 - Plan View of Ultimate Pit Design
| 16.3.5 | Ore Material Stockpiles |
The mine's design, as described in section 16.2.6, aligns ore extraction rates with the mill's processing capacity. This synchronization reduces the need for large, long-term ore stockpiles, thereby minimizing land use and restricting rehandling costs to those associated with the run-of-mine (ROM) stockpile. The ROM stockpile will be used to ensure a steady ore feed daily. For cost modelling, it is assumed that 3% of material movement will involve rehandling to account for an operational stockpile near the crusher.
149
NI 43-101 Technical Report – Cerro Prieto Project
| 16.3.6 | Waste Rock Storage Facilities |
The waste rock storage areas have been designed to accommodate the waste rock produced during the mine’s operational life. The facility is near its associated pit, to reduce waste haulage distance and cost.
| 16.4 | Production Schedule |
A monthly production plan was established from this single mining phase, using a fixed cut-off grade of 0.2 g/t (cut-off grade optimization was not considered). An opportunity has been identified to bring forward a pocket of high-grade ore from a small pit north of the deposit. It should be evaluated to determine the economic impact. The table below shows the monthly production plan.
Table 84 - Production Plan Details
| Mine Life (Month & Year) |
| Mining | Units | Qty | 4/25 | 5/25 | 6/25 | 7/25 | 8/25 | 9/25 | 10/25 | 11/25 | 12/25 | 01/26 | 02/26 | 03/26 | 04/26 |
| Total Material Moved | kt | 3,709 | 467 | 355 | 284 | 264 | 270 | 296 | 331 | 360 | 360 | 343 | 204 | 161 | 14 |
| Waste | kt | 2,184 | 341 | 229 | 158 | 138 | 144 | 170 | 205 | 234 | 234 | 217 | 78 | 35 | 2 |
| Processing | |||||||||||||||
| Total Ore Processed | kt | 1,524 | 126 | 126 | 126 | 126 | 126 | 126 | 126 | 126 | 126 | 126 | 126 | 126 | 12 |
| Au Grade | g/t | 0.43 | 0.37 | 0.39 | 0.42 | 0.44 | 0.45 | 0.43 | 0.41 | 0.40 | 0.40 | 0.43 | 0.54 | 0.48 | 0.35 |
| Au Recovery | % | 72 | 72 | 72 | 72 | 72 | 72 | 72 | 72 | 72 | 72 | 72 | 72 | 72 | 72 |
| Metal Recovery | |||||||||||||||
| Gold | Koz | 15.1 | 1.1 | 1.1 | 1.2 | 1.3 | 1.3 | 1.2 | 1.2 | 1.2 | 1.2 | 1.3 | 1.6 | 1.4 | 0.1 |
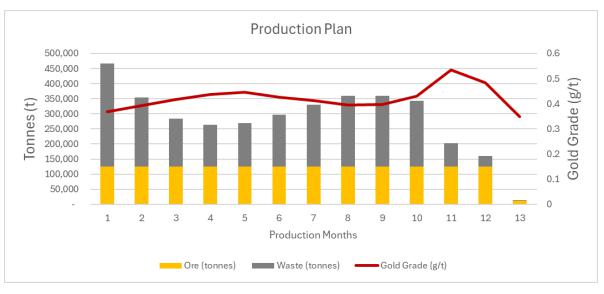
Figure 85 - Production Plan
| 16.5 | Mine Operations and Equipment Selection |
For this study, equipment selection was made based on equipment class, rather than specific models from major vendors. The chosen equipment is detailed in the loading, hauling, drilling, and auxiliary equipment sections. A straightforward time usage model with three key performance indicators (KPIs) was employed for all fleets. As depicted in Figure 88, the time usage model uses Physical Availability (PA), Utilization (UA), and
150
NI 43-101 Technical Report – Cerro Prieto Project
Efficiency (EF) to determine each fleet's productive time as a ratio of total calendar time. The production plan is based on a 365-day operating calendar.
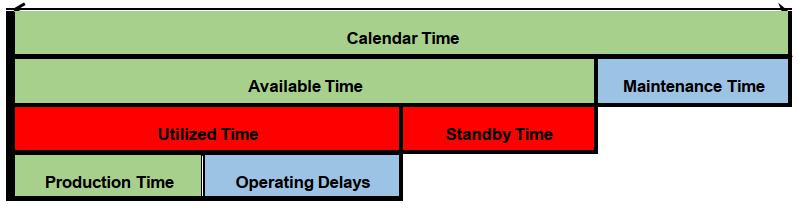
Figure 86 - Time Usage Model
The mine operates with a contractor fleet. A summary of the equipment operating is in Table 84.
Table 85 - Production Equipment Fleet
| Max No. of Units During Life of Mine | Type | Description |
| 4 | Truck | 48 tonnes |
| 4 | Truck | 100 tonnes |
| 1 | Loader (980) | 4 cubic meters |
| 1 | Loader (988) | 5 cubic meters |
| 2 | Drills | DM 45 1 5 3/4” |
| 1 | Drill | DM50 6 ¾” |
| 2 | Dozer | D |
| 1 | Excavator | XMG 5m3 |
| 2 | Grader | 1 |
151
NI 43-101 Technical Report – Cerro Prieto Project
| 17.0 | EXISTING CERRO PRIETO RECOVERY METHODS |
Rodrigo R Carneiro MSc, QP, SME Registered Member an independent consultant prepared this section of the Technical Report using the information provided by Company personnel during the mine site visit. The recovery method of the Cerro Prieto project includes three-stage crushing process to obtain a crush size of approximately P80 of 3/4", crushed ore handling using an overland conveyor and a series of grass-hopper conveyors to a stacking system on the heap leach pad, heap leach, solution handling and precious metal recovery (Au & Ag) in the ADR plant.
| 17.1 | Ore Handling, Crushing and Screening |
The Crushing Plant is three-stage with a primary jaw, a secondary cone crusher operating in closed circuit with a screen and a tertiary cone crusher operating in closed circuit. Run-of-mine ore is delivered to the crushing plant, and the ore is fed directly to the primary crusher when possible; otherwise, the ore is stockpiled adjacent to the primary crusher.
When ore is not being mined, a front-end loader reclaims ore from the stockpile and feeds it to the primary crusher. Primary crushed ore is conveyed to a secondary cone crusher operating in closed circuit with a screen and a tertiary cone crusher operating in closed circuit. The crushing plant is depicted in Figure 88 with coordinates 1533107.853, 3364207.017 N.
Figure 87 - Plan View of the Crushing Plant Circuit, Heap Leach Area & ADR Plant. Source: Mina de Oroco 2024
| 17.2 | Crushing Plant |
The target crushing rate is 216,000 tons per month with a nominal crushing rate of 250 tph. This is equivalent to an availability of 67%.
152
NI 43-101 Technical Report – Cerro Prieto Project
| 17.3 | Sampler |
Sampling of the crushed ore is conducted every hour using an automated sampler that discharges the sample through a hopper into a metal container which already contains the final product mineral with added lime. The sample is collected by metallurgical personnel to perform analysis of the crushed ore being transported to the heap leach area.
| 17.4 | Manpower Required |
The manpower required for the existing unit operations at Cerro Prieto Mine is summarized in the following table.
Table 86 - Manpower Requirement Per Process Area
| Process Area | Position | Quantity |
General |
Plant Manager | 1 |
| Mechanics | 5 | |
| Electrical Maintenance Superintendent | 1 | |
| Electricians | 4 | |
| Training Coordinator | 1 | |
Crushing Plant |
Superintendent (Operations and | 1 |
| Operation Supervisor | 3 | |
| Maintenance Supervisor | 0 | |
| Operational Planner (Maintenance) | 1 | |
| Process Operators | 11 | |
| Heap Leaching | Operation Supervisor | 2 |
| Process Operator | 5 | |
ADR Plant |
Superintendent | 1 |
| Plant Supervisor | 2 | |
| Supervisory Assistant | 1 | |
| Maintenance | 1 | |
| Process Operator | 3 | |
| Adjutant General | 4 | |
| Refinery | Process Operator | 4 |
Analytical and Metallurgical Laboratory |
Metallurgical Engineer | 2 |
| Metallurgical Technician | 3 | |
| Laboratory Technician | 4 |
| 17.4.1 | Crushing Plant and ADR Plant: |
| § | Operators and Supervisors work on day shift from 07:00-19:00h (12h), working 8 days and off 4 days, |
153
NI 43-101 Technical Report – Cerro Prieto Project
| § | Operators and Supervisors work on night shift, from 19:00-0700h (12h), working 8 days and off 4 days, |
| § | Supervisors work on day shift from 07:00-17:00h (10h), working 5 days and off 2 days. |
| 17.4.2 | Heap Leaching: |
| § | Operators work on day shift from 07:00-19:00h (12h), working 8 days and off 4 days, |
| § | Supervisors work on day shift from 07:00-17:00h (10h), working 5 days and off 2 days. |
| 17.5 | Adsorption, Desorption and Recovery Plant (ADR Plant) |
The pregnant solution is collected on the layer of geotextile that lines base of the heaps and is pumped (~263 m3/h) through a series of ponds to the Adsorption-Desorption-Recovery Plant (ADR Plant) where the gold and silver are absorbed onto activated carbon, removed from the carbon by acid wash, and recovered using electrowinning and smelting of the precious metal precipitate into a Doré product. The capacity of the ADR plant is summarized below:
| § | Capacity to process 263 m3/h of pregnant solution with a daily utilization of 61%. |
| § | The carbon adsorption circuit has capacity of 15 metric tons of activated carbon with a daily utilization of 61% to process 159.9 m3/h of pregnant solution. |
| § | The atmospheric carbon desorption circuit has capacity of 2.5 metric tons per 30 hours, and the pressurized carbon desorption circuit has capacity of 1.0 metric tons per 12 hours for a total capacity to process 12.5 m3/h of solution with a daily utilization of approximately 58%. |
| § | The carbon regeneration circuit has a capacity to process 1.5 metric tons per day with a daily utilization of 50%. |
| § | The electrowinning circuit has a capacity to process 12.5 m3/h with a daily utilization of 58%. |
| 17.5.1 | ADR Process |
The ADR Plant is in the west side of leach pad area, and it received 262.5 m3 per hour of pregnant solution from the leaching pads and the pregnant solution is processed in the desorption, adsorption, and recovery plant (ADR Plant). The pregnant solution is pumped into the process, as a first step the solution is passed through a mesh filter that removes any impurity that may contain. Once the pregnant solution is filtered it enters the activated carbon column circuit. The pregnant solution flows through a series of fluidized bed columns in an up-flow direction.
In each one of the columns, gold and silver are deposited in the pores of activated carbon, the first one having the highest concentration of gold and silver, which decreases as the solution is passed from one column to the next one, so the last column contain a solution with a small amount of gold and after this the solution is filtered for the second time and sent to the barren solution pound where the cyanide concentration and solution pH are adjusted to 350 ppm and 10.4 units respectively and the barren solution is pumped to the heap.
154
NI 43-101 Technical Report – Cerro Prieto Project
After desorption of gold and silver from the loaded carbon, the high-grade pregnant solution is pumped to the electrowinning circuit to obtain the filtered cathode sludge which is dried then fluxed with silica, borax, fluorspar and nitre. The mix is placed in a crucible and melted in a furnace. The slag is poured into a mold and removed for further treatment. The Doré metal is poured into a mold, cooled, weighted, stamped and stored for further processing at the Metalor USA Refining Corporation.
| 17.5.2 | Historical Reagent and Power Consumptions |
The sodium cyanide consumption, lime consumption and power consumption from Year 2017 through Year 2023 are summarized in following table.
Table 87 - Historical Reagents and Power Consumptions
Year |
Consumption | ||
NaCN |
Hydrated
Lime (kg/t) |
Power (kWh) | |
| 2017 | 0.462 | 1.00 | 4,280,260 |
| 2018 | 0.469 | 1.98 | 4,311,466 |
| 2019 | 0.622 | 2.56 | 3,798,644 |
| 2020 | 0.540 | 1.78 | 3,507,494 |
| 2021 | 0.787 | 1.36 | 3,864,578 |
| 2022 | 0.441 | 2.22 | 3,210,060 |
| 2023 | 0.451 | 1.87 | 3,184,720 |
| 17.6 | Cerro Prieto Mine Smelter Terms |
The Project produces a Doré in the refinery on site and the Doré is shipped to the Metalor USA Refining Corporation (Metalor). The refinery is in the city of North Attleborough in the State of Massachusetts, USA. Metalor refines the Doré to produce saleable gold and silver. The refined gold and silver are sold by site personnel to Metalor based on an agreed price at the time of sale.
| 17.7 | Cerro Prieto Mine Heap Leach Operation |
| 17.7.1 | Design of the Facility |
The site layout is shown in Figure 88 above showing the details of the heap leach pad layout. The heap leach pad has been constructed in stages and the heap leach slopes and drains to the pregnant solution ponds.
The liner system for the heap leach pad includes a composite liner system with a lower compacted soil liner and overlying linear low-density polyethylene (“LLDPE”) geomembrane with a textured liner within the toe region for enhanced stability.
| 17.7.2 | Existing Backup Systems |
The ADR plant has a 625-KVA diesel backup generator that allows the plant to operate when there is a power outage.
155
NI 43-101 Technical Report – Cerro Prieto Project
| 17.8 | Existing Conveying and Stacking |
Hydrated lime is added to the crushed ore, and the addition rate is controlled with a valve and linked to a weightometer and the crushed ore is fed to the overland conveyor and the overland conveyor discharges to a series of portable ramp conveyors via a tripper.
The ore conveyed to the top of the leach pad where a tripper feeds the ore to a series of grasshoppers which feed the horizontal feed conveyor system, and ultimately the radial stacker where the ore is stacked in 6-meter lifts and a width of approximately 90 in a retreat manner.
| 17.8.1 | Support Equipment |
A dozer is used to:
| § | Rip the pad surface prior to stacking, |
| § | Even out irregularities in the stacked ore, |
| § | String drip tube on the pad surface. |
| 17.9 | Heap Leach Solution Management |
Barren solution from the ADR Plant and an Intermediate pumping system can be used for both primary and secondary leaching. Barren solution, which is the lowest grade, should be used preferentially for the secondary leach cycle of previously leached ore. Lower grade solution, from secondary leach cycles, is best used for the primary leach of virgin ore.
Solution application rate is 8 Lph/m2 to the top and sides of the pad, historical data shows the pregnant solution flow rate is approximately 5,500 m3/day and barren solution flow rate of 6,000 m3/day.
The pregnant solution is collected in a network of perforated pipes and is directed to pipes in the lined solution conveyance channel. The solutions then flow to either the pregnant solution pond for treatment in the ADR plant or to the operating pond for recycle to the leach pad.
Frequent sampling of the various solution streams are required to ensure that barren solution and the recycle solution are applied to the heap most effectively. Operating experience with ultimately are required to develop an effective solution management system.
| 17.9.1 | Solution Application Practice |
The distribution system for leach solution is composed of 8-inch HDPE headers branching off to 2-inch Aquamine sub-headers. The 2-inch Aquamine pipe is drilled and tapped to accommodate threaded compression fittings that connect to drip tube. The drip line is strung out using a dozer, the drip line lays in the windrow created by the dozer’s ripping tines.
The site uses a welded steel fittings with a valved, 2-inch tee and grooved 8-inch ends and the tee is threaded and accepts Aquamine stubs that are threaded on one end and grooved on the other. The welded steel fittings allow the transition from HDPE to Aquamine without the use of proprietary fittings. Cerro Prieto’s standard leach panel size is approximately 37 long by approximately 85 meters.
156
NI 43-101 Technical Report – Cerro Prieto Project
| 17.9.2 | Water Required |
The average water consumed for the site is approximately 1,000 m3 of water per day, this includes the water consumed in both the process and the mine.
157
NI 43-101 Technical Report – Cerro Prieto Project
| 18.0 | EXISTING PROJECT INFRASTRUCTURE |
Rodrigo R Carneiro MSc, QP, SME Registered Member an independent consultant prepared the information included in this section using the information provided by Company personnel during the mine site visit.
| 18.1 | Site Access |
Site access exists from the town of Magdalena de Kino, State of Sonora, in northwestern Mexico at approximately 52 kilometers from Magdalena de Kino. A paved two-lane highway of 40 kilometers, and then by a secondary gravel road, which often follows local arroyos (dry riverbeds), for an additional 12 kilometers north from the highway.
| 18.2 | Communication |
Onsite communications include wired phone service, cellular phone service and internet. The site uses radios for communication between employees.
| 18.3 | Buildings |
The buildings are plumbed with potable water and have septic service.
| 18.4 | Waste Disposal |
A contractor provides non-hazardous waste disposal service to the mine site. The non-hazardous waste is disposed of in a county landfill.
| 18.5 | Water Required and Water Supply |
Water is used for dust control during mining, dust control and make-up water to process, for construction and general site purposes. Water is produced from wells and stored in tanks. Well water can be directed to the pond without being pumped to the tanks.
The water system includes two production wells. Water is pumped from the production wells to the main water storage tank. A pump station located beside the main water storage tank supplies the crushing plant, the workshop-warehouse, the ADR plant and dust control water storage tanks.
Water from wells is used to supply all facets of the project, make-up water from the process (loss from evaporation), reagent mixing, and emergency water.
Cerro Prieto management provides bottled drinking water for employees.
| 18.6 | Power Required and Power Supply |
Electrical power is present in the town of Magdalena de Kino, and a power line runs down the paved road and along the off-road access to within five kilometers of the Project. It continues through the village of Cucurpe, which lies approximately five kilometers southeast of the access road from the highway.
The current infrastructure of the Cerro Prieto Project consists of a high voltage powerline nearby, access roads, and mining operations that are in operation. There is a 12 km gravel access road from the village of Cucurpe, located 40 km southeast of the regional hub of Magdalena de Kino, Sonora, which, in turn, is located 52 km from the Project.
The mine site is connected to the 33 kV transmission line is located 24 kilometers from the site and the electrical power line and associated switch gear provides the electrical power required at the mine site. A diesel-powered generator (625 kVA) provides emergency standby power to the ADR plant.
158
NI 43-101 Technical Report – Cerro Prieto Project
| 18.7 | Workshop Warehouse, Offices and Wash Bay |
The Workshop Warehouse serves the Mine as a maintenance facility. The workshop includes three service bays for mobile equipment; a gantry crane exists for lifting large loads.
The Wash Bay includes primary and secondary settling basins, a hot water high pressure washer and an oil-water separator. Sediments are removed as required and disposed of in an approved location.
| 18.8 | Security |
A contractor provides security for the main gate to the mine gate and the refinery. The security contractor also patrols the perimeter of the property. The mining contractor prepared a note on security requirements in Sonora, Mexico and provided a model Security Plan that can serve as a basis for a site-specific security plan.
| 18.9 | Assay Laboratory |
The site laboratory includes facilities for sample preparation, fire assay, wet and metallurgical testing. Fire assay has a capacity 180 fire assay per day with AA finish with a maximum capacity of 220 assays per day. The laboratory can also do bullion assays onsite.
| § | Month column leach tests and bottle rolls are performed in the laboratory, |
| § | Environmental samples are sent off site to a contract laboratory, |
| § | The laboratory has been constructed to meet all state and federal codes. |
159
NI 43-101 Technical Report – Cerro Prieto Project
| 19.0 | EXISTING MARKET STUDIES AND CONTRACTS |
Rodrigo R Carneiro MSc, QP, SME Registered Member an independent consultant (RRC) prepared this section of the Technical Report using the information provided by Company personnel. This section summarizes the studies, analyses, and contractual arrangements relevant to Goldgroup’s production, as reviewed and confirmed by Rodrigo R Carneiro (RRC), based on information provided by Company personnel.
Goldgroup’s approach to market analysis and contractual arrangements reflects the nature of the gold market and the operational requirements of its projects. With gold being a freely traded commodity, independent market studies are not required for the sale of gold Doré. The company’s service and supply contracts are structured to meet industry standards, supporting efficient and compliant property development and production activities.
| 19.1 | Market Studies and Commodity Price Analyses |
According to Company personnel, Goldgroup’s principal product is gold Doré. Gold bullion is a freely traded commodity with prices that are widely disseminated and established in international markets. Due to the transparent and liquid nature of the gold market, Goldgroup does not undertake independent market studies or commission third-party market analyses for the sale of gold Doré. The prospects for the sale of any gold production are considered virtually assured, given the global demand, established trading platforms, and the absence of market entry barriers specific to gold bullion.
As such, Goldgroup does not produce independent commodity price projections, product valuation studies, or detailed market entry strategies for gold Doré. The company relies on prevailing market prices, which are publicly available, and does not face product specification requirements unique to its operations, as gold Doré is a standard product in the industry.
| 19.2 | Material Contracts for Property Development and Operations |
Goldgroup has identified a range of service and supply contracts that are material to the development and ongoing operation of its Cerro Prieto Heap Leach Project. These contracts cover essential aspects of mining, processing, transportation, and support services. The material contracts include:
| § | Open pit mining services. |
| § | Explosives supply. |
| § | Fuel supply. |
| § | Camp catering and maintenance. |
| § | Doré transport and refining. |
| § | Reagents supply. |
| § | Environmental consulting services |
Company personnel have indicated that the terms, rates, and charges associated with these contracts are within industry norms. This ensures that the operational costs are competitive and in line with common practices in the mining sector. Some contracts are currently in place, while others remain under negotiation to further support ongoing and future operations.
160
NI 43-101 Technical Report – Cerro Prieto Project
| 20.0 | ENVIRONMENTAL STUDIES, PERMITTING AND COMMUNITY IMPACT |
José Antonio Olmedo MSc, P. Eng. Geo, QP, SME Registered Member prepared this section of the Technical Report, and the following summary has been prepared for the Cerro Prieto Project, located in Cucurpe, Sonora, Mexico. The information is based on documentation provided by Minas de Oroco Resources and its environmental consultants, Cambiens, S.A. de C.V., in the study “Environmental Situation,” dated June 16, 2025, signed by Eng. Jorge Alberto Martínez de Anda, and publicly available government filings. The author, acting as a Qualified Person for geology and mineral resources, is not an expert in environmental and permitting matters and relies on the work of Oroco and its environmental advisors for the content of this section.
| 20.1 | Environmental Studies and Issues |
Between 2009 and 2024, numerous environmental studies were carried out for the Cerro Prieto Project. These studies found no major environmental obstacles that would hinder mineral resource extraction within the project area.
The project is situated outside federally protected natural areas, priority terrestrial regions, and priority hydrological zones. Some of the project area overlaps with an Important Bird Area (IBA); however, this does not significantly affect mining activities.
The hydrographic setting includes an intermittent Category 4 stream, which must be considered in flood control measures and mine design. Flora and fauna in the area are widespread. Certain species of concern such as Parabuteo unicinctus (hawk), Crotalus molossus (rattlesnake), and slow growing cactimust be identified and protected under species management plans.
| 20.2 | Waste, Tailings, and Water Management |
Waste rock and tailings management plans developed by Cambiens in 2020 remain in effect. These plans include:
| § | Heap leach tailings disposal and closure rinsing procedures. |
| § | Monitoring groundwater quality with eight wells, which to date show no signs of contamination. |
| § | Placement of waste rock at stable angles of repose and monitoring for acid rock drainage. |
| § | Reforestation and slope stabilization of heap leach and waste disposal sites. |
| § | Fencing and hydrological surveys to prevent erosion and slope failures. |
Heap rinsing and neutralization of potential contaminants are planned as part of the closure. Continuous monitoring of groundwater and acid drainage is recommended.
| 20.3 | Permitting Status |
The project is subject to federal regulation by SEMARNAT and PROFEPA, which require Environmental Impact Assessments (MIA), hazardous waste handling permits, air emissions licenses, and authorizations for forest land-use changes. The project currently holds multiple approvals, including the 2011 MIA, updates from 2019 and 2020, hazardous waste generator registration, and land-use change permits. Table 86.
161
NI 43-101 Technical Report – Cerro Prieto Project
Applications for additional land use and MIA expansions have been submitted; some are still pending due to regulatory delays related to recent changes in the Ley de Minería. Compensation payments have been made where necessary, and Oroco considers these applications complete and legally supported.
Table 88 - Permitting
| Number | Topic | Issuer | Permit | Document Number(s) | Issued | Valid Thru |
| 1 | Air emissions | SEMARNAT | Stationary sources License (LAU) | DS-SG-UGA-0017/02/2022 | 17/Mar/22 | N/A |
| 2 | Environmental Impact Assessment | SEMARNAT | MIA (165 ha) | DS-SG-UGA-IA-01072-11 | 25/Nov/11 | 22/Nov/20 |
| 3 | Environmental Impact Assessment | SEMARNAT | MIA Update (114.22 ha added) | DS-SG-UGA-IA-0483-2019 | 13/Sep/19 | N/A |
| 4 | Environmental Impact Assessment | SEMARNAT | MIA Update (Project's lifetime update) | DS-SG-UGA-0309/2020 | 11/Nov/20 | 10/Nov/25 |
| 5 | Environmental Impact | SEMARNAT | MIA Update (98.250952 ha to be added) | Document not issued. Approval in progress | ||
| 6 | Hazardous Waste | SEMARNAT | Hazardous waste generator register | MOR2602200001 | N/A | |
| 7 | Hazardous waste | SEMARNAT | Hazardous Waste Handling Plan | 26-PMG-I-4590-2022 | 14/Nov/22 | 14/Nov/23 |
| 8 | Land Use (forest) | SEMARNAT | Forest land use change (CUSTF) (165 ha) | DFS/SGPA/UAARN/0265/2012 | 23/Mar/12 | N/A |
| 9 | Land Use (forest) | PROFEPA | Forest land use change exemption (CUSTF) (74.9 ha) | PFPA/32.5/2C.27.1/0182-16 | 25/Feb/16 | N/A |
| 10 | Land Use (forest) | SEMARNAT | Forest land use change (CUSTF) (98.250952 ha to be added) | Document not issued. Compensation payment is done, and approval is granted consequently. | ||
| 11 | Land Use (forest) | SEMARNAT | Forest land use change (CUSTF) for 376 ha | Study finished. Submittal in progress for expansion plans | N/A | N/A |
| 12 | Hazardous Waste | SEMARNAT | Hazardous waste generator register | MOR2602200001 | N/A | |
| 13 | Hazardous Waste | SEMARNAT | Hazardous Waste Handling Plan | 26-PMG-I-4590-2022 | 14/Nov/22 | N/A |
| 20.4 | Community Relations |
The project is situated on private ranch land with no communal (ejido) property. Landowner relations have been described as cooperative and based on mutual agreements. The absence of ejido lands simplifies community engagement and minimizes potential land-use conflicts.
162
NI 43-101 Technical Report – Cerro Prieto Project
| 20.5 | Mine Closure and Reclamation |
Planned shutdown activities consist of:
| § | Demolition and removal of mine infrastructure. |
| § | Decontamination of the ADR plant and neutralization of cyanide solutions. |
| § | Heap leach rinsing and capping with waste rock and salvaged growth material. |
| § | Pit and waste rock regrading along with slope stabilization. |
| § | Road ripping to restore hydrologic balance and prevent unauthorized access. |
| § | Well closure in accordance with Mexican standards. |
| § | Progressive reforestation and revegetation initiatives. |
The estimated cost for closure and reclamation for executing the above tasks for the mine closure and reclamation is USD 2,24 million.
| 20.6 | Reliance and Cautionary Statement |
The author of this Technical Report, José Antonio de Jesús Olmedo Vera, P.Eng. Geo., MSc., acts as the Qualified Person for geological and mineral resource matters. The author is not an expert in environmental studies, permitting, or community relations. The information in this item is based on reports and data prepared by Oroco and its environmental consultants.
The author accepts responsibility for accurately summarizing this information but does not assume responsibility for its technical accuracy or completeness. Readers are cautioned that the Qualified Person’s opinion is limited strictly to geology and mineral resource aspects of the Project, and reliance is placed on the Company and its environmental advisors for the accuracy of environmental, permitting, and social content.
163
NI 43-101 Technical Report – Cerro Prieto Project
| 21 | CAPITAL AND OPERATING COSTS |
Rodrigo R Carneiro MSc, QP, SME Registered Member (RRC) an independent consultant prepared the information included in this section of the Technical Report using the information provided by Company personnel and RRC verified the information received associated to Operation Capital and Operation Costs to prepare the capital and operating costs included in this section.
| 21.2 | Capital Costs |
All major capital for the mine and processing is scheduled to be executed from April 2025 through November 2025. The heap leach has been expanded to its final size. Future capital costs are mainly sustaining capital type expenditure like heavy equipment replacement, light duty equipment and equipment overhaul costs. The capital costs are depicted in Table 88 and Table 89 below:
Table 89 - Summary Budget 2025 Capital Costs (Crushing Plant, Heavy Equipment, Light Vehicles, Exploration, IT and Metallurgy)
Table 90 - Summary Budget 2025 Capital Costs, Continue (ADR Plant, Chemical Laboratory, Medical Service and HR, Contingency and Back UPS)
164
NI 43-101 Technical Report – Cerro Prieto Project
| 21.3 | Operating Costs |
Operating costs at the Cerro Prieto project are separated in Mining, Crushing Plant, Heap Leaching Pads, ADR Plant, General Expenses, Administration and Corporative and NSR Royalty. Each area is supporting the life of 13 months of the Esperanzas Deposit costs.
The budget operating costs is based for processing 1,748,979 tonnes of mineralized material in the crushing plant and placing and processing 1,484,979 crushed tonnes of mineralized material under leaching process from April 2025 through April 2026 are summarized in Table 90.
Table 91 - Budget Operating Costs (USD) April 2025 Through April 2026
165
NI 43-101 Technical Report – Cerro Prieto Project
| 22.0 | ECONOMIC ANALYSIS |
Rodrigo R Carneiro MSc, QP, SME Registered Member (RRC) an independent consultant prepared this section of the Technical Report.
| 22.1 | Methodology |
Tables referred to in Section 22.0 have been taken directly from the Cerro Prieto Project Cash Flow Model. The cash flow model uses data from the site’s financial model and calculates the net present value using a discounted cash flow approach. Project cash flows used are from April 1st, 2025, through to April 31, 2026, and the pre-tax cash flow analyses are presented in Section 22.5.
| 22.2 | Financial Model Parameters |
| 22.2.1 | Basic Parameters |
The base case cash flow analysis is done on a constant United States dollar, after-tax, stand-alone Project basis. Cerro Prieto is an operating mine and the only capital costs are sustaining. No debt or lease payments are considered. Refer to Section 21.2 for detailed breakdown of the capital costs. Operating costs are described in Section 21.3. The operating costs come directly from Cerro Prieto Mine’s financial model.
| 22.2.2 | Gold and Silver Prices |
Gold and silver prices used to model the base case cash flows are USD 2,400/oz and USD 30/oz respectively. Prices are fixed for the life of the mine.
| 22.2.3 | Gold and Silver Production |
Gold and silver production from material stacked from April 2025 through April 2026 and are based on recoveries discussed in Section 13.0. Actual monthly production of ounces is taken from a model used by Cerro Prieto Mine. The production also includes gold and silver ounces (19,152 oz gold, 540 oz silver) that are believed to be recoverable.
| 22.3 | Financial Model |
| 22.3.1 | Net Smelter Returns |
The Project produces a Doré in the refinery on site. It is expected that the Doré continues to be shipped to a refinery located in the United States. The smelting and refining charges are included in the general expenses item in the cash flow table.
| 22.3.2 | Sales Taxes |
No sales tax has been added. The costs used as the basis are the actual operating costs, and tax is assumed to be included.
| 22.3.3 | Property Taxes |
Property taxes are included in the in the general expenses item in the cash flow table.
| 22.3.4 | Reclamation and Closure Costs |
Reclamation and closure costs are not included in the cash flow table since future exploration program will develop future mining resources. It is assumed that the company will used the revenue from the salvage of the mining and process equipment at closure for reclamation.
166
NI 43-101 Technical Report – Cerro Prieto Project
| 22.3.5 | NSR Royalty and State Fees |
Royalties are included in the cash flow table. State and county fees are included in the Administration Operating Costs item in the cash flow table.
| 22.4 | Capital Cost Estimates |
The capital cost estimates are sustaining costs only and are detailed in Section 21.0 in this Technical Report.
| 22.5 | Cash Flow Analysis |
| 22.5.1 | After-tax Cash Flow Analysis |
The base case cash flow analysis is done on a constant United States dollar, after-tax, stand-alone Project basis. The Project has Pre-Tax and after-tax net present values of USD 12,607,981 and USD 9,085,680, respectively, at a discount rate of 8.0%.
The total cash costs per equivalent ounce including sustaining capital is $1,477/oz. Gold and silver prices used to model the cash flows were US$2,400/oz and US$24/oz, respectively. The Project generates positive cash flow in each month of production except in April, May, June and July 2025.
Assumptions for developing the Cash Flow for the Esperanzas Deposit:
| § | Total production cost was developed calculated based on processing in the heap leaching 1,484,979 tonnes of mineralized material from the mineral resources. |
| § | Gold and silver prices used to model the base case cash flows are USD 2,400/oz and USD 30/oz respectively. Prices are fixed for the life of the mine of Esperanzas Resources. |
| § | Gold recovery of 70% at crush sizes of -3/4” and -6”. |
| § | Capital investment of USD 2,764,585 is executed from April 2025 through November. |
| § | 2025, specific details are Section 21.2 Capital Costs in Tables 88 and 89. |
| § | Esperanzas Deposit in the Cerro Prieto Project has pre-taxed and after-tax net present cumulative values of USS 12,607,981and USD 9,085,680 respectively. |
The Cash Flow for Experanzas Deposit from April 2025 Through April 2026 is depicted in Table 92 and Table 93below:
167
NI 43-101 Technical Report – Cerro Prieto Project
Table 92 - Total Production Cost in USD, April 2025 Through April 2026
Total production cost (USD) developed in Table 92 from April 2025 Through April 2026 was used for developing the Cash Flow in USD from April 2025 Through April 2026 and the data developed are included below:
168
NI 43-101 Technical Report – Cerro Prieto Project
Table 93 - Cash Flow in USD, April 2025 Through April 2026
| § | Capital investment of USD 2,764,585 is executed from April 2025 through November 2025, specific details are Section 21.2 Capital Costs in Tables 89 and 90. |
| § | Value of Doré gold of USD 2,400/oz and Doré silver of USD 30/oz. |
| § | The Esperanzas Deposit has pre-taxed and after-tax net present cumulative values of USD12,110,701and USD 8,737,584 respectively. |
| § | By comparison, at an 8% discount rate, the pre-tax and after tax NPV are USD 11,199,031 at an IRR of 35% and USD 8,064,004 at an IRR of 32% respectively. |
| § | The Esperanzas Deposit generates positive cash flow through the end of April 2026. |
169
NI 43-101 Technical Report – Cerro Prieto Project
| 22.5.2 | Sensitivity Analysis |
The sensitivity of project cash flows to increases in capital costs (sustaining capital) and site operating costs was evaluated using the base case gold and silver. The project pre-tax and after-tax NPV (8% discount rate) is relatively insensitive in capital costs but are sensitive to operating costs and gold prices.
Table 94 - Project Pre-Tax NPV with Changes in Capital, and Operating Costs
| NPV
at Discount Rate (US$, Million) | ||||
| Variation | Capital
Costs (US$ Million) |
5% | 8% | 10% |
| 75% | 2.07 | 12.21 | 11.87 | 11.66 |
| 90% | 2.49 | 11.80 | 11.47 | 11.25 |
| 100% | 2.76 | 11.53 | 11.20 | 10.98 |
| 110% | 3.04 | 11.26 | 10.93 | 10.71 |
| 125% | 3.46 | 10.85 | 10.52 | 10.31 |
| NPV
at Discount Rate (US$, Million) | ||||
| Variation | Operating
Costs (US$ Million) |
5% | 8% | 10% |
| 75% | 20.13 | 18.05 | 17.61 | 17.32 |
| 90% | 24.16 | 14.14 | 13.76 | 13.52 |
| 100% | 26.84 | 11.53 | 11.20 | 10.98 |
| 110% | 29.52 | 8.92 | 8.63 | 8.45 |
| 125% | 33.55 | 5.01 | 4.79 | 4.64 |
Table 95 - Project Pre-Tax NPV with Changes in Capital, and Operating Costs
| NPV
at Discount Rate (US$, Million) | ||||
| Variation | Capital
Costs (US$ Million) |
5% | 8% | 10% |
| 75% | 2.07 | 8.99 | 8.74 | 8.58 |
| 90% | 2.49 | 8.58 | 8.33 | 8.17 |
| 100% | 2.76 | 8.31 | 8.06 | 7.90 |
| 110% | 3.04 | 8.04 | 7.79 | 7.64 |
| 125% | 3.46 | 7.63 | 7.39 | 7.23 |
| NPV
at Discount Rate (US$, Million) | ||||
| Variation | Operating
Costs (US$ Million) |
5% | 8% | 10% |
| 75% | 20.13 | 12.87 | 12.55 | 12.34 |
| 90% | 24.16 | 10.14 | 9.86 | 9.68 |
| 100% | 26.84 | 8.31 | 8.04 | 7.87 |
| 110% | 29.52 | 6.48 | 6.27 | 6.13 |
| 125% | 33.55 | 3.75 | 3.58 | 3.47 |
170
NI 43-101 Technical Report – Cerro Prieto Project
The sensitivity of the Project Cash Flows to changes in gold process was further examined. The pre-tax and after-tax for range of gold price variances from the best cases are shown in the tables below.
Table 96 - Project Pre-Tax NPV with Changing Gold Price
| NPV
at Discount Rate (US$, Million) | ||||
| Variation | Gold
Price (US$/oz) |
5% | 8% | 10% |
| 75% | 1,800 | 1.70 | 1.56 | 1.47 |
| 90% | 2,160 | 7.60 | 7.34 | 7.18 |
| 100% | 2,400 | 11.53 | 11.20 | 10.98 |
| 110% | 2,640 | 15.46 | 15.05 | 14.79 |
| 125% | 3,000 | 21.36 | 20.83 | 20.49 |
Table 97 - Project After-Tax NPV with Changing Gold Price
| NPV
at Discount Rate (US$, Million) | ||||
| Variation | Gold
Price (US$/oz) |
5% | 8% | 10% |
| 75% | 1,800 | 1.43 | 1.32 | 1.25 |
| 90% | 2,160 | 5.56 | 5.37 | 5.24 |
| 100% | 2,400 | 8.31 | 8.04 | 7.87 |
| 110% | 2,640 | 11.06 | 10.76 | 10.57 |
| 125% | 3,000 | 15.19 | 14.81 | 14.56 |
Graphs of the Pre-Tax NPV and After-Tax NPV as a function of varying Capital Costs, Operating Costs and Gold Prices are presented as follows:
Figure 88 – Project Pre-Tax NPV Sensitivity
171
NI 43-101 Technical Report – Cerro Prieto Project
Figure 89 – Project After-Tax NPV Sensitivity
| 23.0 | ADJACENT PROPERTIES |
José Antonio Olmedo MSc, P. Eng. Geo, QP, SME Registered Member prepared the information included in this section of the Technical Report. The adjacent mining projects near to the Cerro Prieto Project are:
| § | Cerro Caliche Project, Sonoro Gold Corp. Located at approximately 2 km east from the Cerro Prieto Project. |
| § | Mercedes Mine Project, Bear Creek Mining Corp. Located at approximately 10 km southwest from the Cerro Prieto Project. |
| § | Santa Gertrudis Project, Agnico-Eagle Mines Ltd. Located at approximately 20 km north from the Cerro Prieto Project. |
| 23.1 | Cerro Caliche Project Overview (Sonoro Gold Corp.) |
| § | Acquired: September 2018. |
| § | Area: 1,400 hectares. |
| § | Mineralization: Low-sulfidation epithermal veins, NW-trending, near-surface Au-Ag quartz veins often associated with rhyolitic dikes. |
| § | On March 24, 2023, Sonoro Gold Corp., published a NI 43-101 Technical Report, Mineral Resource Estimate for the Cerro Caliche Project. |
| § | On October 10, 2023, Sonoro Gold Corp., published a NI 43-101 Technical Report for Preliminary Economic Assessment (PEA). |
| 23.2 | Cautionary Note |
| § | José Antonio Olmedo MSc, P. Eng. Geo, QP, SME Registered Member stated that he has not verified the Cerro Caliche data included in the Technical Reports published by Sonoro Gold Corp. |
| § | Proximity of the above adjacent projects does not imply similar mineralization at the Esperanzas Deposit in the Cerro Prieto Project. |
172
NI 43-101 Technical Report – Cerro Prieto Project
| 24.0 | Other Relevant Data and Information |
José Antonio Olmedo MSc, P. Eng. Geo, QP, SME Registered Member prepared the information included in this section of the Technical Report. Goldgroup Mining Inc. issued a cautionary statement on a press release dated April 17, 2024, regarding its decision to put the Cerro Prieto Mine into production without completing a feasibility study.
| § | Key Points: |
| o | No feasibility study or independent technical report confirming the mine's economic or technical viability was conducted before production began. |
| o | Consequently, there is: |
| iii. | Increased risk and uncertainty about future economic outcomes. |
| iv. | Greater technical risk of failure than decisions based on completed feasibility studies. |
173
NI 43-101 Technical Report – Cerro Prieto Project
| 25.0 | INTERPRETATION AND CONCLUSIONS |
José Antonio Olmedo MSc, P. Eng. Geo, QP, SME Registered Member prepared the information included in this section of the Technical Report.
| 25.1 | Geology and Mineralization |
| § | The Esperanzas Deposit is located within a Tertiary volcanic sequence (felsic volcanoclastics, andesitic-basaltic flows, rhyolite/dacite tuffs). |
| § | Mineralization is structurally controlled: |
| o | Primary vein (Az 345°): approximately 700 m long, semi-vertical. |
| o | Secondary vein (Az 313°): dips 50–65° to the southwest. |
| § | Mineralization consists of quartz veins, chalcedony, amorphous silica, black calcite, and manganese within a low-sulfidation epithermal system. |
| 25.2 | Exploration and Drilling |
| § | Protocols adhered to industry standards, including mapping, geochemical and geophysical surveys, and chip sampling. |
| § | Drilling was completed prior to José Antonio Olmedo MSc, P. Eng. Geo, QP, SME Registered Member (JAO) site visit, so the drilling performance could not be verified. |
| § | Adjacent exploration targets (Reyna, Cata, Coatí, Cascabel) exhibit significant Au anomalies ranging from 0.18 to 25.27 g/t. |
| 25.3 | Mineral Resource Estimation |
| § | This analysis is based on 51 drill holes, 3,955 core samples, and 1,231 surface samples. |
| § | The estimation methodology follows CIM 2014 definitions and the best practice guidelines from 2019. |
| § | Modelled using Leapfrog Geo and EDGE software; only gold values are included at this stage. |
| § | Assumes: |
| o | 100% mining recovery. |
| o | No external dilution. |
| o | Internal dilution is included (5x5x5 m blocks). |
Database Concern:
| § | About 95% of assays originate from the non-certified Cerro Prieto lab (CoP), which lacks a formal QA/QC program, highlighting a critical data integrity issue. |
| § | Recommendation: Re-assays samples using certified laboratories and implement comprehensive QA/QC procedures. |
174
NI 43-101 Technical Report – Cerro Prieto Project
| 25.4 | Forward-Looking Caution |
| § | Goldgroup moved Cerro Prieto Project into production without conducting a feasibility study. |
| § | This raises: |
| o | Higher risk of technical failure. |
| o | Greater economic uncertainty. |
| § | Decisions were made without verifying the economic or technical viability of reserves and resources. |
175
NI 43-101 Technical Report – Cerro Prieto Project
| 26.0 | RECOMMENDATIONS |
| 26.1 | Recommendation on Mineral Resources |
José Antonio Olmedo MSc, P. Eng. Geo, QP, SME Registered Member (JAO) concurs with the overall direction of Oroco’s exploration and development program for the property and offers the following additional recommendations:
| § | Create markers for drill hole locations. |
| § | Improve the database and data management system to enhance data integrity, flow, usage, and management of all project-related information. |
| § | To estimate resources more precisely, a more accurate topographic surface with a minimum resolution of 50 cm per pixel is strongly recommended. |
| § | Reconstruct the core warehouse, including the entire ceiling, side protection walls, security door, and cleaning maintenance. |
| § | Keep at least ¼ of the mineralized intercepts in core boxes. |
| § | Keep coarse and pulp rejects separate from local and ALS rejects. |
| § | Utilize an accredited and certified geochemistry laboratory to analyze all mineralized intervals for gold included in Oroco’s database. |
| § | Conduct quality assurance and quality control (QA/QC) procedures as outlined in CIM Exploration Best Practice Guidelines. |
| § | JAO recommends that Oroco submit lab duplicates of pulp or coarse rejects instead of field duplicates in future exploration programs. |
| § | The author recommends submitting at least 5% of coarse pulp or pulp lab rejects to a certified laboratory other than local or ALS, as umpire assays periodically during drilling programs to corroborate ALS lab precision, identify any potential issues immediately, and apply corrective actions. |
| § | During future core drilling programs, adopt a systematic approach to measuring and recording specific gravity (SG) throughout the drilled section. |
| § | Conduct an optimization study of the open pit to estimate the mineral resources within Oroco’s designed pit envelope. |
| § | Conduct geotechnical studies to ensure the stability of the mine. |
| § | The property's exploration work, along with the initial mineral resource estimate at the Esperanzas target area and the numerous historical mines and workings, supports ongoing exploration in several target areas, including Reyna, Cascabel, Cata, Coatí, Zona Sur, and Socorro. |
JAO endorses Oroco’s 2025 exploration program depicted in the table below to evaluate the economic potential of Cerro Prieto’s mineralized targets.
176
NI 43-101 Technical Report – Cerro Prieto Project
| 2025 Exploration Budget | ||||||
| Runtime (Days) |
Zone |
Geophysics
(USD) |
Roads, Drilling Pads (USD) |
Drillings (USD) |
Total
(USD) | |
| 15 | Nueva Esperanza | 64,152 | 64,152 | |||
| 48 | Punta de Fecha & Puma Norte | 9,997 | 13,784 | 88,592 | 112,373 | Diamond |
| 52 | Reyna | 10,496 | 6,014 | 278,837 | 295,347 | Drilling |
| 17 | Sureste Extension Puma | 57,094 | 57,094 | |||
| 30 | Sur Patios | 59,566 | 59,566 | |||
| 5 | Cata | 8,997 | 6,892 | 22,667 | 38,556 | RC |
| 35 | Coati | 8,997 | 8,048 | 35,283 | 52,328 | Drilling |
| 22 | Cascabel | 5,998 | 6,892 | 22,667 | 35,557 | |
| Other Direct Exploration Costs | 36,172 | 36,172 | ||||
| Total (USD) | 44,485 | 41,630 | 665,030 | 751,145 | ||
| 26.2 | Recommendations on Mine Design |
Cristian Garcia, P. Eng., QP, Registered at Engineers and Geoscientists of British Columbia prepared this section of the Technical Report, and offers the following additional information, comments and/or recommendations:
| § | There is a limited opportunity for mine plan optimization because of the short mine life and sing phase design. However, if the north section of the pit is accelerated, there may be an opportunity to bring higher grades forward. |
| § | The mine currently uses a fixed cutoff grade. There is an opportunity to use the current operating costs to better define the cutoffs for different areas of the mine site. |
| § | The pit design only supports a 14-month plan. Work should be undertaken to better define and expand the measured and indicated reserve. This could support future expansions or a phased pit design, allowing for more optimization opportunities. |
| § | The current pit design is larger than the supporting Whittle shell. The pit should be re-designed to better follow he Whittle shell, which will improve the overall economics of the design. |
| § | The current life of mine is only 14 moths, and for that reason the recommendation is to use a fleet of contractor mining equipment. Contractor equipment comes at an operational premium but avoids the requirement for a large capital outlay. If future exploration supports a longer mine life, then other options, such as purchasing or leasing equipment, should be explored. |
177
NI 43-101 Technical Report – Cerro Prieto Project
| 26.3 | Recommendations on Mineral Processing |
Rodrigo R Carneiro MSc, QP, SME Registered Member this section of the Technical Report and offers the following additional comments and/or recommendations based on the results obtained on the composite samples evaluated under locked cycle cyanide column testing and assuming the composites evaluated represent the mineral resources of the Esperanza Deposit and the following recommendations should be considered for maximize the gold recovery under heap leaching process:
| § | Before heap leaching process, the sample should be stage crushed to 80% passing through a 3/8” sieve size to maximize gold recovery. |
| § | The sodium cyanide concentration of barren feed solution should be kept at 600 ppm at a pH in the range from 10.5 to 11.0 units. |
178
NI 43-101 Technical Report – Cerro Prieto Project
| 27.0 | REFERENCES |
NI 43-101. Preliminary Economic Assessment on the Cerro Prieto Project, Magdalena de Kino Area, Sonora State, Mexico. Prepared by Giroux, G. Moose Mountain Technical Services for Oroco Resource, Corp. in January 2011.
Report on the 2011-2012 Exploration Program, Including an Updated Resource Estimation on the Cerro Prieto Project. Magdalena de Kino Area, Sonora State, Mexico. Prepared by D. Bain, Duncan Bain Consulting, LTD., and G.H. Giroux, Giroux Consultants, LTD. June 10, 2013.
Goldgroup Mining, Inc. Press Releases: April 11, 2024, "Goldgroup Updates Cerro Prieto Mine Operations,” April 17, 2024, "Goldgroup Updates Exploration Efforts at Cerro Prieto Gold Mine," both signed by Craig Gibson, Ph.D., CPG, the qualified person. March 26, 2025.” Goldgroup Begins High-Impact Exploration at Cerro Prieto and New Gold Zones.”
Bain, D. J., and Giroux, 2013: The 2011-2012 Exploration Program Including an Updated Resources Estimation on the Cerro Prieto Project, Magdalena de Kino Area, Sonora State, Mexico.
Bain, D. J., 2007: Report on Phase 1 Exploration, Cerro Prieto Pb-Zn-Au-Ag-Mo Project, Magdalena de Kino Area, Sonora State, Mexico.
Bain, D. J., and Giroux, 2009: Report on the 2008 Exploration Program Including a Resource Estimation on the Cerro Prieto Project, Magdelena de Kino Area, Sonora State Mexico.
Bain, D. J., and Giroux, G., 2009: Report on the 2008 Exploration Program Including a Resource Estimation on the Cerro Prieto Project, Magdelena de Kino Area, Sonora State Mexico, Amended April 14, 2009.
Bain, D. and Giroux, G., 2010, Report on the 2009 Exploration Program Including a Resource Estimation on the Cerro Prieto Project, Magdelena de Kino Area, Sonora State, Mexico.
Bentzen, A., and Sinclair, 1993, P-RES – a computer program to aid in the investigation of polymetallic ore reserves; Tech. Rept. MT-9, Mineral Deposit Research Unit, Dept. of Geological Sciences, UBC, Vancouver (includes diskette), 55 pp.
Bideaux, R.A., 1972, The Collector, Mineralogical Record, 3, 198-201 Dominquez, Evaristo, April 8, 1980, Report on the Cerro Prieto Mine for Dravo Corporation. Unpublished report.
CIM, Estimation of Mineral Resources and Mineral Reserves. Best Practice Guidelines. CIM Mineral Reserve Committee. Adopted by the CIM Council on November 29, 2019.
CIM, Definition Standards for Mineral Resources and Mineral Reserves. CIM Standing Committee on Reserve Definitions. Adopted by the CIM Council on May 19, 2014.
CIM, Mineral Exploration Best Practice Guidelines. CIM Mineral Resource and Mineral Reserve Committee. Published November 23, 2018.
Giroux, G., 2011, Preliminary Economic Assessment Technical Report on the Cerro Prieto Project, Magdelena de Kino Area, Sonora State, Mexico, January 28, 2011; prepared by Moose Mountain Technical Services for Oroco Resource Corp Hedenquist, J.W., Arribas, A., González, E., Schematic Reconstruction Low-Sulfidation Deposit. Exploration Epithermal Deposits. November 2000.
179
NI 43-101 Technical Report – Cerro Prieto Project
Hedenquist, J.W., and Cowestern, M. (1994). The Characteristics of Epithermal Precious and Base Metal Systems: Economic Geology, 89(5), 1042–1063.
Kappes Cassidy & Associates, June 2010, Cerro Prieto Project Report of Metallurgical Test Work
Nourse, J.A., 1995, Jurassic-Cretaceous Paleogeography of the Magdalena Region, Northern Sonora, and its Influence on the Positioning of Tertiary Metamorphic Core Complexes, in Geol. Soc. America Spec. Paper 301, p. 59 -78.
Manning, L.J., 1969, Report on the San Francisco Claim, Sonora, Mexico for Ramada Resources Ltd. (N.P.L.), unpublished report.
Moore, T., 2004, Famous mineral localities: The San Francisco Mine, Sonora, Mexico, Mineralogical Record, Nov/Dec 2004.
Morgain Minerals Inc. 1998 Annual Report.
Morgain Minerals Inc. news releases, January 18, 1999, and March 16, 1999.
Oroco Resource Corp. news release, December 15, 2010; March 7, 2011; May 18, 2011;
January 17, 2012; January 26, 2012; April 19, 2012.
Perry, V.D. and Mulchay, R.B., 1934, Report on the Cerro Prieto Mine for Anaconda Copper Co. Unpublished report.
Pye, W.D., 1972, San Francisco Mine, Sonora, Mexico: progress report for Devex Corporation. Unpublished report.
ROCKLABS, 2025. Certificate of Analysis for Reference Materials. ROCKLABS, A Division of Scott Technology Ltd. Auckland, New Zealand.
Servicio Geológico Mexicano (SGM). Estudio de Tomografía Eléctrica en la Mina Cerro Prieto, Municipio de Cucurpe, Sonora. Internal Report. April 2025.
SGS Mineral Services, 2009, Metallurgical Tests for Determination of the Sensitivity to the Acid and Cyanide Leaching of an ore Deposit Called Cerro Prieto.
Sinclair, A.J., 1976: Applications of probability graphs in mineral exploration; Spec. v. 4, Association of Exploration Geochemists, 95 pp.
Smith, L.J., 1986, Evaluacion Preliminar, Prospecto “San Francisco-Cerro Prieto”, Municipio de Cucurpe, Sonora. Unpublished report for Compania Fresnillo, S.A. de C.V.
Sonoro Gold, Inc. Micon International Limited. NI 43-101 Technical Report for the preliminary Economic Assessment on the Cerro Caliche Project, Sonora, Mexico. Effective Date: August 28, 2023.
Swoboda, E. (1994), The San Francisco Mine. Unpublished manuscript, 92 pp.
White, J.S., 1972, What’s New in Minerals Mineralogical Record, 3, p. 180-182
180
NI 43-101 Technical Report – Cerro Prieto Project
CERTIFICATE OF QUALIFIED PERSON
This certificate applies to the Technical Report titled "Cerro Prieto Mine, Esperanzas Project, Heap Leach Project Magdalena de Kino, State of Sonora, Mexico" ("the Technical Report"), with an effective date of 4 April 2025, prepared for Goldgroup Mining, Inc. ("the Issuer).
I, Rodrigo R Carneiro, MS, PE, QP do hereby certify that I am currently employed as Principal Metallurgical Consultant by RCarneiro Mineral Engineering & Consultant LLC, 212 Borrego, Irvine, California 92618 (USA) and:
| 1. | I graduated with a Bachelor of Science degree in Metallurgical Engineering from the University of Arizona (USA) in 1978 and Master of Science degree in Mineral Processing from the University of Arizona in 1993. I am a Registered Member No. 4028876 of the Society for Mining, Metallurgy & Exploration (SME), Mining & Metallurgical Society of America (MMSA) Qualified Person in Metallurgy/Processing (QP) No. 01381QP. I am a Registered Professional Metallurgical Engineer (PE), in the Venezuelan College of Engineers, Registration No. C.I.V 71,096.Since 1979, I have worked as senior metallurgical engineer, metallurgical project manager, director of research and process development, global technical specialist in mine and plant services for precious metal projects, base metal projects in South America, Central America, Mongolia, China and Philippines. |
| 2. | I have read the definition of “Qualified Person” set out in National Instrument 43-101 (“NI 43-101”) and certify that by reason of my education, affiliation with a professional association (as defined in NI 43-101) and past relevant work experience, I fulfill the requirements to be a “Qualified Person” for the purposes of NI 43-101. |
| 3. | I have visited the project site on 27, 28 and 29 May 2024. |
| 4. | Responsible for the following sections of the Technical Report 1.0, 1.1, 1.2, 1.3, 1.12, 1.14, 1.17.2, 2.0, 2.1, 2.2, 2.3, 2.4, 2.5, 2.6, 3.0, 3.1, 3.2, 4.1, 4.2, 4.3, 4.4, 5.1, 5.2, 5.3, 6.0, 12.0, 12.1, 12.2, 12.2.3,13.0, 17.0, 18.0, 19.0, 21.0, 22.0, 26.3 and I accept professional responsibility for my contributions to the Technical Report. |
| 5. | I am independent of Goldgroup Mining Inc., applying all of the 1.5 of NI 43-101. |
| 6. | I have not been involved with property that is the subject of the Technical Report. |
| 7. | I have read NI 43-101 and Form 43-101F1 and the sections of the Technical Report. I am responsible for have been prepared in compliance with that instrument and form. |
| 8. | As of the effective date of the Technical Report, to the best of my knowledge, information, and belief, this Technical Report contains all the scientific and technical information that is required to be disclosed to make those parts of the Technical Report for which I am responsible for not misleading. |
Effective Date: 4 April 2025.
Signing Date: 16 October 2025.
| “Signed and Stamped” | |
| Rodrigo R Carneiro MS,
PE, QP Irvine, California, USA |
181
NI 43-101 Technical Report – Cerro Prieto Project
CERTIFICATE OF QUALIFIED PERSON
I, José A. Olmedo, SME, MSc, P. Eng., P. Geo., QP, hereby certify that:
1. I am currently an Independent Consultant with an office at Valle de México 26, Loma de Valle Escondido, Atizapán de Zaragoza, 52930 Estado de México, México.
2. This certificate applies to the Technical Report titled "Cerro Prieto Mine, Esperanzas Project, Heap Leach Project Magdalena de Kino, State of Sonora, Mexico" ("the Technical Report"), with an effective date of 4 April 2025, prepared for Goldgroup Mining, Inc. ("the Issuer).
3. I hold a Bachelor's Degree in Geological Engineering from Universidad Nacional Autónoma de México, with Professional ID # 598612. Additionally, I have a Master of Science in Mineral Exploration from McGill University in Montreal, Canada, along with several diplomas in Business Administration, International Business, and Economic Geology from various national and international institutions. I am certified as a Valuator of Mineral Properties by Imperial College in London, UK, and have certificates as a Financial Analyst and Enterprise Valuator from the Corporate Finance Institute in Vancouver, Canada. I am a Registered Member in good standing of the Society for Mining, Metallurgy & Exploration Engineers USA (SME), with registration number 426799RM, and an active member of the Asociación de Ingenieros de Minas, Metalurgistas y Geólogos de México (AIMMGM), # 15655. I have spent 46 years working with national and international corporations in mineral exploration and the economic assessment of mineral properties of various styles of mineralization. This includes low-sulfidation epithermal-related projects, such as the Cerro Prieto – Esperanzas Project, which is the subject of the Technical Report. My performance is results-oriented, with expertise in start-up operations, and I have proven successful in project management, technical reporting, corporate finances, and strategic planning.
4. I have read the definition of "Qualified Person" as outlined in National Instrument 43-101 ("NI 43-101") and certify that, due to my education, affiliation with a professional association (as defined in NI 43-101), and relevant past work experience, I meet the requirements to be a "Qualified Person" for NI 43-101.
5. I personally inspected the property from May 28 to 31, 2024.
6. I am responsible for Sections 1.0, 1.2, 1.4. 1.5, 1.6, 1.7, 1.8, 1.9, 1.10, 1.13, 1.15, 1.16, 1.17.1, 2.1, 2.2, 2.3, 2.4, 3.3, 5.4, 7.0, 8.0, 9.0, 10.0, 11.0, 12.1, 12.2.1, 14.0, 15.0, 20.0, 23.0, 24.0, 26.1 25.0, and 26.1 and 27.0 and I accept professional responsibility for my contributions to the Technical Report.
7. I am independent of the issuer and related companies while applying all the tests in Section
1.5 of the NI 43-101. I have not had any prior involvement with the property subject of the Technical Report.
8. As of the effective date of this Technical Report, to the best of my knowledge, information, and belief, the sections of the Technical Report for which I am responsible contain all the scientific and technical information that is required to be disclosed to ensure those parts of this Technical Report are not misleading.
Effective Date: 4 April 2025.
Signing Date: 16 October 2025.
| "Signed and Stamped" | |
| José A. Olmedo, SME, MSc, P. Eng., P. Geo., QP |
182
NI 43-101 Technical Report – Cerro Prieto Project
CERTIFICATE OF QUALIFIED PERSON
I, Cristian Garcia, P.Eng. as an author of this report titled "Cerro Prieto Mine, Heap Leach Project Magdalena de Kino, State of Sonora, Mexico" {the Technical Report), with an effective date of 4 April 2025, prepared for Goldgroup Mining Inc.) in respect of the Issuer's Cerro Prieto Mine {the Property), do hereby certify that
| § | I am employed as a Principal Mining Engineer with TechSer Mining Consultants (TechSer), with an office address of 540 Hermosa Avenue, North Vancouver, British Columbia, Canada, V7N 3C1. |
| § | I graduated from Universidad de Santiago de Chile in 2001 with a degree in mining engineering. I have practiced my profession for 20 years since graduation. I have been directly involved in several studies, working in consulting and operations in project evaluation, technical services group, and strategic mine planning. I have experience in scoping, and pre-feasibility and feasibility studies for underground and open pit projects. I am a registered Professional Engineer with Engineers and Geoscientists of British Columbia (Registration No. 58399). I have visited the Property on May 28th, 2024. |
I have read the definition of qualified person set out in National Instrument 43-101 (NI 43-101) and certify that by virtue of my education, affiliation to a professional association, and past relevant work experience, I fulfill the requirements to be a qualified person for the purposes of NI 43-101.
| § | As a qualified person, I am independent of the Issuer as defined in Section 1.5 of NI 43-101. I am a co-author of the Technical Report, responsible for Sections 1.0, 1.2, 1.11, 2.1, 2.2, 2.3, 2.4, 3.0, 12.2.2, 16.0, and 26.2, and I accept professional responsibility for my contributions to the Technical Report. |
| § | I have no prior involvement with the Cerro Prieto Mine. |
| § | I have read NI 43-101 and Form 43-101F1, and the Technical Report has been prepared in compliance with NI 43-101 and Form 43-101F1. |
| § | As of the date of this certificate, to the best of my knowledge, information and belief, the portion of the Technical Report for which I am responsible contains all scientific and technical information that is required to be disclosed to make the portion of the Technical Report for which I am responsible not misleading. |
Effective Date: 4 April 2025.
Signing Date: 18 September 2025.
| “Signed and Stamped” | |
| Cristian Garcia PEng, QP |
183