
Pri m ar y & se co nd ar y br an d co lor s Data viz colors Data viz monochromatic July 21, 2026 Q2 Earnings Conference Call
Pri m ar y & se co nd ar y br an d co lor s Data viz colors Data viz monochromatic This presentation contains forward-looking statements within the meaning of the Private Securities Litigation Reform Act of 1995 that are based on management's beliefs, assumptions, current expectations, estimates and projections about BOK Financial Corporation, the financial services industry, and the economy generally. Words such as “anticipates,” “believes,” “estimates,” “expects,” “forecasts,” “plans,” "outlook," “projects,” “will,” “intends,” "may," "could,""should," "would," "potential," "continue," "seek," "target," variations of such words and similar expressions are intended to identify such forward-looking statements. Management judgments relating to and discussion of the provision and allowance for credit losses, allowance for uncertain tax positions, accruals for loss contingencies and valuation of mortgage servicing rights involve judgments as to expected events and are inherently forward-looking statements. Assessments that acquisitions and growth endeavors will be profitable are statements of belief as to the outcome of future events based in part on information provided by others which BOK Financial has not independently verified and for which BOK Financial assumes no responsibility for the accuracy or completeness. These various forward-looking statements are not guarantees of future performance and involve certain risks, uncertainties, and assumptions which are difficult to predict with regard to timing, extent, likelihood and degree of occurrence. All statements other than statements of historical fact are forward-looking statements. Therefore, actual results and outcomes may materially differ from what is expected, implied, or forecasted in such forward-looking statements. Internal and external factors that might cause such a difference include, but are not limited to changes in government, changes in governmental economic policy, including tariffs; changes in commodity prices; interest rates and interest rate relationships; inflation; demand for products and services; the degree of competition by traditional and nontraditional competitors; changes in banking regulations; tax laws; prices, levies and assessments; the impact of technological advances; trends in customer behavior as well as their ability to repay loans; credit quality deterioration; cybersecurity incidents and data breaches; operational failures or interruptions; liquidity risks; capital adequacy requirements; litigation and regulatory enforcement actions; and other risks detailed in BOK Financial Corporation's filings with the Securities and Exchange Commission. For a discussion of risk factors that may cause actual results to differ from expectations, please refer to BOK Financial Corporation’s most recent annual and quarterly reports. BOK Financial Corporation and its affiliates undertake no obligation to update, amend, or clarify forward-looking statements, whether as a result of new information, future events, or otherwise. Non-GAAP Financial Measures: This presentation may refer to non-GAAP financial measures. Additional information on these financial measures is available in BOK Financial’s Form 8-K filings furnished pursuant to Item 2.02, which can be accessed at bokf.com. All data is presented as of June 30, 2026 unless otherwise noted. Legal Disclaimers 2
Pri m ar y & se co nd ar y br an d co lor s Data viz colors Data viz monochromatic Stacy Kymes Chief Executive Officer 3
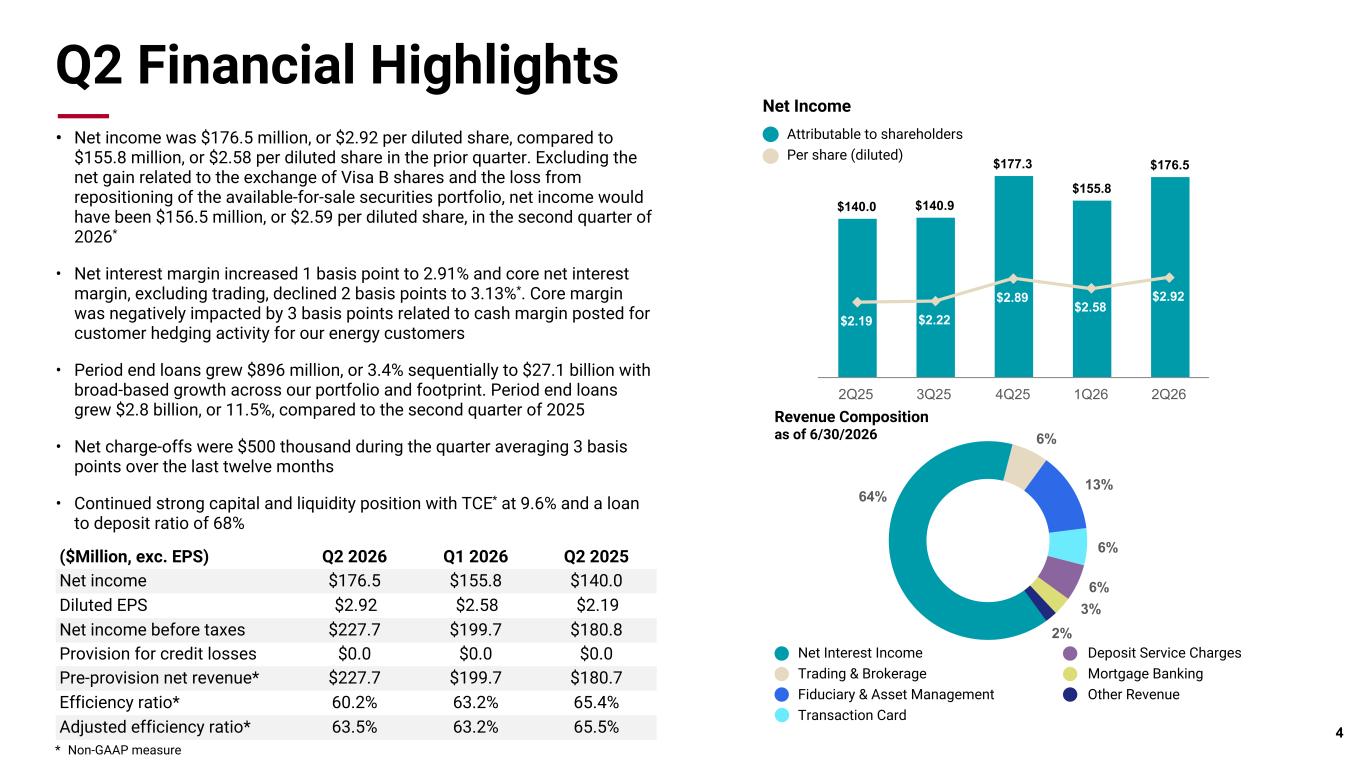
Pri m ar y & se co nd ar y br an d co lor s Data viz colors Data viz monochromatic Q2 Financial Highlights * Non-GAAP measure Attributable to shareholders Per share (diluted) Net Income • Net income was $176.5 million, or $2.92 per diluted share, compared to $155.8 million, or $2.58 per diluted share in the prior quarter. Excluding the net gain related to the exchange of Visa B shares and the loss from repositioning of the available-for-sale securities portfolio, net income would have been $156.5 million, or $2.59 per diluted share, in the second quarter of 2026* • Net interest margin increased 1 basis point to 2.91% and core net interest margin, excluding trading, declined 2 basis points to 3.13%*. Core margin was negatively impacted by 3 basis points related to cash margin posted for customer hedging activity for our energy customers • Period end loans grew $896 million, or 3.4% sequentially to $27.1 billion with broad-based growth across our portfolio and footprint. Period end loans grew $2.8 billion, or 11.5%, compared to the second quarter of 2025 • Net charge-offs were $500 thousand during the quarter averaging 3 basis points over the last twelve months • Continued strong capital and liquidity position with TCE* at 9.6% and a loan to deposit ratio of 68% 4 $140.0 $140.9 $177.3 $155.8 $176.5 $2.19 $2.22 $2.89 $2.58 $2.92 2Q25 3Q25 4Q25 1Q26 2Q26 ($Million, exc. EPS) Q2 2026 Q1 2026 Q2 2025 Net income $176.5 $155.8 $140.0 Diluted EPS $2.92 $2.58 $2.19 Net income before taxes $227.7 $199.7 $180.8 Provision for credit losses $0.0 $0.0 $0.0 Pre-provision net revenue* $227.7 $199.7 $180.7 Efficiency ratio* 60.2% 63.2% 65.4% Adjusted efficiency ratio* 63.5% 63.2% 65.5% Revenue Composition as of 6/30/2026 64% 6% 13% 6% 6% 3% 2% Net Interest Income Trading & Brokerage Fiduciary & Asset Management Transaction Card Deposit Service Charges Mortgage Banking Other Revenue
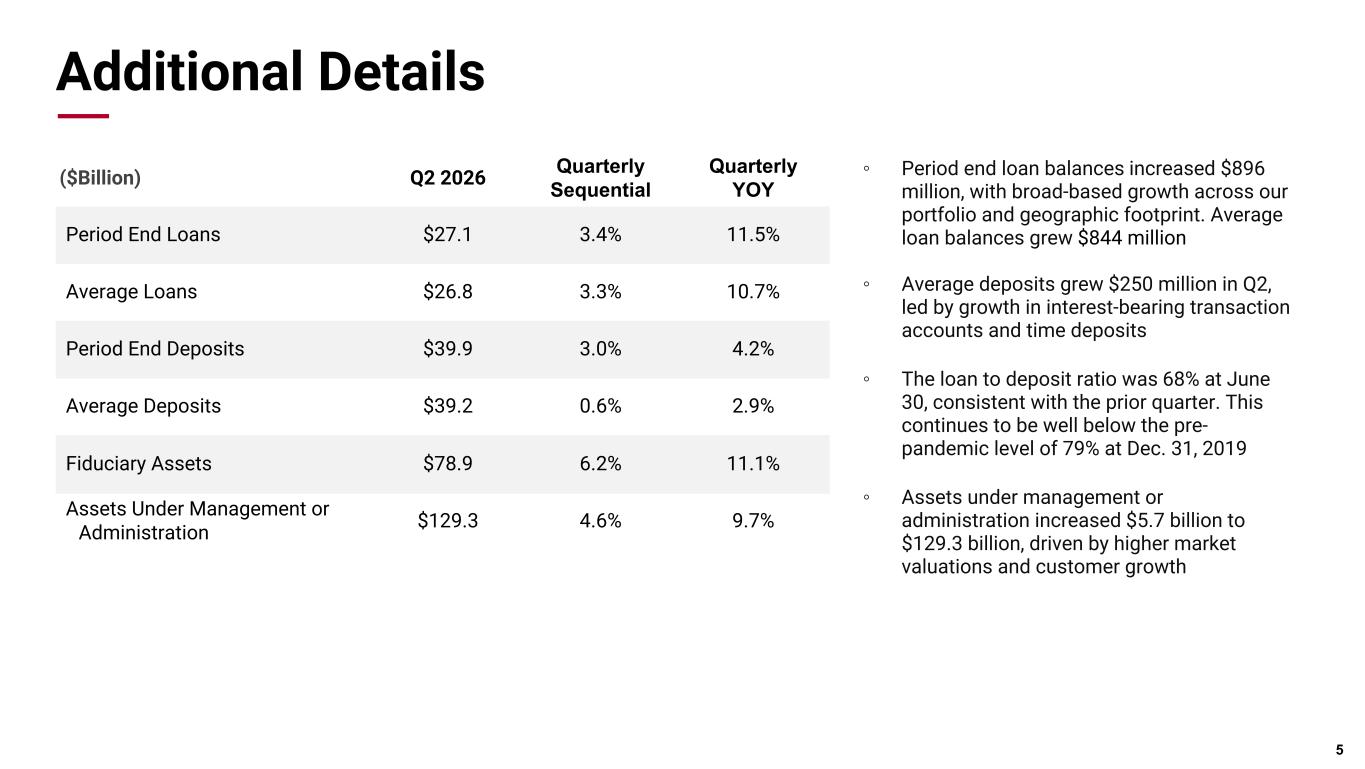
Pri m ar y & se co nd ar y br an d co lor s Data viz colors Data viz monochromatic Additional Details 5 ◦ Period end loan balances increased $896 million, with broad-based growth across our portfolio and geographic footprint. Average loan balances grew $844 million ◦ Average deposits grew $250 million in Q2, led by growth in interest-bearing transaction accounts and time deposits ◦ The loan to deposit ratio was 68% at June 30, consistent with the prior quarter. This continues to be well below the pre- pandemic level of 79% at Dec. 31, 2019 ◦ Assets under management or administration increased $5.7 billion to $129.3 billion, driven by higher market valuations and customer growth ($Billion) Q2 2026 Quarterly Sequential Quarterly YOY Period End Loans $27.1 3.4% 11.5% Average Loans $26.8 3.3% 10.7% Period End Deposits $39.9 3.0% 4.2% Average Deposits $39.2 0.6% 2.9% Fiduciary Assets $78.9 6.2% 11.1% Assets Under Management or Administration $129.3 4.6% 9.7%
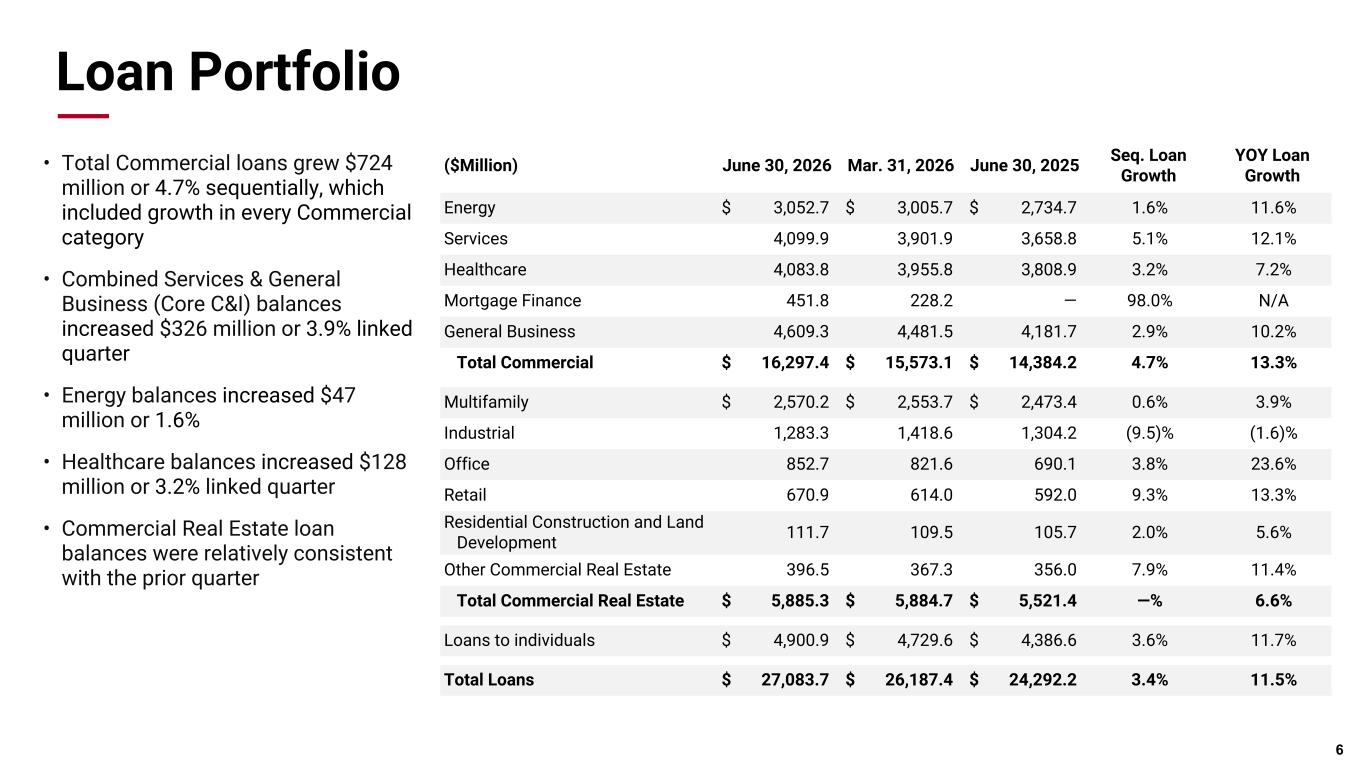
Pri m ar y & se co nd ar y br an d co lor s Data viz colors Data viz monochromatic Loan Portfolio • Total Commercial loans grew $724 million or 4.7% sequentially, which included growth in every Commercial category • Combined Services & General Business (Core C&I) balances increased $326 million or 3.9% linked quarter • Energy balances increased $47 million or 1.6% • Healthcare balances increased $128 million or 3.2% linked quarter • Commercial Real Estate loan balances were relatively consistent with the prior quarter 6 ($Million) June 30, 2026 Mar. 31, 2026 June 30, 2025 Seq. Loan Growth YOY Loan Growth Energy $ 3,052.7 $ 3,005.7 $ 2,734.7 1.6% 11.6% Services 4,099.9 3,901.9 3,658.8 5.1% 12.1% Healthcare 4,083.8 3,955.8 3,808.9 3.2% 7.2% Mortgage Finance 451.8 228.2 — 98.0% N/A General Business 4,609.3 4,481.5 4,181.7 2.9% 10.2% Total Commercial $ 16,297.4 $ 15,573.1 $ 14,384.2 4.7% 13.3% Multifamily $ 2,570.2 $ 2,553.7 $ 2,473.4 0.6% 3.9% Industrial 1,283.3 1,418.6 1,304.2 (9.5)% (1.6)% Office 852.7 821.6 690.1 3.8% 23.6% Retail 670.9 614.0 592.0 9.3% 13.3% Residential Construction and Land Development 111.7 109.5 105.7 2.0% 5.6% Other Commercial Real Estate 396.5 367.3 356.0 7.9% 11.4% Total Commercial Real Estate $ 5,885.3 $ 5,884.7 $ 5,521.4 —% 6.6% Loans to individuals $ 4,900.9 $ 4,729.6 $ 4,386.6 3.6% 11.7% Total Loans $ 27,083.7 $ 26,187.4 $ 24,292.2 3.4% 11.5%
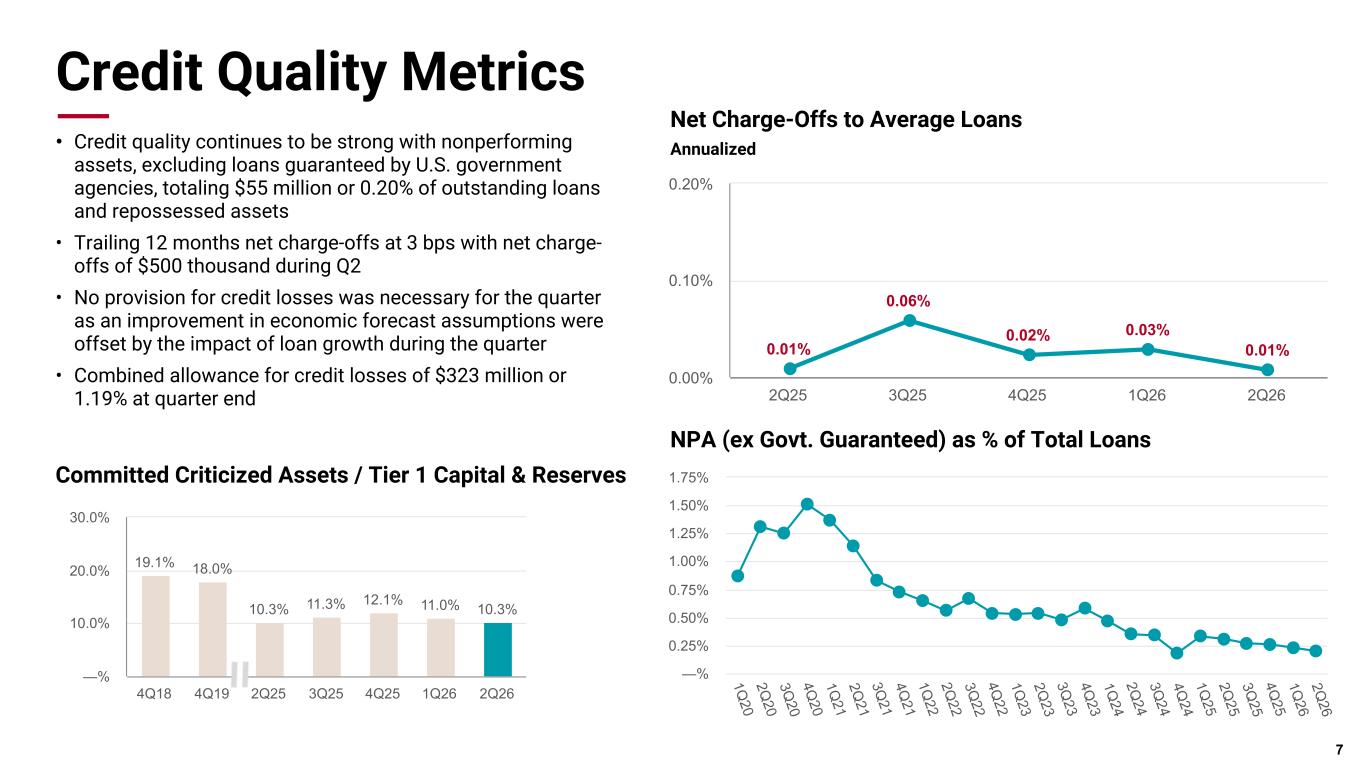
Pri m ar y & se co nd ar y br an d co lor s Data viz colors Data viz monochromatic Credit Quality Metrics • Credit quality continues to be strong with nonperforming assets, excluding loans guaranteed by U.S. government agencies, totaling $55 million or 0.20% of outstanding loans and repossessed assets • Trailing 12 months net charge-offs at 3 bps with net charge- offs of $500 thousand during Q2 • No provision for credit losses was necessary for the quarter as an improvement in economic forecast assumptions were offset by the impact of loan growth during the quarter • Combined allowance for credit losses of $323 million or 1.19% at quarter end Net Charge-Offs to Average Loans NPA (ex Govt. Guaranteed) as % of Total Loans Annualized 7 0.01% 0.06% 0.02% 0.03% 0.01% 2Q25 3Q25 4Q25 1Q26 2Q26 0.00% 0.10% 0.20% 19.1% 18.0% 10.3% 11.3% 12.1% 11.0% 10.3% 4Q18 4Q19 2Q25 3Q25 4Q25 1Q26 2Q26 —% 10.0% 20.0% 30.0% Committed Criticized Assets / Tier 1 Capital & Reserves 1Q 20 2Q 20 3Q 20 4Q 20 1Q 21 2Q 21 3Q 21 4Q 21 1Q 22 2Q 22 3Q 22 4Q 22 1Q 23 2Q 23 3Q 23 4Q 23 1Q 24 2Q 24 3Q 24 4Q 24 1Q 25 2Q 25 3Q 25 4Q 25 1Q 26 2Q 26 —% 0.25% 0.50% 0.75% 1.00% 1.25% 1.50% 1.75%

Pri m ar y & se co nd ar y br an d co lor s Data viz colors Data viz monochromatic Scott Grauer EVP, Wealth Management Executive 8
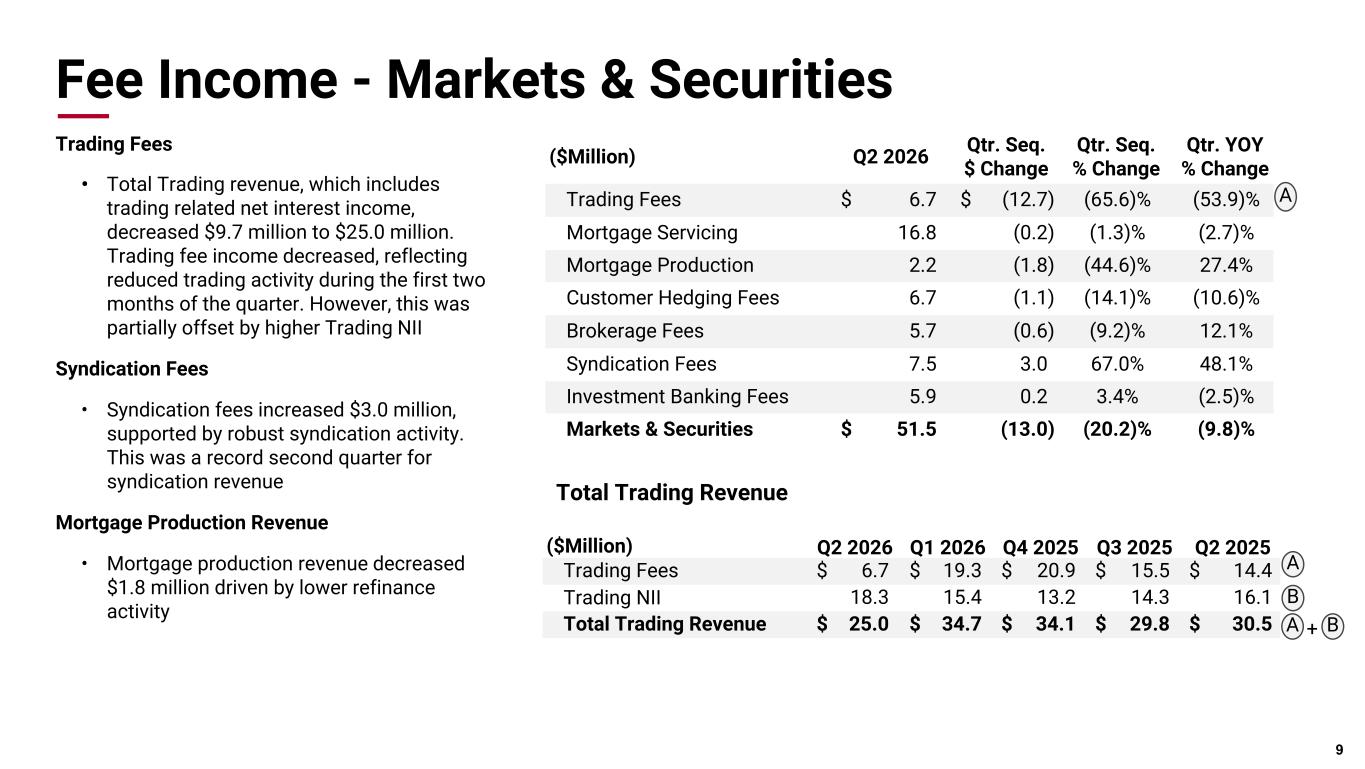
Pri m ar y & se co nd ar y br an d co lor s Data viz colors Data viz monochromatic Fee Income - Markets & Securities Trading Fees • Total Trading revenue, which includes trading related net interest income, decreased $9.7 million to $25.0 million. Trading fee income decreased, reflecting reduced trading activity during the first two months of the quarter. However, this was partially offset by higher Trading NII Syndication Fees • Syndication fees increased $3.0 million, supported by robust syndication activity. This was a record second quarter for syndication revenue Mortgage Production Revenue • Mortgage production revenue decreased $1.8 million driven by lower refinance activity 9 ($Million) Q2 2026 Qtr. Seq. $ Change Qtr. Seq. % Change Qtr. YOY % Change Trading Fees $ 6.7 $ (12.7) (65.6)% (53.9)% Mortgage Servicing 16.8 (0.2) (1.3)% (2.7)% Mortgage Production 2.2 (1.8) (44.6)% 27.4% Customer Hedging Fees 6.7 (1.1) (14.1)% (10.6)% Brokerage Fees 5.7 (0.6) (9.2)% 12.1% Syndication Fees 7.5 3.0 67.0% 48.1% Investment Banking Fees 5.9 0.2 3.4% (2.5)% Markets & Securities $ 51.5 (13.0) (20.2)% (9.8)% ($Million) Q2 2026 Q1 2026 Q4 2025 Q3 2025 Q2 2025 Trading Fees $ 6.7 $ 19.3 $ 20.9 $ 15.5 $ 14.4 Trading NII 18.3 15.4 13.2 14.3 16.1 Total Trading Revenue $ 25.0 $ 34.7 $ 34.1 $ 29.8 $ 30.5 A A Total Trading Revenue A + B B
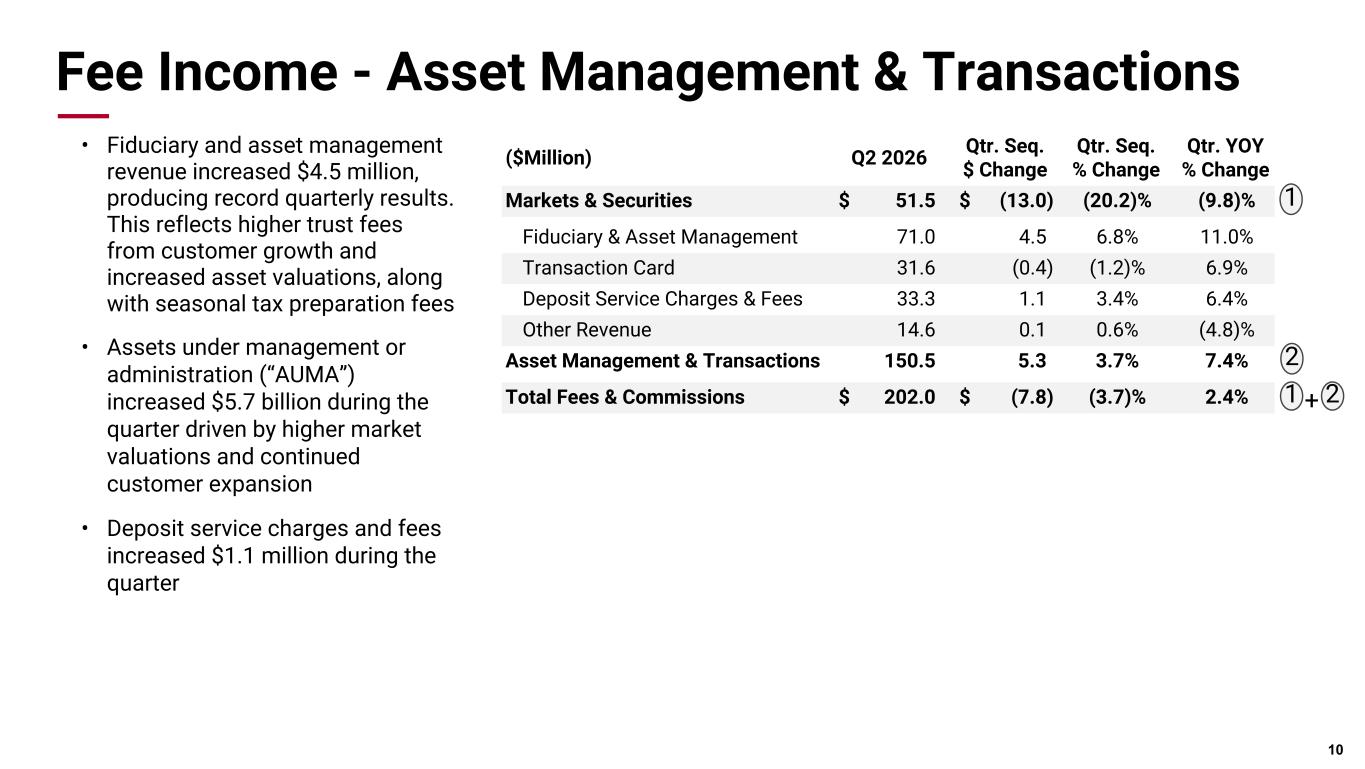
Pri m ar y & se co nd ar y br an d co lor s Data viz colors Data viz monochromatic Fee Income - Asset Management & Transactions • Fiduciary and asset management revenue increased $4.5 million, producing record quarterly results. This reflects higher trust fees from customer growth and increased asset valuations, along with seasonal tax preparation fees • Assets under management or administration (“AUMA”) increased $5.7 billion during the quarter driven by higher market valuations and continued customer expansion • Deposit service charges and fees increased $1.1 million during the quarter 10 ($Million) Q2 2026 Qtr. Seq. $ Change Qtr. Seq. % Change Qtr. YOY % Change Markets & Securities $ 51.5 $ (13.0) (20.2)% (9.8)% Fiduciary & Asset Management 71.0 4.5 6.8% 11.0% Transaction Card 31.6 (0.4) (1.2)% 6.9% Deposit Service Charges & Fees 33.3 1.1 3.4% 6.4% Other Revenue 14.6 0.1 0.6% (4.8)% Asset Management & Transactions 150.5 5.3 3.7% 7.4% Total Fees & Commissions $ 202.0 $ (7.8) (3.7)% 2.4% 2+1 1 2

Pri m ar y & se co nd ar y br an d co lor s Data viz colors Data viz monochromatic Marty Grunst EVP, Chief Financial Officer 11
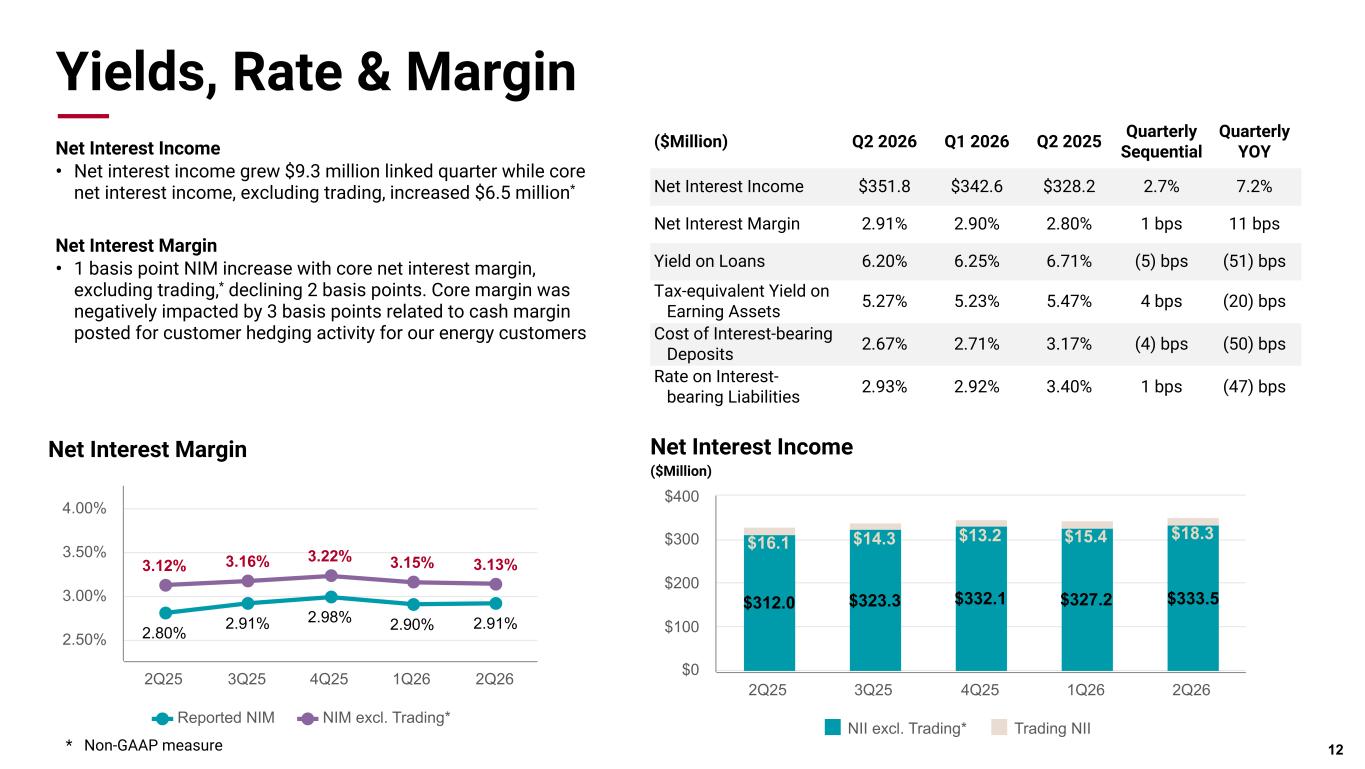
Pri m ar y & se co nd ar y br an d co lor s Data viz colors Data viz monochromatic Yields, Rate & Margin Net Interest Income • Net interest income grew $9.3 million linked quarter while core net interest income, excluding trading, increased $6.5 million* Net Interest Margin • 1 basis point NIM increase with core net interest margin, excluding trading,* declining 2 basis points. Core margin was negatively impacted by 3 basis points related to cash margin posted for customer hedging activity for our energy customers 12 ($Million) Q2 2026 Q1 2026 Q2 2025 Quarterly Sequential Quarterly YOY Net Interest Income $351.8 $342.6 $328.2 2.7% 7.2% Net Interest Margin 2.91% 2.90% 2.80% 1 bps 11 bps Yield on Loans 6.20% 6.25% 6.71% (5) bps (51) bps Tax-equivalent Yield on Earning Assets 5.27% 5.23% 5.47% 4 bps (20) bps Cost of Interest-bearing Deposits 2.67% 2.71% 3.17% (4) bps (50) bps Rate on Interest- bearing Liabilities 2.93% 2.92% 3.40% 1 bps (47) bps Net Interest Income ($Million) $312.0 $323.3 $332.1 $327.2 $333.5 $16.1 $14.3 $13.2 $15.4 $18.3 NII excl. Trading* Trading NII 2Q25 3Q25 4Q25 1Q26 2Q26 $0 $100 $200 $300 $400 2.80% 2.91% 2.98% 2.90% 2.91% 3.12% 3.16% 3.22% 3.15% 3.13% Reported NIM NIM excl. Trading* 2Q25 3Q25 4Q25 1Q26 2Q26 2.50% 3.00% 3.50% 4.00% Net Interest Margin * Non-GAAP measure
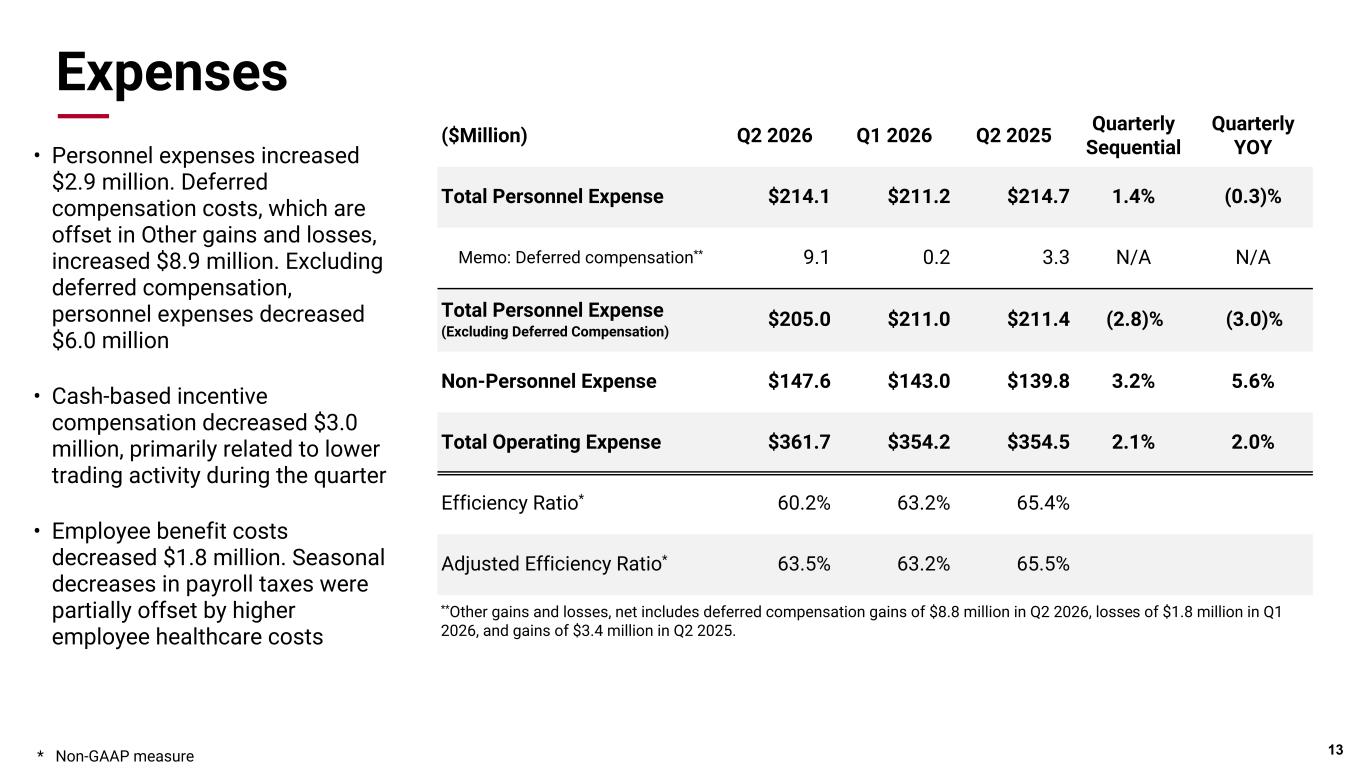
Pri m ar y & se co nd ar y br an d co lor s Data viz colors Data viz monochromatic Expenses • Personnel expenses increased $2.9 million. Deferred compensation costs, which are offset in Other gains and losses, increased $8.9 million. Excluding deferred compensation, personnel expenses decreased $6.0 million • Cash-based incentive compensation decreased $3.0 million, primarily related to lower trading activity during the quarter • Employee benefit costs decreased $1.8 million. Seasonal decreases in payroll taxes were partially offset by higher employee healthcare costs 13 ($Million) Q2 2026 Q1 2026 Q2 2025 Quarterly Sequential Quarterly YOY Total Personnel Expense $214.1 $211.2 $214.7 1.4% (0.3)% Memo: Deferred compensation** 9.1 0.2 3.3 N/A N/A Total Personnel Expense (Excluding Deferred Compensation) $205.0 $211.0 $211.4 (2.8)% (3.0)% Non-Personnel Expense $147.6 $143.0 $139.8 3.2% 5.6% Total Operating Expense $361.7 $354.2 $354.5 2.1% 2.0% Efficiency Ratio* 60.2% 63.2% 65.4% Adjusted Efficiency Ratio* 63.5% 63.2% 65.5% * Non-GAAP measure **Other gains and losses, net includes deferred compensation gains of $8.8 million in Q2 2026, losses of $1.8 million in Q1 2026, and gains of $3.4 million in Q2 2025.
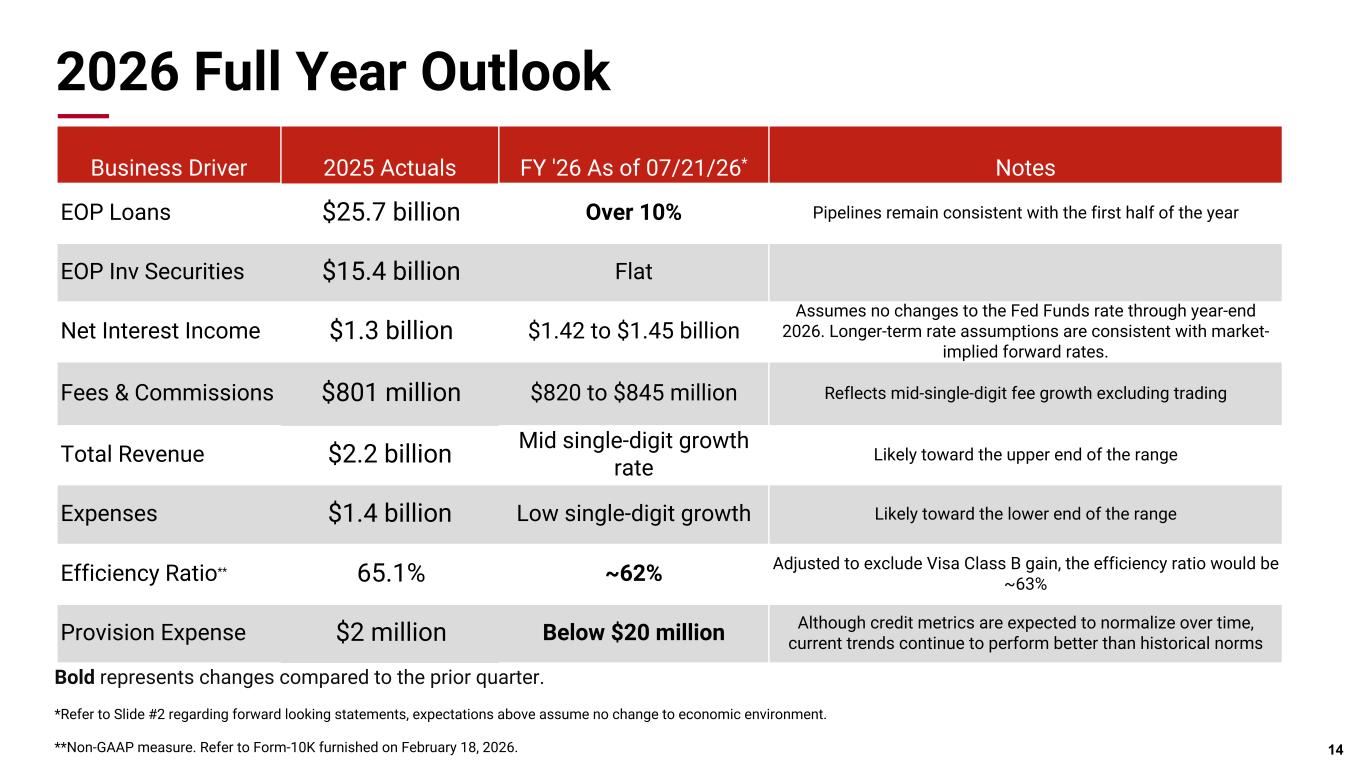
Pri m ar y & se co nd ar y br an d co lor s Data viz colors Data viz monochromatic 2026 Full Year Outlook 14 Bold represents changes compared to the prior quarter. *Refer to Slide #2 regarding forward looking statements, expectations above assume no change to economic environment. **Non-GAAP measure. Refer to Form-10K furnished on February 18, 2026. Business Driver 2025 Actuals FY '26 As of 07/21/26* Notes EOP Loans $25.7 billion Over 10% Pipelines remain consistent with the first half of the year EOP Inv Securities $15.4 billion Flat Net Interest Income $1.3 billion $1.42 to $1.45 billion Assumes no changes to the Fed Funds rate through year-end 2026. Longer-term rate assumptions are consistent with market- implied forward rates. Fees & Commissions $801 million $820 to $845 million Reflects mid‑single‑digit fee growth excluding trading Total Revenue $2.2 billion Mid single-digit growth rate Likely toward the upper end of the range Expenses $1.4 billion Low single-digit growth Likely toward the lower end of the range Efficiency Ratio** 65.1% ~62% Adjusted to exclude Visa Class B gain, the efficiency ratio would be ~63% Provision Expense $2 million Below $20 million Although credit metrics are expected to normalize over time, current trends continue to perform better than historical norms

Pri m ar y & se co nd ar y br an d co lor s Data viz colors Data viz monochromatic Question & Answer Session 15
Pri m ar y & se co nd ar y br an d co lor s Data viz colors Data viz monochromatic Stacy Kymes Chief Executive Officer 16

Pri m ar y & se co nd ar y br an d co lor s Data viz colors Data viz monochromatic Appendix 17
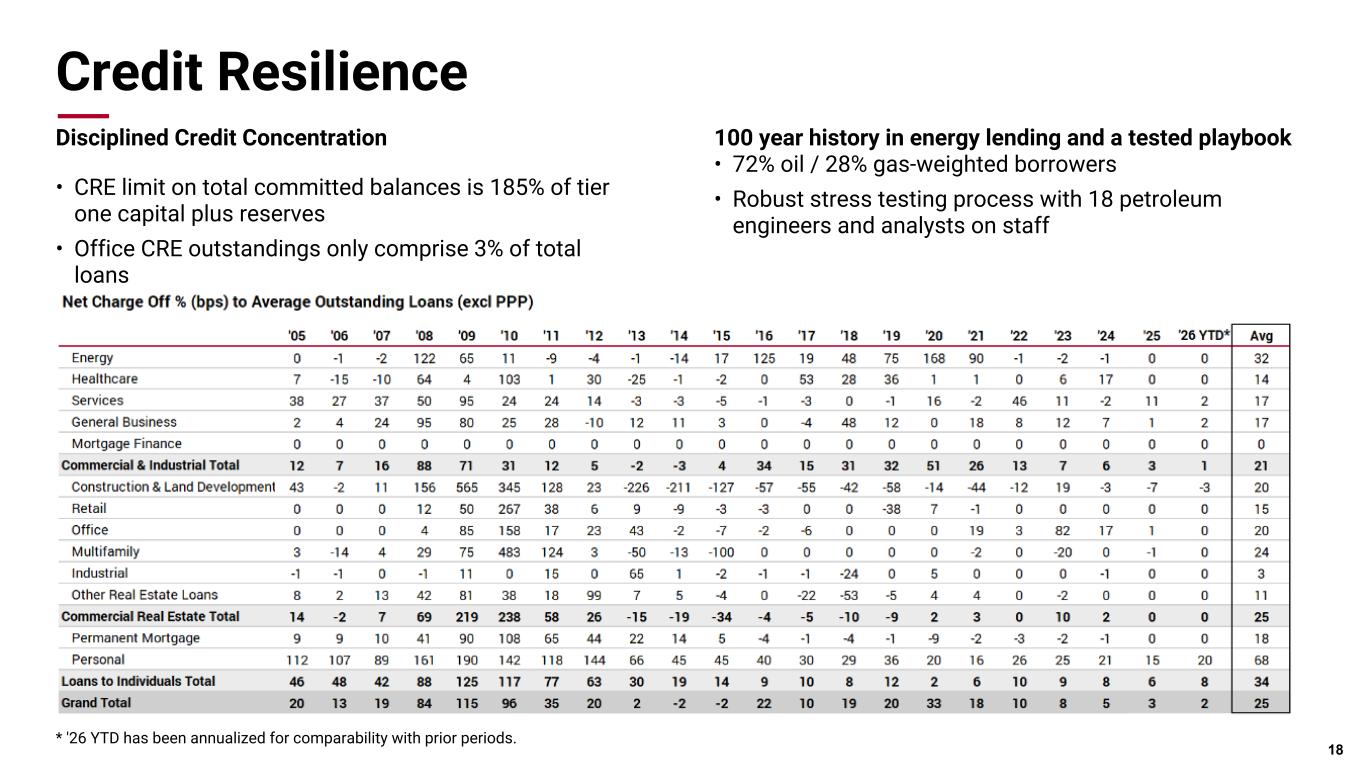
Pri m ar y & se co nd ar y br an d co lor s Data viz colors Data viz monochromatic Credit Resilience Disciplined Credit Concentration • CRE limit on total committed balances is 185% of tier one capital plus reserves • Office CRE outstandings only comprise 3% of total loans 18 100 year history in energy lending and a tested playbook • 72% oil / 28% gas-weighted borrowers • Robust stress testing process with 18 petroleum engineers and analysts on staff * '26 YTD has been annualized for comparability with prior periods.
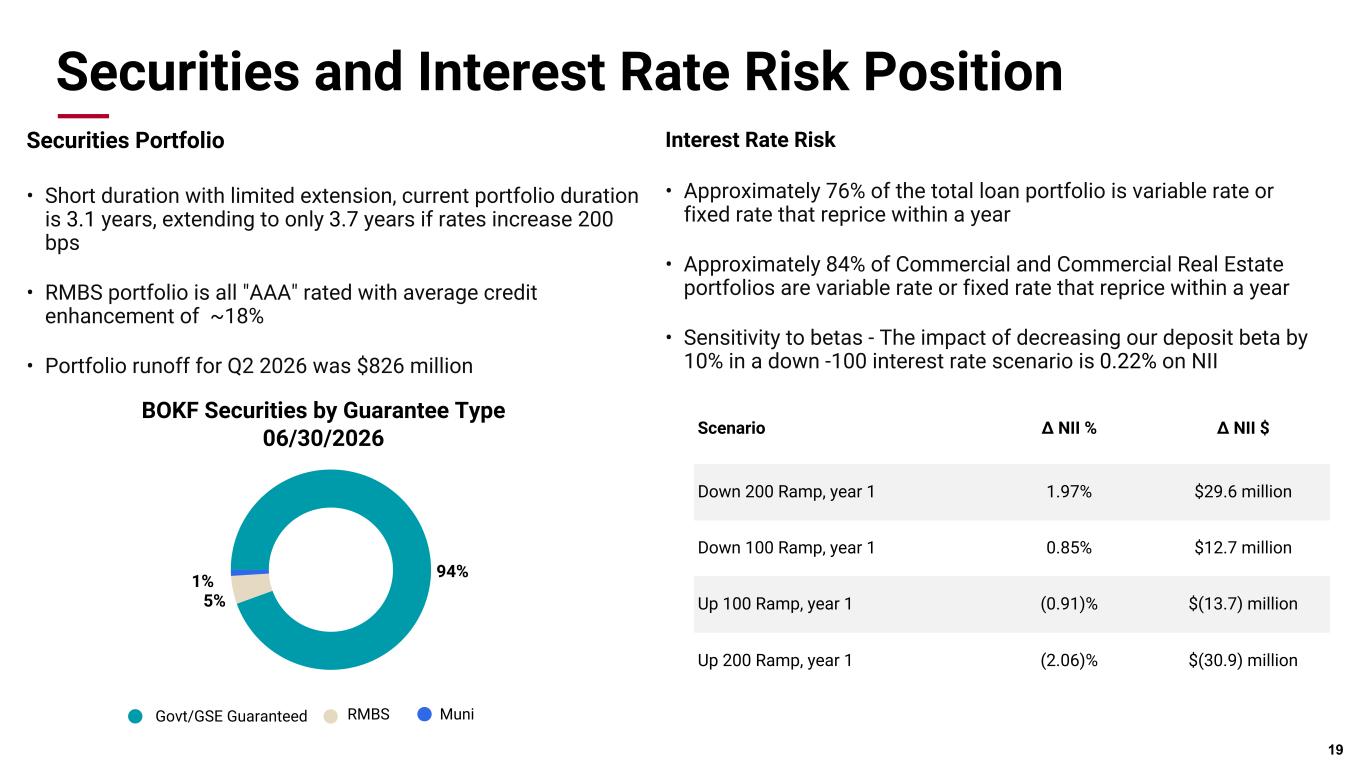
Pri m ar y & se co nd ar y br an d co lor s Data viz colors Data viz monochromatic Securities and Interest Rate Risk Position Interest Rate Risk • Approximately 76% of the total loan portfolio is variable rate or fixed rate that reprice within a year • Approximately 84% of Commercial and Commercial Real Estate portfolios are variable rate or fixed rate that reprice within a year • Sensitivity to betas - The impact of decreasing our deposit beta by 10% in a down -100 interest rate scenario is 0.22% on NII 19 Scenario Δ NII % Δ NII $ Down 200 Ramp, year 1 1.97% $29.6 million Down 100 Ramp, year 1 0.85% $12.7 million Up 100 Ramp, year 1 (0.91)% $(13.7) million Up 200 Ramp, year 1 (2.06)% $(30.9) million Securities Portfolio • Short duration with limited extension, current portfolio duration is 3.1 years, extending to only 3.7 years if rates increase 200 bps • RMBS portfolio is all "AAA" rated with average credit enhancement of ~18% • Portfolio runoff for Q2 2026 was $826 million 94% 5% 1% Govt/GSE Guaranteed RMBS Muni BOKF Securities by Guarantee Type 06/30/2026
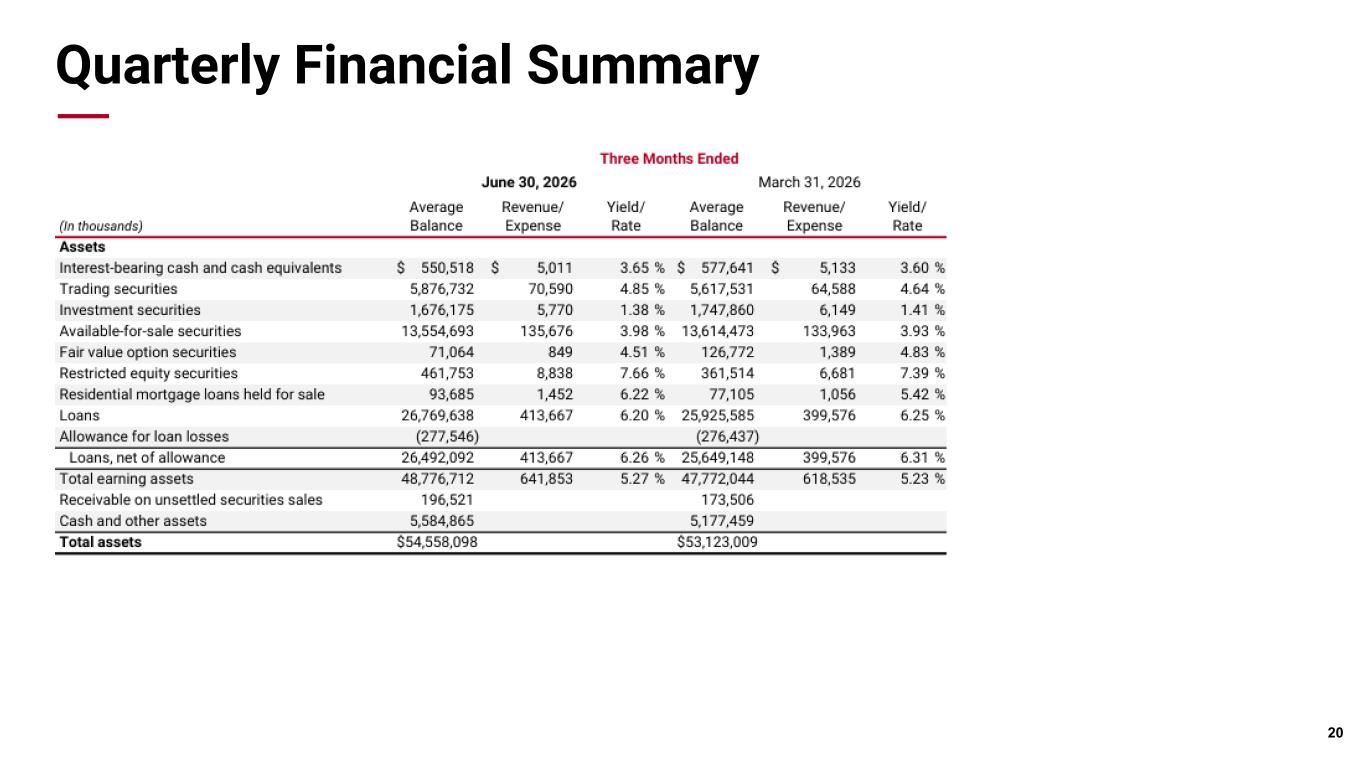
Pri m ar y & se co nd ar y br an d co lor s Data viz colors Data viz monochromatic Quarterly Financial Summary 20
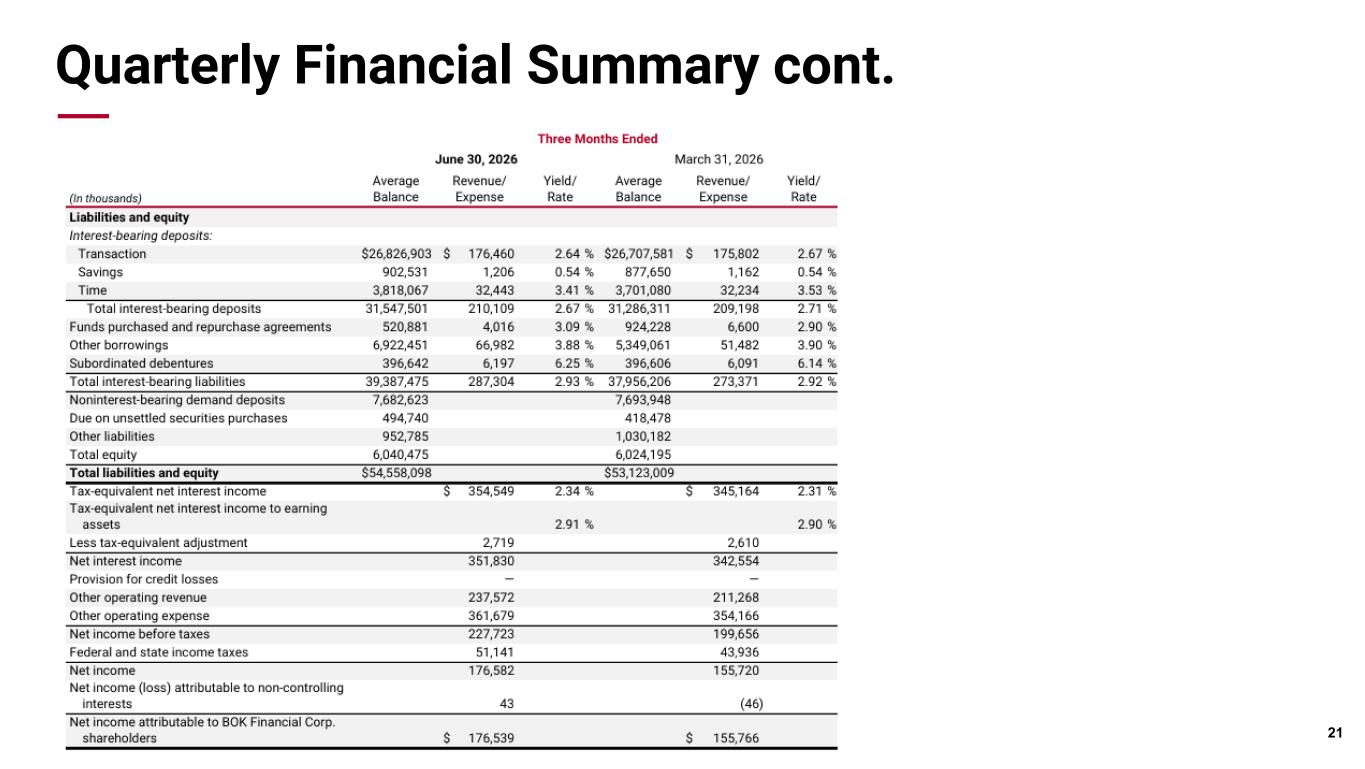
Pri m ar y & se co nd ar y br an d co lor s Data viz colors Data viz monochromatic Quarterly Financial Summary cont. 21
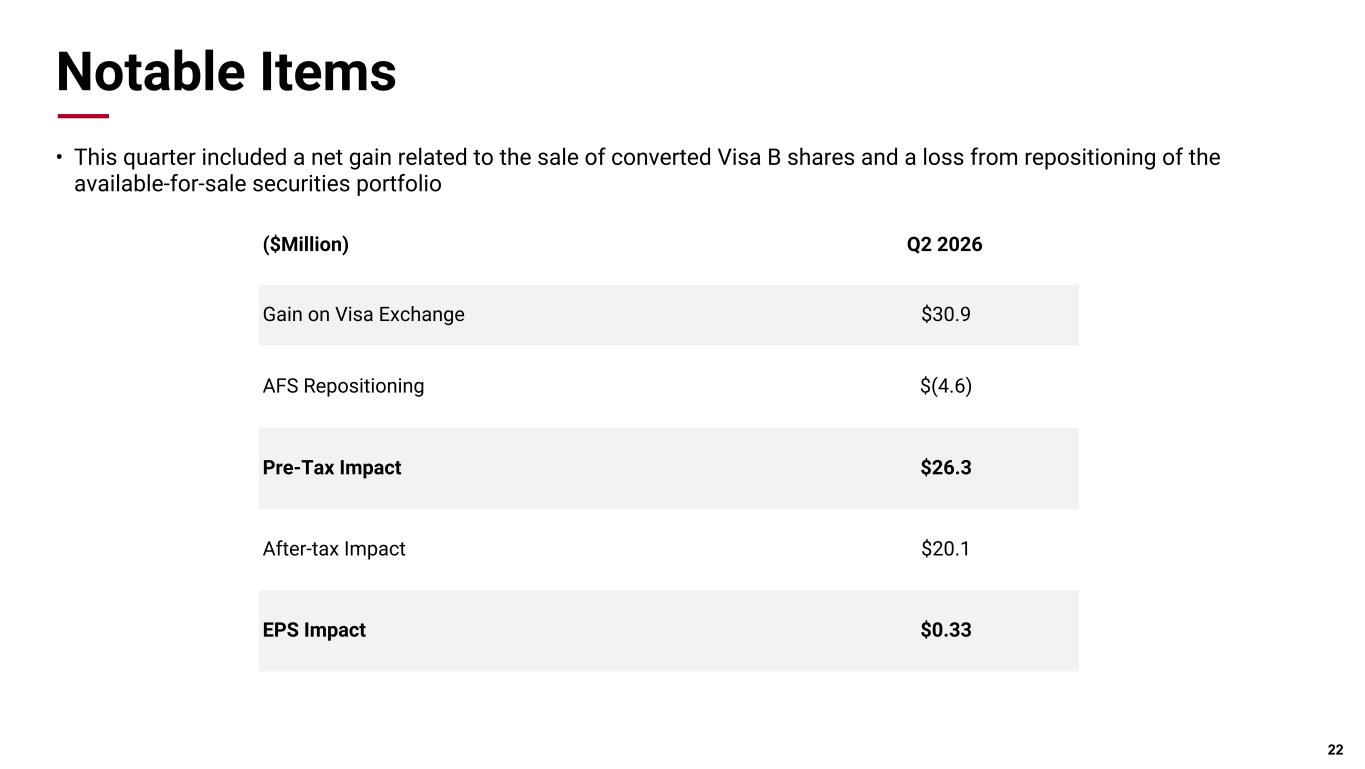
Pri m ar y & se co nd ar y br an d co lor s Data viz colors Data viz monochromatic Notable Items • This quarter included a net gain related to the sale of converted Visa B shares and a loss from repositioning of the available-for-sale securities portfolio 22 ($Million) Q2 2026 Gain on Visa Exchange $30.9 AFS Repositioning $(4.6) Pre-Tax Impact $26.3 After-tax Impact $20.1 EPS Impact $0.33

Pri m ar y & se co nd ar y br an d co lor s Data viz colors Data viz monochromatic