
Earnings Webcast July 17, 2026 Second Quarter 2026 Exhibit 1

About projections and forward-looking statements 0 Additional information about Vista Energy, S.A.B. de C.V., a sociedad anónima bursátil de capital variable organized under the laws of Mexico (the “Company” or “Vista”) can be found in the “Investors” section on the website at www.vistaenergy.com. This presentation does not constitute an offer to sell or a solicitation of any offer to buy any securities of the Company, in any jurisdiction. Securities may not be offered or sold in the United States absent registration with the U.S. Securities Exchange Commission (“SEC”), the Mexican National Securities Registry held by the Mexican National Banking and Securities Commission (“CNBV”) or an exemption from such registrations. This presentation does not contain all the Company’s financial information. As a result, investors should read this presentation in conjunction with the Company’s consolidated financial statements and other financial information available on the Company’s website. Some of the amounts contained herein are unaudited. Rounding amounts and percentages: Certain amounts and percentages included in this presentation have been rounded for ease of presentation. Percentage figures included in this presentation have not in all cases been calculated on the basis of such rounded figures, but on the basis of such amounts prior to rounding. For this reason, certain percentage amounts in this presentation may vary from those obtained by performing the same calculations using the figures in the financial statements. In addition, certain other amounts that appear in this presentation may not sum due to rounding. This presentation contains certain metrics that do not have standardized meanings or standard methods of calculation and therefore such measures may not be comparable to similar measures used by other companies. Such metrics have been included herein to provide readers with additional measures to evaluate the Company’s performance; however, such measures are not reliable indicators of future performance of the Company and future results may not be comparable to past performance. No reliance should be placed for any purpose whatsoever on the information contained in this document or on its completeness. Certain information contained in this presentation has been obtained from published sources, which may not have been independently verified or audited. No representation or warranty, express or implied, is given or will be given by or on behalf of the Company, or any of its affiliates (within the meaning of Rule 405 under the U.S. Securities Act of 1933, as amended, “Affiliates”), members, directors, officers or employees or any other person (the “Related Parties”) as to the accuracy, completeness or fairness of the information or opinions contained in this presentation or any other material discussed verbally, and any reliance you place on them will be at your sole risk. Any opinions presented herein are based on general information gathered at the time of writing and are subject to change without notice. In addition, no responsibility, obligation or liability (whether direct or indirect, in contract, tort or otherwise) is or will be accepted by the Company or any of its Related Parties in relation to such information or opinions or any other matter in connection with this presentation or its contents or otherwise arising in connection therewith. This presentation also includes certain non-IFRS (International Financial Reporting Standards) financial measures which have not been subject to a financial audit for any period. The information and opinions contained in this presentation are provided as of the date of this presentation and are subject to verification, completion and change without notice. This presentation includes “forward-looking statements” concerning the future. Words such as “believes,” “thinks,” “forecasts,” “expects,” “anticipates,” “intends,” “should,” “seeks,” “estimates,” and “future” or similar expressions are included with the intention of identifying statements about the future. For the avoidance of doubt, any projection, guidance or similar estimation about future results, performance or achievements is a forward-looking statement. Although the assumptions and estimates on which forward-looking statements are based are believed by our management to be reasonable and based on the best currently available information, such forward-looking statements are based on assumptions that are inherently subject to significant uncertainties and contingencies, many of which are beyond our control. There will be differences between actual and projected results, and actual results may be materially greater or materially less than those contained in the projections. Projections related to production results as well as cost estimations – including any anticipated performance and guidance of Vista included in this presentation – are based on information as of the date of this presentation and reflect numerous assumptions including assumptions with respect to type curves for new well designs and certain frac spacing expectations, all of which are difficult to predict and many of which are beyond our control and remain subject to several risks and uncertainties. The inclusion of the projected financial information in this document should not be regarded as an indication that we or our management considered or consider the projections to be a reliable prediction of future events. As such, no representation can be made as to the attainability of projections, guidances or other estimations of future results, performance or achievements. We have not warranted the accuracy, reliability, appropriateness or completeness of the projections to anyone. Neither our management nor any of our representatives has made or makes any representation to any person regarding our future performance compared to the information contained in the projections, and none of them intends to or undertakes any obligation to update or otherwise revise the projections to reflect circumstances existing after the date when made or to reflect the occurrence of future events in the event that any or all of the assumptions underlying the projections are shown to be in error. We may or may not refer back to these projections in our future periodic reports filed or furnished under the Securities Exchange Act of 1934. These expectations and projections are subject to significant known and unknown risks and uncertainties which may cause our actual results, performance or achievements, or industry results, to be materially different from any expected or projected results, performance or achievements expressed or implied by such forward-looking statements. Many important factors could cause our actual results, performance or achievements to differ materially from those expressed or implied in our forward looking statements, including, among other things uncertainties relating to future government concessions and exploration permits; adverse outcomes in litigation that may arise in the future; general political, economic, social, demographic and business conditions in Argentina, Mexico and in other countries in which we may operate in the future; the impact of political developments and uncertainties relating to political and economic conditions in Argentina, including the policies of the current government in Argentina; significant economic or political developments in Mexico, Argentina and the United States; changes in law, rules, regulations and interpretations and enforcements thereto applicable to the Argentine and Mexican energy sectors and throughout Latin America, including changes to the regulatory environment in which we operate and changes to programs established to promote investments in the energy industry; any unexpected increases in financing costs or an inability to obtain financing and/or additional capital pursuant to attractive terms; any changes in the capital markets in general that may affect the policies or attitude in Argentina and/or Mexico, and/or Argentine and Mexican companies with respect to financings extended to or investments made in Argentina and Mexico or Argentine and Mexican companies; fines or other penalties and claims by the authorities and/or customers; restrictions on the ability to exchange Mexican or Argentine Pesos into foreign currencies or to transfer funds abroad; the imposition of import restrictions on goods that are key for the maintenance of our assets; the revocation or amendment of our respective concession agreements by the granting authority; our ability to renew certain hydrocarbon exploitation concessions; our ability to implement our capital expenditures plans or business strategy, including our ability to obtain financing when necessary and on reasonable terms; government intervention, including measures that result in changes to the Argentine and Mexican labor markets, exchange markets or tax systems; continued and/or higher rates of inflation and fluctuations in exchange rates, including the devaluation and/or appreciation of the Mexican Peso or Argentine Peso; any force majeure events, or fluctuations or reductions in the value of Argentine public debt; changes to the demand for oil and gas in particular, and energy in general, both in Argentina and globally; the effects of a pandemic or epidemic and any subsequent mandatory regulatory restrictions or containment measures; environmental, health and safety regulations and industry standards that are becoming more stringent; energy markets, including the timing and extent of changes and volatility in commodity prices, and the impact of any protracted or material reduction in oil prices from historical averages; our relationship with our employees and our ability to retain key members of our senior management and key technical employees; the ability of our directors and officers to identify an adequate number of potential acquisition opportunities; our expectations with respect to the performance of our recently acquired businesses, including Vista LACh; our expectations for future production, costs and crude oil prices used in our projections; changes to our capital expenditure plans; uncertainties inherent in making estimates of our oil and gas reserves, including recently discovered oil and gas reserves, and changes to our previous reserves estimates; increased market competition in the energy sectors in Argentina and Mexico; potential regulatory changes and modifications to free trade agreements driven by evolving U.S. trade policies and political developments in Argentina, Mexico or other Latin American countries; climate change and severe weather events; any potential adverse effects that may arise in connection with any prospective mergers, acquisitions, divestitures, or other corporate reorganizations; adverse global macroeconomic environments, including trade wars, high inflation, a global recession, and increasing market volatility, especially in relation to commodities prices; and ongoing and potential geopolitical conflicts, including, among others, those involving Russia and Ukraine; the United States, Israel, Hamas, Iran and several countries in the Middle East; and tensions between China and Taiwan. Forward looking statements speak only as of the date on which they were made, and we undertake no obligation to release publicly any updates or revisions to any forward looking statements contained herein because of new information, future events or other factors. In light of these limitations, undue reliance should not be placed on forward looking statements contained in this presentation. Further information concerning risks and uncertainties associated with these forward looking statements and Vista’s business can be found in Vista’s public disclosures filed on EDGAR (www.sec.gov) or at the web page of the Mexican Stock Exchange (www.bmv.com.mx). You should not take any statement regarding past trends or activities as a representation that such trends or activities will continue in the future. Accordingly, you should not put undue reliance on these statements. This presentation is not intended to constitute and should not be construed as investment advice. Other Information. Vista routinely publishes important information for investors in the Investor Relations support section on its website, www.vistaenergy.com. From time to time, Vista may use its website as a channel for distributing material information. Accordingly, investors should monitor Vista’s Investor Relations website, in addition to following Vista’s press releases, SEC filings, public conference calls and webcasts.
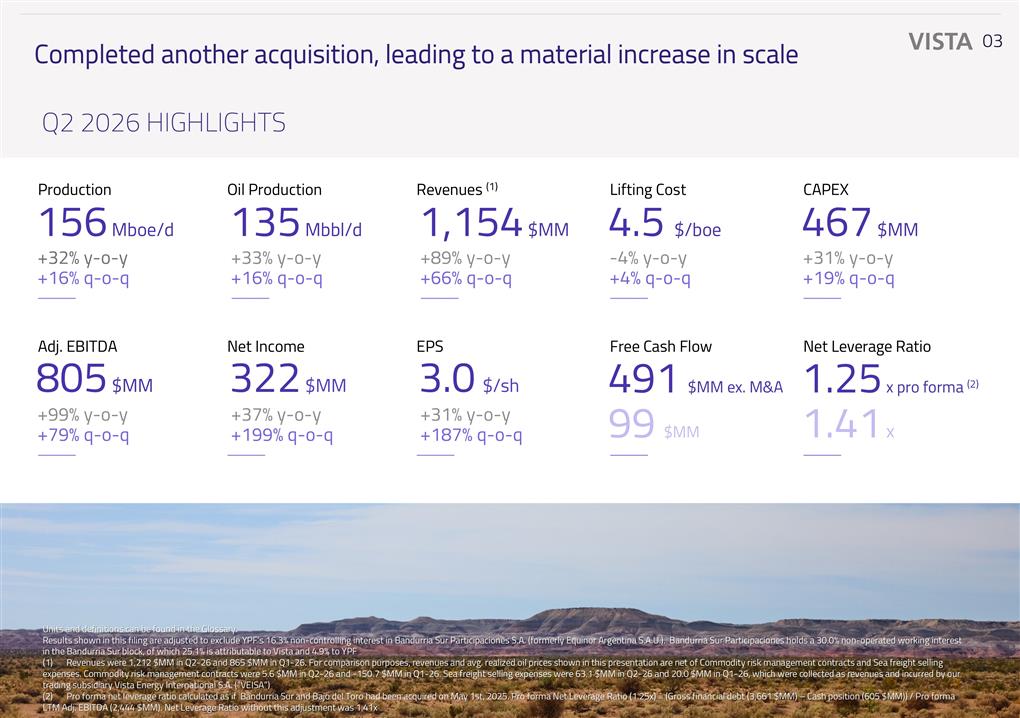
Units and definitions can be found in the Glossary. Results shown in this filing are adjusted to exclude YPF’s 16.3% non-controlling interest in Bandurria Sur Participaciones S.A. (formerly Equinor Argentina S.A.U.). Bandurria Sur Participaciones holds a 30.0% non-operated working interest in the Bandurria Sur block, of which 25.1% is attributable to Vista and 4.9% to YPF (1)Revenues were 1,212 $MM in Q2-26 and 865 $MM in Q1-26. For comparison purposes, revenues and avg. realized oil prices shown in this presentation are net of Commodity risk management contracts and Sea freight selling expenses. Commodity risk management contracts were 5.6 $MM in Q2-26 and -150.7 $MM in Q1-26. Sea freight selling expenses were 63.1 $MM in Q2-26 and 20.0 $MM in Q1-26, which were collected as revenues and incurred by our trading subsidiary Vista Energy International S.A. (“VEISA”) (2)Pro forma net leverage ratio calculated as if Bandurria Sur and Bajo del Toro had been acquired on May 1st, 2025. Pro forma Net Leverage Ratio (1.25x) = (Gross financial debt (3,661 $MM) – Cash position (605 $MM)) / Pro forma LTM Adj. EBITDA (2,444 $MM). Net Leverage Ratio without this adjustment was 1.41x Q2 2026 HIGHLIGHTS 156 Mboe/d Production +32% y-o-y +16% q-o-q 135 Mbbl/d Oil Production +33% y-o-y +16% q-o-q 1,154 $MM Revenues (1) +89% y-o-y +66% q-o-q 4.5 $/boe Lifting Cost -4% y-o-y +4% q-o-q 467 $MM CAPEX +31% y-o-y +19% q-o-q 805 $MM Adj. EBITDA +99% y-o-y +79% q-o-q 322 $MM Net Income 99 $MM Free Cash Flow 1.41 x Net Leverage Ratio 3.0 $/sh EPS 0 Completed another acquisition, leading to a material increase in scale +37% y-o-y +199% q-o-q +31% y-o-y +187% q-o-q 491 $MM ex. M&A 1.25 x pro forma (2)
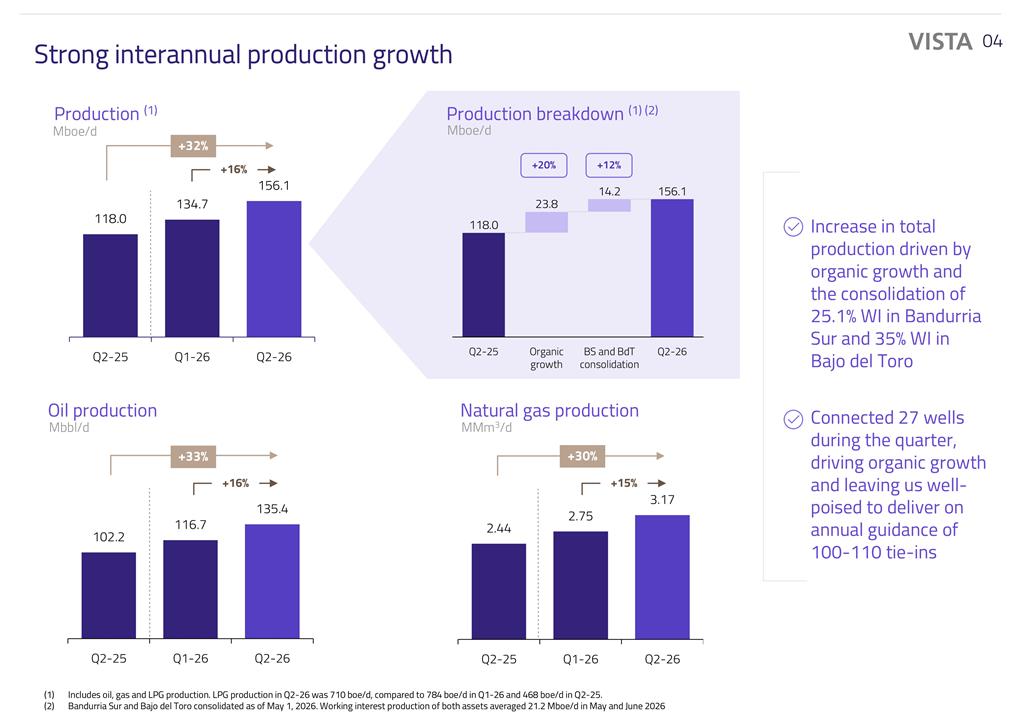
Strong interannual production growth 0 Production (1) Mboe/d Oil production Mbbl/d Natural gas production MMm3/d Production breakdown (1) (2) Mboe/d +30% +33% +32% Increase in total production driven by organic growth and the consolidation of 25.1% WI in Bandurria Sur and 35% WI in Bajo del Toro Connected 27 wells during the quarter, driving organic growth and leaving us well-poised to deliver on annual guidance of 100-110 tie-ins Includes oil, gas and LPG production. LPG production in Q2-26 was 710 boe/d, compared to 784 boe/d in Q1-26 and 468 boe/d in Q2-25. Bandurria Sur and Bajo del Toro consolidated as of May 1, 2026. Working interest production of both assets averaged 21.2 Mboe/d in May and June 2026 +16% +16% +15% +20% +12%
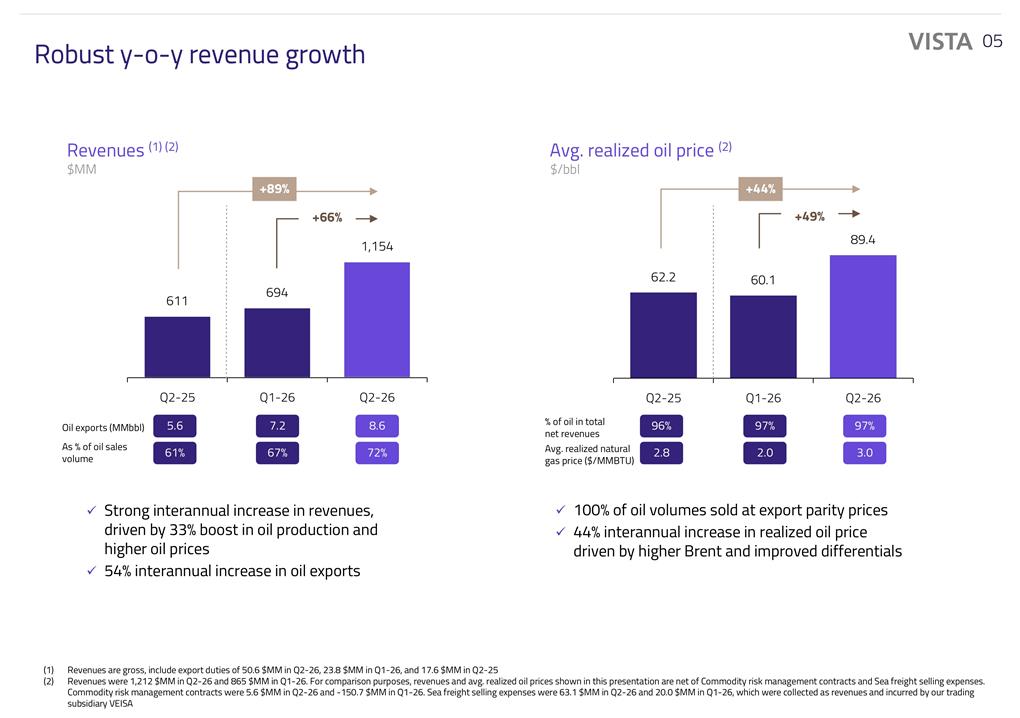
Robust y-o-y revenue growth 0 Revenues (1) (2) 100% of oil volumes sold at export parity prices 44% interannual increase in realized oil price driven by higher Brent and improved differentials Revenues are gross, include export duties of 50.6 $MM in Q2-26, 23.8 $MM in Q1-26, and 17.6 $MM in Q2-25 Revenues were 1,212 $MM in Q2-26 and 865 $MM in Q1-26. For comparison purposes, revenues and avg. realized oil prices shown in this presentation are net of Commodity risk management contracts and Sea freight selling expenses. Commodity risk management contracts were 5.6 $MM in Q2-26 and -150.7 $MM in Q1-26. Sea freight selling expenses were 63.1 $MM in Q2-26 and 20.0 $MM in Q1-26, which were collected as revenues and incurred by our trading subsidiary VEISA +89% Strong interannual increase in revenues, driven by 33% boost in oil production and higher oil prices 54% interannual increase in oil exports 61% 67% 72% 5.6 7.2 8.6 As % of oil sales volume Oil exports (MMbbl) $MM 2.8 2.0 3.0 96% 97% 97% Avg. realized natural gas price ($/MMBTU) % of oil in total net revenues $/bbl +44% Avg. realized oil price (2) +66% +49%
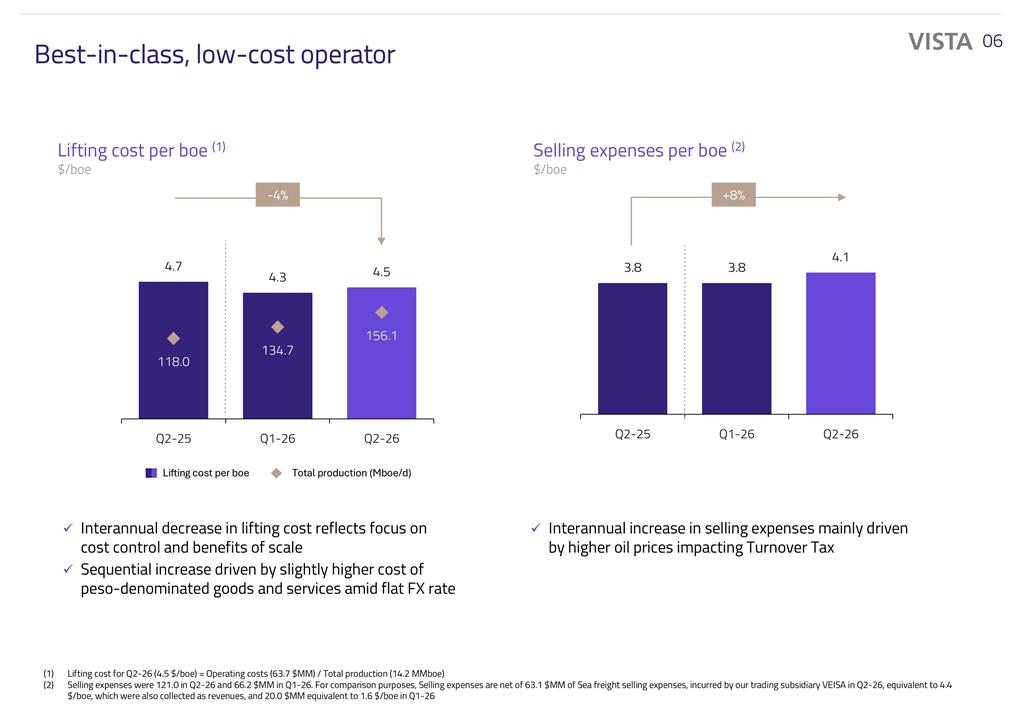
Best-in-class, low-cost operator 0 Selling expenses per boe (2) Lifting cost per boe (1) Interannual decrease in lifting cost reflects focus on cost control and benefits of scale Sequential increase driven by slightly higher cost of peso-denominated goods and services amid flat FX rate Lifting cost for Q2-26 (4.5 $/boe) = Operating costs (63.7 $MM) / Total production (14.2 MMboe) Selling expenses were 121.0 in Q2-26 and 66.2 $MM in Q1-26. For comparison purposes, Selling expenses are net of 63.1 $MM of Sea freight selling expenses, incurred by our trading subsidiary VEISA in Q2-26, equivalent to 4.4 $/boe, which were also collected as revenues, and 20.0 $MM equivalent to 1.6 $/boe in Q1-26 Total production (Mboe/d) Lifting cost per boe -4% $/boe $/boe Interannual increase in selling expenses mainly driven by higher oil prices impacting Turnover Tax +8%
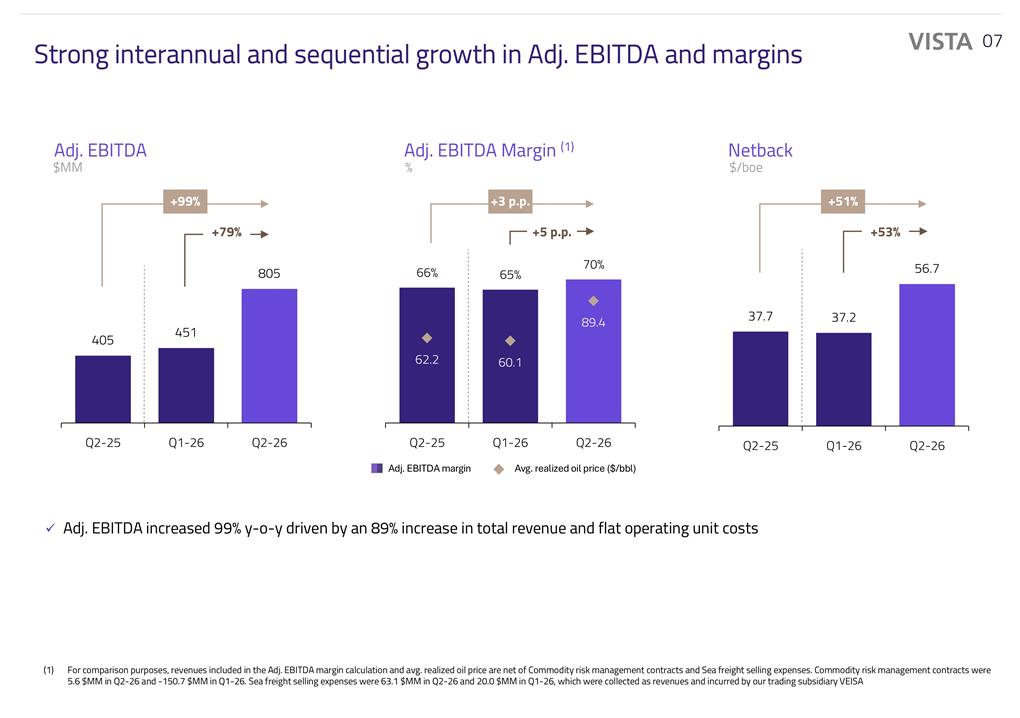
Strong interannual and sequential growth in Adj. EBITDA and margins 0 Adj. EBITDA $MM Adj. EBITDA Margin (1) % Netback $/boe Avg. realized oil price ($/bbl) Adj. EBITDA margin +99% +3 p.p. For comparison purposes, revenues included in the Adj. EBITDA margin calculation and avg. realized oil price are net of Commodity risk management contracts and Sea freight selling expenses. Commodity risk management contracts were 5.6 $MM in Q2-26 and -150.7 $MM in Q1-26. Sea freight selling expenses were 63.1 $MM in Q2-26 and 20.0 $MM in Q1-26, which were collected as revenues and incurred by our trading subsidiary VEISA +79% +5 p.p. +51% +53% Adj. EBITDA increased 99% y-o-y driven by an 89% increase in total revenue and flat operating unit costs
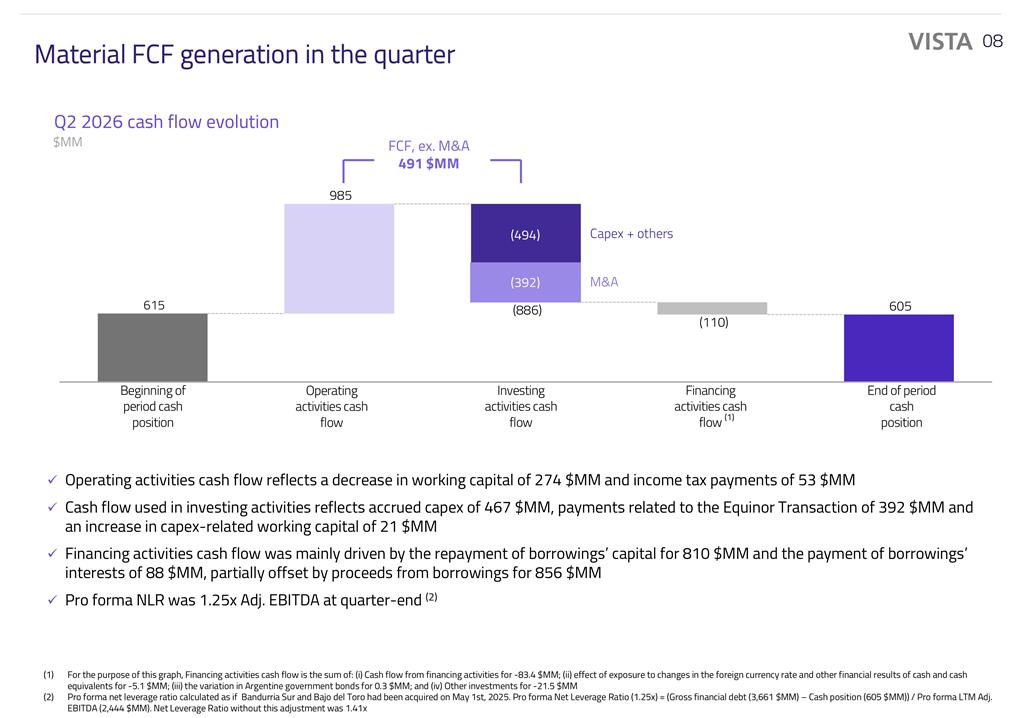
Material FCF generation in the quarter 0 Operating activities cash flow reflects a decrease in working capital of 274 $MM and income tax payments of 53 $MM Cash flow used in investing activities reflects accrued capex of 467 $MM, payments related to the Equinor Transaction of 392 $MM and an increase in capex-related working capital of 21 $MM Financing activities cash flow was mainly driven by the repayment of borrowings’ capital for 810 $MM and the payment of borrowings’ interests of 88 $MM, partially offset by proceeds from borrowings for 856 $MM Pro forma NLR was 1.25x Adj. EBITDA at quarter-end (2) Beginning of period cash position End of period cash position Investing activities cash flow Operating activities cash flow Financing activities cash flow (1) Q2 2026 cash flow evolution $MM For the purpose of this graph, Financing activities cash flow is the sum of: (i) Cash flow from financing activities for -83.4 $MM; (ii) effect of exposure to changes in the foreign currency rate and other financial results of cash and cash equivalents for -5.1 $MM; (iii) the variation in Argentine government bonds for 0.3 $MM; and (iv) Other investments for -21.5 $MM Pro forma net leverage ratio calculated as if Bandurria Sur and Bajo del Toro had been acquired on May 1st, 2025. Pro forma Net Leverage Ratio (1.25x) = (Gross financial debt (3,661 $MM) – Cash position (605 $MM)) / Pro forma LTM Adj. EBITDA (2,444 $MM). Net Leverage Ratio without this adjustment was 1.41x (392) M&A FCF, ex. M&A 491 $MM (494) Capex + others
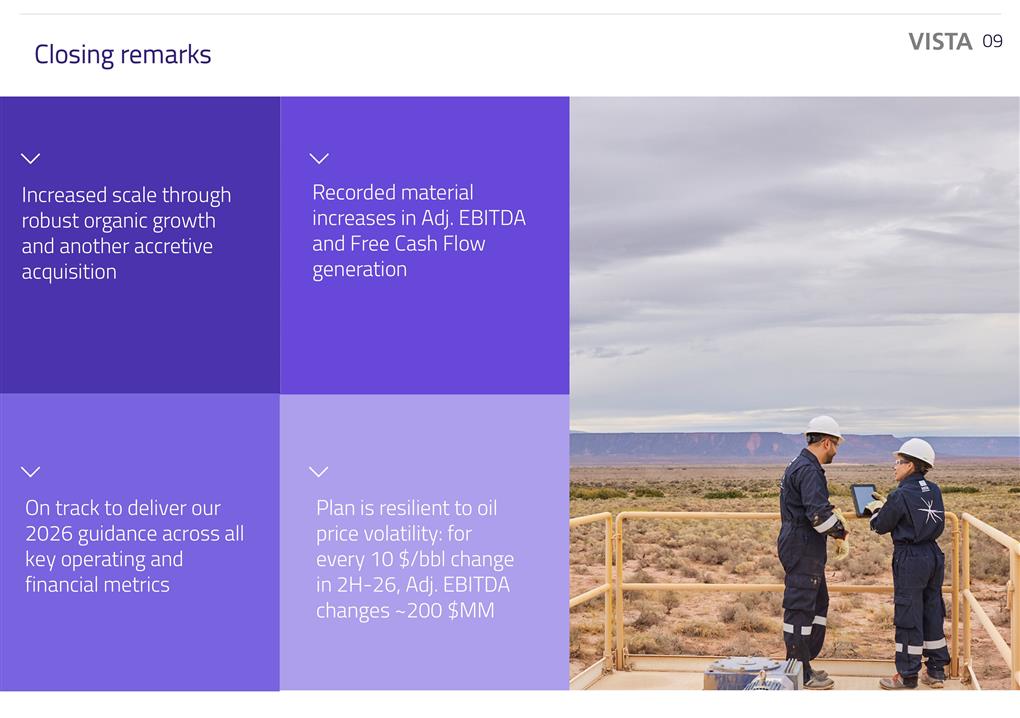
Closing remarks 0 Increased scale through robust organic growth and another accretive acquisition Recorded material increases in Adj. EBITDA and Free Cash Flow generation Plan is resilient to oil price volatility: for every 10 $/bbl change in 2H-26, Adj. EBITDA changes ~200 $MM On track to deliver our 2026 guidance across all key operating and financial metrics

Q&A THANKS!
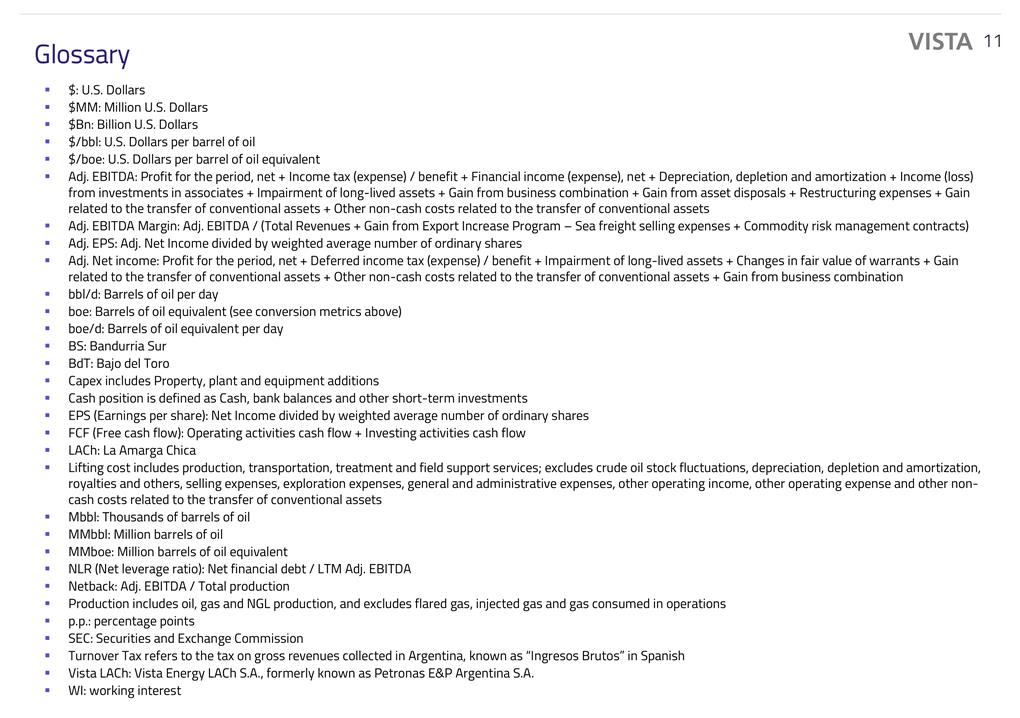
Glossary $: U.S. Dollars $MM: Million U.S. Dollars $Bn: Billion U.S. Dollars $/bbl: U.S. Dollars per barrel of oil $/boe: U.S. Dollars per barrel of oil equivalent Adj. EBITDA: Profit for the period, net + Income tax (expense) / benefit + Financial income (expense), net + Depreciation, depletion and amortization + Income (loss) from investments in associates + Impairment of long-lived assets + Gain from business combination + Gain from asset disposals + Restructuring expenses + Gain related to the transfer of conventional assets + Other non-cash costs related to the transfer of conventional assets Adj. EBITDA Margin: Adj. EBITDA / (Total Revenues + Gain from Export Increase Program – Sea freight selling expenses + Commodity risk management contracts) Adj. EPS: Adj. Net Income divided by weighted average number of ordinary shares Adj. Net income: Profit for the period, net + Deferred income tax (expense) / benefit + Impairment of long-lived assets + Changes in fair value of warrants + Gain related to the transfer of conventional assets + Other non-cash costs related to the transfer of conventional assets + Gain from business combination bbl/d: Barrels of oil per day boe: Barrels of oil equivalent (see conversion metrics above) boe/d: Barrels of oil equivalent per day BS: Bandurria Sur BdT: Bajo del Toro Capex includes Property, plant and equipment additions Cash position is defined as Cash, bank balances and other short-term investments EPS (Earnings per share): Net Income divided by weighted average number of ordinary shares FCF (Free cash flow): Operating activities cash flow + Investing activities cash flow LACh: La Amarga Chica Lifting cost includes production, transportation, treatment and field support services; excludes crude oil stock fluctuations, depreciation, depletion and amortization, royalties and others, selling expenses, exploration expenses, general and administrative expenses, other operating income, other operating expense and other non-cash costs related to the transfer of conventional assets Mbbl: Thousands of barrels of oil MMbbl: Million barrels of oil MMboe: Million barrels of oil equivalent NLR (Net leverage ratio): Net financial debt / LTM Adj. EBITDA Netback: Adj. EBITDA / Total production Production includes oil, gas and NGL production, and excludes flared gas, injected gas and gas consumed in operations p.p.: percentage points SEC: Securities and Exchange Commission Turnover Tax refers to the tax on gross revenues collected in Argentina, known as “Ingresos Brutos” in Spanish Vista LACh: Vista Energy LACh S.A., formerly known as Petronas E&P Argentina S.A. WI: working interest $: U.S. Dollars $MM: Million U.S. Dollars $Bn: Billion U.S. Dollars $/bbl: U.S. Dollars per barrel of oil $/boe: U.S. Dollars per barrel of oil equivalent Adj. EBITDA: Profit for the period, net + Income tax (expense) / benefit + Financial income (expense), net + Depreciation, depletion and amortization + Income (loss) from investments in associates + Impairment of long-lived assets + Gain from business combination + Gain from asset disposals + Restructuring expenses + Gain related to the transfer of conventional assets + Other non-cash costs related to the transfer of conventional assets Adj. EBITDA Margin: Adj. EBITDA / (Total Revenues + Gain from Export Increase Program – Sea freight selling expenses + Commodity risk management contracts) Adj. EPS: Adj. Net Income divided by weighted average number of ordinary shares Adj. Net income: Profit for the period, net + Deferred income tax (expense) / benefit + Impairment of long-lived assets + Changes in fair value of warrants + Gain related to the transfer of conventional assets + Other non-cash costs related to the transfer of conventional assets + Gain from business combination AF: Aguada Federal AM: Águila Mora bbl/d: Barrels of oil per day boe: Barrels of oil equivalent (see conversion metrics above) boe/d: Barrels of oil equivalent per day BN: Bandurria Norte BS: Bandurria Sur BPE: Bajada del Palo Este BPO: Bajada del Palo Oeste BdT: Bajo del Toro Capex includes Property, plant and equipment additions Cash position is defined as Cash, bank balances and other short-term investments D&C: drilling and completion EPS (Earnings per share): Net Income divided by weighted average number of ordinary shares FCF (Free cash flow): Operating activities cash flow + Investing activities cash flow GHG emissions: Scope 1 & 2 greenhouse gas emissions from our operated assets at 100% working interest LACh: La Amarga Chica Lifting cost includes production, transportation, treatment and field support services; excludes crude oil stock fluctuations, depreciation, depletion and amortization, royalties and others, selling expenses, exploration expenses, general and administrative expenses, other operating income, other operating expense and other non-cash costs related to the transfer of conventional assets Mbbl: Thousands of barrels of oil MMbbl: Million barrels of oil MMboe: Million barrels of oil equivalent NLR (Net leverage ratio): Net financial debt / LTM Adj. EBITDA Netback: Adj. EBITDA / Total production Production includes oil, gas and NGL production, and excludes flared gas, injected gas and gas consumed in operations p.p.: percentage points ROACE: (Adj. EBITDA – Depreciation, depletion and amortization + Gain related to the transfer of conventional assets + Other non-cash costs related to the transfer of conventional assets + Gain from business combination) / (Average total debt + Average total shareholders’ equity). Total Debt = Current Borrowings + Non-current Borrowings + Current Lease liabilities + Non-current Lease liabilities ROFR: Right of First Refusal SEC: Securities and Exchange Commission TRIR (Total recordable injury rate): Number of recordable incidents x 1,000,000 / total number of hours worked Vista LACh: Vista Energy LACh S.A., formerly known as Petronas E&P Argentina S.A. WI: working interest