Pay vs Performance Disclosure - USD ($)
Mar. 31, 2026
Mar. 31, 2025
Mar. 31, 2024
Mar. 31, 2023
Mar. 31, 2022
Fiscal Year | Summary Compensation Table Total for PEO1 ($) | Compensation Actually Paid to PEO1,2,3,4 ($) | Average Summary Compensation Table Total for Non-PEO NEOs1 ($) | Average Compensation Actually Paid to Non-PEO NEOs1,2,3,4 ($) | Value of Initial Fixed $100 Investment based on:5 | Net Income ($ Millions) | Adjusted EBITDA6 ($ Millions) | |
TSR ($) | Peer Group TSR ($) | |||||||
2026 | 403,019 | 403,019 | 6,429,468 | 5,123,009 | 112 | 137 | (298.2) | 1,401.6 |
2025 | 106,457 | 106,457 | 6,445,720 | 18,396,613 | 117 | 129 | (4,478.9) | 901.0 |
2024 | 274,074 | 274,074 | 5,788,486 | 6,261,216 | 84 | 121 | (3,744.2) | 845.2 |
2023 | 115,015 | 115,015 | 6,495,652 | 4,231,852 | 68 | 97 | (1,124.7) | 940.6 |
2022 | 142,996 | 142,996 | 3,316,198 | 2,134,073 | 87 | 107 | 418.0 | 827.2 |
Lainie Goldstein, Karl Slatoff, and Daniel Emerson.
by Item 201(e) of Regulation S-K included in our Annual Report on Form 10-K for the year ended March 31, 2026. The comparison assumes $100 was invested
for the period starting March 31, 2021, through the end of the listed fiscal year in the Company and in the RDG Technology Composite Index, respectively.
Historical stock performance is not necessarily indicative of future stock performance.
2022, the 2017 Management Agreement. The provisions of the 2022 Management Agreement and the 2017 Management Agreement establish the payments
and benefits to which ZMC is entitled as consideration for providing the services set forth therein. In general, in connection with their provision of services to the
Company, the actual amount of compensation received by Messrs. Zelnick and Slatoff is determined in the sole discretion of ZMC and without the Company’s
knowledge, except that, under the terms of the 2022 Management Agreement and the 2017 Management Agreement, Mr. Zelnick may not receive more than
60% of the payments and benefits made to ZMC and Mr. Slatoff may not receive more than 40% of the payments and benefits made to ZMC. Amounts paid by
ZMC to Messrs. Zelnick and Slatoff are not included in this disclosure.
Compensation Actually Paid reflects the exclusions and inclusions of certain amounts for the PEO and Non-PEO NEOs as set forth below. Equity values are calculated in accordance with ASC Topic 718. Amounts in the Exclusion of Stock Awards column are the totals from the Stock Awards column set forth in the
Summary Compensation Table.
Fiscal Year | Summary Compensation Table Total for PEO ($) | Exclusion of Stock Awards for PEO ($) | Inclusion of Equity Values for PEO ($) | Compensation Actually Paid to PEO ($) |
2026 | 403,019 | — | — | 403,019 |
Fiscal Year | Average Summary Compensation Table Total for Non-PEO NEOs ($) | Average Exclusion of Stock Awards for Non-PEO NEOs ($) | Average Inclusion of Equity Values for Non-PEO NEOs ($) | Average Compensation Actually Paid to Non-PEO NEOs ($) |
2026 | 6,429,468 | (4,095,163) | 2,788,704 | 5,123,009 |
The amounts in the Inclusion of Equity Values in the tables above are derived from the amounts set forth in the following tables:
Fiscal Year | Year-End Fair Value of Equity Awards Granted During Year That Remained Unvested as of Last Day of Year for PEO ($) | Change in Fair Value from Last Day of Prior Year to Last Day of Year of Unvested Equity Awards for PEO ($) | Vesting-Date Fair Value of Equity Awards Granted During Year that Vested During Year for PEO ($) | Change in Fair Value from Last Day of Prior Year to Vesting Date of Unvested Equity Awards that Vested During Year for PEO ($) | Fair Value at Last Day of Prior Year of Equity Awards Forfeited During Year for PEO ($) | Value of Dividends or Other Earnings Paid on Equity Awards Not Otherwise Included for PEO ($) | Total- Inclusion of Equity Values for PEO ($) |
2026 | — | — | — | — | — | — | — |
Fiscal Year | Average Year-End Fair Value of Equity Awards Granted During Year That Remained Unvested as of Last Day of Year for Non- PEO NEOs ($) | Average Change in Fair Value from Last Day of Prior Year to Last Day of Year of Unvested Equity Awards for Non-PEO NEOs ($) | Average Vesting-Date Fair Value of Equity Awards Granted During Year that Vested During Year for Non-PEO NEOs ($) | Average Change in Fair Value from Last Day of Prior Year to Vesting Date of Unvested Equity Awards that Vested During Year for Non-PEO NEOs ($) | Average Fair Value at Last Day of Prior Year of Equity Awards Forfeited During Year for Non-PEO NEOs ($) | Average Value of Dividends or Other Earnings Paid on Equity Awards Not Otherwise Included for Non-PEO NEOs ($) | Total - Average Inclusion of Equity Values for Non-PEO NEOs ($) |
2026 | 3,679,497 | (1,780,616) | — | 889,823 | — | — | 2,788,704 |
actually earned, realized, or received by the Company’s NEOs. These amounts reflect the Summary Compensation Table Total with certain adjustments as
described in footnote 4 below.
Messrs. Zelnick and Slatoff were compensated for their respective services to the Company under the 2022 Management Agreement and, prior to May 23, 2022, the 2017 Management Agreement. The provisions of the 2022 Management Agreement and the 2017 Management Agreement establish the payments
and benefits to which ZMC is entitled as consideration for providing the services set forth therein. In general, in connection with their provision of services to the
Company, the actual amount of compensation received by Messrs. Zelnick and Slatoff is determined in the sole discretion of ZMC and without the Company’s
knowledge, except that, under the terms of the 2022 Management Agreement and the 2017 Management Agreement, Mr. Zelnick may not receive more than
60% of the payments and benefits made to ZMC and Mr. Slatoff may not receive more than 40% of the payments and benefits made to ZMC. Amounts paid by
ZMC to Messrs. Zelnick and Slatoff are not included in this disclosure.
Compensation Actually Paid reflects the exclusions and inclusions of certain amounts for the PEO and Non-PEO NEOs as set forth below. Equity values are calculated in accordance with ASC Topic 718. Amounts in the Exclusion of Stock Awards column are the totals from the Stock Awards column set forth in the
Summary Compensation Table.
Fiscal Year | Summary Compensation Table Total for PEO ($) | Exclusion of Stock Awards for PEO ($) | Inclusion of Equity Values for PEO ($) | Compensation Actually Paid to PEO ($) |
2026 | 403,019 | — | — | 403,019 |
Fiscal Year | Average Summary Compensation Table Total for Non-PEO NEOs ($) | Average Exclusion of Stock Awards for Non-PEO NEOs ($) | Average Inclusion of Equity Values for Non-PEO NEOs ($) | Average Compensation Actually Paid to Non-PEO NEOs ($) |
2026 | 6,429,468 | (4,095,163) | 2,788,704 | 5,123,009 |
The amounts in the Inclusion of Equity Values in the tables above are derived from the amounts set forth in the following tables:
Fiscal Year | Year-End Fair Value of Equity Awards Granted During Year That Remained Unvested as of Last Day of Year for PEO ($) | Change in Fair Value from Last Day of Prior Year to Last Day of Year of Unvested Equity Awards for PEO ($) | Vesting-Date Fair Value of Equity Awards Granted During Year that Vested During Year for PEO ($) | Change in Fair Value from Last Day of Prior Year to Vesting Date of Unvested Equity Awards that Vested During Year for PEO ($) | Fair Value at Last Day of Prior Year of Equity Awards Forfeited During Year for PEO ($) | Value of Dividends or Other Earnings Paid on Equity Awards Not Otherwise Included for PEO ($) | Total- Inclusion of Equity Values for PEO ($) |
2026 | — | — | — | — | — | — | — |
Fiscal Year | Average Year-End Fair Value of Equity Awards Granted During Year That Remained Unvested as of Last Day of Year for Non- PEO NEOs ($) | Average Change in Fair Value from Last Day of Prior Year to Last Day of Year of Unvested Equity Awards for Non-PEO NEOs ($) | Average Vesting-Date Fair Value of Equity Awards Granted During Year that Vested During Year for Non-PEO NEOs ($) | Average Change in Fair Value from Last Day of Prior Year to Vesting Date of Unvested Equity Awards that Vested During Year for Non-PEO NEOs ($) | Average Fair Value at Last Day of Prior Year of Equity Awards Forfeited During Year for Non-PEO NEOs ($) | Average Value of Dividends or Other Earnings Paid on Equity Awards Not Otherwise Included for Non-PEO NEOs ($) | Total - Average Inclusion of Equity Values for Non-PEO NEOs ($) |
2026 | 3,679,497 | (1,780,616) | — | 889,823 | — | — | 2,788,704 |
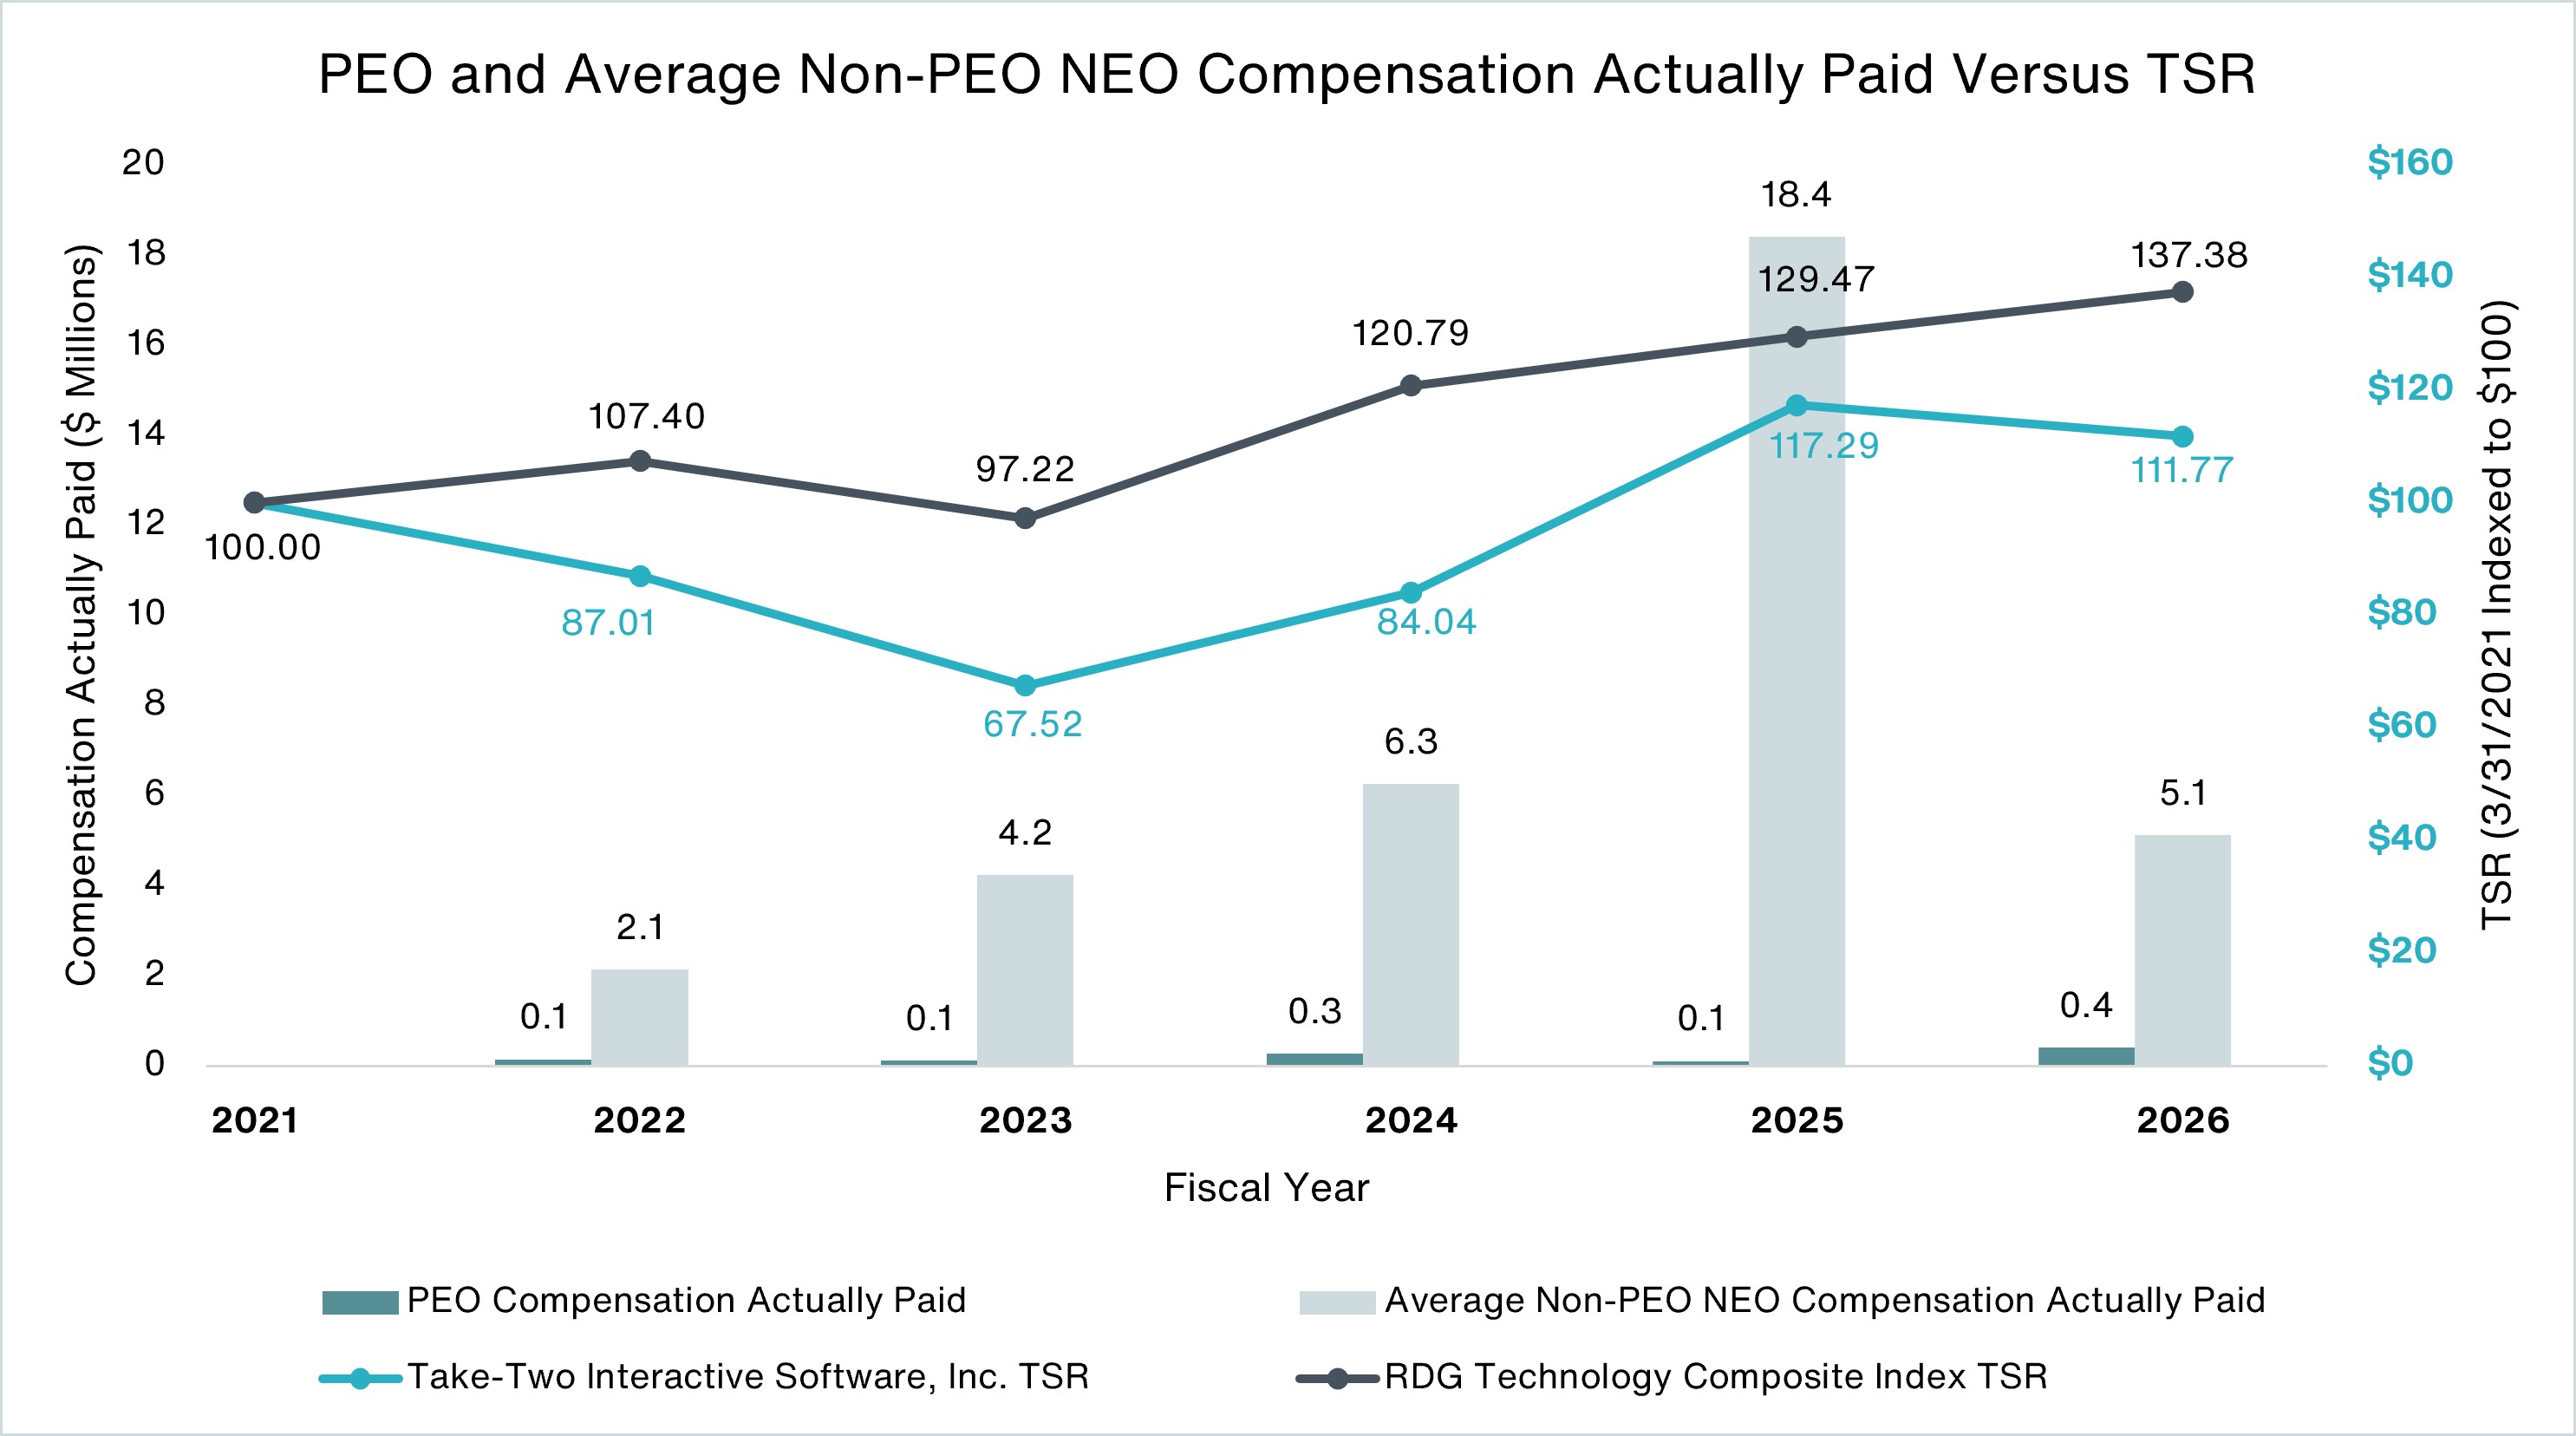
Return (“TSR”)
The following chart sets forth the relationship between Compensation Actually Paid to our PEO, the average of Compensation
Actually Paid to our Non-PEO NEOs, and the cumulative TSR over the five most recently completed fiscal years for the
Company and the RDG Technology Composite Index.
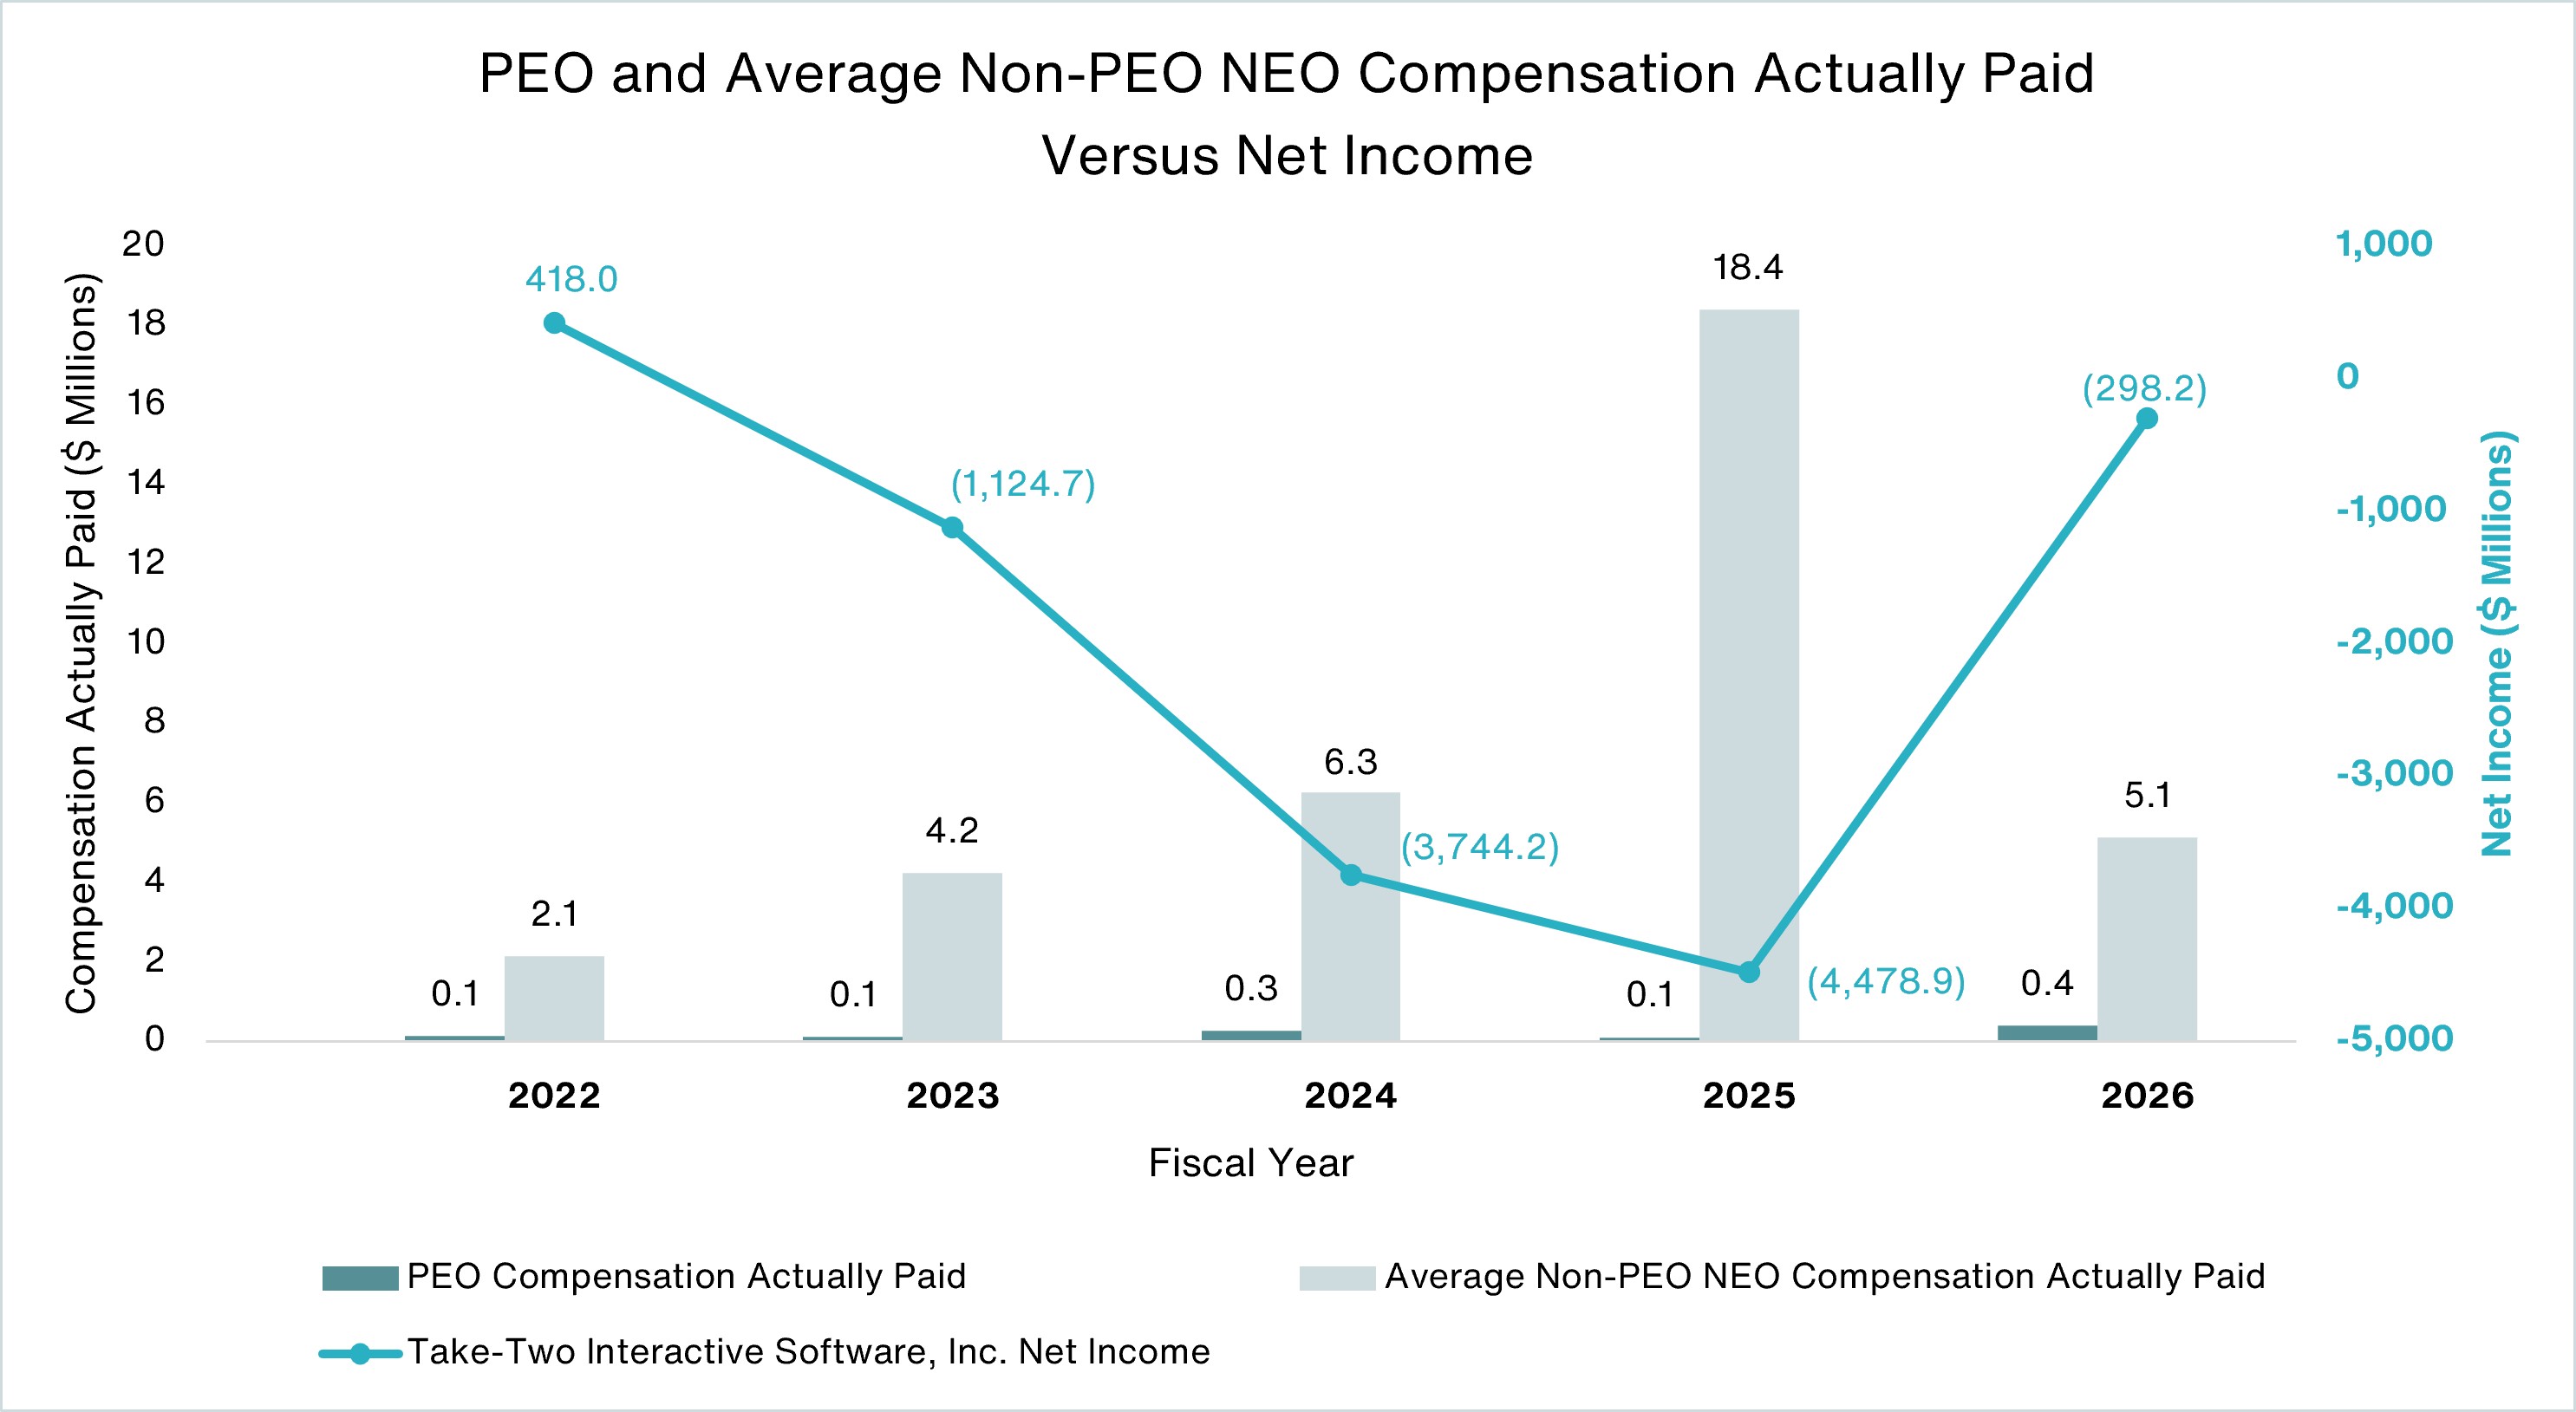
The following chart sets forth the relationship between Compensation Actually Paid to our PEO, the average of Compensation
Actually Paid to our Non-PEO NEOs, and our Net Income during the five most recently completed fiscal year.
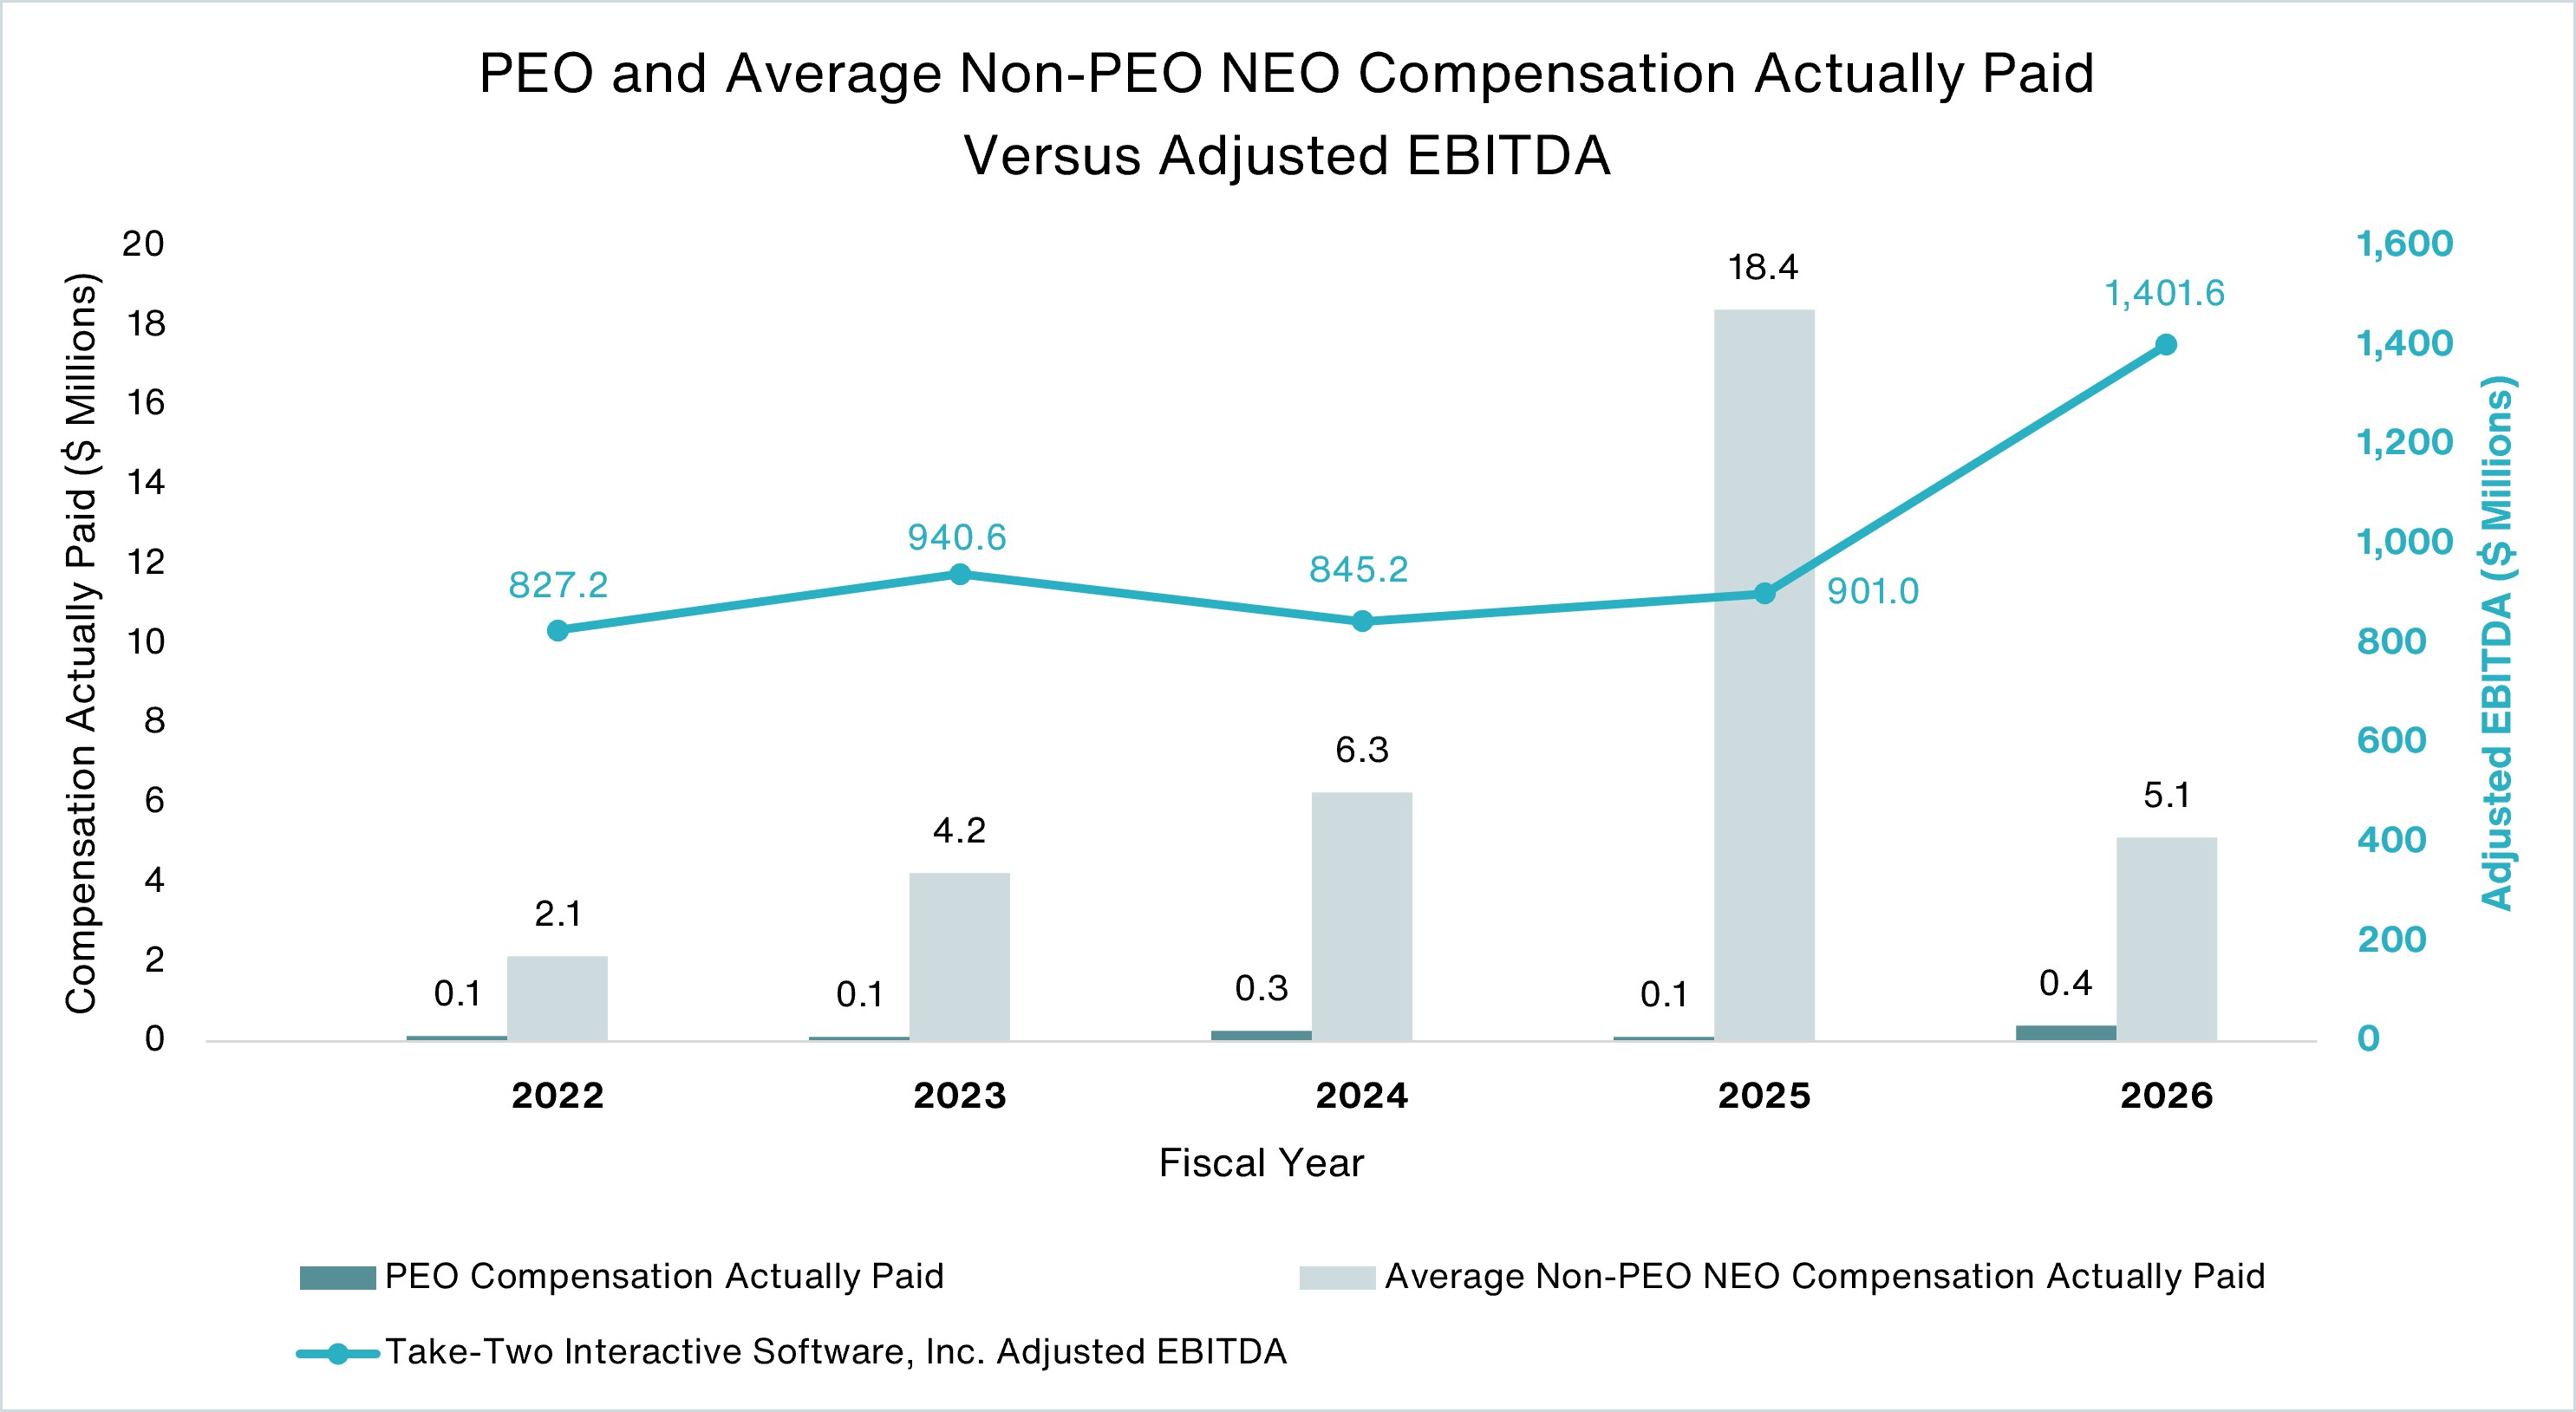
The following chart sets forth the relationship between Compensation Actually Paid to our PEO, the average of Compensation
Actually Paid to our Non-PEO NEOs, and our Adjusted EBITDA during the five most recently completed fiscal years.
Return (“TSR”)
The following chart sets forth the relationship between Compensation Actually Paid to our PEO, the average of Compensation
Actually Paid to our Non-PEO NEOs, and the cumulative TSR over the five most recently completed fiscal years for the
Company and the RDG Technology Composite Index.
The following table presents the financial performance measures that the Company considers to have been the most important
in linking Compensation Actually Paid to our NEOs for fiscal 2026 to Company performance. The measures in this table are
not ranked.
Adjusted EBITDA |
Relative TSR |
Recurrent Consumer Spending |
our NEOs in fiscal 2026. Adjusted EBITDA is a non-GAAP measure, which is defined as GAAP net income (loss) excluding the change in deferred net revenue
and related cost of revenue, stock-based compensation, business reorganization, interest expense (income), depreciation and amortization, amortization and
impairment of intangible assets, bonus, income taxes, fair value adjustments related to certain equity investments and acquisition-related costs. A reconciliation
of GAAP net income to Adjusted EBITDA for fiscal 2026 is provided in Annex A. Adjusted EBITDA may not have been the most important financial performance
measure in prior fiscal years, and we may determine a different financial performance measure to be the most important financial performance measure in
future fiscal years.