
DISCLAIMER FORWARD-LOOKING STATEMENTS AND INFORMATION This presentation contains "forward-looking statements" within the meaning of applicable United States securities legislation (collectively referred to as "forward-looking information" ("FLI")), and readers should read the cautionary notes related to FLI included later in this presentation. The Feasibility Study (“FS”) referenced herein that relates to Peak Gold, LLC (“Peak Gold”), was prepared by Kinross Gold Corporation (“Kinross”), which controls the Manager of Peak Gold and holds 70% of its outstanding membership interests, in accordance with Canadian National Instrument 43-101 (NI 43-101). Contango Silver & Gold Inc. (the “Company” or “Contango”) owns the remaining 30% membership interest in Peak Gold, and must rely on Kinross and its affiliates for the FS and related information. Further, Contango is not subject to regulation by Canadian regulatory authorities and no Canadian regulatory authority has reviewed the FS or passed upon its accuracy or compliance with NI 43-101. The terms “mineral resource”, “measured mineral resource”, “indicated mineral resource” and “inferred mineral resource” as used in the resource estimate, the FS and this presentation are Canadian mining terms as defined in accordance with NI 43-101. In the United States, mining disclosure is reported under sub-part 1300 of Regulation S-K (“S-K 1300”). Under S-K 1300, the U.S. Securities and Exchange Commission (“SEC”) recognizes estimates of “Measured Mineral Resources”, “Indicated Mineral Resources” and “Inferred Mineral Resources”. In addition, the definitions of “Proven Mineral Reserves” and “Probable Mineral Reserves” are substantially similar to international standards. Under S-K 1300, an SEC registrant with material mining operations must disclose specified information in its SEC filings concerning mineral resources, in addition to mineral reserves, which have been determined on one or more of its properties. Such mineral resources and reserves are supported by a technical report summary (the “S-K 1300 Report”), which is dated and signed by a qualified person or persons, and identifies and summarizes the information reviewed and conclusions reached by each qualified person about the SEC registrant’s mineral resources or mineral reserves determined to be on each material property. Contango prepared an S-K 1300 Report, dated May 12, 2023, based on the FS, that presented mineral resource estimates and mineral reserve estimates for the Manh Choh project as of December 31, 2022 (the "Manh Choh S-K 1300 Report"). Contango prepared an additional S-K 1300 Report, dated May 26, 2023, based on historical and recent drill hole assay information, that presented mineral resource estimates for the Lucky Shot project as of May 26, 2023 (the "Lucky Shot S-K 1300 Report"). Investors are cautioned that while the S-K 1300 definitions are “substantially similar” to the NI 43-101 definitions, there are differences between the two. Accordingly, there is no assurance any mineral reserve or mineral resource estimates that Peak Gold may report as “probable mineral reserves”, “measured mineral resources”, “indicated mineral resources” and “inferred mineral resources” under NI 43-101 would be the same had Contango prepared the mineral reserve or mineral resource estimates under S-K 1300. Further, U.S. investors are also cautioned that while the SEC recognizes “measured mineral resources”, “indicated mineral resources” and “inferred mineral resources” under S-K 1300, investors should not assume that any part or all of the mineralization in these categories will ever be converted into a higher category of mineral resources or into mineral reserves. Mineralization that has been characterized as resources has a greater degree of uncertainty as to its existence and feasibility than mineralization that has been characterized as reserves. Accordingly, investors are cautioned not to assume that any measured mineral resources, indicated mineral resources or inferred mineral resources that Contango reports are or will be economically or legally mineable. For more detail regarding the FS, please see Contango's press release dated May 26, 2023: https://www.contangoore.com/press-release/contango-ore-announces-completion-of-s-k-1300-technical-report-summary-for-its-manh-choh-project-in-alaska. The information contained in, or otherwise accessible through, the links are not part of, and are not incorporated by reference into this investor presentation. To view a copy of the Manh Choh S-K 1300 Report, see: https://assets.website-files.com/5fc5d36fd44fd675102e4420/6470afdaf94d2ac9f93d93e0_SIMS%20Contango%20Manh%20Choh%20Project%20S-K%201300%20TRS%20FINAL%2020230524%20(1)-compressed.pdf . The information contained in, or otherwise accessible through, the links are not part of, and are not incorporated by reference into this investor presentation. To view a copy of the Lucky Shot S-K 1300 Report, see: https://assets.website-files.com/5fc5d36fd44fd675102e4420/6487270414e64406df8280bb_Contango%20Lucky%20Shot%20Project%20S-K%201300%20TRS%202023-05-26.pdf. The information contained in, or otherwise accessible through, the links are not part of, and are not incorporated by reference into this investor presentation. For additional details on the Johnson Tract Project, see NI 43-101 Technical Report titled “Updated Mineral Resource Estimate and NI 43-101 Technical Report for the Johnson Tract Project, Alaska”, dated August 25, 2022 (effective date of July 12, 2022) authored by Ray C. Brown, James N. Gray, P.Geo. and Lyn Jones, P.Eng, see: https://cdn.prod.website-files.com/5fc5d36fd44fd675102e4420/66b39f847ac30bd736ac91ad_hg-technical-report-25aug-2022_compressed.pdf. The information contained in, or otherwise accessible through, the links are not part of, and are not incorporated by reference into this investor presentation. For more detail regarding the Johnson Tract IA, please see Contango's press release dated May 6, 2025: https://www.contangoore.com/press-release/contango-announces-s-k-1300-technical-report-summary-with-robust-economics-and-one-year-payback-for-its-johnson-tract-project The information contained in, or otherwise accessible through, the links are not part of and are not incorporated by reference into this investor presentation. The technical information in this presentation related to the Kitsault Valley Project (owned by Dolly Varden Silver Corporation (“Dolly Varden”), a wholly-owned subsidiary of Contango) has been reviewed and approved by Robert van Egmond, P.Geo. VP Exploration - Canada, who is considered, by virtue of his education, experience and professional association, a qualified person under NI 43-101. Mr. van Egmond is not considered independent for purposes of NI 43-101 as he is an employee of Dolly Varden. This presentation also contains references to estimates of mineral resources (as such term is defined in NI 43-101). The estimation of mineral resources is inherently uncertain and involves subjective judgments about many relevant factors. Mineral resources that are not mineral reserves do not have demonstrated economic viability. The accuracy of any such estimates is a function of the quantity and quality of available data, and of the assumptions made and judgments used in engineering and geological interpretation (including estimated future production from Dolly Varden’s projects, if any, the anticipated amounts and grades that will be mined and the estimated level of recovery that will be realized), which may prove to be unreliable and depend, to a certain extent, upon the analysis of drilling results and statistical inferences that ultimately may prove to be inaccurate. Some of the mineral resources at the Kitsault Valley Project are categorized as indicated and some as inferred mineral resources. Mineral resources that are not mineral reserves do not have demonstrated economic viability. Mineral resource estimates do not account for mineability, selectivity, mining loss and dilution. These mineral resource estimates include inferred mineral resources that are normally considered too speculative geologically to have economic considerations applied to them that would enable them to be categorized as mineral reserves. There is also no certainty that these inferred mineral resources will be converted to measured and indicated categories through further drilling, or into mineral reserves, once economic considerations are applied. Certain information in this presentation is based upon, and certain information is extracted directly from, an NI 43-101 compliant technical report prepared by Dolly Varden for the Kitsault Valley Project (the “Technical Report”), a copy of which is available under its SEDAR+ profile at www.sedarplus.ca. The Technical Report includes relevant information regarding the effective date and the assumptions, parameters and methods of the mineral resource estimates cited in this presentation, as well as information regarding data verification, exploration procedures and other matters relevant to the scientific and technical disclosure contained in this presentation in respect of the Kitsault Valley Project. You are encouraged to read the Technical Report in full and any information summarized or extracted therefrom in this presentation should not be read or relied upon out of context. All such technical information in this presentation is subject to the assumptions and qualifications contained in the Technical Report. The Technical Report was not prepared in accordance with S-K 1300. A qualified person has not done sufficient work to classify the mineral resource estimates derived from the Technical Report and included in this presentation as current estimates of S-K 1300 mineral resources. The securities of Contango have not been approved or disapproved by the United States Securities and Exchange Commission, or any other securities commission or regulatory authority in the United States or any other jurisdiction, nor have any of the foregoing authorities passed upon or endorsed the merits this presentation or confirmed the accuracy or adequacy of the information contained in this presentation. Any representation to the contrary is a criminal offense. This presentation does not constitute an offer to sell or the solicitation of an offer to buy the securities of Contango. This presentation does not contain all of the information that would normally appear in a prospectus under applicable United States securities laws. Prospective investors should carefully read Contango's disclosure documents filed on Edgar, especially the risk factors contained in such filings, before making an investment decision with respect to investing in the securities of Contango.
WWW.CONTANGOORE.COM
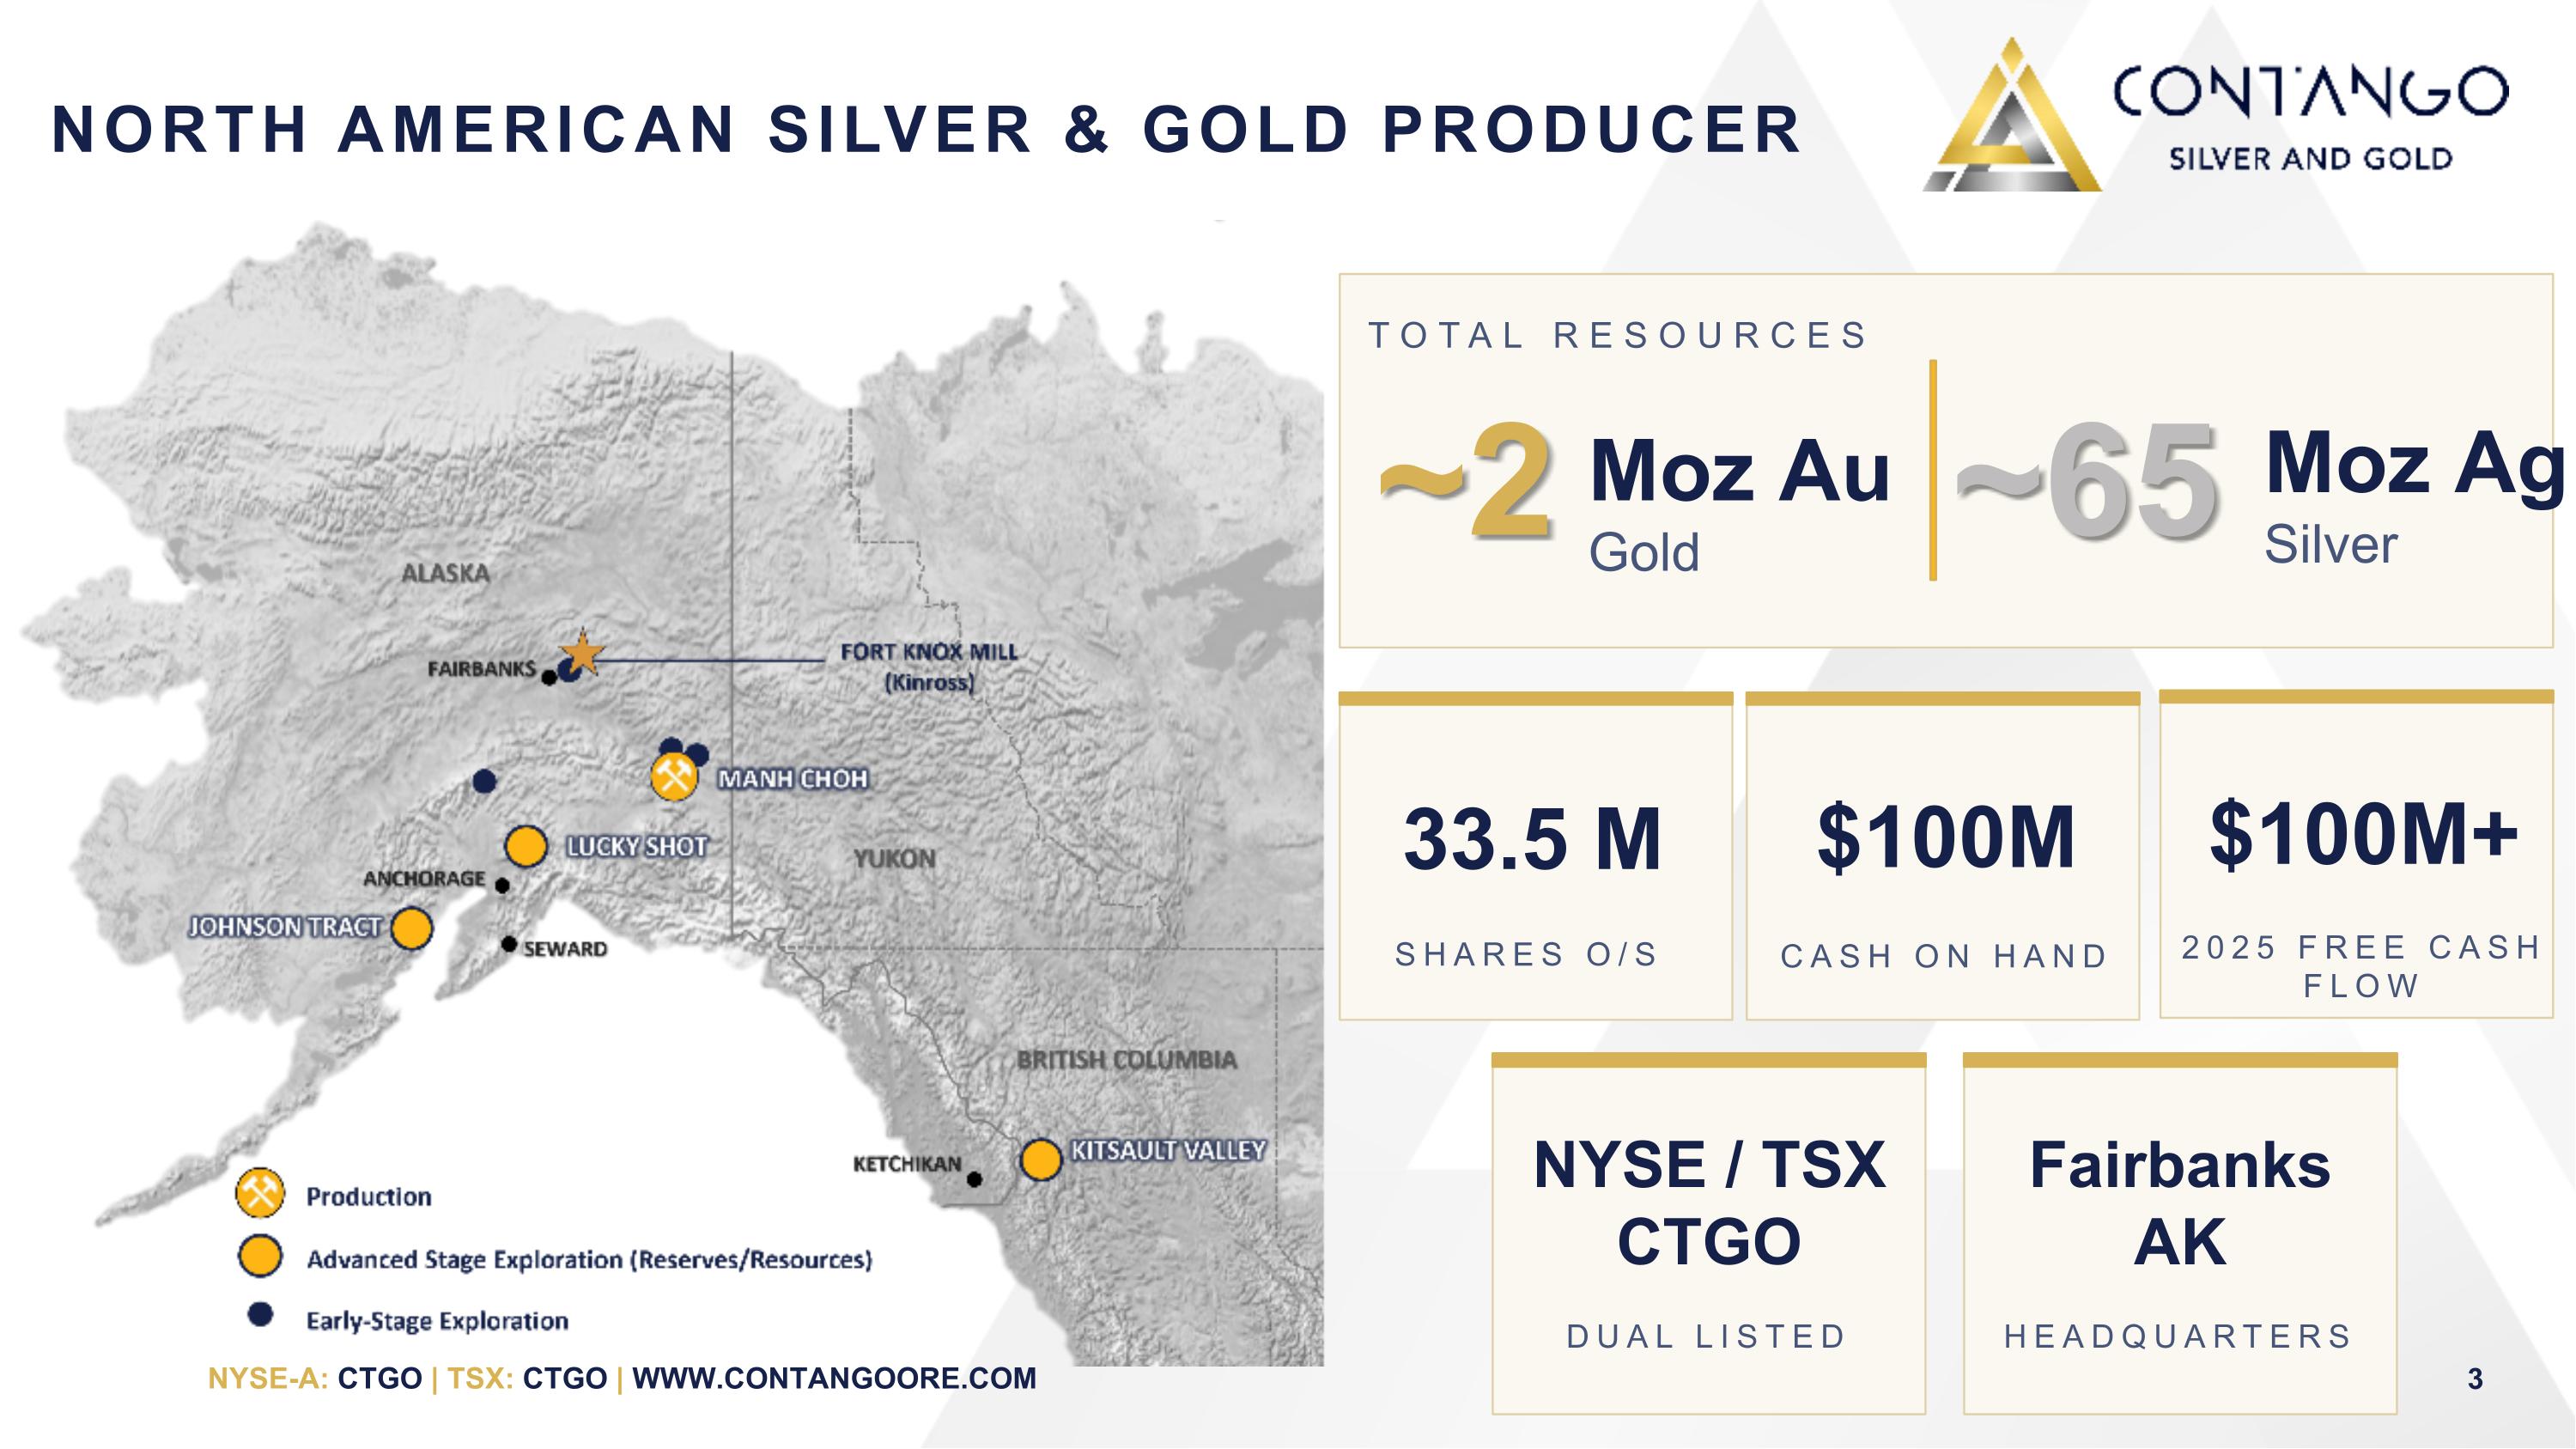
33.5 M SHARES O/S NYSE / TSX CTGO DUAL LISTED Fairbanks AK HEADQUARTERS NORTH AMERICAN SILVER & GOLD PRODUCER ~2 Moz Au Gold ~65 Moz Ag Silver TOTAL RESOURCES $100M CASH ON HAND $100M+ 2025 FREE CASH FLOW
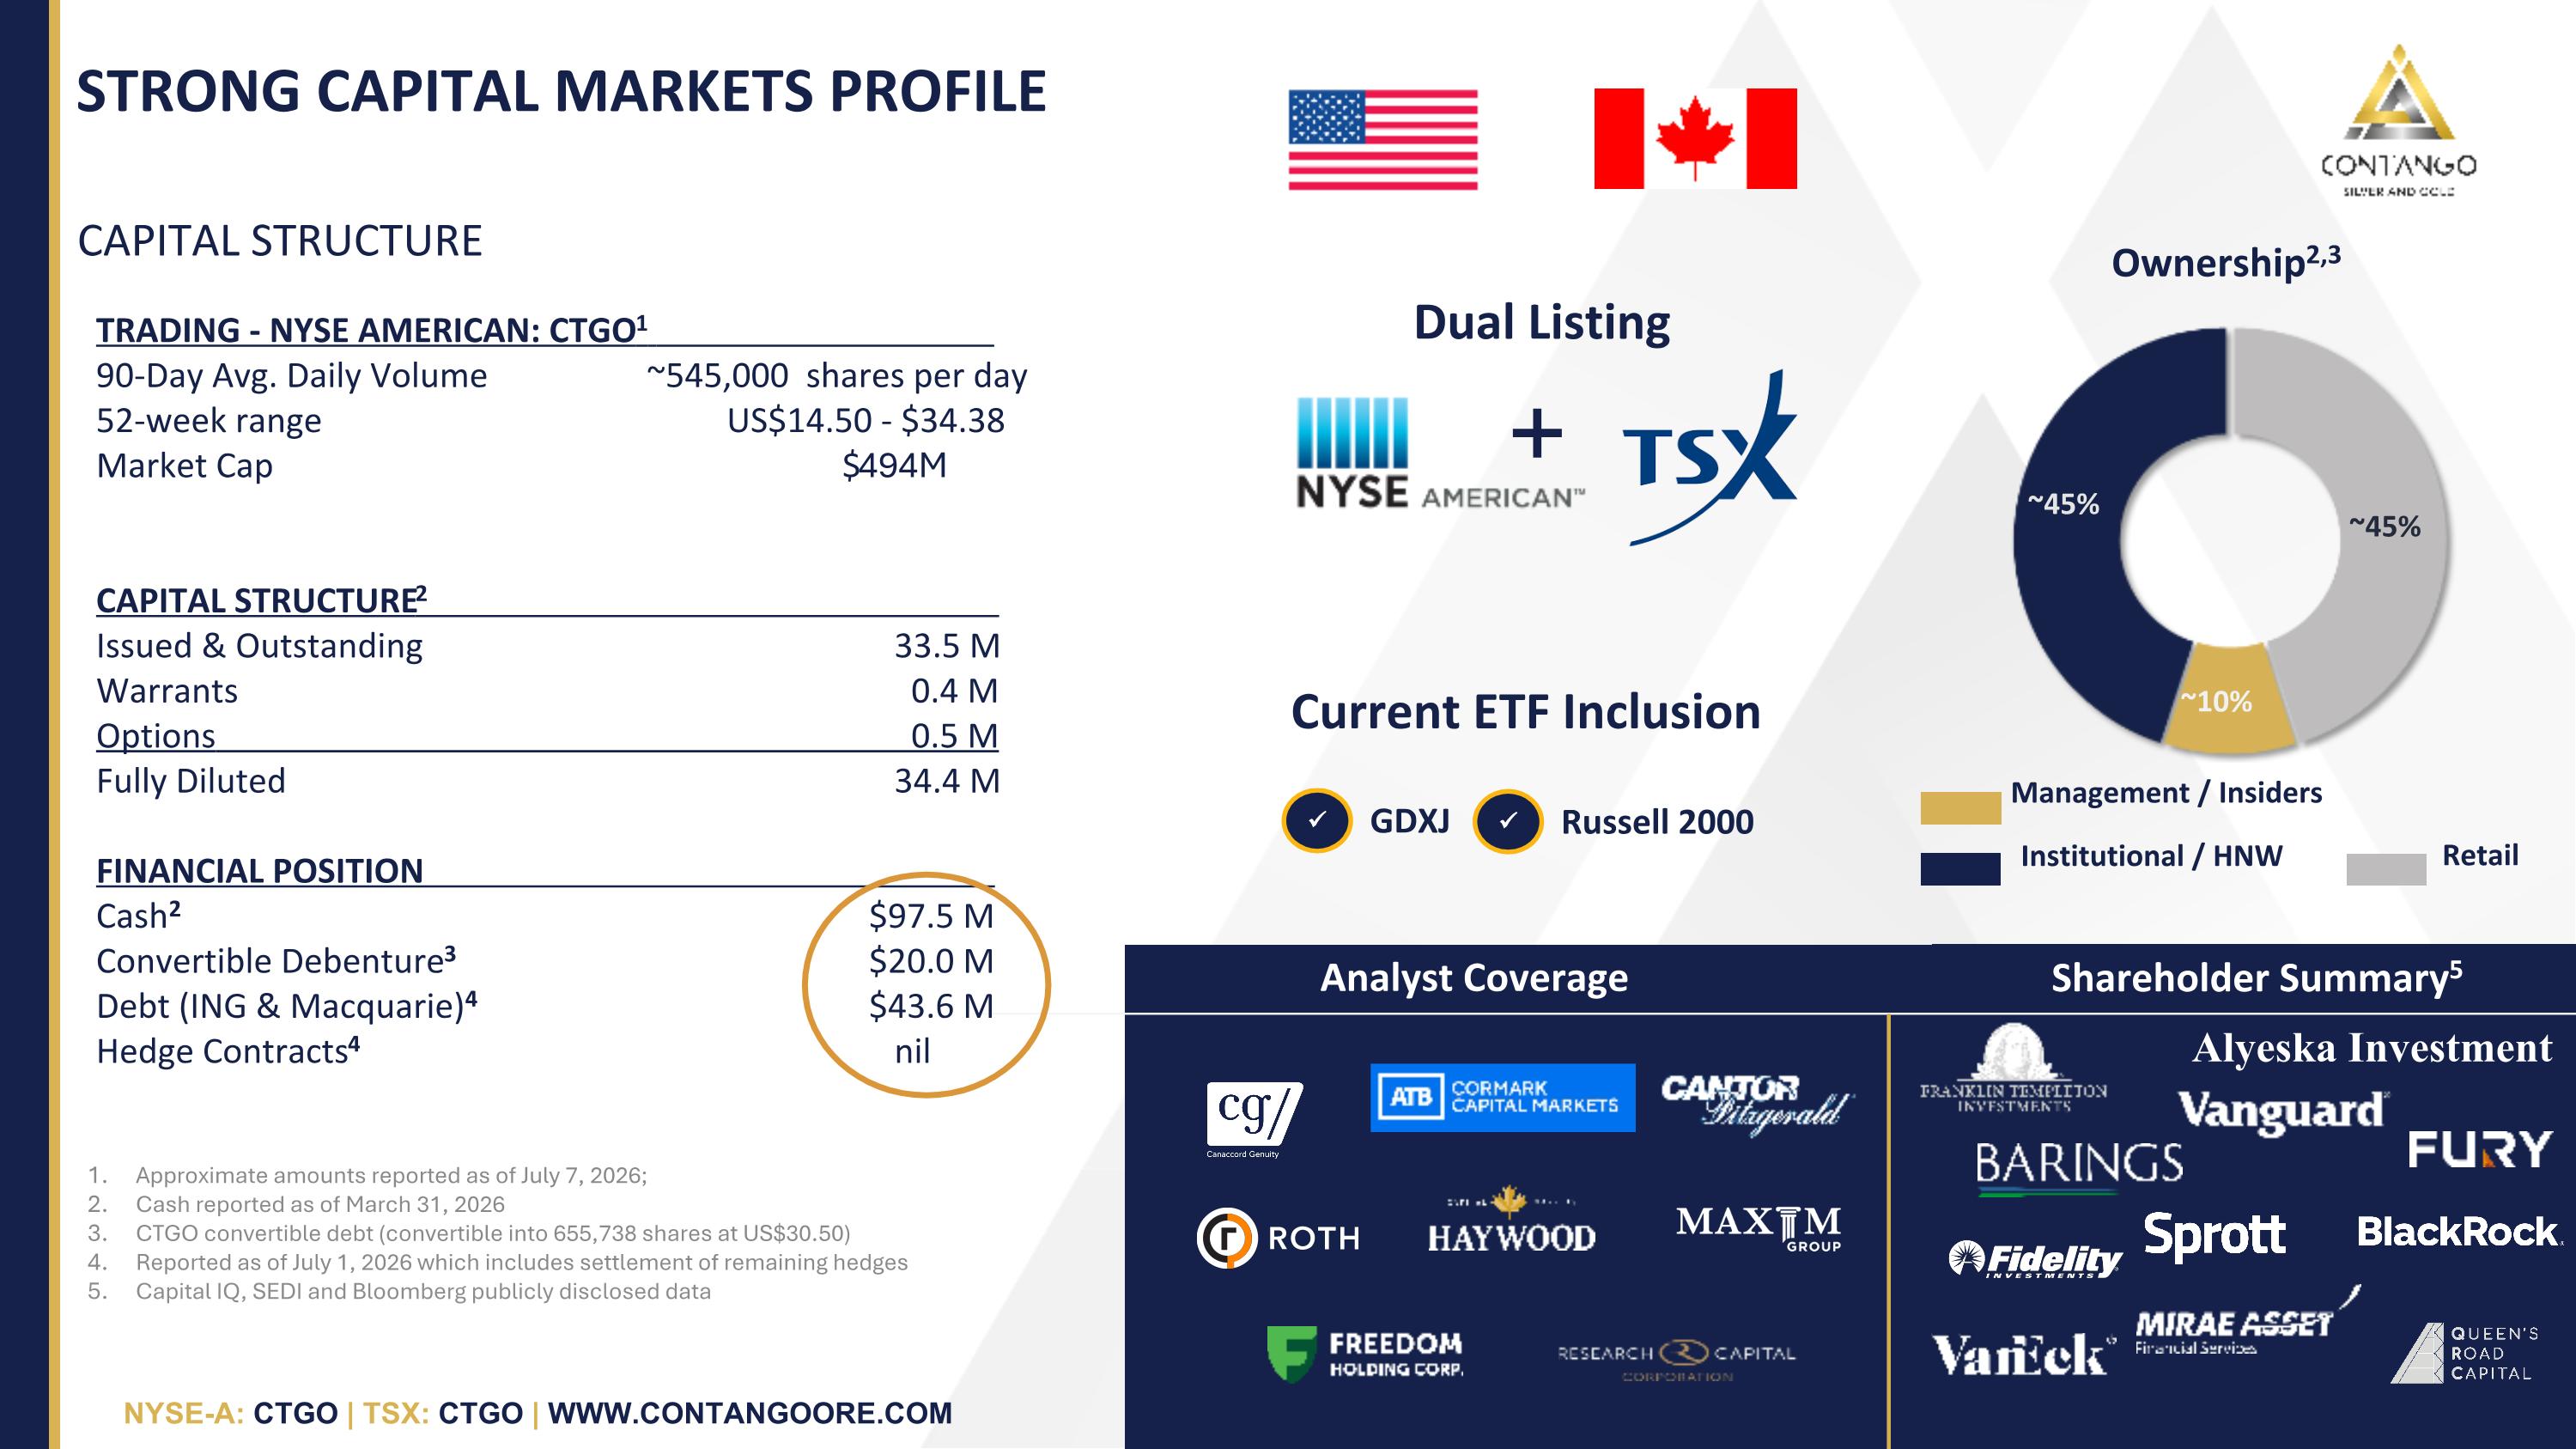
STRONG CAPITAL MARKETS PROFILE Approximate amounts reported as of July 7, 2026; Cash reported as of March 31, 2026 CTGO convertible debt (convertible into 655,738 shares at US$30.50) Reported as of July 1, 2026 which includes settlement of remaining hedges Capital IQ, SEDI and Bloomberg publicly disclosed data Ownership2,3 Shareholder Summary5 Analyst Coverage Current ETF Inclusion GDXJ Dual Listing Russell 2000 CAPITAL STRUCTURE TRADING - NYSE AMERICAN: CTGO1 90-Day Avg. Daily Volume ~545,000 shares per day 52-week range US$14.50 - $34.38 Market Cap $494M CAPITAL STRUCTURE2 Issued & Outstanding 33.5 M Warrants 0.4 M Options 0.5 M Fully Diluted 34.4 M FINANCIAL POSITION Cash2 $97.5 M Convertible Debenture3 $20.0 M Debt (ING & Macquarie)4 $43.6 M Hedge Contracts4 nil Alyeska Investment ~45% ~45% ~10% Institutional / HNW Retail Management / Insiders
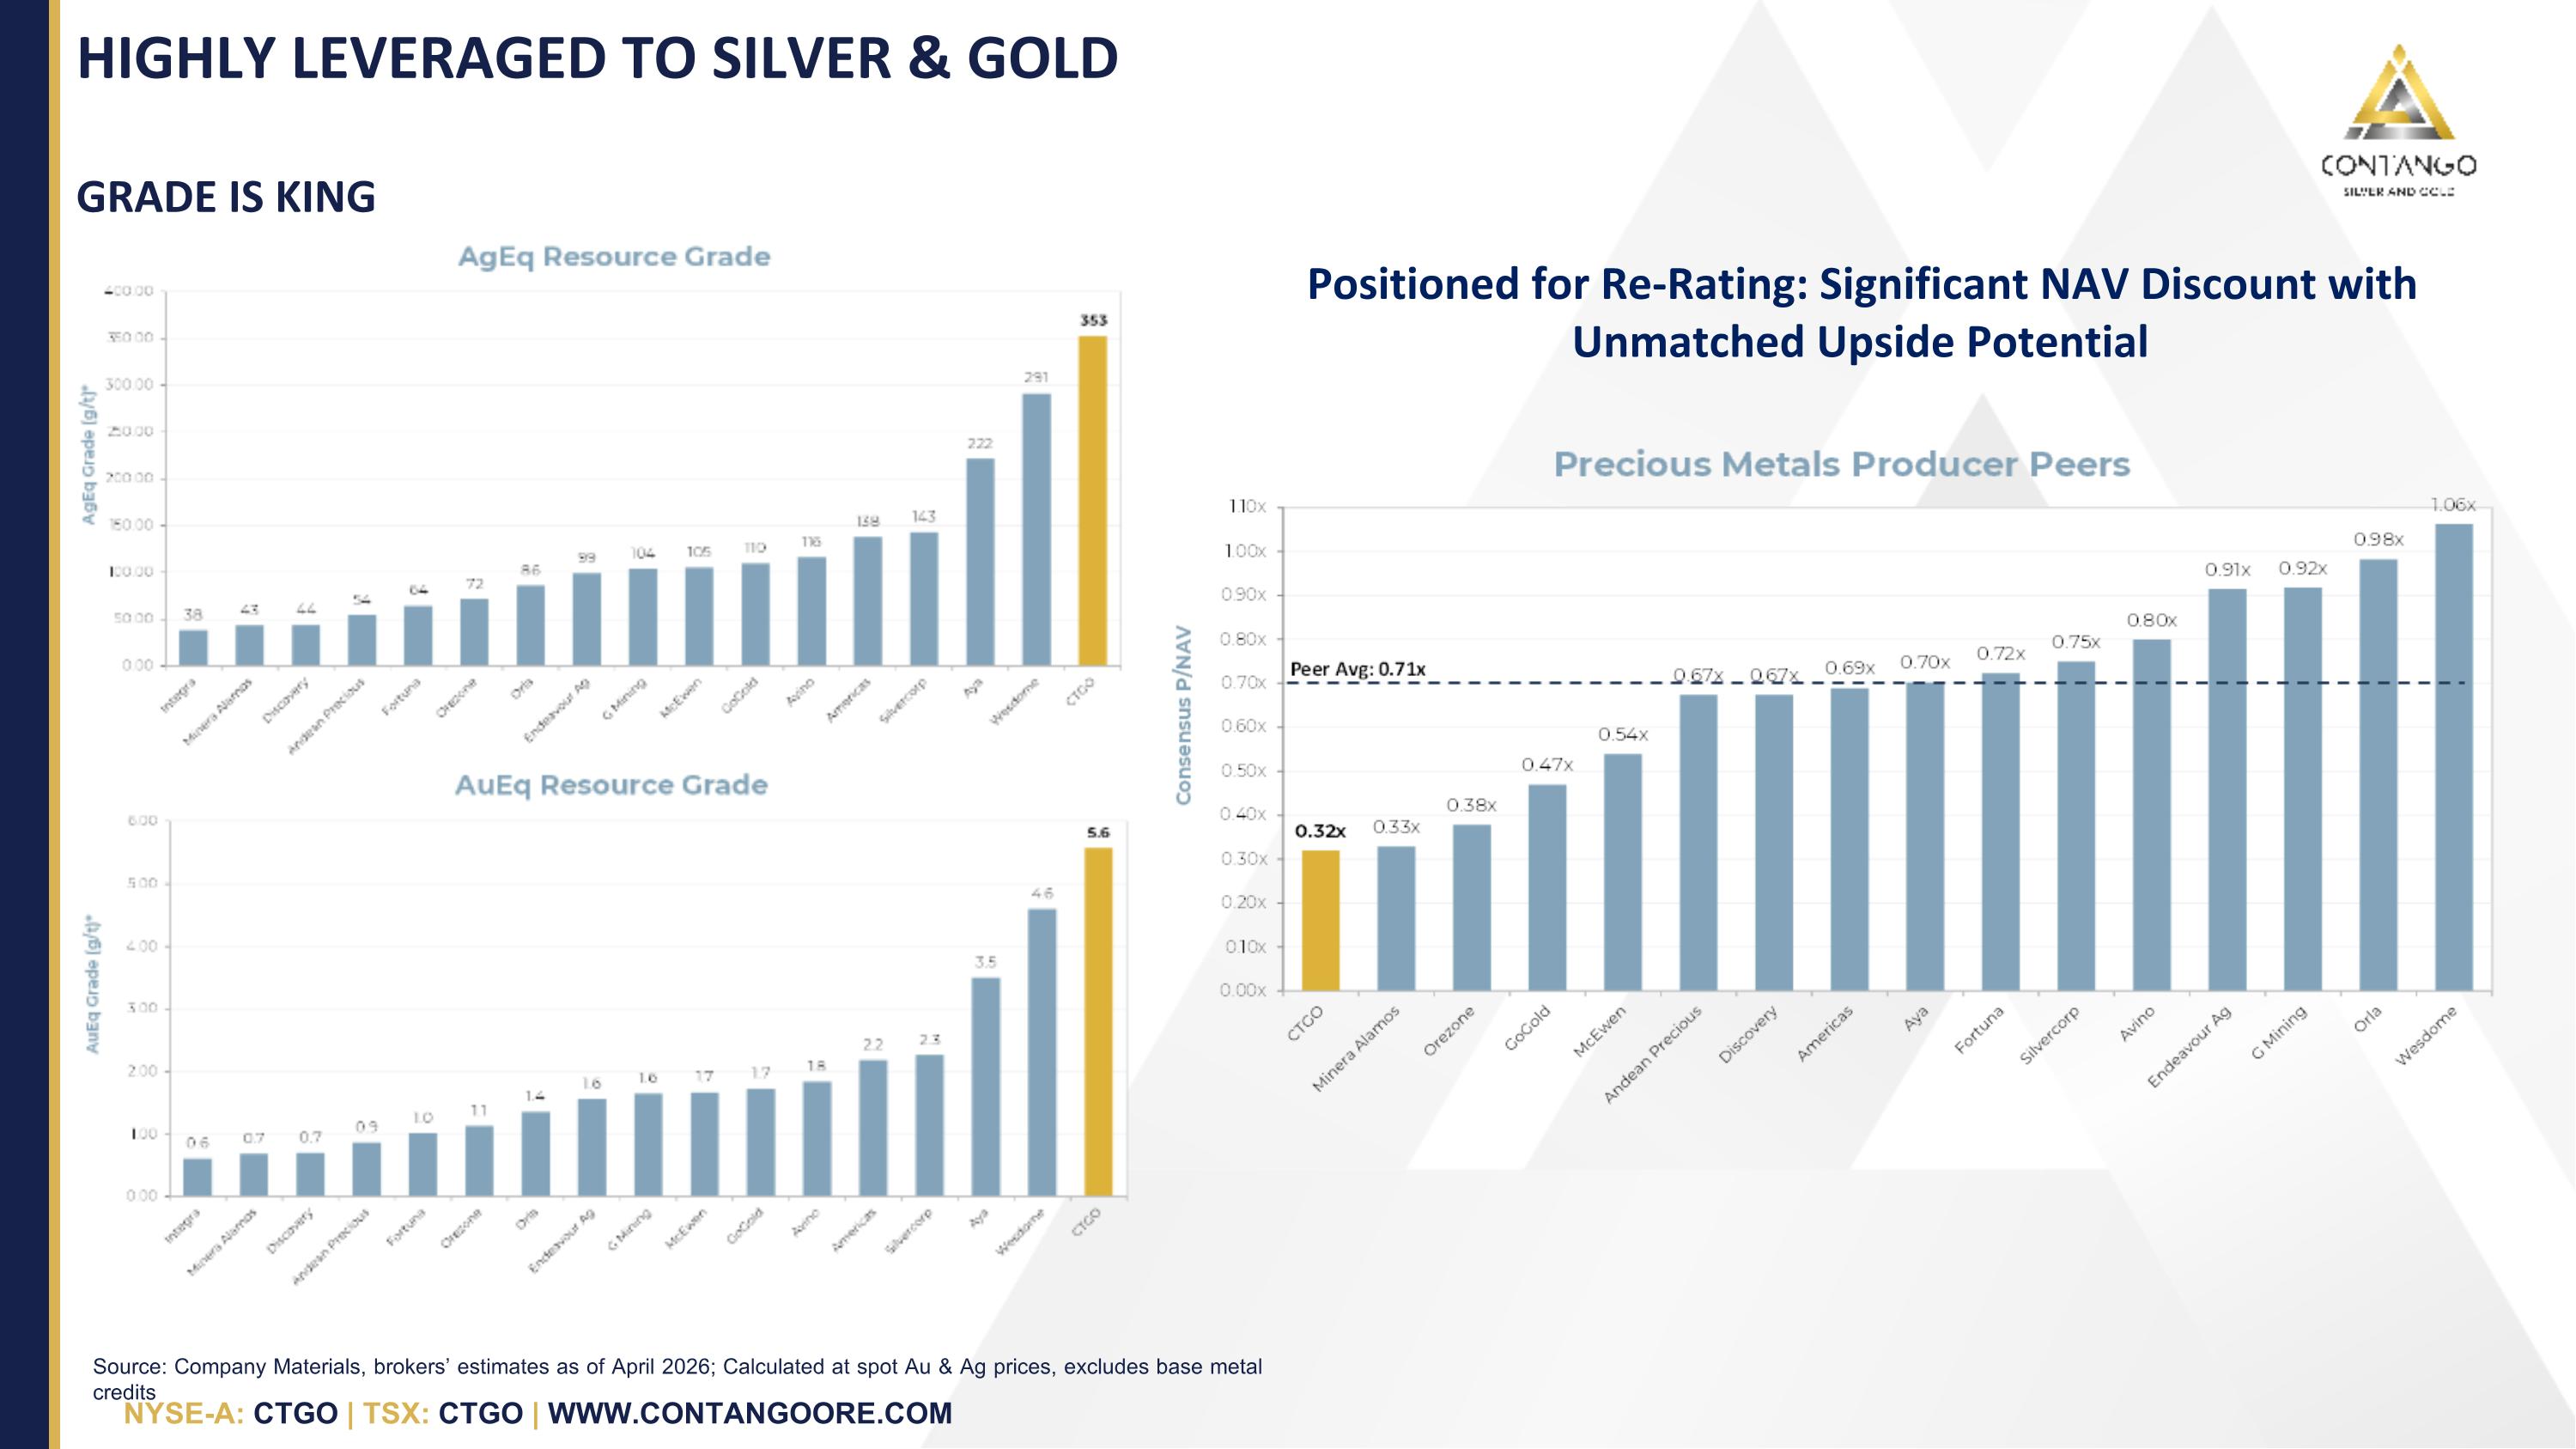
HIGHLY LEVERAGED TO SILVER & GOLD Source: Company Materials, brokers’ estimates as of April 2026; Calculated at spot Au & Ag prices, excludes base metal credits GRADE IS KING Positioned for Re-Rating: Significant NAV Discount with Unmatched Upside Potential
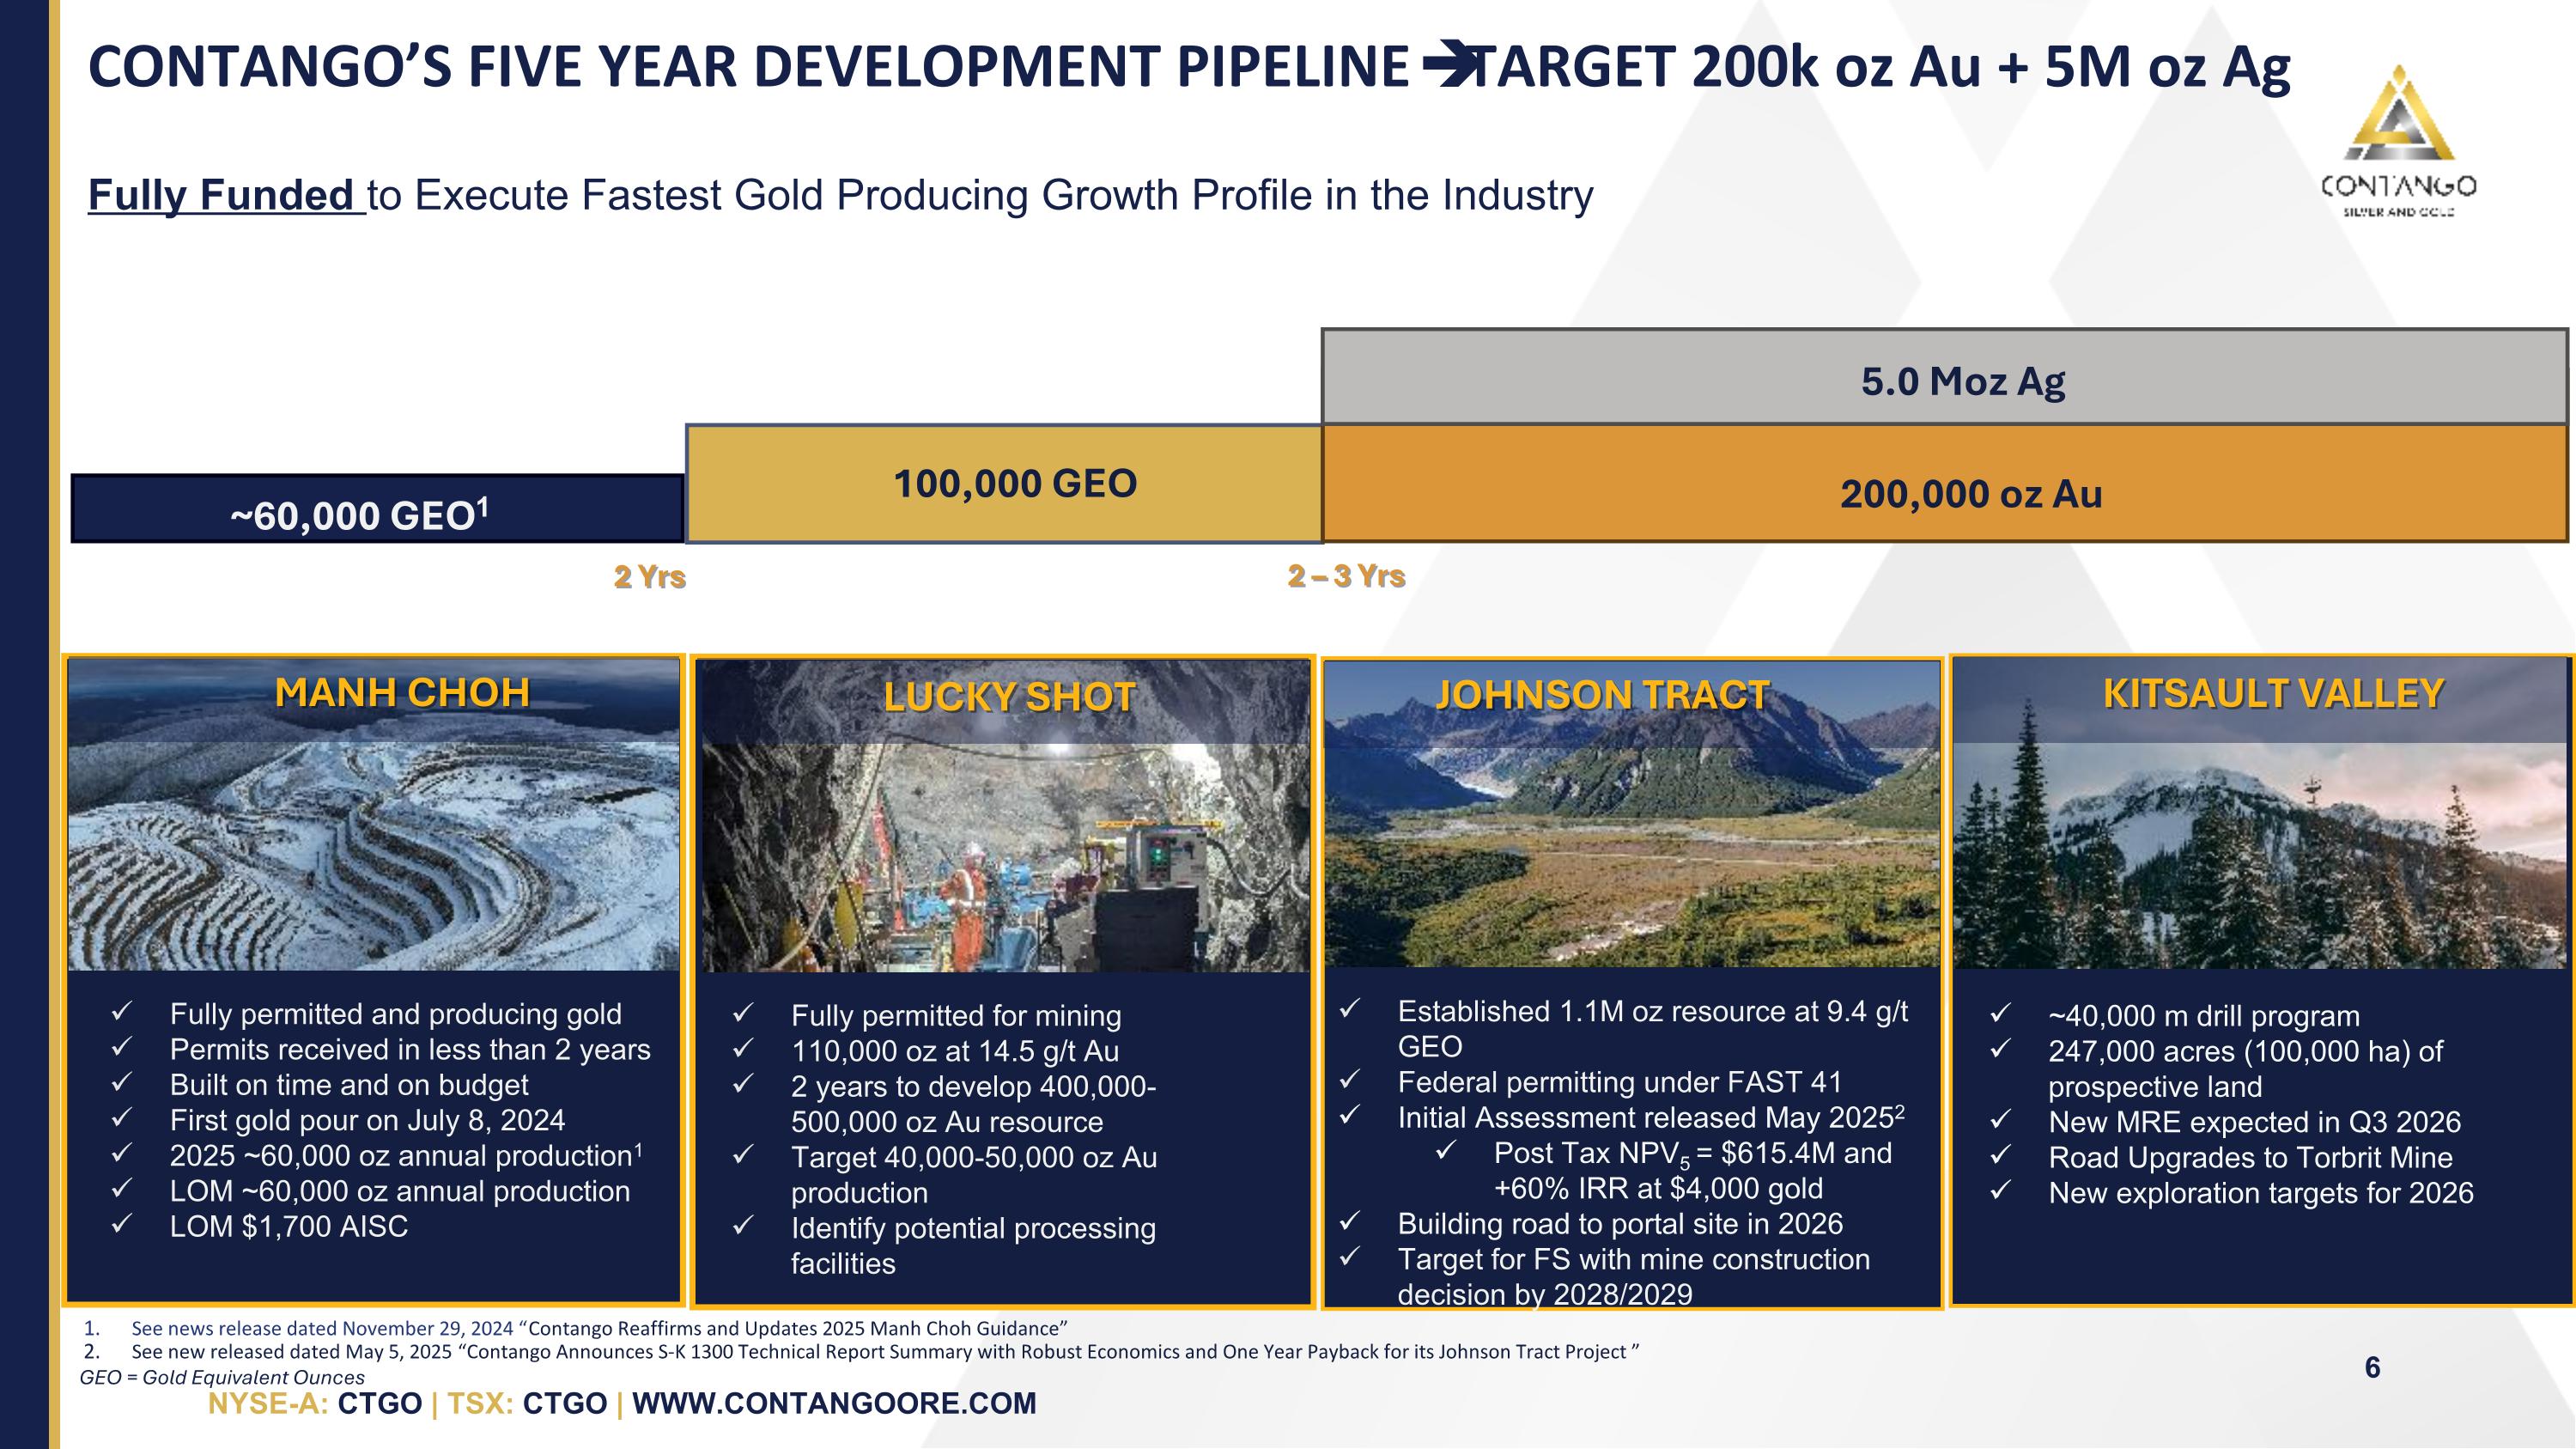
CONTANGO’S FIVE YEAR DEVELOPMENT PIPELINE TARGET 200k oz Au + 5M oz Ag 2 Yrs 100,000 GEO 2 – 3 Yrs See news release dated November 29, 2024 “Contango Reaffirms and Updates 2025 Manh Choh Guidance” See new released dated May 5, 2025 “Contango Announces S-K 1300 Technical Report Summary with Robust Economics and One Year Payback for its Johnson Tract Project ” Fully Funded to Execute Fastest Gold Producing Growth Profile in the Industry ~60,000 GEO1 KITSAULT VALLEY ~40,000 m drill program 247,000 acres (100,000 ha) of prospective land New MRE expected in Q3 2026 Road Upgrades to Torbrit Mine New exploration targets for 2026 MANH CHOH LUCKY SHOT JOHNSON TRACT Fully permitted and producing gold Permits received in less than 2 years Built on time and on budget First gold pour on July 8, 2024 2025 ~60,000 oz annual production1 LOM ~60,000 oz annual production LOM $1,700 AISC Fully permitted for mining 110,000 oz at 14.5 g/t Au 2 years to develop 400,000-500,000 oz Au resource Target 40,000-50,000 oz Au production Identify potential processing facilities Established 1.1M oz resource at 9.4 g/t GEO Federal permitting under FAST 41 Initial Assessment released May 20252 Post Tax NPV5 = $615.4M and +60% IRR at $4,000 gold Building road to portal site in 2026 Target for FS with mine construction decision by 2028/2029 GEO = Gold Equivalent Ounces 200,000 oz Au 5.0 Moz Ag

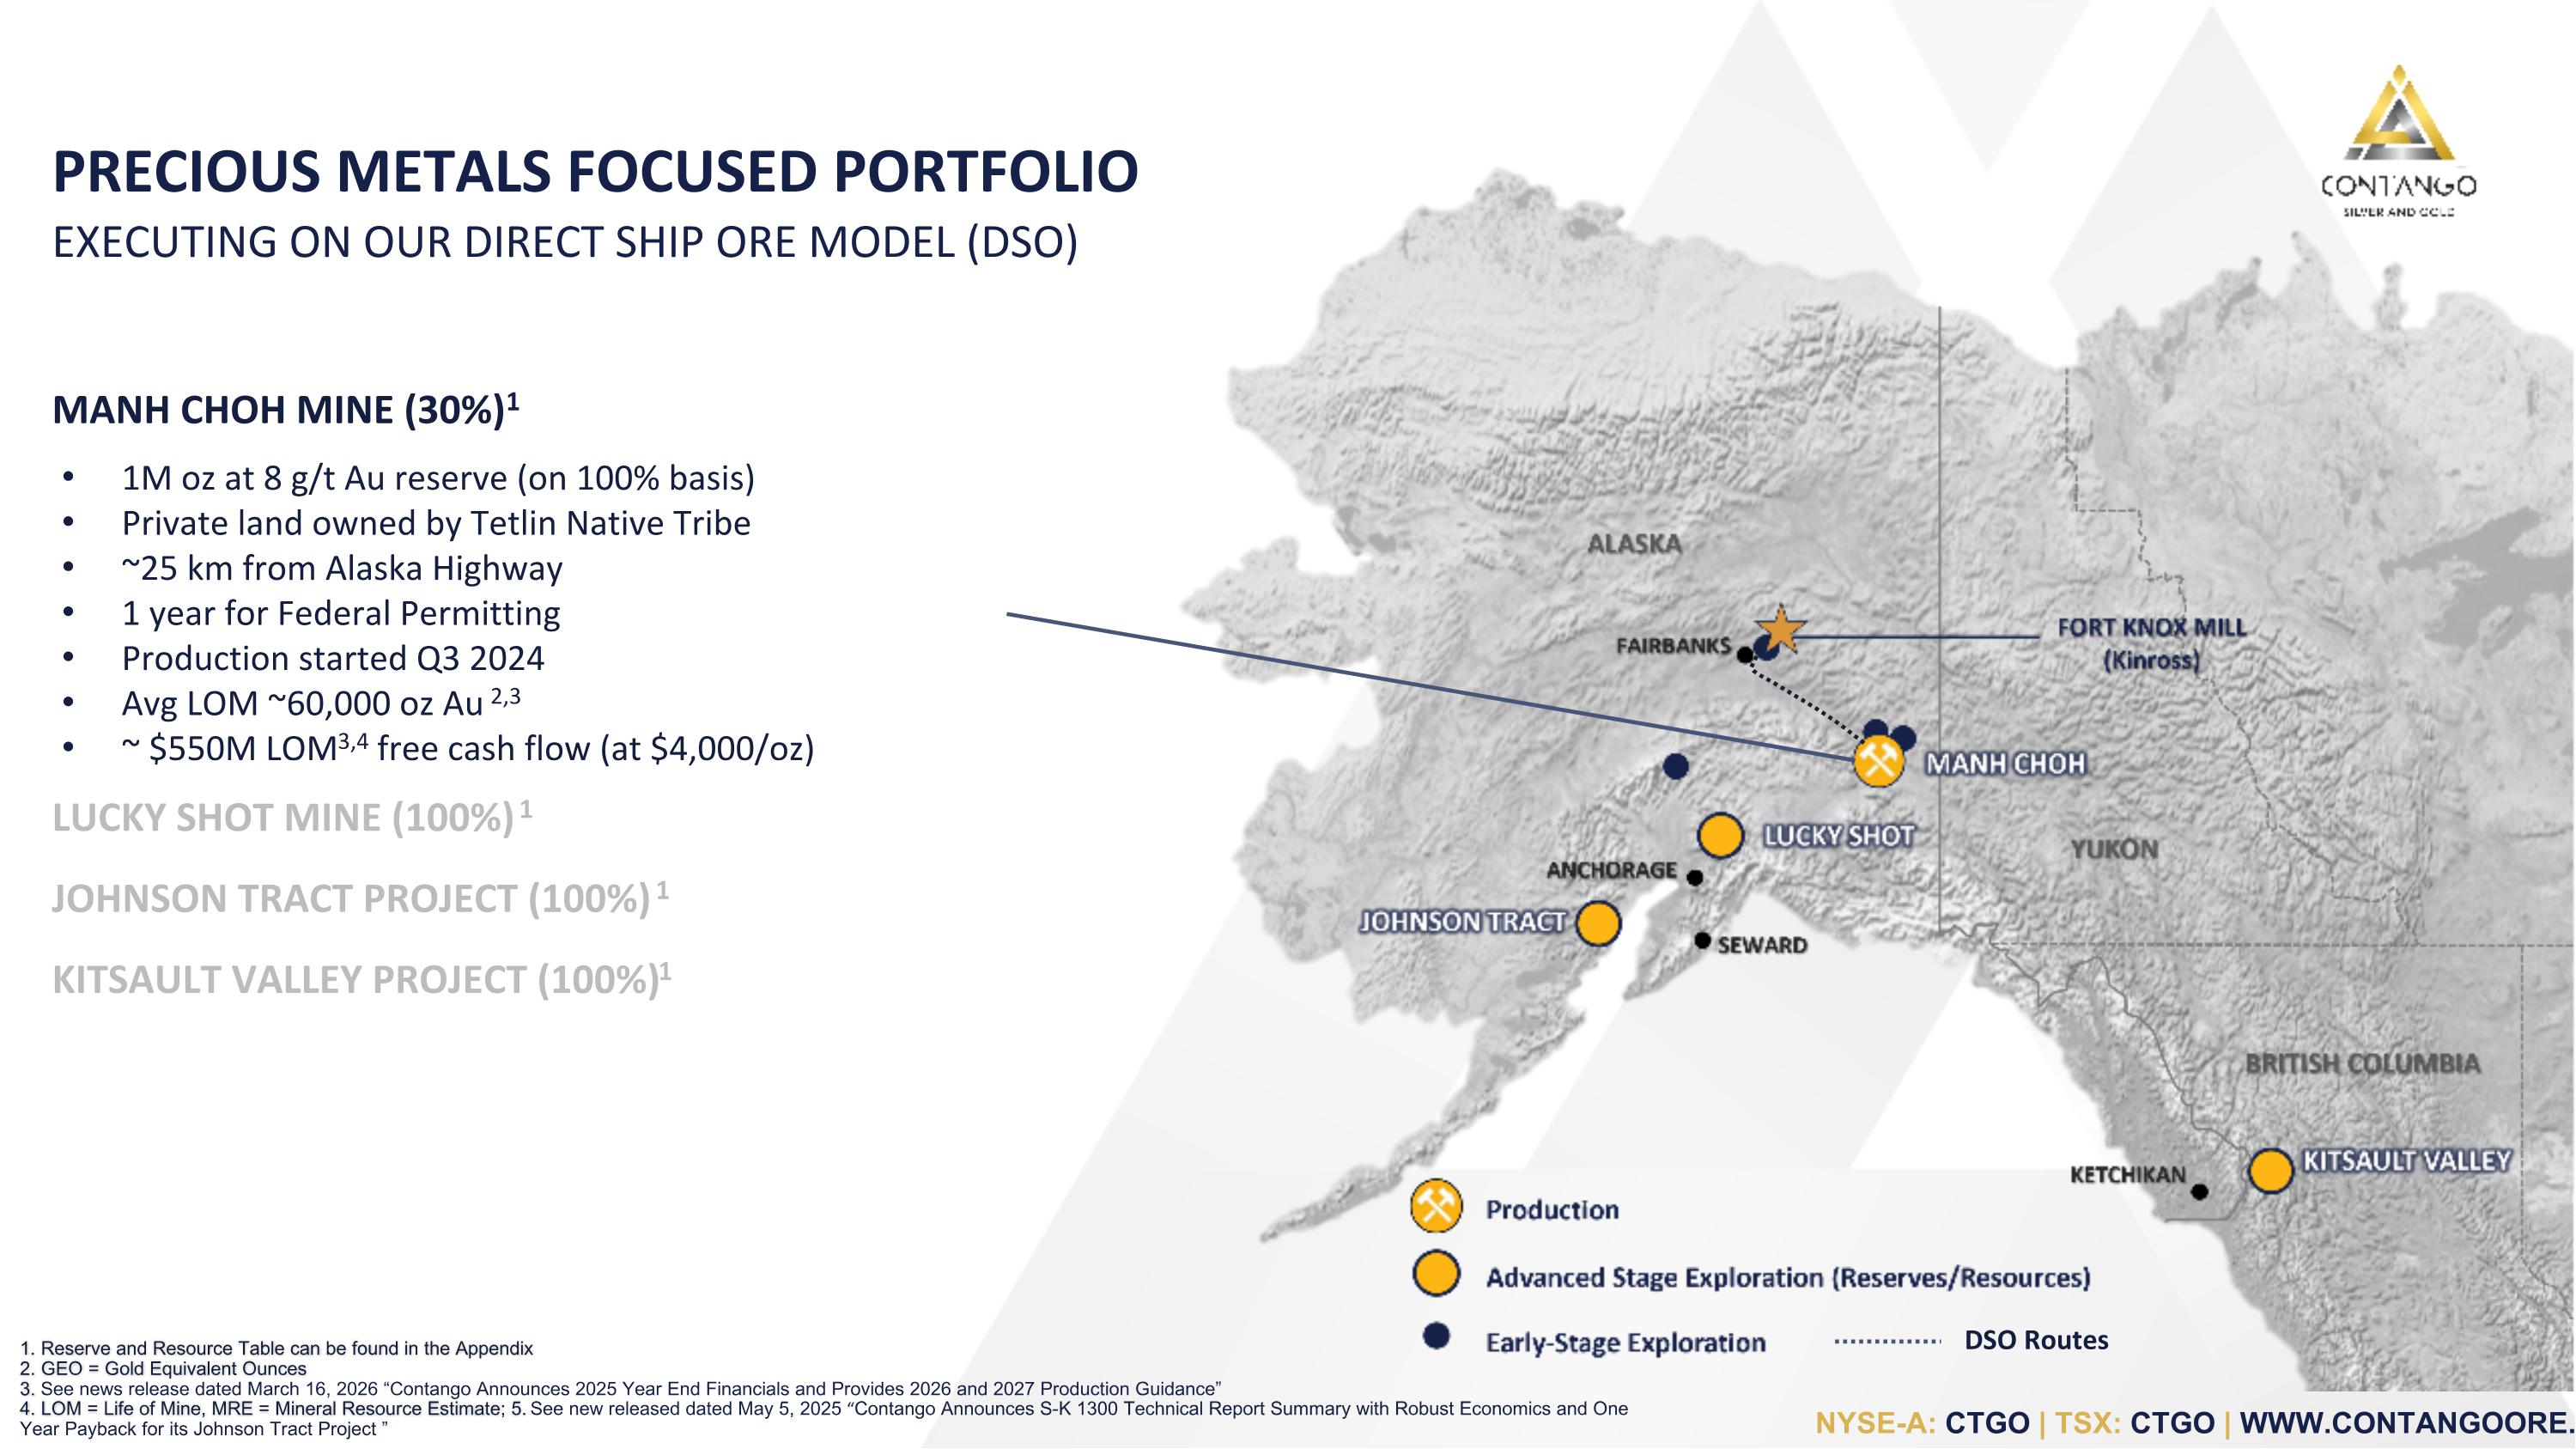
PRECIOUS METALS FOCUSED PORTFOLIO EXECUTING ON OUR DIRECT SHIP ORE MODEL (DSO) FORT KNOX MILL (Kinross) 1. Reserve and Resource Table can be found in the Appendix 2. GEO = Gold Equivalent Ounces 3. See news release dated March 16, 2026 “Contango Announces 2025 Year End Financials and Provides 2026 and 2027 Production Guidance” 4. LOM = Life of Mine, MRE = Mineral Resource Estimate; 5. See new released dated May 5, 2025 “Contango Announces S-K 1300 Technical Report Summary with Robust Economics and One Year Payback for its Johnson Tract Project ” MANH CHOH MINE (30%)1 1M oz at 8 g/t Au reserve (on 100% basis) Private land owned by Tetlin Native Tribe ~25 km from Alaska Highway 1 year for Federal Permitting Production started Q3 2024 Avg LOM ~60,000 oz Au 2,3 ~ $550M LOM3,4 free cash flow (at $4,000/oz) JOHNSON TRACT PROJECT (100%) 1 KITSAULT VALLEY PROJECT (100%) 1 LUCKY SHOT MINE (100%) 1 DSO Routes

DSO CRITERIA High-grade resources Gold, Silver, Copper focus Near Infrastructure Road Rail Water Simple permitting from a mining perspective Private and State lands Minimal water and wetlands impact Simple mining/processing 2020/2021 2022 2023 2024 JV with Kinross, Community Outreach, PFS/FS, permit applications submitted Construction decision & road construction, mill modifications, campus renovation; 404 Wetlands Permit received Operating permits received; construction completed with groundbreaking ceremony in August; ore transport started in November Ore stockpiled at Manh Choh and Fort Knox; first gold pour in July 2024! FEDERAL PERMITS 1 YR CONSTRUCTION AND RAMP UP 2 YRS Manh Choh deposit before mining MANH CHOH MINE CTGO SUCCESS OF DSO APPROACH
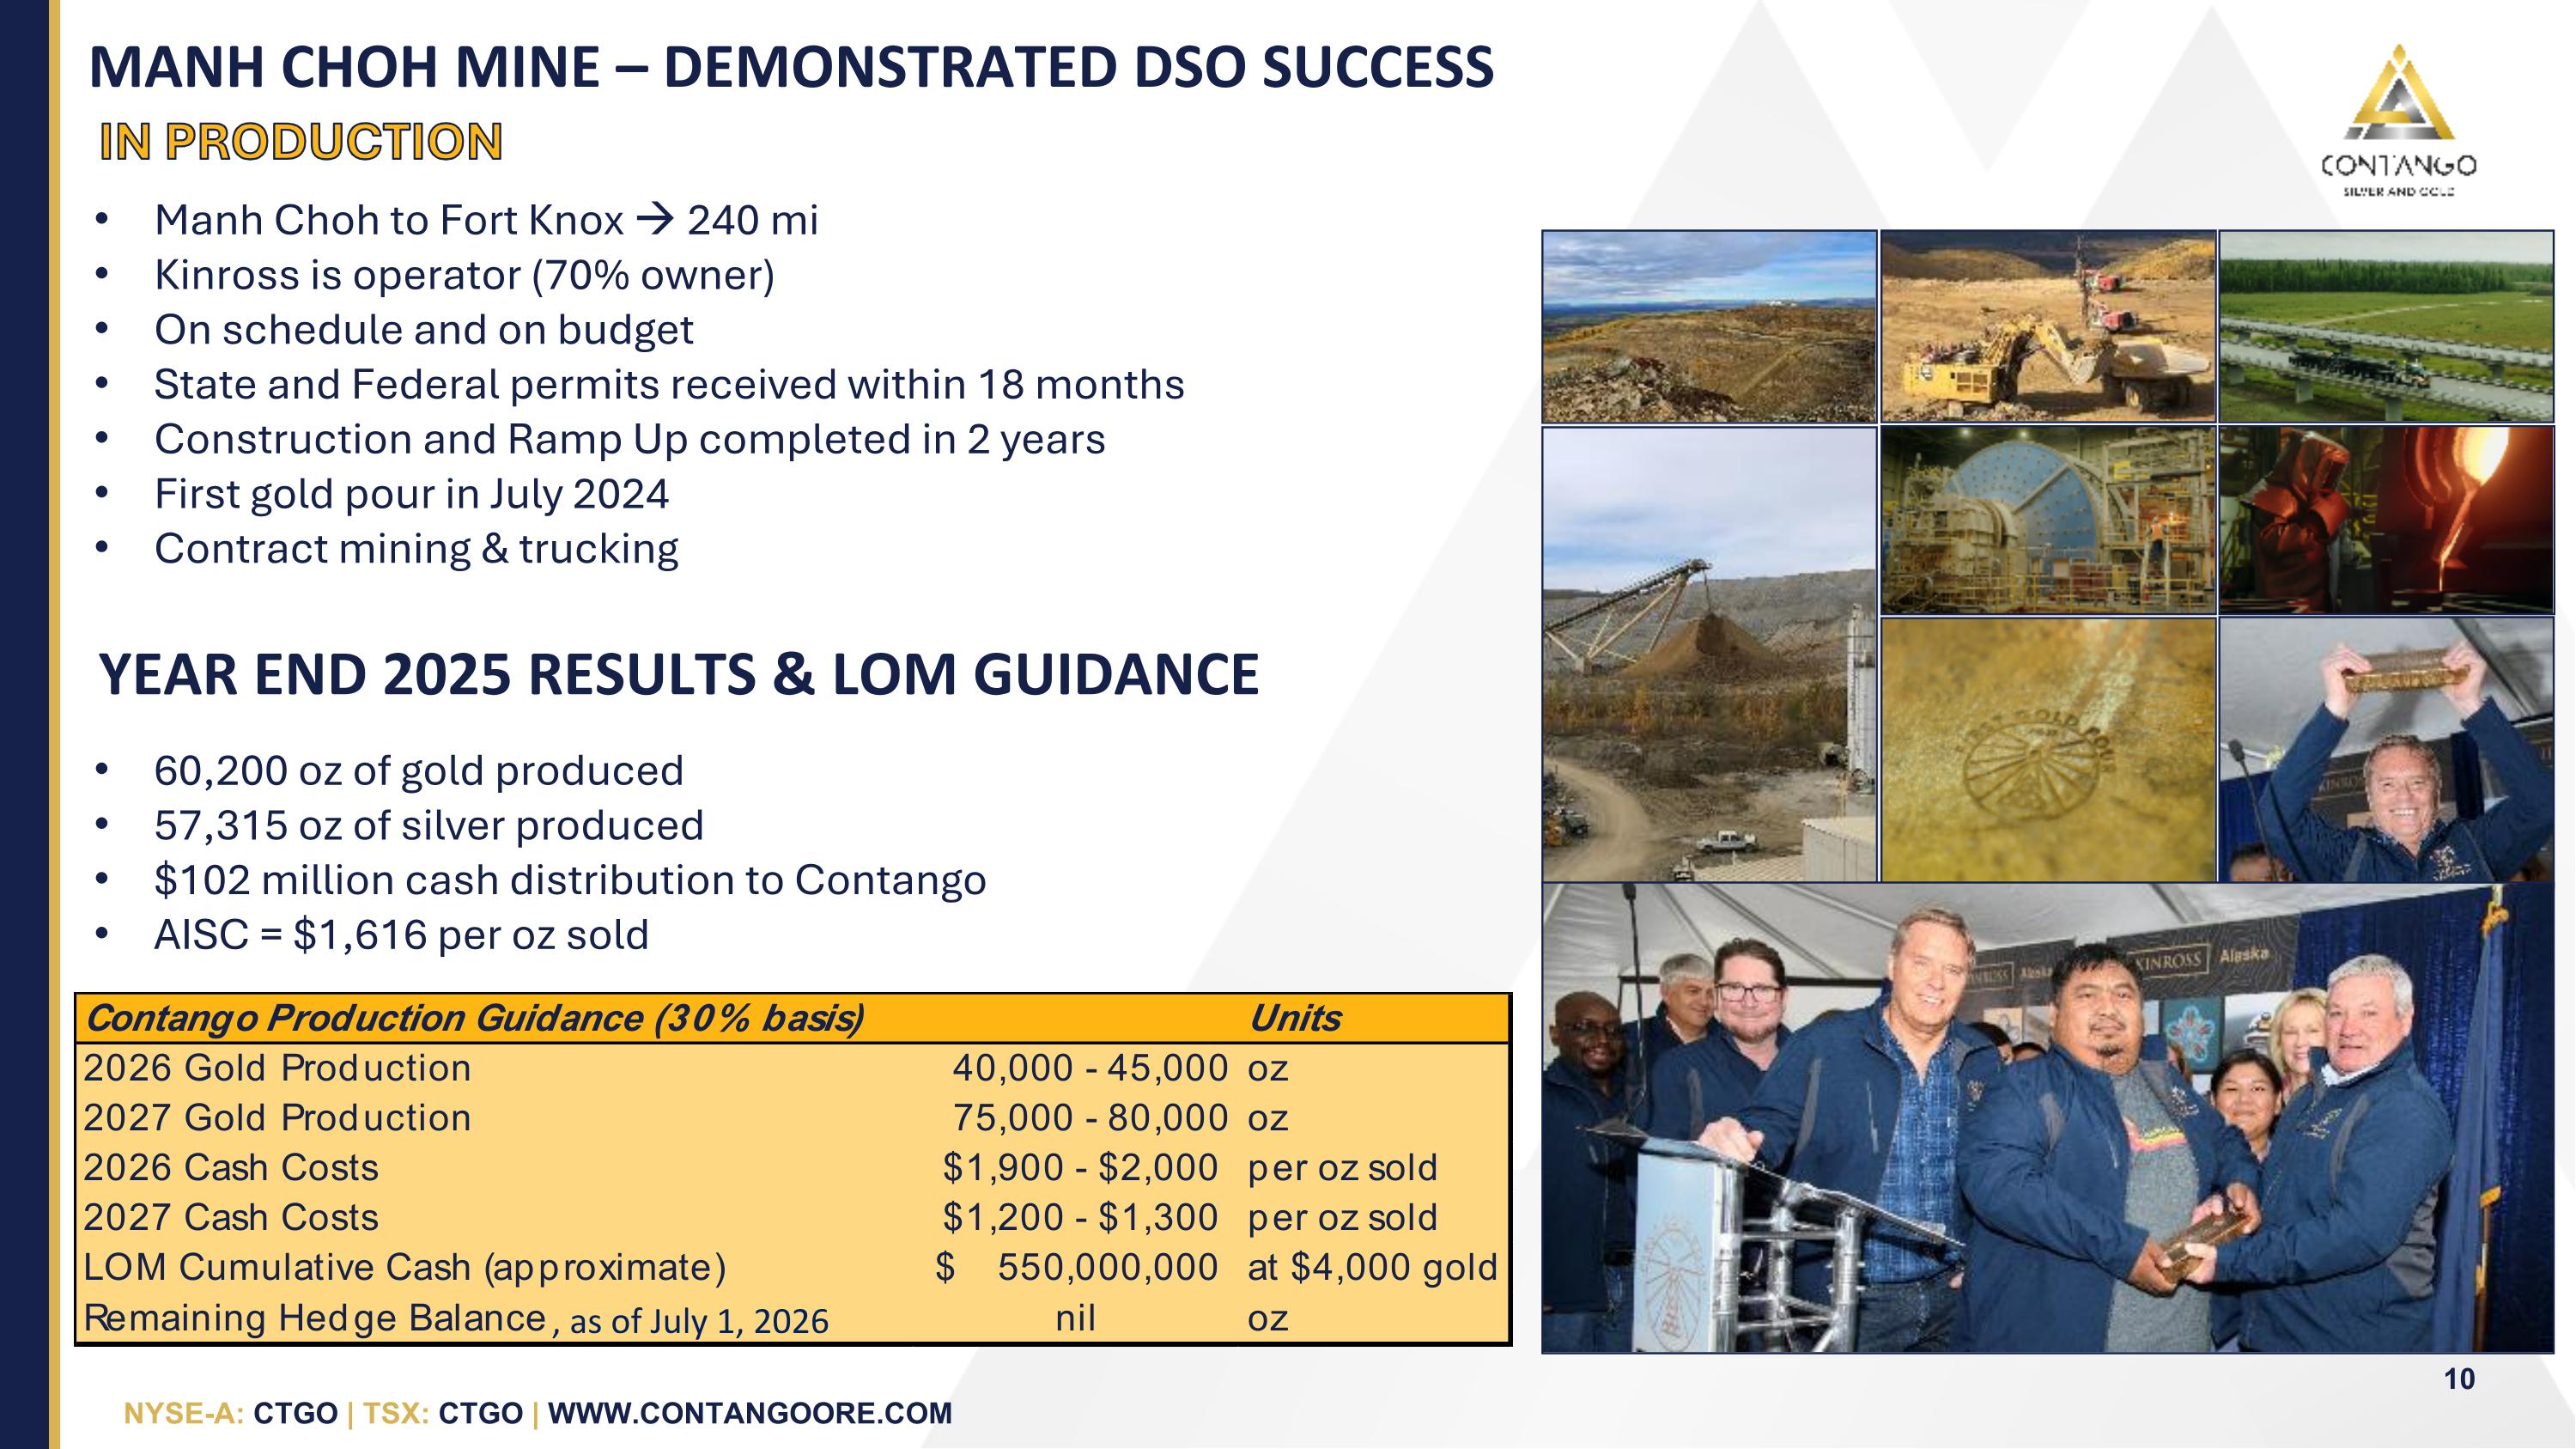
YEAR END 2025 RESULTS & LOM GUIDANCE 60,200 oz of gold produced 57,315 oz of silver produced $102 million cash distribution to Contango AISC = $1,616 per oz sold Manh Choh to Fort Knox 240 mi Kinross is operator (70% owner) On schedule and on budget State and Federal permits received within 18 months Construction and Ramp Up completed in 2 years First gold pour in July 2024 Contract mining & trucking MANH CHOH MINE – DEMONSTRATED DSO SUCCESS IN PRODUCTION , as of July 1, 2026
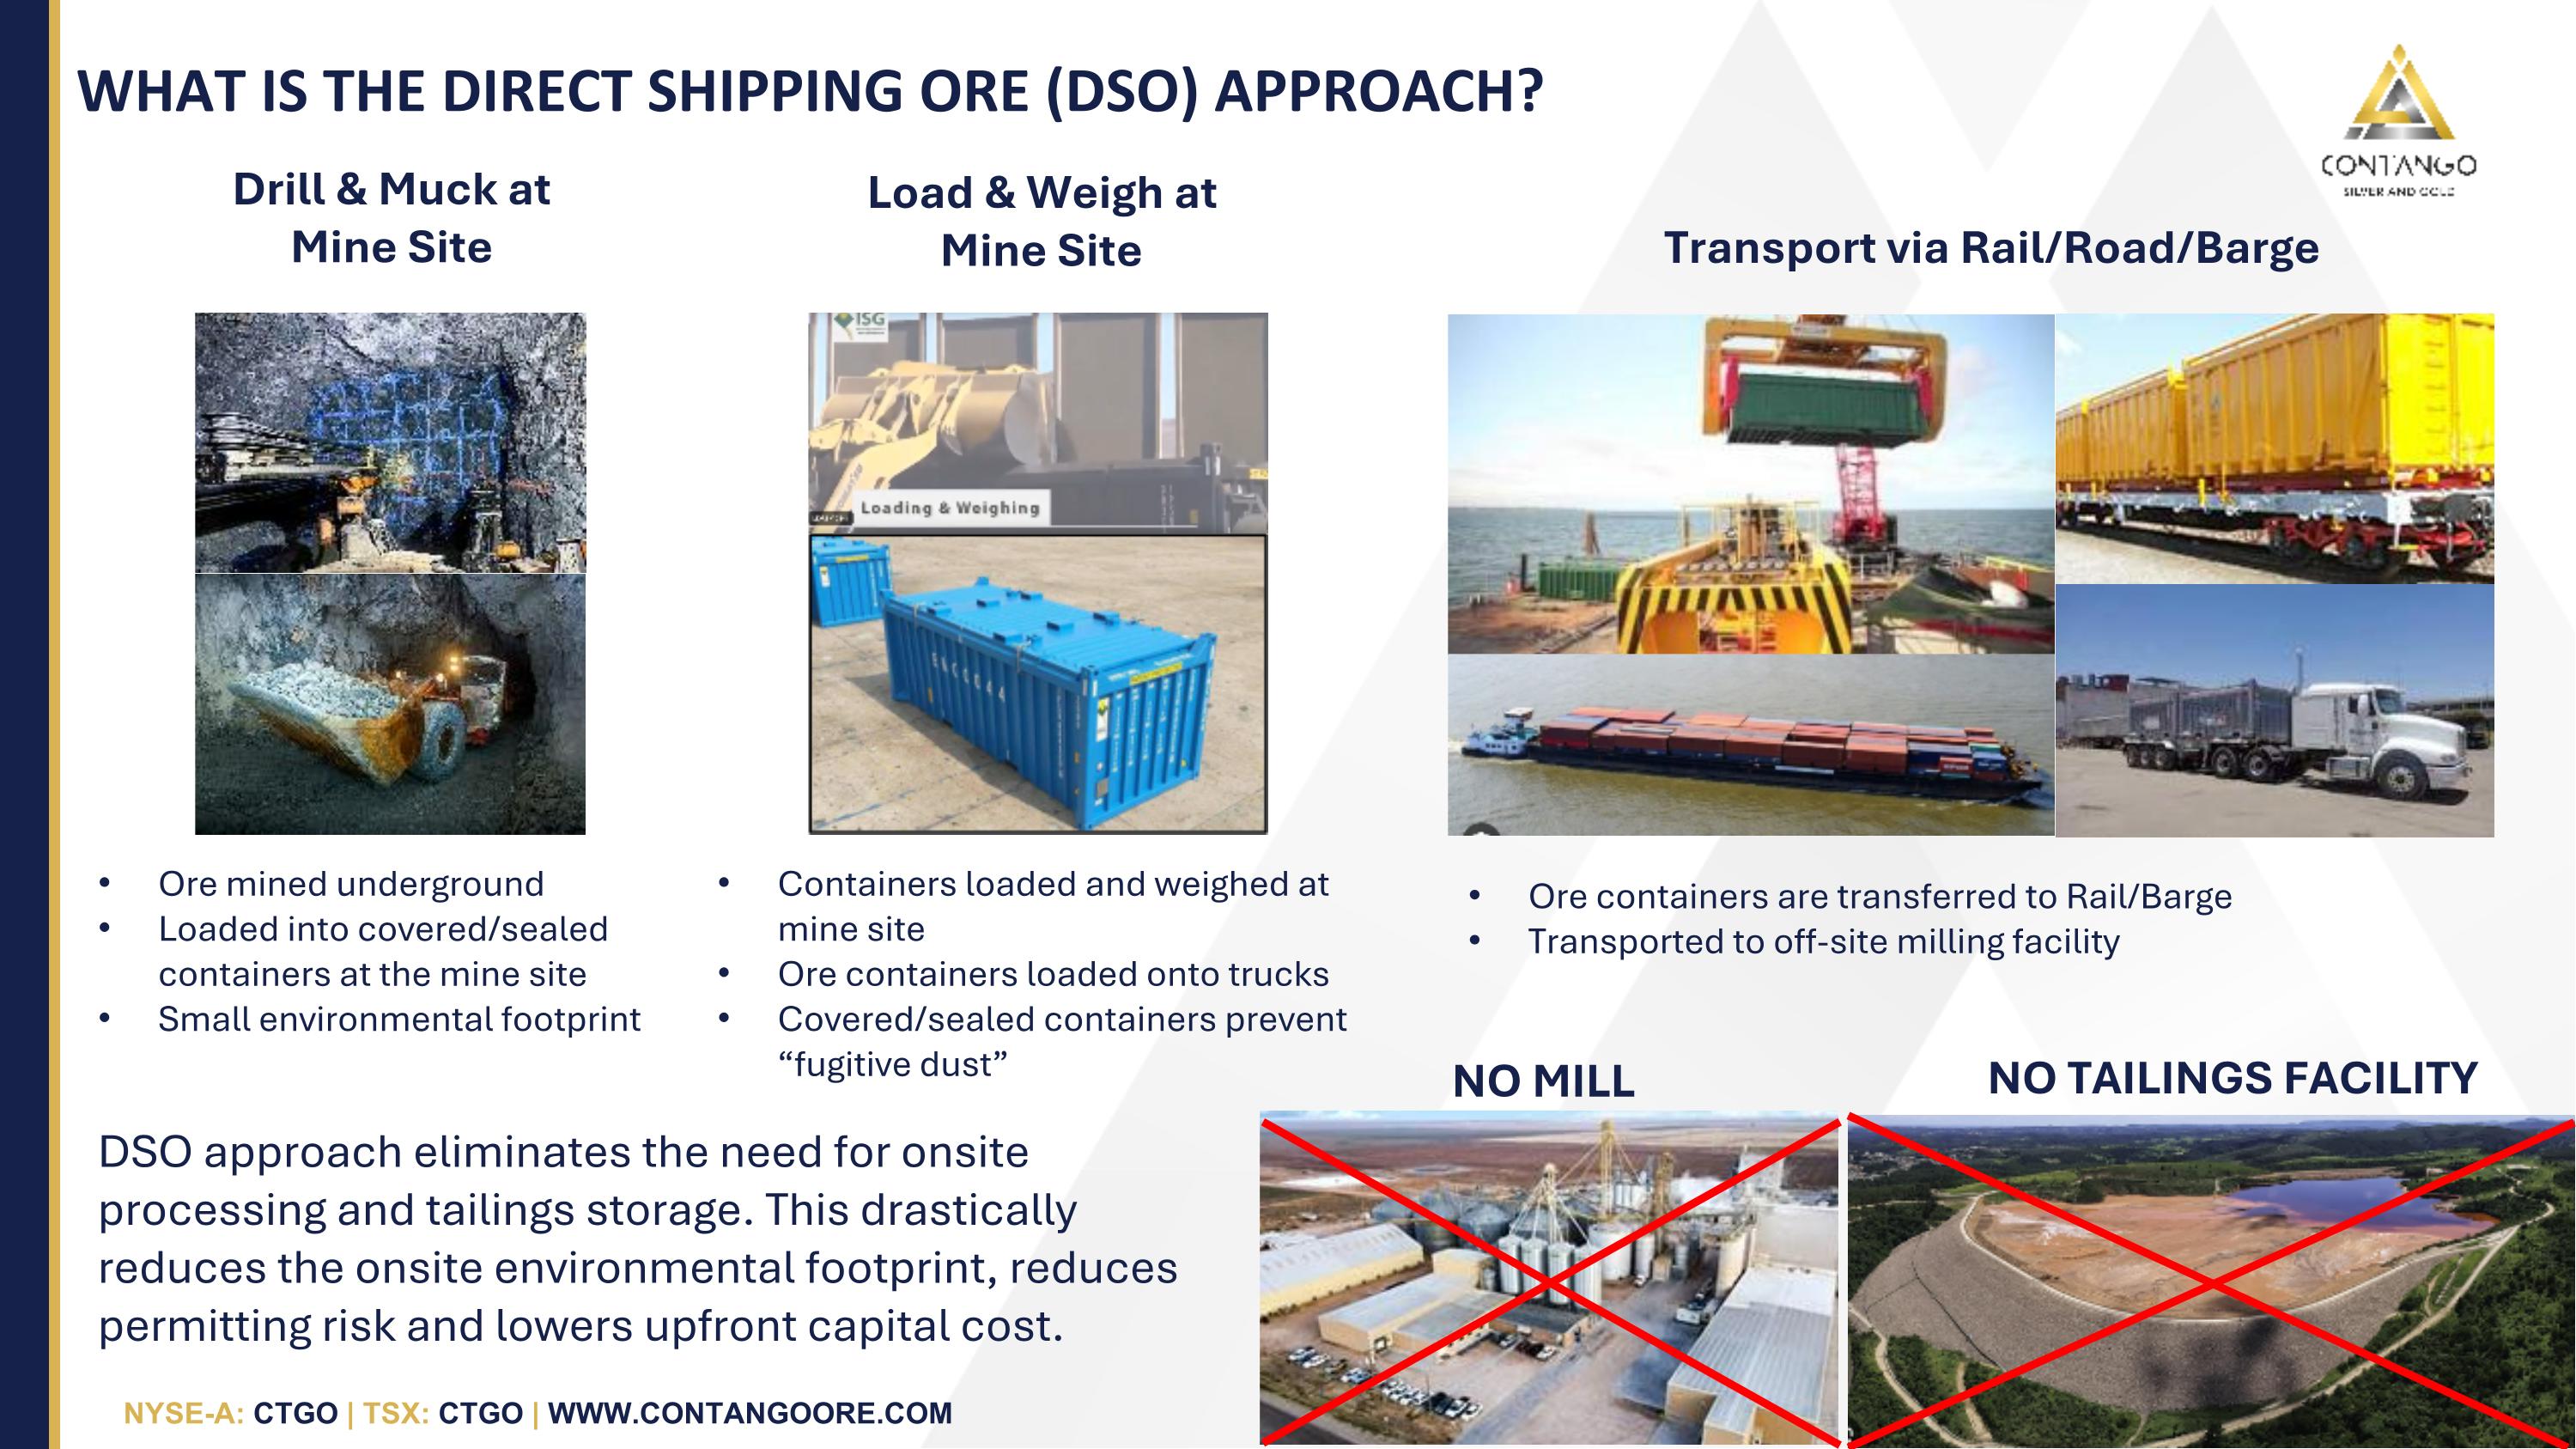
WHAT IS THE DIRECT SHIPPING ORE (DSO) APPROACH? Drill & Muck at Mine Site Load & Weigh at Mine Site Transport via Rail/Road/Barge Ore mined underground Loaded into covered/sealed containers at the mine site Small environmental footprint Containers loaded and weighed at mine site Ore containers loaded onto trucks Covered/sealed containers prevent “fugitive dust” DSO approach eliminates the need for onsite processing and tailings storage. This drastically reduces the onsite environmental footprint, reduces permitting risk and lowers upfront capital cost. NO TAILINGS FACILITY NO MILL Ore containers are transferred to Rail/Barge Transported to off-site milling facility
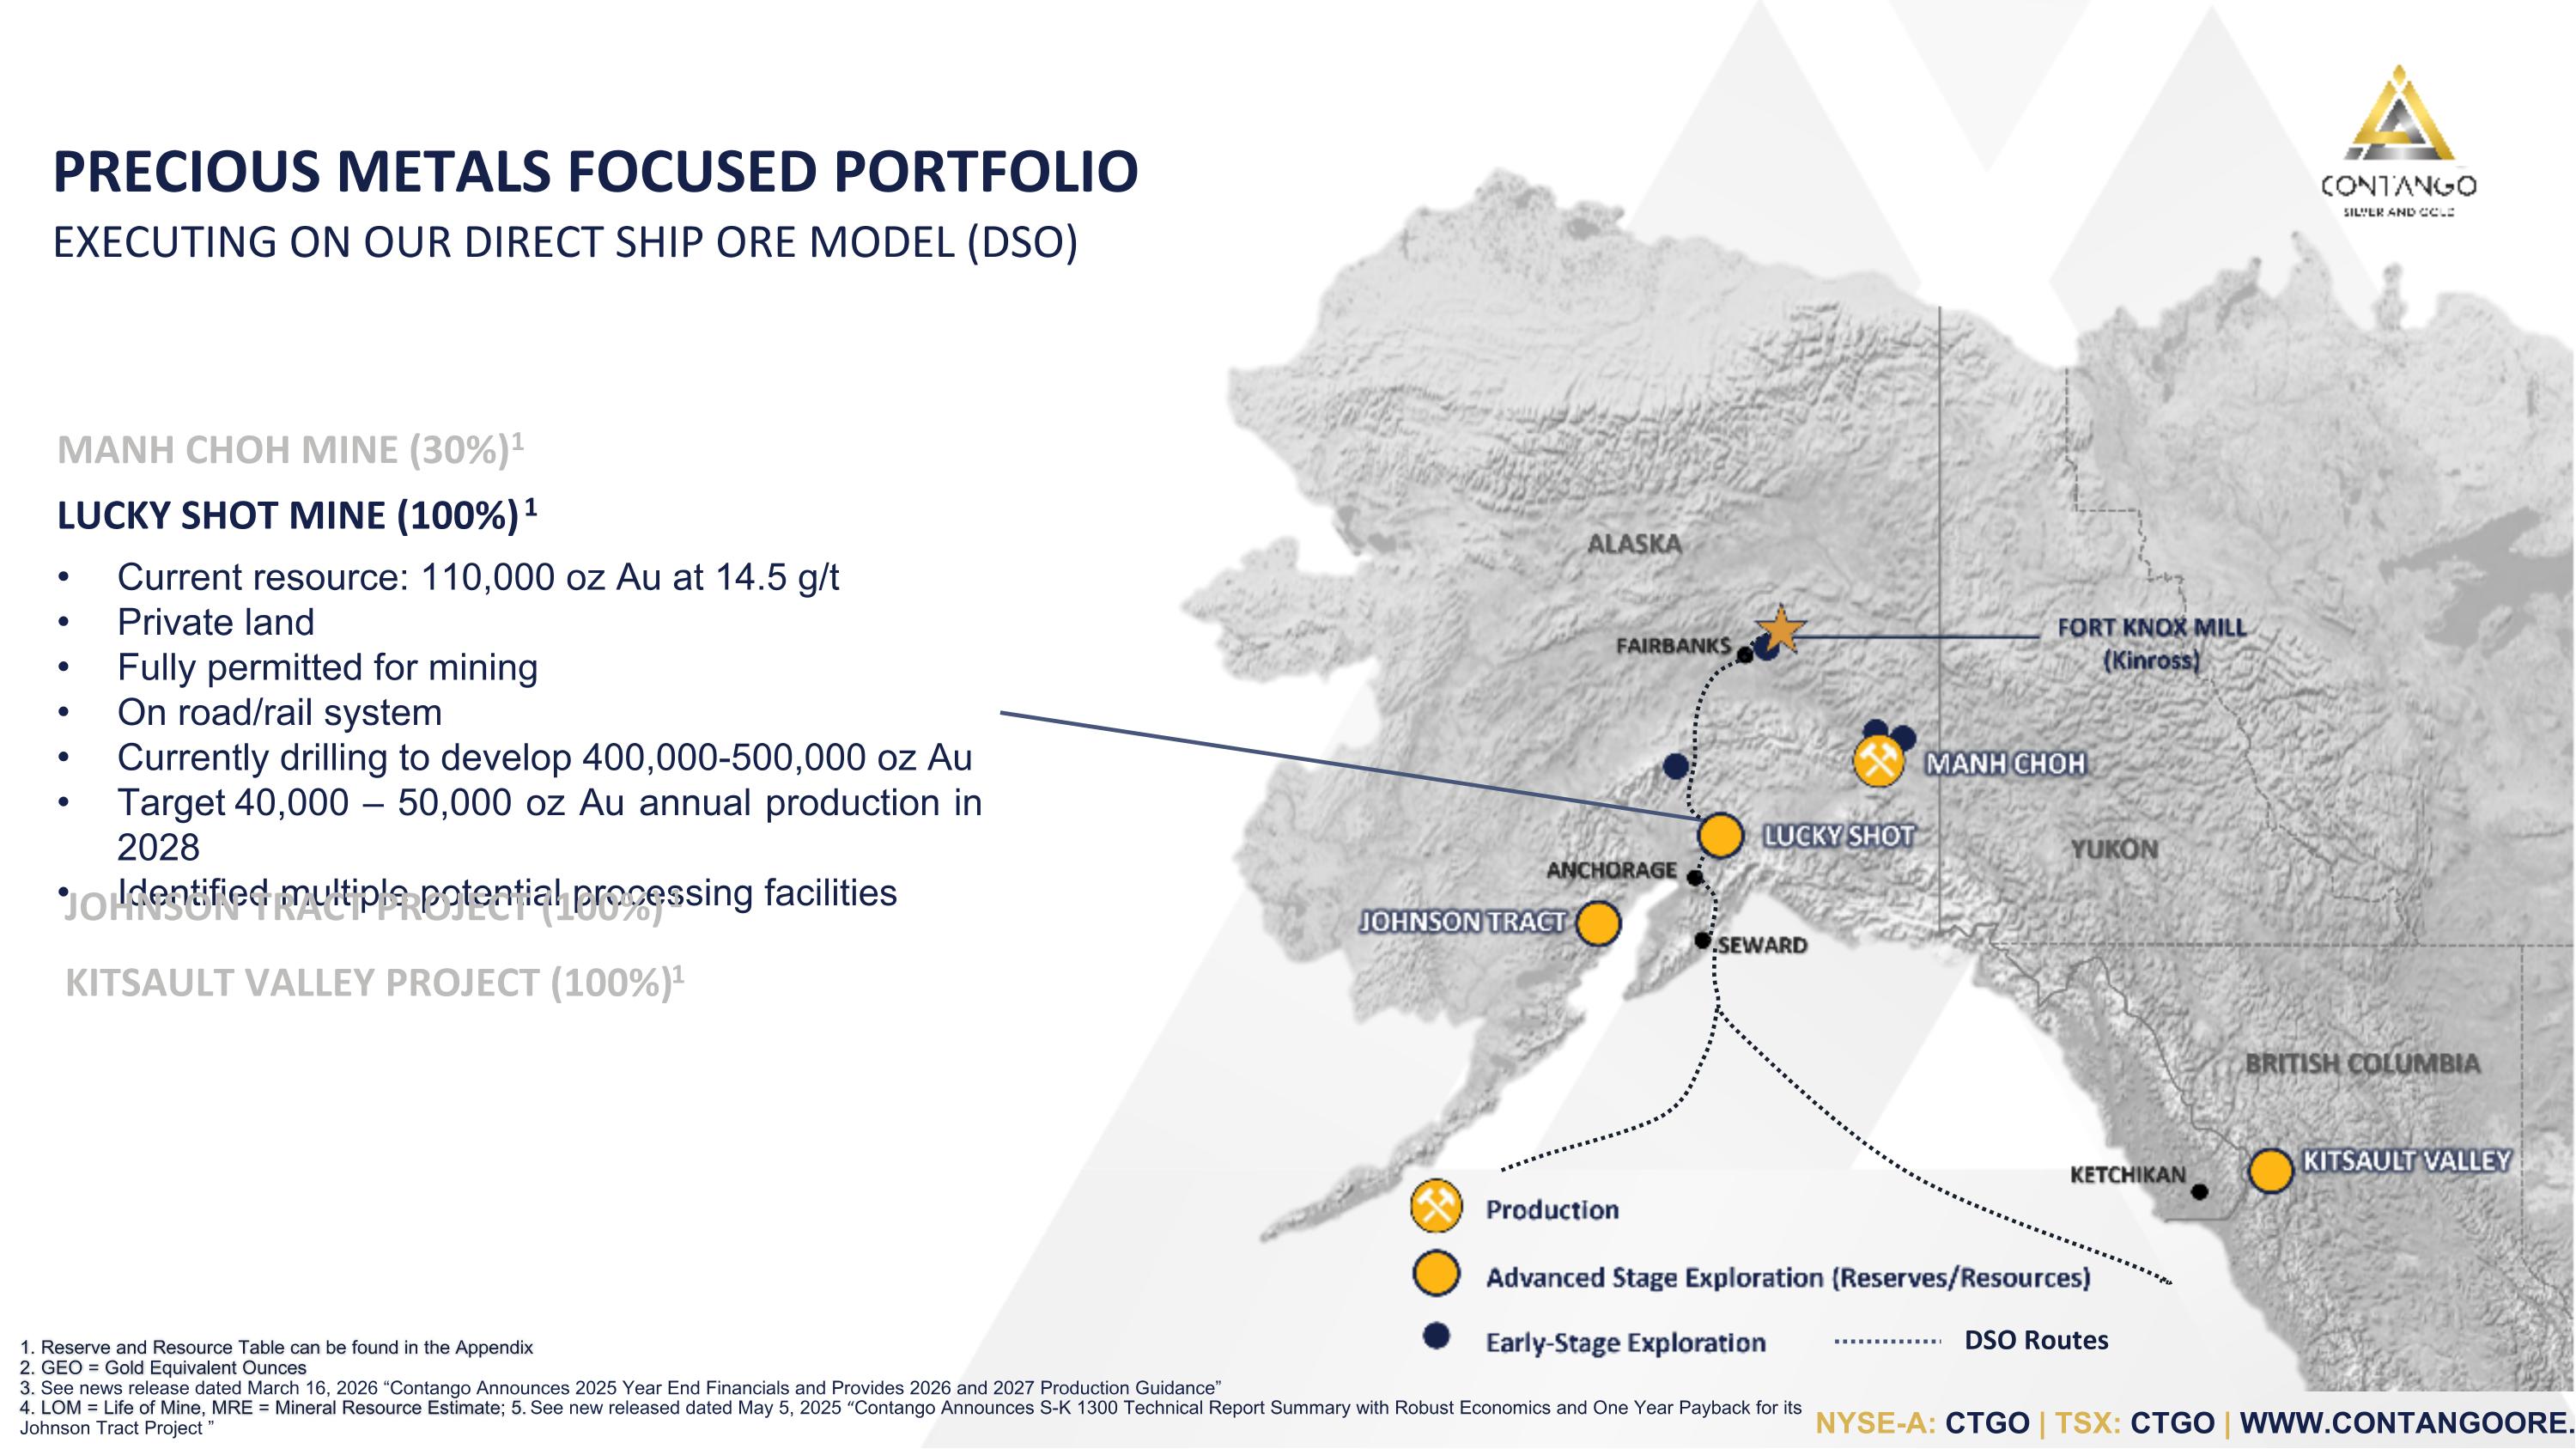
FORT KNOX MILL (Kinross) 1. Reserve and Resource Table can be found in the Appendix 2. GEO = Gold Equivalent Ounces 3. See news release dated March 16, 2026 “Contango Announces 2025 Year End Financials and Provides 2026 and 2027 Production Guidance” 4. LOM = Life of Mine, MRE = Mineral Resource Estimate; 5. See new released dated May 5, 2025 “Contango Announces S-K 1300 Technical Report Summary with Robust Economics and One Year Payback for its Johnson Tract Project ” MANH CHOH MINE (30%)1 LUCKY SHOT MINE (100%) 1 Current resource: 110,000 oz Au at 14.5 g/t Private land Fully permitted for mining On road/rail system Currently drilling to develop 400,000-500,000 oz Au Target 40,000 – 50,000 oz Au annual production in 2028 Identified multiple potential processing facilities JOHNSON TRACT PROJECT (100%) 1 KITSAULT VALLEY PROJECT (100%) 1 PRECIOUS METALS FOCUSED PORTFOLIO EXECUTING ON OUR DIRECT SHIP ORE MODEL (DSO) DSO Routes
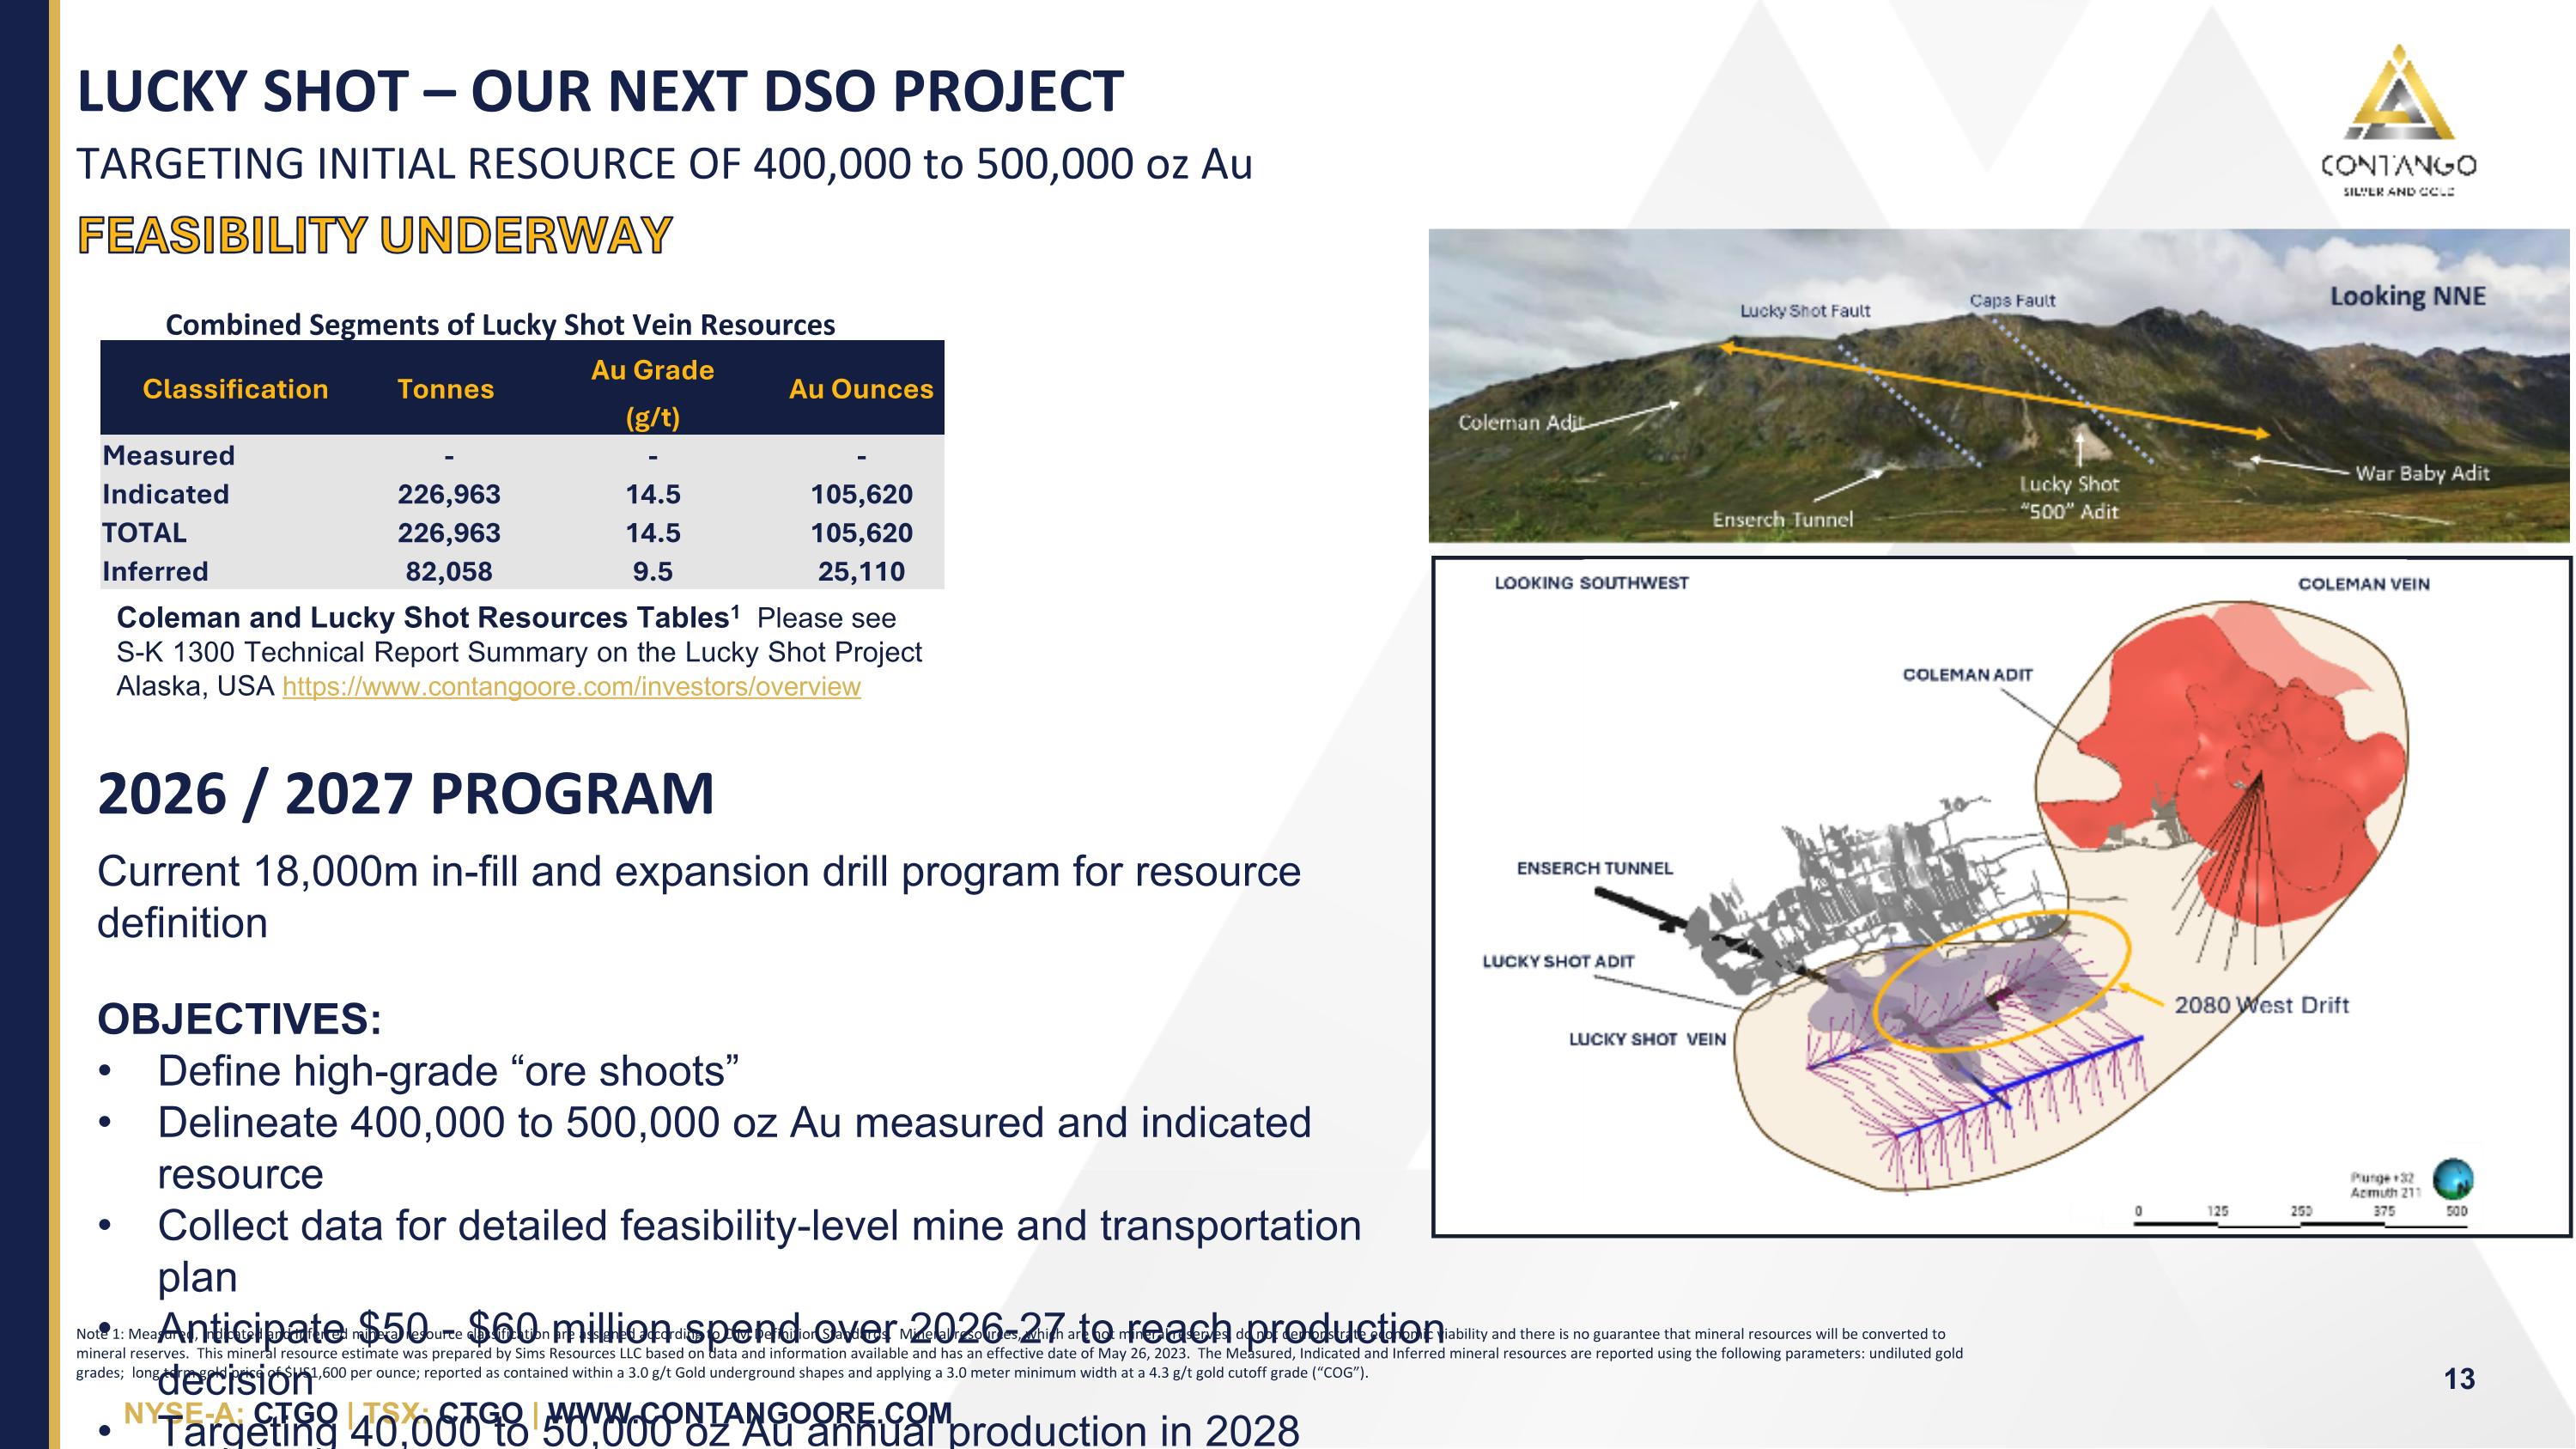
FEASIBILITY UNDERWAY Current 18,000m in-fill and expansion drill program for resource definition OBJECTIVES: Define high-grade “ore shoots” Delineate 400,000 to 500,000 oz Au measured and indicated resource Collect data for detailed feasibility-level mine and transportation plan Anticipate $50 - $60 million spend over 2026-27 to reach production decision Targeting 40,000 to 50,000 oz Au annual production in 2028 TARGETING INITIAL RESOURCE OF 400,000 to 500,000 oz Au LUCKY SHOT – OUR NEXT DSO PROJECT Coleman and Lucky Shot Resources Tables1 Please see S-K 1300 Technical Report Summary on the Lucky Shot Project Alaska, USA https://www.contangoore.com/investors/overview Combined Segments of Lucky Shot Vein Resources Classification Tonnes Au Grade Au Ounces (g/t) Measured - - - Indicated 226,963 14.5 105,620 TOTAL 226,963 14.5 105,620 Inferred 82,058 9.5 25,110 Note 1: Measured, Indicated and Inferred mineral resource classification are assigned according to CIM Definition Standards. Mineral resources, which are not mineral reserves, do not demonstrate economic viability and there is no guarantee that mineral resources will be converted to mineral reserves. This mineral resource estimate was prepared by Sims Resources LLC based on data and information available and has an effective date of May 26, 2023. The Measured, Indicated and Inferred mineral resources are reported using the following parameters: undiluted gold grades; long term gold price of $US1,600 per ounce; reported as contained within a 3.0 g/t Gold underground shapes and applying a 3.0 meter minimum width at a 4.3 g/t gold cutoff grade (“COG”). 2026 / 2027 PROGRAM
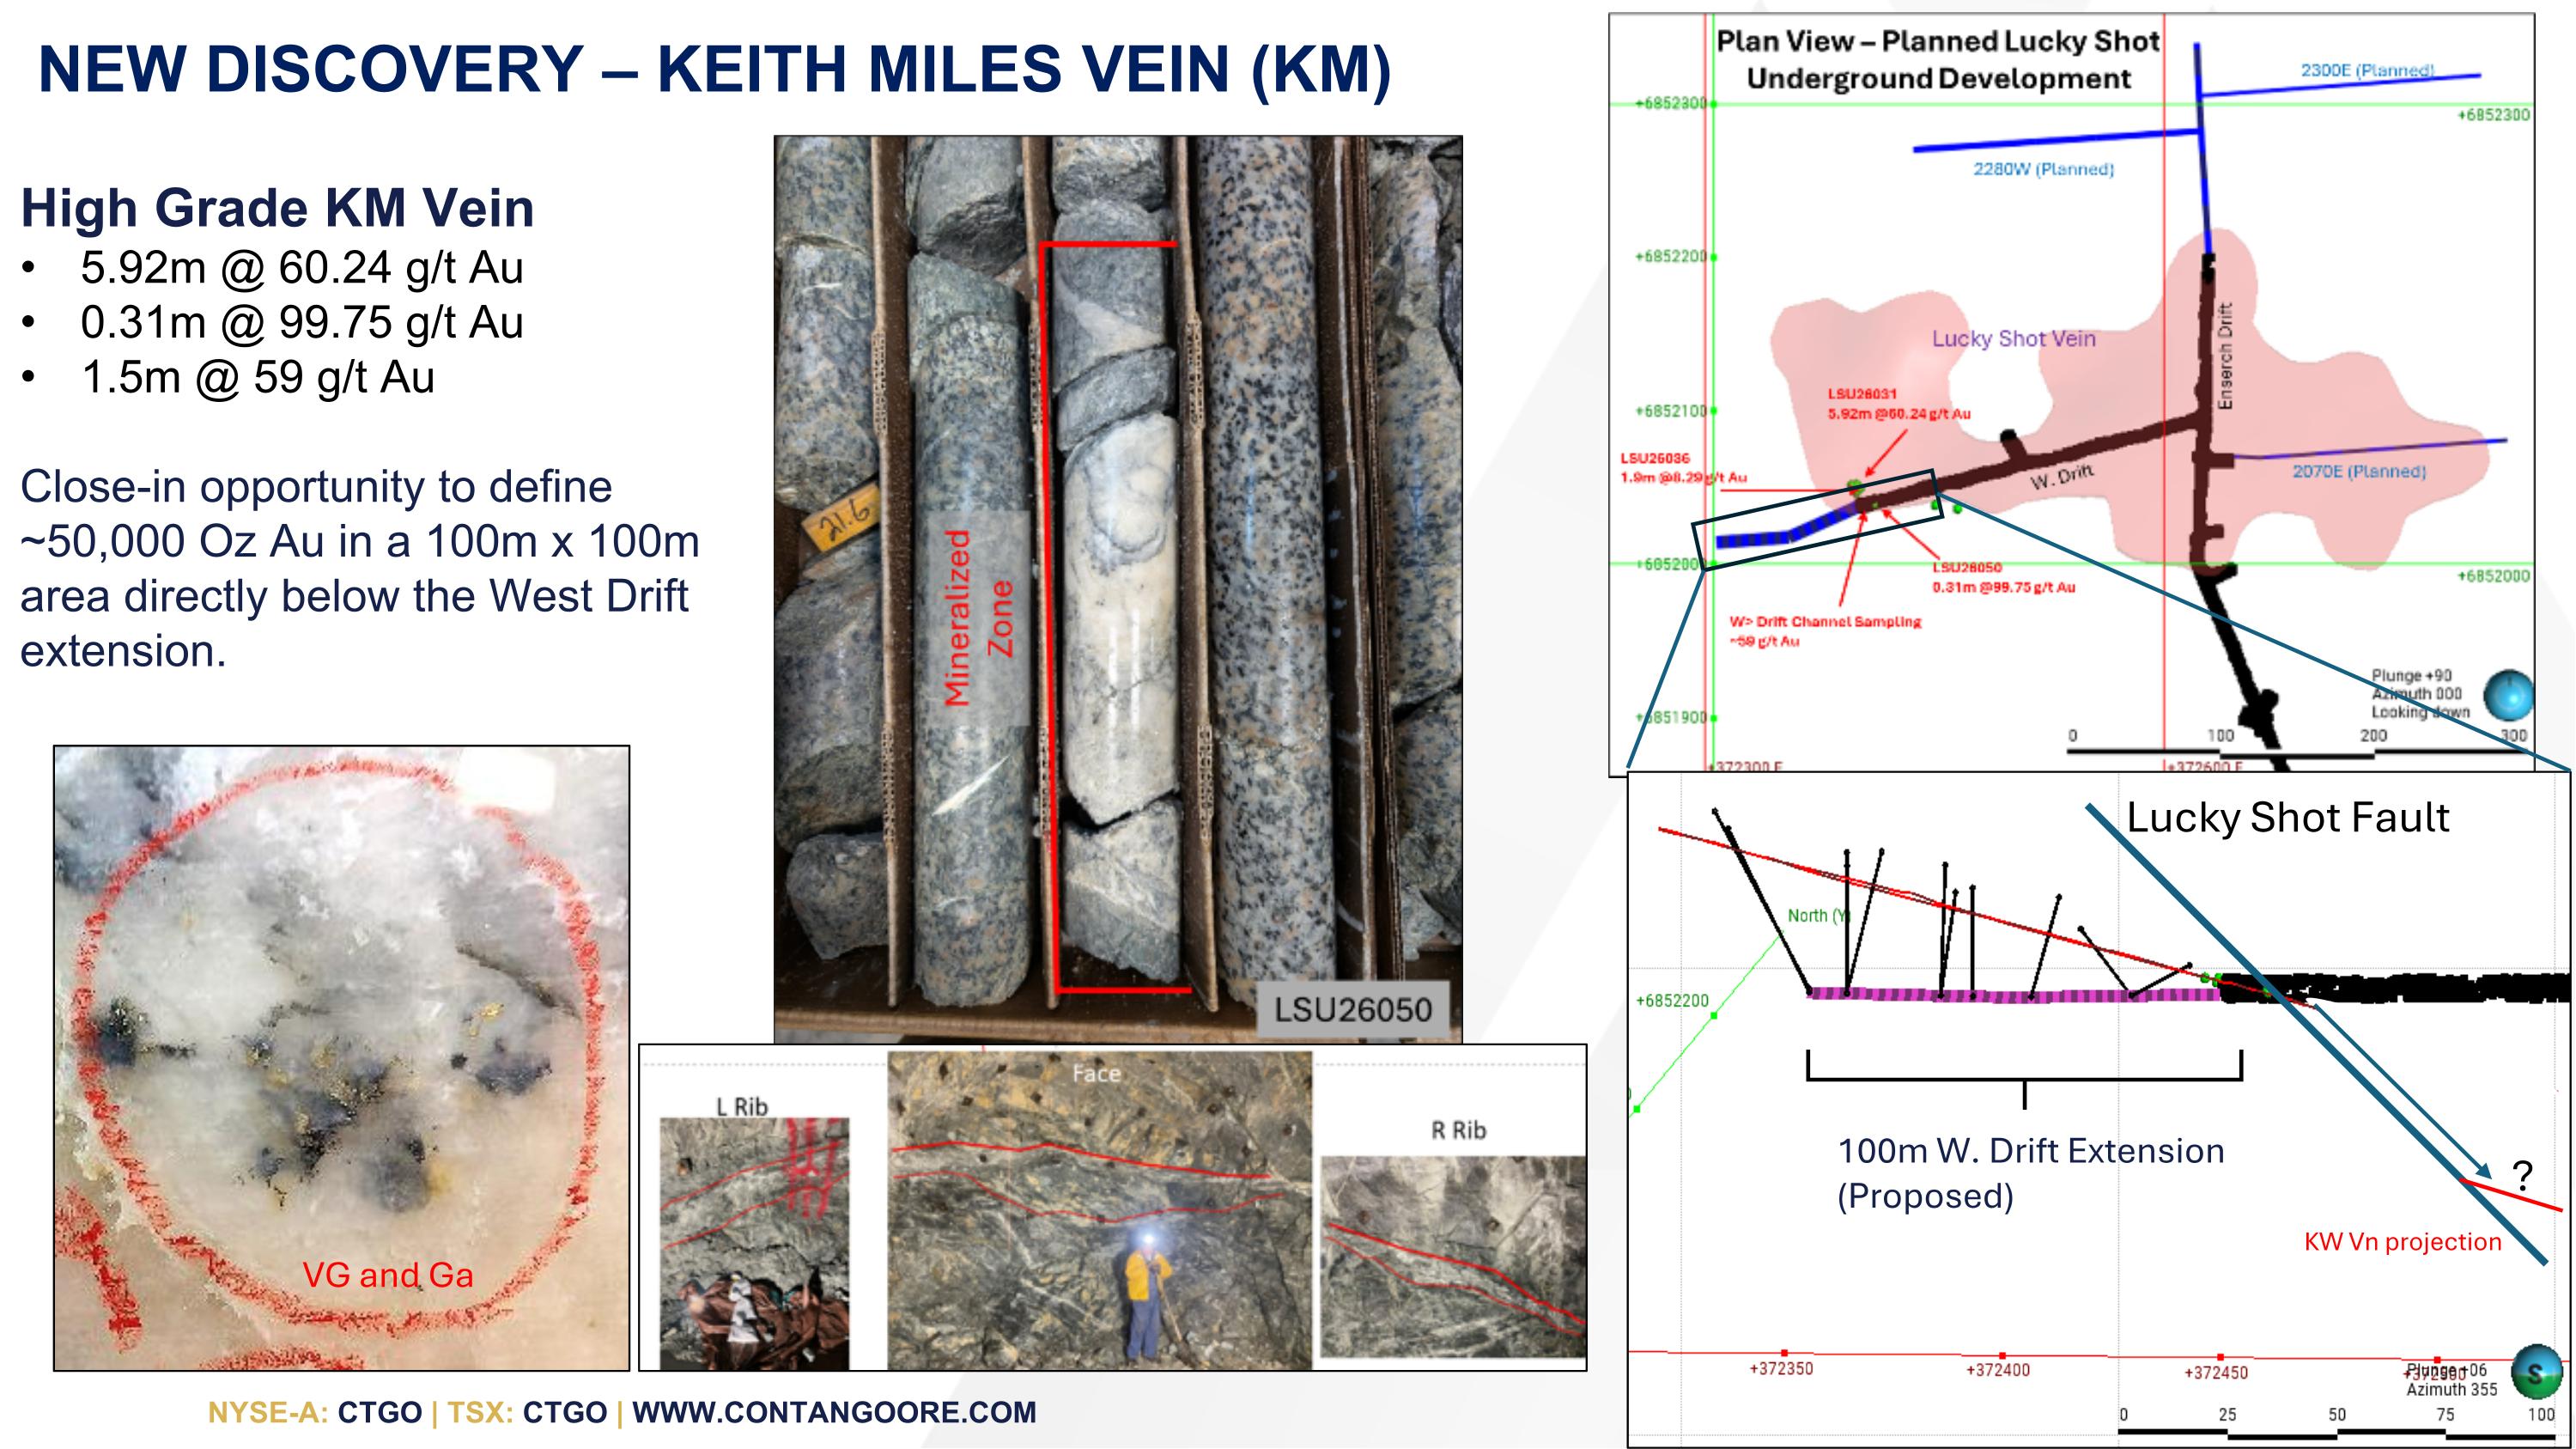
High Grade KM Vein 5.92m @ 60.24 g/t Au 0.31m @ 99.75 g/t Au 1.5m @ 59 g/t Au Close-in opportunity to define ~50,000 Oz Au in a 100m x 100m area directly below the West Drift extension. VG and Ga KW Vn projection 100m W. Drift Extension (Proposed) Lucky Shot Fault ? new discovery – Keith Miles vein (km)
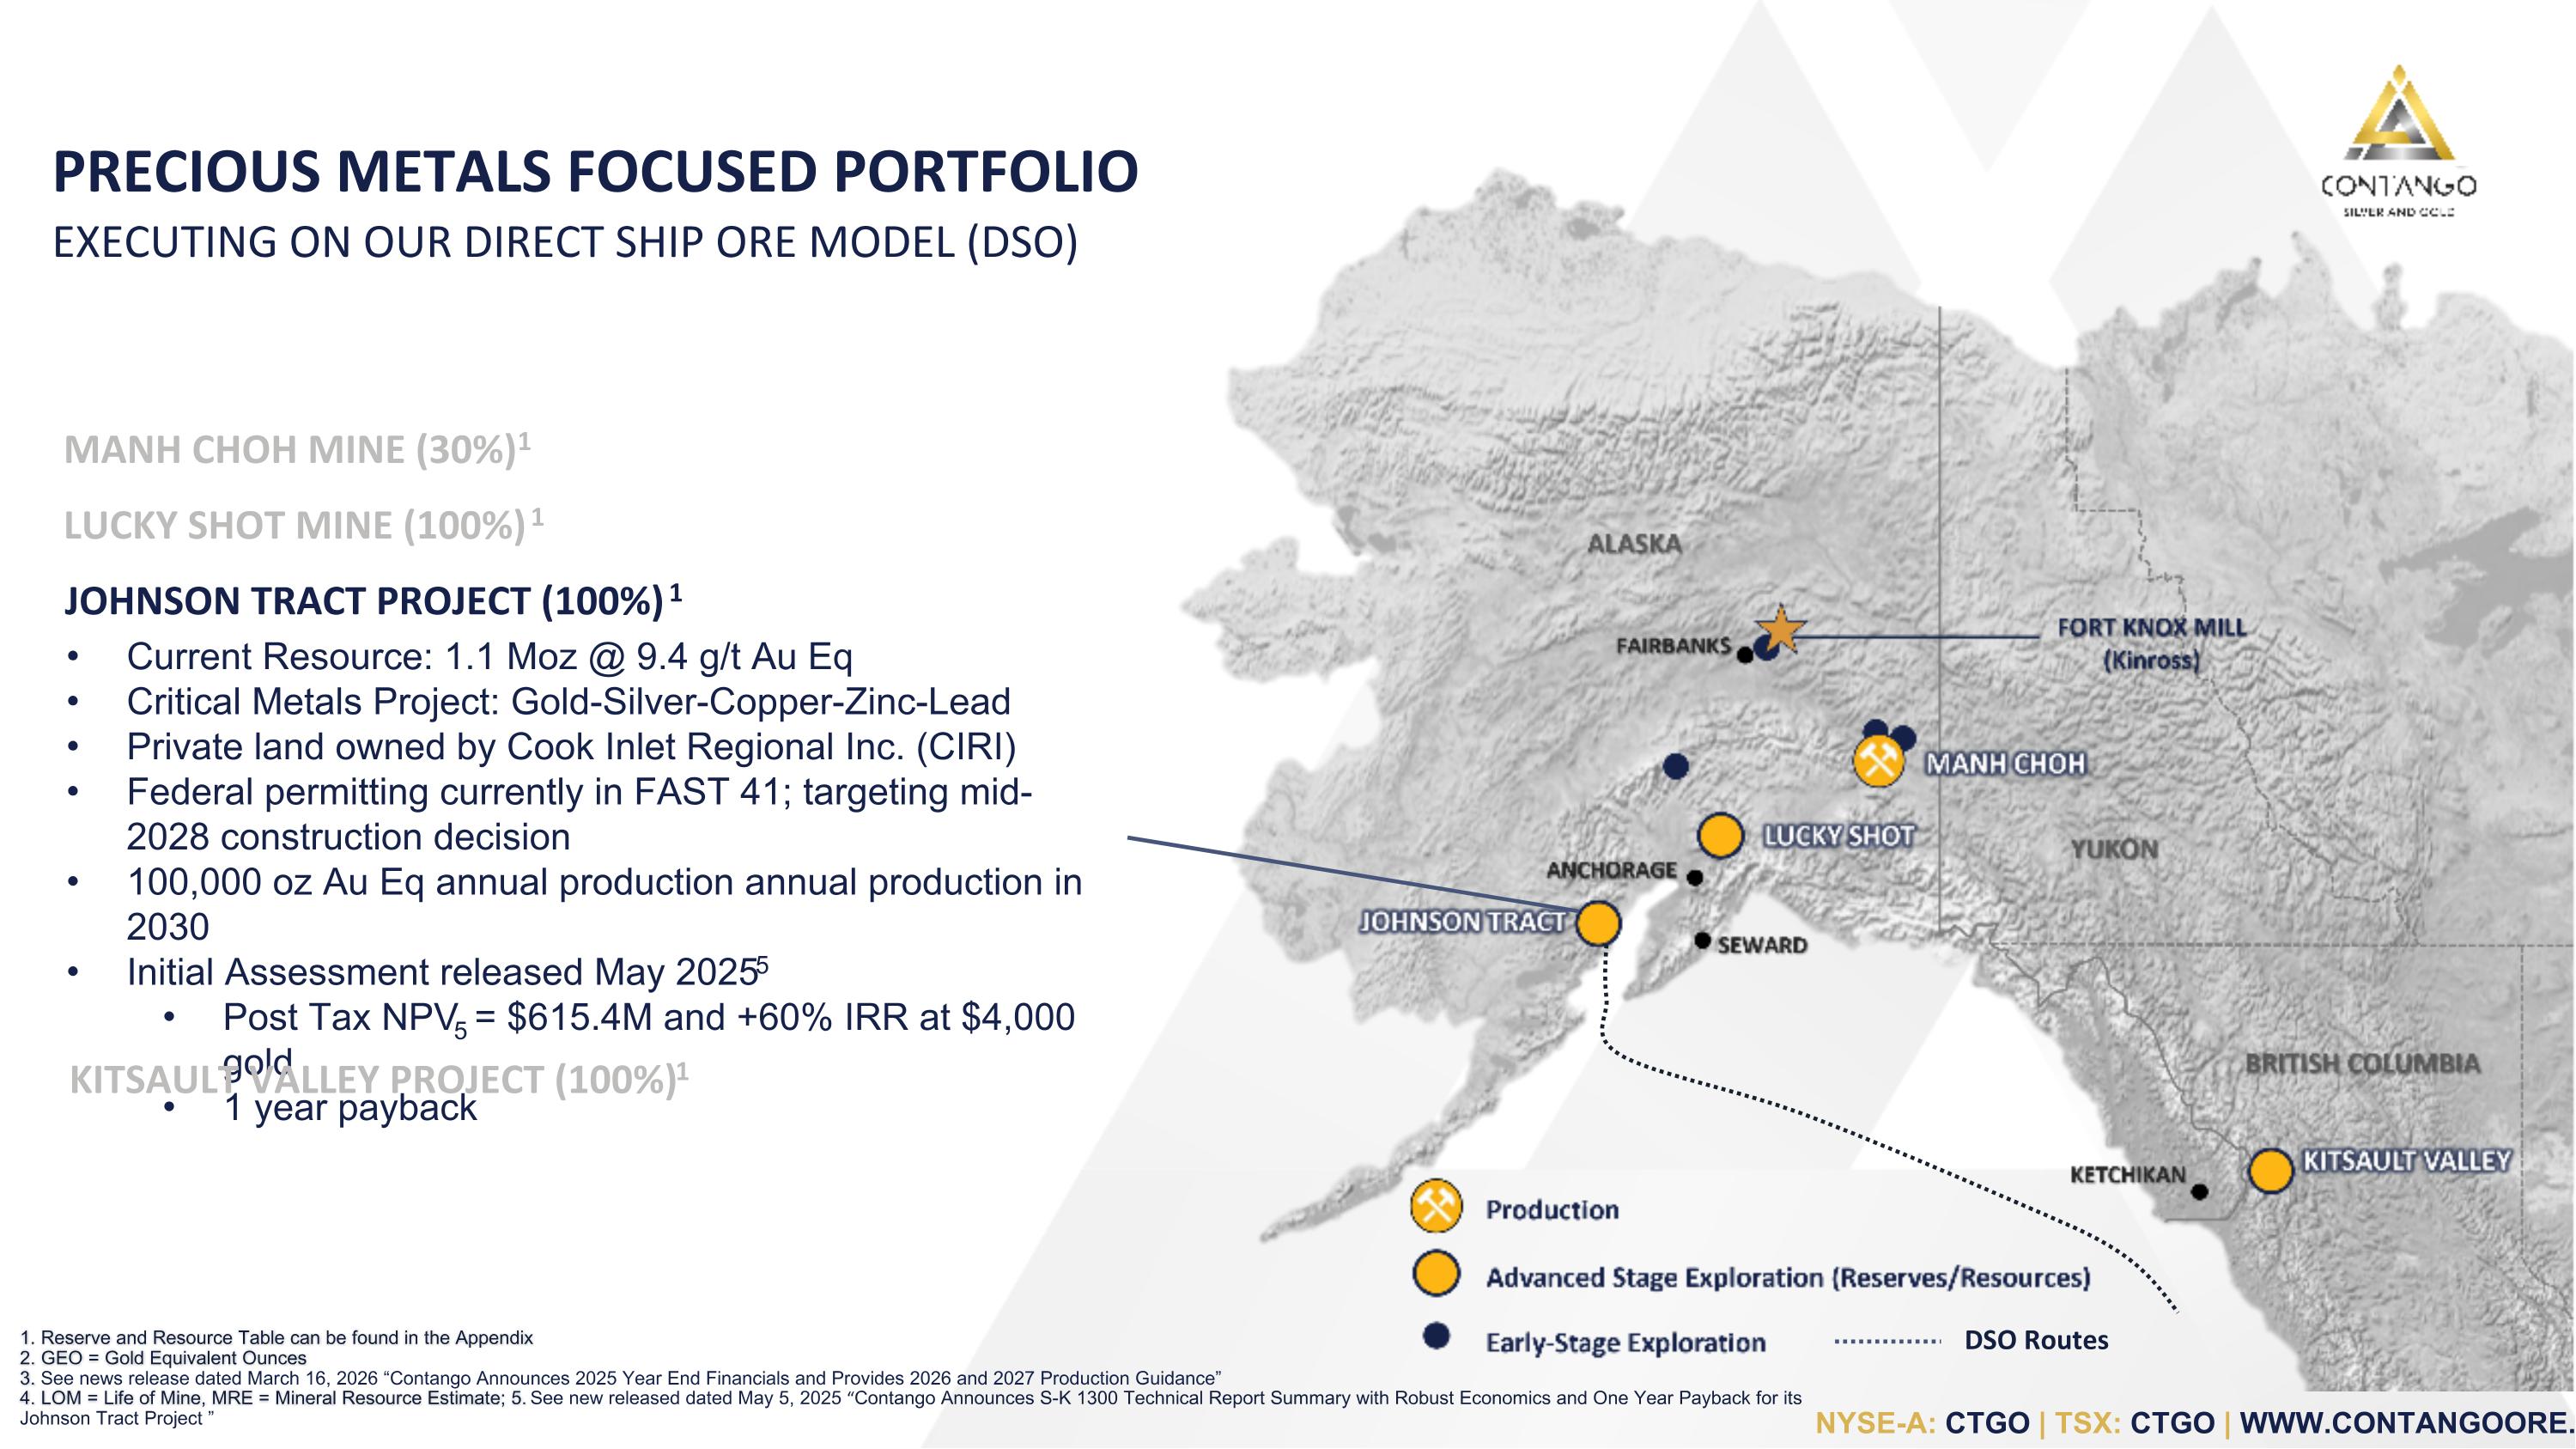
FORT KNOX MILL (Kinross) 1. Reserve and Resource Table can be found in the Appendix 2. GEO = Gold Equivalent Ounces 3. See news release dated March 16, 2026 “Contango Announces 2025 Year End Financials and Provides 2026 and 2027 Production Guidance” 4. LOM = Life of Mine, MRE = Mineral Resource Estimate; 5. See new released dated May 5, 2025 “Contango Announces S-K 1300 Technical Report Summary with Robust Economics and One Year Payback for its Johnson Tract Project ” MANH CHOH MINE (30%)1 LUCKY SHOT MINE (100%) 1 JOHNSON TRACT PROJECT (100%) 1 Current Resource: 1.1 Moz @ 9.4 g/t Au Eq Critical Metals Project: Gold-Silver-Copper-Zinc-Lead Private land owned by Cook Inlet Regional Inc. (CIRI) Federal permitting currently in FAST 41; targeting mid-2028 construction decision 100,000 oz Au Eq annual production annual production in 2030 Initial Assessment released May 20255 Post Tax NPV5 = $615.4M and +60% IRR at $4,000 gold 1 year payback KITSAULT VALLEY PROJECT (100%) 1 PRECIOUS METALS FOCUSED PORTFOLIO EXECUTING ON OUR DIRECT SHIP ORE MODEL (DSO) DSO Routes
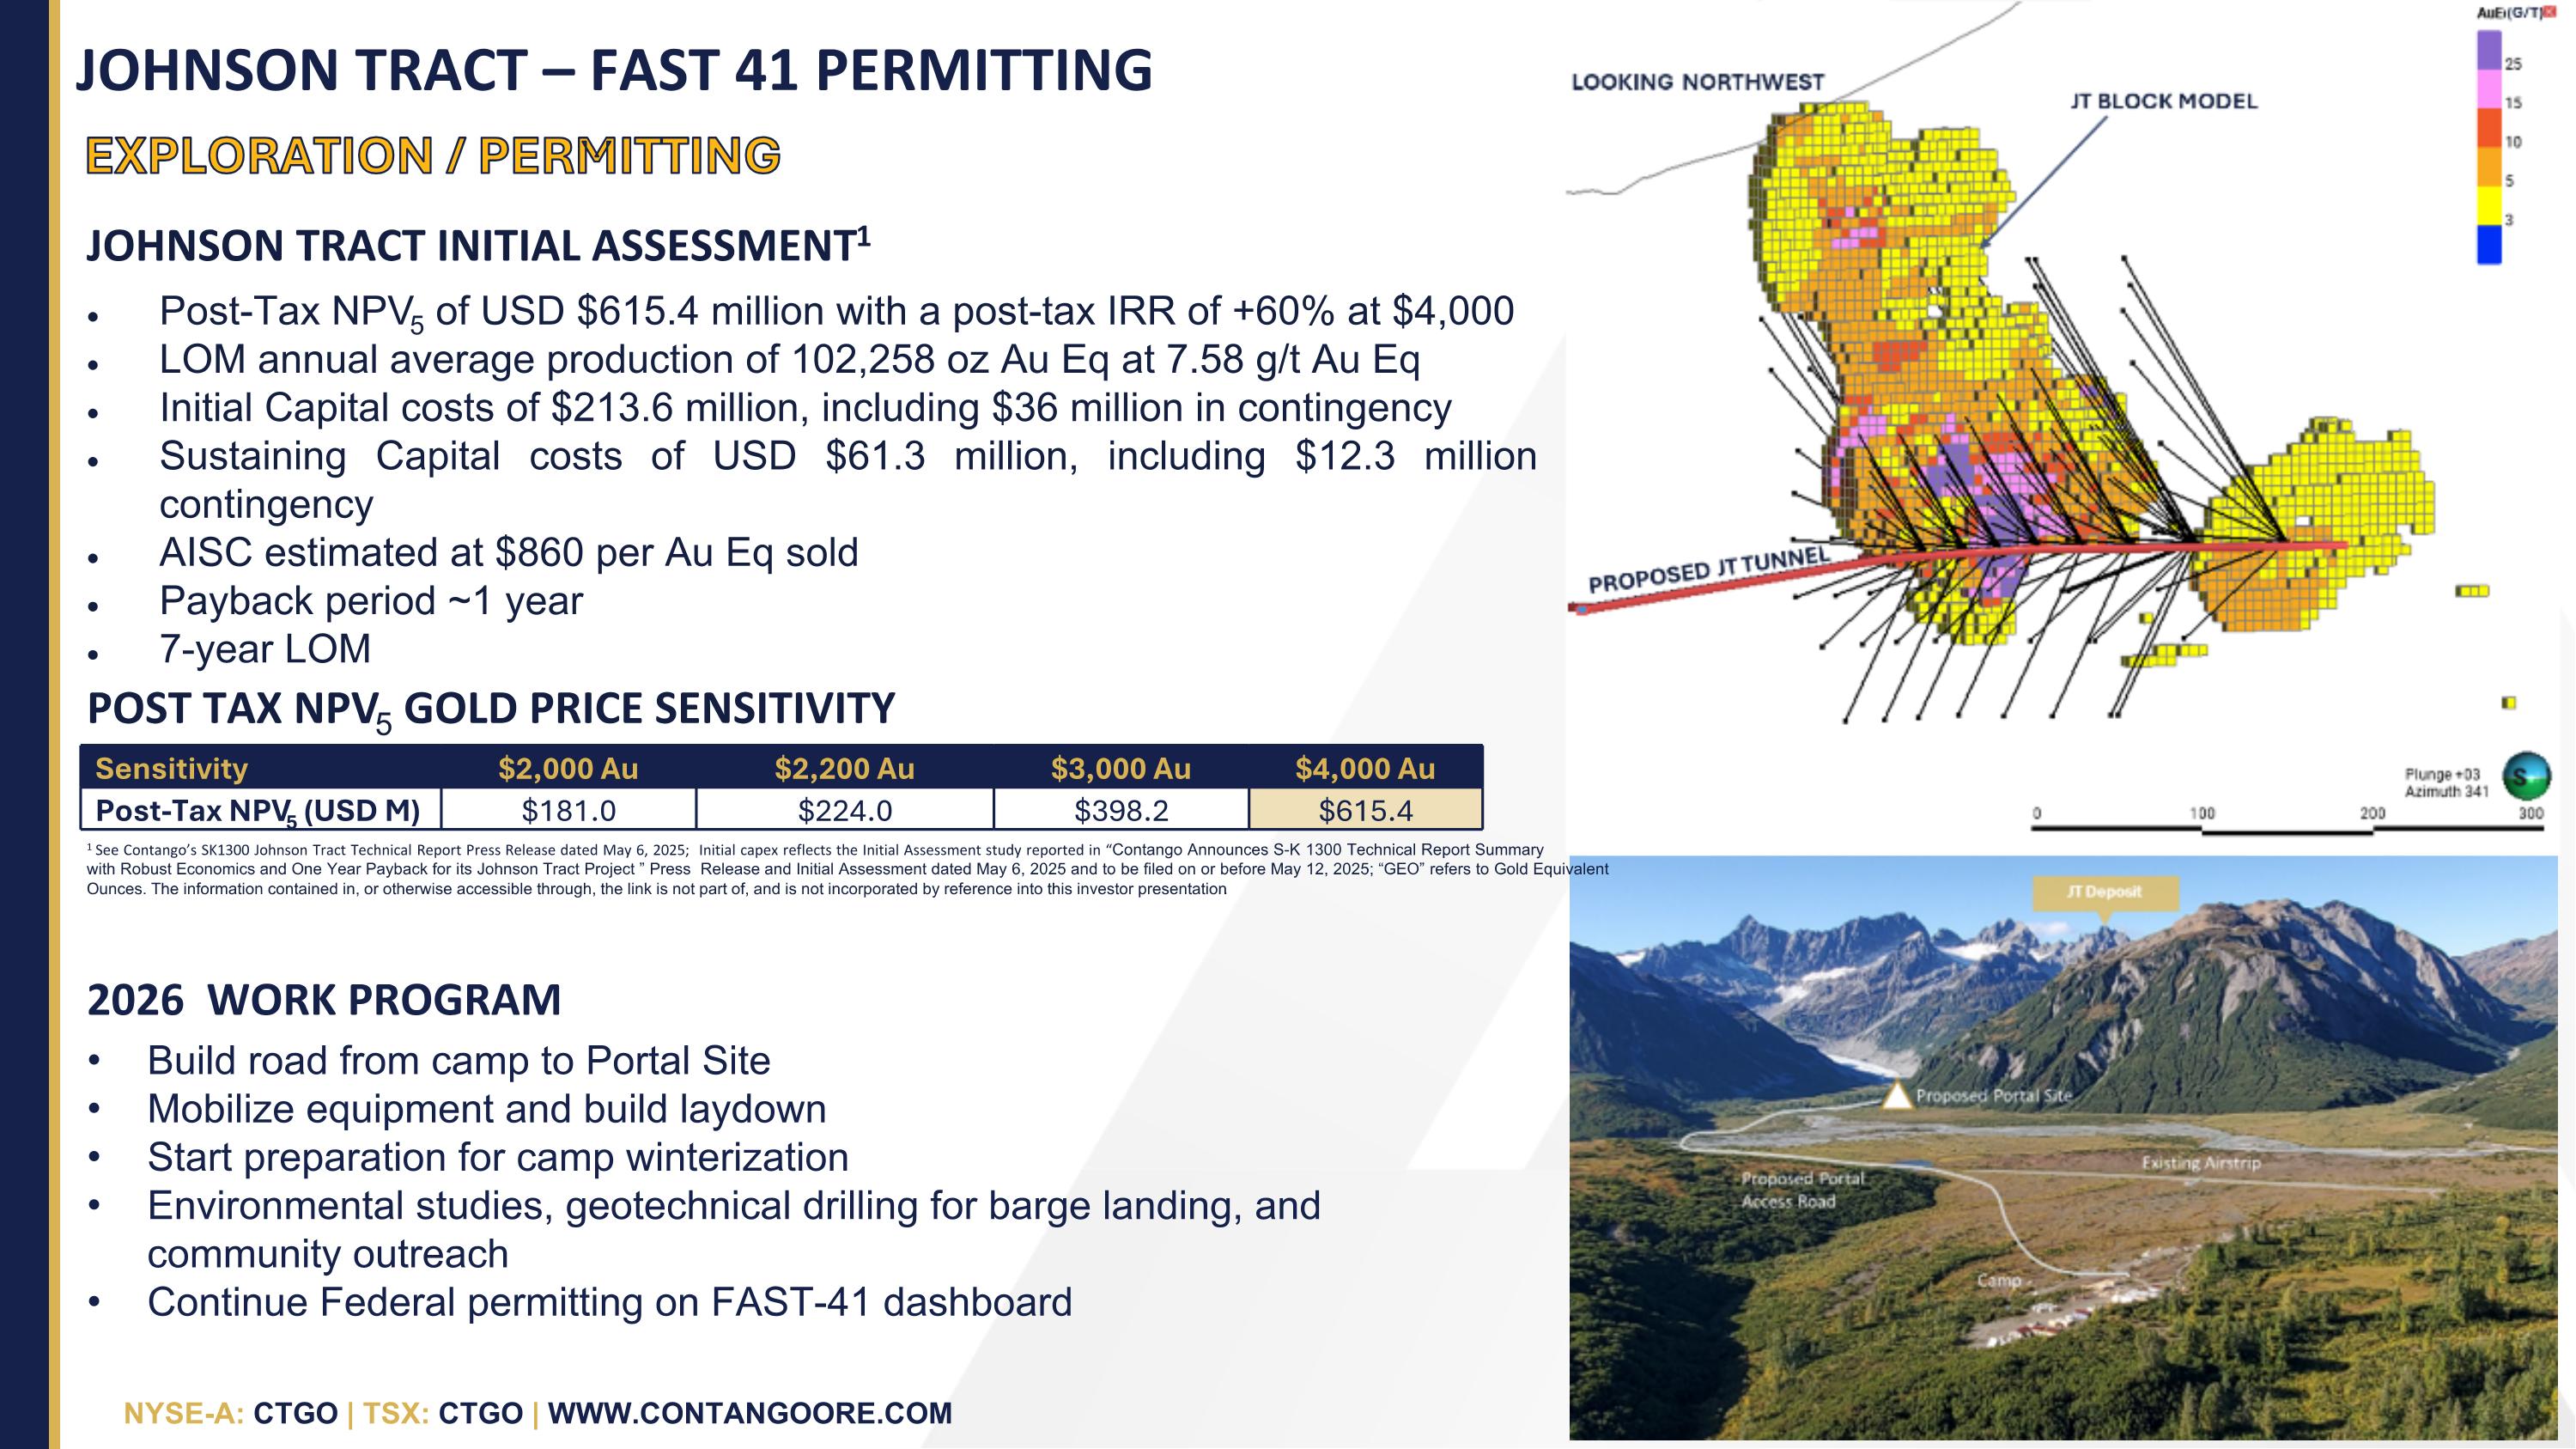
EXPLORATION / PERMITTING 2026 WORK PROGRAM JOHNSON TRACT – FAST 41 PERMITTING JOHNSON TRACT INITIAL ASSESSMENT1 Post-Tax NPV5 of USD $615.4 million with a post-tax IRR of +60% at $4,000 LOM annual average production of 102,258 oz Au Eq at 7.58 g/t Au Eq Initial Capital costs of $213.6 million, including $36 million in contingency Sustaining Capital costs of USD $61.3 million, including $12.3 million in contingency AISC estimated at $860 per Au Eq sold Payback period ~1 year 7-year LOM Sensitivity $2,000 Au $2,200 Au $3,000 Au $4,000 Au Post-Tax NPV5 (USD M) $181.0 $224.0 $398.2 $615.4 POST TAX NPV5 GOLD PRICE SENSITIVITY Build road from camp to Portal Site Mobilize equipment and build laydown Start preparation for camp winterization Environmental studies, geotechnical drilling for barge landing, and community outreach Continue Federal permitting on FAST-41 dashboard 1 See Contango’s SK1300 Johnson Tract Technical Report Press Release dated May 6, 2025; Initial capex reflects the Initial Assessment study reported in “Contango Announces S-K 1300 Technical Report Summary with Robust Economics and One Year Payback for its Johnson Tract Project ” Press Release and Initial Assessment dated May 6, 2025 and to be filed on or before May 12, 2025; “GEO” refers to Gold Equivalent Ounces. The information contained in, or otherwise accessible through, the link is not part of, and is not incorporated by reference into this investor presentation.
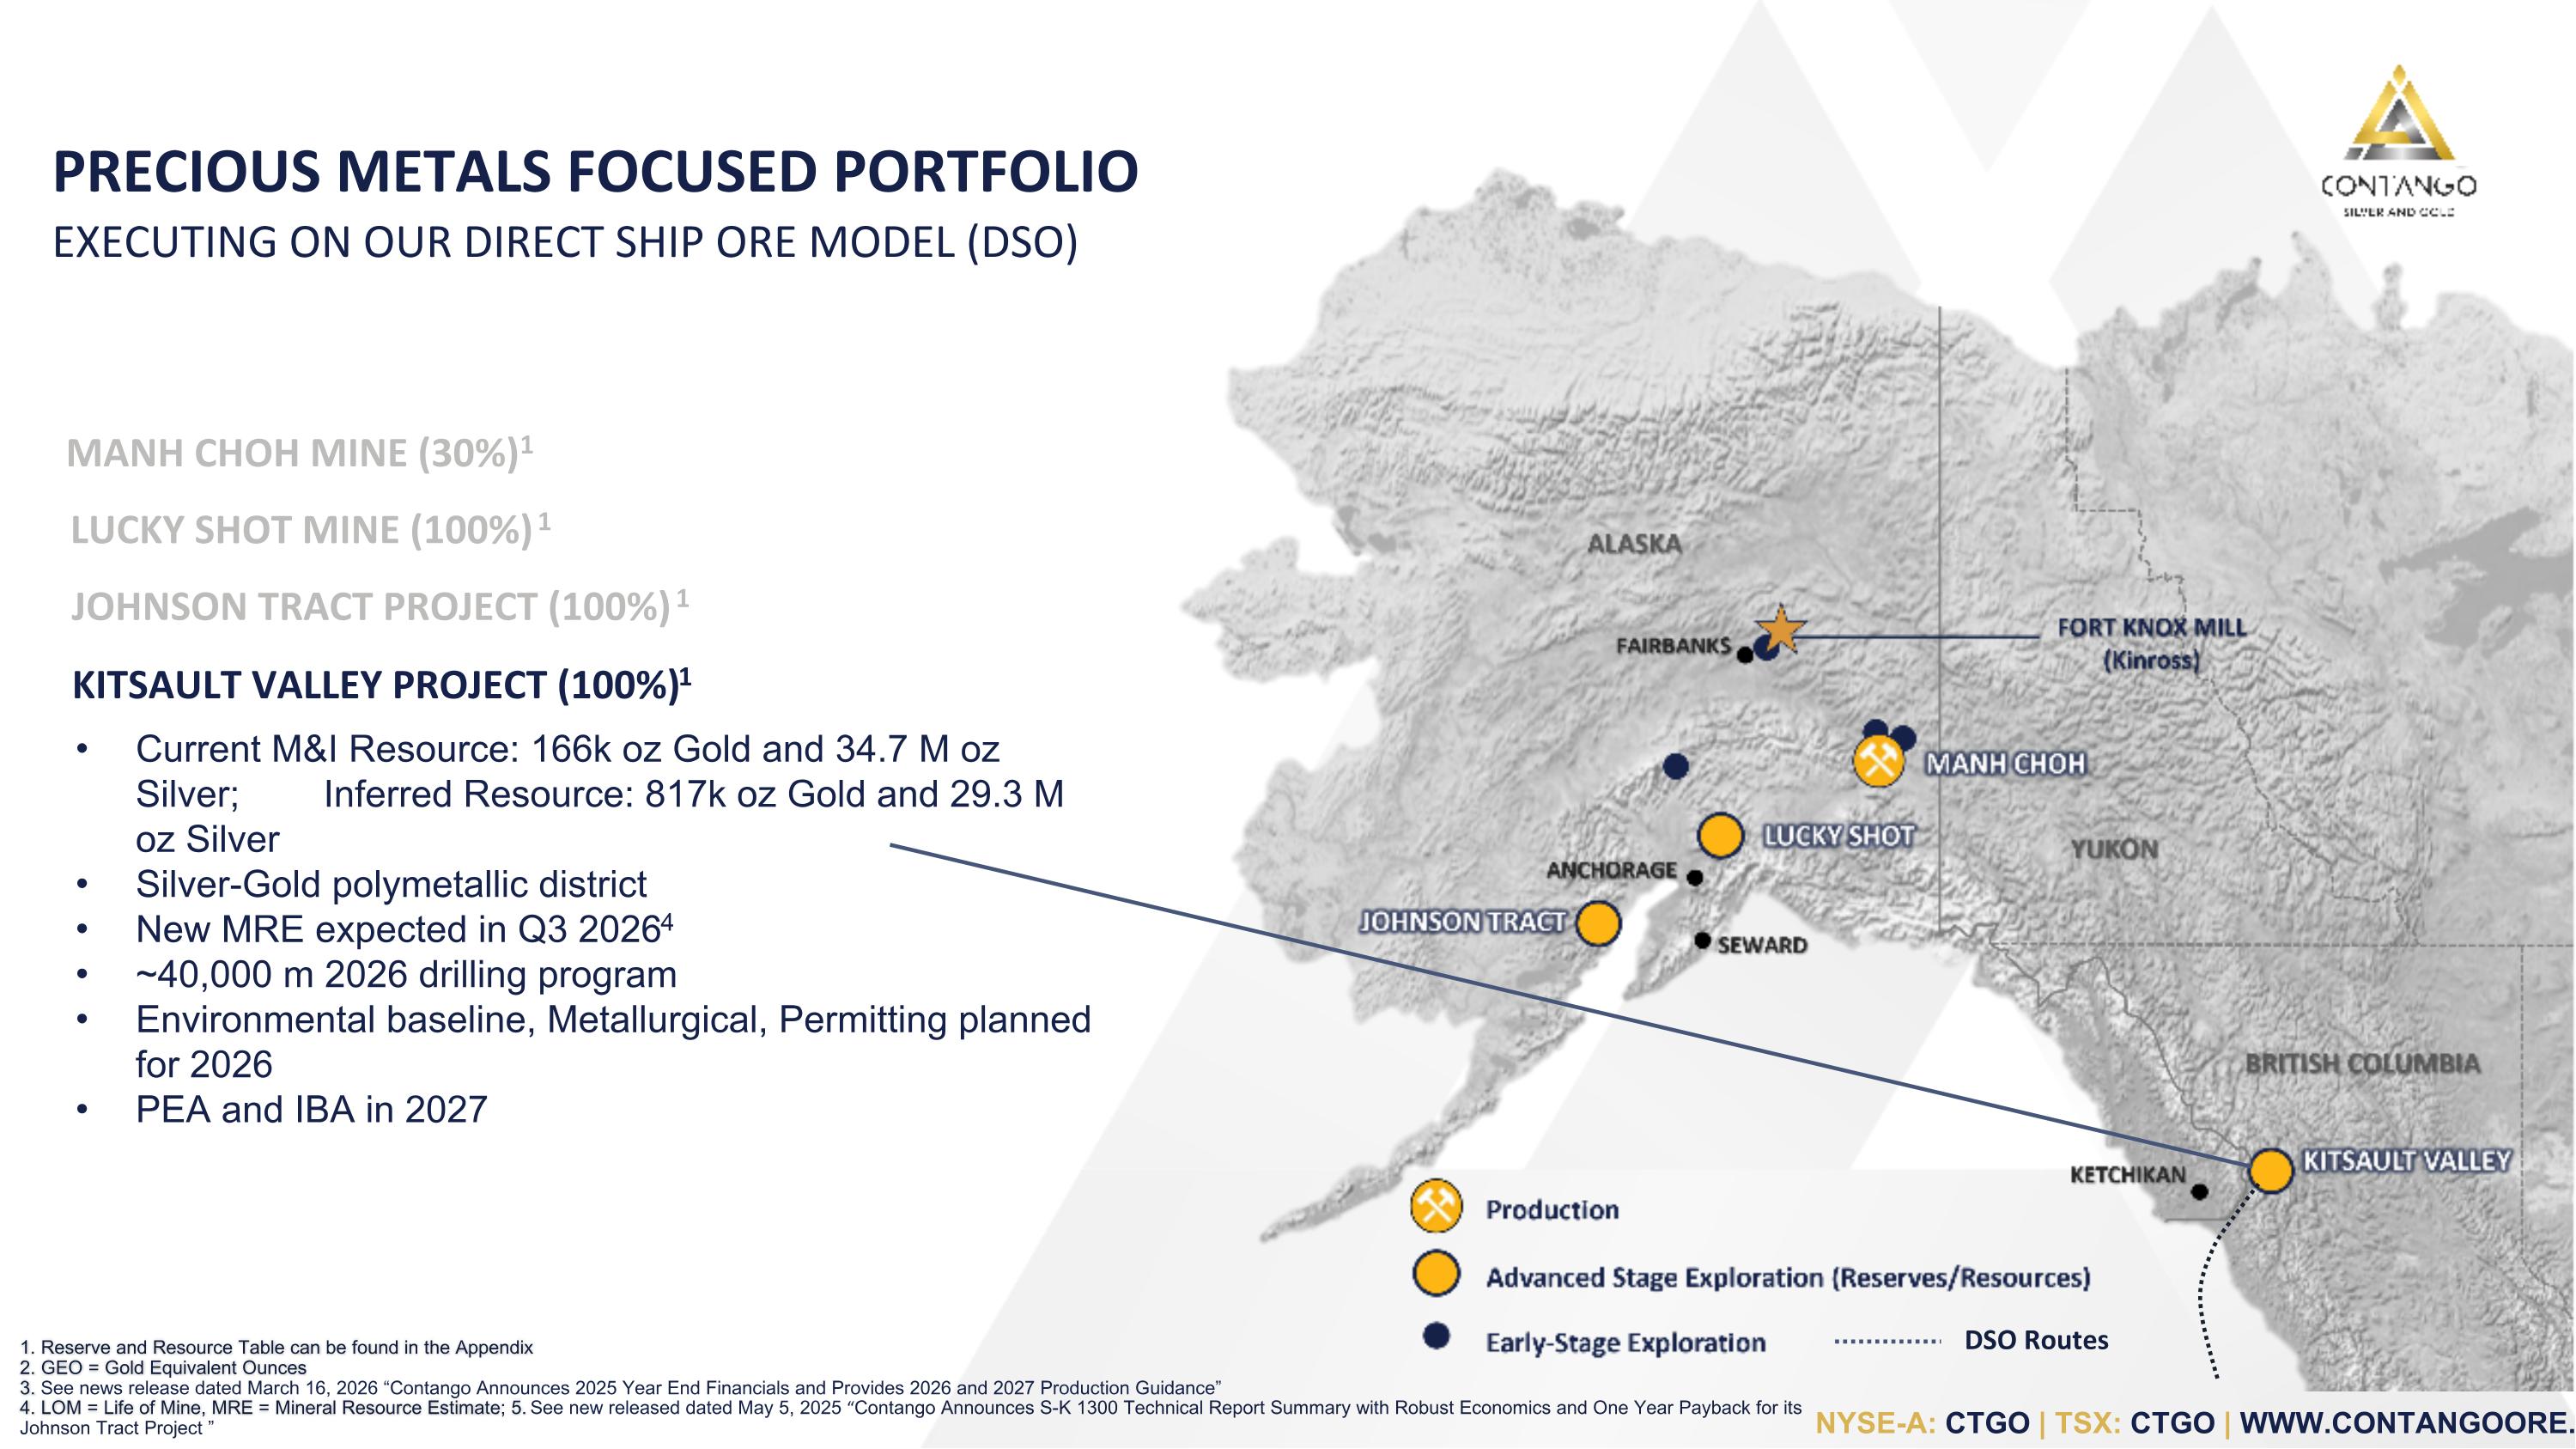
FORT KNOX MILL (Kinross) 1. Reserve and Resource Table can be found in the Appendix 2. GEO = Gold Equivalent Ounces 3. See news release dated March 16, 2026 “Contango Announces 2025 Year End Financials and Provides 2026 and 2027 Production Guidance” 4. LOM = Life of Mine, MRE = Mineral Resource Estimate; 5. See new released dated May 5, 2025 “Contango Announces S-K 1300 Technical Report Summary with Robust Economics and One Year Payback for its Johnson Tract Project ” MANH CHOH MINE (30%)1 LUCKY SHOT MINE (100%) 1 JOHNSON TRACT PROJECT (100%) 1 KITSAULT VALLEY PROJECT (100%) 1 Current M&I Resource: 166k oz Gold and 34.7 M oz Silver; Inferred Resource: 817k oz Gold and 29.3 M oz Silver Silver-Gold polymetallic district New MRE expected in Q3 20264 ~40,000 m 2026 drilling program Environmental baseline, Metallurgical, Permitting planned for 2026 PEA and IBA in 2027 PRECIOUS METALS FOCUSED PORTFOLIO EXECUTING ON OUR DIRECT SHIP ORE MODEL (DSO) DSO Routes
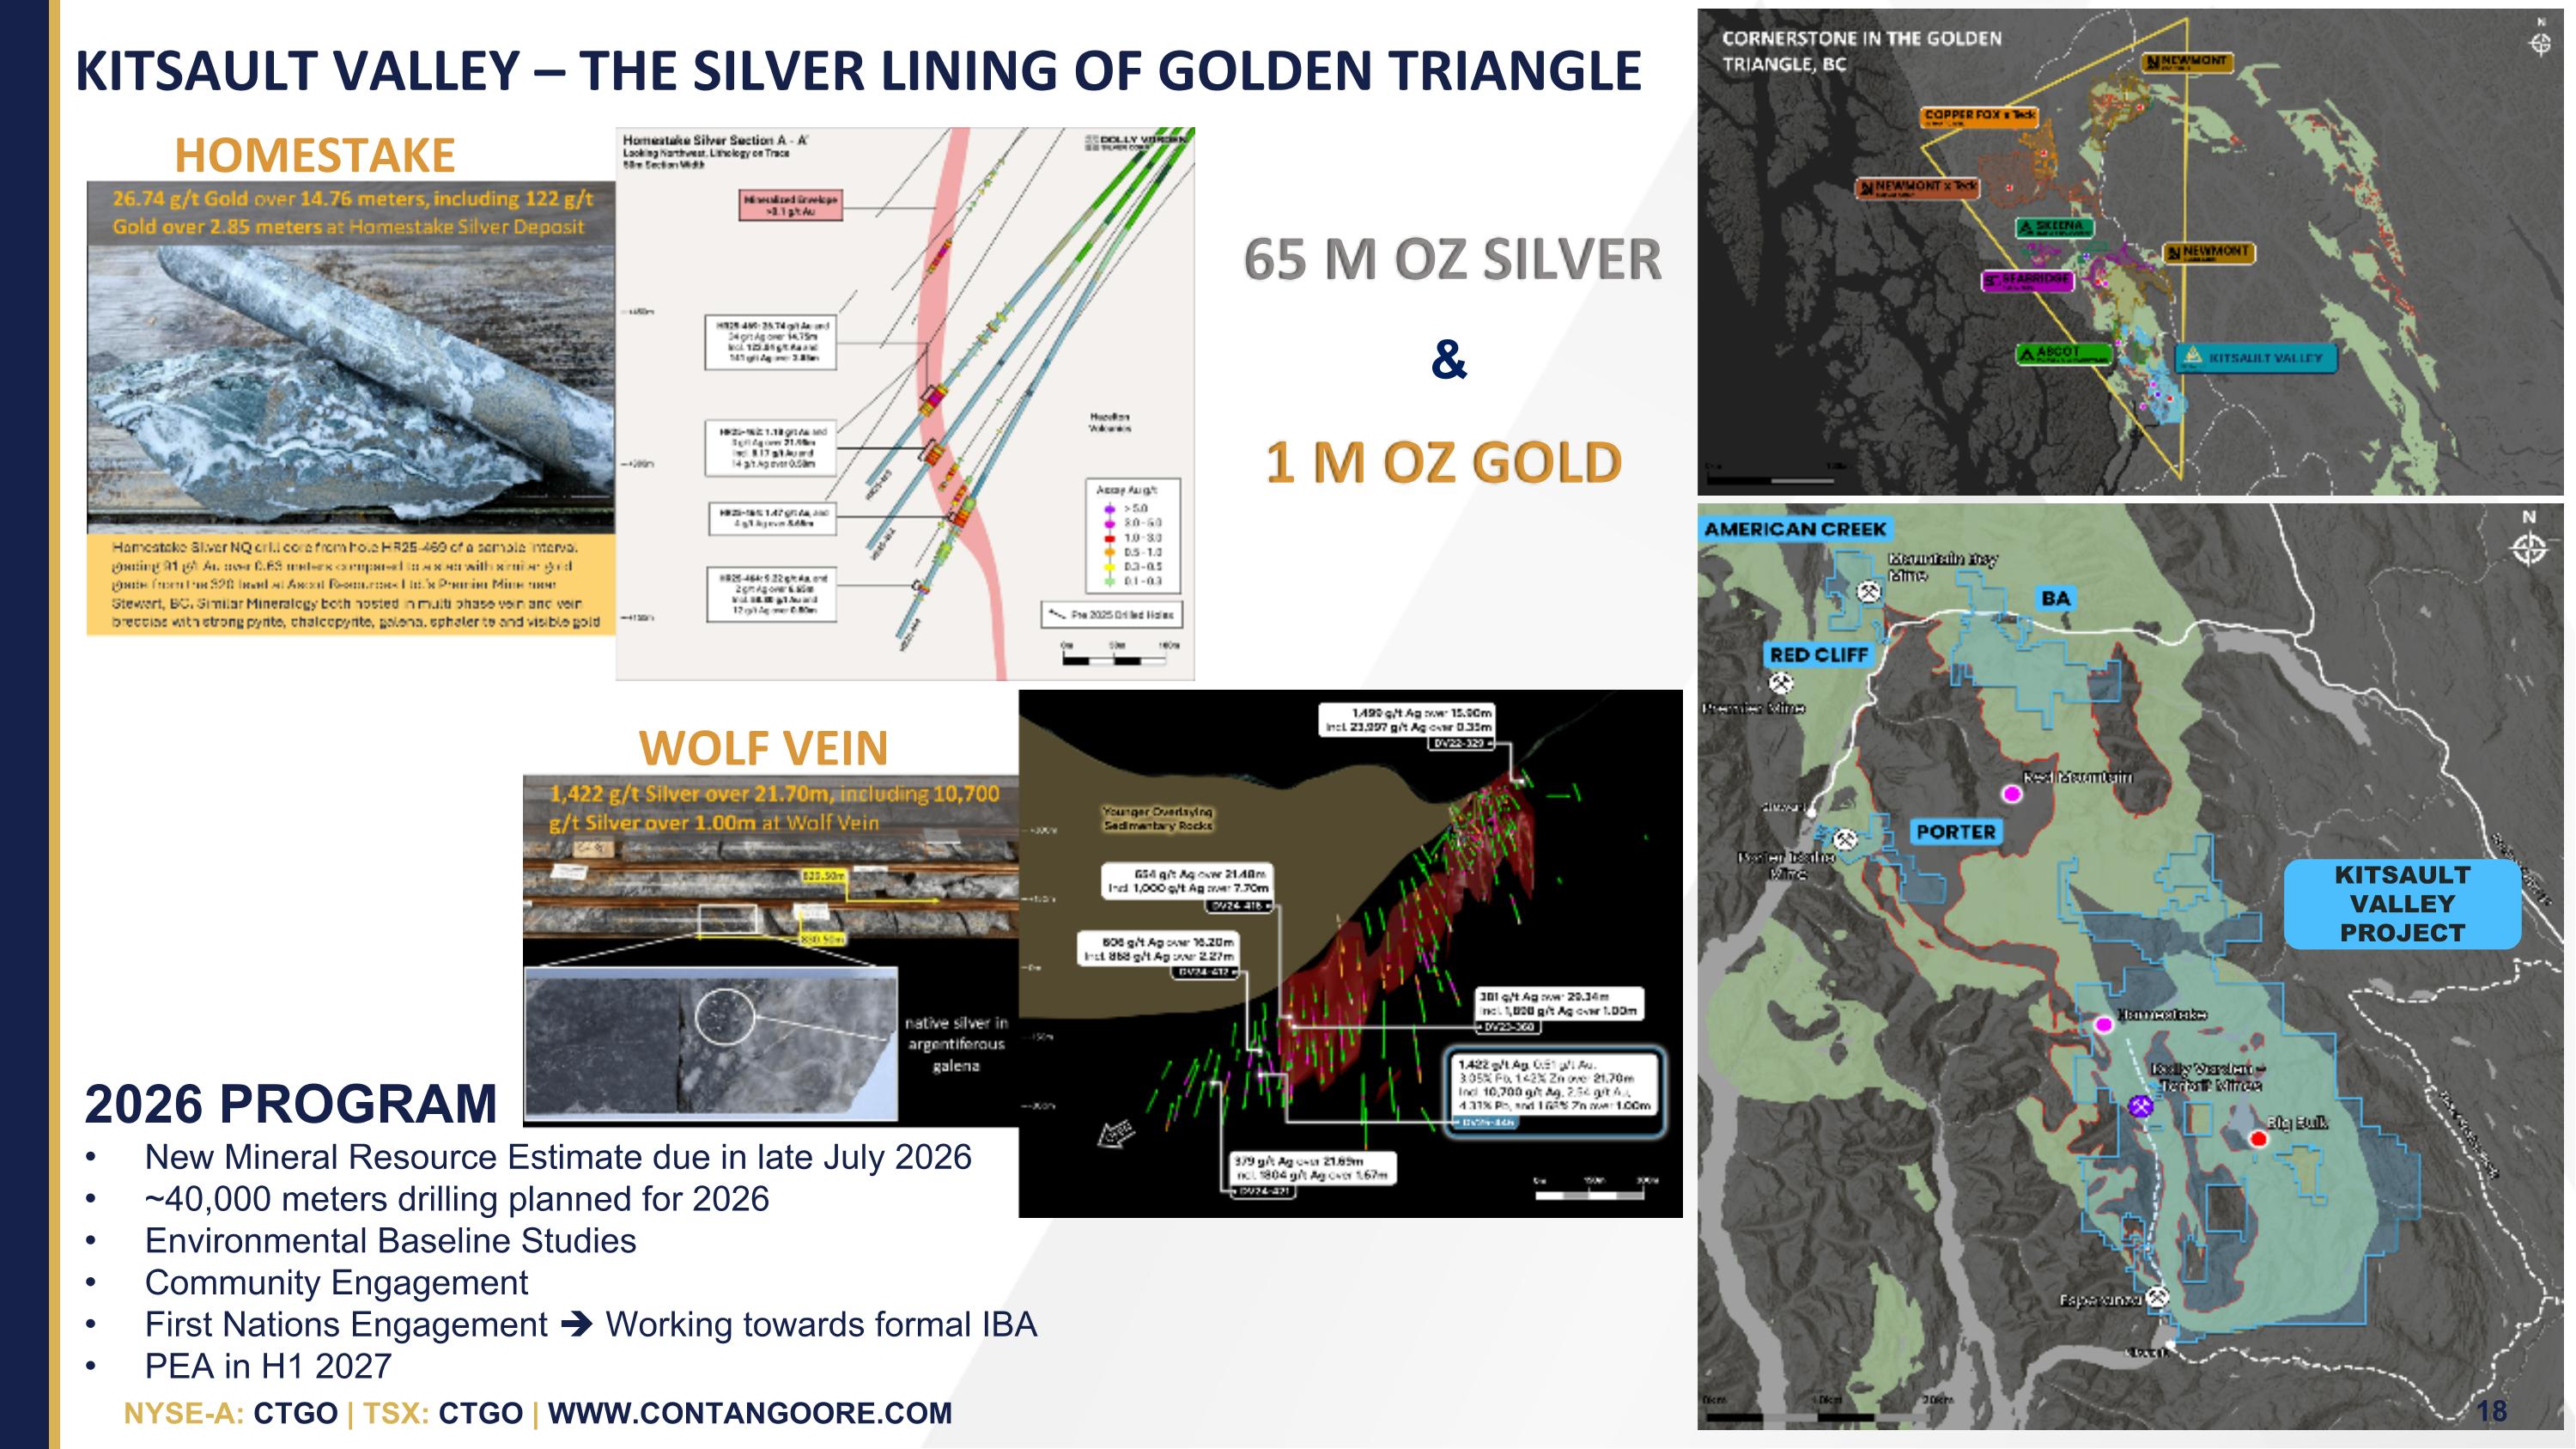
KITSAULT VALLEY PROJECT KITSAULT VALLEY – THE SILVER LINING OF GOLDEN TRIANGLE 18 WOLF VEIN HOMESTAKE 2026 PROGRAM New Mineral Resource Estimate due in late July 2026 ~40,000 meters drilling planned for 2026 Environmental Baseline Studies Community Engagement First Nations Engagement Working towards formal IBA PEA in H1 2027 65 M OZ SILVER & 1 M OZ GOLD
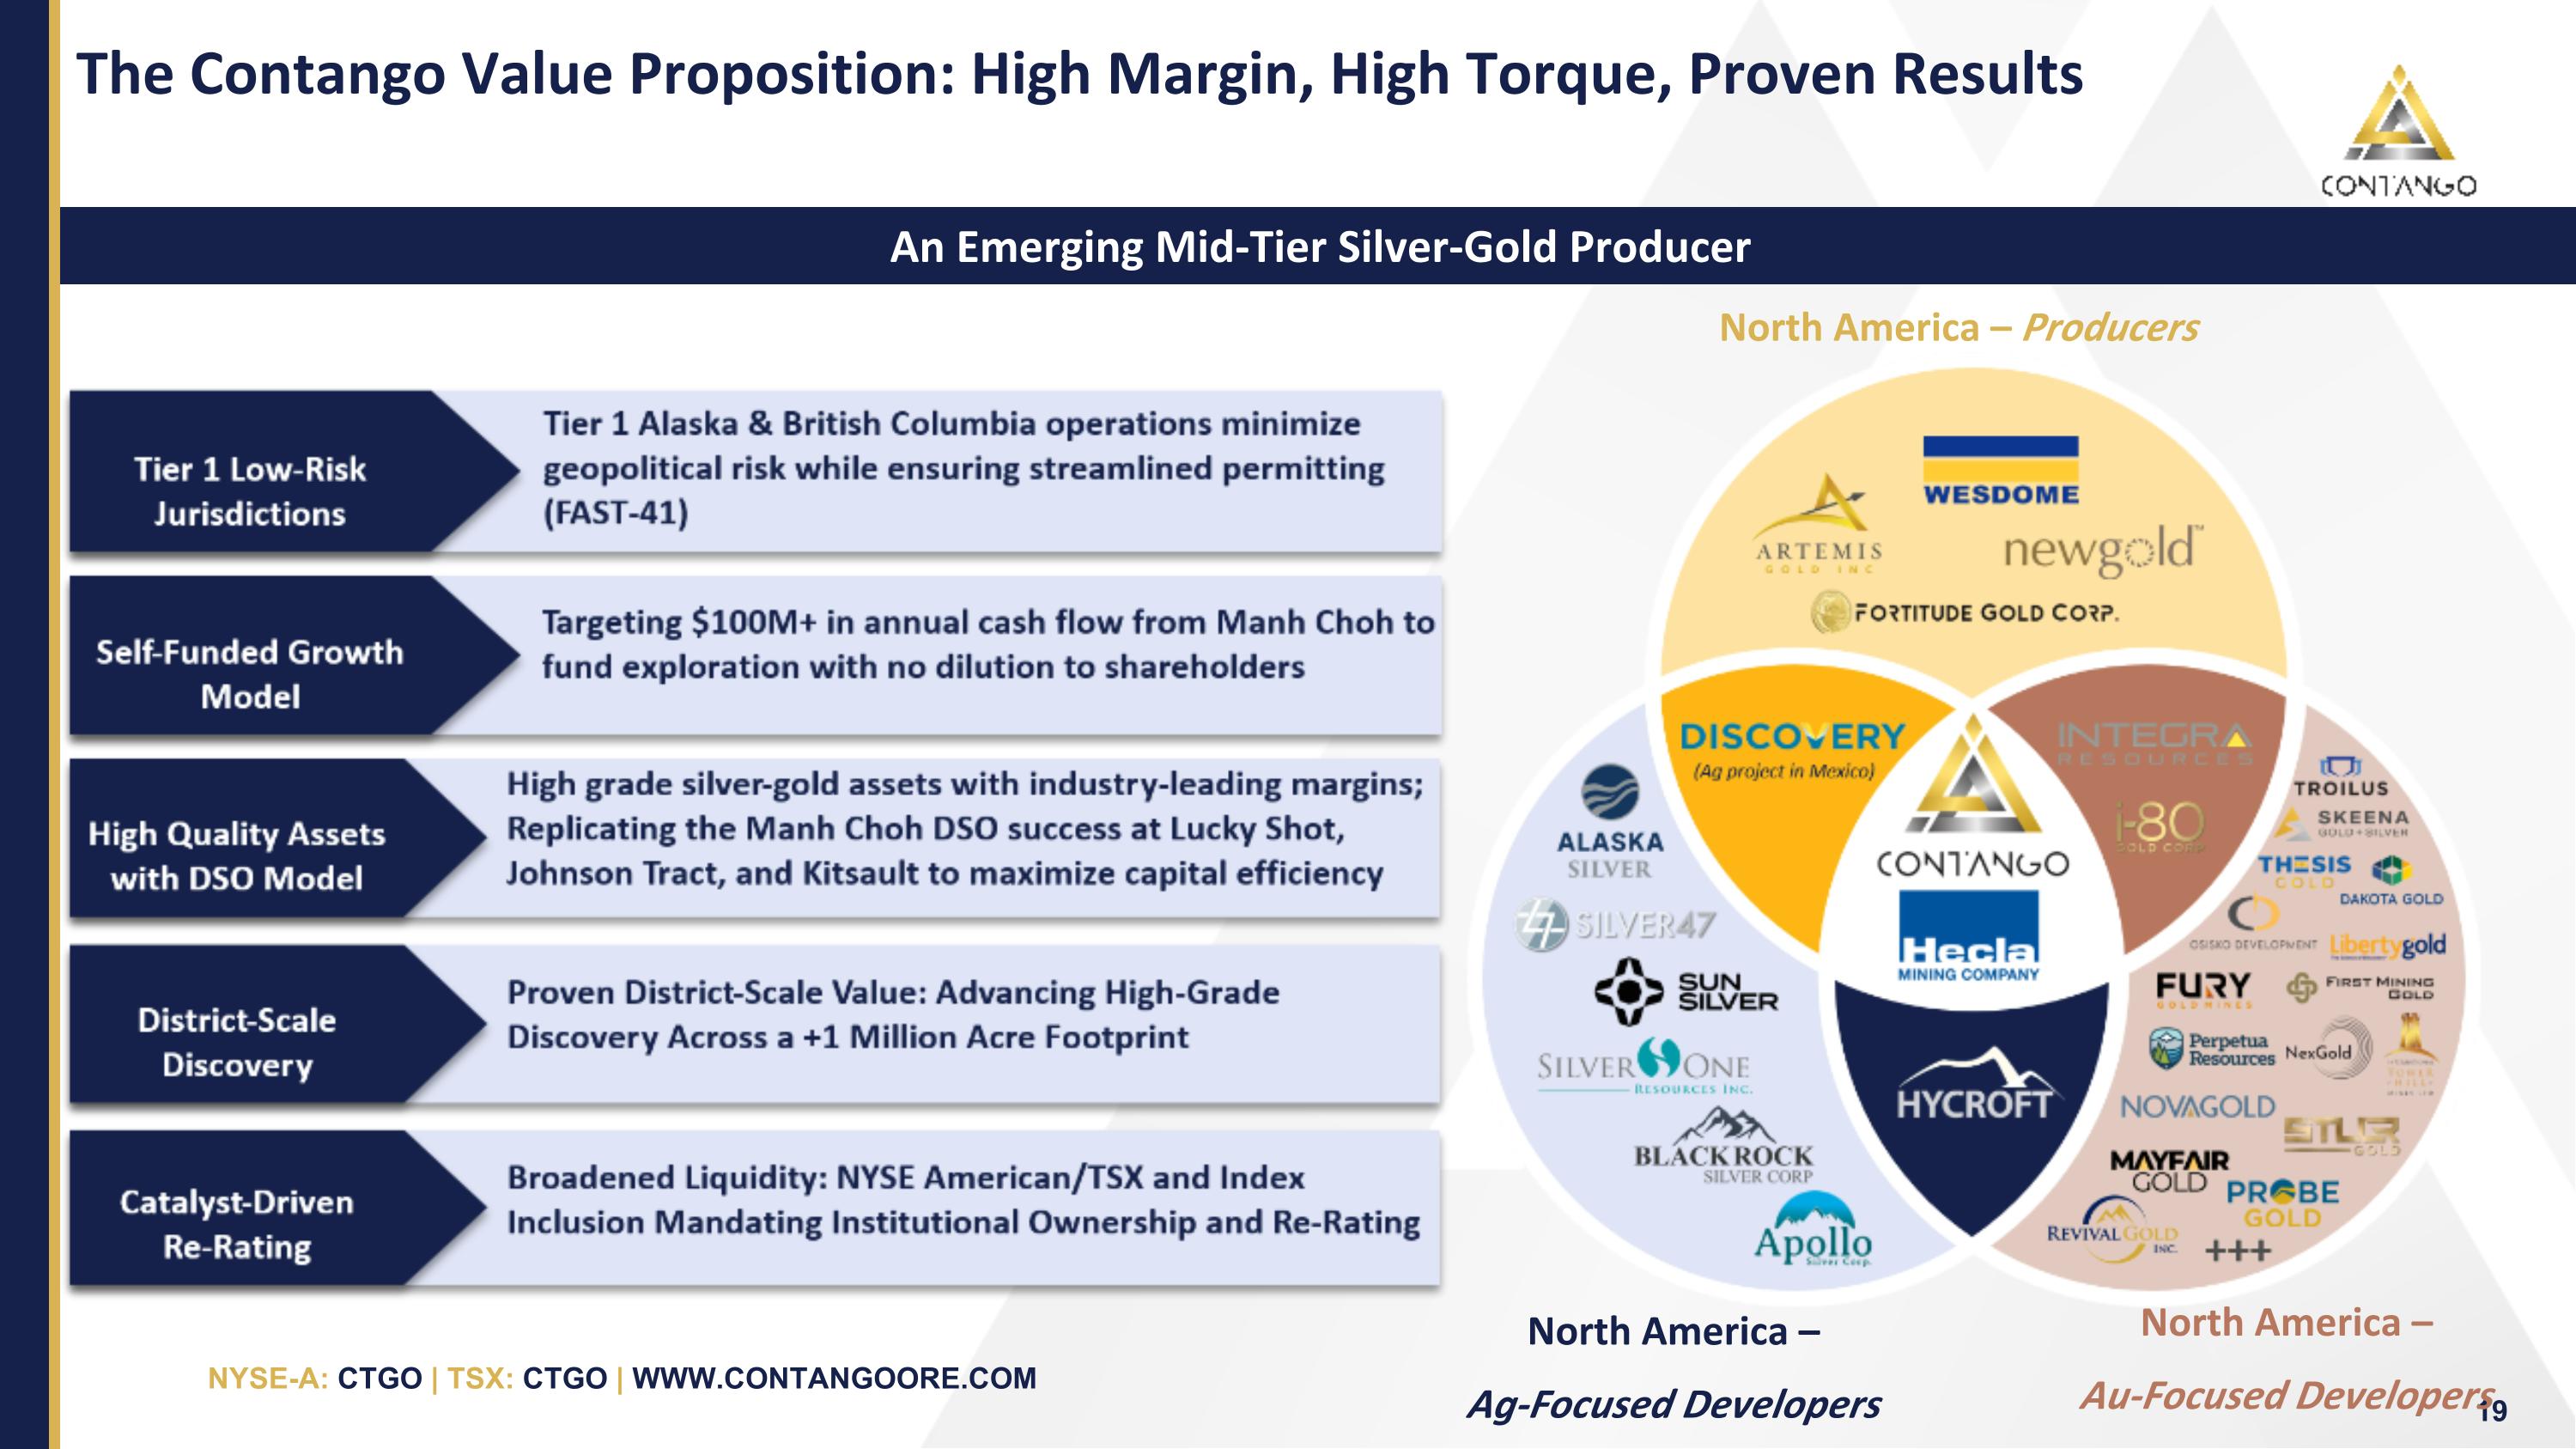
The Contango Value Proposition: High Margin, High Torque, Proven Results An Emerging Mid-Tier Silver-Gold Producer 19 North America – Ag-Focused Developers North America – Producers North America – Au-Focused Developers

20 info@contangoore.com +1-907-388-7770 www.contangoore.com Twitter: @orecontango LinkedIn: Contango ORE Instagram: ContangoORE Facebook: Contango ORE CORPORATE INQUIRIES NYSE-A / TSX: CTGO
NON-GAAP RECONCILIATION DISCLAIMER This presentation contains forward looking estimates of all-in sustaining cost (“AISC”), resources, free cash flow and EBITDA, which are financial measures not determined in accordance with United States generally accepted accounting principles (“GAAP”). We cannot provide a reconciliation of estimated AISC, resources and EBITDA to estimated costs of goods sold, assets and net income, which are the GAAP financial measures most directly comparable to such non-GAAP measures, without unreasonable efforts due to the inherent difficulty and impracticality of quantifying certain amounts that would be required to calculate projected AISC, resources and EBITDA. In addition, the estimates of AISC, resources and EBITDA have been prepared by Kinross and are based on IFRS accounting standards and detailed information that the Company does not have access to at this time. These amounts that would require unreasonable effort to quantify could be significant, such that the amount of projected GAAP cost of goods sold, assets and net income would vary substantially from the amount of projected AISC, resources and EBITDA. 21
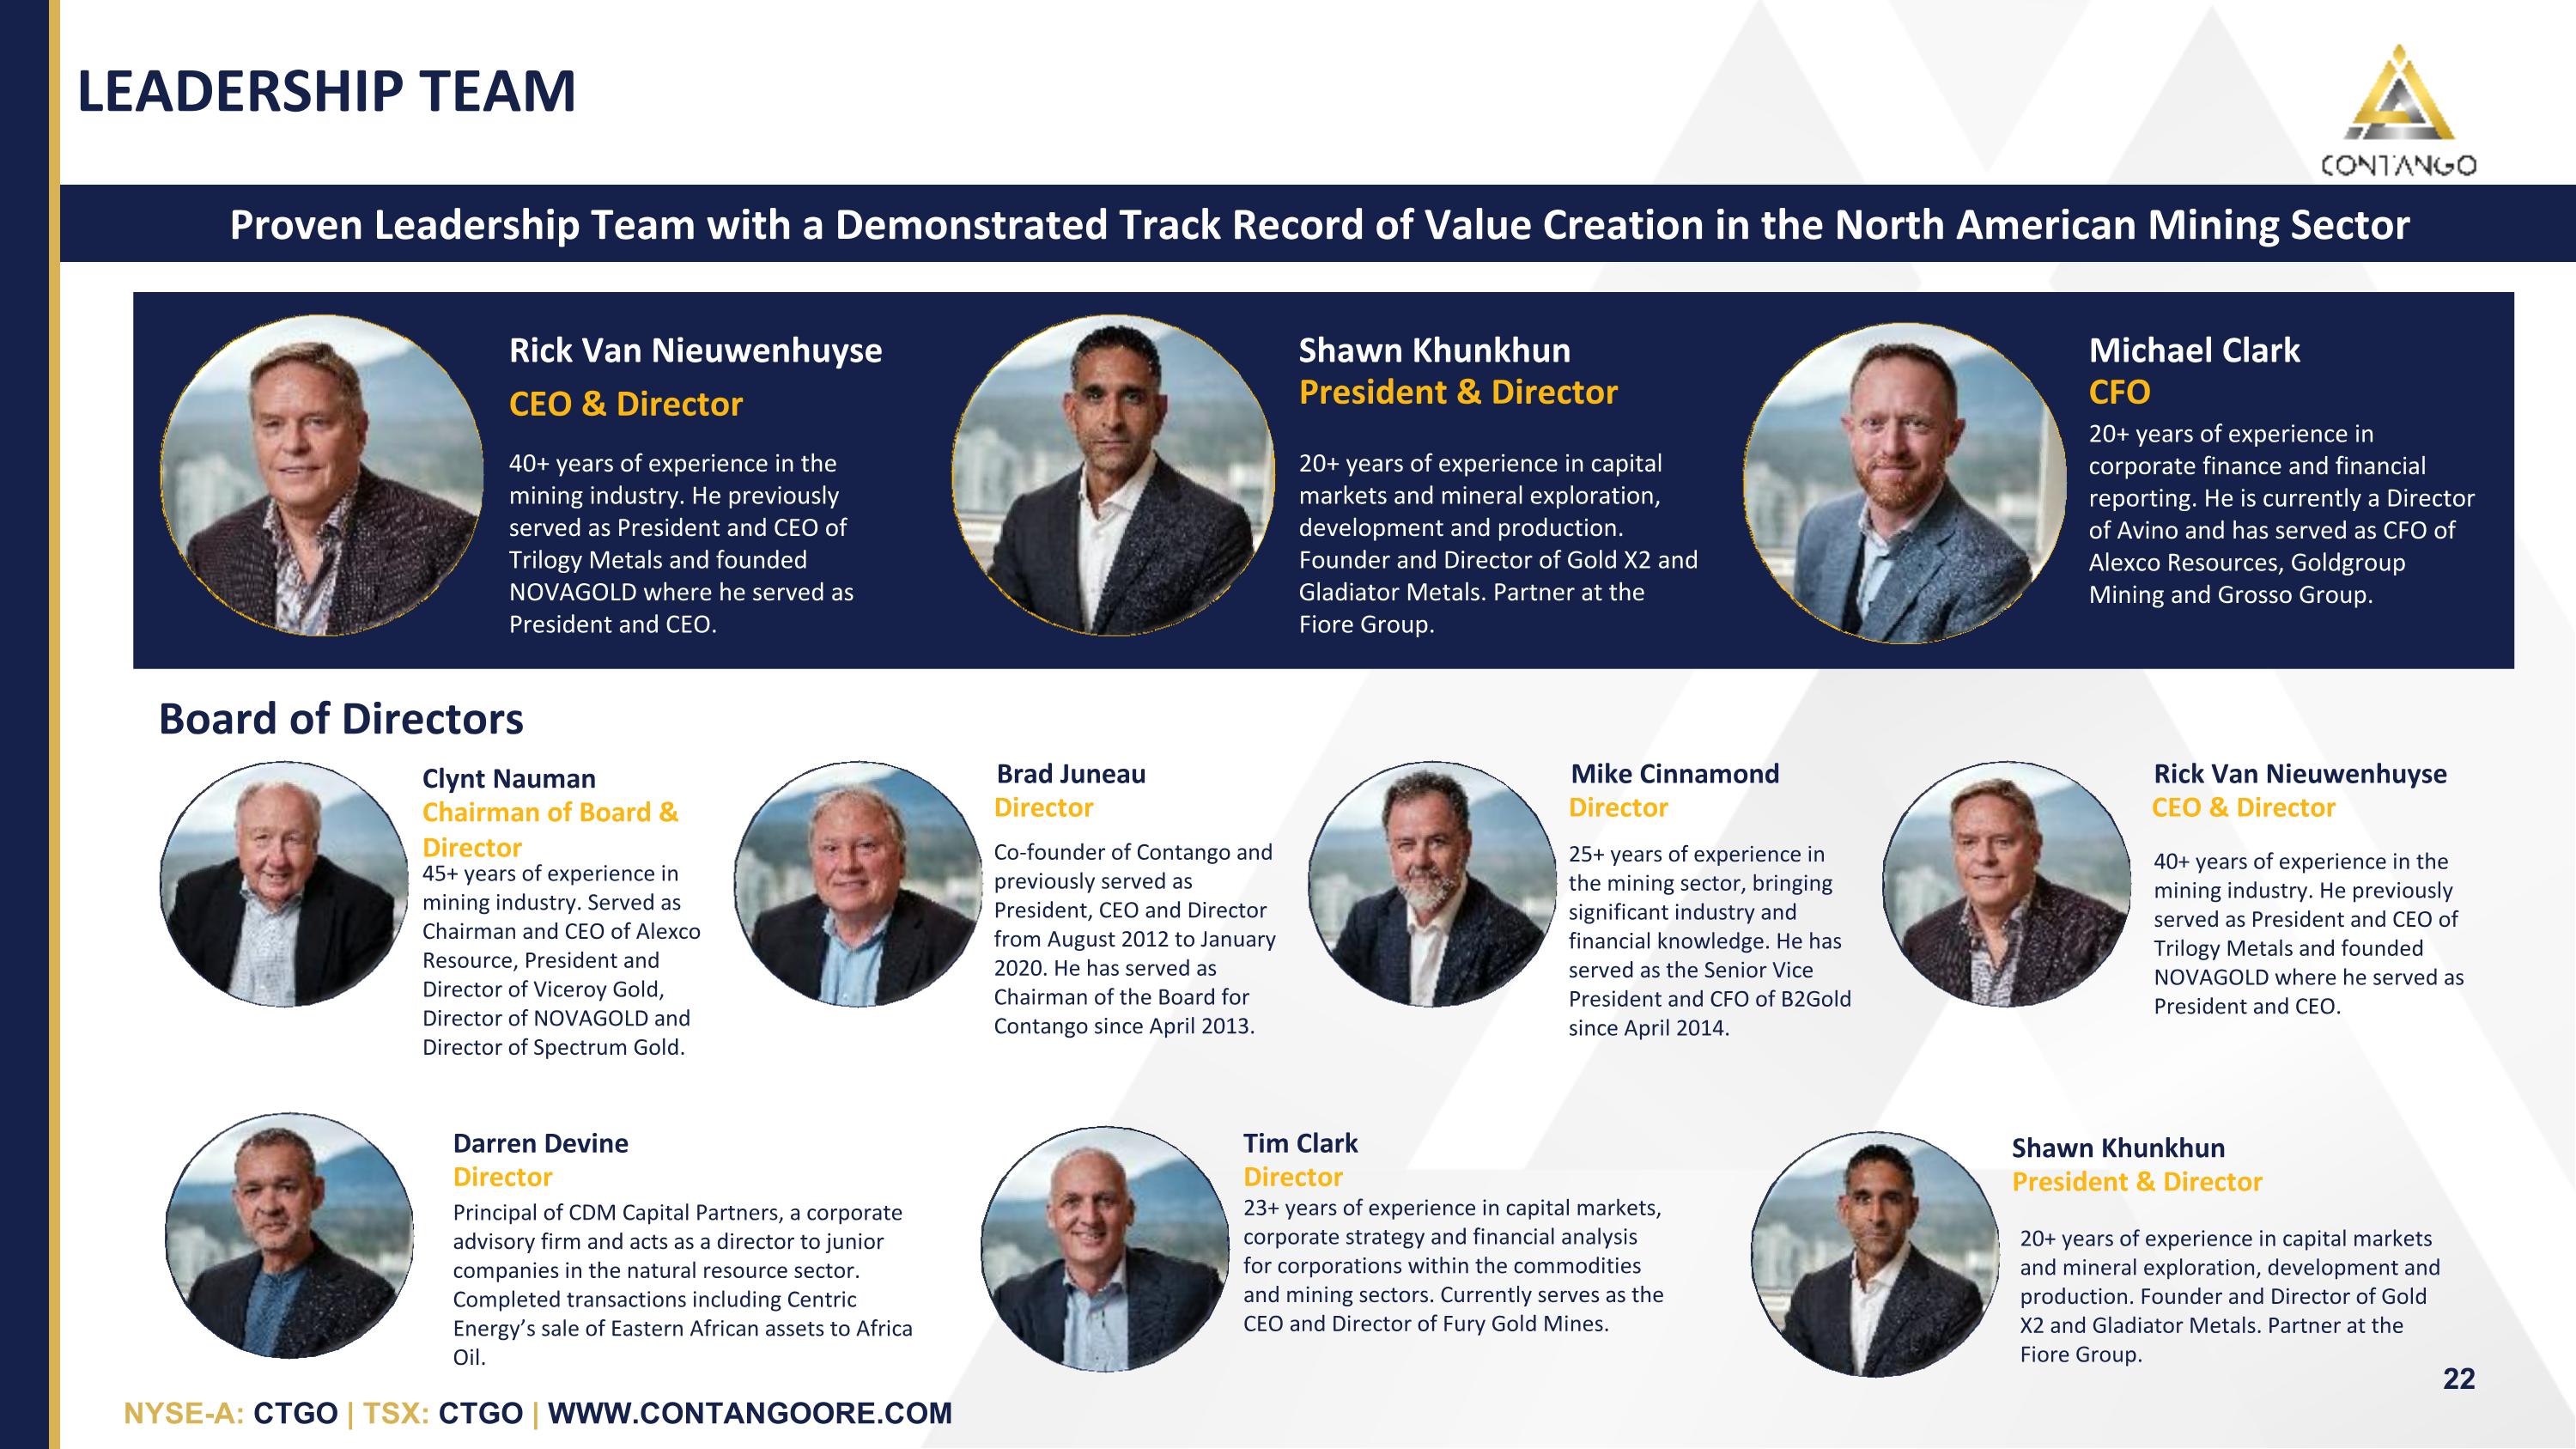
LEADERSHIP TEAM Rick Van Nieuwenhuyse CEO & Director 40+ years of experience in the mining industry. He previously served as President and CEO of Trilogy Metals and founded NOVAGOLD where he served as President and CEO. Shawn Khunkhun President & Director 20+ years of experience in capital markets and mineral exploration, development and production. Founder and Director of Gold X2 and Gladiator Metals. Partner at the Fiore Group. Clynt Nauman Chairman of Board & Director 45+ years of experience in mining industry. Served as Chairman and CEO of Alexco Resource, President and Director of Viceroy Gold, Director of NOVAGOLD and Director of Spectrum Gold. Board of Directors Michael Clark CFO 20+ years of experience in corporate finance and financial reporting. He is currently a Director of Avino and has served as CFO of Alexco Resources, Goldgroup Mining and Grosso Group. Darren Devine Director Principal of CDM Capital Partners, a corporate advisory firm and acts as a director to junior companies in the natural resource sector. Completed transactions including Centric Energy’s sale of Eastern African assets to Africa Oil. Tim Clark Director 23+ years of experience in capital markets, corporate strategy and financial analysis for corporations within the commodities and mining sectors. Currently serves as the CEO and Director of Fury Gold Mines. Brad Juneau Director Co-founder of Contango and previously served as President, CEO and Director from August 2012 to January 2020. He has served as Chairman of the Board for Contango since April 2013. Mike Cinnamond Director 25+ years of experience in the mining sector, bringing significant industry and financial knowledge. He has served as the Senior Vice President and CFO of B2Gold since April 2014. 40+ years of experience in the mining industry. He previously served as President and CEO of Trilogy Metals and founded NOVAGOLD where he served as President and CEO. Shawn Khunkhun President & Director 20+ years of experience in capital markets and mineral exploration, development and production. Founder and Director of Gold X2 and Gladiator Metals. Partner at the Fiore Group. Proven Leadership Team with a Demonstrated Track Record of Value Creation in the North American Mining Sector Rick Van Nieuwenhuyse CEO & Director
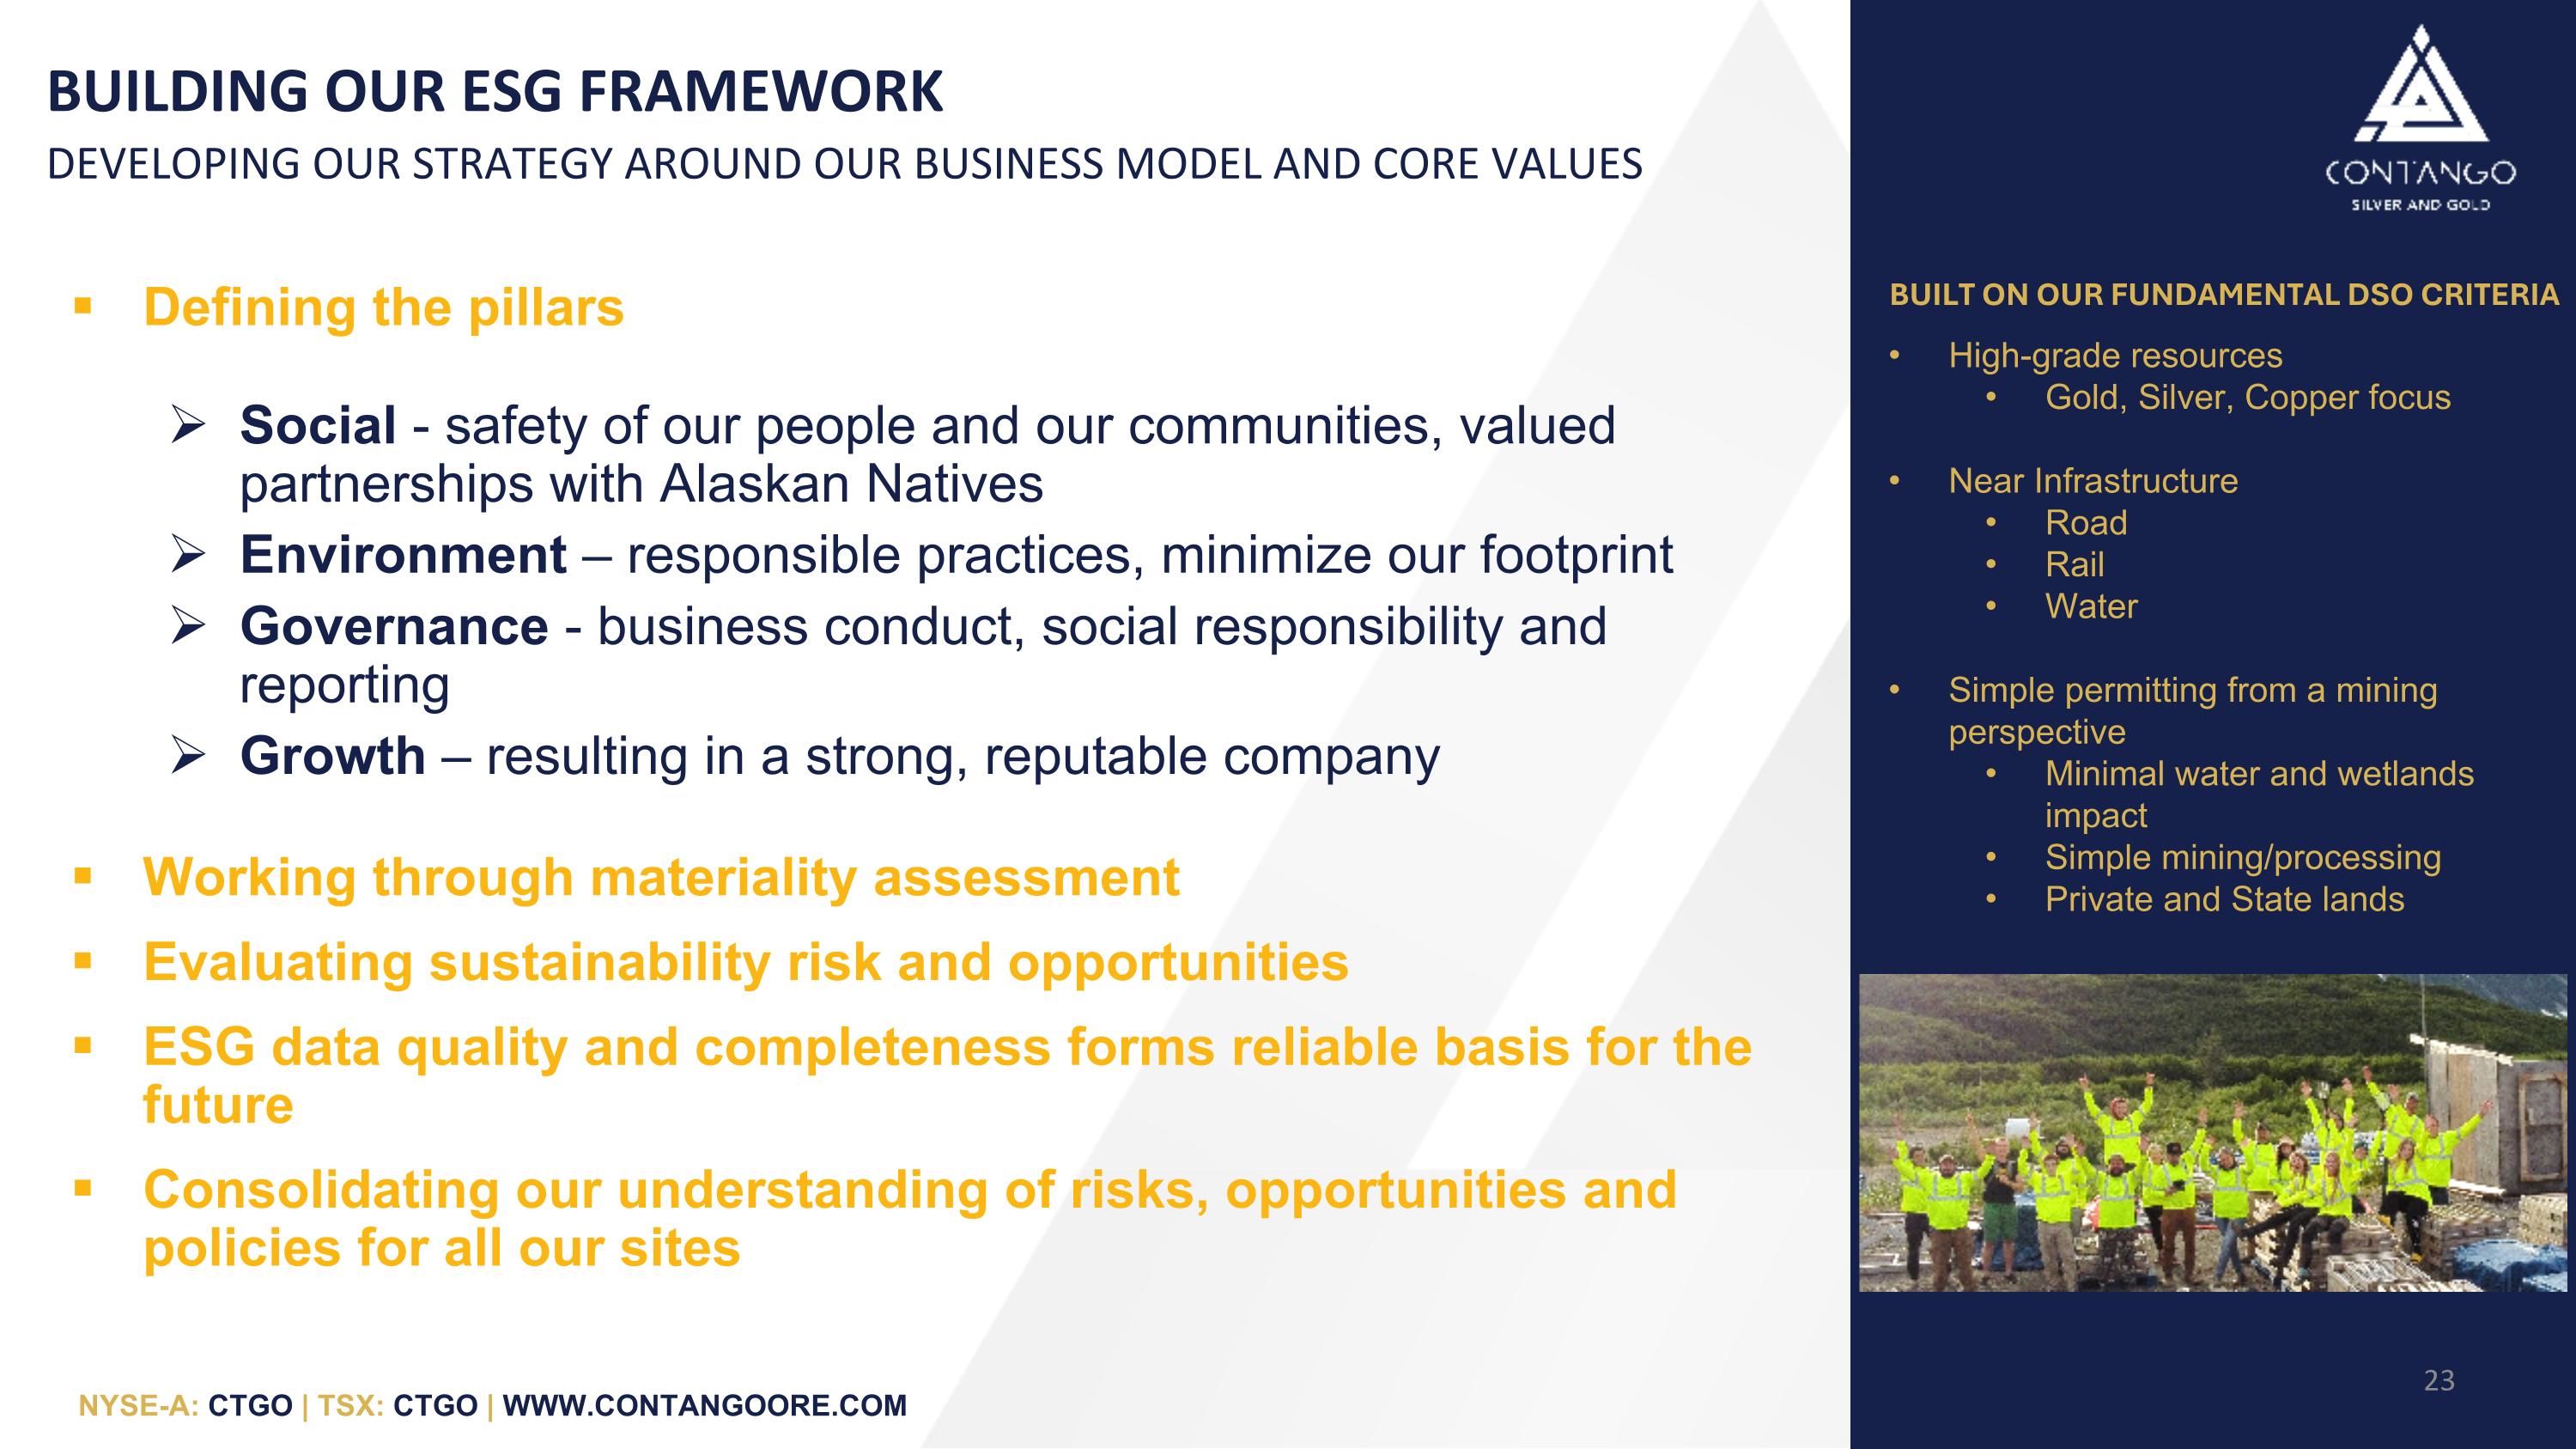
BUILDING OUR ESG FRAMEWORK DEVELOPING OUR STRATEGY AROUND OUR BUSINESS MODEL AND CORE VALUES BUILT ON OUR FUNDAMENTAL DSO CRITERIA High-grade resources Gold, Silver, Copper focus Near Infrastructure Road Rail Water Simple permitting from a mining perspective Minimal water and wetlands impact Simple mining/processing Private and State lands Defining the pillars Social - safety of our people and our communities, valued partnerships with Alaskan Natives Environment – responsible practices, minimize our footprint Governance - business conduct, social responsibility and reporting Growth – resulting in a strong, reputable company Working through materiality assessment Evaluating sustainability risk and opportunities ESG data quality and completeness forms reliable basis for the future Consolidating our understanding of risks, opportunities and policies for all our sites
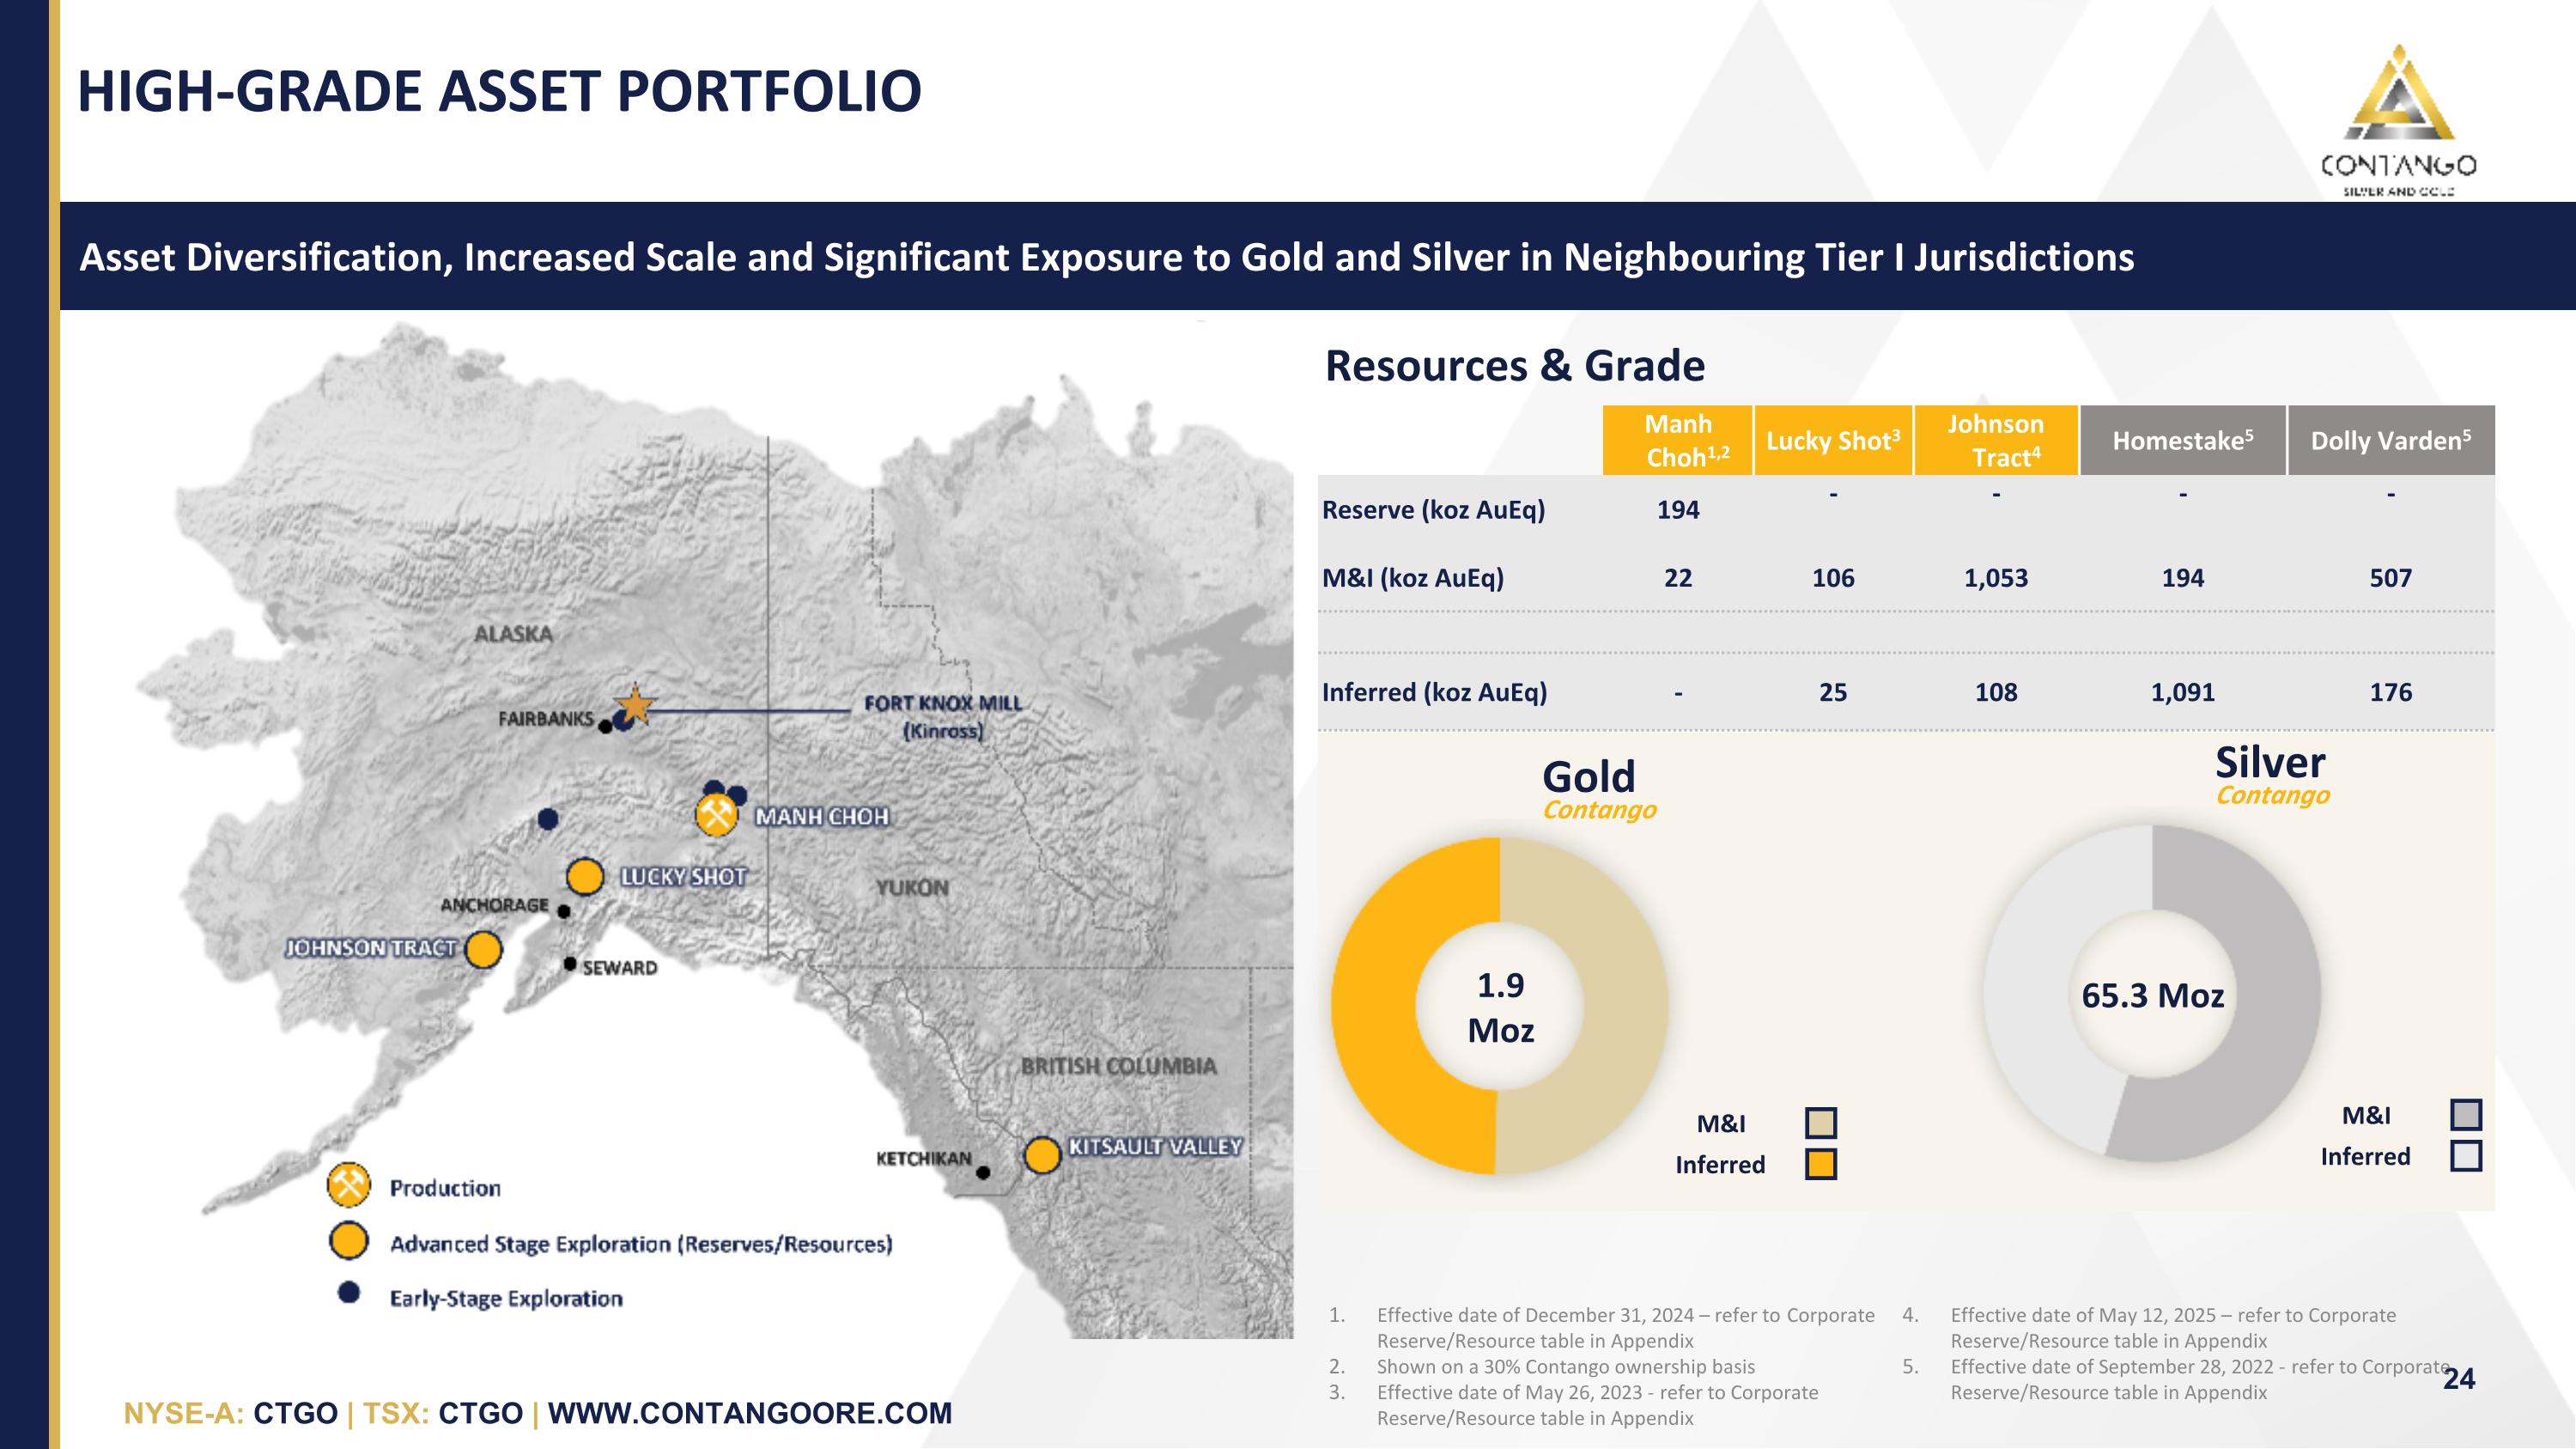
Gold Contango Resources & Grade Asset Diversification, Increased Scale and Significant Exposure to Gold and Silver in Neighbouring Tier I Jurisdictions M&I Inferred HIGH-GRADE ASSET PORTFOLIO M&I Inferred Silver Contango 1.9 Moz 65.3 Moz Effective date of December 31, 2024 – refer to Corporate Reserve/Resource table in Appendix Shown on a 30% Contango ownership basis Effective date of May 26, 2023 - refer to Corporate Reserve/Resource table in Appendix Effective date of May 12, 2025 – refer to Corporate Reserve/Resource table in Appendix Effective date of September 28, 2022 - refer to Corporate Reserve/Resource table in Appendix Manh Choh1,2 Lucky Shot3 Johnson Tract4 Homestake5 Dolly Varden5 Reserve (koz AuEq) 194 - - - - M&I (koz AuEq) 22 106 1,053 194 507 Inferred (koz AuEq) - 25 108 1,091 176
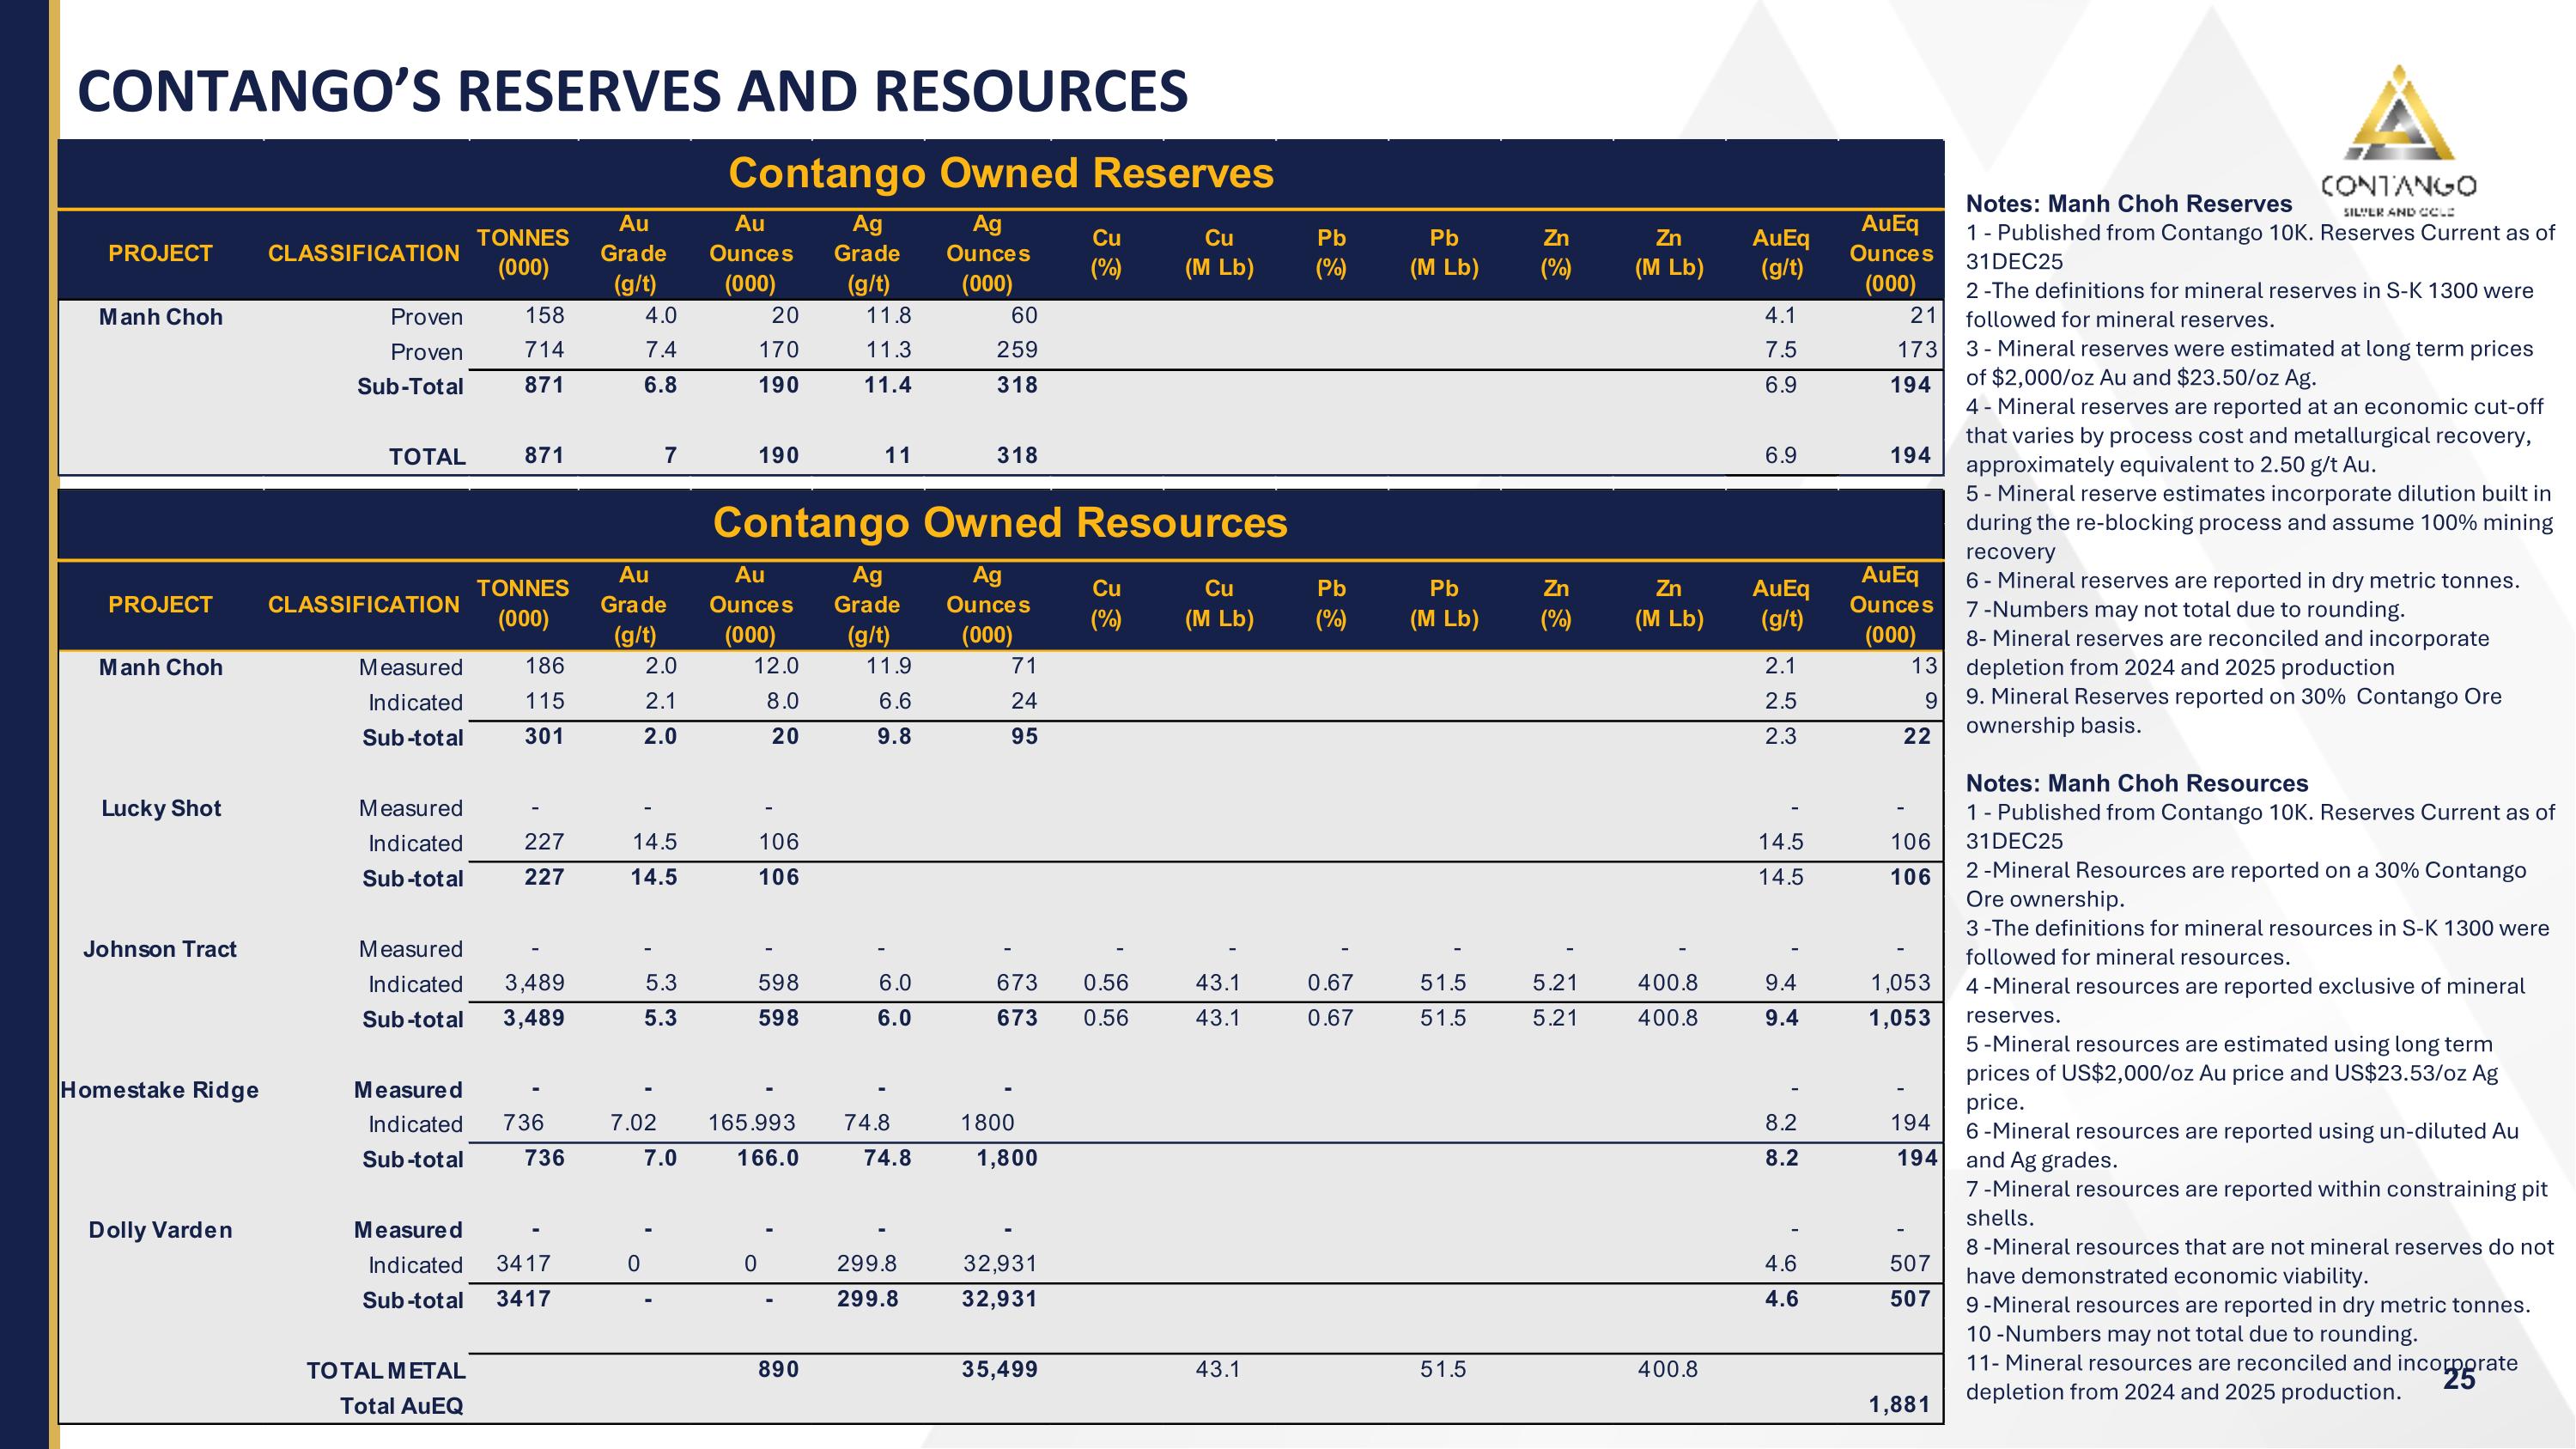
CONTANGO’S RESERVES AND RESOURCES CONTINUED ON NEXT PAGE Notes: Manh Choh Reserves 1 - Published from Contango 10K. Reserves Current as of 31DEC25 2 -The definitions for mineral reserves in S-K 1300 were followed for mineral reserves. 3 - Mineral reserves were estimated at long term prices of $2,000/oz Au and $23.50/oz Ag. 4 - Mineral reserves are reported at an economic cut-off that varies by process cost and metallurgical recovery, approximately equivalent to 2.50 g/t Au. 5 - Mineral reserve estimates incorporate dilution built in during the re-blocking process and assume 100% mining recovery 6 - Mineral reserves are reported in dry metric tonnes. 7 -Numbers may not total due to rounding. 8- Mineral reserves are reconciled and incorporate depletion from 2024 and 2025 production 9. Mineral Reserves reported on 30% Contango Ore ownership basis. Notes: Manh Choh Resources 1 - Published from Contango 10K. Reserves Current as of 31DEC25 2 -Mineral Resources are reported on a 30% Contango Ore ownership. 3 -The definitions for mineral resources in S-K 1300 were followed for mineral resources. 4 -Mineral resources are reported exclusive of mineral reserves. 5 -Mineral resources are estimated using long term prices of US$2,000/oz Au price and US$23.53/oz Ag price. 6 -Mineral resources are reported using un-diluted Au and Ag grades. 7 -Mineral resources are reported within constraining pit shells. 8 -Mineral resources that are not mineral reserves do not have demonstrated economic viability. 9 -Mineral resources are reported in dry metric tonnes. 10 -Numbers may not total due to rounding. 11- Mineral resources are reconciled and incorporate depletion from 2024 and 2025 production.
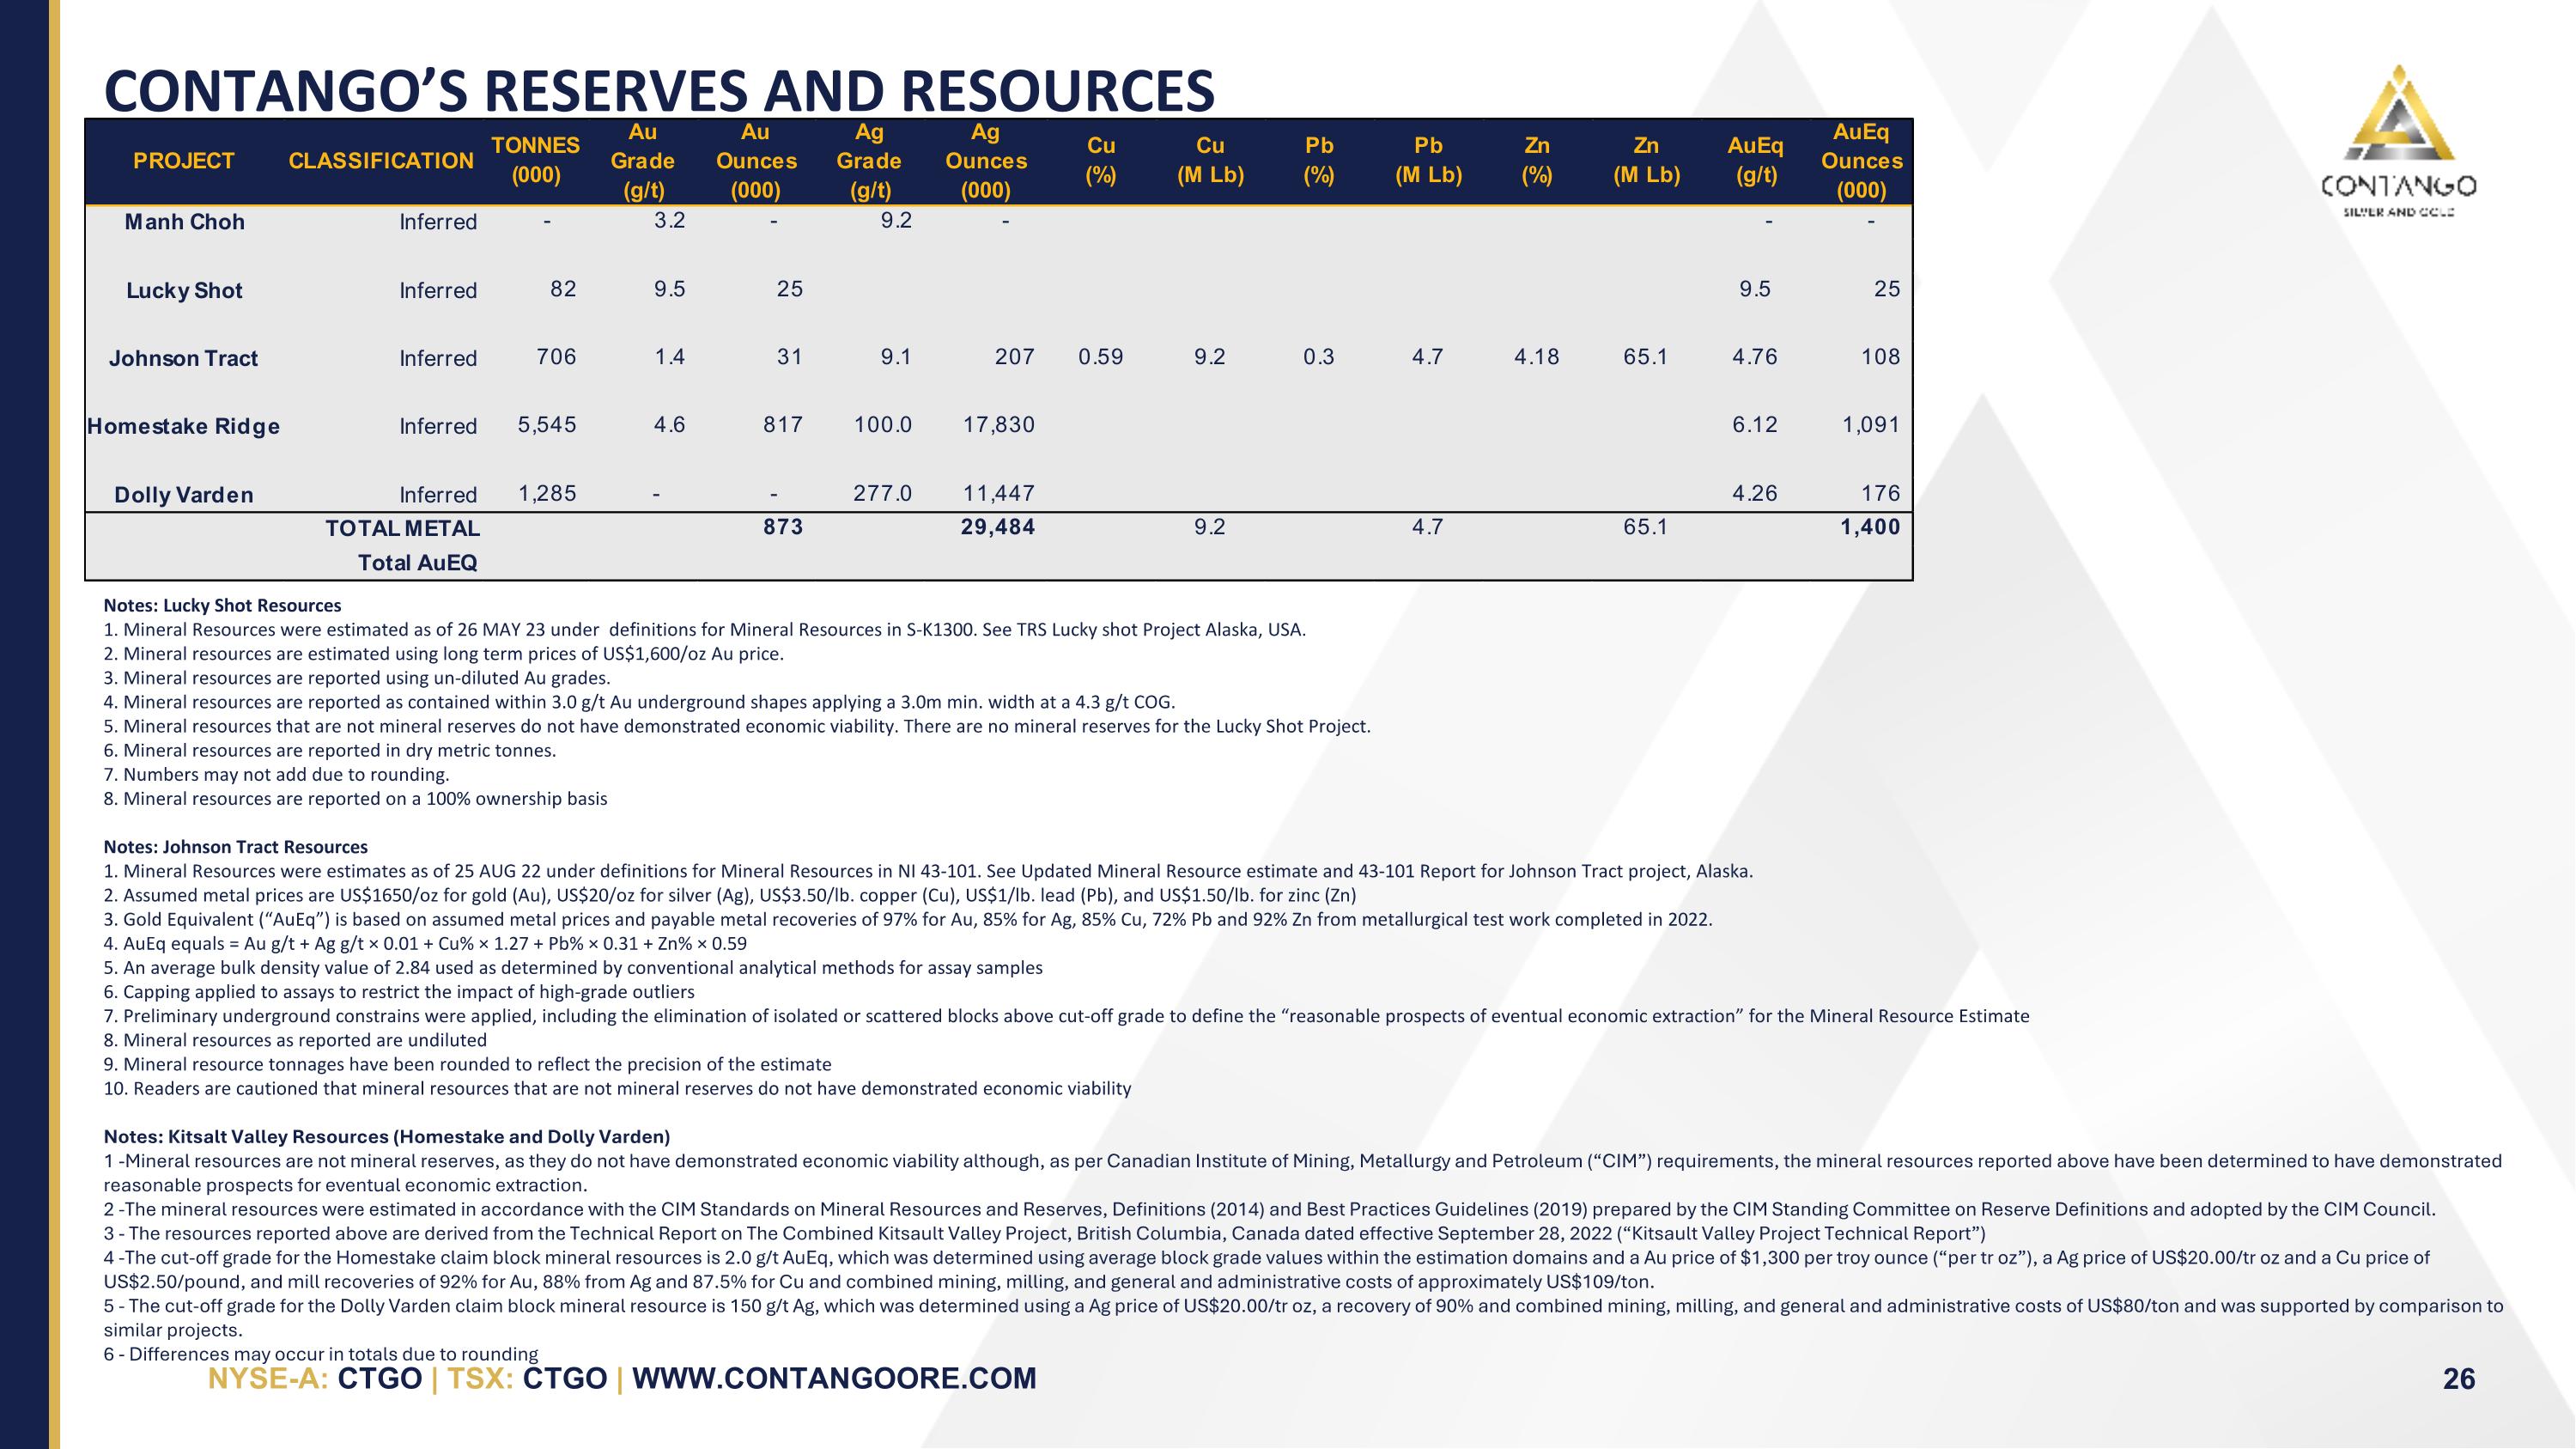
CONTANGO’S RESERVES AND RESOURCES Notes: Lucky Shot Resources 1. Mineral Resources were estimated as of 26 MAY 23 under definitions for Mineral Resources in S-K1300. See TRS Lucky shot Project Alaska, USA. 2. Mineral resources are estimated using long term prices of US$1,600/oz Au price. 3. Mineral resources are reported using un-diluted Au grades. 4. Mineral resources are reported as contained within 3.0 g/t Au underground shapes applying a 3.0m min. width at a 4.3 g/t COG. 5. Mineral resources that are not mineral reserves do not have demonstrated economic viability. There are no mineral reserves for the Lucky Shot Project. 6. Mineral resources are reported in dry metric tonnes. 7. Numbers may not add due to rounding. 8. Mineral resources are reported on a 100% ownership basis Notes: Johnson Tract Resources 1. Mineral Resources were estimates as of 25 AUG 22 under definitions for Mineral Resources in NI 43-101. See Updated Mineral Resource estimate and 43-101 Report for Johnson Tract project, Alaska. 2. Assumed metal prices are US$1650/oz for gold (Au), US$20/oz for silver (Ag), US$3.50/lb. copper (Cu), US$1/lb. lead (Pb), and US$1.50/lb. for zinc (Zn) 3. Gold Equivalent (“AuEq”) is based on assumed metal prices and payable metal recoveries of 97% for Au, 85% for Ag, 85% Cu, 72% Pb and 92% Zn from metallurgical test work completed in 2022. 4. AuEq equals = Au g/t + Ag g/t × 0.01 + Cu% × 1.27 + Pb% × 0.31 + Zn% × 0.59 5. An average bulk density value of 2.84 used as determined by conventional analytical methods for assay samples 6. Capping applied to assays to restrict the impact of high-grade outliers 7. Preliminary underground constrains were applied, including the elimination of isolated or scattered blocks above cut-off grade to define the “reasonable prospects of eventual economic extraction” for the Mineral Resource Estimate 8. Mineral resources as reported are undiluted 9. Mineral resource tonnages have been rounded to reflect the precision of the estimate 10. Readers are cautioned that mineral resources that are not mineral reserves do not have demonstrated economic viability Notes: Kitsalt Valley Resources (Homestake and Dolly Varden) 1 -Mineral resources are not mineral reserves, as they do not have demonstrated economic viability although, as per Canadian Institute of Mining, Metallurgy and Petroleum (“CIM”) requirements, the mineral resources reported above have been determined to have demonstrated reasonable prospects for eventual economic extraction. 2 -The mineral resources were estimated in accordance with the CIM Standards on Mineral Resources and Reserves, Definitions (2014) and Best Practices Guidelines (2019) prepared by the CIM Standing Committee on Reserve Definitions and adopted by the CIM Council. 3 - The resources reported above are derived from the Technical Report on The Combined Kitsault Valley Project, British Columbia, Canada dated effective September 28, 2022 (“Kitsault Valley Project Technical Report”) 4 -The cut-off grade for the Homestake claim block mineral resources is 2.0 g/t AuEq, which was determined using average block grade values within the estimation domains and a Au price of $1,300 per troy ounce (“per tr oz”), a Ag price of US$20.00/tr oz and a Cu price of US$2.50/pound, and mill recoveries of 92% for Au, 88% from Ag and 87.5% for Cu and combined mining, milling, and general and administrative costs of approximately US$109/ton. 5 - The cut-off grade for the Dolly Varden claim block mineral resource is 150 g/t Ag, which was determined using a Ag price of US$20.00/tr oz, a recovery of 90% and combined mining, milling, and general and administrative costs of US$80/ton and was supported by comparison to similar projects. 6 - Differences may occur in totals due to rounding
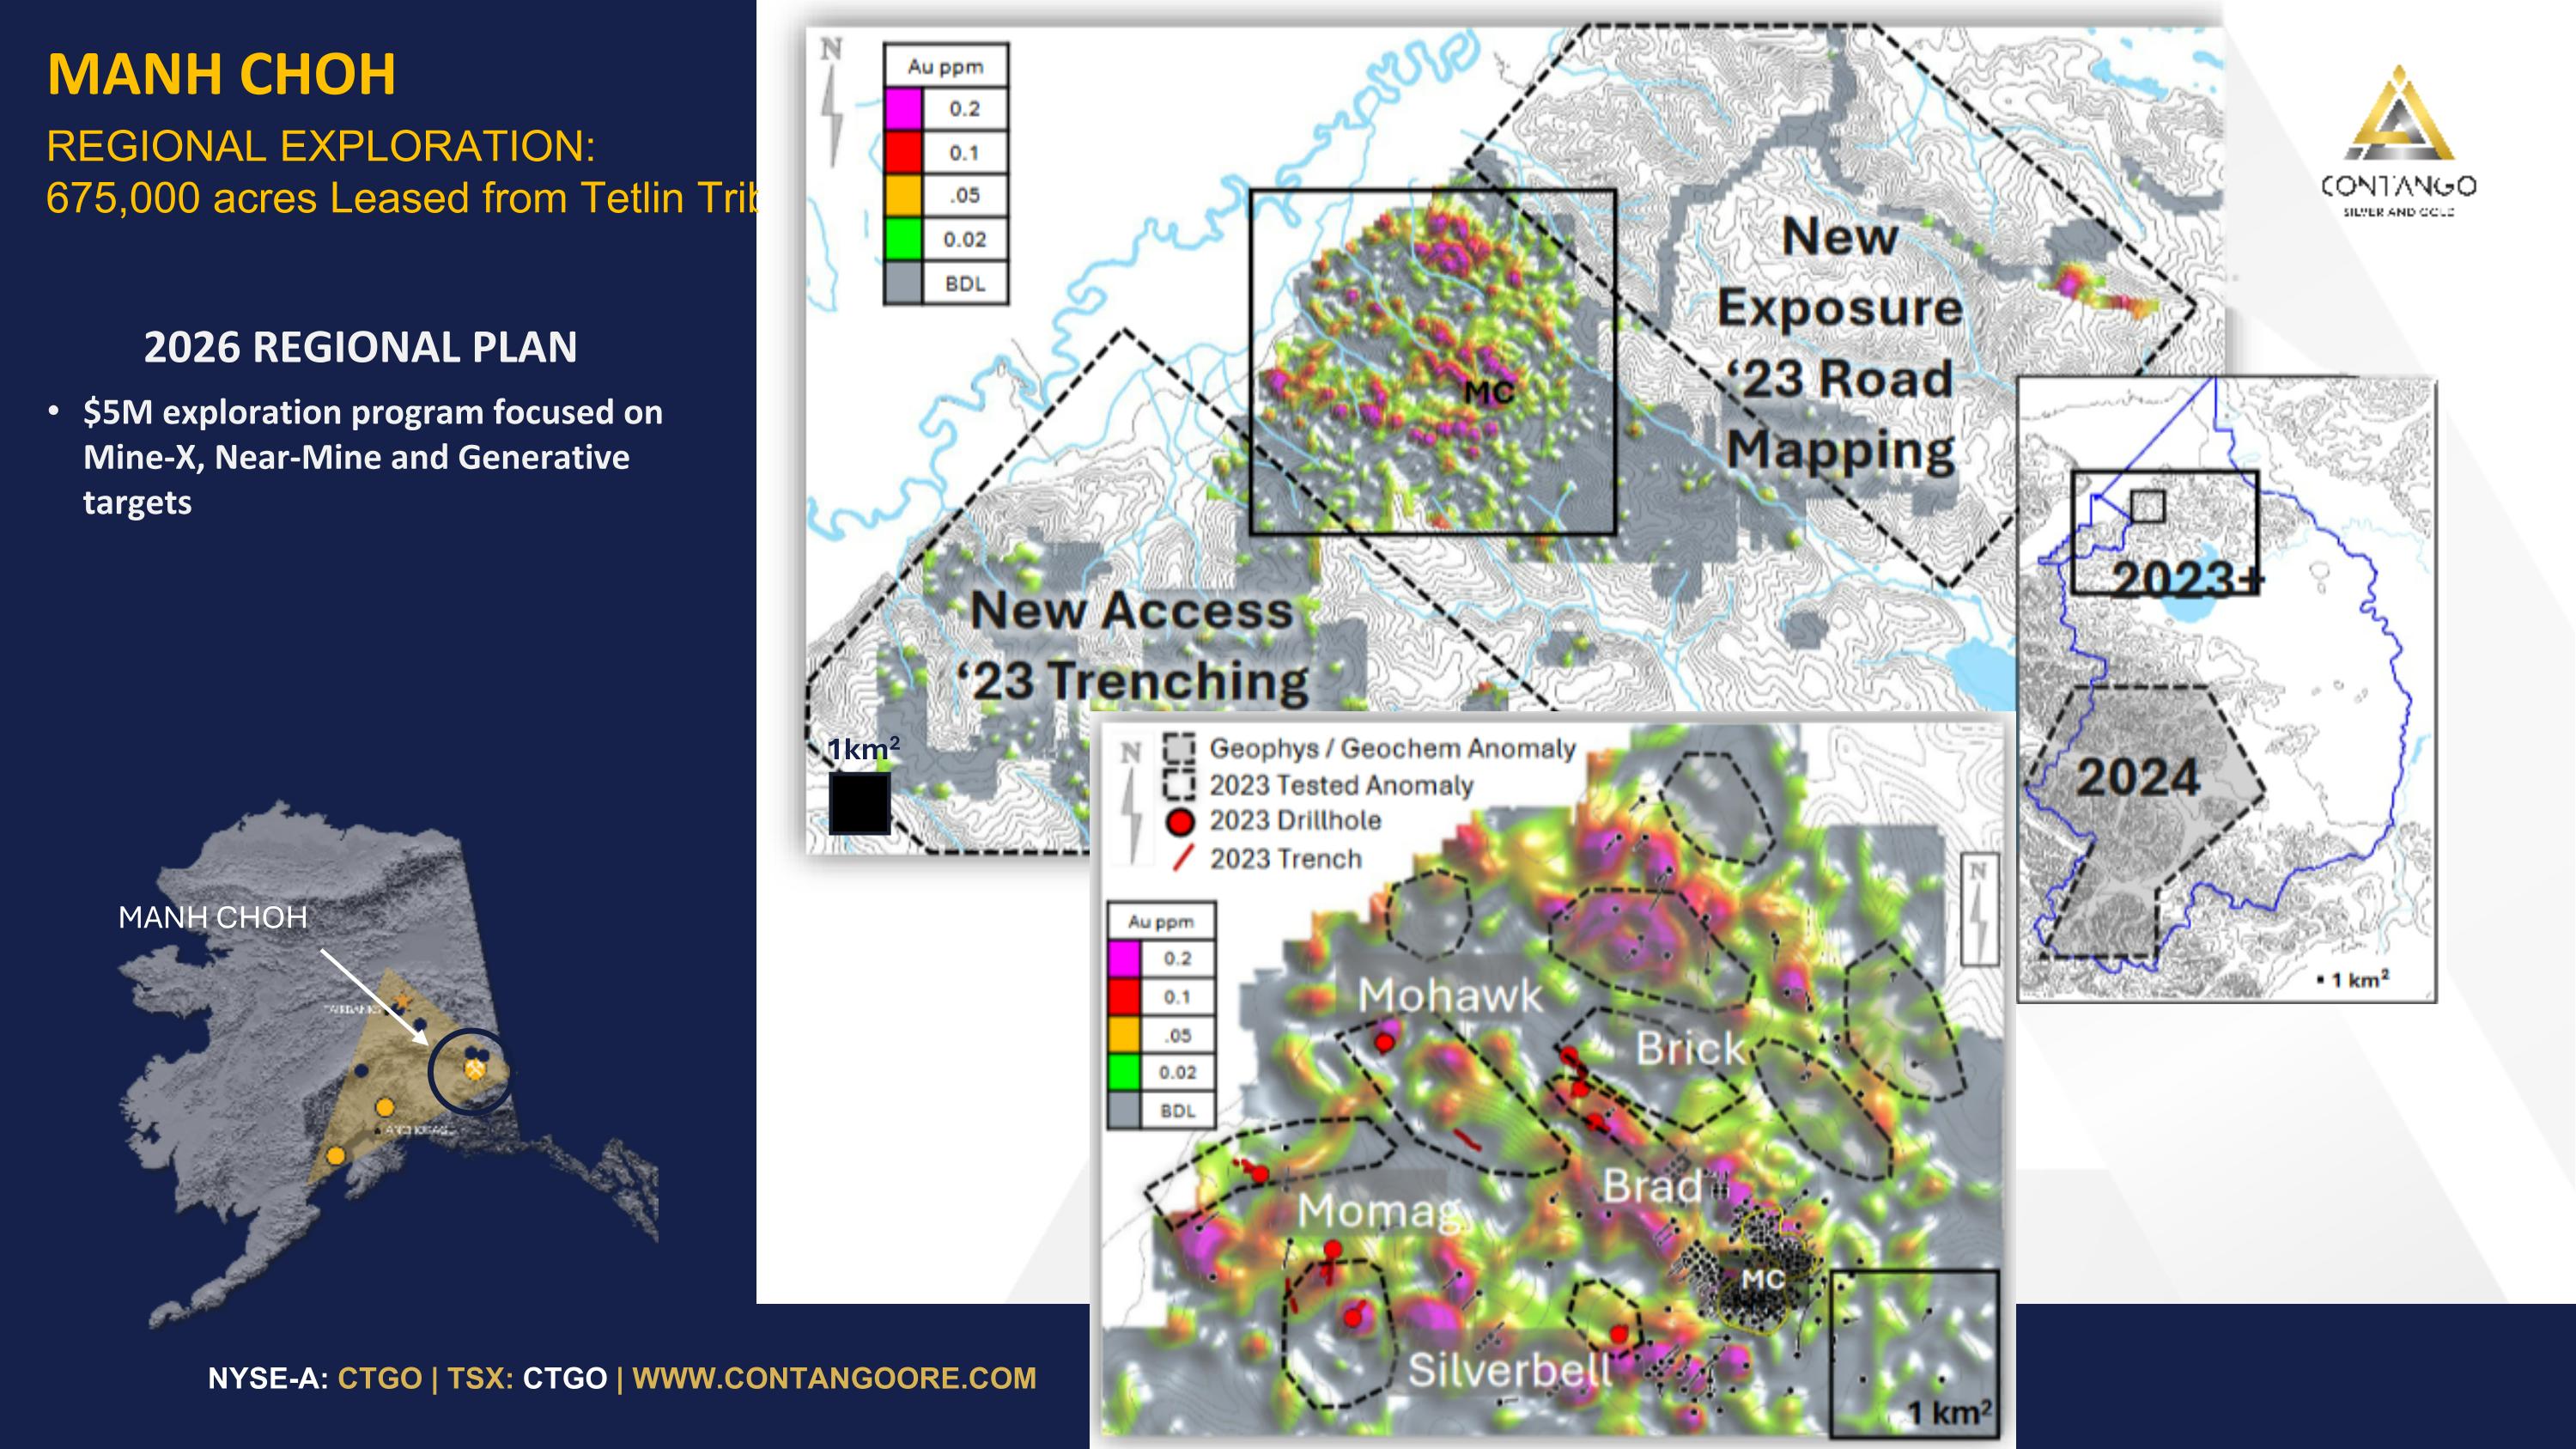
MANH CHOH REGIONAL EXPLORATION: 675,000 acres Leased from Tetlin Tribe $5M exploration program focused on Mine-X, Near-Mine and Generative targets 2026 REGIONAL PLAN MANH CHOH 1km2
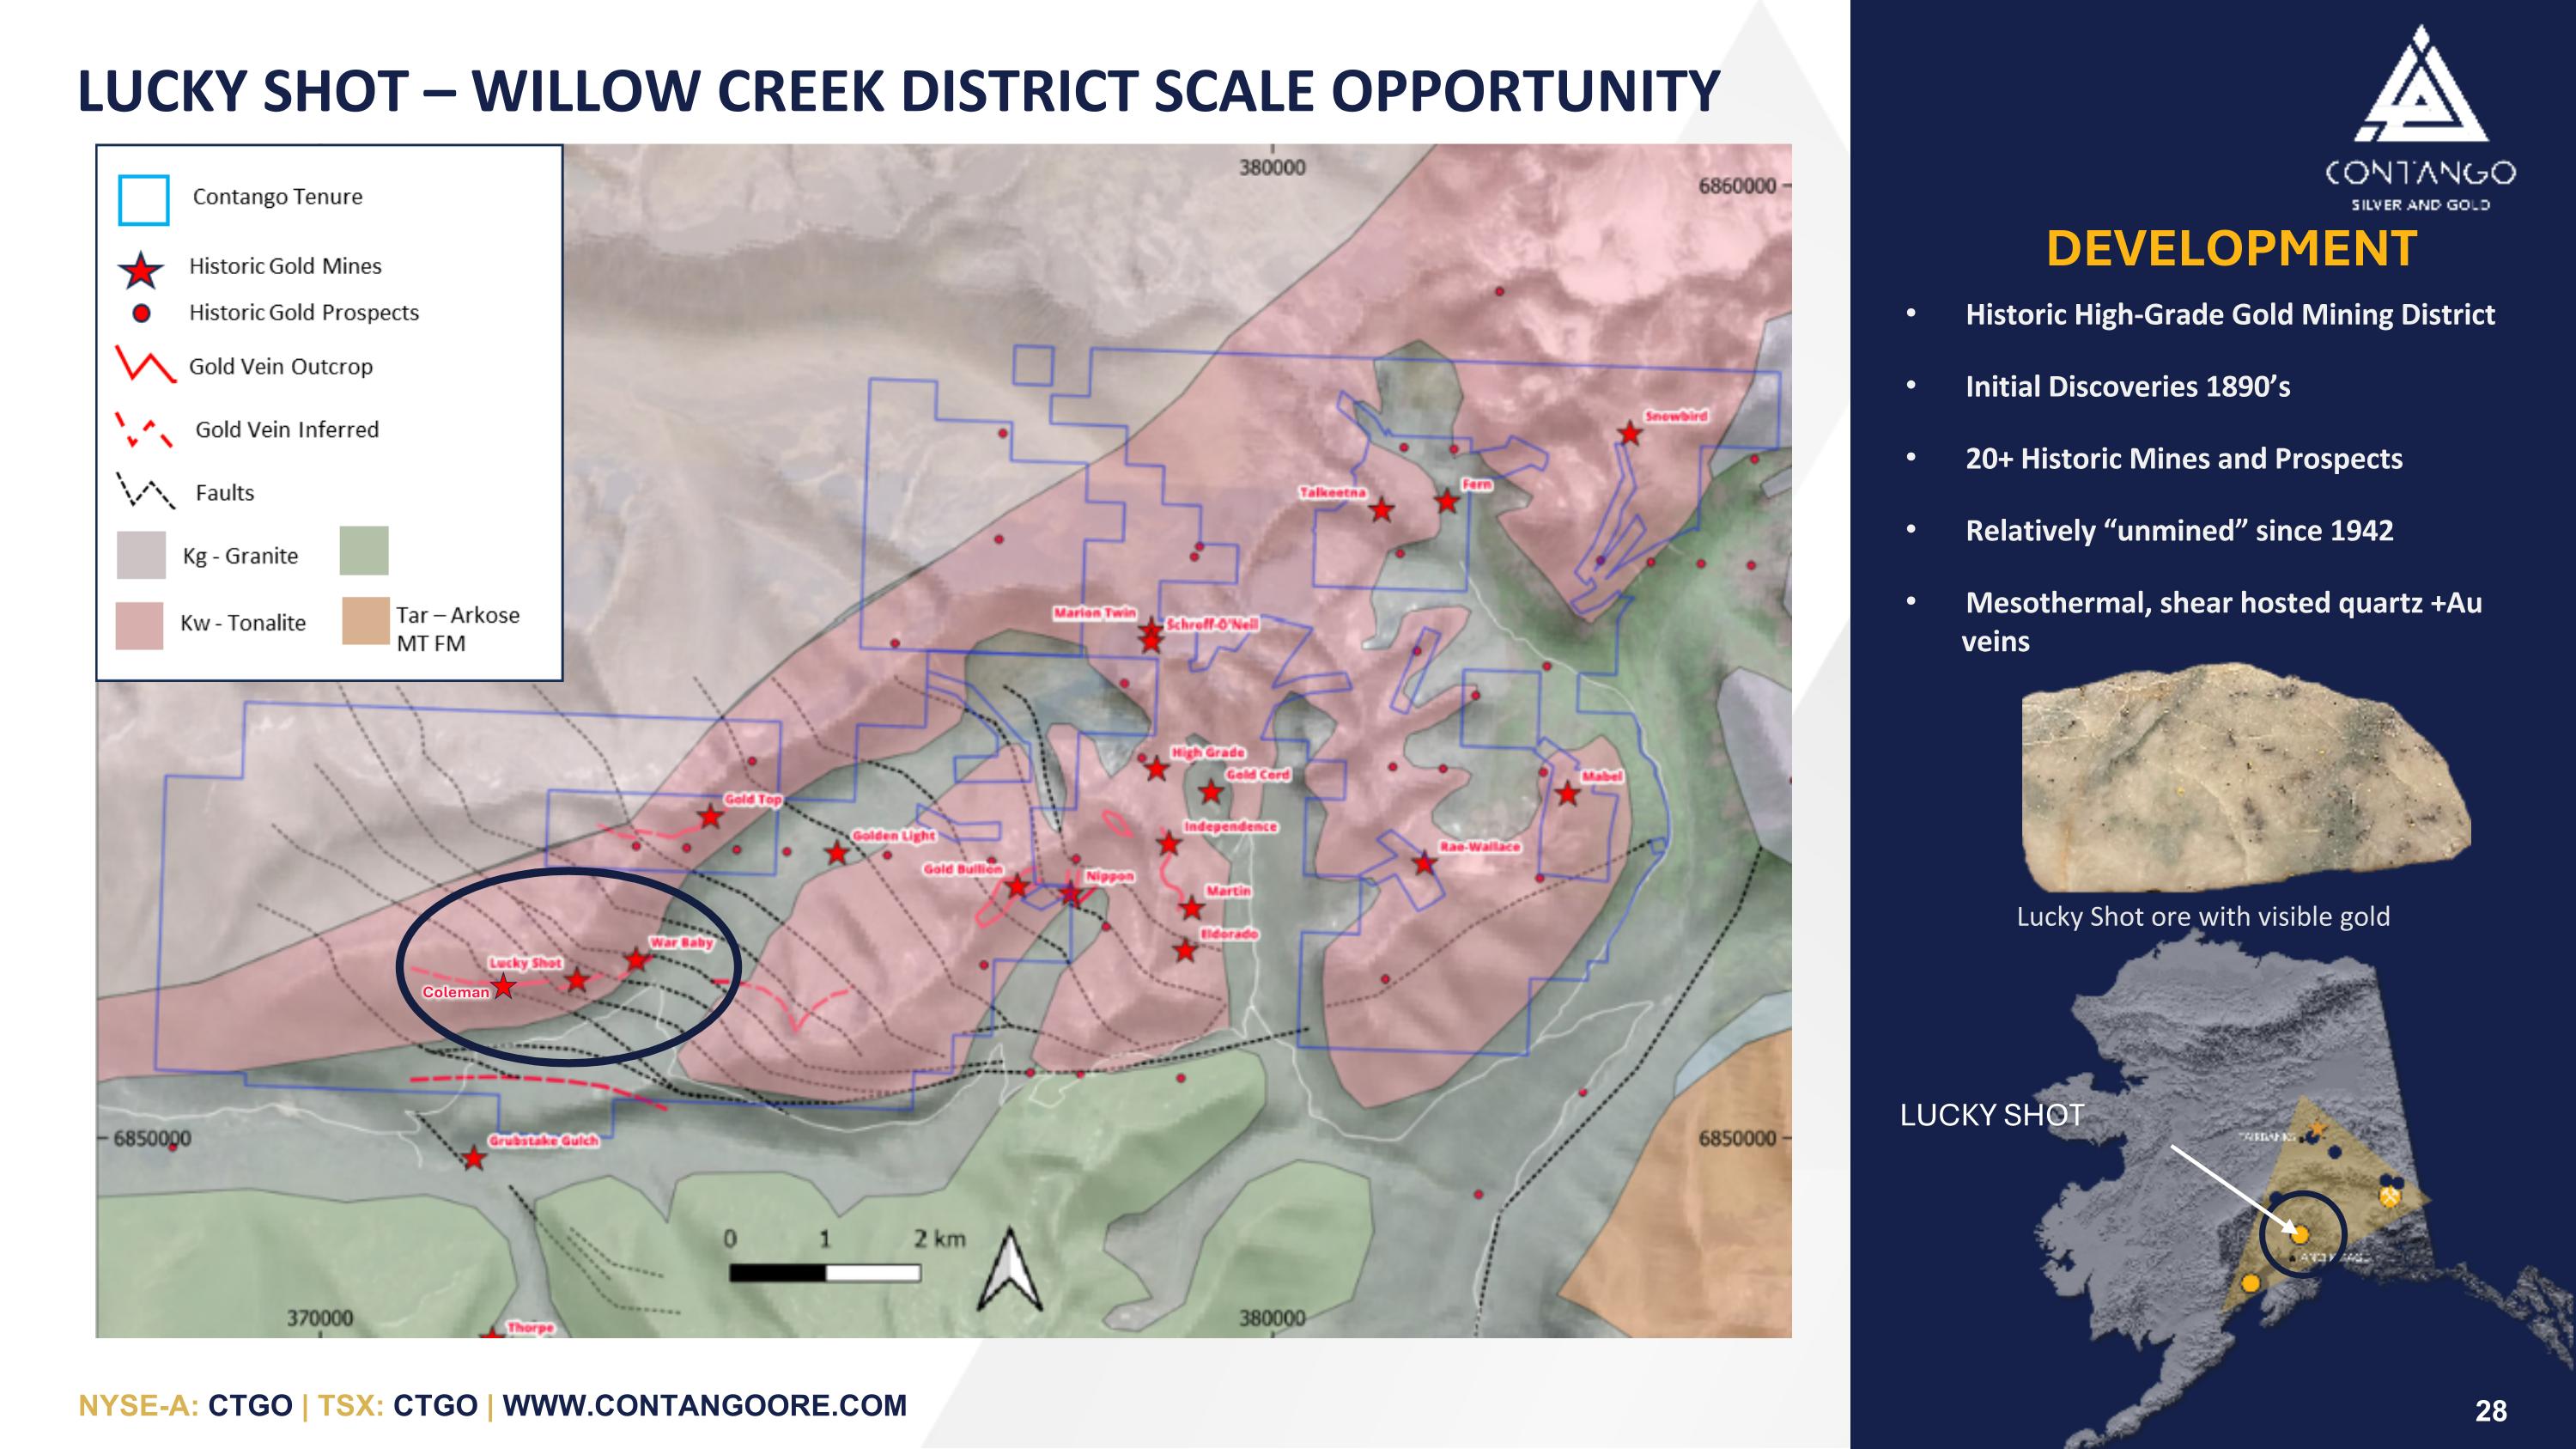
DEVELOPMENT Historic High-Grade Gold Mining District Initial Discoveries 1890’s 20+ Historic Mines and Prospects Relatively “unmined” since 1942 Mesothermal, shear hosted quartz +Au veins LUCKY SHOT Lucky Shot ore with visible gold Coleman LUCKY SHOT – WILLOW CREEK DISTRICT SCALE OPPORTUNITY 28
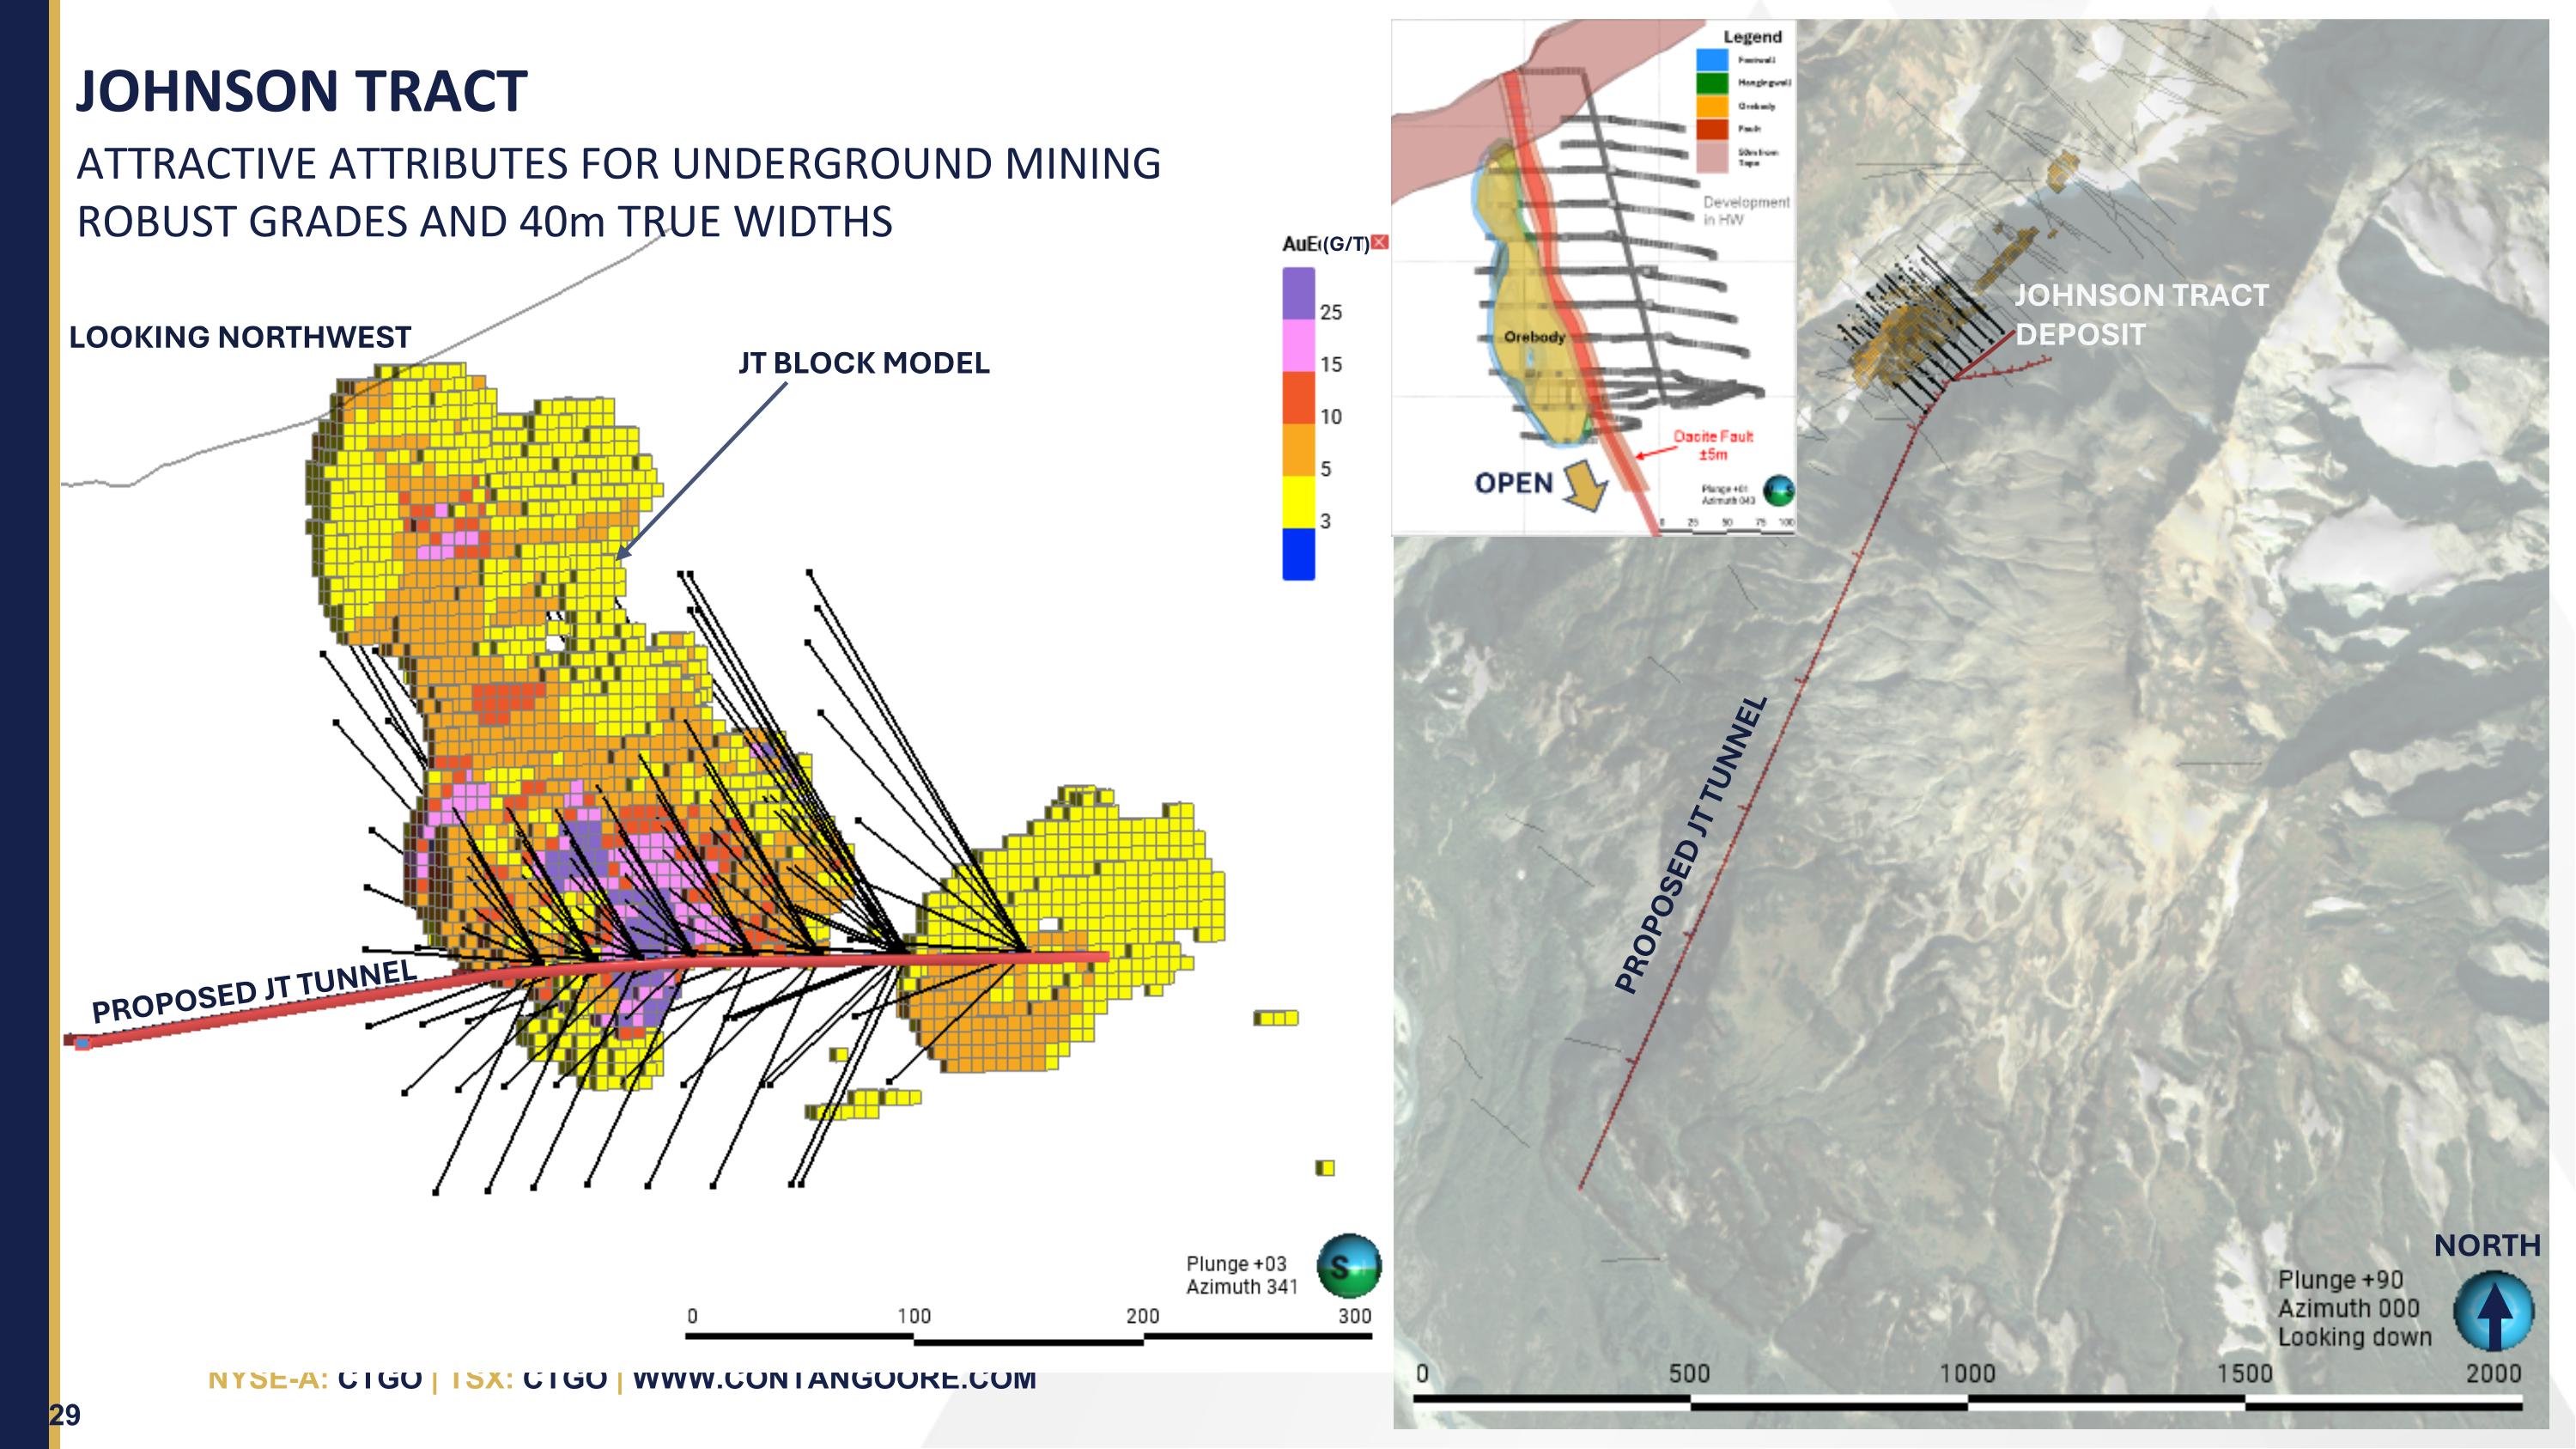
PLAN VIEW LOOKING NORTHWEST PROPOSED JT TUNNEL JT BLOCK MODEL JOHNSON TRACT DEPOSIT PROPOSED JT TUNNEL NORTH (G/T) JOHNSON TRACT 29 ATTRACTIVE ATTRIBUTES FOR UNDERGROUND MINING ROBUST GRADES AND 40m TRUE WIDTHS
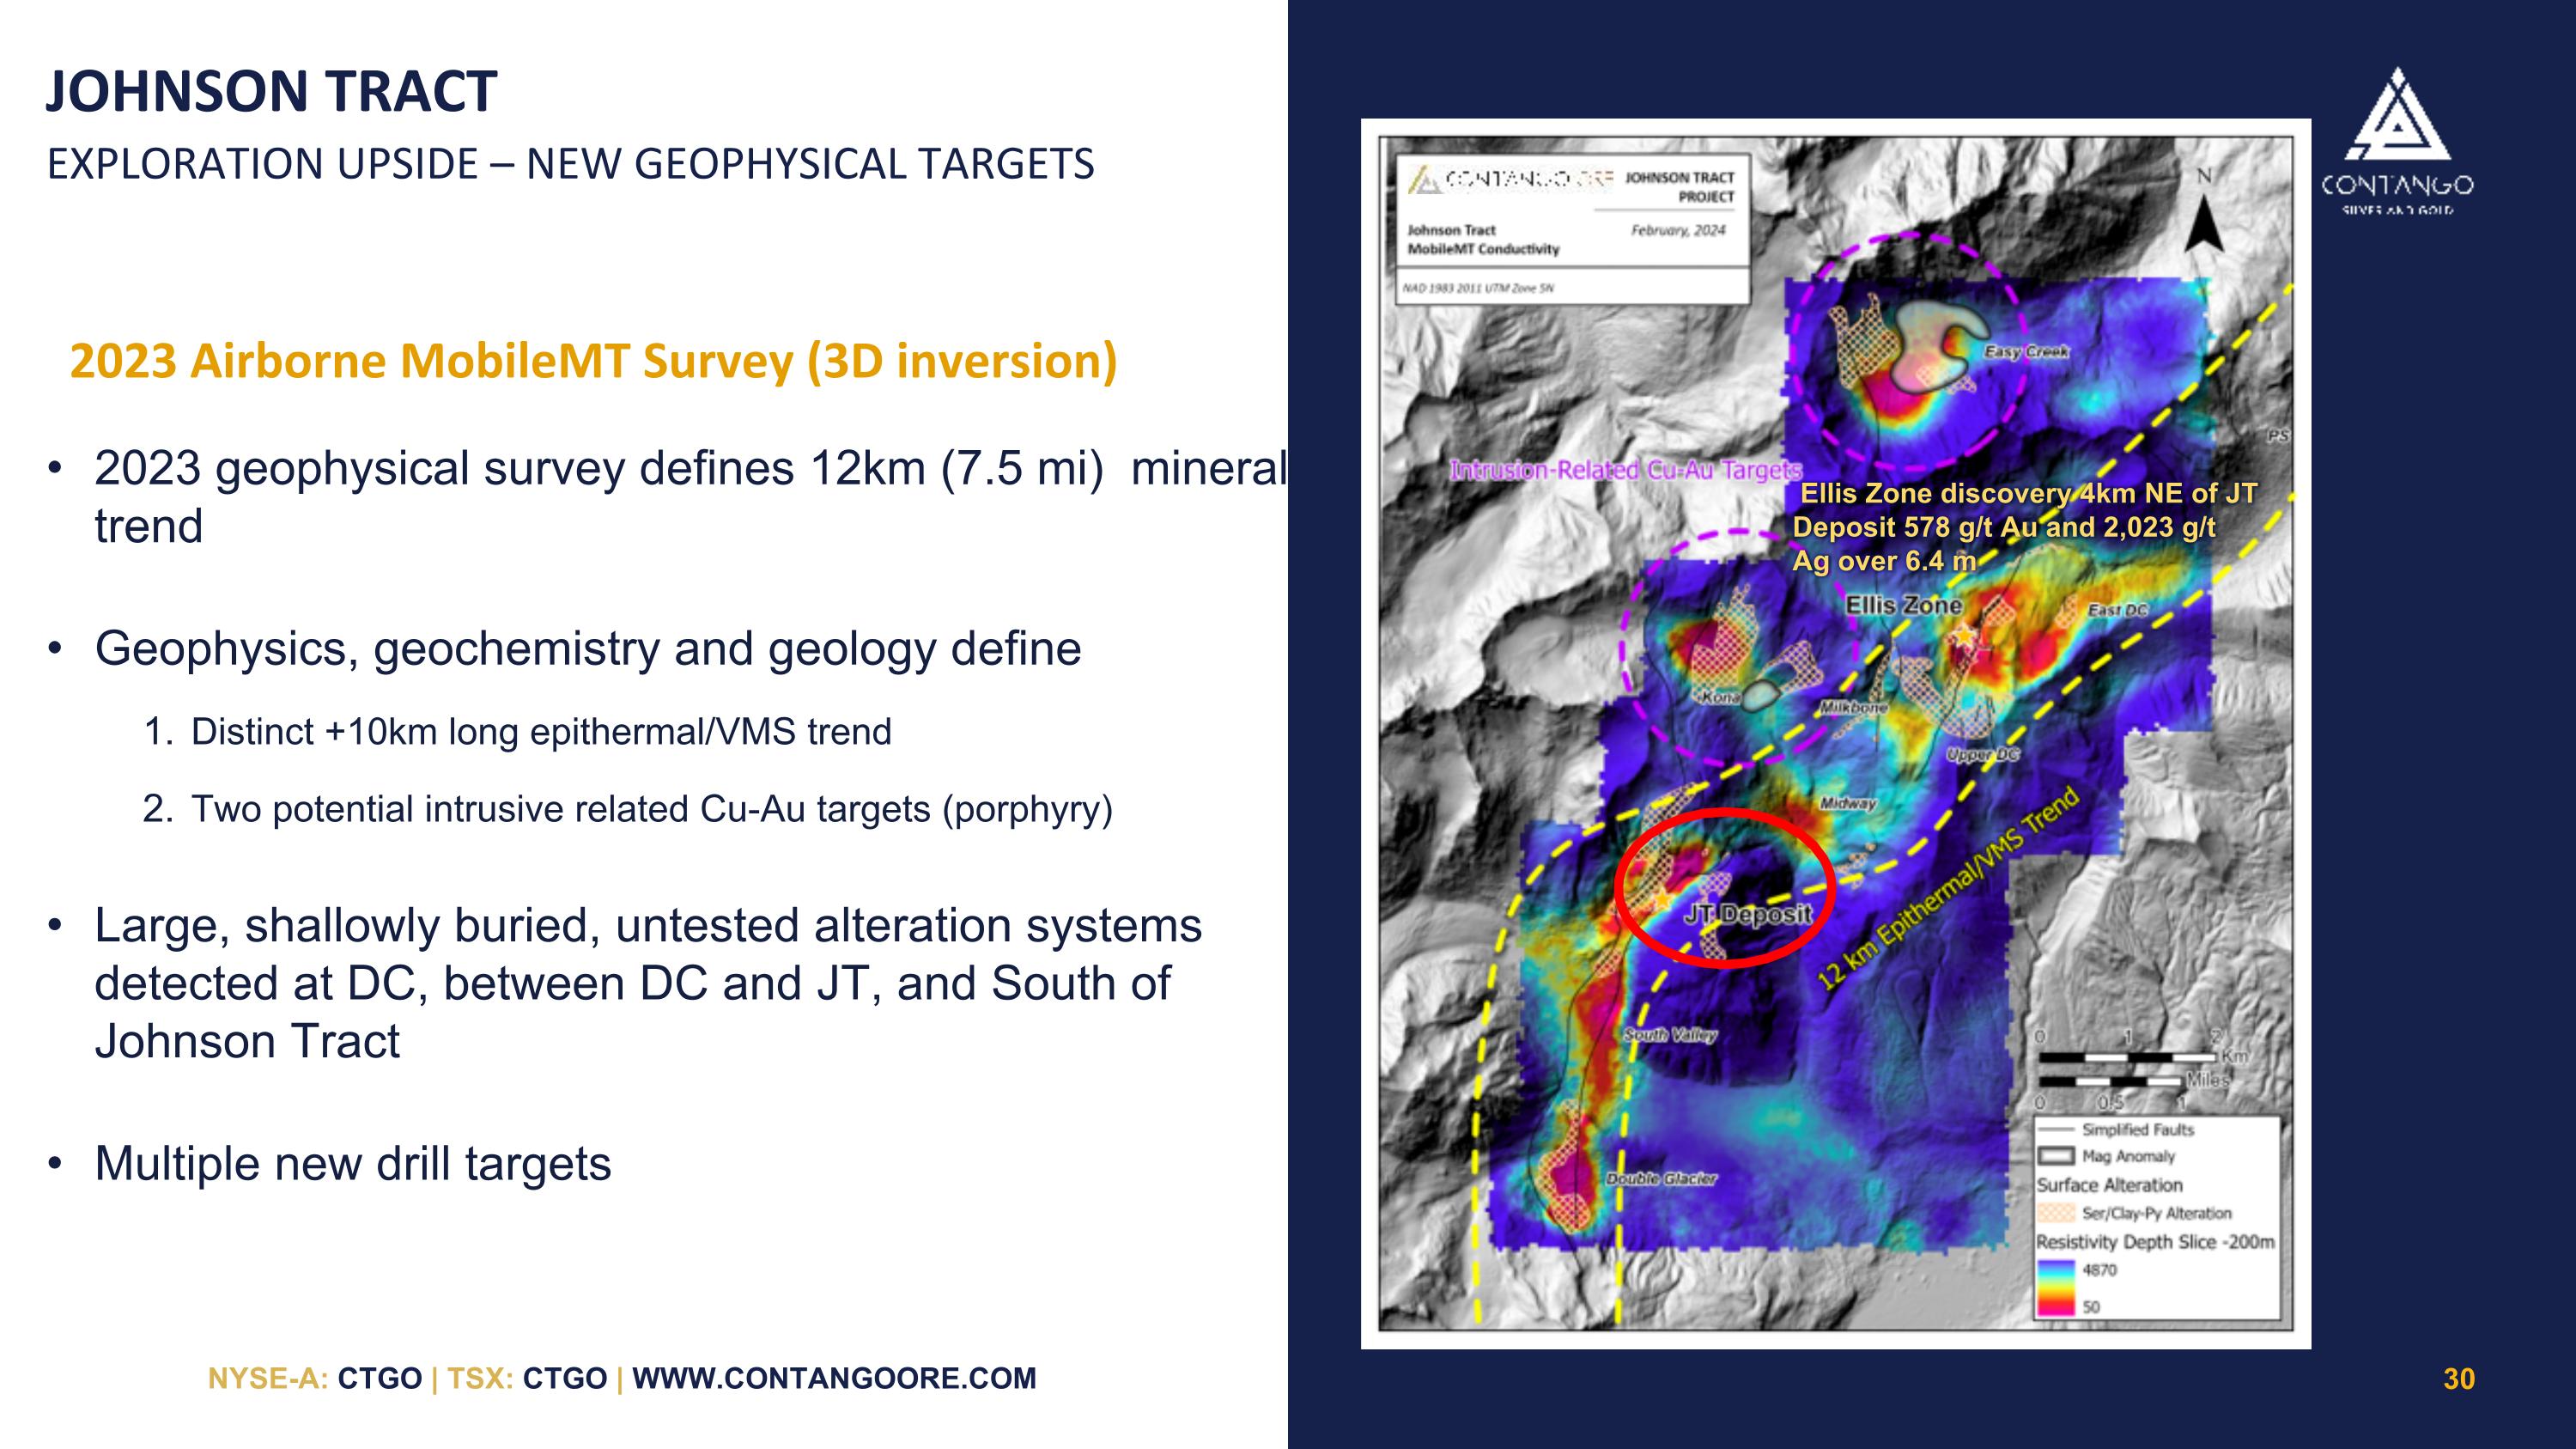
Ellis Zone discovery 4km NE of JT Deposit 578 g/t Au and 2,023 g/t Ag over 6.4 m JOHNSON TRACT EXPLORATION UPSIDE – NEW GEOPHYSICAL TARGETS 2023 geophysical survey defines 12km (7.5 mi) mineral trend Geophysics, geochemistry and geology define Distinct +10km long epithermal/VMS trend Two potential intrusive related Cu-Au targets (porphyry) Large, shallowly buried, untested alteration systems detected at DC, between DC and JT, and South of Johnson Tract Multiple new drill targets 2023 Airborne MobileMT Survey (3D inversion)
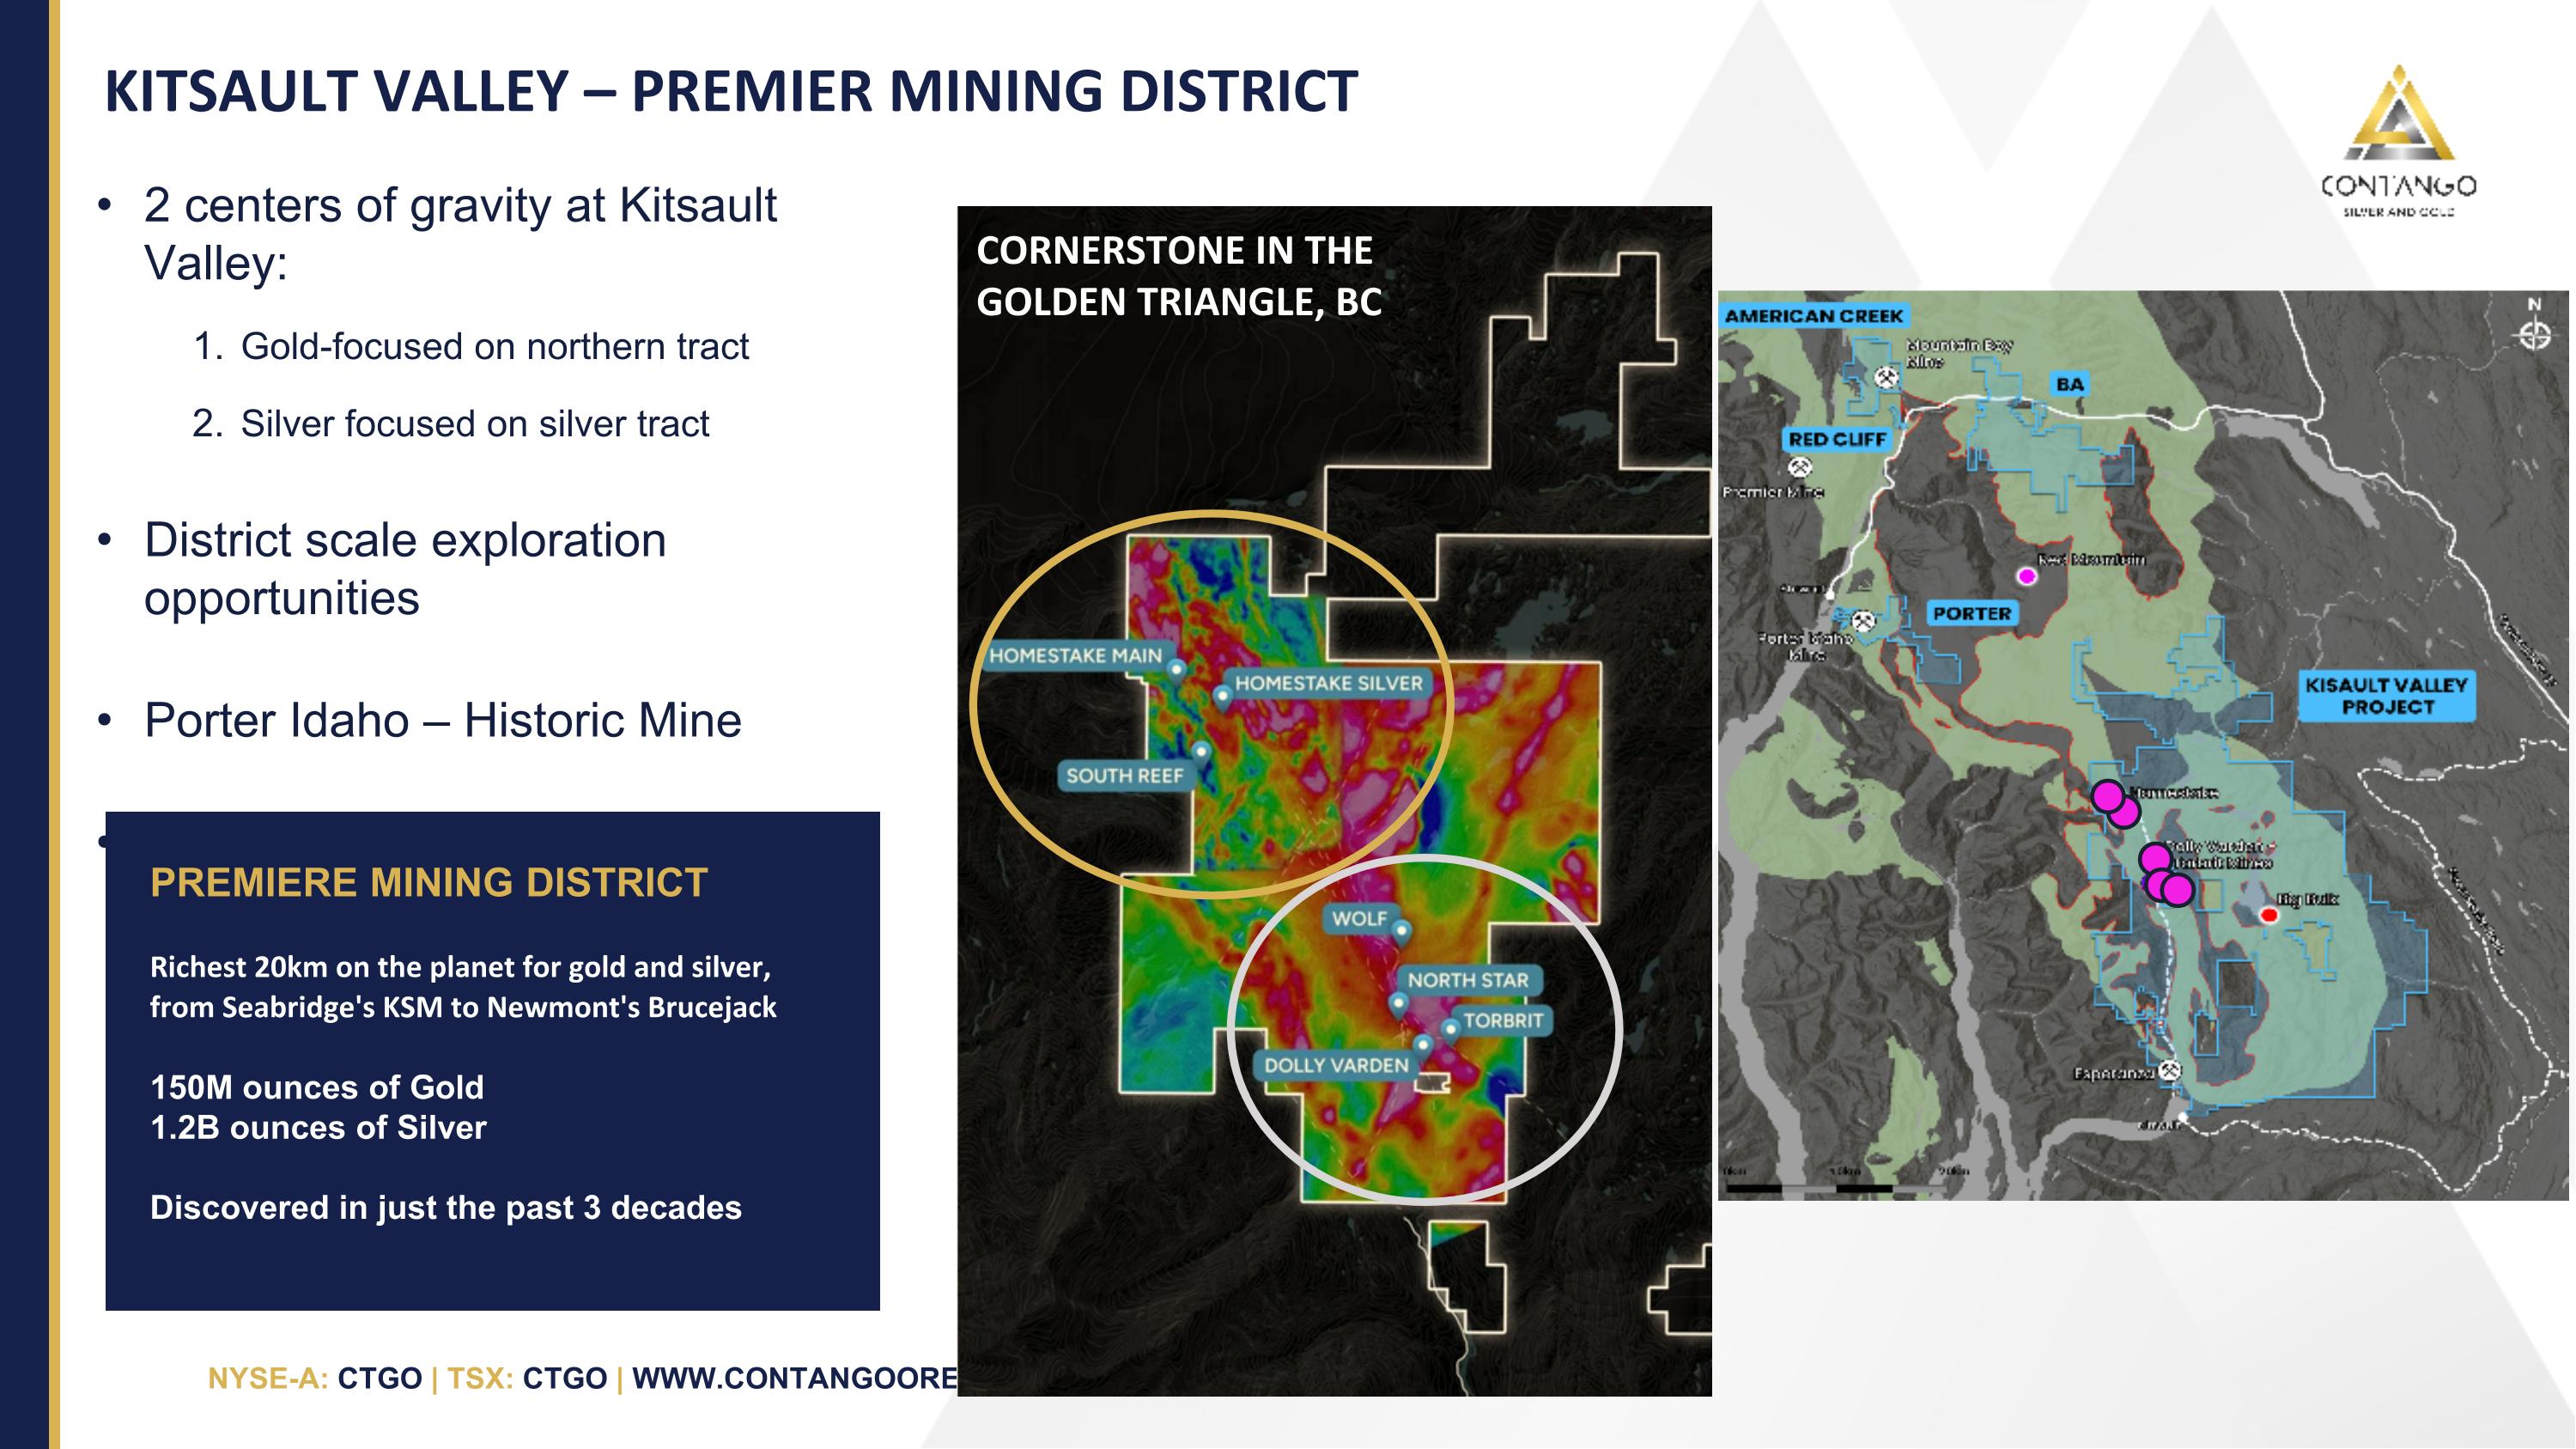
KITSAULT VALLEY – PREMIER MINING DISTRICT 2 centers of gravity at Kitsault Valley: Gold-focused on northern tract Silver focused on silver tract District scale exploration opportunities Porter Idaho – Historic Mine Mountain Boy – Historic Mine PREMIERE MINING DISTRICT Richest 20km on the planet for gold and silver, from Seabridge's KSM to Newmont's Brucejack 150M ounces of Gold 1.2B ounces of Silver Discovered in just the past 3 decades CORNERSTONE IN THE GOLDEN TRIANGLE, BC
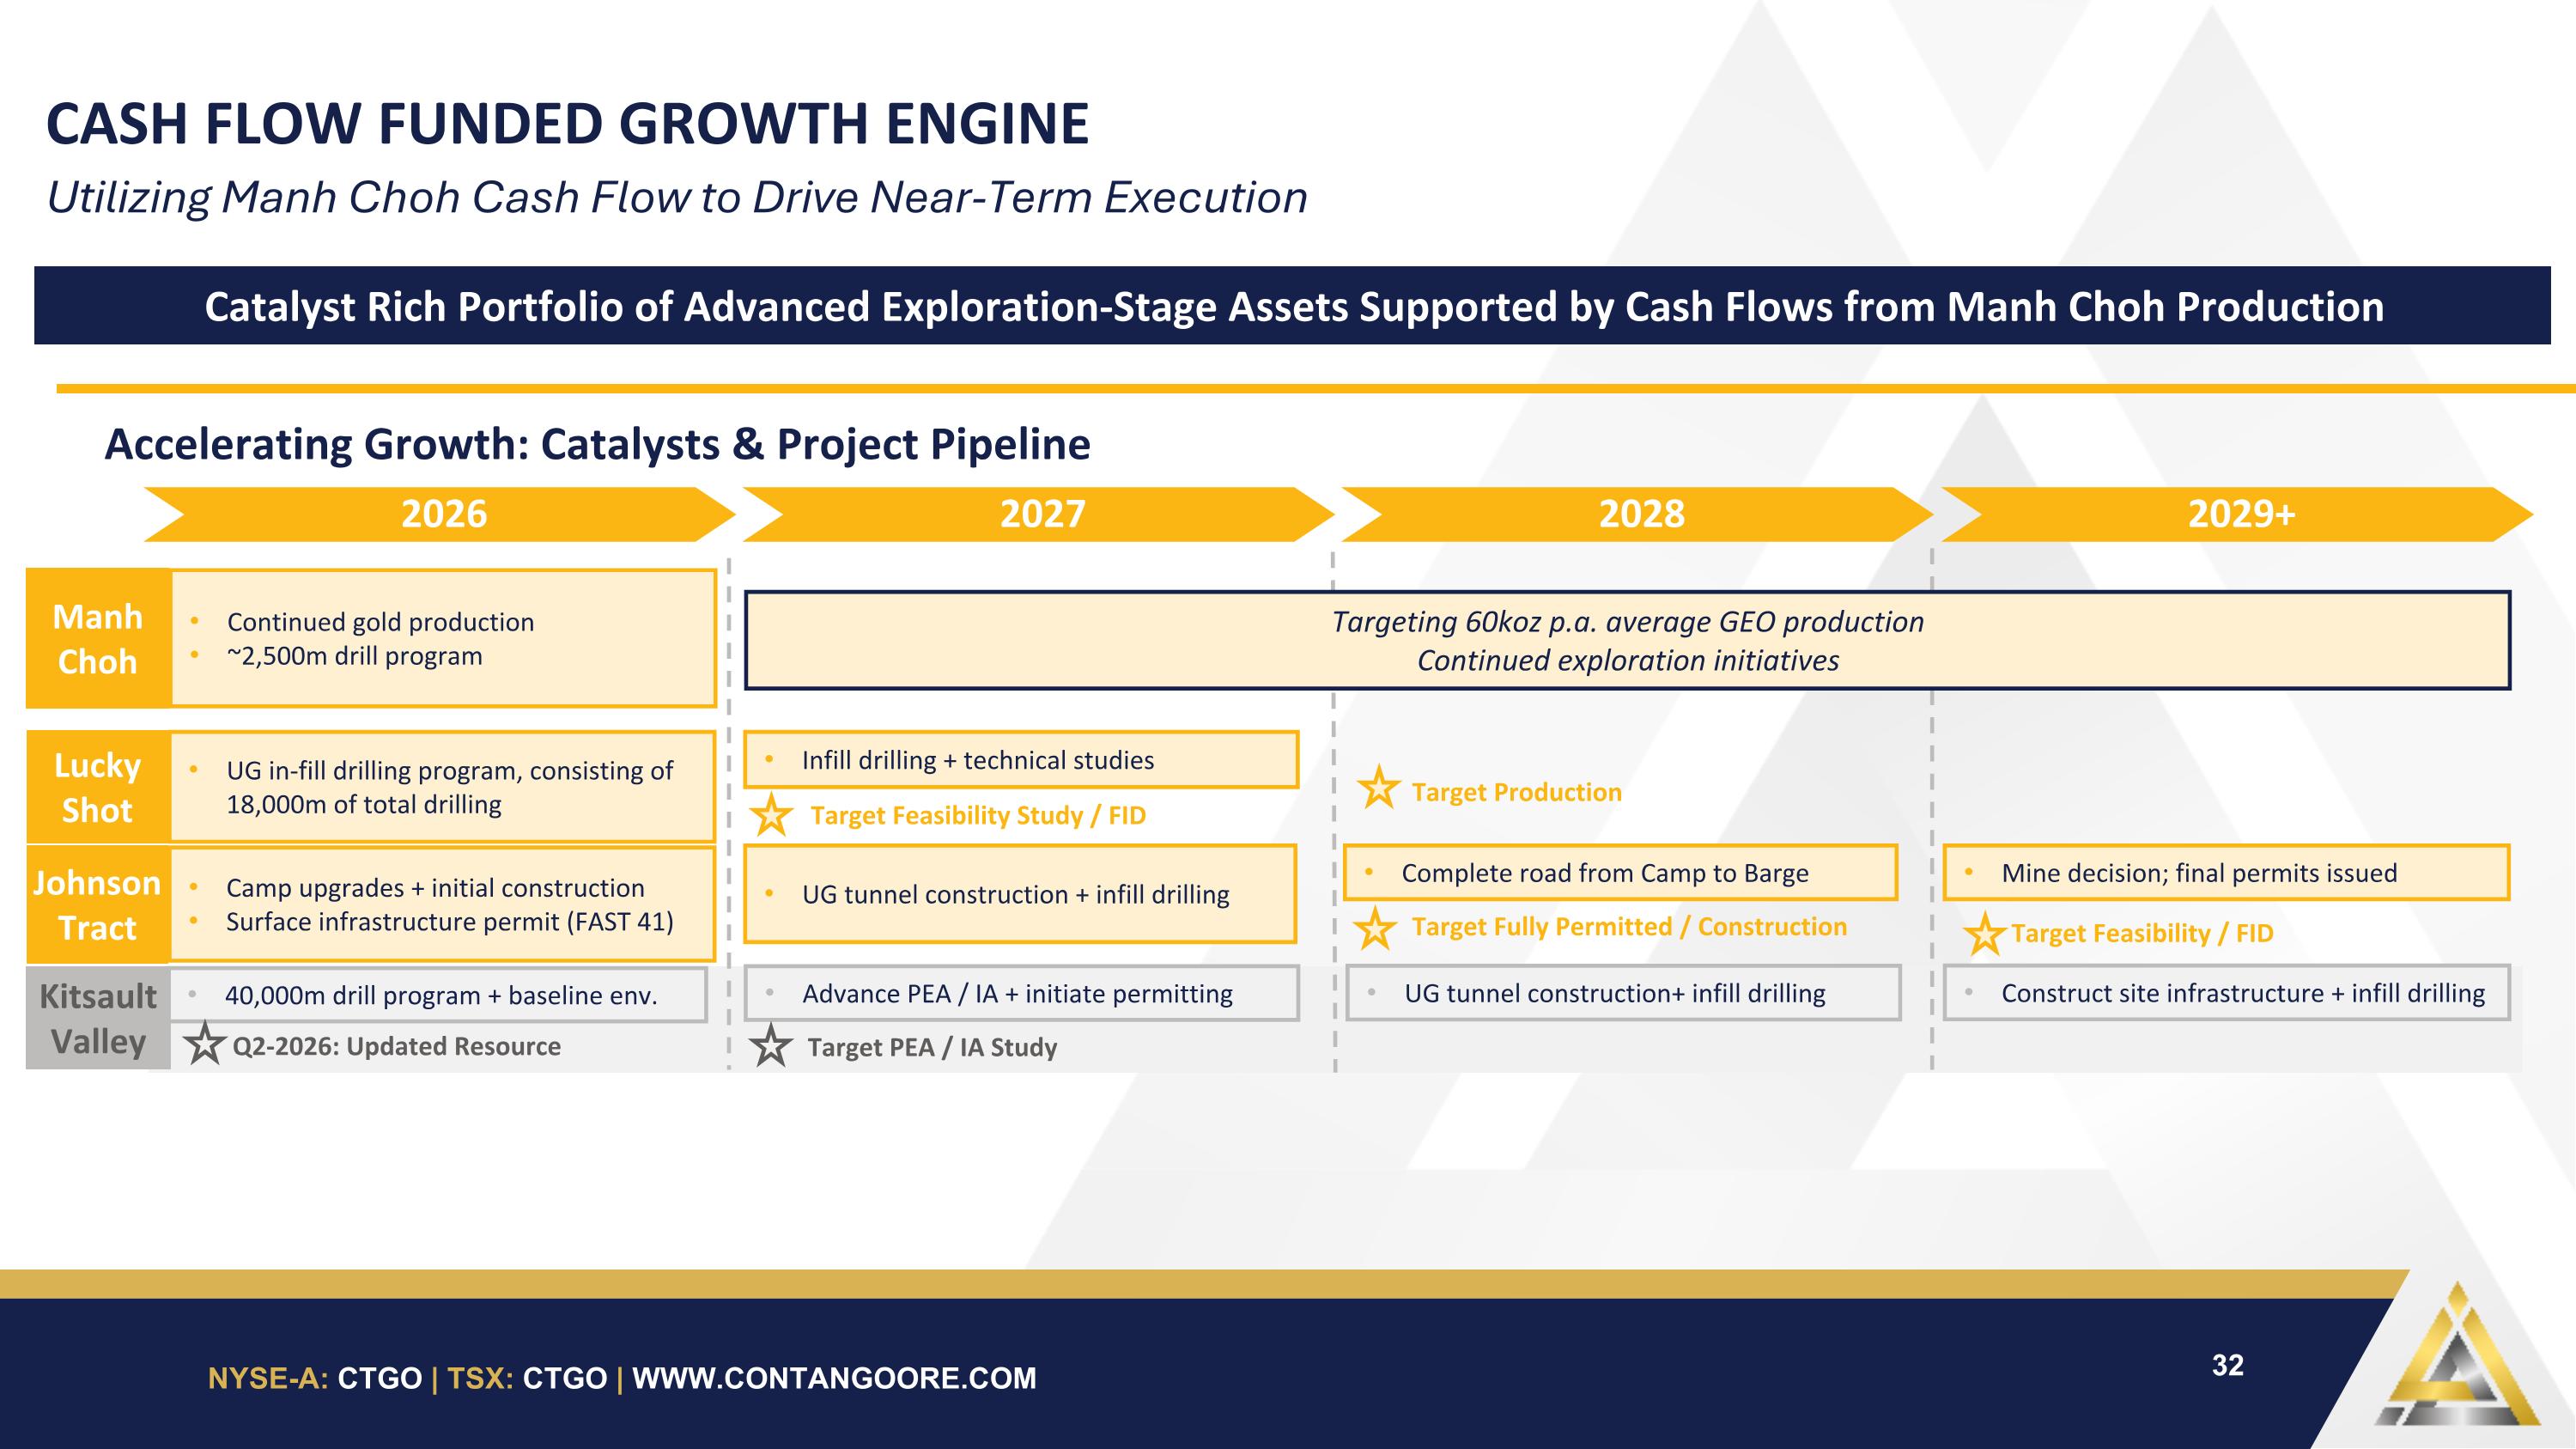
2026 2027 2028 2029+ CASH FLOW FUNDED GROWTH ENGINE Catalyst Rich Portfolio of Advanced Exploration-Stage Assets Supported by Cash Flows from Manh Choh Production Accelerating Growth: Catalysts & Project Pipeline 40,000m drill program + baseline env. Advance PEA / IA + initiate permitting Target PEA / IA Study Camp upgrades + initial construction Surface infrastructure permit (FAST 41) Johnson Tract Lucky Shot Manh Choh Kitsault Valley UG tunnel construction + infill drilling Complete road from Camp to Barge Target Fully Permitted / Construction Mine decision; final permits issued Target Feasibility / FID Continued gold production ~2,500m drill program Targeting 60koz p.a. average GEO production Continued exploration initiatives Infill drilling + technical studies UG in-fill drilling program, consisting of 18,000m of total drilling Target Feasibility Study / FID Q2-2026: Updated Resource UG tunnel construction+ infill drilling Construct site infrastructure + infill drilling Target Production Utilizing Manh Choh Cash Flow to Drive Near-Term Execution
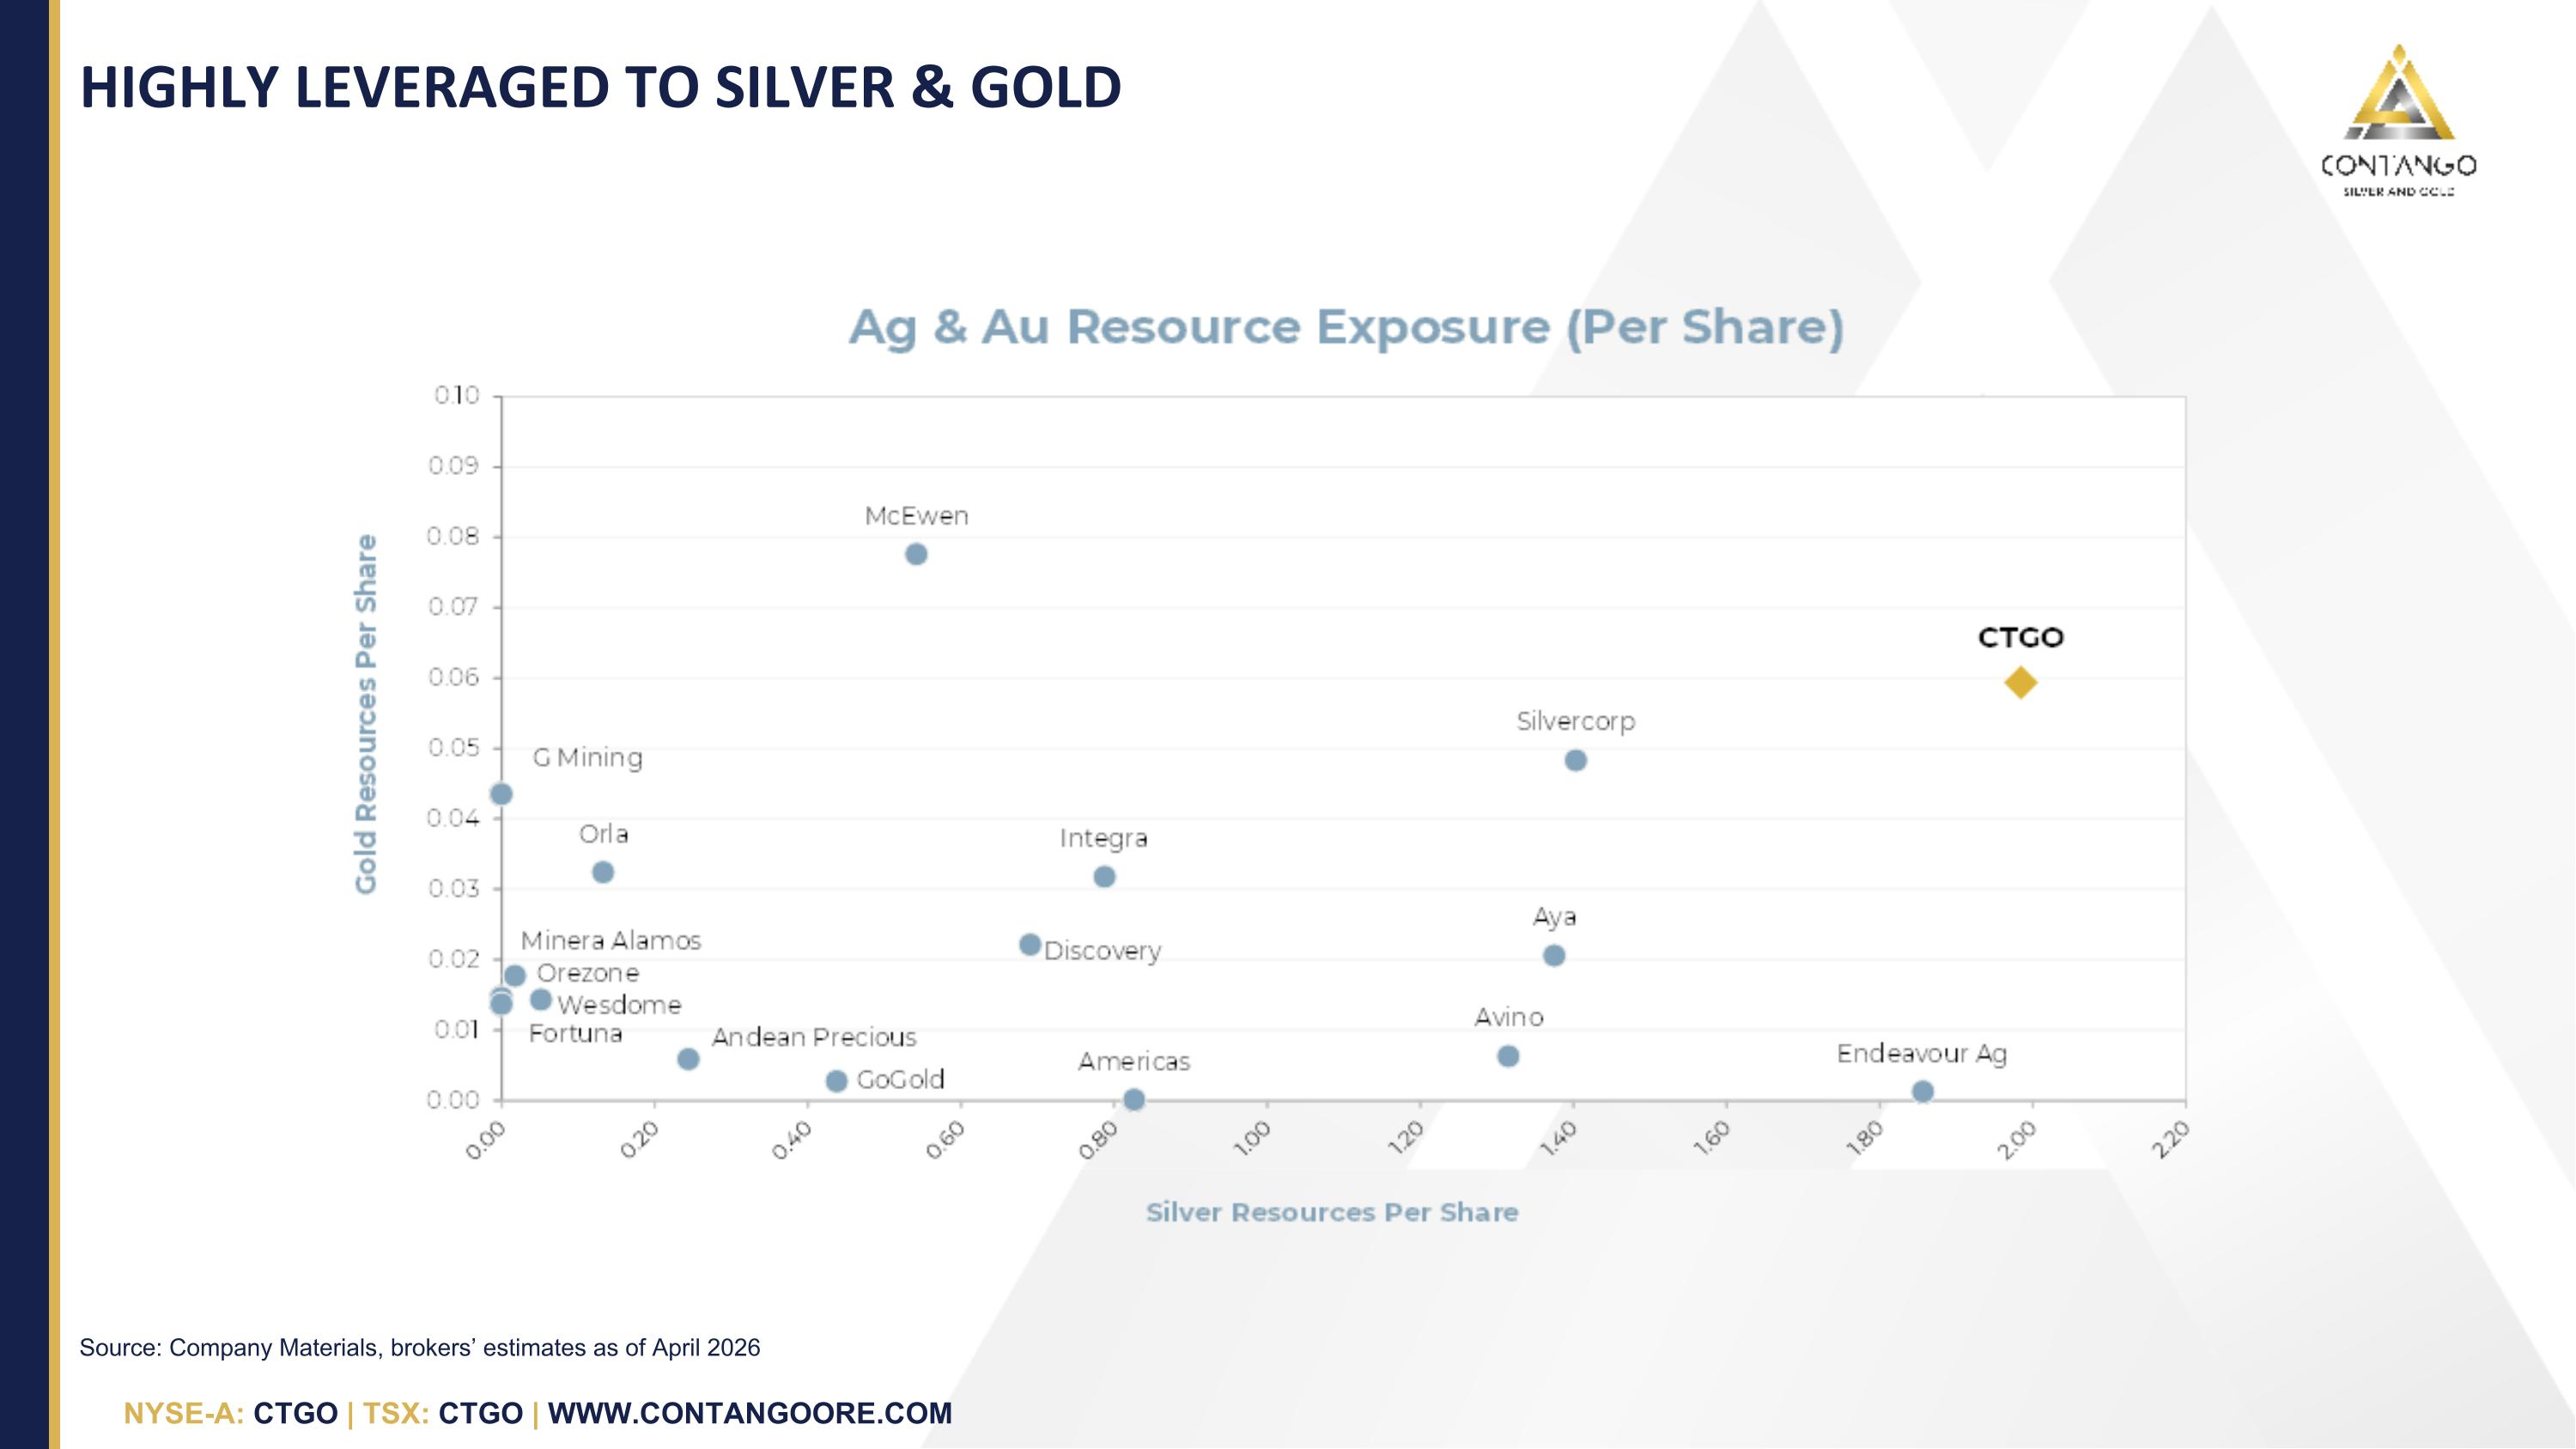
Source: Company Materials, brokers’ estimates as of April 2026 HIGHLY LEVERAGED TO SILVER & GOLD