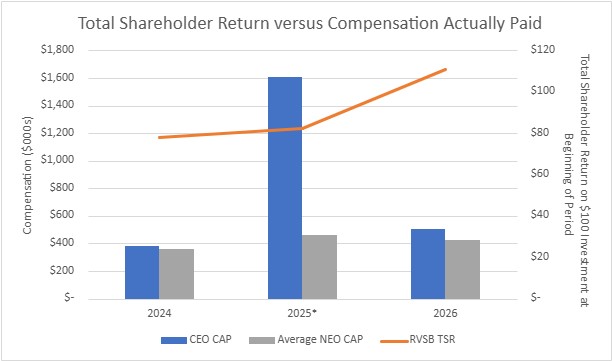
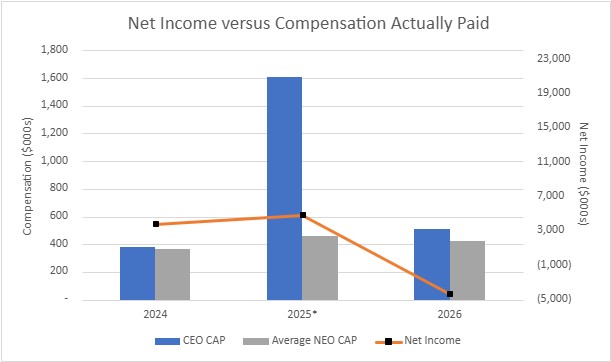
| | | | | | | | | Value of | | ||||||||||
Initial Fixed | ||||||||||||||||||||
Average | $100 | |||||||||||||||||||
Summary | Summary | Summary | Summary | Average | Investment | |||||||||||||||
Compensation | Compensation | Compensation | Compensation | Compensation | Compensation | Compensation | Compensation | Based on | ||||||||||||
Table | Actually | Table | Actually | Table | Actually | Table | Actually | Total | ||||||||||||
Total for | Paid to | Total for | Paid to | Total for | Paid to | Total for | Paid to | Shareholder | ||||||||||||
PEO #1 | PEO #1 | PEO #2 | PEO #2 | PEO #3 | PEO #3 | Non-PEO | Non-PEO | Return | ||||||||||||
Year | ($)(1) | ($)(2) | ($)(1) | ($)(2) | ($)(1) | ($)(1) | NEOs ($)(1) | NEOs ($)(2) | ($)(3) | Net Income ($) | ||||||||||
2026 |
| 527,653 |
| 507,213 |
| — |
| — |
| — |
| — |
| 426,152 |
| 424,942 |
| 11.20 |
| (4,341,000) |
2025 |
| 1,481,716 |
| 1,609,280 |
| 458,033 |
| 483,033 |
| — |
| — |
| 442,332 |
| 459,921 |
| (17.3) |
| 4,903,000 |
2024 |
| — |
| — |
| 403,949 |
| 382,111 |
| 264,775 |
| 264,775 |
| 380,390 |
| 362,957 |
| (22.0) |
| 3,799,000 |
(1) | During the year ended March 31, 2026, B. Nicole Sherman served as our PEO (PEO #1). During the year ended March 31, 2025, B. Nicole Sherman (PEO #1) and Daniel D. Cox (PEO #2) each served as our principal executive officer (“PEO”). During the year ended March 31, 2024, Daniel D. Cox (PEO #2) and Kevin J. Lycklama (PEO #3) each served as our PEO. The non-PEO named executive officers (non-PEO NEOs) for 2026 and 2025 are Daniel D. Cox and C. Evan Sowers, and for 2024 are C. Evan Sowers and David Lam. |
(2) | The amounts shown for Compensation Actually Paid have been calculated in accordance with Item 402(v) of Regulation S-K and do not reflect compensation actually earned, realized, or received by Riverview’s NEOs. These amounts reflect the Summary Compensation Table totals with certain adjustments. Adjustments for 2026 are as follows: |
| | Average of | | ||
Non-PEO | |||||
PEO #1 ($) | NEOs ($) | ||||
Summary Compensation Table total |
| 527,653 |
| 426,152 |
|
Deduction for amounts reported under the Stock Awards column in the Summary Compensation Table |
| 42,498 |
| 34,250 |
|
Year-end value of equity awards granted during year that remain unvested as of year‑end |
| 45,386 |
| 36,578 |
|
Year over year change in fair value of outstanding and unvested equity awards |
| (23,051) |
| (2,619) |
|
Year over year change in fair value of equity awards granted in prior years and vested in the year |
| (277) |
| (919) |
|
Compensation Actually Paid |
| 507,213 |
| 424,942 |
|
(3) | Total Shareholder Return assumes $100 invested on March 31, 2023, with all dividends reinvested. |
(1) | During the year ended March 31, 2026, B. Nicole Sherman served as our PEO (PEO #1). During the year ended March 31, 2025, B. Nicole Sherman (PEO #1) and Daniel D. Cox (PEO #2) each served as our principal executive officer (“PEO”). During the year ended March 31, 2024, Daniel D. Cox (PEO #2) and Kevin J. Lycklama (PEO #3) each served as our PEO. The non-PEO named executive officers (non-PEO NEOs) for 2026 and 2025 are Daniel D. Cox and C. Evan Sowers, and for 2024 are C. Evan Sowers and David Lam. |
(2) | The amounts shown for Compensation Actually Paid have been calculated in accordance with Item 402(v) of Regulation S-K and do not reflect compensation actually earned, realized, or received by Riverview’s NEOs. These amounts reflect the Summary Compensation Table totals with certain adjustments. Adjustments for 2026 are as follows: |
| | Average of | | ||
Non-PEO | |||||
PEO #1 ($) | NEOs ($) | ||||
Summary Compensation Table total |
| 527,653 |
| 426,152 |
|
Deduction for amounts reported under the Stock Awards column in the Summary Compensation Table |
| 42,498 |
| 34,250 |
|
Year-end value of equity awards granted during year that remain unvested as of year‑end |
| 45,386 |
| 36,578 |
|
Year over year change in fair value of outstanding and unvested equity awards |
| (23,051) |
| (2,619) |
|
Year over year change in fair value of equity awards granted in prior years and vested in the year |
| (277) |
| (919) |
|
Compensation Actually Paid |
| 507,213 |
| 424,942 |
|
(2) | The amounts shown for Compensation Actually Paid have been calculated in accordance with Item 402(v) of Regulation S-K and do not reflect compensation actually earned, realized, or received by Riverview’s NEOs. These amounts reflect the Summary Compensation Table totals with certain adjustments. Adjustments for 2026 are as follows: |
| | Average of | | ||
Non-PEO | |||||
PEO #1 ($) | NEOs ($) | ||||
Summary Compensation Table total |
| 527,653 |
| 426,152 |
|
Deduction for amounts reported under the Stock Awards column in the Summary Compensation Table |
| 42,498 |
| 34,250 |
|
Year-end value of equity awards granted during year that remain unvested as of year‑end |
| 45,386 |
| 36,578 |
|
Year over year change in fair value of outstanding and unvested equity awards |
| (23,051) |
| (2,619) |
|
Year over year change in fair value of equity awards granted in prior years and vested in the year |
| (277) |
| (919) |
|
Compensation Actually Paid |
| 507,213 |
| 424,942 |
|