v3.26.1
Pay vs Performance Disclosure - USD ($)
12 Months Ended
Dec. 31, 2025
Dec. 31, 2024
Dec. 31, 2023
Pay vs Performance Disclosure [Table]      
Disclosure - Pay vs Performance Disclosure
(a)  (b)   (c)   (d)   (e)   (f)   (h) 
                   Value of Initial     
           Average   Average   Fixed $100     
           Summary   Compensation   Investment     
   Summary       Compensation   Actually Paid   Based on:     
   Compensation   Compensation   Table Total   to   Total     
   Table Total for   Actually Paid to   for non-PEO   Non-PEO   Shareholder   Net 
Year  PEO ($)   PEO ($)(1)   NEOs ($)   NEOs ($)(1)   Return ($)   Loss ($) 
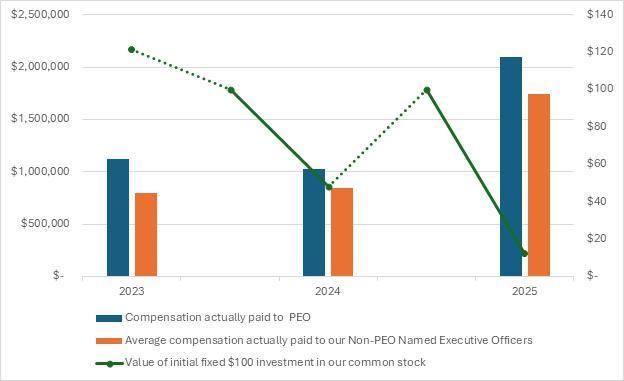
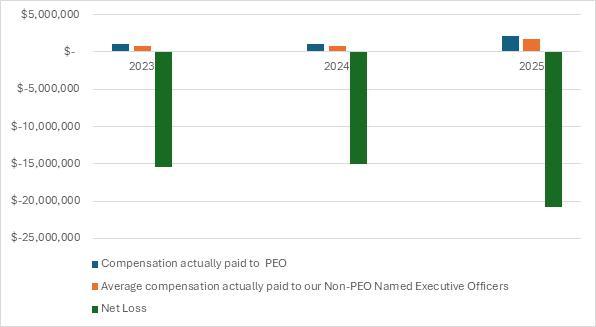
2025  $2,197,171   $2,094,767   $1,822,578   $1,742,715   $12   $(20,848,916)
2024  $1,157,217   $1,029,281   $949,640   $845,621   $48   $(15,022,027)
2023  $1,001,249   $1,122,094   $744,039   $799,786   $121   $(15,423,471)
   
PEO Total Compensation Amount $ 2,197,171 $ 1,157,217 $ 1,001,249
PEO Actually Paid Compensation Amount [1] 2,094,767 1,029,281 1,122,094
Non-PEO NEO Average Total Compensation Amount 1,822,578 949,640 744,039
Non-PEO NEO Average Compensation Actually Paid Amount [1] $ 1,742,715 845,621 799,786
Equity Valuation Assumption Difference, Footnote [Text Block]


Compensation actually paid to our NEOs represents the “Total” compensation reported in the Summary Compensation Table for the applicable fiscal year, as adjusted as follows:


Adjustments  PEO   Average non-PEO NEOs 
   2025 
Adjustments  PEO   Average non-PEO NEOs 
         
Deduction for Amounts Reported under the “Stock Awards” and “Option Awards” Columns in the Summary Compensation Table for Applicable FY  $-   $- 
           
Increase based on ASC 718 Fair Value of Awards Granted during Applicable FY that Remain Unvested as of Applicable FY End, determined as of Applicable FY End   -    - 
           
Decrease for Awards Granted during Prior FY that were Outstanding and Unvested as of Applicable FY End, determined based on change in ASC 718 Fair Value from Prior FY End to Applicable FY End   (80,936)   (67,183)
           
Increase for Awards Granted during Prior FY that Vested During Applicable FY, determined based on change in ASC 718 Fair Value from Prior FY End to Vesting Date   (21,468)   (12,680)
           
TOTAL ADJUSTMENTS  $(102,404)  $(79,863)
   
Compensation Actually Paid vs. Total Shareholder Return [Text Block]


TSR amounts reported in the graph assume an initial fixed investment of $100. We do not pay dividends.


Compensation Actually Paid vs. Net Income [Text Block]

The graph below compares the compensation actually paid to our PEO and the average of the compensation actually paid to our remaining NEOs, with our net loss for the fiscal years ended December 31, 2023, 2024 and 2025.


Total Shareholder Return Amount $ 12 48 121
Net Income (Loss) Attributable to Parent $ (20,848,916) $ (15,022,027) $ (15,423,471)
PEO Name Jeffrey A. Meckler Jeffrey A. Meckler Jeffrey A. Meckler
PEO [Member]      
Pay vs Performance Disclosure [Table]      
TOTAL ADJUSTMENTS $ (102,404)    
PEO [Member] | Deduction for Amounts Reported Under "Stock Awards" and "Option Awards" Columns in Summary Compensation Table for Applicable FY [Member]      
Pay vs Performance Disclosure [Table]      
TOTAL ADJUSTMENTS    
PEO [Member] | Increase Based on ASC 718 Fair Value of Awards Granted During Applicable FY that Remain Unvested as of Applicable FY End, Determined as of Applicable FY End [Member]      
Pay vs Performance Disclosure [Table]      
TOTAL ADJUSTMENTS    
PEO [Member] | Decrease for Awards Granted During Prior FY that Were Outstanding and Unvested as of Applicable FY End, Determined Based on Change in ASC 718 Fair Value from Prior FY End to Applicable FY End [Member]      
Pay vs Performance Disclosure [Table]      
TOTAL ADJUSTMENTS (80,936)    
PEO [Member] | Increase for Awards Granted During Prior FY that Vested During Applicable FY, Determined Based on Change in ASC 718 Fair Value From Prior FY End To Vesting Date [Member]      
Pay vs Performance Disclosure [Table]      
TOTAL ADJUSTMENTS (21,468)    
Non-PEO NEO [Member]      
Pay vs Performance Disclosure [Table]      
TOTAL ADJUSTMENTS (79,863)    
Non-PEO NEO [Member] | Deduction for Amounts Reported Under "Stock Awards" and "Option Awards" Columns in Summary Compensation Table for Applicable FY [Member]      
Pay vs Performance Disclosure [Table]      
TOTAL ADJUSTMENTS    
Non-PEO NEO [Member] | Increase Based on ASC 718 Fair Value of Awards Granted During Applicable FY that Remain Unvested as of Applicable FY End, Determined as of Applicable FY End [Member]      
Pay vs Performance Disclosure [Table]      
TOTAL ADJUSTMENTS    
Non-PEO NEO [Member] | Decrease for Awards Granted During Prior FY that Were Outstanding and Unvested as of Applicable FY End, Determined Based on Change in ASC 718 Fair Value from Prior FY End to Applicable FY End [Member]      
Pay vs Performance Disclosure [Table]      
TOTAL ADJUSTMENTS (67,183)    
Non-PEO NEO [Member] | Increase for Awards Granted During Prior FY that Vested During Applicable FY, Determined Based on Change in ASC 718 Fair Value From Prior FY End To Vesting Date [Member]      
Pay vs Performance Disclosure [Table]      
TOTAL ADJUSTMENTS $ (12,680)    
[1] Amounts represent compensation actually paid to our PEOs and the average compensation actually paid to our remaining NEOs for the relevant fiscal year, as determined under SEC rules, which includes the individuals indicated in the table below for each fiscal year: