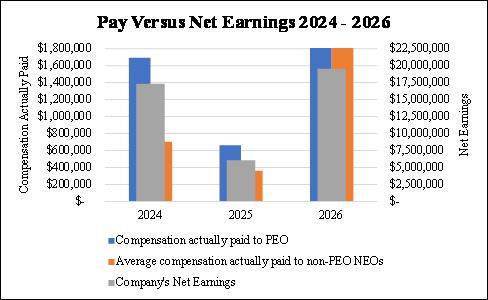
Pay Versus Performance Table
The following table sets forth information concerning the compensation of our named executive officers for each of the fiscal years ended March 31, 2026, 2025 and 2024, and our financial performance for each such fiscal year. The amounts shown for “Compensation Actually Paid” reflects the Summary Compensation Table total with certain adjustments as described below, but does not reflect compensation actually earned, realized, or received by our NEOs.
|
Year (1) |
Summary Compensation Table Total for PEO ($) |
Compensation Actually Paid to PEO ($) (2) |
Average Summary Compensation Table Total for Non-PEO NEOs ($) |
Average Compensation Actually Paid to Non-PEO NEOs ($) (2) |
Value of Initial Fixed $100 Investment Based on Total Shareholder Return ($) |
Net Earnings ($) |
||||||||||||
|
2026 |
2,709,607 | 2,874,307 | 1,936,534 | 1,855,808 | 156.88 | 19,533,000 | ||||||||||||
|
2025 |
700,734 | 662,234 | 365,704 | 361,854 | 131.31 | 6,085,000 | ||||||||||||
|
2024 |
1,614,524 | 1,693,724 | 693,581 | 701,501 | 165.26 | 17,345,000 |
(1) For each fiscal year shown, our principal executive officers, or PEOs and our remaining NEOs or Non-PEO NEOs, represent the following individuals:
|
Year |
PEOs |
Non-PEO NEOs |
|
2026 |
Michael J. Taylor |
Alex LaRue, Gaurav Chhibbar |
|
2025 |
Michael J. Taylor |
Alex LaRue |
|
2024 |
Michael J. Taylor |
Alex LaRue |
(2) Amounts represent compensation actually paid to our PEO and the average compensation actually paid to our Non-PEO NEOs for the relevant fiscal year as determined under Item 402(v)(2)(iii) of Regulation S-K to calculate “compensation actually paid”, which include the following adjustments:
|
Compensation actually paid to PEO and average compensation actually paid to Non-PEO NEOs |
|
As Reported in Summary Compensation Table(a) |
Equity Award Adjustments |
|||||||||||||||||||||||||||
|
Year |
Total Compensation ($) |
Deduct Stock and Option Awards ($) |
Add Fair Value as of Year End of Awards Granted During Year that Remain Outstanding and Unvested as of Year End(b) ($) |
Add Year over Year Change in Fair Value of Awards Granted in Prior Year that Remain Outstanding and Unvested as of Year End(c) ($) |
Add Fair Value as of Vesting Date of Awards Granted During Year that Vested During Year(d) ($) |
Add Year over Year Change in Fair Value of Awards Granted in Prior Year that Vest During Year(e) ($) |
Compensation “Actually Paid” (f) ($) |
|||||||||||||||||||||
|
PEO |
||||||||||||||||||||||||||||
|
2026 |
2,709,607 | (718,234 | ) | 887,934 | - | - | (5,000 | ) | 2,874,307 | |||||||||||||||||||
|
2025 |
700,734 | - | - | (38,500 | ) | - | - | 662,234 | ||||||||||||||||||||
|
2024 |
1,614,524 | - | - | 74,000 | - | 5,200 | 1,693,724 | |||||||||||||||||||||
|
Non-PEO NEOs |
||||||||||||||||||||||||||||
|
2026 |
1,936,534 | (683,593 | ) | 603,152 | - | - | (286 | ) | 1,855,808 | |||||||||||||||||||
|
2025 |
365,704 | - | - | (3,850 | ) | - | - | 361,854 | ||||||||||||||||||||
|
2024 |
693,581 | - | - | 7,400 | - | 520 | 701,501 | |||||||||||||||||||||
|
(a) |
Reflects, for our PEO, the applicable amounts reported in the Summary Compensation Table and for the Non-PEO NEOs, the average of the applicable amounts reported in the Summary Compensation Table in each of the fiscal years indicated. |
|
|
(b) |
Reflects either (i) the fair value, with respect to our PEO, or (ii) the average of the fair value, with respect to the Non-PEO NEOs, in each case as of March 31 of the covered fiscal year of awards granted in the covered fiscal year that remained outstanding and unvested (in whole or in part) as of the end of the covered fiscal year. |
|
|
(c) |
Reflects either (i) the change in fair value, with respect to our PEO, or (ii) the average of the change in fair value, with respect to the Non-PEO NEOs, in each case from March 31 of the prior fiscal year to March 31 of the covered fiscal year of awards granted in a prior fiscal year that remained outstanding and unvested (in whole or in part) as of the end of the covered fiscal year. |
|
|
(d) |
Reflects either (i) the fair value, with respect to our PEO, or (ii) the average of the fair value, with respect to the Non-PEO NEOs, in each case, as of the day awards became vested in the covered fiscal year, when such awards were also granted in the covered fiscal year. |
|
|
(e) |
Reflects either (i) the change in fair value, with respect to our PEO, or (ii) the average of the change in fair value, with respect to the Non-PEO NEOs, in each case from March 31 of the prior fiscal year to the day awards became vested in the covered fiscal year, when such awards were granted in a prior fiscal year. |
|
|
(f) |
Reflects, for our PEO, the total compensation actually paid and for the Non-PEO NEOs, the average total compensation actually paid in each of the fiscal years indicated. |
|
|
|
|
Compensation actually paid to PEO and average compensation actually paid to Non-PEO NEOs |
|
As Reported in Summary Compensation Table(a) |
Equity Award Adjustments |
|||||||||||||||||||||||||||
|
Year |
Total Compensation ($) |
Deduct Stock and Option Awards ($) |
Add Fair Value as of Year End of Awards Granted During Year that Remain Outstanding and Unvested as of Year End(b) ($) |
Add Year over Year Change in Fair Value of Awards Granted in Prior Year that Remain Outstanding and Unvested as of Year End(c) ($) |
Add Fair Value as of Vesting Date of Awards Granted During Year that Vested During Year(d) ($) |
Add Year over Year Change in Fair Value of Awards Granted in Prior Year that Vest During Year(e) ($) |
Compensation “Actually Paid” (f) ($) |
|||||||||||||||||||||
|
PEO |
||||||||||||||||||||||||||||
|
2026 |
2,709,607 | (718,234 | ) | 887,934 | - | - | (5,000 | ) | 2,874,307 | |||||||||||||||||||
|
2025 |
700,734 | - | - | (38,500 | ) | - | - | 662,234 | ||||||||||||||||||||
|
2024 |
1,614,524 | - | - | 74,000 | - | 5,200 | 1,693,724 | |||||||||||||||||||||
|
Non-PEO NEOs |
||||||||||||||||||||||||||||
|
2026 |
1,936,534 | (683,593 | ) | 603,152 | - | - | (286 | ) | 1,855,808 | |||||||||||||||||||
|
2025 |
365,704 | - | - | (3,850 | ) | - | - | 361,854 | ||||||||||||||||||||
|
2024 |
693,581 | - | - | 7,400 | - | 520 | 701,501 | |||||||||||||||||||||
|
(a) |
Reflects, for our PEO, the applicable amounts reported in the Summary Compensation Table and for the Non-PEO NEOs, the average of the applicable amounts reported in the Summary Compensation Table in each of the fiscal years indicated. |
|
|
(b) |
Reflects either (i) the fair value, with respect to our PEO, or (ii) the average of the fair value, with respect to the Non-PEO NEOs, in each case as of March 31 of the covered fiscal year of awards granted in the covered fiscal year that remained outstanding and unvested (in whole or in part) as of the end of the covered fiscal year. |
|
|
(c) |
Reflects either (i) the change in fair value, with respect to our PEO, or (ii) the average of the change in fair value, with respect to the Non-PEO NEOs, in each case from March 31 of the prior fiscal year to March 31 of the covered fiscal year of awards granted in a prior fiscal year that remained outstanding and unvested (in whole or in part) as of the end of the covered fiscal year. |
|
|
(d) |
Reflects either (i) the fair value, with respect to our PEO, or (ii) the average of the fair value, with respect to the Non-PEO NEOs, in each case, as of the day awards became vested in the covered fiscal year, when such awards were also granted in the covered fiscal year. |
|
|
(e) |
Reflects either (i) the change in fair value, with respect to our PEO, or (ii) the average of the change in fair value, with respect to the Non-PEO NEOs, in each case from March 31 of the prior fiscal year to the day awards became vested in the covered fiscal year, when such awards were granted in a prior fiscal year. |
|
|
(f) |
Reflects, for our PEO, the total compensation actually paid and for the Non-PEO NEOs, the average total compensation actually paid in each of the fiscal years indicated. |
|
|
|
Relationship Between Pay and Financial Performance Measures
The graph below compares the compensation actually paid to our PEO and the average of the compensation actually paid to our Non-PEO NEOs, with our cumulative total shareholder return, or TSR, for the fiscal years ended March 31, 2026, 2025 and 2024. TSR amounts reported in the graph assume an initial fixed investment of $100.
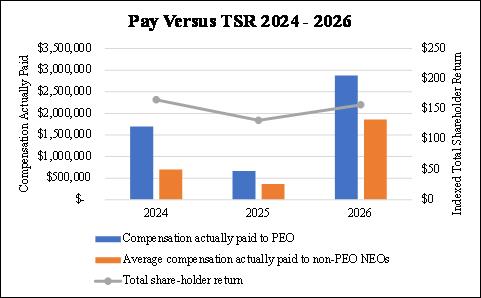
The graph below compares the compensation actually paid to our PEOs and the average of the compensation actually paid to our Non-PEO NEOs, with our net income, for the fiscal years ended March 31, 2026, 2025 and 2024.