Pay vs. Performance
As required by Section 953(a) of the Dodd-Frank Wall Street Reform and Consumer Protection Act, and Item 402(v) of Regulation S-K, we are providing the following information about the relationship between executive compensation actually paid (as defined by SEC rules) ("CAP") and certain financial performance measures of the Company. For further information concerning our pay for performance philosophy and how we align executive compensation with the Company’s performance, refer to the Compensation Discussion & Analysis section of this Proxy Statement.
Pay vs. Performance Table
|
|
|
|
|
|
|
|
Average |
|
|
Average |
|
|
|
|
|
|
|
|
|
|
|
|
|
||||||||
|
|
|
|
|
|
|
|
Summary |
|
|
Compensation |
|
|
Value of Initial Fixed $100 |
|
|
|
|
|
|
|
|||||||||||
|
|
|
|
|
|
|
|
Compensation |
|
|
Actually Paid |
|
|
Investment Based On: |
|
|
|
|
|
|
|
|||||||||||
|
|
Summary |
|
|
Compensation |
|
|
Table Total for Non- |
|
|
to Non-PEO |
|
|
|
|
|
Peer Group |
|
|
|
|
|
Adjusted |
|
||||||||
|
|
Compensation |
|
|
Actually Paid |
|
|
PEO Named |
|
|
Named |
|
|
Total |
|
|
Total |
|
|
|
|
|
Operating |
|
||||||||
|
|
Table Total for |
|
|
to CEO/PEO |
|
|
Executive |
|
|
Executive |
|
|
Shareholder |
|
|
Shareholder |
|
|
Net Income |
|
|
Income |
|
||||||||
Fiscal Year(1) |
|
CEO/PEO ($) |
|
|
($)(2) |
|
|
Officers ($) |
|
|
Officers ($)(2) |
|
|
Return ($) |
|
|
Return ($)(3) |
|
|
($ millions) |
|
|
($ millions)(4) |
|
||||||||
2026 |
|
|
22,157,635 |
|
|
|
22,535,504 |
|
|
|
15,872,198 |
|
|
|
15,599,191 |
|
|
|
163.57 |
|
|
|
260.29 |
|
|
|
1,276 |
|
|
|
1,706 |
|
2025 |
|
|
23,127,224 |
|
|
|
4,745,188 |
|
|
|
10,520,090 |
|
|
|
5,324,959 |
|
|
|
130.57 |
|
|
|
171.25 |
|
|
|
1,186 |
|
|
|
1,476 |
|
2024 |
|
|
17,735,436 |
|
|
|
39,826,957 |
|
|
|
7,021,089 |
|
|
|
16,378,259 |
|
|
|
146.70 |
|
|
|
154.18 |
|
|
|
986 |
|
|
|
1,325 |
|
2023 |
|
|
11,364,543 |
|
|
|
(3,136,331 |
) |
|
|
4,881,517 |
|
|
|
3,271,722 |
|
|
|
88.91 |
|
|
|
110.13 |
|
|
|
1,274 |
|
|
|
1,227 |
|
2022 |
|
|
18,883,551 |
|
|
|
17,384,526 |
|
|
|
8,466,683 |
|
|
|
4,539,483 |
|
|
|
100.38 |
|
|
|
101.89 |
|
|
|
937 |
|
|
|
1,251 |
|
|
|
|
|
|
|
|
|
FY 2026 ($) |
|
|||||
Total Equity Award Adjustments to Determine Compensation “Actually Paid” |
|
CEO/PEO |
|
|
Average Non-PEO |
|
||||||||
Total Reported in Summary Compensation Table |
|
|
22,157,635 |
|
|
|
15,872,198 |
|
||||||
Less change in actuarial present value reported under the “Change in Pension Value and Nonqualified Deferred Compensation Earnings” column of the summary compensation table |
|
|
— |
|
|
|
— |
|
||||||
Plus “service cost” for pension plans |
|
|
— |
|
|
|
— |
|
||||||
Less for amounts reported under the “Stock Awards” column in the summary compensation table |
|
|
(19,552,872 |
) |
|
|
(13,683,653 |
) |
||||||
Less for amounts reported under the “Option Awards” column in the summary compensation table |
|
|
— |
|
|
|
— |
|
||||||
Plus the fair value of awards as of the end of the covered year granted during the covered year that remain outstanding and unvested as of year-end |
|
|
15,773,672 |
|
|
|
11,276,756 |
|
||||||
Plus the change in fair value from prior year-end to current year-end of awards granted prior to covered year that were outstanding and unvested as of year-end |
|
|
314,897 |
|
|
|
323,493 |
|
||||||
Plus fair value for awards that are granted and vested in the covered year |
|
|
2,538,822 |
|
|
|
1,452,179 |
|
||||||
Plus the change in fair value from prior year-end to vesting date of awards granted prior to covered year that vested during covered year |
|
|
1,303,350 |
|
|
|
358,218 |
|
||||||
Less the fair value as of prior year-end of awards granted prior to covered year that were forfeited during covered year |
|
|
— |
|
|
|
— |
|
||||||
Plus the dollar value of any dividends or other earnings paid on awards in the covered year prior to the vesting date that are not otherwise included |
|
|
— |
|
|
|
— |
|
||||||
Total Equity Award Adjustments |
|
|
377,869 |
|
|
|
(273,007 |
) |
||||||
Compensation Actually Paid |
|
|
22,535,504 |
|
|
|
15,599,191 |
|
||||||
"Compensation Actually Paid" represents a nuanced calculation that includes the increase or decrease in value of certain elements of compensation over each fiscal year, including compensation granted in a prior year, in accordance with Item 402(v) of Regulation S-K. The amount of compensation ultimately received may, in fact, be different from the amounts disclosed in these columns of the Pay vs. Performance Table.
|
|
|
|
|
|
|
|
FY 2026 ($) |
|
|||||
Total Equity Award Adjustments to Determine Compensation “Actually Paid” |
|
CEO/PEO |
|
|
Average Non-PEO |
|
||||||||
Total Reported in Summary Compensation Table |
|
|
22,157,635 |
|
|
|
15,872,198 |
|
||||||
Less change in actuarial present value reported under the “Change in Pension Value and Nonqualified Deferred Compensation Earnings” column of the summary compensation table |
|
|
— |
|
|
|
— |
|
||||||
Plus “service cost” for pension plans |
|
|
— |
|
|
|
— |
|
||||||
Less for amounts reported under the “Stock Awards” column in the summary compensation table |
|
|
(19,552,872 |
) |
|
|
(13,683,653 |
) |
||||||
Less for amounts reported under the “Option Awards” column in the summary compensation table |
|
|
— |
|
|
|
— |
|
||||||
Plus the fair value of awards as of the end of the covered year granted during the covered year that remain outstanding and unvested as of year-end |
|
|
15,773,672 |
|
|
|
11,276,756 |
|
||||||
Plus the change in fair value from prior year-end to current year-end of awards granted prior to covered year that were outstanding and unvested as of year-end |
|
|
314,897 |
|
|
|
323,493 |
|
||||||
Plus fair value for awards that are granted and vested in the covered year |
|
|
2,538,822 |
|
|
|
1,452,179 |
|
||||||
Plus the change in fair value from prior year-end to vesting date of awards granted prior to covered year that vested during covered year |
|
|
1,303,350 |
|
|
|
358,218 |
|
||||||
Less the fair value as of prior year-end of awards granted prior to covered year that were forfeited during covered year |
|
|
— |
|
|
|
— |
|
||||||
Plus the dollar value of any dividends or other earnings paid on awards in the covered year prior to the vesting date that are not otherwise included |
|
|
— |
|
|
|
— |
|
||||||
Total Equity Award Adjustments |
|
|
377,869 |
|
|
|
(273,007 |
) |
||||||
Compensation Actually Paid |
|
|
22,535,504 |
|
|
|
15,599,191 |
|
||||||
"Compensation Actually Paid" represents a nuanced calculation that includes the increase or decrease in value of certain elements of compensation over each fiscal year, including compensation granted in a prior year, in accordance with Item 402(v) of Regulation S-K. The amount of compensation ultimately received may, in fact, be different from the amounts disclosed in these columns of the Pay vs. Performance Table.
|
|
|
|
|
|
|
|
FY 2026 ($) |
|
|||||
Total Equity Award Adjustments to Determine Compensation “Actually Paid” |
|
CEO/PEO |
|
|
Average Non-PEO |
|
||||||||
Total Reported in Summary Compensation Table |
|
|
22,157,635 |
|
|
|
15,872,198 |
|
||||||
Less change in actuarial present value reported under the “Change in Pension Value and Nonqualified Deferred Compensation Earnings” column of the summary compensation table |
|
|
— |
|
|
|
— |
|
||||||
Plus “service cost” for pension plans |
|
|
— |
|
|
|
— |
|
||||||
Less for amounts reported under the “Stock Awards” column in the summary compensation table |
|
|
(19,552,872 |
) |
|
|
(13,683,653 |
) |
||||||
Less for amounts reported under the “Option Awards” column in the summary compensation table |
|
|
— |
|
|
|
— |
|
||||||
Plus the fair value of awards as of the end of the covered year granted during the covered year that remain outstanding and unvested as of year-end |
|
|
15,773,672 |
|
|
|
11,276,756 |
|
||||||
Plus the change in fair value from prior year-end to current year-end of awards granted prior to covered year that were outstanding and unvested as of year-end |
|
|
314,897 |
|
|
|
323,493 |
|
||||||
Plus fair value for awards that are granted and vested in the covered year |
|
|
2,538,822 |
|
|
|
1,452,179 |
|
||||||
Plus the change in fair value from prior year-end to vesting date of awards granted prior to covered year that vested during covered year |
|
|
1,303,350 |
|
|
|
358,218 |
|
||||||
Less the fair value as of prior year-end of awards granted prior to covered year that were forfeited during covered year |
|
|
— |
|
|
|
— |
|
||||||
Plus the dollar value of any dividends or other earnings paid on awards in the covered year prior to the vesting date that are not otherwise included |
|
|
— |
|
|
|
— |
|
||||||
Total Equity Award Adjustments |
|
|
377,869 |
|
|
|
(273,007 |
) |
||||||
Compensation Actually Paid |
|
|
22,535,504 |
|
|
|
15,599,191 |
|
||||||
"Compensation Actually Paid" represents a nuanced calculation that includes the increase or decrease in value of certain elements of compensation over each fiscal year, including compensation granted in a prior year, in accordance with Item 402(v) of Regulation S-K. The amount of compensation ultimately received may, in fact, be different from the amounts disclosed in these columns of the Pay vs. Performance Table.
CAP and TSR
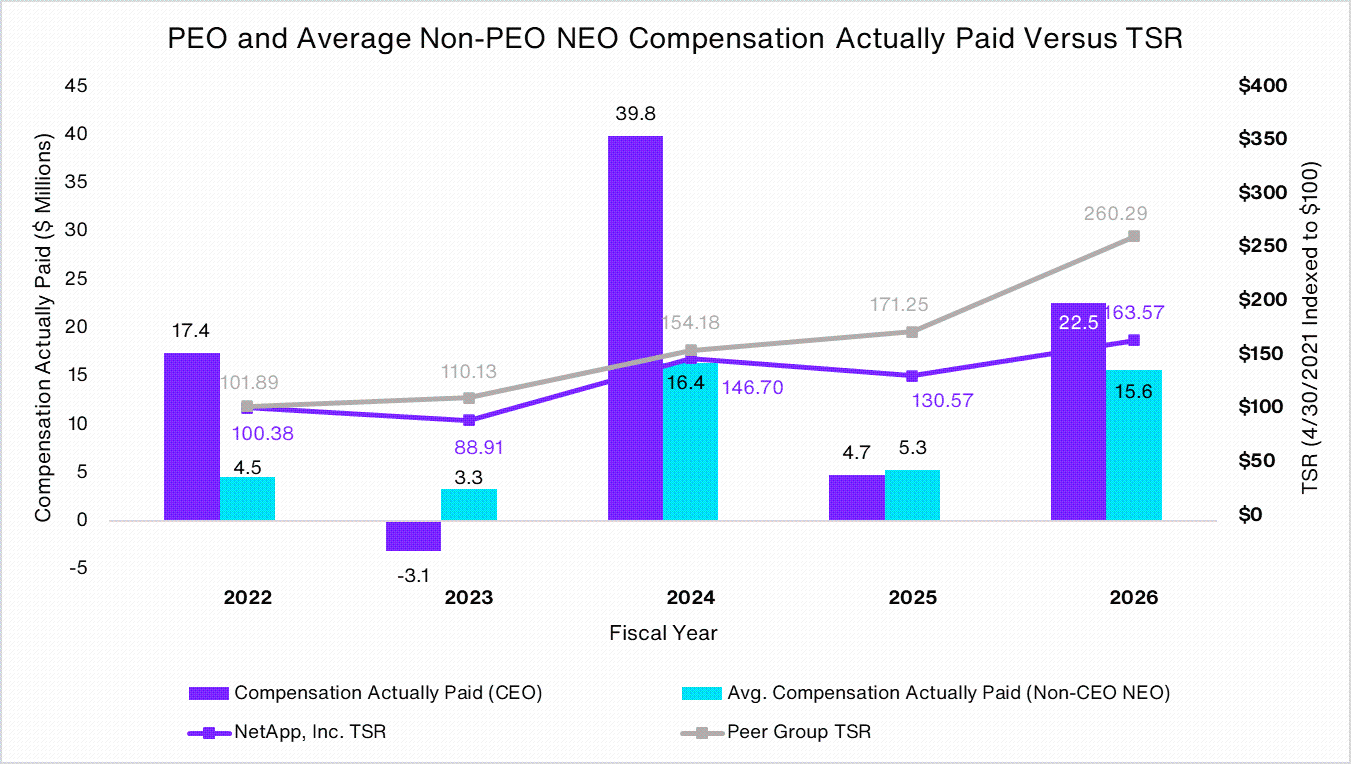
The graph below shows the relationship between (i) the total return to stockholders on our common stock and the return on the S&P 500 Information Technology Sector through the end of the listed fiscal year, in each case assuming that $100 was invested in our common stock and in the S&P 500 Information Technology Sector on April 30, 2021 and that any dividends were reinvested, and (ii) the CAP for our CEO/PEO and the average CAP for our non-PEO NEOs for each of fiscal 2026, 2025, 2024, 2023 and 2022.
Relationship Between Compensation Actually Paid and Company/Peer Group Total Shareholder Return
CAP and Net Income
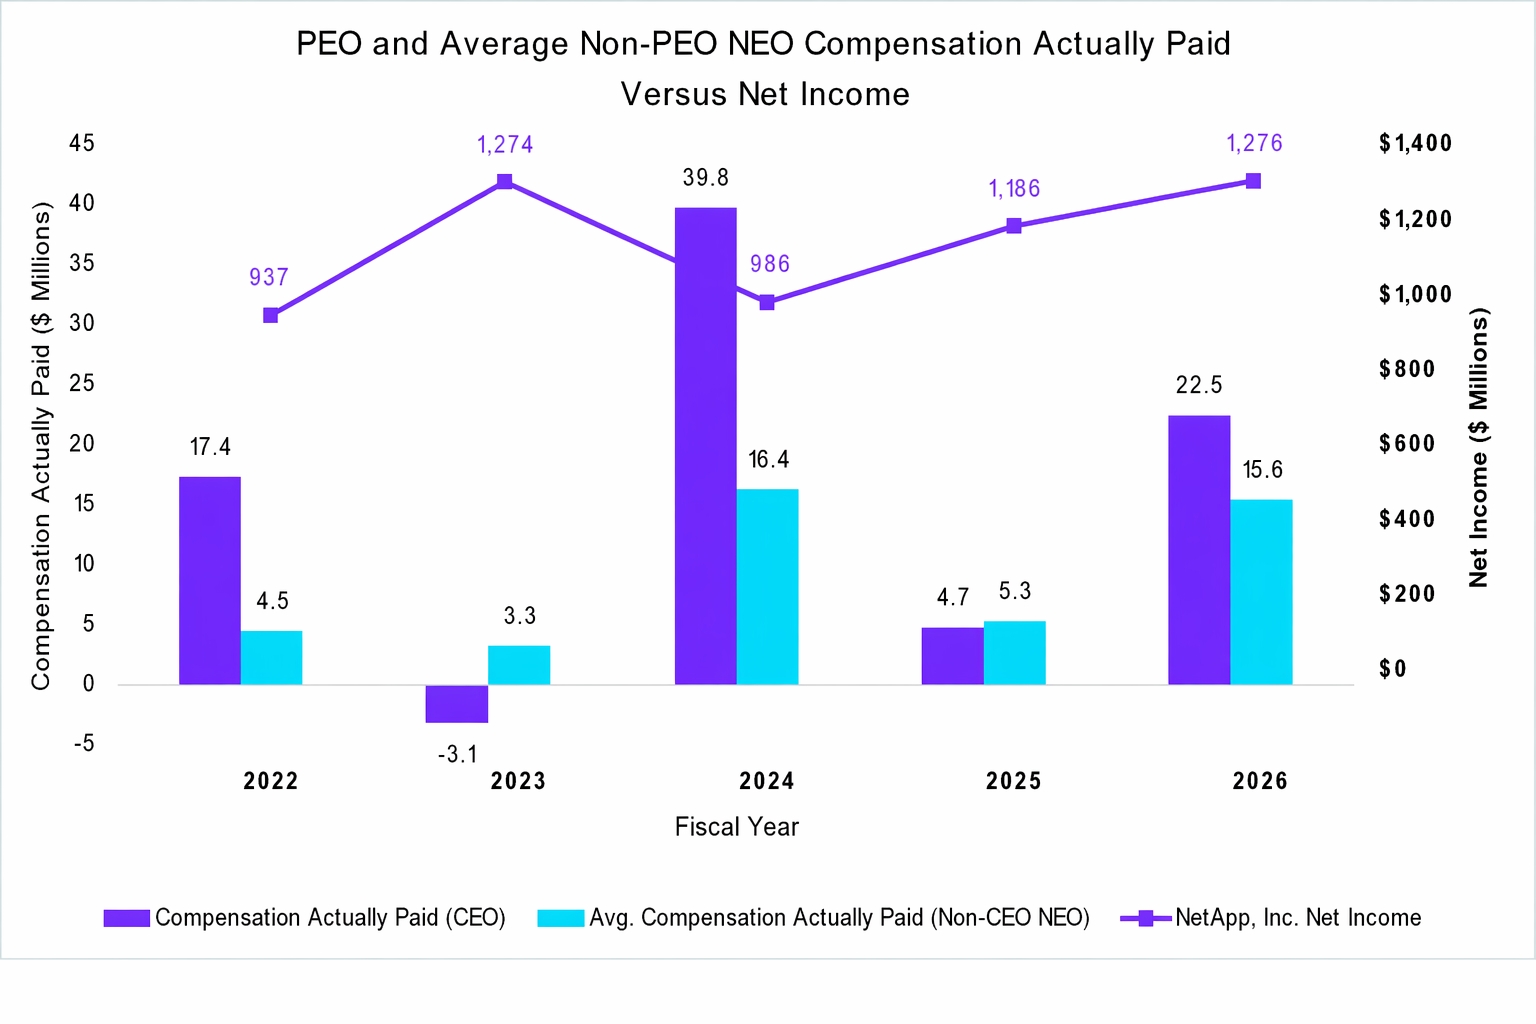
The graph below shows the relationship between our net income and the CAP for our CEO/PEO and the average CAP for our non-PEO NEOs for each of fiscal 2026, 2025, 2024, 2023 and 2022.
Relationship Between Compensation Actually Paid and Net Income
CAP and Adjusted Operating Income
The graph below shows the relationship between our Adjusted Operating Income and the CAP for our CEO/PEO and the average CAP for our non-PEO NEOs for each of fiscal 2026, 2025, 2024, 2023 and 2022.
Relationship Between Compensation Actually Paid and Adjusted Operating Income
Financial Performance Measures
As described in greater detail in the Compensation Discussion & Analysis section of this Proxy Statement, the Company’s executive compensation program reflects a pay-for-performance philosophy. We utilize metrics for our short- and long-term incentive compensation programs based on an objective of driving profitable growth and increasing stockholder value. Listed below are the financial and non-financial performance measures which in our assessment represent the most important performance measures we used to link compensation actually paid to our NEOs, including our CEO, for fiscal 2026, to Company performance.
These measures are not ranked by importance.
Adjusted Operating Income* |
Revenue |
Billings** |
Relative Total Shareholder Return |
* Adjusted Operating Income is calculated as non-GAAP operating income less stock-based compensation expense. For a reconciliation of Adjusted Operating Income to the most directly comparable GAAP financial measure and insight into how Adjusted Operating Income is considered by management, please see Annex A to this Proxy Statement.
** Billings is not prepared in accordance with GAAP. A definition of Billings can be found in the Long-Term Equity Incentive Compensation -- PBRSUs section on page 48 above.