
Exhibit 99.2 Q2 2026 Earnings Presentation July 16, 2026
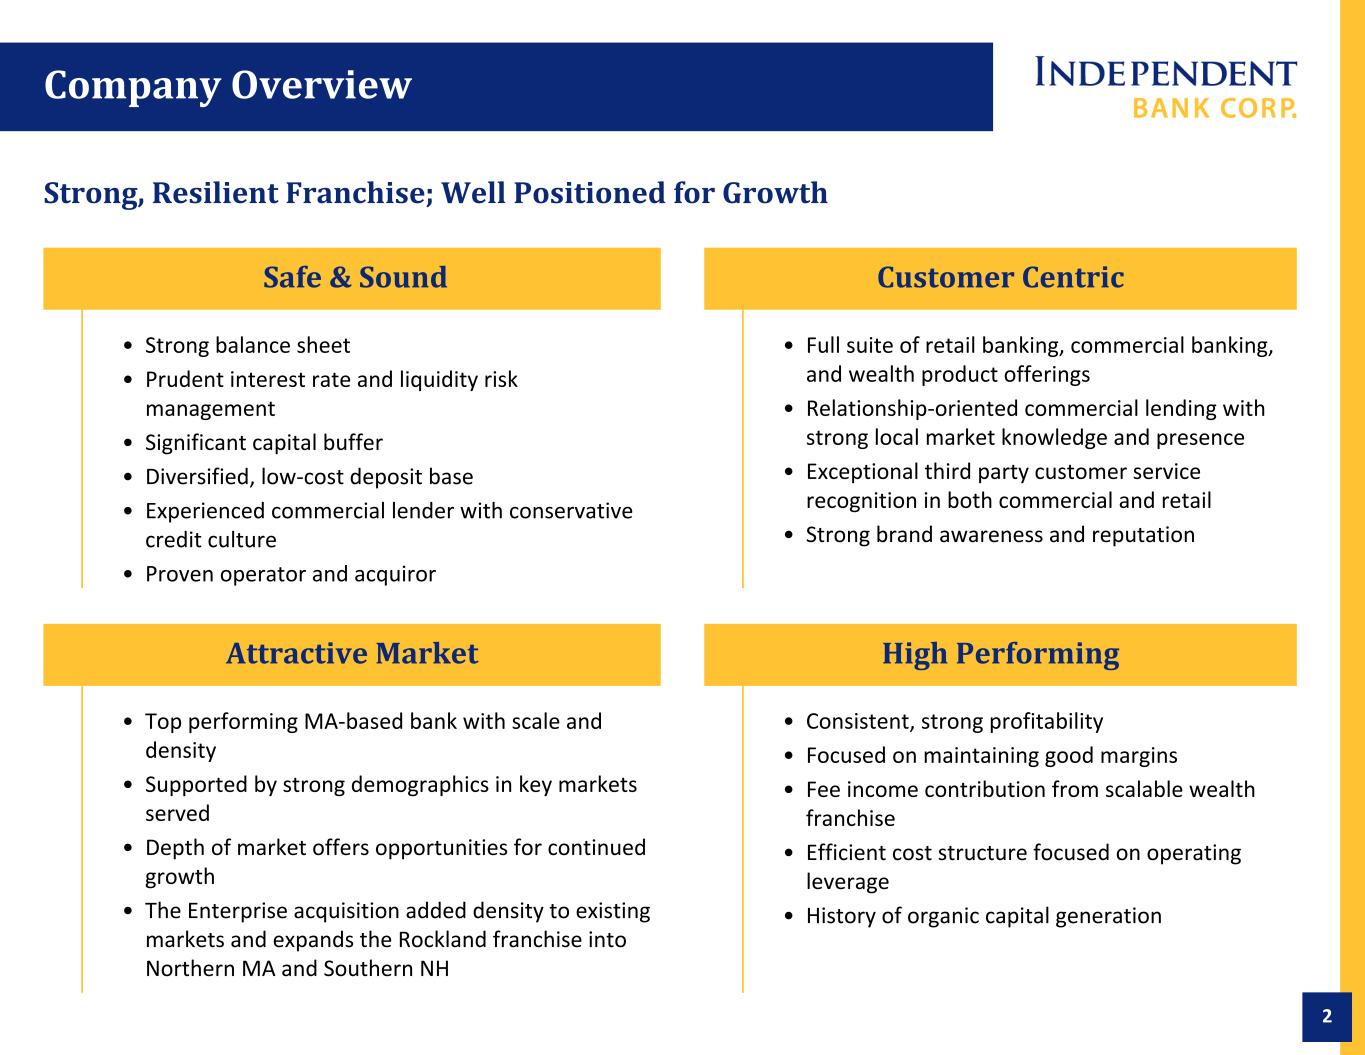
2 Safe & Sound Customer Centric • Full suite of retail banking, commercial banking, and wealth product offerings • Relationship-oriented commercial lending with strong local market knowledge and presence • Exceptional third party customer service recognition in both commercial and retail • Strong brand awareness and reputation Attractive Market • Top performing MA-based bank with scale and density • Supported by strong demographics in key markets served • Depth of market offers opportunities for continued growth • The Enterprise acquisition added density to existing markets and expands the Rockland franchise into Northern MA and Southern NH Strong, Resilient Franchise; Well Positioned for Growth High Performing • Consistent, strong profitability • Focused on maintaining good margins • Fee income contribution from scalable wealth franchise • Efficient cost structure focused on operating leverage • History of organic capital generation • Strong balance sheet • Prudent interest rate and liquidity risk management • Significant capital buffer • Diversified, low-cost deposit base • Experienced commercial lender with conservative credit culture • Proven operator and acquiror Company Overview
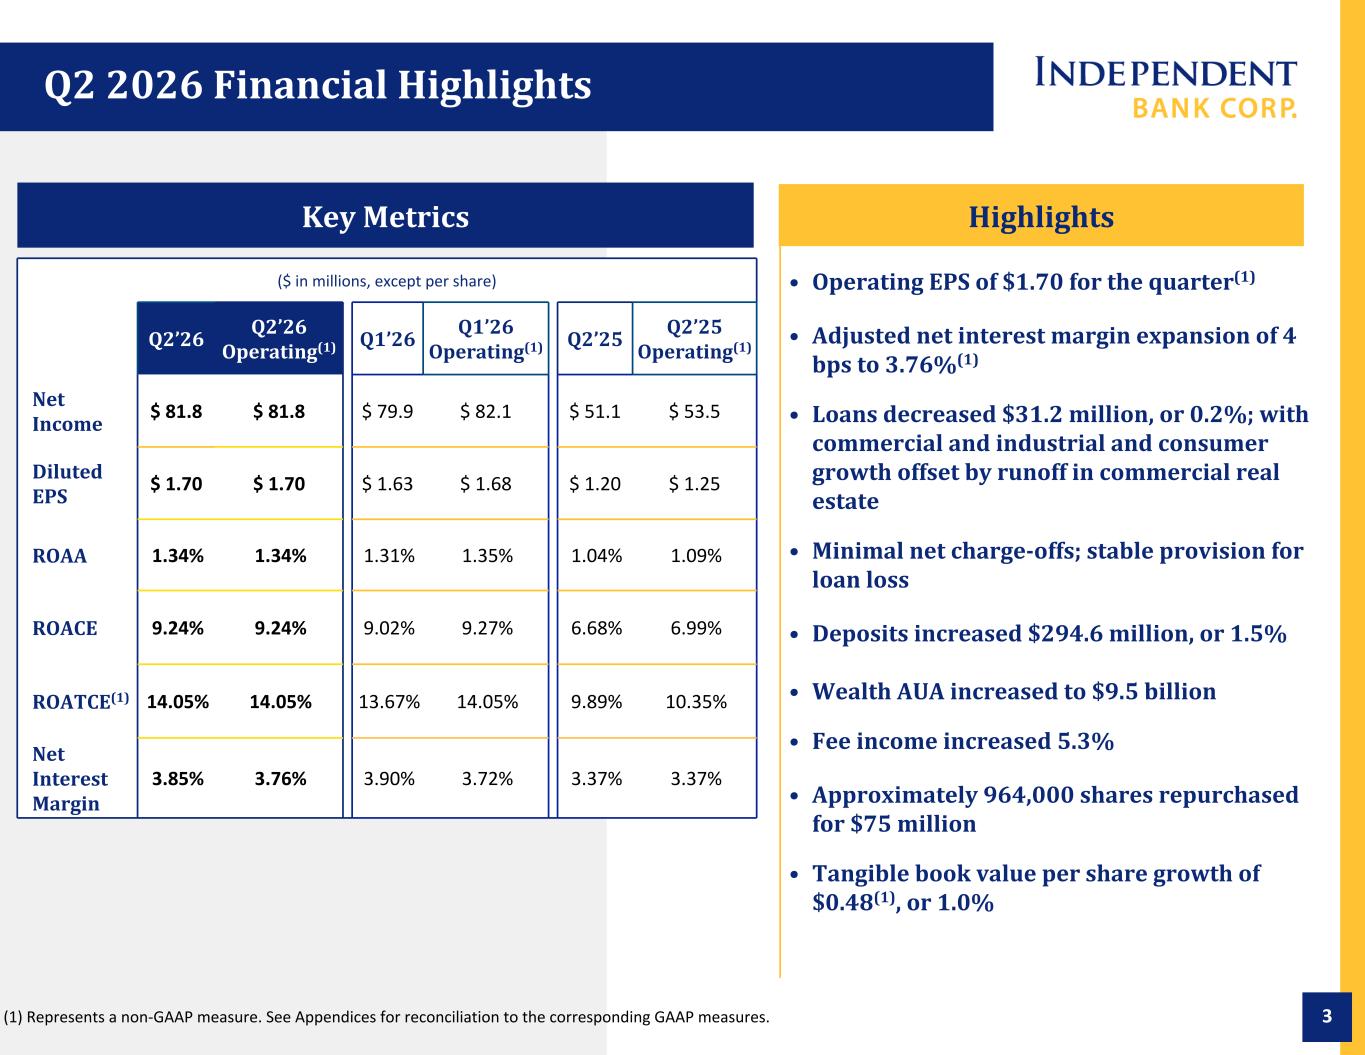
3 ($ in millions, except per share) Q2’26 Q2’26 Operating(1) Q1’26 Q1’26 Operating(1) Q2’25 Q2’25 Operating(1) Net Income $ 81.8 $ 81.8 $ 79.9 $ 82.1 $ 51.1 $ 53.5 Diluted EPS $ 1.70 $ 1.70 $ 1.63 $ 1.68 $ 1.20 $ 1.25 ROAA 1.34% 1.34% 1.31% 1.35% 1.04% 1.09% ROACE 9.24% 9.24% 9.02% 9.27% 6.68% 6.99% ROATCE(1) 14.05% 14.05% 13.67% 14.05% 9.89% 10.35% Net Interest Margin 3.85% 3.76% 3.90% 3.72% 3.37% 3.37% Q2 2026 Financial Highlights Key Metrics Highlights • Operating EPS of $1.70 for the quarter(1) • Adjusted net interest margin expansion of 4 bps to 3.76%(1) • Loans decreased $31.2 million, or 0.2%; with commercial and industrial and consumer growth offset by runoff in commercial real estate • Minimal net charge-offs; stable provision for loan loss • Deposits increased $294.6 million, or 1.5% • Wealth AUA increased to $9.5 billion • Fee income increased 5.3% • Approximately 964,000 shares repurchased for $75 million • Tangible book value per share growth of $0.48(1), or 1.0% (1) Represents a non-GAAP measure. See Appendices for reconciliation to the corresponding GAAP measures.
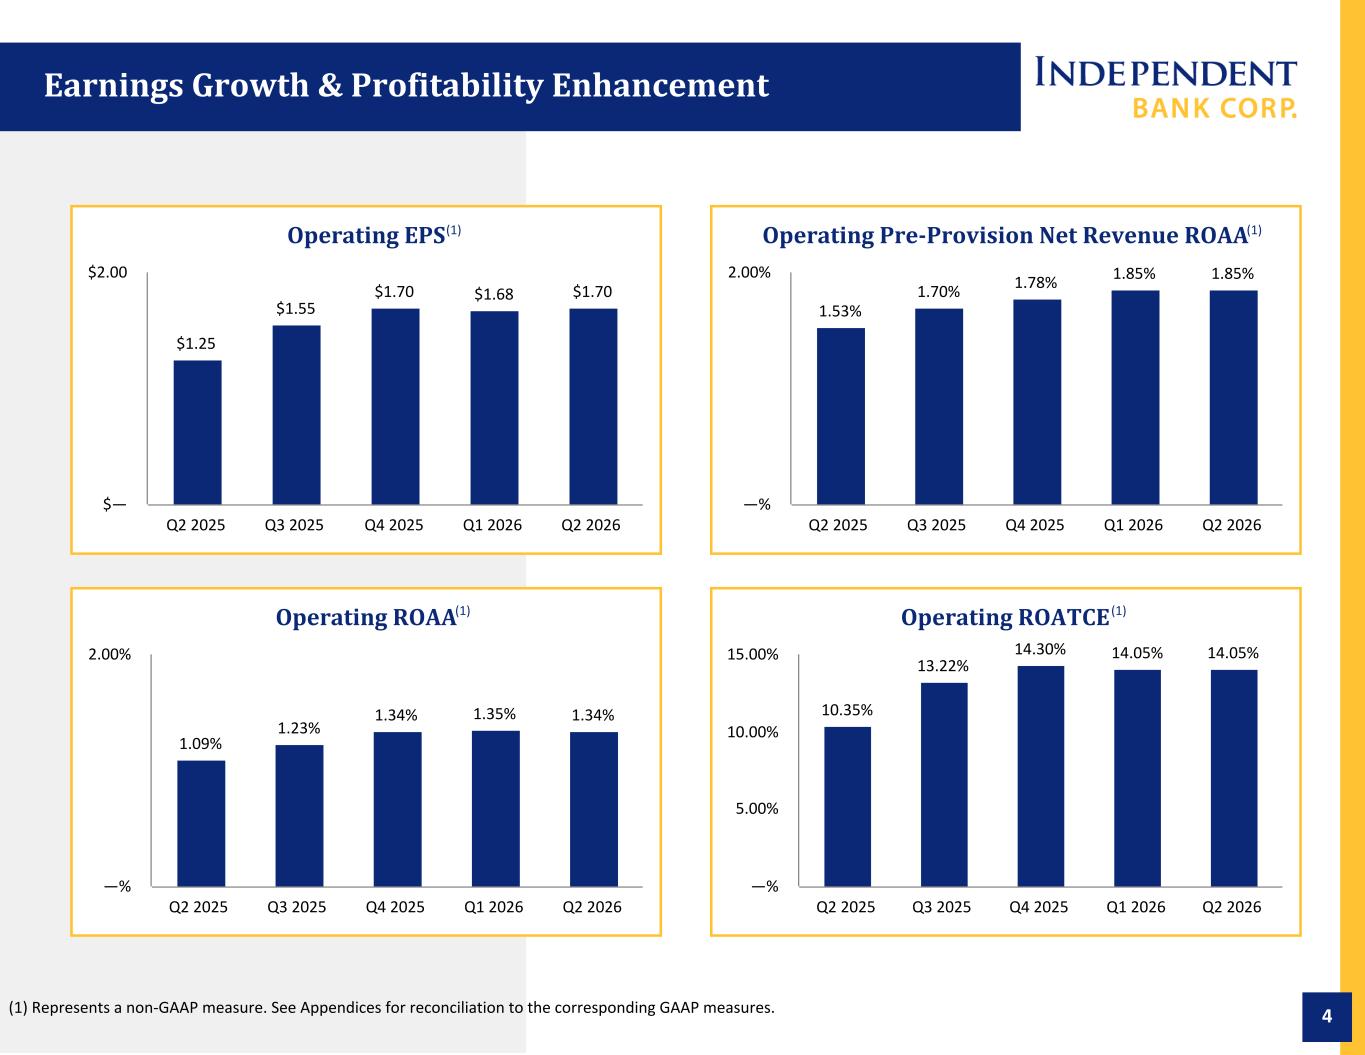
4 Earnings Growth & Profitability Enhancement (1) Represents a non-GAAP measure. See Appendices for reconciliation to the corresponding GAAP measures. Operating Pre-Provision Net Revenue ROAA 1.53% 1.70% 1.78% 1.85% 1.85% Q2 2025 Q3 2025 Q4 2025 Q1 2026 Q2 2026 —% 2.00% Operating ROAA 1.09% 1.23% 1.34% 1.35% 1.34% Q2 2025 Q3 2025 Q4 2025 Q1 2026 Q2 2026 —% 2.00% Operating ROATCE 10.35% 13.22% 14.30% 14.05% 14.05% Q2 2025 Q3 2025 Q4 2025 Q1 2026 Q2 2026 —% 5.00% 10.00% 15.00% Operating EPS $1.25 $1.55 $1.70 $1.68 $1.70 Q2 2025 Q3 2025 Q4 2025 Q1 2026 Q2 2026 $— $2.00 (1) (1) (1) (1)
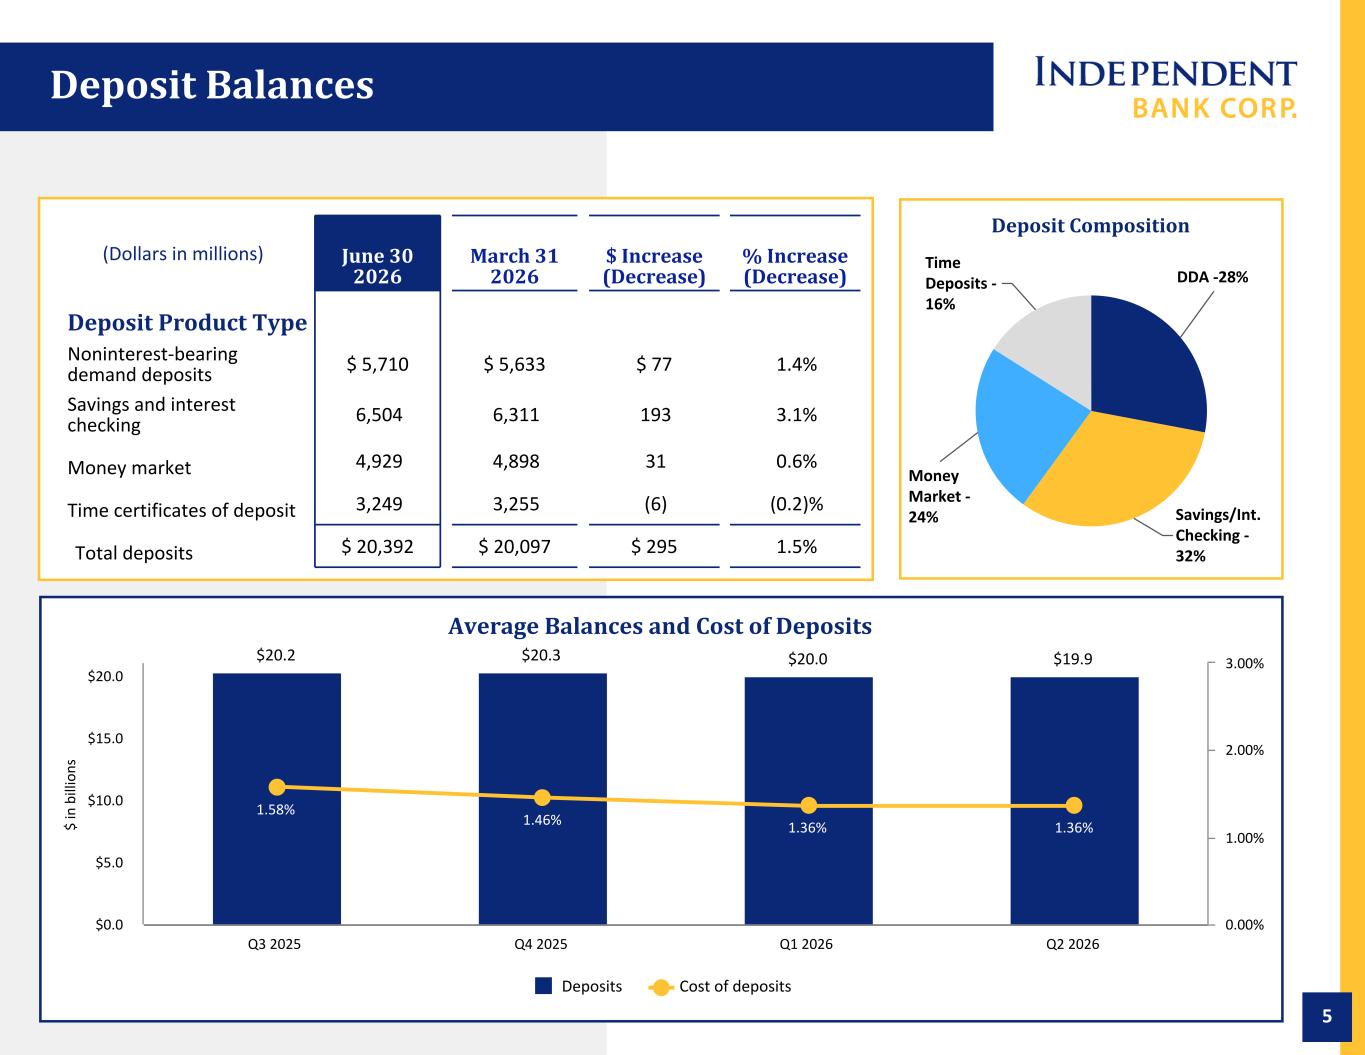
5 Deposit Balances (Dollars in millions) June 30 2026 March 31 2026 $ Increase (Decrease) % Increase (Decrease) Deposit Product Type Noninterest-bearing demand deposits $ 5,710 $ 5,633 $ 77 1.4% Savings and interest checking 6,504 6,311 193 3.1% Money market 4,929 4,898 31 0.6% Time certificates of deposit 3,249 3,255 (6) (0.2)% Total deposits $ 20,392 $ 20,097 $ 295 1.5% $ in b ill io ns Average Balances and Cost of Deposits $20.2 $20.3 $20.0 $19.9 1.58% 1.46% 1.36% 1.36% Deposits Cost of deposits Q3 2025 Q4 2025 Q1 2026 Q2 2026 $0.0 $5.0 $10.0 $15.0 $20.0 0.00% 1.00% 2.00% 3.00% Deposit Composition DDA -28% Savings/Int. Checking - 32% Money Market - 24% Time Deposits - 16%
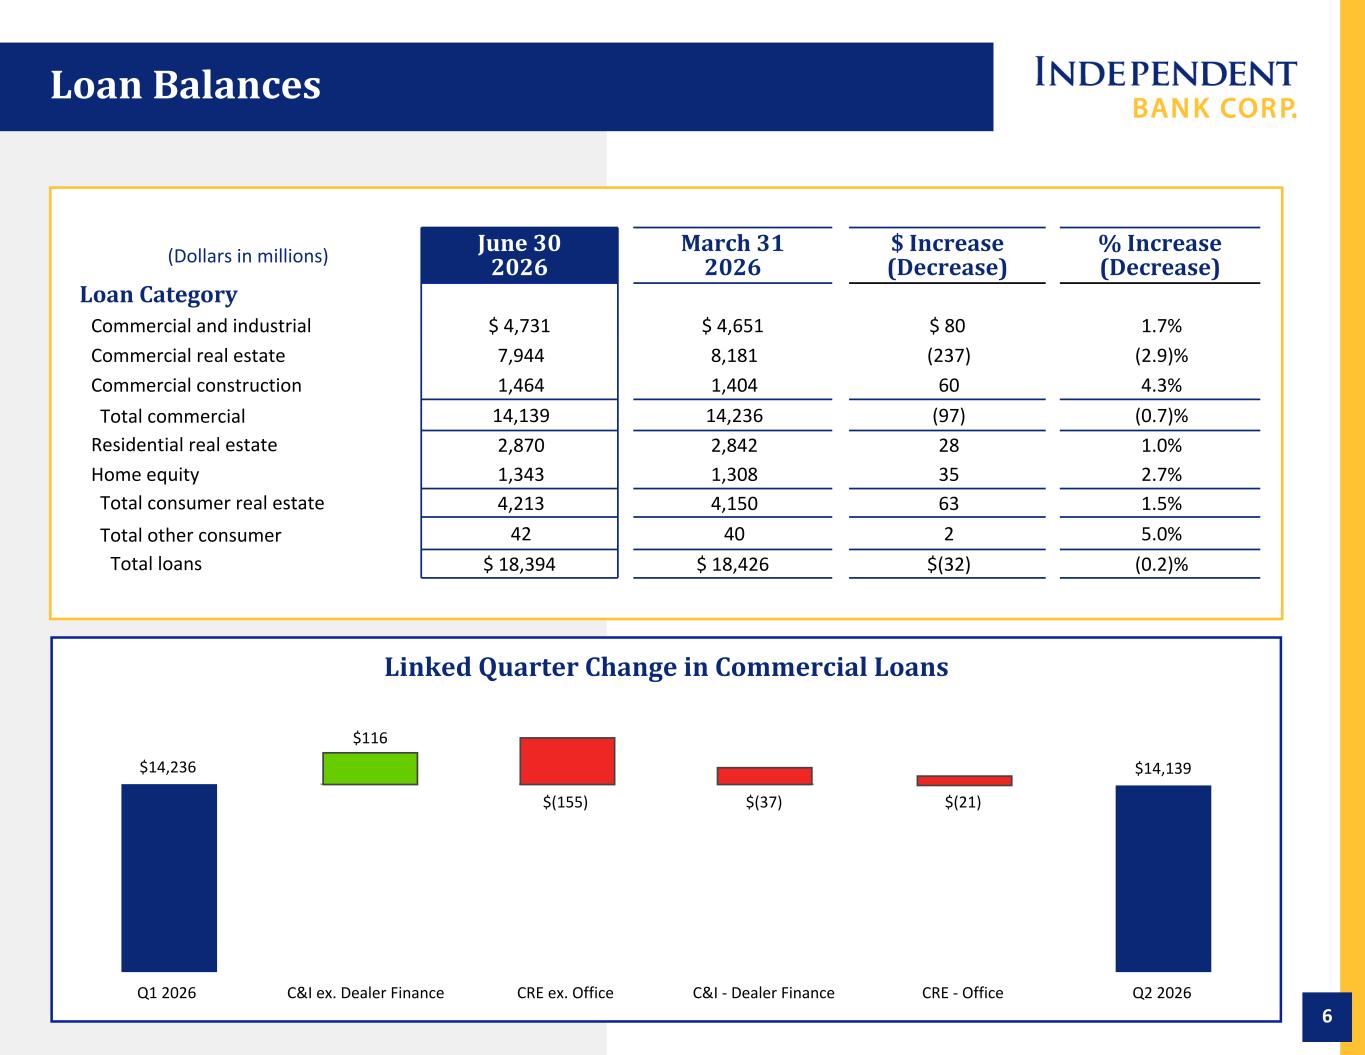
6 Linked Quarter Change in Commercial Loans $14,236 $116 $(155) $(37) $(21) $14,139 Q1 2026 C&I ex. Dealer Finance CRE ex. Office C&I - Dealer Finance CRE - Office Q2 2026 Loan Balances (Dollars in millions) June 30 2026 March 31 2026 $ Increase (Decrease) % Increase (Decrease) Loan Category Commercial and industrial $ 4,731 $ 4,651 $ 80 1.7% Commercial real estate 7,944 8,181 (237) (2.9)% Commercial construction 1,464 1,404 60 4.3% Total commercial 14,139 14,236 (97) (0.7)% Residential real estate 2,870 2,842 28 1.0% Home equity 1,343 1,308 35 2.7% Total consumer real estate 4,213 4,150 63 1.5% Total other consumer 42 40 2 5.0% Total loans $ 18,394 $ 18,426 $(32) (0.2)% $116
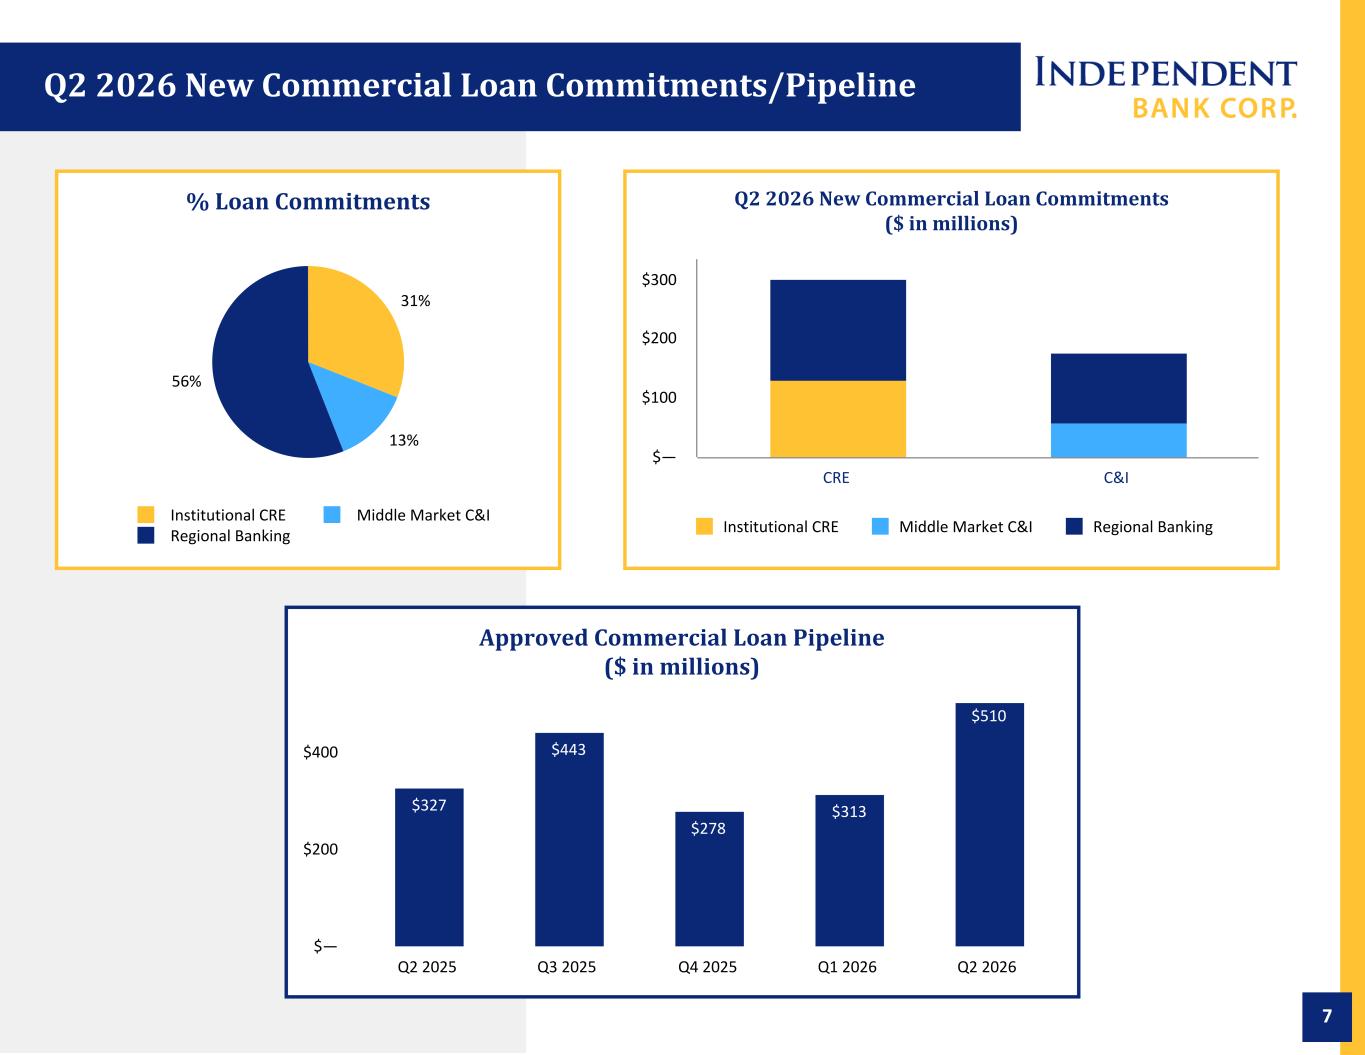
7 Q2 2026 New Commercial Loan Commitments ($ in millions) Institutional CRE Middle Market C&I Regional Banking CRE C&I $— $100 $200 $300 Q2 2026 New Commercial Loan Commitments/Pipeline % Loan Commitments 31% 13% 56% Institutional CRE Middle Market C&I Regional Banking Approved Commercial Loan Pipeline ($ in millions) $327 $443 $278 $313 $510 Q2 2025 Q3 2025 Q4 2025 Q1 2026 Q2 2026 $— $200 $400
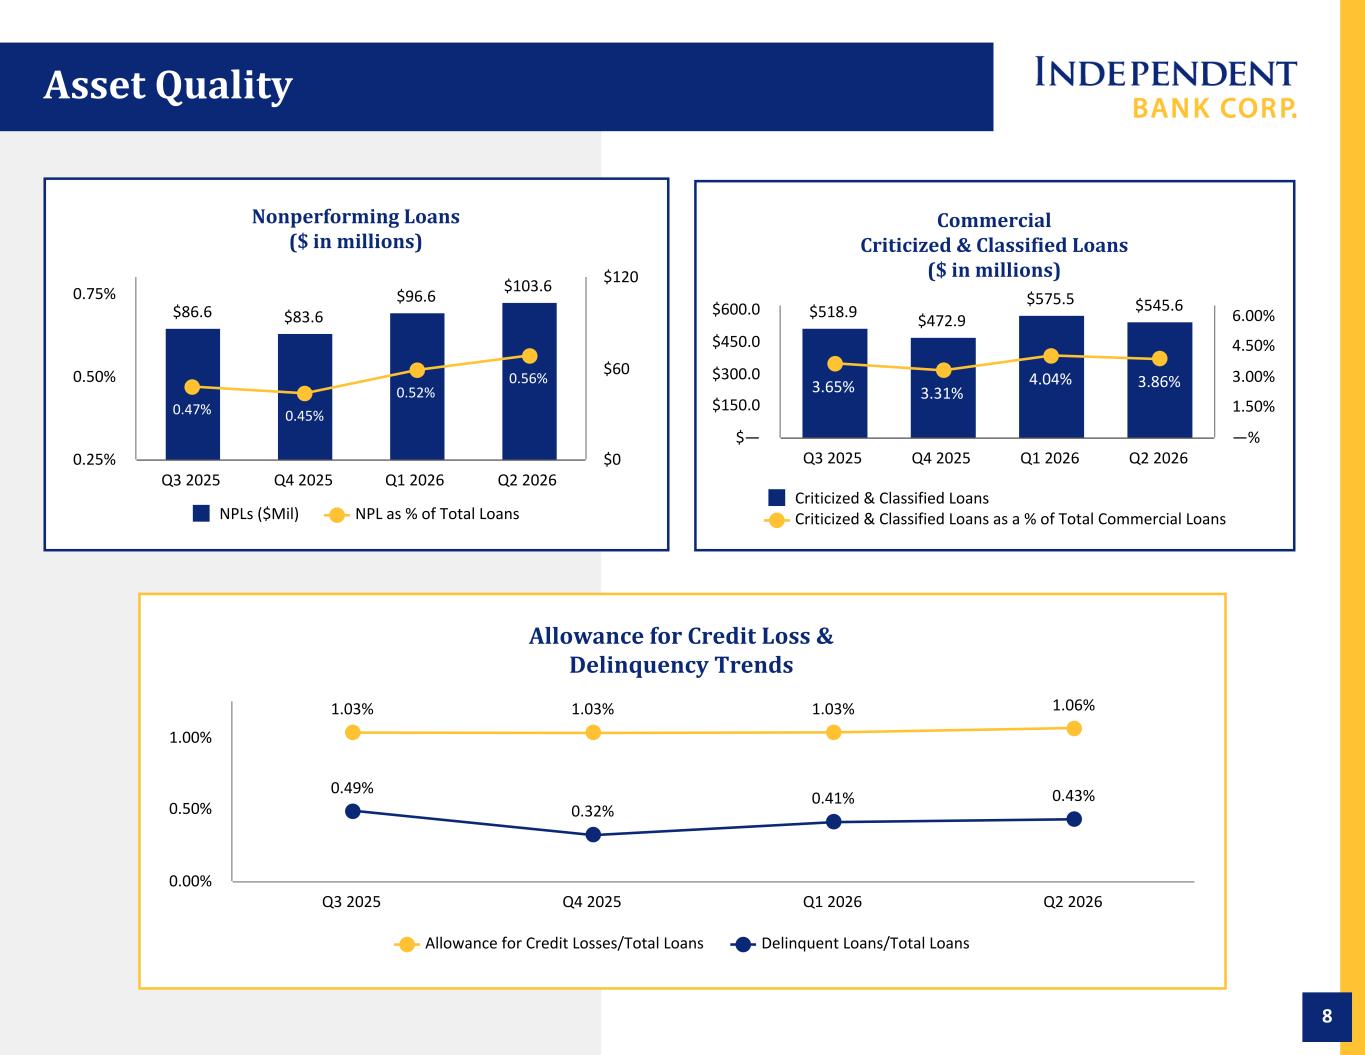
8 Nonperforming Loans ($ in millions) $86.6 $83.6 $96.6 $103.6 0.47% 0.45% 0.52% 0.56% NPLs ($Mil) NPL as % of Total Loans Q3 2025 Q4 2025 Q1 2026 Q2 2026 0.25% 0.50% 0.75% $0 $60 $120 Commercial Criticized & Classified Loans ($ in millions) $518.9 $472.9 $575.5 $545.6 3.65% 3.31% 4.04% 3.86% Criticized & Classified Loans Criticized & Classified Loans as a % of Total Commercial Loans Q3 2025 Q4 2025 Q1 2026 Q2 2026 $— $150.0 $300.0 $450.0 $600.0 —% 1.50% 3.00% 4.50% 6.00% Asset Quality Allowance for Credit Loss & Delinquency Trends 1.03% 1.03% 1.03% 1.06% 0.49% 0.32% 0.41% 0.43% Allowance for Credit Losses/Total Loans Delinquent Loans/Total Loans Q3 2025 Q4 2025 Q1 2026 Q2 2026 0.00% 0.50% 1.00%
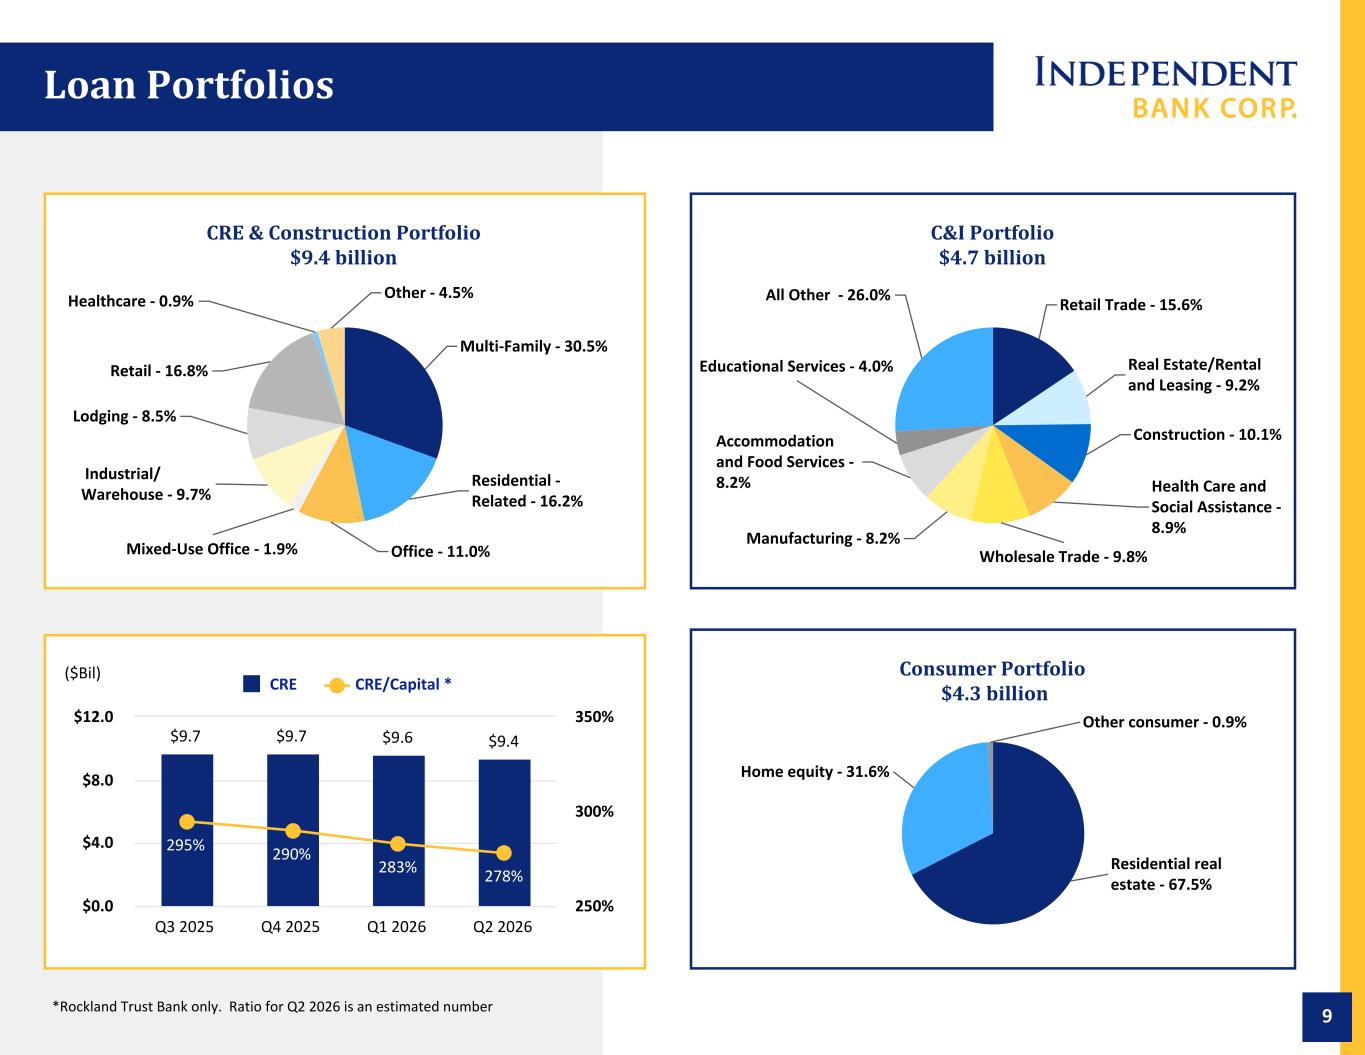
9 95% CRE & Construction Portfolio $9.4 billion Multi-Family - 30.5% Residential - Related - 16.2% Office - 11.0%Mixed-Use Office - 1.9% Industrial/ Warehouse - 9.7% Lodging - 8.5% Retail - 16.8% Healthcare - 0.9% Other - 4.5% C&I Portfolio $4.7 billion Retail Trade - 15.6% Real Estate/Rental and Leasing - 9.2% Construction - 10.1% Health Care and Social Assistance - 8.9% Wholesale Trade - 9.8% Manufacturing - 8.2% Accommodation and Food Services - 8.2% Educational Services - 4.0% All Other - 26.0% Consumer Portfolio $4.3 billion Residential real estate - 67.5% Home equity - 31.6% Other consumer - 0.9% $9.7 $9.7 $9.6 $9.4 295% 290% 283% 278% CRE CRE/Capital * Q3 2025 Q4 2025 Q1 2026 Q2 2026 $0.0 $4.0 $8.0 $12.0 250% 300% 350% ($Bil) *Rockland Trust Bank only. Ratio for Q2 2026 is an estimated number Loan Portfolios
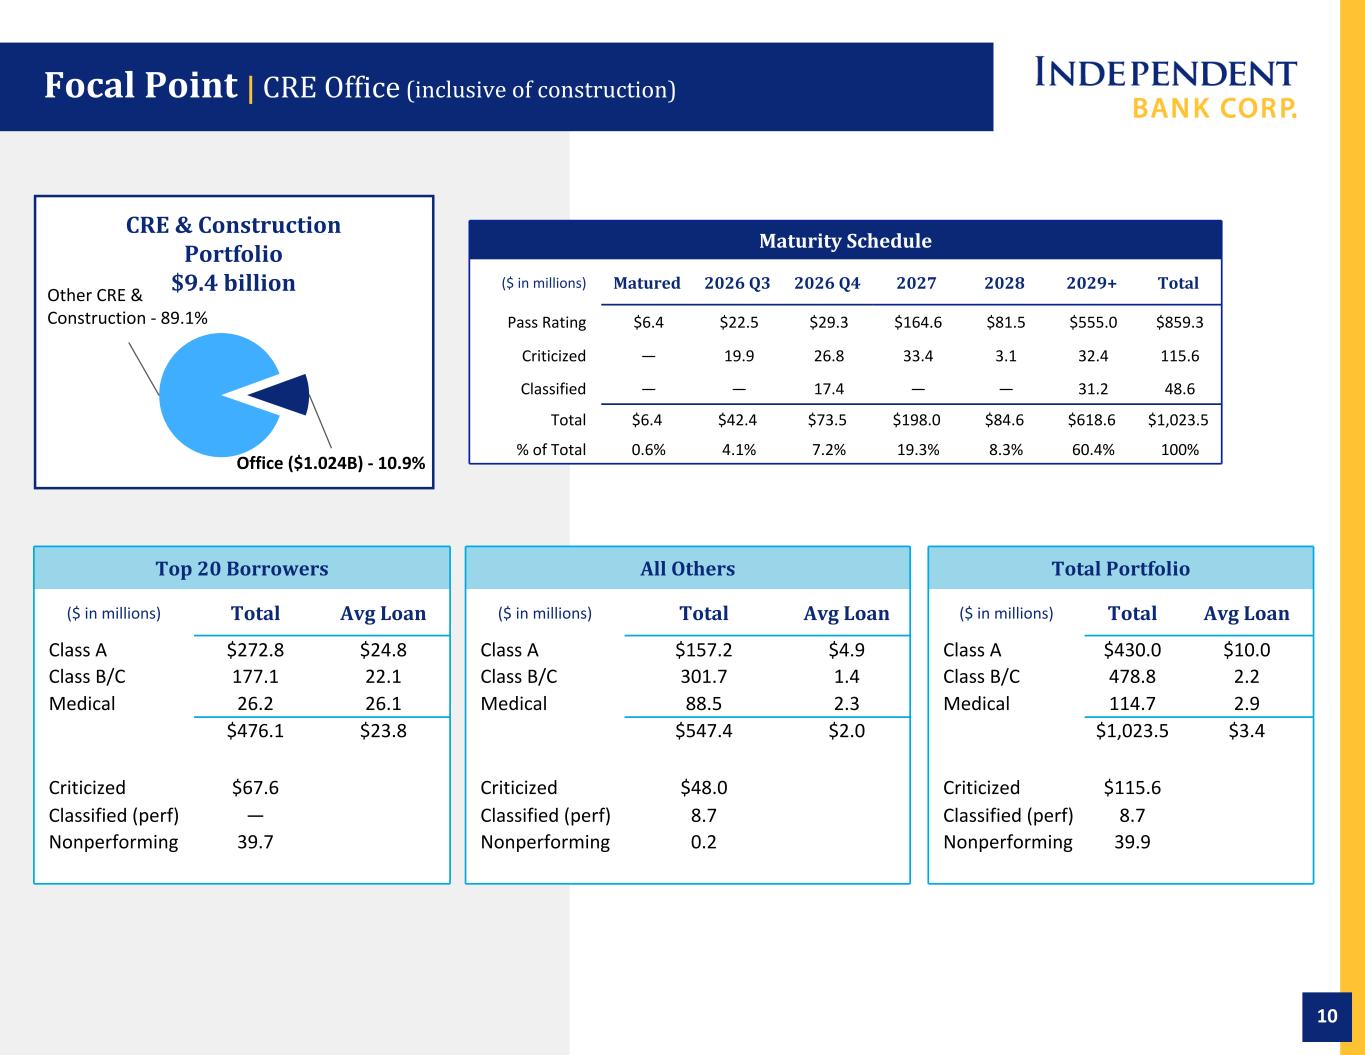
10 Top 20 Borrowers All Others Total Portfolio ($ in millions) Total Avg Loan ($ in millions) Total Avg Loan ($ in millions) Total Avg Loan Class A $272.8 $24.8 Class A $157.2 $4.9 Class A $430.0 $10.0 Class B/C 177.1 22.1 Class B/C 301.7 1.4 Class B/C 478.8 2.2 Medical 26.2 26.1 Medical 88.5 2.3 Medical 114.7 2.9 $476.1 $23.8 $547.4 $2.0 $1,023.5 $3.4 Criticized $67.6 Criticized $48.0 Criticized $115.6 Classified (perf) — Classified (perf) 8.7 Classified (perf) 8.7 Nonperforming 39.7 Nonperforming 0.2 Nonperforming 39.9 Maturity Schedule ($ in millions) Matured 2026 Q3 2026 Q4 2027 2028 2029+ Total Pass Rating $6.4 $22.5 $29.3 $164.6 $81.5 $555.0 $859.3 Criticized — 19.9 26.8 33.4 3.1 32.4 115.6 Classified — — 17.4 — — 31.2 48.6 Total $6.4 $42.4 $73.5 $198.0 $84.6 $618.6 $1,023.5 % of Total 0.6% 4.1% 7.2% 19.3% 8.3% 60.4% 100% CRE & Construction Portfolio $9.4 billion Office ($1.024B) - 10.9% Other CRE & Construction - 89.1% Focal Point | CRE Office (inclusive of construction)
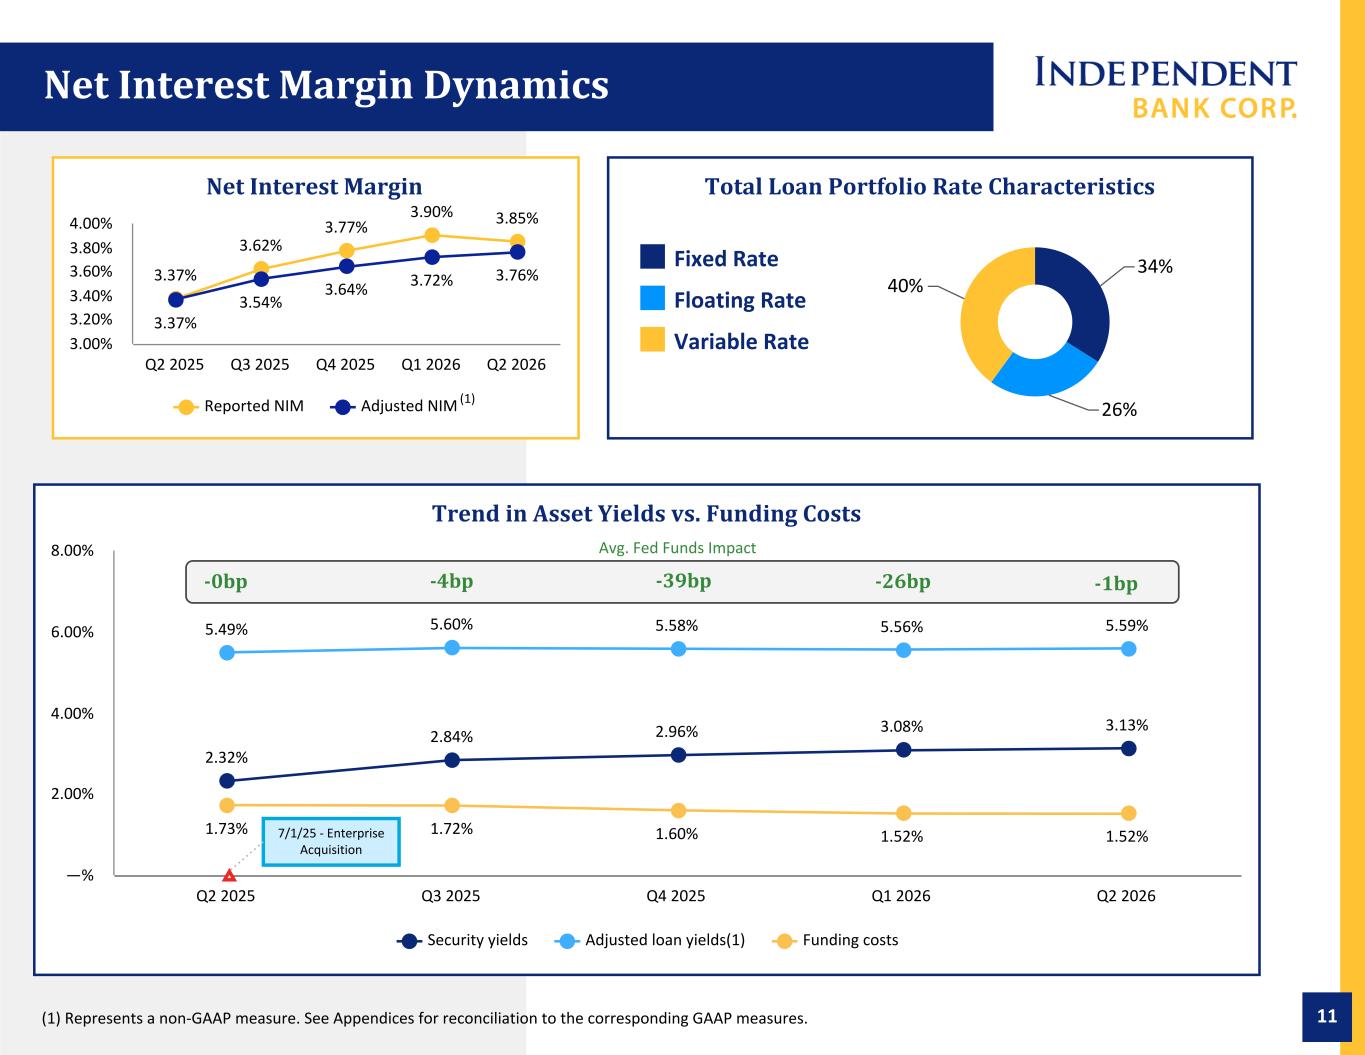
11 Trend in Asset Yields vs. Funding Costs 2.32% 2.84% 2.96% 3.08% 3.13% 5.49% 5.60% 5.58% 5.56% 5.59% 1.73% 1.72% 1.60% 1.52% 1.52% Security yields Adjusted loan yields(1) Funding costs Q2 2025 Q3 2025 Q4 2025 Q1 2026 Q2 2026 —% 2.00% 4.00% 6.00% 8.00% Net Interest Margin 3.37% 3.62% 3.77% 3.90% 3.85% 3.37% 3.54% 3.64% 3.72% 3.76% Reported NIM Adjusted NIM Q2 2025 Q3 2025 Q4 2025 Q1 2026 Q2 2026 3.00% 3.20% 3.40% 3.60% 3.80% 4.00% Net Interest Margin Dynamics 7/1/25 - Enterprise Acquisition (1) Represents a non-GAAP measure. See Appendices for reconciliation to the corresponding GAAP measures. Total Loan Portfolio Rate Characteristics 34% 26% 40% Fixed Rate Floating Rate Variable Rate -39bp-0bp -4bp Avg. Fed Funds Impact -26bp -1bp (1)
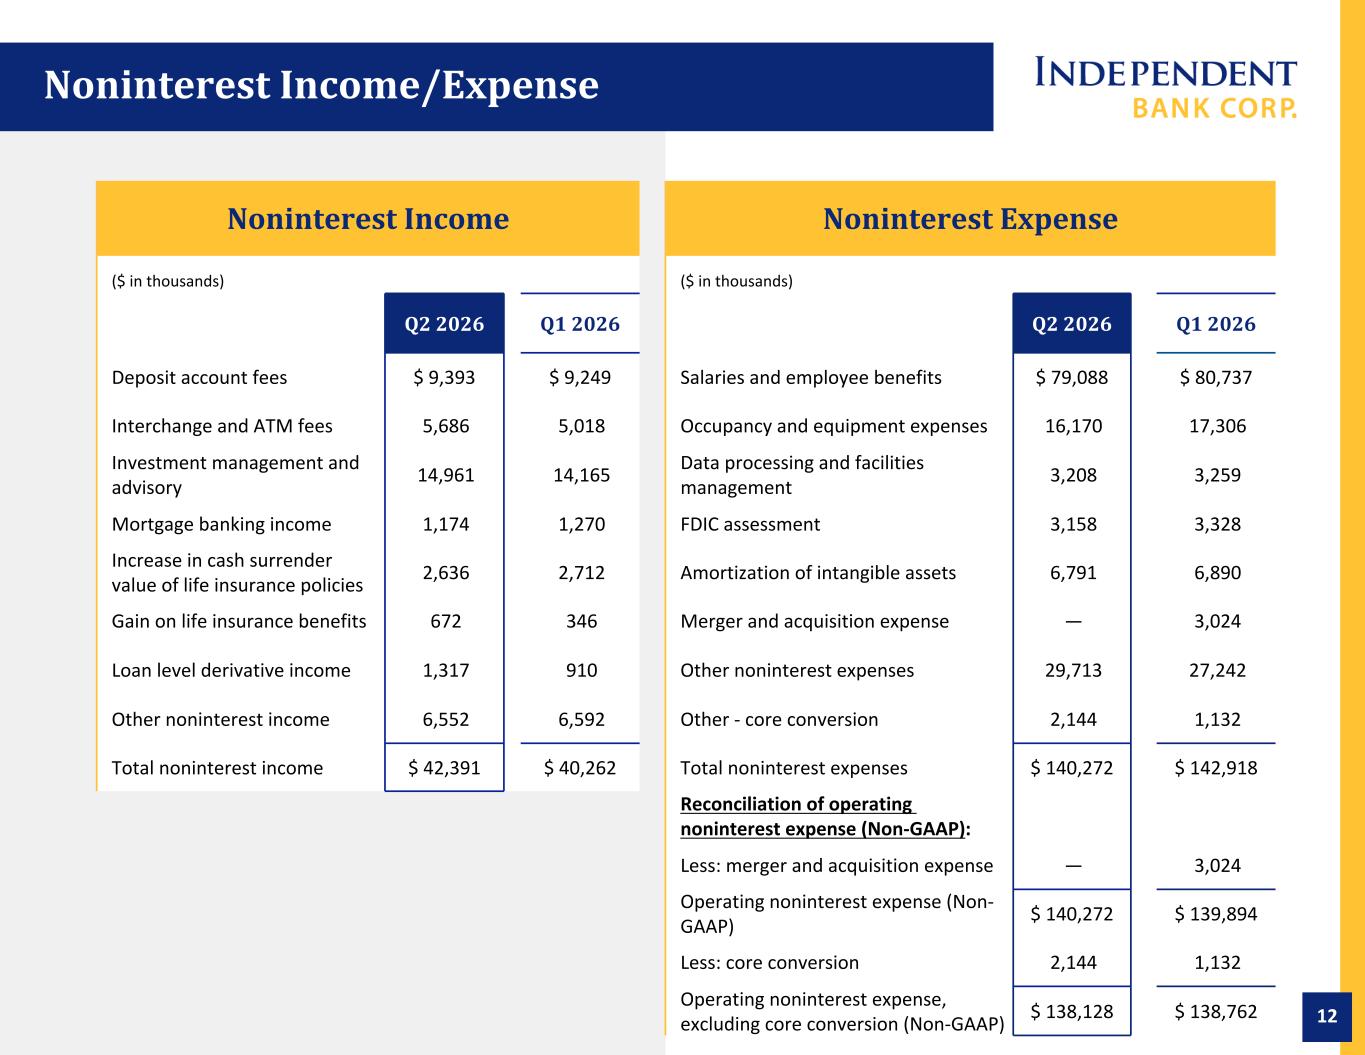
12 Noninterest Income Noninterest Expense ($ in thousands) ($ in thousands) Q2 2026 Q1 2026 Q2 2026 Q1 2026 Deposit account fees $ 9,393 $ 9,249 Salaries and employee benefits $ 79,088 $ 80,737 Interchange and ATM fees 5,686 5,018 Occupancy and equipment expenses 16,170 17,306 Investment management and advisory 14,961 14,165 Data processing and facilities management 3,208 3,259 Mortgage banking income 1,174 1,270 FDIC assessment 3,158 3,328 Increase in cash surrender value of life insurance policies 2,636 2,712 Amortization of intangible assets 6,791 6,890 Gain on life insurance benefits 672 346 Merger and acquisition expense — 3,024 Loan level derivative income 1,317 910 Other noninterest expenses 29,713 27,242 Other noninterest income 6,552 6,592 Other - core conversion 2,144 1,132 Total noninterest income $ 42,391 $ 40,262 Total noninterest expenses $ 140,272 $ 142,918 Reconciliation of operating noninterest expense (Non-GAAP): Less: merger and acquisition expense — 3,024 Operating noninterest expense (Non- GAAP) $ 140,272 $ 139,894 Less: core conversion 2,144 1,132 Operating noninterest expense, excluding core conversion (Non-GAAP) $ 138,128 $ 138,762 Noninterest Income/Expense
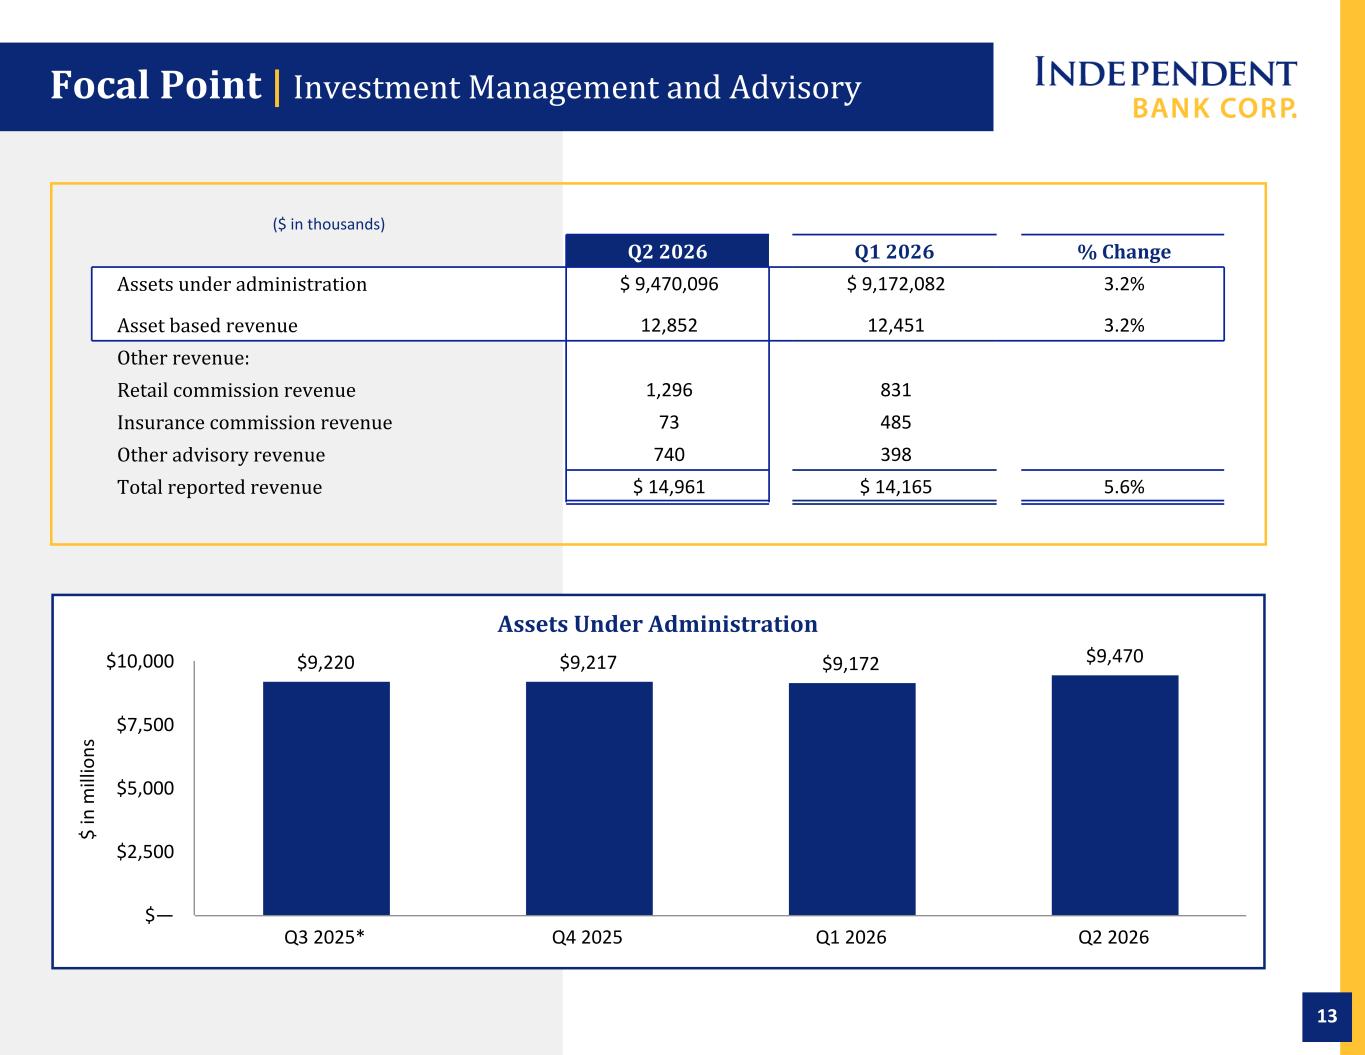
13 $ in m ill io ns Assets Under Administration $9,220 $9,217 $9,172 $9,470 Q3 2025* Q4 2025 Q1 2026 Q2 2026 $— $2,500 $5,000 $7,500 $10,000 ($ in thousands) Q2 2026 Q1 2026 % Change Assets under administration $ 9,470,096 $ 9,172,082 3.2% Asset based revenue 12,852 12,451 3.2% Other revenue: Retail commission revenue 1,296 831 Insurance commission revenue 73 485 Other advisory revenue 740 398 Total reported revenue $ 14,961 $ 14,165 5.6% Focal Point | Investment Management and Advisory
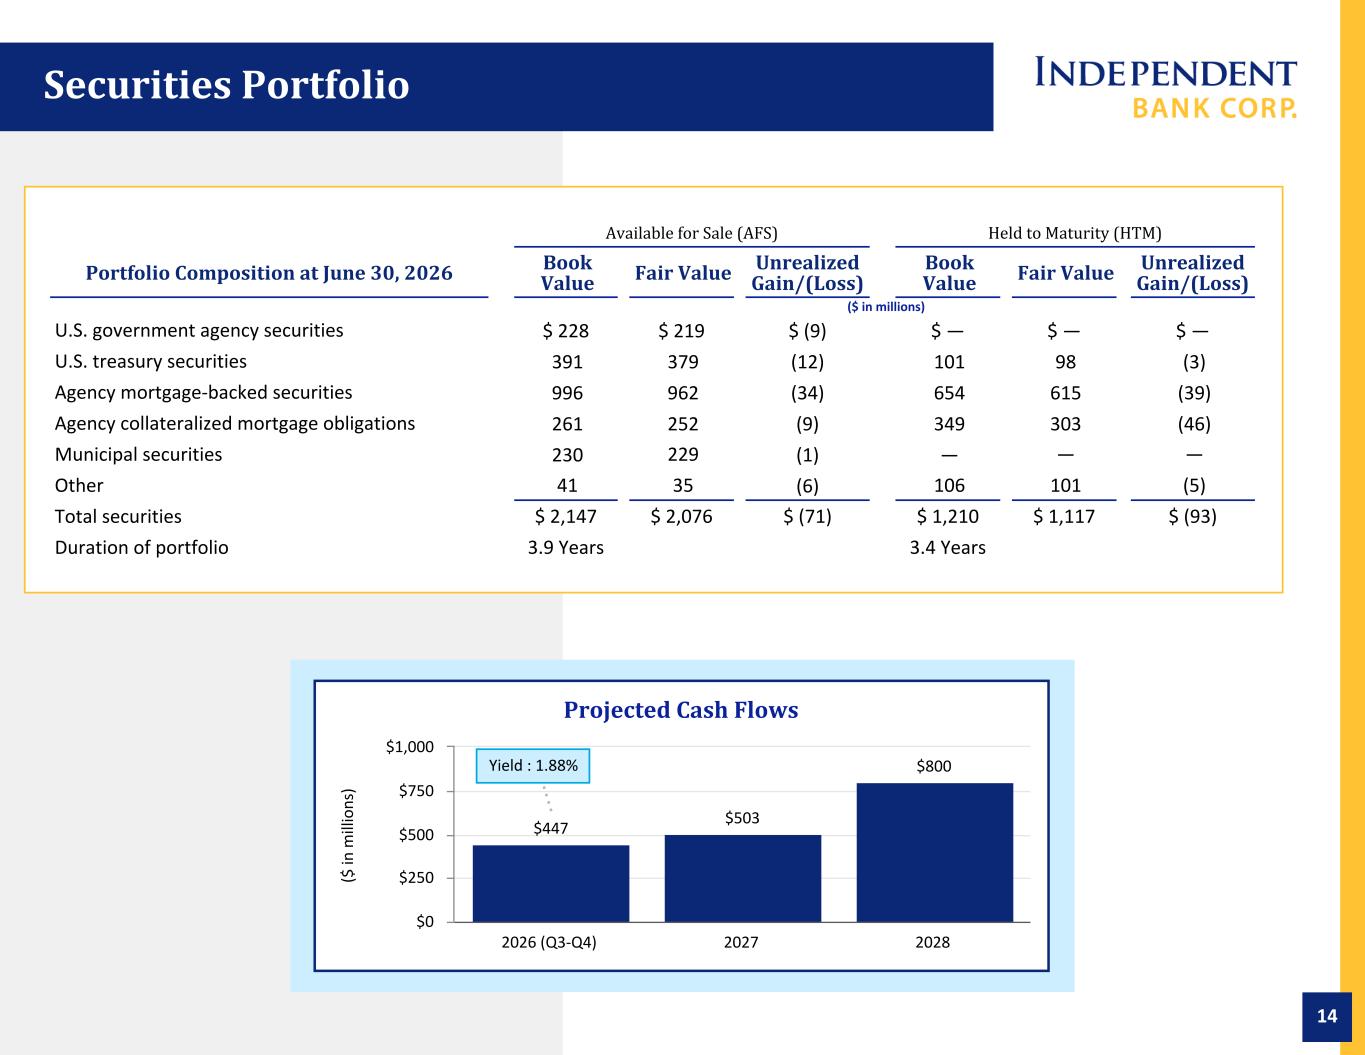
14 Available for Sale (AFS) Held to Maturity (HTM) Portfolio Composition at June 30, 2026 Book Value Fair Value Unrealized Gain/(Loss) Book Value Fair Value Unrealized Gain/(Loss) ($ in millions) U.S. government agency securities $ 228 $ 219 $ (9) $ — $ — $ — U.S. treasury securities 391 379 (12) 101 98 (3) Agency mortgage-backed securities 996 962 (34) 654 615 (39) Agency collateralized mortgage obligations 261 252 (9) 349 303 (46) Municipal securities 230 229 (1) — — — Other 41 35 (6) 106 101 (5) Total securities $ 2,147 $ 2,076 $ (71) $ 1,210 $ 1,117 $ (93) Duration of portfolio 3.9 Years 3.4 Years ($ in m ill io ns ) Projected Cash Flows $447 $503 $800 2026 (Q3-Q4) 2027 2028 $0 $250 $500 $750 $1,000 Securities Portfolio Yield : 1.88%
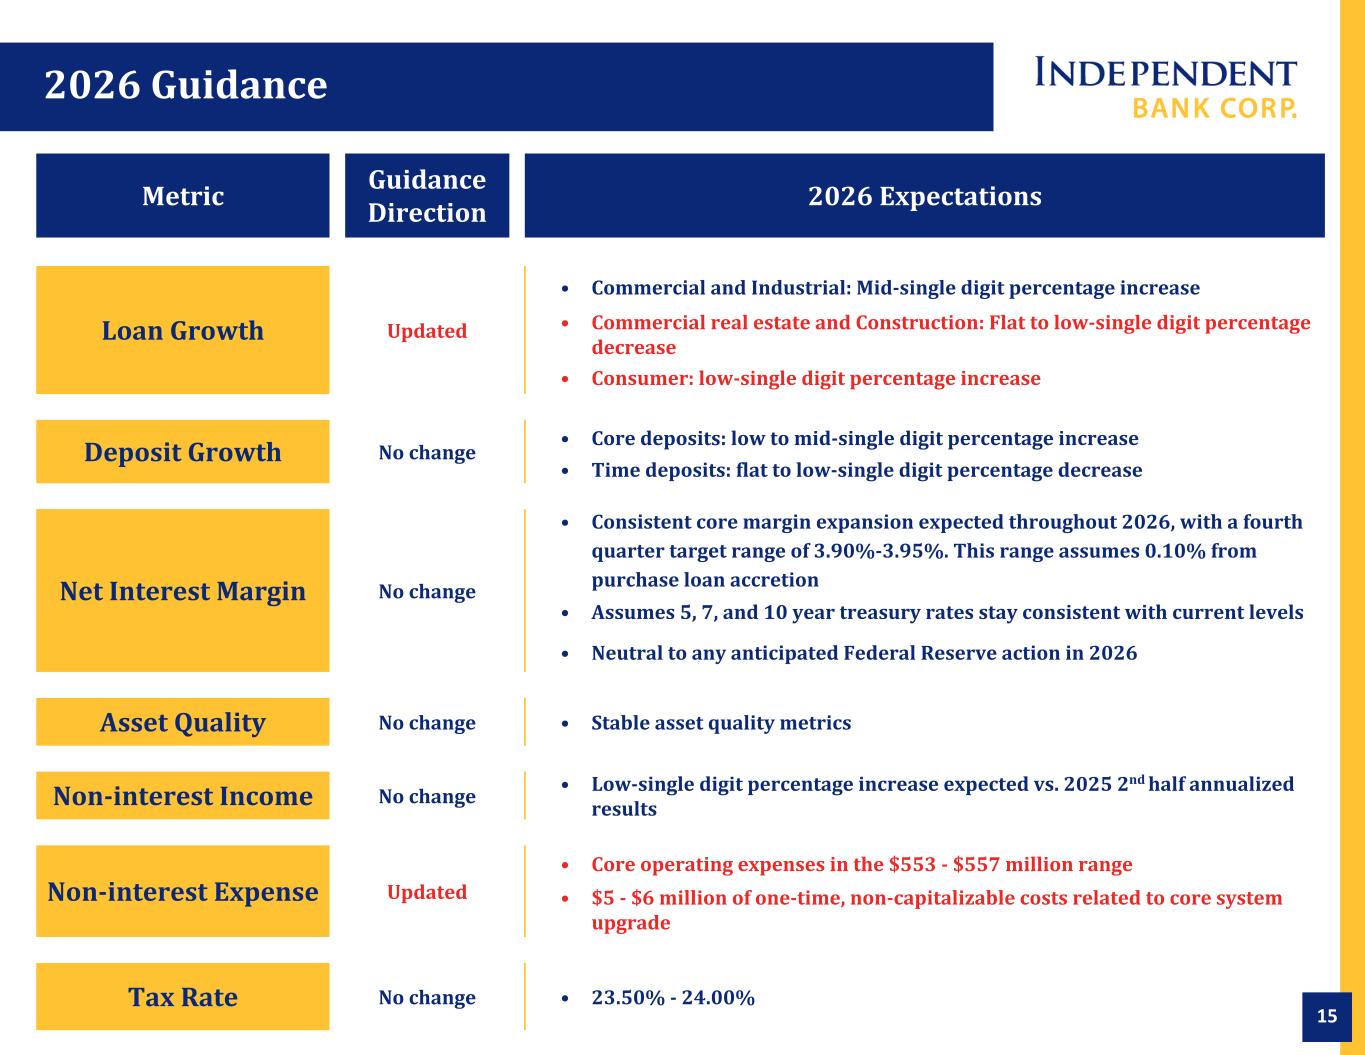
15 Metric Guidance Direction 2026 Expectations Loan Growth Updated • Commercial and Industrial: Mid-single digit percentage increase • Commercial real estate and Construction: Flat to low-single digit percentage decrease • Consumer: low-single digit percentage increase Deposit Growth No change • Core deposits: low to mid-single digit percentage increase • Time deposits: flat to low-single digit percentage decrease Net Interest Margin No change • Consistent core margin expansion expected throughout 2026, with a fourth quarter target range of 3.90%-3.95%. This range assumes 0.10% from purchase loan accretion • Assumes 5, 7, and 10 year treasury rates stay consistent with current levels • Neutral to any anticipated Federal Reserve action in 2026 Asset Quality No change • Stable asset quality metrics Non-interest Income No change • Low-single digit percentage increase expected vs. 2025 2nd half annualized results Non-interest Expense Updated • Core operating expenses in the $553 - $557 million range • $5 - $6 million of one-time, non-capitalizable costs related to core system upgrade Tax Rate No change • 23.50% - 24.00% 2026 Guidance
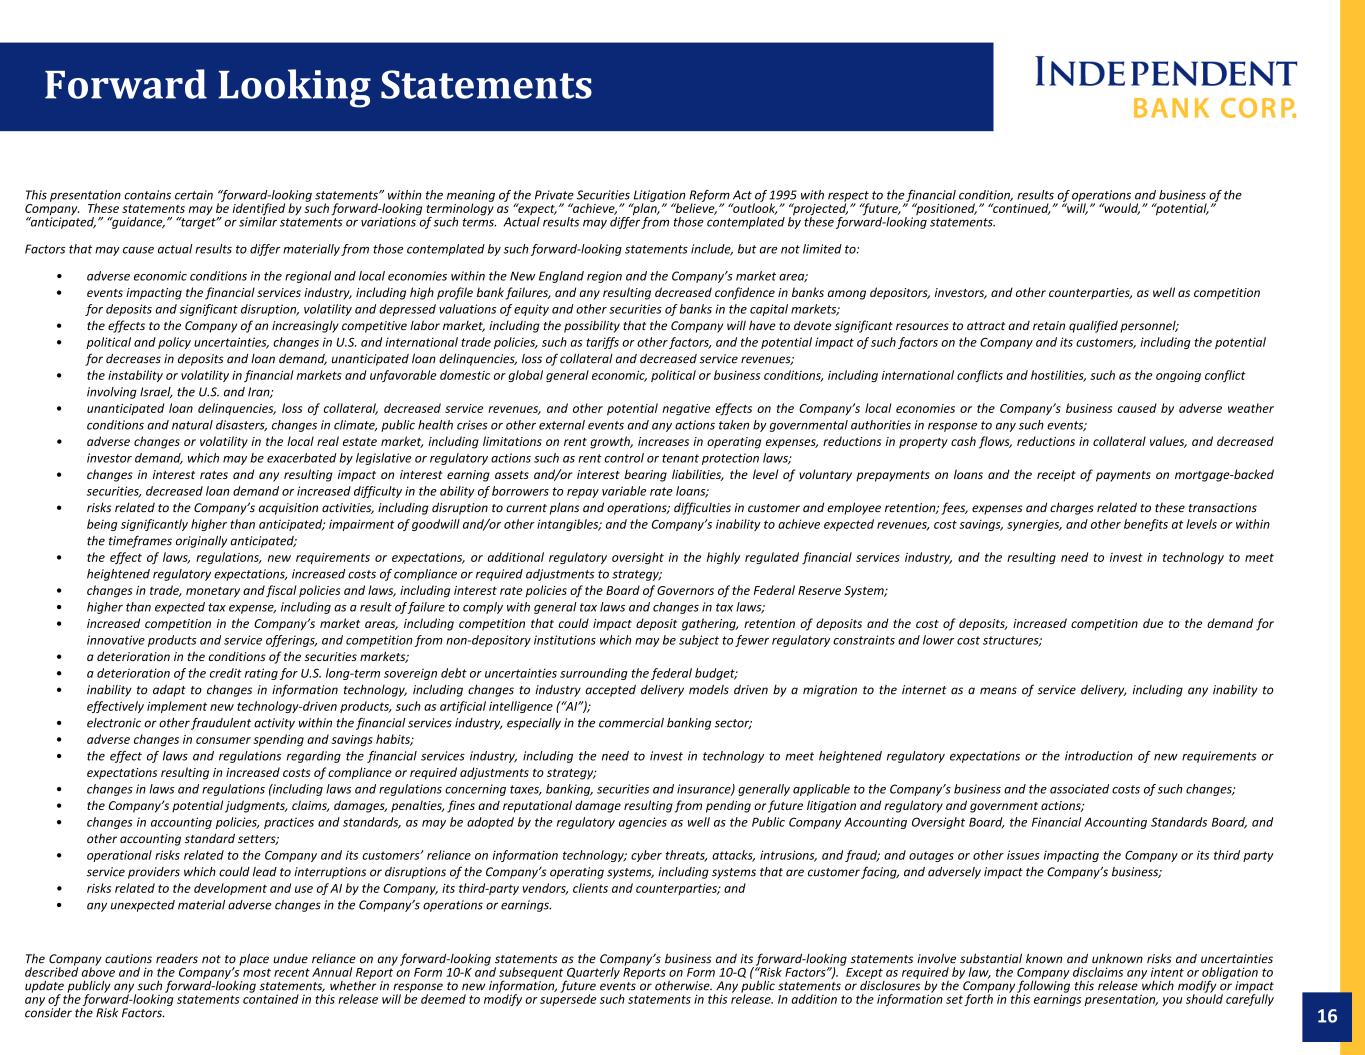
16 This presentation contains certain “forward-looking statements” within the meaning of the Private Securities Litigation Reform Act of 1995 with respect to the financial condition, results of operations and business of the Company. These statements may be identified by such forward-looking terminology as “expect,” “achieve,” “plan,” “believe,” “outlook,” “projected,” “future,” “positioned,” “continued,” “will,” “would,” “potential,” “anticipated,” “guidance,” “target” or similar statements or variations of such terms. Actual results may differ from those contemplated by these forward-looking statements. Factors that may cause actual results to differ materially from those contemplated by such forward-looking statements include, but are not limited to: • adverse economic conditions in the regional and local economies within the New England region and the Company’s market area; • events impacting the financial services industry, including high profile bank failures, and any resulting decreased confidence in banks among depositors, investors, and other counterparties, as well as competition for deposits and significant disruption, volatility and depressed valuations of equity and other securities of banks in the capital markets; • the effects to the Company of an increasingly competitive labor market, including the possibility that the Company will have to devote significant resources to attract and retain qualified personnel; • political and policy uncertainties, changes in U.S. and international trade policies, such as tariffs or other factors, and the potential impact of such factors on the Company and its customers, including the potential for decreases in deposits and loan demand, unanticipated loan delinquencies, loss of collateral and decreased service revenues; • the instability or volatility in financial markets and unfavorable domestic or global general economic, political or business conditions, including international conflicts and hostilities, such as the ongoing conflict involving Israel, the U.S. and Iran; • unanticipated loan delinquencies, loss of collateral, decreased service revenues, and other potential negative effects on the Company’s local economies or the Company’s business caused by adverse weather conditions and natural disasters, changes in climate, public health crises or other external events and any actions taken by governmental authorities in response to any such events; • adverse changes or volatility in the local real estate market, including limitations on rent growth, increases in operating expenses, reductions in property cash flows, reductions in collateral values, and decreased investor demand, which may be exacerbated by legislative or regulatory actions such as rent control or tenant protection laws; • changes in interest rates and any resulting impact on interest earning assets and/or interest bearing liabilities, the level of voluntary prepayments on loans and the receipt of payments on mortgage-backed securities, decreased loan demand or increased difficulty in the ability of borrowers to repay variable rate loans; • risks related to the Company’s acquisition activities, including disruption to current plans and operations; difficulties in customer and employee retention; fees, expenses and charges related to these transactions being significantly higher than anticipated; impairment of goodwill and/or other intangibles; and the Company’s inability to achieve expected revenues, cost savings, synergies, and other benefits at levels or within the timeframes originally anticipated; • the effect of laws, regulations, new requirements or expectations, or additional regulatory oversight in the highly regulated financial services industry, and the resulting need to invest in technology to meet heightened regulatory expectations, increased costs of compliance or required adjustments to strategy; • changes in trade, monetary and fiscal policies and laws, including interest rate policies of the Board of Governors of the Federal Reserve System; • higher than expected tax expense, including as a result of failure to comply with general tax laws and changes in tax laws; • increased competition in the Company’s market areas, including competition that could impact deposit gathering, retention of deposits and the cost of deposits, increased competition due to the demand for innovative products and service offerings, and competition from non-depository institutions which may be subject to fewer regulatory constraints and lower cost structures; • a deterioration in the conditions of the securities markets; • a deterioration of the credit rating for U.S. long-term sovereign debt or uncertainties surrounding the federal budget; • inability to adapt to changes in information technology, including changes to industry accepted delivery models driven by a migration to the internet as a means of service delivery, including any inability to effectively implement new technology-driven products, such as artificial intelligence (“AI”); • electronic or other fraudulent activity within the financial services industry, especially in the commercial banking sector; • adverse changes in consumer spending and savings habits; • the effect of laws and regulations regarding the financial services industry, including the need to invest in technology to meet heightened regulatory expectations or the introduction of new requirements or expectations resulting in increased costs of compliance or required adjustments to strategy; • changes in laws and regulations (including laws and regulations concerning taxes, banking, securities and insurance) generally applicable to the Company’s business and the associated costs of such changes; • the Company’s potential judgments, claims, damages, penalties, fines and reputational damage resulting from pending or future litigation and regulatory and government actions; • changes in accounting policies, practices and standards, as may be adopted by the regulatory agencies as well as the Public Company Accounting Oversight Board, the Financial Accounting Standards Board, and other accounting standard setters; • operational risks related to the Company and its customers’ reliance on information technology; cyber threats, attacks, intrusions, and fraud; and outages or other issues impacting the Company or its third party service providers which could lead to interruptions or disruptions of the Company’s operating systems, including systems that are customer facing, and adversely impact the Company’s business; • risks related to the development and use of AI by the Company, its third-party vendors, clients and counterparties; and • any unexpected material adverse changes in the Company’s operations or earnings. The Company cautions readers not to place undue reliance on any forward-looking statements as the Company’s business and its forward-looking statements involve substantial known and unknown risks and uncertainties described above and in the Company’s most recent Annual Report on Form 10-K and subsequent Quarterly Reports on Form 10-Q (“Risk Factors”). Except as required by law, the Company disclaims any intent or obligation to update publicly any such forward-looking statements, whether in response to new information, future events or otherwise. Any public statements or disclosures by the Company following this release which modify or impact any of the forward-looking statements contained in this release will be deemed to modify or supersede such statements in this release. In addition to the information set forth in this earnings presentation, you should carefully consider the Risk Factors. Forward Looking Statements
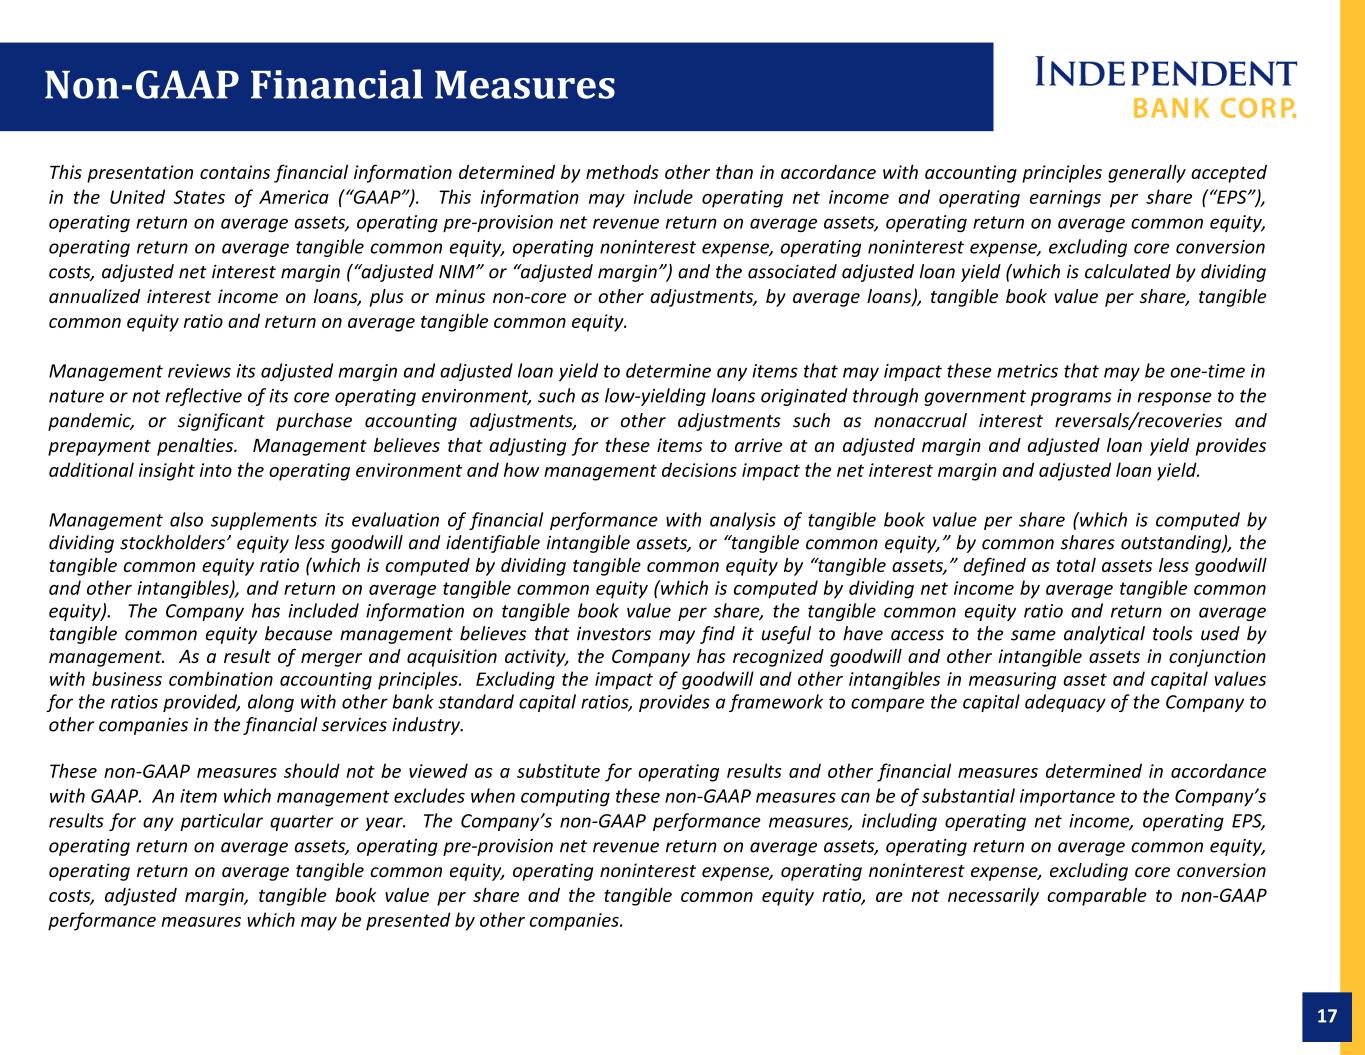
17 This presentation contains financial information determined by methods other than in accordance with accounting principles generally accepted in the United States of America (“GAAP”). This information may include operating net income and operating earnings per share (“EPS”), operating return on average assets, operating pre-provision net revenue return on average assets, operating return on average common equity, operating return on average tangible common equity, operating noninterest expense, operating noninterest expense, excluding core conversion costs, adjusted net interest margin (“adjusted NIM” or “adjusted margin”) and the associated adjusted loan yield (which is calculated by dividing annualized interest income on loans, plus or minus non-core or other adjustments, by average loans), tangible book value per share, tangible common equity ratio and return on average tangible common equity. Management reviews its adjusted margin and adjusted loan yield to determine any items that may impact these metrics that may be one-time in nature or not reflective of its core operating environment, such as low-yielding loans originated through government programs in response to the pandemic, or significant purchase accounting adjustments, or other adjustments such as nonaccrual interest reversals/recoveries and prepayment penalties. Management believes that adjusting for these items to arrive at an adjusted margin and adjusted loan yield provides additional insight into the operating environment and how management decisions impact the net interest margin and adjusted loan yield. Management also supplements its evaluation of financial performance with analysis of tangible book value per share (which is computed by dividing stockholders’ equity less goodwill and identifiable intangible assets, or “tangible common equity,” by common shares outstanding), the tangible common equity ratio (which is computed by dividing tangible common equity by “tangible assets,” defined as total assets less goodwill and other intangibles), and return on average tangible common equity (which is computed by dividing net income by average tangible common equity). The Company has included information on tangible book value per share, the tangible common equity ratio and return on average tangible common equity because management believes that investors may find it useful to have access to the same analytical tools used by management. As a result of merger and acquisition activity, the Company has recognized goodwill and other intangible assets in conjunction with business combination accounting principles. Excluding the impact of goodwill and other intangibles in measuring asset and capital values for the ratios provided, along with other bank standard capital ratios, provides a framework to compare the capital adequacy of the Company to other companies in the financial services industry. These non-GAAP measures should not be viewed as a substitute for operating results and other financial measures determined in accordance with GAAP. An item which management excludes when computing these non-GAAP measures can be of substantial importance to the Company’s results for any particular quarter or year. The Company’s non-GAAP performance measures, including operating net income, operating EPS, operating return on average assets, operating pre-provision net revenue return on average assets, operating return on average common equity, operating return on average tangible common equity, operating noninterest expense, operating noninterest expense, excluding core conversion costs, adjusted margin, tangible book value per share and the tangible common equity ratio, are not necessarily comparable to non-GAAP performance measures which may be presented by other companies. Non-GAAP Financial Measures
18 Appendix
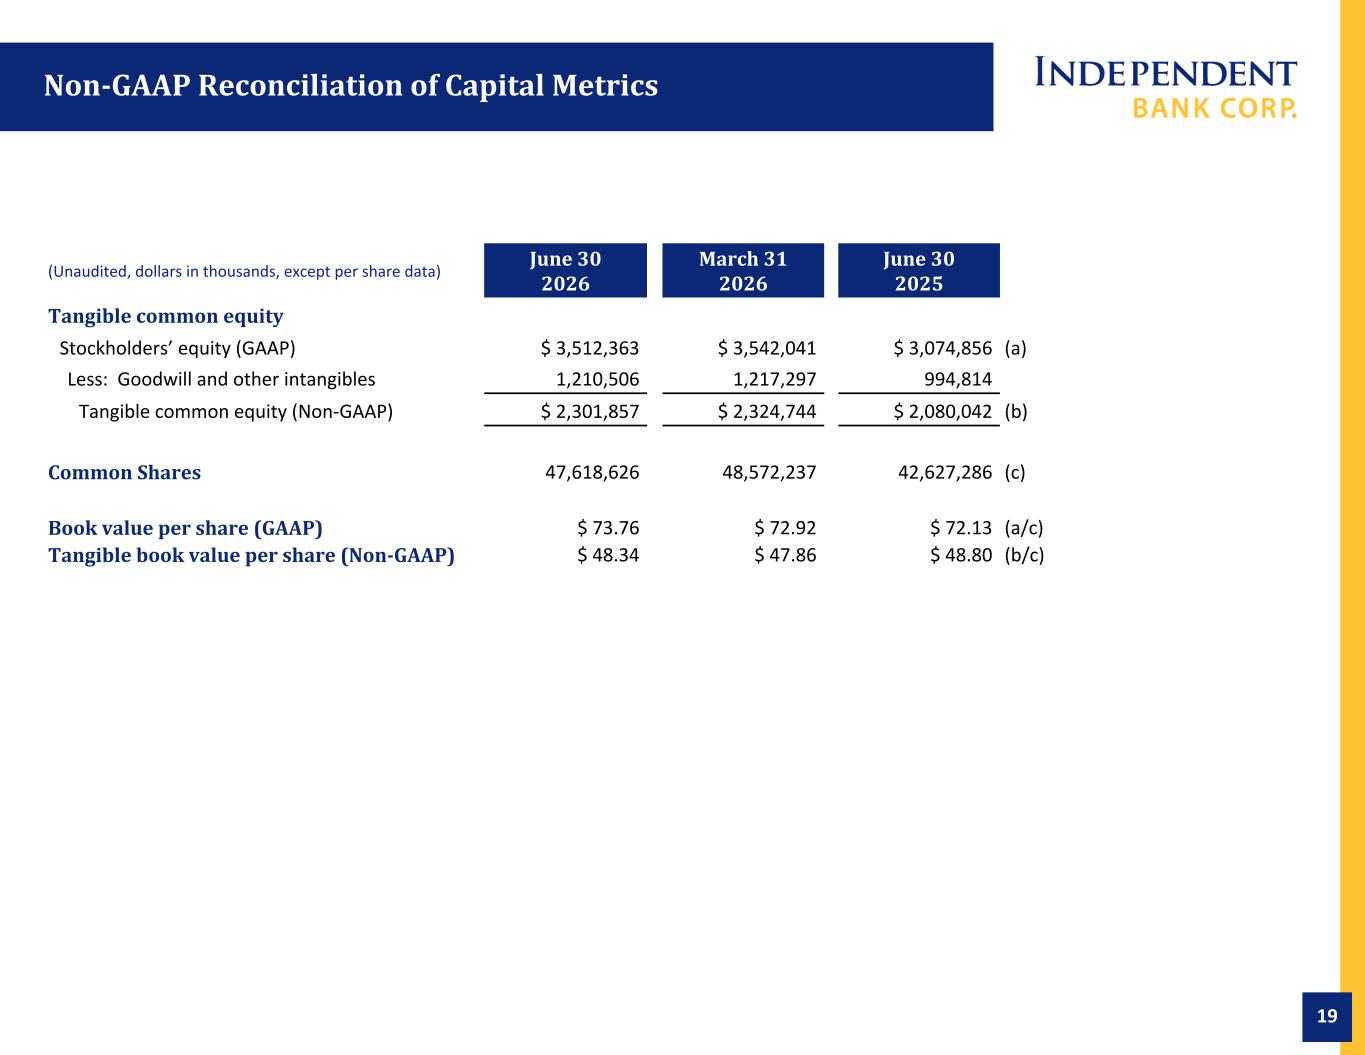
19 Non-GAAP Reconciliation of Capital Metrics (Unaudited, dollars in thousands, except per share data) June 30 2026 March 31 2026 June 30 2025 Tangible common equity Stockholders’ equity (GAAP) $ 3,512,363 $ 3,542,041 $ 3,074,856 (a) Less: Goodwill and other intangibles 1,210,506 1,217,297 994,814 Tangible common equity (Non-GAAP) $ 2,301,857 $ 2,324,744 $ 2,080,042 (b) Common Shares 47,618,626 48,572,237 42,627,286 (c) Book value per share (GAAP) $ 73.76 $ 72.92 $ 72.13 (a/c) Tangible book value per share (Non-GAAP) $ 48.34 $ 47.86 $ 48.80 (b/c)
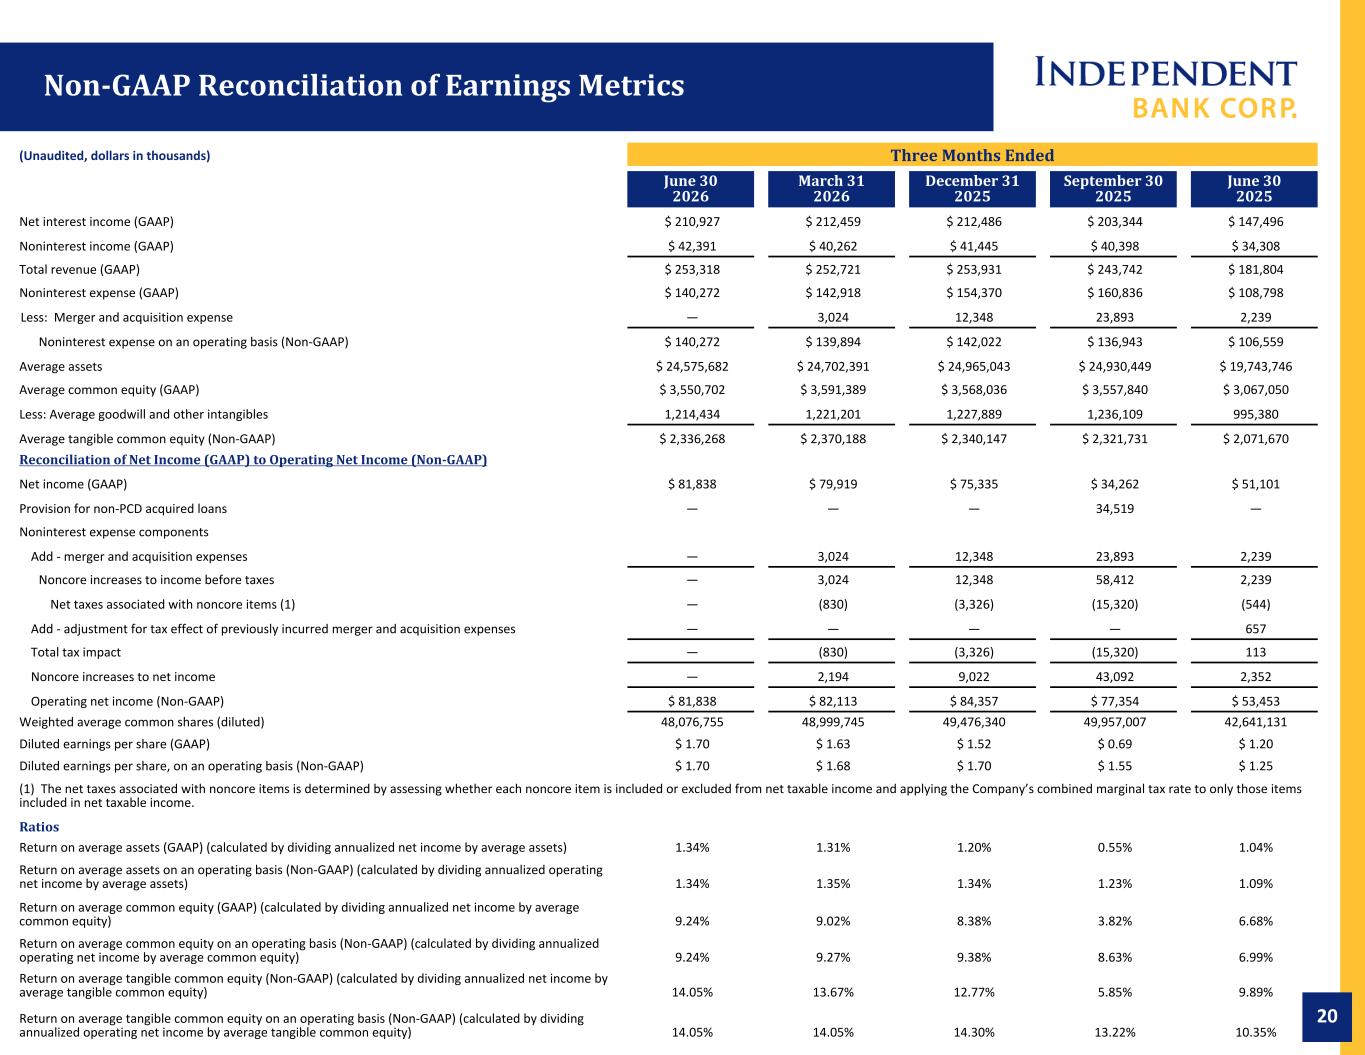
20 Non-GAAP Reconciliation of Earnings Metrics (Unaudited, dollars in thousands) Three Months Ended June 30 2026 March 31 2026 December 31 2025 September 30 2025 June 30 2025 Net interest income (GAAP) $ 210,927 $ 212,459 $ 212,486 $ 203,344 $ 147,496 Noninterest income (GAAP) $ 42,391 $ 40,262 $ 41,445 $ 40,398 $ 34,308 Total revenue (GAAP) $ 253,318 $ 252,721 $ 253,931 $ 243,742 $ 181,804 Noninterest expense (GAAP) $ 140,272 $ 142,918 $ 154,370 $ 160,836 $ 108,798 Less: Merger and acquisition expense — 3,024 12,348 23,893 2,239 Noninterest expense on an operating basis (Non-GAAP) $ 140,272 $ 139,894 $ 142,022 $ 136,943 $ 106,559 Average assets $ 24,575,682 $ 24,702,391 $ 24,965,043 $ 24,930,449 $ 19,743,746 Average common equity (GAAP) $ 3,550,702 $ 3,591,389 $ 3,568,036 $ 3,557,840 $ 3,067,050 Less: Average goodwill and other intangibles 1,214,434 1,221,201 1,227,889 1,236,109 995,380 Average tangible common equity (Non-GAAP) $ 2,336,268 $ 2,370,188 $ 2,340,147 $ 2,321,731 $ 2,071,670 Reconciliation of Net Income (GAAP) to Operating Net Income (Non-GAAP) Net income (GAAP) $ 81,838 $ 79,919 $ 75,335 $ 34,262 $ 51,101 Provision for non-PCD acquired loans — — — 34,519 — Noninterest expense components Add - merger and acquisition expenses — 3,024 12,348 23,893 2,239 Noncore increases to income before taxes — 3,024 12,348 58,412 2,239 Net taxes associated with noncore items (1) — (830) (3,326) (15,320) (544) Add - adjustment for tax effect of previously incurred merger and acquisition expenses — — — — 657 Total tax impact — (830) (3,326) (15,320) 113 Noncore increases to net income — 2,194 9,022 43,092 2,352 Operating net income (Non-GAAP) $ 81,838 $ 82,113 $ 84,357 $ 77,354 $ 53,453 Weighted average common shares (diluted) 48,076,755 48,999,745 49,476,340 49,957,007 42,641,131 Diluted earnings per share (GAAP) $ 1.70 $ 1.63 $ 1.52 $ 0.69 $ 1.20 Diluted earnings per share, on an operating basis (Non-GAAP) $ 1.70 $ 1.68 $ 1.70 $ 1.55 $ 1.25 (1) The net taxes associated with noncore items is determined by assessing whether each noncore item is included or excluded from net taxable income and applying the Company’s combined marginal tax rate to only those items included in net taxable income. Ratios Return on average assets (GAAP) (calculated by dividing annualized net income by average assets) 1.34% 1.31% 1.20% 0.55% 1.04% Return on average assets on an operating basis (Non-GAAP) (calculated by dividing annualized operating net income by average assets) 1.34% 1.35% 1.34% 1.23% 1.09% Return on average common equity (GAAP) (calculated by dividing annualized net income by average common equity) 9.24% 9.02% 8.38% 3.82% 6.68% Return on average common equity on an operating basis (Non-GAAP) (calculated by dividing annualized operating net income by average common equity) 9.24% 9.27% 9.38% 8.63% 6.99% Return on average tangible common equity (Non-GAAP) (calculated by dividing annualized net income by average tangible common equity) 14.05% 13.67% 12.77% 5.85% 9.89% Return on average tangible common equity on an operating basis (Non-GAAP) (calculated by dividing annualized operating net income by average tangible common equity) 14.05% 14.05% 14.30% 13.22% 10.35%
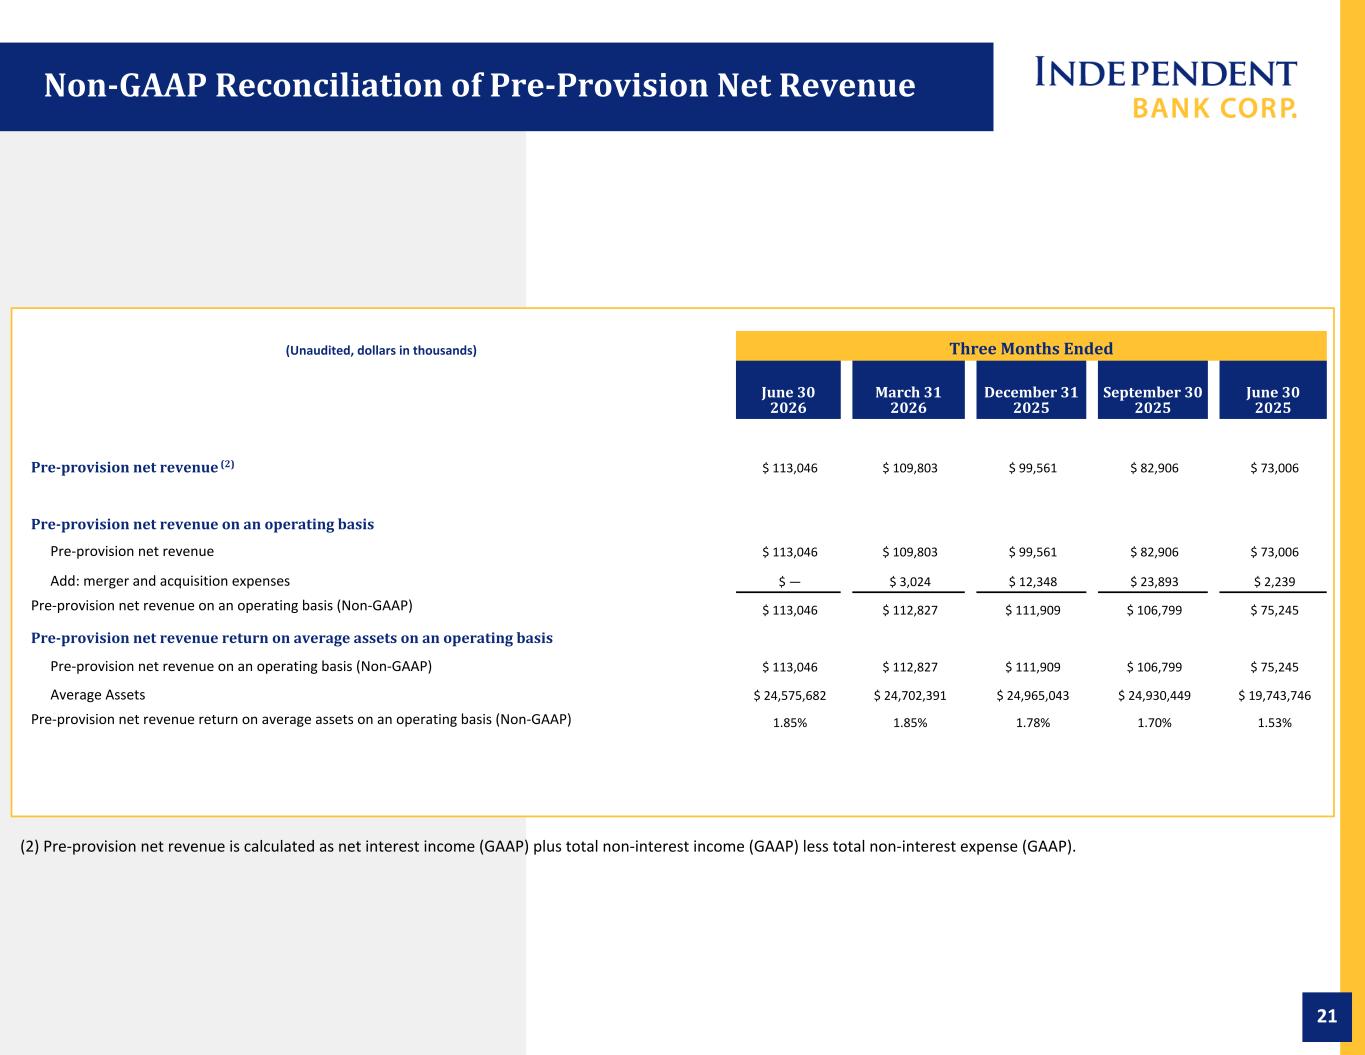
21 (Unaudited, dollars in thousands) Three Months Ended June 30 2026 March 31 2026 December 31 2025 September 30 2025 June 30 2025 Pre-provision net revenue (2) $ 113,046 $ 109,803 $ 99,561 $ 82,906 $ 73,006 Pre-provision net revenue on an operating basis Pre-provision net revenue $ 113,046 $ 109,803 $ 99,561 $ 82,906 $ 73,006 Add: merger and acquisition expenses $ — $ 3,024 $ 12,348 $ 23,893 $ 2,239 Pre-provision net revenue on an operating basis (Non-GAAP) $ 113,046 $ 112,827 $ 111,909 $ 106,799 $ 75,245 Pre-provision net revenue return on average assets on an operating basis Pre-provision net revenue on an operating basis (Non-GAAP) $ 113,046 $ 112,827 $ 111,909 $ 106,799 $ 75,245 Average Assets $ 24,575,682 $ 24,702,391 $ 24,965,043 $ 24,930,449 $ 19,743,746 Pre-provision net revenue return on average assets on an operating basis (Non-GAAP) 1.85% 1.85% 1.78% 1.70% 1.53% Non-GAAP Reconciliation of Pre-Provision Net Revenue (2) Pre-provision net revenue is calculated as net interest income (GAAP) plus total non-interest income (GAAP) less total non-interest expense (GAAP).
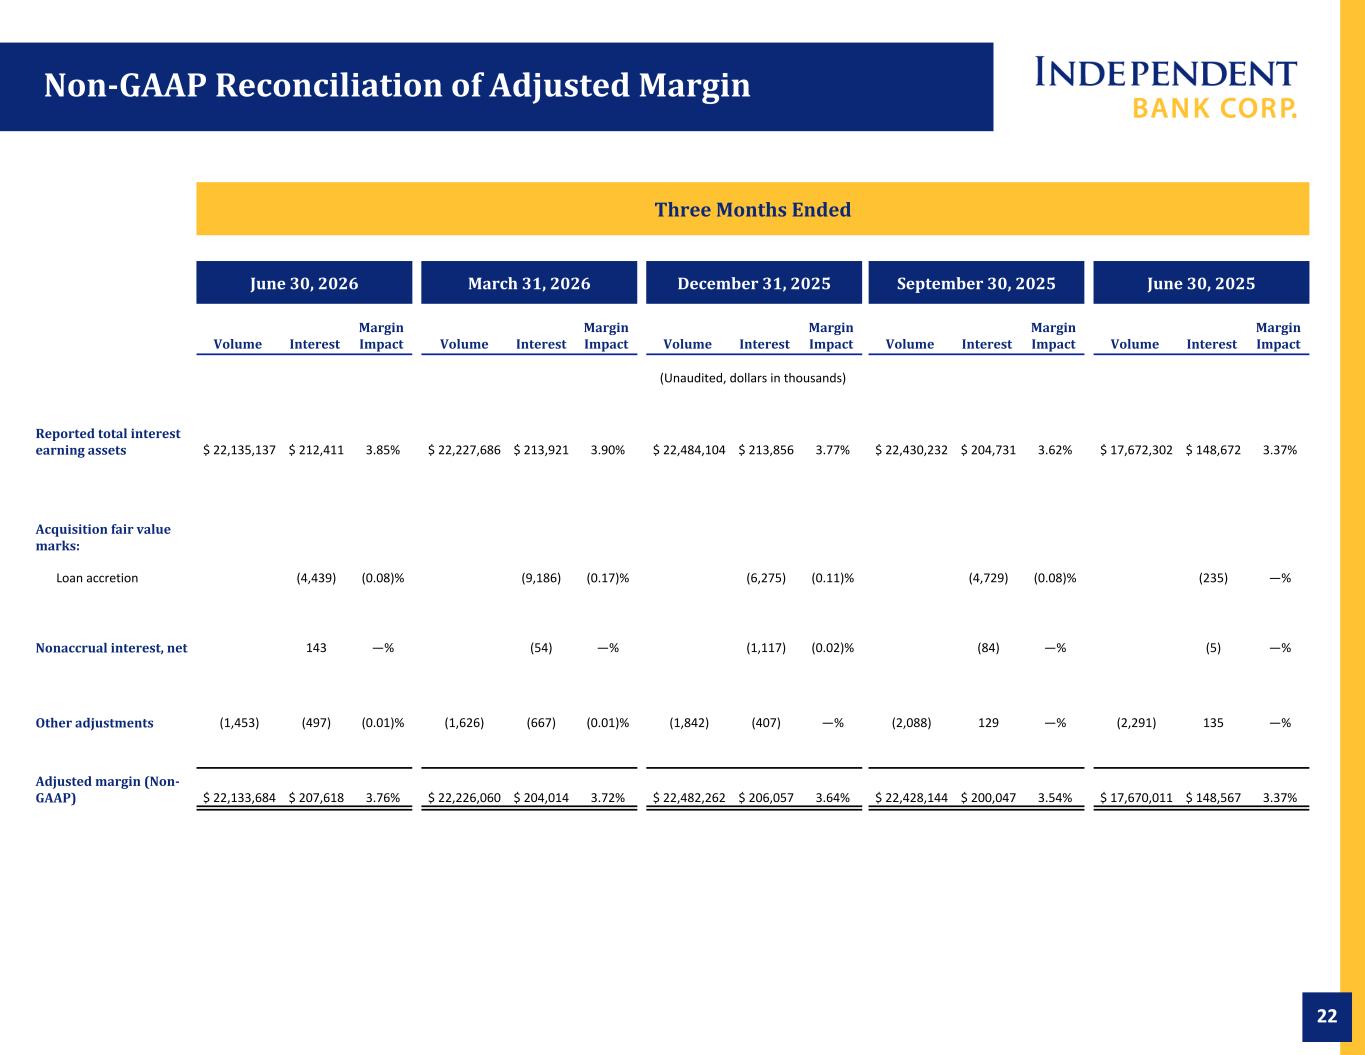
22 Three Months Ended June 30, 2026 March 31, 2026 December 31, 2025 September 30, 2025 June 30, 2025 Volume Interest Margin Impact Volume Interest Margin Impact Volume Interest Margin Impact Volume Interest Margin Impact Volume Interest Margin Impact (Unaudited, dollars in thousands) Reported total interest earning assets $ 22,135,137 $ 212,411 3.85% $ 22,227,686 $ 213,921 3.90% $ 22,484,104 $ 213,856 3.77% $ 22,430,232 $ 204,731 3.62% $ 17,672,302 $ 148,672 3.37% Acquisition fair value marks: Loan accretion (4,439) (0.08)% (9,186) (0.17)% (6,275) (0.11)% (4,729) (0.08)% (235) —% Nonaccrual interest, net 143 —% (54) —% (1,117) (0.02)% (84) —% (5) —% Other adjustments (1,453) (497) (0.01)% (1,626) (667) (0.01)% (1,842) (407) —% (2,088) 129 —% (2,291) 135 —% Adjusted margin (Non- GAAP) $ 22,133,684 $ 207,618 3.76% $ 22,226,060 $ 204,014 3.72% $ 22,482,262 $ 206,057 3.64% $ 22,428,144 $ 200,047 3.54% $ 17,670,011 $ 148,567 3.37% Non-GAAP Reconciliation of Adjusted Margin