Pay vs Performance Disclosure - USD ($)
Mar. 31, 2026
Mar. 31, 2025
Mar. 31, 2024
Mar. 31, 2023
Mar. 31, 2022
Pay Versus Performance Disclosure
The following table sets forth required disclosures regarding our principal executive officer (“PEO”) and
Non-PEO
NEOs and Company performance for the fiscal years listed below. These required disclosures include a figure labeled “Compensation Actually Paid” (“CAP”), which is calculated pursuant to SEC disclosure requirements. While CAP includes some compensation elements that are actually paid by the Company and received by the NEOs (namely, base salary and AIP payments), CAP includes amounts that the Company did not actually pay to the NEOs in the fiscal years below and that the NEOs did not receive from the Company. As such, CAP is not equivalent to realized pay.
The Compensation Committee did not consider these disclosures in evaluating compensation decisions in any year shown. For a fulsome discussion of how the Compensation Committee does seek to align executive pay with Company performance when making compensation decisions, please refer to “The Compensation Decision Making Process” and “Executive Compensation Program” in the CD&A.
Year |
Summary Compensation Table Total for PEO (1) ($) |
Compensation Actually Paid to PEO (1)(2) ($) |
Average Summary Compensation Table Total for Non-PEO NEOs (1) ($) |
Average Compensation Actually Paid to Non-PEO NEOs (1)(2) ($) |
Value of Initial Fixed $100 Investment based on (3) : |
Net Income ($ Thousands) |
EBITDA (4) ($ Thousands) | |||||||||||||||||||||||||||||||||
TSR ($) |
Peer Group TSR ($) | |||||||||||||||||||||||||||||||||||||||
2022 |
17,043,097 |
12,476,830 |
1,506,616 |
945,584 |
87.09 |
97.82 |
67,319 |
133,323 |
||||||||||||||||||||||||||||||||
2023 |
4,276,487 |
9,426,129 |
1,426,777 |
2,102,263 |
102.90 |
101.30 |
96,574 |
174,067 |
||||||||||||||||||||||||||||||||
2024 |
5,963,245 |
24,801,517 |
1,661,475 |
3,501,738 |
173.80 |
134.46 |
102,539 |
200,013 |
||||||||||||||||||||||||||||||||
2025 |
6,330,479 |
17,689,641 |
1,715,506 |
2,644,990 |
215.90 |
126.28 |
136,652 |
227,860 |
||||||||||||||||||||||||||||||||
2026 |
7,273,615 |
1,042,676 |
1,636,895 |
1,096,335 |
193.60 |
166.08 |
112,045 |
269,638 |
||||||||||||||||||||||||||||||||
(1) |
The individuals comprising the PEO and Non-PEO NEOs for each year presented are listed below: |
| |
2026 |
2025 |
2024 |
2023 |
2022 | |||||
PEO: NON-PEO NEOS: |
Joseph B. Armes James E. Perry Jeff A. Underwood Luke E. Alverson Danielle R. Garde |
Joseph B. Armes James E. Perry Donal J. Sullivan Luke E. Alverson Jeff A. Underwood |
Joseph B. Armes James E. Perry Donal J. Sullivan Luke E. Alverson Danielle R. Garde |
Joseph B. Armes James E. Perry Donal J. Sullivan Luke E. Alverson Danielle R. Garde |
Joseph B. Armes James E. Perry Donal J. Sullivan Luke E. Alverson |
(2) |
The amounts shown for CAP have been calculated in accordance with Item 402(v) of Regulation S-K. To calculate CAP for the PEO and Non-PEO NEOs, the following adjustments were made to the Summary Compensation Table (“SCT”) Total in accordance with SEC methodology: |
2026 |
2025 |
2024 |
2023 |
2022 |
||||||||||||||||||||||||||||||||||||
Year |
PEO ($) |
Non-PEO NEO Average ($) |
PEO ($) |
Non-PEO NEO Average ($) |
PEO ($) |
Non-PEO NEO Average ($) |
PEO ($) |
Non-PEO NEO Average ($) |
PEO ($) |
Non-PEO NEO Average ($) |
||||||||||||||||||||||||||||||
SCT Total |
7,273,615 |
1,636,895 |
6,330,479 |
1,715,506 |
5,963,245 |
1,661,475 |
4,276,487 |
1,426,777 |
17,043,097 |
1,506,616 |
||||||||||||||||||||||||||||||
Less: Change in Actuarial Value of Pension Plan Value |
(4,042 |
) |
— |
(5,148 |
) |
— |
(3,022 |
) |
— |
13,961 |
— |
6,486 |
— |
|||||||||||||||||||||||||||
Less: GDFV of Equity Awards Reported in SCT Total Compensation |
(4,938,001 |
) |
(785,562 |
) |
(4,221,414 |
) |
(882,670 |
) |
(3,733,051 |
) |
(781,912 |
) |
(2,251,035 |
) |
(661,237 |
) |
(15,314,974 |
) |
(726,354 |
) | ||||||||||||||||||||
Plus: Year End Fair Value of Equity Awards Granted in Covered Year |
3,959,044 |
653,897 |
5,145,837 |
1,012,317 |
6,923,908 |
1,412,904 |
2,982,181 |
866,910 |
12,266,848 |
593,743 |
||||||||||||||||||||||||||||||
Change in Fair Value of Equity Awards that Vested in Covered Year |
(177,091 |
) |
(48,520 |
) |
946,913 |
268,780 |
322,469 |
85,356 |
(65,768 |
) |
(5,276 |
) |
(22,956 |
) |
(5,535 |
) | ||||||||||||||||||||||||
Change in Fair Value of Outstanding Unvested Equity Awards from Prior Years |
(5,070,849 |
) |
(491,056 |
) |
9,492,974 |
351,722 |
15,327,968 |
995,941 |
4,470,303 |
475,088 |
(1,498,186 |
) |
(422,887 |
) | ||||||||||||||||||||||||||
Calculated CAP |
1,042,676 |
1,096,335 |
17,689,641 |
2,644,990 |
24,801,517 |
3,501,738 |
9,426,129 |
2,102,263 |
12,476,830 |
945,584 |
||||||||||||||||||||||||||||||
The above equity award values are calculated in accordance with FASB ASC Topic 718. |
(3) |
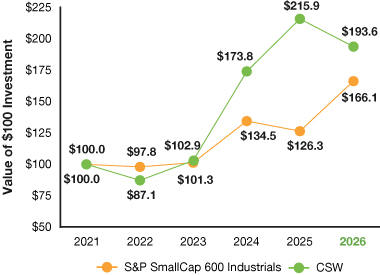
The Peer Group TSR set forth in this table utilizes the S&P SmallCap 600 Industrial Index, which we also utilize in the stock performance graph required by Item 201(e) of Regulation S-K included in our Annual Report. The comparison assumes $100 was invested for the period starting April 1, 2021, through March 31 of the listed year in each of the Company and in the index, respectively. |
(4) |
We determined EBITDA to be the most important financial performance measure used to link Company performance to the calculated CAPs of our PEO and Non-PEO NEOs in fiscal 2026. This performance measure may not have been the most important financial performance measure for fiscal years 2022, 2023, 2024 and 2025, and we may determine a different financial performance measure to be the most important financial performance measure in future years. EBITDA is defined for purposes of the AIP as set forth above in the “Compensation Discussion and Analysis” section. See Exhibit A for GAAP reconciliation information. |
(1) |
The individuals comprising the PEO and Non-PEO NEOs for each year presented are listed below: |
| |
2026 |
2025 |
2024 |
2023 |
2022 | |||||
PEO: NON-PEO NEOS: |
Joseph B. Armes James E. Perry Jeff A. Underwood Luke E. Alverson Danielle R. Garde |
Joseph B. Armes James E. Perry Donal J. Sullivan Luke E. Alverson Jeff A. Underwood |
Joseph B. Armes James E. Perry Donal J. Sullivan Luke E. Alverson Danielle R. Garde |
Joseph B. Armes James E. Perry Donal J. Sullivan Luke E. Alverson Danielle R. Garde |
Joseph B. Armes James E. Perry Donal J. Sullivan Luke E. Alverson |
S-K
included in our Annual Report. The comparison assumes $100 was invested for the period starting April 1, 2021, through March 31 of the listed year in each of the Company and in the index, respectively.
(2) |
The amounts shown for CAP have been calculated in accordance with Item 402(v) of Regulation S-K. To calculate CAP for the PEO and Non-PEO NEOs, the following adjustments were made to the Summary Compensation Table (“SCT”) Total in accordance with SEC methodology: |
2026 |
2025 |
2024 |
2023 |
2022 |
||||||||||||||||||||||||||||||||||||
Year |
PEO ($) |
Non-PEO NEO Average ($) |
PEO ($) |
Non-PEO NEO Average ($) |
PEO ($) |
Non-PEO NEO Average ($) |
PEO ($) |
Non-PEO NEO Average ($) |
PEO ($) |
Non-PEO NEO Average ($) |
||||||||||||||||||||||||||||||
SCT Total |
7,273,615 |
1,636,895 |
6,330,479 |
1,715,506 |
5,963,245 |
1,661,475 |
4,276,487 |
1,426,777 |
17,043,097 |
1,506,616 |
||||||||||||||||||||||||||||||
Less: Change in Actuarial Value of Pension Plan Value |
(4,042 |
) |
— |
(5,148 |
) |
— |
(3,022 |
) |
— |
13,961 |
— |
6,486 |
— |
|||||||||||||||||||||||||||
Less: GDFV of Equity Awards Reported in SCT Total Compensation |
(4,938,001 |
) |
(785,562 |
) |
(4,221,414 |
) |
(882,670 |
) |
(3,733,051 |
) |
(781,912 |
) |
(2,251,035 |
) |
(661,237 |
) |
(15,314,974 |
) |
(726,354 |
) | ||||||||||||||||||||
Plus: Year End Fair Value of Equity Awards Granted in Covered Year |
3,959,044 |
653,897 |
5,145,837 |
1,012,317 |
6,923,908 |
1,412,904 |
2,982,181 |
866,910 |
12,266,848 |
593,743 |
||||||||||||||||||||||||||||||
Change in Fair Value of Equity Awards that Vested in Covered Year |
(177,091 |
) |
(48,520 |
) |
946,913 |
268,780 |
322,469 |
85,356 |
(65,768 |
) |
(5,276 |
) |
(22,956 |
) |
(5,535 |
) | ||||||||||||||||||||||||
Change in Fair Value of Outstanding Unvested Equity Awards from Prior Years |
(5,070,849 |
) |
(491,056 |
) |
9,492,974 |
351,722 |
15,327,968 |
995,941 |
4,470,303 |
475,088 |
(1,498,186 |
) |
(422,887 |
) | ||||||||||||||||||||||||||
Calculated CAP |
1,042,676 |
1,096,335 |
17,689,641 |
2,644,990 |
24,801,517 |
3,501,738 |
9,426,129 |
2,102,263 |
12,476,830 |
945,584 |
||||||||||||||||||||||||||||||
(2) |
The amounts shown for CAP have been calculated in accordance with Item 402(v) of Regulation S-K. To calculate CAP for the PEO and Non-PEO NEOs, the following adjustments were made to the Summary Compensation Table (“SCT”) Total in accordance with SEC methodology: |
2026 |
2025 |
2024 |
2023 |
2022 |
||||||||||||||||||||||||||||||||||||
Year |
PEO ($) |
Non-PEO NEO Average ($) |
PEO ($) |
Non-PEO NEO Average ($) |
PEO ($) |
Non-PEO NEO Average ($) |
PEO ($) |
Non-PEO NEO Average ($) |
PEO ($) |
Non-PEO NEO Average ($) |
||||||||||||||||||||||||||||||
SCT Total |
7,273,615 |
1,636,895 |
6,330,479 |
1,715,506 |
5,963,245 |
1,661,475 |
4,276,487 |
1,426,777 |
17,043,097 |
1,506,616 |
||||||||||||||||||||||||||||||
Less: Change in Actuarial Value of Pension Plan Value |
(4,042 |
) |
— |
(5,148 |
) |
— |
(3,022 |
) |
— |
13,961 |
— |
6,486 |
— |
|||||||||||||||||||||||||||
Less: GDFV of Equity Awards Reported in SCT Total Compensation |
(4,938,001 |
) |
(785,562 |
) |
(4,221,414 |
) |
(882,670 |
) |
(3,733,051 |
) |
(781,912 |
) |
(2,251,035 |
) |
(661,237 |
) |
(15,314,974 |
) |
(726,354 |
) | ||||||||||||||||||||
Plus: Year End Fair Value of Equity Awards Granted in Covered Year |
3,959,044 |
653,897 |
5,145,837 |
1,012,317 |
6,923,908 |
1,412,904 |
2,982,181 |
866,910 |
12,266,848 |
593,743 |
||||||||||||||||||||||||||||||
Change in Fair Value of Equity Awards that Vested in Covered Year |
(177,091 |
) |
(48,520 |
) |
946,913 |
268,780 |
322,469 |
85,356 |
(65,768 |
) |
(5,276 |
) |
(22,956 |
) |
(5,535 |
) | ||||||||||||||||||||||||
Change in Fair Value of Outstanding Unvested Equity Awards from Prior Years |
(5,070,849 |
) |
(491,056 |
) |
9,492,974 |
351,722 |
15,327,968 |
995,941 |
4,470,303 |
475,088 |
(1,498,186 |
) |
(422,887 |
) | ||||||||||||||||||||||||||
Calculated CAP |
1,042,676 |
1,096,335 |
17,689,641 |
2,644,990 |
24,801,517 |
3,501,738 |
9,426,129 |
2,102,263 |
12,476,830 |
945,584 |
||||||||||||||||||||||||||||||
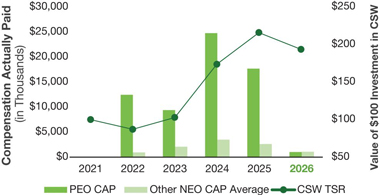
The following chart sets forth the relationship between the CAP calculation of our PEO, the average CAP of our other NEOs, and the Company’s cumulative TSR over the five most recently completed fiscal years.
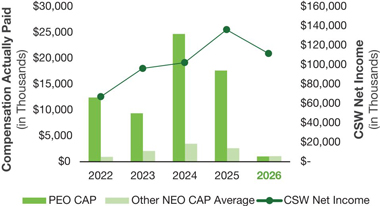
The following chart sets forth the relationship between the calculated CAP of our PEO, the average CAP of our other NEOs, and the Company’s Net Income over the five most recently completed fiscal years.
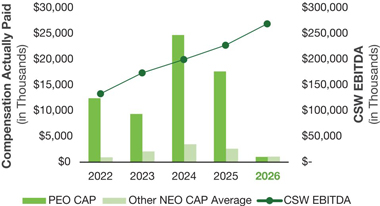
The following chart sets forth the relationship between the calculated CAP of our PEO, the average CAP of our other NEOs, and the Company’s EBITDA over the five most recently completed fiscal years.
The following chart compares the Company’s TSR over the last five completed fiscal years to that of the Peer Group over the same period.
The following table presents the financial performance measures that the Company considers to have been the most important in linking the CAP of our PEO and other NEOs for fiscal 2026 to Company performance. The CAP calculation is heavily influenced by the year-over-year change in values of unvested equity awards, and equity awards constitute the majority of our NEO’s compensation. As such, TSR performance has an outsized effect on CAP figures when compared to SCT totals.
TSR |
EBITDA |
Cash Flow from Operations |