Value of Initial Fixed $100 Investment Based on: | ||||||||||||||||||||||||||||||
(a) | | (b) | | (c) | | (d) | | (e) | | (f) | | (g) | | (h) | | (i) | | (j) | | (k) | ||||||||||
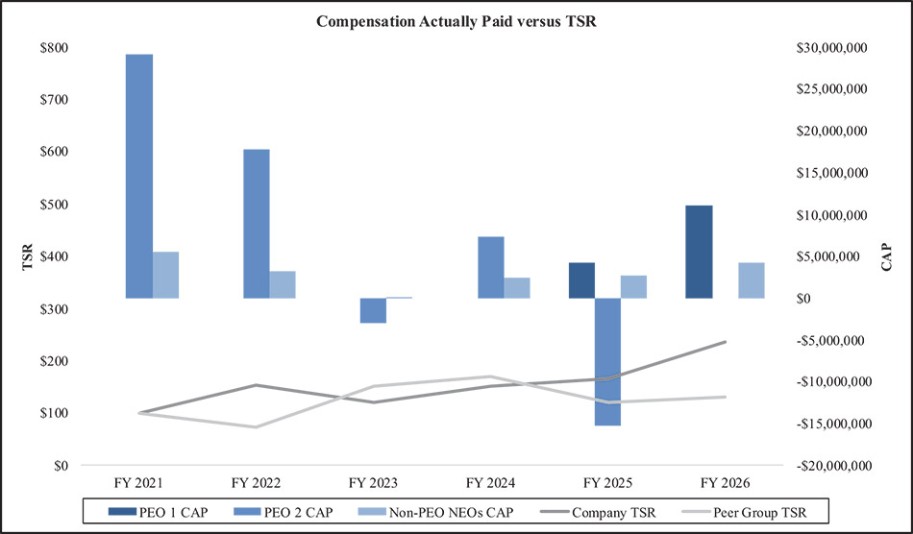
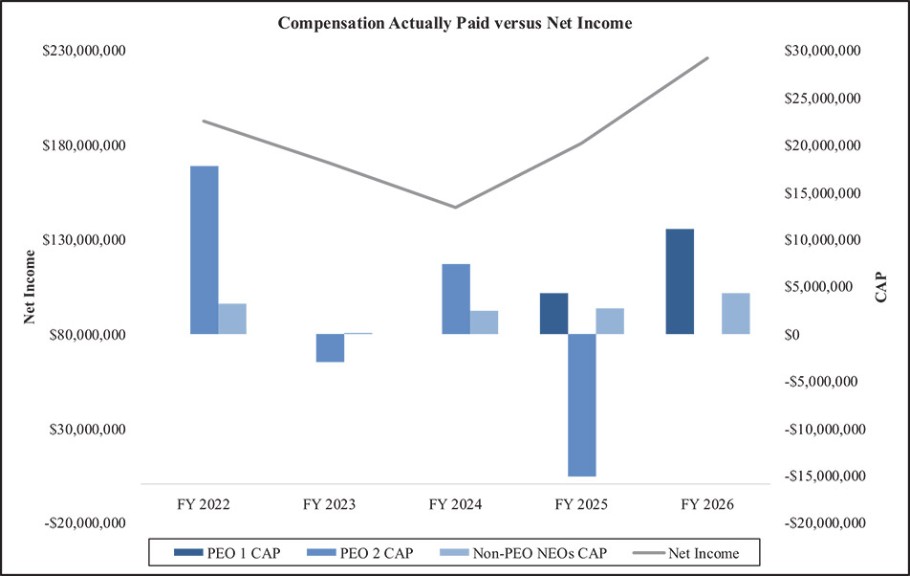
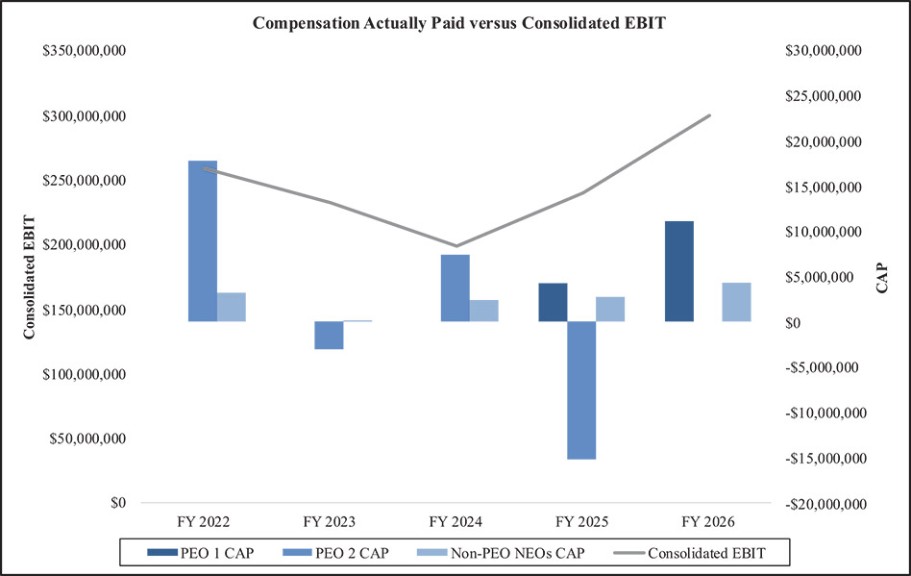
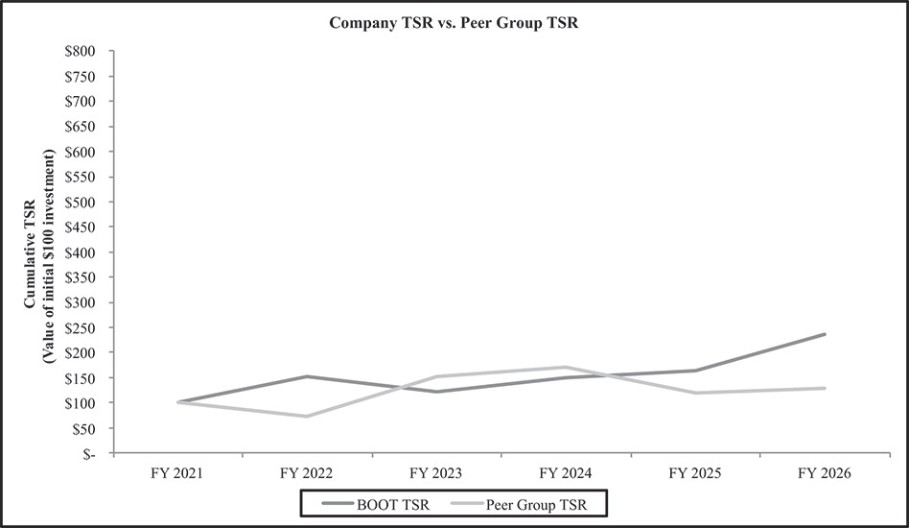
2026 | $ | 6,661,922 | $ | - | $ | 11,060,323 | $ | - | $ | 2,283,273 | $ | 4,269,230 | $ | 235.75 | $ | 117.76 | $ | 225,880 | $ | 299,145 | ||||||||||
2025 | 3,565,927 | 5,914,378 | 4,216,572 | (15,220,969) | 2,162,934 | 2,702,319 | 164.57 | 112.74 | 180,942 | 239,352 | ||||||||||||||||||||
2024 | 6,973,503 | 7,367,614 | 1,815,713 | 2,369,165 | 150.32 | 147.96 | 146,996 | 198,214 | ||||||||||||||||||||||
2023 | 9,795,809 | (3,068,276) | 1,476,243 | 103,495 | 121.07 | 100.55 | 170,553 | 231,787 | ||||||||||||||||||||||
2022 | 4,479,778 | 17,738,024 | 1,419,248 | 3,174,953 | 152.50 | 83.37 | 192,450 | 258,338 | ||||||||||||||||||||||
| (1) | NEOs included in the above compensation columns reflect the following: |
Fiscal Year | PEO | Non-PEO NEOs | ||
2026 | | John Hazen | | James M. Watkins, Laurie Grijalva, Jonathon Kosoff, Michael A. Love |
2025 | John Hazen (beginning November 22, 2024) | James M. Watkins, Peter Starrett, Laurie Grijalva, Michael A. Love | ||
2024 | James G. Conroy | James M. Watkins, Laurie Grijalva, John Hazen, Michael A. Love | ||
2023, 2022 | James G. Conroy | Gregory V. Hackman, James M. Watkins, Laurie Grijalva, John Hazen, Michael A. Love |
| (2) | The dollar amounts reported in columns (d), (e), and (g) represent the amounts of CAP to PEO 1, CAP to PEO 2, and Average CAP to Non-PEO NEOs, respectively. CAP does not necessarily represent cash and/or equity value transferred to the PEOs or Non-PEO NEOs without restriction, but rather is a value calculated in accordance with applicable SEC rules. As the Company does not have a defined benefit plan, no adjustments for pension benefits are included in the below tables. Similarly, no adjustments were made for dividends, as the Company has not paid any dividends. No adjustments were made for equity awards that were granted and vested in the same fiscal year, as there were no such equity awards for the fiscal years presented. Additionally, no adjustments were made for equity awards that failed to meet their vesting conditions, as any such equity awards were previously accounted for in prior fiscal years. The following tables reconcile CAP to the SCT Total for the PEOs and the Non-PEO NEOs. |
PEO 1 SCT Total to CAP Reconciliation
Fiscal 2026 | Fiscal 2025 | |||||
SCT Total | $ | 6,661,922 | $ | 3,565,927 | ||
Less: Grant Date Fair Value of Option and Stock Awards Granted in Fiscal Year | 4,100,160 | 1,850,221 | ||||
Plus: Year-End Fair Value of Outstanding and Unvested Equity Awards Granted in Fiscal Year | 5,856,681 | 2,109,234 | ||||
Plus: Change in Fair Value of Outstanding and Unvested Equity Awards from Prior Fiscal Years | 2,379,760 | 155,754 | ||||
Plus: Change in Fair Value of Vested Equity Awards Granted from Prior Fiscal Years | 262,120 | 235,878 | ||||
CAP | $ | 11,060,323 | $ | 4,216,572 | ||
PEO 2 SCT Total to CAP Reconciliation
Fiscal 2026 | Fiscal 2025 | Fiscal 2024 | Fiscal 2023 | Fiscal 2022 | |||||||||||
SCT Total | $ | - | $ | 5,914,378 | $ | 6,973,503 | $ | 9,795,809 | $ | 4,479,778 | |||||
Less: Grant Date Fair Value of Option and Stock Awards Granted in Fiscal Year | - | 5,250,100 | 4,899,980 | 8,200,025 | 1,600,078 | ||||||||||
Plus: Year-End Fair Value of Outstanding and Unvested Equity Awards Granted in Fiscal Year | - | - | 6,766,392 | 3,795,733 | 986,054 | ||||||||||
Plus: Change in Fair Value of Outstanding and Unvested Equity Awards from Prior Fiscal Years | - | - | 2,045,422 | (6,212,364) | 12,759,978 | ||||||||||
Plus: Change in Fair Value of Vested Equity Awards Granted from Prior Fiscal Years | - | 892,225 | (3,517,723) | (2,247,429) | 1,112,292 | ||||||||||
Less: Fair Value as of Prior Fiscal Year-End of Equity Awards that Failed to Meet Applicable Vesting Conditions | - | 16,777,472 | - | ||||||||||||
CAP | $ | - | $ | (15,220,969) | $ | 7,367,614 | $ | (3,068,276) | $ | 17,738,024 | |||||
Average Non-PEO NEOs SCT Total to CAP Reconciliation
Fiscal 2026 | Fiscal 2025 | Fiscal 2024 | Fiscal 2023 | Fiscal 2022 | |||||||||||
SCT Total | $ | 2,283,273 | $ | 2,162,934 | $ | 1,815,713 | $ | 1,476,243 | $ | 1,419,248 | |||||
Less: Grant Date Fair Value of Option and Stock Awards Granted in Fiscal Year | 1,075,187 | 1,117,637 | 999,984 | 760,030 | 464,967 | ||||||||||
Plus: Year-End Fair Value of Outstanding and Unvested Equity Awards Granted in Fiscal Year | 1,535,801 | 1,382,935 | 1,380,883 | 334,917 | 294,822 | ||||||||||
Plus: Change in Fair Value of Outstanding and Unvested Equity Awards from Prior Fiscal Years | 1,324,668 | 116,513 | 274,804 | (530,391) | 1,573,495 | ||||||||||
Plus: Change in Fair Value of Vested Equity Awards Granted from Prior Fiscal Years | 200,675 | 157,574 | (102,251) | (417,244) | 352,355 | ||||||||||
CAP | $ | 4,269,230 | $ | 2,702,319 | $ | 2,369,165 | $ | 103,495 | $ | 3,174,953 | |||||
| (3) | Total Stockholder Return (“TSR”) and peer group TSR reflect our TSR compared to that of a peer group of similarly-sized (based on EBITDA, market capitalization, and revenue sizes, as well as total shareholder return) publicly-traded companies in similar business sectors, most notably specialty retail, used by our compensation committee in making executive compensation determinations and described under “Compensation Discussion and Analysis.” Information regarding the peer group, including changes in the companies comprising the fiscal 2026 peer group and the TSR calculations based on the fiscal 2025 peer group, is set forth under “Company TSR Compared to Peer Group TSR.” TSR for both the Company and the peer group is based on an initial $100 investment, measured on a cumulative basis from the market close on March 26, 2021, through and including the end of the applicable fiscal year as presented in the table. TSR calculations reflect reinvestment of dividends. |
| (4) | In accordance with SEC rules, the table must include, in addition to relative TSR and Net Income, a Company-Selected Measure (“CSM”). We have included Consolidated EBIT, a non-GAAP financial measure that is defined for this purpose as earnings before income taxes, excluding certain one-time selling, general, and administrative expenses. As discussed above under “Compensation Discussion and Analysis,” Consolidated EBIT is a key measure used in determining compensation of our NEOs. |
| (1) | NEOs included in the above compensation columns reflect the following: |
Fiscal Year | PEO | Non-PEO NEOs | ||
2026 | | John Hazen | | James M. Watkins, Laurie Grijalva, Jonathon Kosoff, Michael A. Love |
2025 | John Hazen (beginning November 22, 2024) | James M. Watkins, Peter Starrett, Laurie Grijalva, Michael A. Love | ||
2024 | James G. Conroy | James M. Watkins, Laurie Grijalva, John Hazen, Michael A. Love | ||
2023, 2022 | James G. Conroy | Gregory V. Hackman, James M. Watkins, Laurie Grijalva, John Hazen, Michael A. Love |
| (3) | Total Stockholder Return (“TSR”) and peer group TSR reflect our TSR compared to that of a peer group of similarly-sized (based on EBITDA, market capitalization, and revenue sizes, as well as total shareholder return) publicly-traded companies in similar business sectors, most notably specialty retail, used by our compensation committee in making executive compensation determinations and described under “Compensation Discussion and Analysis.” Information regarding the peer group, including changes in the companies comprising the fiscal 2026 peer group and the TSR calculations based on the fiscal 2025 peer group, is set forth under “Company TSR Compared to Peer Group TSR.” TSR for both the Company and the peer group is based on an initial $100 investment, measured on a cumulative basis from the market close on March 26, 2021, through and including the end of the applicable fiscal year as presented in the table. TSR calculations reflect reinvestment of dividends. |
PEO 1 SCT Total to CAP Reconciliation
Fiscal 2026 | Fiscal 2025 | |||||
SCT Total | $ | 6,661,922 | $ | 3,565,927 | ||
Less: Grant Date Fair Value of Option and Stock Awards Granted in Fiscal Year | 4,100,160 | 1,850,221 | ||||
Plus: Year-End Fair Value of Outstanding and Unvested Equity Awards Granted in Fiscal Year | 5,856,681 | 2,109,234 | ||||
Plus: Change in Fair Value of Outstanding and Unvested Equity Awards from Prior Fiscal Years | 2,379,760 | 155,754 | ||||
Plus: Change in Fair Value of Vested Equity Awards Granted from Prior Fiscal Years | 262,120 | 235,878 | ||||
CAP | $ | 11,060,323 | $ | 4,216,572 | ||
PEO 2 SCT Total to CAP Reconciliation
Fiscal 2026 | Fiscal 2025 | Fiscal 2024 | Fiscal 2023 | Fiscal 2022 | |||||||||||
SCT Total | $ | - | $ | 5,914,378 | $ | 6,973,503 | $ | 9,795,809 | $ | 4,479,778 | |||||
Less: Grant Date Fair Value of Option and Stock Awards Granted in Fiscal Year | - | 5,250,100 | 4,899,980 | 8,200,025 | 1,600,078 | ||||||||||
Plus: Year-End Fair Value of Outstanding and Unvested Equity Awards Granted in Fiscal Year | - | - | 6,766,392 | 3,795,733 | 986,054 | ||||||||||
Plus: Change in Fair Value of Outstanding and Unvested Equity Awards from Prior Fiscal Years | - | - | 2,045,422 | (6,212,364) | 12,759,978 | ||||||||||
Plus: Change in Fair Value of Vested Equity Awards Granted from Prior Fiscal Years | - | 892,225 | (3,517,723) | (2,247,429) | 1,112,292 | ||||||||||
Less: Fair Value as of Prior Fiscal Year-End of Equity Awards that Failed to Meet Applicable Vesting Conditions | - | 16,777,472 | - | ||||||||||||
CAP | $ | - | $ | (15,220,969) | $ | 7,367,614 | $ | (3,068,276) | $ | 17,738,024 | |||||
Average Non-PEO NEOs SCT Total to CAP Reconciliation
Fiscal 2026 | Fiscal 2025 | Fiscal 2024 | Fiscal 2023 | Fiscal 2022 | |||||||||||
SCT Total | $ | 2,283,273 | $ | 2,162,934 | $ | 1,815,713 | $ | 1,476,243 | $ | 1,419,248 | |||||
Less: Grant Date Fair Value of Option and Stock Awards Granted in Fiscal Year | 1,075,187 | 1,117,637 | 999,984 | 760,030 | 464,967 | ||||||||||
Plus: Year-End Fair Value of Outstanding and Unvested Equity Awards Granted in Fiscal Year | 1,535,801 | 1,382,935 | 1,380,883 | 334,917 | 294,822 | ||||||||||
Plus: Change in Fair Value of Outstanding and Unvested Equity Awards from Prior Fiscal Years | 1,324,668 | 116,513 | 274,804 | (530,391) | 1,573,495 | ||||||||||
Plus: Change in Fair Value of Vested Equity Awards Granted from Prior Fiscal Years | 200,675 | 157,574 | (102,251) | (417,244) | 352,355 | ||||||||||
CAP | $ | 4,269,230 | $ | 2,702,319 | $ | 2,369,165 | $ | 103,495 | $ | 3,174,953 | |||||
Tabular Disclosure of Most Important Compensation-Related Measures
The following table sets forth an unranked list of the most important measures, including the CSM, used by the Company to link CAP for the PEOs and each of the Non-PEO NEOs to Company performance for fiscal 2026 as described in more detail above under “Compensation Discussion and Analysis”:
PEO | Non-PEO NEOs | |||||||||
John Hazen | James M. Watkins | Laurie Grijalva | Jon Kosoff | Michael A. Love | ||||||
Consolidated EBIT* | X | X | X | X | X | |||||
Earnings per Diluted Share | X | X | X | X | X | |||||
Revenue | X | X | X | X | X | |||||
Consolidated Merchandise Margin | X | |||||||||
Consolidated Exclusive Brand Sales Penetration | X | X | X | |||||||
* Consolidated EBIT is a non-GAAP financial measure that is defined for this purpose as earnings before income taxes, excluding certain one-time selling, general, and administrative expenses.
| (4) | In accordance with SEC rules, the table must include, in addition to relative TSR and Net Income, a Company-Selected Measure (“CSM”). We have included Consolidated EBIT, a non-GAAP financial measure that is defined for this purpose as earnings before income taxes, excluding certain one-time selling, general, and administrative expenses. As discussed above under “Compensation Discussion and Analysis,” Consolidated EBIT is a key measure used in determining compensation of our NEOs. |