
Exhibit 99.2
TRX GOLD CORPORATION
MANAGEMENT’S DISCUSSION AND ANALYSIS
For the three and nine month periods ended May 31, 2026
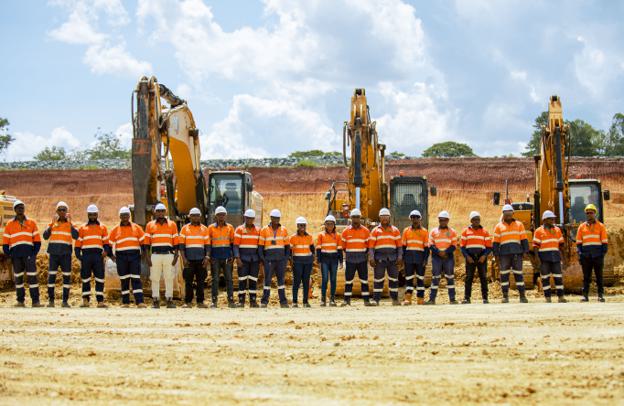
| Management’s Discussion and Analysis May 31, 2026 |
The following Management’s Discussion and Analysis (“MD&A”) of the financial condition and results of operations for TRX Gold Corporation (“TRX Gold” or the “Company”) should be read in conjunction with the Company’s Unaudited Interim Condensed Consolidated Financial Statements for the three and nine months ended May 31, 2026, as well as the Company’s audited consolidated financial statements included in the Company’s Annual Report on Form 40-F and Annual Information Form for the year ended August 31, 2025. The financial statements and related notes of TRX Gold have been prepared in accordance with International Financial Reporting Standards (“IFRS”). Additional information, including our press releases, has been filed electronically on SEDAR+ and is available online under the Company’s profile at www.sedarplus.ca, on EDGAR at www.sec.gov/edgar, and on our website at www.TRXGold.com.
This MD&A reports our activities to date, July 14, 2026, unless otherwise indicated. References to the 3rd quarter of 2026 or Q3 2026, and references to the 3rd quarter of 2025 or Q3 2025 mean the three months ended May 31, 2026, and May 31, 2025, respectively. References to fiscal 2026 and fiscal 2025 mean the twelve months ended August 31, 2026, and August 31, 2025, respectively. Unless otherwise noted, all references to currency in this MD&A refer to US dollars. Certain prior period amounts have been restated to conform with current period classification. Unless clearly otherwise referenced to a specific table, numbers referenced refer to numbered Endnotes on page 41.
Disclosure and Cautionary Statement Regarding Forward Looking Information
This MD&A contains certain forward-looking statements and forward-looking information, including without limitation statements about TRX Gold’s future business, operations and production capabilities. All statements, other than statements of historical fact, included herein are forward-looking statements and forward-looking information that involve various risks and uncertainties. There can be no assurance that such statements will prove to be accurate, and actual results and future events could differ materially from those anticipated in such statements. Although TRX Gold believes the expectations expressed in such forward-looking statements are based on reasonable assumptions, such statements are not guarantees of future performance. The actual achievements of TRX Gold or other future events or conditions may differ materially from those reflected in the forward-looking statements due to a variety of risks, uncertainties and other factors. These risks, uncertainties and factors include general business, legal, economic, competitive, political, regulatory and social uncertainties; actual results of exploration activities and economic evaluations; fluctuations in currency exchange rates; changes in costs; future prices of gold and other minerals; mining method, production profile and mine plan; delays in exploration, development and construction activities; changes in government legislation and regulation; the ability to obtain financing on acceptable terms and in a timely manner or at all; contests over title to properties; employee relations and shortages of skilled personnel and contractors; and the speculative nature of, and the risks involved in, the exploration, development and mining business.
Mr. Richard Boffey, BE Mining (Hons) F AusIMM, Chief Operating Officer of TRX Gold Corporation, is the Company’s in-house Qualified Person under National Instrument 43-101 “Standards of Disclosure for Mineral Projects” (“NI 43-101”) and has reviewed and assumes responsibility for the scientific and technical content in this MD&A.
| 1 |
| Management’s Discussion and Analysis May 31, 2026 |
The disclosure contained in this MD&A of a scientific or technical nature relating to the Company’s Buckreef Project has been summarized or extracted from the technical report prepared in accordance with NI 43-101 – Standards of Disclosure for Mineral Projects on the Buckreef Gold Project (“Buckreef Gold”) titled Preliminary Economic Assessment and Updated Mineral Resource Estimate of the Buckreef Gold Mine Project, Tanzania (“PEA”) with an effective date of April 15, 2025. The PEA was prepared in accordance with NI 43-101 guidelines by P&E Mining Consultants Inc. (“P&E”). Input to this PEA was also provided by D.E.N.M. Engineering Ltd. (“D.E.N.M.”). The information contained herein is subject to all of the assumptions, qualifications and procedures set out in, and is qualified in its entirety by reference to the full text of, the PEA and reference should be made to the full details of the PEA which has been filed with the applicable regulatory authorities and is available on the Company’s profile at www.sedarplus.ca.
Certain information presented in this MD&A may constitute “forward-looking statements” and “forward looking information” within the meaning of the U.S. Private Securities Litigation Reform Act of 1995 and under securities legislation applicable in Canada, respectively. Such forward-looking statements and information are based on numerous assumptions, and involve known and unknown risks, uncertainties, and other factors, including risks inherent in mineral exploration and development, which may cause the actual results, performance, or achievements of the Company to be materially different from any projected future results, performance, or achievements expressed or implied by such forward-looking statements and information. Investors are referred to our description of the risk factors affecting the Company, as contained in our U.S. Securities and Exchange Commission (“SEC”) filings, including our Annual Report on Form 40-F and Report of Foreign Private Issuer on Form 6-K, and our Annual Information Form also posted on SEDAR+ and EDGAR, for more information concerning these risks, uncertainties, and other factors.
TRX Gold Corporation
TRX Gold is a high margin and growing gold company advancing the Buckreef Gold Project in Tanzania. Buckreef Gold includes an established open pit operation and 2,000 tonnes per day process plant with upside potential demonstrated in the May 2025 PEA. The PEA outlines average gold production of 62,000 oz per annum over 17.6 years at 3,000 tonnes per day (“tpd”) of throughput capacity, and $1.9 - $2.6 billion pre-tax NPV5% at average life of mine gold price of $4,000/oz - $5,000/oz. The Buckreef Gold Project hosts a Measured and Indicated Mineral Resource of 10.8 million tonnes (“MT”) at 2.57 grams per tonne (“g/t”) gold containing 893,000 ounces (“oz”) of gold and an Inferred Mineral Resource of 9.1 MT at 2.47 g/t gold for 726,000 oz of gold. The leadership team is focused on creating both near-term and long-term shareholder value by increasing gold production to generate positive cash flow to fund the expansion as outlined in the PEA, grow Mineral Resources through exploration, and update the PEA with a larger capacity beyond 3,000 tpd. TRX Gold’s actions are led by the highest environmental, social and corporate governance (“ESG”) standards, evidenced by the relationships and programs that the Company has developed during its nearly two decades of presence in the Geita Region, Tanzania.
| 2 |
| Management’s Discussion and Analysis May 31, 2026 |
Highlights – Third Quarter and Year to Date 2026
The Company continued its strong production momentum by delivering record processing plant throughput and improved recoveries during Q3 2026, which drove strong quarterly production and a record buildup of gold-in-circuit inventory, demonstrating the operational strength and scalability of Buckreef Gold. With production increasing by 58% year-over-year and recoveries improving to 84.9%, the Company continues to demonstrate leverage to high gold spot prices, realizing robust gross profit margins and strong cash flow generation, including record quarterly adjusted EBITDA of $20.7 million during Q3 2026. During Q3 2026, the Company was able to continue to improve its working capital position to approximately 2.2 times, including a cash position of $26.8 million, while continuing to invest in the future growth and development of Buckreef Gold. During Q3 2026, the Company announced robust recovery results from metallurgical testwork above what was assumed in the PEA as part of its current flowsheet optimization and future expanded processing plant development. Testwork has led to a letter of award for a new 3,500 tpd mill, operating in conjunction with the existing, upgraded 2,000 tpd plant, which is a much larger processing facility than the 3,000 tpd mill that was initially contemplated in the PEA. The expanded plant is now expected to produce greater than 62 thousand ounces of average annual gold as published in the PEA. The Company also initiated a revision of the life-of-mine plan, which has the potential to extend the open pit and add recoverable ounces, improving the overall economics of the project. During Q3 2026, the Company also made significant progress on its life-of-mine tailings storage facility. All required regulatory approvals and permits have been received, a construction contractor has been selected, and Stage 1 is targeted for completion in Q2 2027. The Company’s short-to-medium term priorities are to continue to expand and upgrade processing capacity above the PEA, advance exploration drilling in key areas, continue to strengthen liquidity, and use cash flow from operations to self-fund value creating activities.
Key Q3 and Year to Date 2026 Financial and Operational Highlights:
| · | During Q3 2026 the Company continued to make progress on upgrades to the 2,000 tpd processing plant, including accelerated manufacturing for several key components, including installation of the pre-leach thickener, upgraded agitators & interstage screens, Aachen reactor, oxygen plant, apron feeder and belt magnet. The plant upgrades are in various stages of completion and have already begun to boost plant reliability and performance as evidenced by an increase in plant throughput (1,690 tpd) and an improvement in recovery (84.9%) in Q3 2026. |
| · | During Q3 2026, the Company reported results of ongoing metallurgical testwork as part of its current flowsheet optimisation and future expanded processing plant development. Recovery rates between 89% - 92% were achieved from metallurgical test work, which is above the 88% recovery rate assumed in the PEA. Testwork has led the Company to specify a Semi Autogenous Grind (“SAG”) / Ball mill combination of 3,500 tpd. A letter of award for the new SAG and Ball mills has been initiated with final contract execution expected in Q4 2026 and an initial estimated completion date of 12 – 18 months. The existing, upgraded 2,000 tpd processing plant will be available to continue operating in conjunction with the new 3,500 tpd SAG / Ball mill processing plant, providing a significant upgrade in processing capacity versus the 3,000 tpd assumed in the PEA. The increase in throughput from the expanded processing plant is expected to produce average annual gold production in excess of the 62,000 ounces of gold originally anticipated in the PEA. |
| · | During Q3 2026 the Company also initiated a revision of the life-of-mine plan as a result of the expected increase in processing capacity and the increase in gold price well above the PEA reserve estimate. Preliminary analysis indicates the potential for an expanded open pit, which could extend open pit operations, defer commencement of underground mining in the Main Zone and enhance total recoverable ounces. The Company is also evaluating the potential for an earlier start to underground mining of Stamford Bridge, alongside accelerating mining of the Eastern Porphyry. This is expected to improve the overall economics of the project. Throughput rates for the updated PEA will be determined by the revised mine plan, which will feed the new 3,500 tpd processing plant and existing, upgraded 2,000 tpd processing plant. |
| 3 |
| Management’s Discussion and Analysis May 31, 2026 |
| · | During Q3 2026, Buckreef Gold achieved record processing plant throughput, and poured 7,426 ounces of gold, an increase of 58% from the prior year, and sold 6,983 ounces, an increase of 75% from the prior year, at a record average realized price (net)1 of $4,703 per ounce. The Company recognized revenue of $32.9 million, gross profit of $19.5 million, gross profit margin of 59%, adjusted net income1 of $10.1 million, operating cash flow of $8.8 million and record adjusted EBITDA[1] of $20.7 million, all of which reflect increases compared to the prior year comparative period, demonstrating the Company’s leverage to record gold prices during Q3 2026. |
| · | Year to date, the Company poured 21,476 ounces of gold and recognized revenue of $92.0 million, gross profit of $54.7 million, adjusted net income1 of $29.5 million, operating cash flow of $20.5 million and adjusted EBITDA1 of $54.1 million. Revenue, gross profit, adjusted net income, and adjusted EBITDA1 were all year to date records for the Company, and reflected increases compared to the prior year comparative period mainly due to the impact of a higher average gold price realized on higher ounces of gold sold. During the period, the Company continued to demonstrate leverage to high gold price levels and sold 20,789 ounces of gold at an average realized price (net)1 of $4,423 per ounce. |
| · | During Q3 2026 the Company continued to strengthen its working capital position through increased production, organically generated cashflow, improved liquidity and an increase in stockpile inventory. As a result, the Company’s current ratio has improved to a ratio of approximately 2.2 at May 31, 2026, including a cash balance of $26.8 million, an increase in net cash of approximately $19.1 million from year-end. |
| · | During Q3 2026, the Company continued to invest in mine development, mill optimizations, and run of mine (“ROM”) stockpile inventory. The ROM and crushed ore stockpile has grown to an estimated 19,566 ounces of contained gold as at May 31, 2026, as the Company continued to access higher grade ore blocks in the pit and processed a higher proportion of high grade mined material. The fair market value of the stockpile is approximately $89.0 million at current market prices. |
| · | During Q3 2026, the Company completed its 3-stage geophysical survey that commenced in Q4 2025. From this dipole-dipole survey, a total of 13 drill holes covering 1,850 meters has been identified for initial drill-testing across 9 sections as a preliminary test pattern. These holes, which are outside current known resources, are expected to be drilled in Q4 2026. Concurrently, in Q3 2026, approximately 50% of the fourteen-kilometer Eastern Porphyry drill program was completed with the Company’s newly commissioned Reverse Circulation (“RC”) drill rig with the goal of upgrading the Mineral Resource at the Eastern Porphyry. |
| · | The Company achieved zero lost time injuries (“LTI”), achieving the outstanding achievement of exceeding 6,000,000 manhours LTI-free. There were no reportable environmental incidents during Q3 2026. |
____________________________
Numerical annotations throughout the text of the remainder of this document refer to the endnotes found on page 41.
| 4 |
| Management’s Discussion and Analysis May 31, 2026 |
Recent Company Developments:
| · | TRX Gold Reports Robust Recovery Rates from Recent Study and Significant Increase in Plant Expansion Scope: In Q3 2026, the Company announced results of ongoing metallurgical test work at Buckreef Gold as part of its current flowsheet optimization and future expanded processing plant development. The Company is in the process of planning and executing a much larger processing plant expansion than originally anticipated in the May 2025 PEA at Buckreef Gold. |
| · | Robust Recovery Rates Achieved: Recovery rates between 89% - 92% were achieved from the additional test work, which is in line with prior studies and above the 88% recovery rate assumed in the PEA. The test work provided a more comprehensive understanding of optimal grind size and achievable mine feed from the mine plan, which has led the Company to specify a SAG / Ball mill combination of 3,500 tpd. A letter of award for the new SAG mill has been initiated with final contract execution expected in Q4 2026 and an initial estimated completion date of 12 – 18 months. |
| · | Advancing Existing Processing Plant Upgrades and Increased Expansion: The existing 2,000 tpd processing plant is currently undergoing significant upgrades and will be available to continue operating in conjunction with the new 3,500 tpd SAG mill processing plant, providing a significant upgrade in processing capacity versus the 3,000 tpd assumed in the PEA. Notable upgrades to the existing processing plant include completed installation and commissioning of upgraded agitators & interstage screens, apron feeder, belt magnet, and a new tertiary crusher. A pre-leach thickener is installed and will be commissioned in Q4 2026. These upgrades are currently in progress and are expected to be completed by calendar Q4 2026. A new Adsorption, Desorption and Recovery (“ADR”) plant and new gold room will be shipped in Q4 2026 and will be commissioned in early Q1 2027. |
| · | Strategic Mine Planning to Expand Further: The Company has also progressed a revision of the life-of-mine plan as a result of the expected increase in processing capacity and the increase in gold price well above the PEA reserve estimate assumption of US$1,900/oz. Preliminary analysis indicates the potential for an expanded third cutback at the Main Pit, which could extend open-pit operations, defer commencement of underground mining in the Main Zone and enhance total recoverable ounces at Buckreef Gold. This is expected to improve the overall economics of the project. The Company is also evaluating the potential for an earlier start to underground mining at the Stamford Bridge orebody, alongside accelerating mining of the expanded Eastern Porphyry pit. The Company has hired P&E Mining Consultants Inc. to update the PEA, which is expected to be completed in calendar Q2 2027. |
| · | Planning for Expanded Mill Throughput: Mine planning and scheduling as part of updated PEA will incorporate throughput rates for the new 3,500 tpd plant and existing, upgraded 2,000 tpd processing plant, with the goal of maximizing project value. The increase in throughput from the expanded processing capacity is expected to increase average annual gold production in excess of the 62,000 ounces of gold originally anticipated in the May 2025 PEA. Throughput rates for the updated PEA will be determined by the revised mine plan, which will feed the new 3,500 tpd processing plant and existing, upgraded 2,000 tpd processing plant. |
| 5 |
| Management’s Discussion and Analysis May 31, 2026 |
Projects Update – Third Quarter and Year to Date 2026
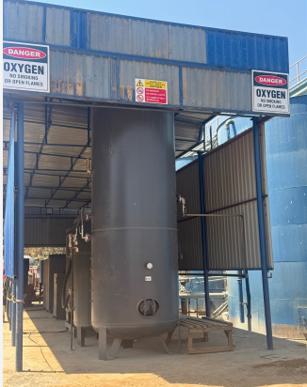
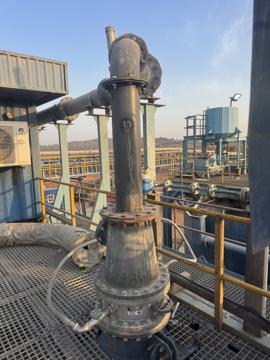
| · | During Q3 2026, the Company continued advancing upgrades to its processing plant, including: commissioning of the oxygen plant which has added slurry oxidation capacity through improved air blowers and oxygen dispersion, installation of (i) the pre-leach thickener, which has entered the final stages of commissioning with completion of the remaining electrical works and PLC programming expected during Q4 2026; (ii) upgraded leach tank agitators and interstage screens, with planned leach tank refurbishment activities to be conducted throughout Q4 2026; (iii) the Aachen reactor, which is now operating with the fully commissioned oxygen plant; and (iv) the new ADR plant and gold room, where engineering, fabrication and delivery continue to progress, with delivery targeted for Q4 2026 and commissioning expected in Q1 2027. |
| · | During Q3 2026, the Company continued advancing its plant expansion program. Following completion of the tender evaluation process and finalization of equipment sizing and technical specifications, the Company initiated a letter of award for the new SAG and Ball Mill grinding circuit, with final contract execution expected in Q4 2026. Fabrication is scheduled to commence, with planning and preparation for foundation works expected to begin in Q4 2026 and an initial expected commissioning within 12-18 months. In parallel, a new tertiary cone crusher was successfully installed and commissioned during the Q3 2026 and is now operating as part of the crushing circuit. Metallurgical testwork supporting the expanded process flowsheet has been substantially completed, allowing for the finalization of equipment sizing and specifications for the flotation circuit, fine grind mill, concentrate thickener, and intensive leach circuit. While tenders for this equipment have been completed, the Company is currently performing trade-off studies to evaluate how much additional recovery can be achieved in the current flowsheet including the pre-leach thickener and excluding a flotation and fine grind circuit. |
| · | The plant upgrade and expansion projects are at various stages of development and implementation and are expected to progressively increase processing throughput, improve recovery, and reduce unit operating costs as they are commissioned through to their respective scheduled completion dates. |
| · | During Q3 2026, the Company successfully completed the final raise of TSF 2.2, extending available tailings storage capacity into Q2 2027 and ensuring uninterrupted support for ongoing operations while the next phase of tailings infrastructure is developed. In parallel, the Company made significant progress on TSF 3.0, its long-term, life-of-mine tailings storage facility. All required regulatory approvals and permits have been received, and a construction contractor has been selected. Mobilization and construction activities are scheduled to commence immediately, with Stage 1 targeted for completion in Q2 2027. The successful completion of the TSF 2.2 raise, together with the commencement of TSF 3.0 construction, provides a seamless transition between short-term and long-term tailings storage requirements. This phased approach continues to mitigate operational risk, maintain storage capacity ahead of production demands, and support the Company's ongoing expansion strategy. |
| 6 |
| Management’s Discussion and Analysis May 31, 2026 |
Operational and Financial Details – Third Quarter and Year to Date 2026
Mining and Processing
| · | During the three and nine months ended May 31, 2026, Buckreef Gold reported zero LTI at site, recorded a safety incident frequency rate of zero (per million hours), including contractors, and achieved 6.4 million hours of LTI free work. |
| · | During Q3 2026, Buckreef Gold poured 7,426 ounces of gold, an increase of 58% from Q3 2025 (4,687 ounces of gold), and sold 6,983 ounces of gold, up 75% from 3,995 ounces of gold sold in Q3 2025. Gold production in Q3 2026 was higher than the prior year comparative period as the Company achieved record quarterly processing plant throughput of 1,690 tpd, a 16% increase from the prior year (Q3 2025: 1,461 tpd), combined with a higher average head grade of 1.96 g/t (Q3 2025: 1.72 g/t) and higher average recovery of 84.9%, up from 67.0% in Q3 2025. The Company achieved record throughput in Q3 2025 as the Company focused on reducing mill feed size, maximising mill power and reducing unplanned downtime. The higher average head grade was due to the mine sequence where the open pit mine accessed higher grade ore blocks in Q3 2026, following completion of the scheduled Stage 1 stripping campaign during fiscal 2025. The higher average throughput and recovery in Q3 2026 was mainly due to a series of plant optimization initiatives, including improved feed size and quality to the mills, supplementary crushing and existing crushing circuit enhancement, improved leach slurry density and residence time, improved reagent management and streamlined elution and electrowinning activities. During Q3 2026, the Company continued to advance on several near-term plant enhancements to further improve gold recoveries, including the addition of a pre-leach thickener (to further improve consistency of leaching density and reduce grind size), upgrades to the existing elution plant, and added slurry oxidation through the Aachen reactor and Oxygen plant. The Company expects plant throughput and recovery to continue to improve over the year as further plant enhancements in the crushing, grinding and leaching circuits are commissioned. |
| · | For the nine months ended May 31, 2026, the Company produced 21,476 ounces of gold (2025: 12,532 ounces) and sold 20,789 ounces of gold (2025: 12,236 ounces). Gold production was higher than the prior year comparative period as a result of higher average head grade of 1.93 g/t (2025: 1.38 g/t), higher average recovery of 81.4% (2025: 71%), and higher mill throughput of 1,597 tpd (2025: 1,474 tpd). The higher average head grade resulted from access to higher grade ore blocks following completion of the Stage 1 stripping campaign in 2025. The higher average recovery was mainly due to a series of plant optimization initiatives, including (i) increasing carbon inventory in the Carbon in Leach (CIL) circuit to improve gold adsorption and reduce gold loss in the solution tails; (ii) increasing pH in the CIL circuit by adding additional lime to improve leaching kinetics and reduce cyanide consumption; (iii) increasing dissolved oxygen levels to improve leaching kinetics by reducing the solid tails, extending leach residence time at the expense of grind size by increasing leach feed density. Mill throughput was, on average, higher than the prior year comparative period as the Company continued to focus on reducing mill feed size, maximising mill power and reducing unplanned downtime. |
| · | Total ore tonnes mined of 183 kt in Q3 2026 were 25% higher than the prior year period (Q3 2025: 147 kt) due to relative positioning of the Stage 1 pit. Waste tonnes mined of 2,272 kt during Q3 2026 were 90% higher than the prior year period (Q3 2025: 1,195 kt) primarily due to an increased contractor fleet to allow accelerated Stage 2 stripping of the Main Pit which will allow for mill feed in fiscal 2027-2029. The higher proportion of waste to ore tonnes contributed to a higher strip ratio of 12.4 (waste:ore tonnes) in Q3 2026 compared to the prior year period (Q3 2025: 8.1 waste:ore tonnes). For the nine months ended May 31, 2026, the Company continued to focus on Stage 2 stripping of the Main Pit to benefit mill feed beginning in fiscal 2027. As a result, total waste tonnes mined of 5,429 kt were higher than the prior year period (2025: 2,937 kt), while total ore tonnes mined of 551 kt were also higher than the prior year period (2025: 364 kt). |
| 7 |
| Management’s Discussion and Analysis May 31, 2026 |
| · | Mining costs per tonne of $3.02 in Q3 2026 were lower than the prior year comparative period (Q3 2025: $3.63) mainly due to finalization of the mining contract renegotiation during the quarter, which has seen unit cost reductions due to an increased rate of mining as well as a contract extension until 2029. Additionally, there was a comparatively higher proportion of higher, free-dig volumes that were moved as the Company accessed the higher areas of the Stage 2 cutback. Mining costs for remainder of fiscal 2026 are expected to remain in line with Q3 2026 costs of approximately $3.00 per tonne. For the nine months ended May 31, 2026, mining cost per tonne of $3.93 were slightly higher than the prior year comparative period (2025: $3.82 per tonne) mainly due to an increase in contractor haulage cost during the first half of fiscal 2026, an increase in drilling and blasting cost to access fresh (sulphide) rock in Q1 and Q2 2026. |
| · | Processing cost per tonne of $25.66 in Q3 2026 were higher than the prior year comparative period (Q3 2025: $14.60 per tonne) mainly due to an increase in consumption of key reagents and mill consumables, all required to improve throughput, metallurgical recovery and elution stripping, which has resulted in a 24% improvement in metallurgical recovery, a 16% increase in throughput and a 9% reduction in cash cost1 per ounce. Additional costs incurred during Q3 2026 that impacted processing cost per tonne included the use of a contractor crushing plant to supplement the Buckreef Gold crushing circuit while it underwent upgrades, higher diesel consumption due to increased use of gensets following grid power quality and interruption issues, higher diesel prices, and the purchase of a significant inventory of maintenance spares to ensure higher plant availability. The increase in plant recovery in Q3 2026 of 84.9% (2025: 67%) more than offset the increase in processing cost per tonne. For the nine months ended May 31, 2026, processing cost of $23.86 per tonne were higher than the prior year comparative period (2025: $14.20 per tonne) mainly due to an increase in reagent and consumable consumption which enhanced plant recovery (2026: 81.4%, 2025: 71%). The processing plant upgrades to the 2,000 tpd plant have already begun to boost plant reliability and performance as evidenced by an increase in plant throughput and an improvement in recovery in Q3 2026. The commissioning of the oxygen plant, which is operating alongside the Aachen reactor, have begun to improve slurry oxidation and are expected to reduce the consumption of hydrogen peroxide in the future. Additionally, commissioning of the pre-leach thickener in Q4 2026 is expected to improve gold concentration and the installation of the ADR plant in Q1 2027 is expected to improve carbon activity progressively benefitting processing cost per tonne over the remainder of fiscal 2026 and throughout fiscal 2027. |
Fiscal 2026 Outlook
| · | For the nine months ended May 31, 2026, the Company produced 21,476 ounces of gold and continues to expect full year gold production to be in the range of 25,000 - 30,000 ounces for fiscal 2026. The Company continues to expect gold production to be highest in Q4 2026 due to the scheduled mine sequence coupled with the completion of plant upgrades and enhancements which are expected to improve throughput and recoveries. Total average cash cost1 for the nine months ended May 31, 2026, was $1,555 per ounce and the Company continues to expect full year total average cash cost1 to be in the range of $1,400 - $1,600 per ounce for fiscal 2026. The Company continues to expect cash cost to be lowest in Q4 2026 in line with the production weighting and following completion of the plant optimization initiatives which are expected to benefit operating and processing costs. |
| 8 |
| Management’s Discussion and Analysis May 31, 2026 |
Inventory
| · | As at May 31, 2026, the ROM pad stockpile contained 528,635 tonnes at an average grade of 1.14 g/t with an estimated 19,373 ounces of contained gold. A further stockpile of crushed mill feed of 2,777 tonnes at 2.17 g/t containing an estimated 193 ounces of gold has been accumulated between the crusher and mill. The fair market value of the ounces of gold on the ROM pad stockpile and crushed ore stockpile is approximately $89.0 million using the London PM Fix gold price of approximately $4,546 per ounce as at May 31, 2026. Since year-end August 31, 2025, the Company added 4,211 ounces to the ROM pad stockpile to support mill feed. These fluctuations in ROM pad inventory are anticipated throughout the course of the year and are designed to ensure steady state processing. During Q3 2026, the Company processed stockpiled and mined material through the 2,000 tpd processing plant and reported record gold in circuit inventory, reflecting a buildup of metal inventory in the CIL tanks. The Company reported 1,591 ounces of gold in circuit on May 31, 2026, which reflected an increase of 544 ounces from August 31, 2025, following gold elution and smelting activity during 2026. |
Exploration
| · | During Q3 2026, the Company completed its 3-stage geophysical survey that commenced in Q4 2025, which was comprised of a detailed magnetic survey across the full property, electro-resistivity based Induced Polarisation (“IP”) resistivity and chargeability surveys across all high-potential structures identified in the detailed magnetic survey and detailed dipole-dipole electro resistivity lines across a series of targets identified when overlapping the structural and IP anomalies. From this dipole-dipole survey, a total of 13 drill holes covering 1,850 meters has been identified for drill-testing across 9 sections as a preliminary test pattern. These holes are expected to be drilled in Q4 2026. |
| · | In parallel, a fourteen-kilometre accumulated depth RC drilling program was commenced using the Company’s newly commissioned drill rig. The primary objective of the RC program is to upgrade the Eastern Porphyry Mineral Resources from the Inferred category to the Indicated/Measured categories. In Q3 2026, approximately 50% of the Eastern Porphyry drill program was completed with the Company’s new RC drill rig. The remaining Eastern Porphyry drilling campaign is expected to be completed in Q1 2027. Additionally, this new drill rig was used to conduct additional grade control drilling in the Stage 2 Main Pit. A second RC drill rig will be delivered in Q4 2026 which will enable additional exploration drilling in the future. |
| · | Concurrently, a contractor’s diamond drill rig has been used to conduct a 5-hole geotechnical drilling program for a deeper open pit and an eventual move to underground mining. At the end of Q3 2026 this was approximately 60% complete and is expected to be fully completed in Q4 2026. Additional technical drilling in Q4 2026 includes a 5-hole hydro-geological drill hole program to assist with mining and site water management and planning. |
| 9 |
| Management’s Discussion and Analysis May 31, 2026 |
Environmental, Social and Corporate Governance (“ESG”)
| · | There were no reportable environmental incidents during the three and nine months ended May 31, 2026. |
| · | During Q3 2026, Buckreef Gold continued working closely with the Geita District Council and local ward authorities to identify and implement programs that address both short- and long-term educational needs. These initiatives align with the Company’s local hiring policy and promote Science, Technology, Engineering, and Mathematics (“STEM”) education and gender inclusion. |
| · | During Q3 2026, the Company continued to focus on implementation of the Council-approved Corporate Social Responsibility (“CSR”) Plan. Buckreef Gold, in partnership with the Geita District Council, allocated TZS 600 million (approximately $0.2M) to support priority education and healthcare projects across the wards of Rwamgasa, Kaseme, Busanda, Butunduwe, and Butobela. The investment focuses on outpatient buildings, road rehabilitation, classrooms, water wells, and staff housing for local health facilities. |
| · | During Q3 2026 construction activities on the approved projects continued to progress. Upgrades to primary schools, including classrooms and teachers’ houses, are in the finishing stage, and water supply systems in Busanda and Rwamgasa wards have been completed and handed over to the respective communities. Construction of two staff houses in Rwamgasa and the Butobela Health Centre are in the final stages of completion. The Company continues implementing the remaining approved projects, with all outstanding construction activities expected to be completed during Q4 2026. |
| · | During Q3 2026, the Buckreef Gold team awarded a contract for an independent survey across all local communities, including local government, local businesses, vulnerable and other groups. The intent of the survey is to work with these key community stakeholders to develop longer term programs to lift the standards of living around the project area. This survey is expected to be completed during Q4 2026. |
| · | Buckreef Gold’s operations remain connected to the Tanzanian national electricity grid and continue to utilize grid power, increasing reliance on hydroelectric generation. During Q3 2026, the Company employed 336 full-time employees, 630 contractor employees, 190 part-time/casual employees, and interns. The Company also continued to support local economic development through local procurement, including sourcing food locally for an approximately 100-mile diet initiative. |
Financial
| · | During Q3 2026, Buckreef Gold achieved record processing plant throughput and poured 7,426 ounces of gold (Q3 2025: 4,687) and sold 6,983 ounces of gold (Q3 2025: 3,995) at a record average realized price1 of $4,703 per ounce (Q3 2025: $3,114) excluding costs related to the gold prepaid purchase agreement (“average realized price (net)1”). |
| · | During Q3 2026, the Company recognized revenue of $32.9 million (Q3 2025: $12.5 million), cost of sales of $13.4 million (Q3 2025: $8.1 million), and cash cost1 of $1,648 per ounce (Q3 2025: $1,819). The Company generated gross profit of $19.5 million (Q3 2025: $4.4 million), a 59% gross profit margin (Q3 2025: 35%), adjusted net income1 of $10.1 million (Q3 2025: $2.0 million), operating cash flow of $8.8 million (Q3 2025: $1.9 million), and adjusted EBITDA1 of $20.7 million (Q3 2025: $4.0 million). The increase in revenue, gross profit, adjusted net income, operating cashflow and adjusted EBITDA1 is mainly related to higher ounces of gold sold of 6,983 ounces (Q3 2025: 3,995 ounces) and a higher average realized price (net)1 of $4,703 per ounce (Q3 2025: $3,114). |
| 10 |
| Management’s Discussion and Analysis May 31, 2026 |
| · | For the nine months ended May 31, 2026, Buckreef Gold poured 21,476 ounces of gold (2025: 12,532) and sold 20,789 ounces of gold (2025: 12,236) at an average realized price1 of $4,423 per ounce (2025: $2,829). The Company recognized record revenue of $92.0 million (2025: $34.1 million), cost of sales of $37.3 million (2025: $22.7 million), and cash cost1 of $1,555 per ounce (2025: $1,635). The Company generated gross profit of $54.7 million (2025: $11.4 million), gross profit margin of 59% (2025: 33%), adjusted net income1 of $29.5 million (2025: $3.8 million), operating cash flow of $20.5 million (2025: $6.2 million), and adjusted EBITDA1 of $54.1 million (2025: $9.3 million). The increase in revenue, gross profit, adjusted net income, operating cashflow and adjusted EBITDA1 is mainly related to higher ounces of gold sold of 20,789 ounces (2025: 12,236 ounces) and a higher average realized price (net)1 of $4,423 per ounce (2025: $2,829). |
| · | During Q3 2026 the Company continued to strengthen its working capital position through increased production, organically generated cashflow, improved liquidity and an increase in stockpile inventory. As a result, the Company’s current ratio has improved to a ratio of approximately 2.2 at May 31, 2026, including a cash balance of $26.8 million, an increase in net cash of approximately $19.1 million from year-end. |
| · | The Company has access to a Gold Prepayment Facility with Auramet International, Inc. through which Buckreef may, at its discretion, sell to up to an aggregate amount of $8.0 million of gold, up to 21 calendar days prior to delivery, on a revolving basis for a one-year term. As at May 31, 2026, the Company had nil gold ounces outstanding under the Auramet Gold Prepayment Facility. |
| · | During Q3 2026, the Company drew $0.6 million on the Stanbic Bank Tanzania Limited (“Stanbic”) revolving credit facility and vehicle and asset financing (“VAF”) facility to fund downpayments on upgrades related to the 2,000 tpd plant, including payments on the pre-leach thickener, upgraded agitators & interstage screens, Aachen reactor, oxygen plant, ADR plant and new gold room, and apron feeder & belt magnet. As at May 31, 2026, the Company had drawn $2.9 million on the Stanbic facility. |
| · | During Q3 2026, no shares were sold under the Company’s At The Market Offering Agreement (“ATM”) pursuant to which the Company, at its discretion, may offer and sell, from time to time, common shares having an aggregate offering price of up to $25 million. During the nine months ended May 31, 2026, the Company sold 19,408 shares for net proceeds of approximately $15,255 under the ATM agreement to gain market intelligence around trading activity. |
| · | As at May 31, 2026, the Company recognized $15.1 million of sales tax receivable on the Unaudited Interim Condensed Consolidated Statements of Financial Position. Sales tax receivables consist of harmonized services tax and value added tax (“VAT”) due from Canadian and Tanzanian tax authorities, respectively. Tanzanian tax regulations allow for VAT receivable to be refunded or set-off against other taxes due to the Tanzania Revenue Authority ("TRA"). |
| 11 |
| Management’s Discussion and Analysis May 31, 2026 |
Key Operating Information
Select operating and financial information from the operation for the three and nine months ended May 31, 2026, follows below:
| Select Operating and Financial Data | ||||||||||||||||||||
| Unit | Three months ended May 31, 2026 | Three months ended May 31, 2025 | Nine months ended May 31, 2026 | Nine months ended May 31, 2025 | ||||||||||||||||
| Operating Data | ||||||||||||||||||||
| Ore Mined | k tonnes | 183 | 147 | 551 | 364 | |||||||||||||||
| Waste Mined | k tonnes | 2,272 | 1,195 | 5,429 | 2,937 | |||||||||||||||
| Total Mined | k tonnes | 2,455 | 1,342 | 5,979 | 3,301 | |||||||||||||||
| Strip Ratio | w:o | 12.4 | 8.1 | 9.9 | 8.1 | |||||||||||||||
| Mining Rate | tpd | 26,681 | 14,588 | 21,903 | 12,091 | |||||||||||||||
| Mining Cost | US$/t | $3.02 | $3.63 | $3.93 | $3.82 | |||||||||||||||
| Plant Ore Milled | k tonnes | 155 | 134 | 436 | 402 | |||||||||||||||
| Head Grade | g/t | 1.96 | 1.72 | 1.93 | 1.38 | |||||||||||||||
| Plant Utilization | % | 93 | 91 | 91 | 87 | |||||||||||||||
| Plant Recovery Rate | % | 84.9 | 67 | 81.4 | 71 | |||||||||||||||
| Processing Cost | US$/t | $25.66 | $14.60 | $23.86 | $14.20 | |||||||||||||||
| Plant Mill Throughput | tpd | 1,690 | 1,461 | 1,597 | 1,474 | |||||||||||||||
| Gold Ounces Poured | oz | 7,426 | 4,687 | 21,476 | 12,532 | |||||||||||||||
| Gold Ounces Sold | oz | 6,983 | 3,995 | 20,789 | 12,236 | |||||||||||||||
| Financial Data | ||||||||||||||||||||
| Revenue1 | $('000s | ) | 32,848 | 12,474 | 92,037 | 34,109 | ||||||||||||||
| Gross profit | $('000s | ) | 19,449 | 4,383 | 54,716 | 11,361 | ||||||||||||||
| Net income (loss) | $('000s | ) | 8,371 | 1,105 | (5,902 | ) | 1,301 | |||||||||||||
| Adjusted net income2 | $('000s | ) | 10,077 | 1,989 | 29,464 | 3,750 | ||||||||||||||
| Adjusted EBITDA2 | $('000s | ) | 20,680 | 3,979 | 54,136 | 9,338 | ||||||||||||||
| Operating cash flow | $('000s | ) | 8,758 | 1,870 | 20,493 | 6,148 | ||||||||||||||
| Working capital5 | $('000s | ) | 36,304 | (3,274 | ) | 36,304 | (3,274 | ) | ||||||||||||
| Average realized price (gross)2 | $/oz | 4,704 | 3,122 | 4,427 | 2,788 | |||||||||||||||
| Average realized price (net)2,3,4 | $/oz | 4,703 | 3,114 | 4,423 | 2,829 | |||||||||||||||
| Cash cost2 | $/oz | 1,648 | 1,819 | 1,555 | 1,635 |
| 1 | Revenue includes immaterial amounts from the sale of by-product silver. |
| 2 | Refer to the "Non-IFRS Performance Measures" section. |
| 3 | Net of revenue and ounces of gold sold related to OCIM gold prepaid purchase agreement. |
| 4 | Net of interest related to Auramet gold prepaid purchase agreement. |
| 5 | Working capital for the three and nine months ended May 31, 2025 are adjusted for derivative liabilities which will only be settled by issuing equity of the Company and for the current portion of deferred revenue (non-cash) related to the Auramet prepaid gold purchase agreement. During Q2 2026, all outstanding warrants of the Company were either exercised or expired. In Q2 2026, the Company received total gross proceeds of approximately $21.0 million from the exercise of warrants. The Company now has a clean capital structure with no remaining warrants outstanding. |
| 12 |
| Management’s Discussion and Analysis May 31, 2026 |
Operational Overview
The Buckreef Gold Project
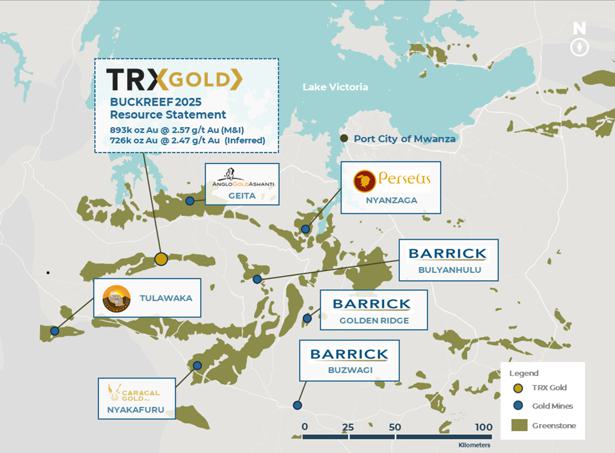
The Company is focused on the Buckreef Gold Project located in the Geita District of the Geita Region south of Lake Victoria, approximately 110 km southwest of the City of Mwanza, Tanzania (Figure 1). The Buckreef Gold Project area can be accessed via a paved national road and, thereafter, via 17 kilometers of well maintained unpaved regional roads. The Buckreef Gold Project comprises several deposits, namely Buckreef, Eastern Porphyry, Anfield and the newly discovered Stamford Bridge. The Buckreef pit itself encompasses three main mineralized zones: Buckreef South, Buckreef Main and Buckreef North. The Buckreef Gold Project is fully licensed for mining and the extraction of gold.
The Buckreef Gold Project Updated Mineral Resource Estimate as of April 15, 2025, are as follows:
| Measured | Indicated | Inferred | Total (Measured + Indicated) | |||||||||||||||||||||||||||||||||||||||||||||
| Tonnes | Grade | Au | Tonnes | Grade | Au | Tonnes | Grade | Au | Tonnes | Grade | Au | |||||||||||||||||||||||||||||||||||||
| Area | MT | g/t | Koz | MT | g/t | Koz | MT | g/t | Koz | MT | g/t | Koz | ||||||||||||||||||||||||||||||||||||
| Buckreef Main | 2,982.8 | 2.36 | 226.4 | 6,193.9 | 2.72 | 542.6 | 7,549.3 | 2.37 | 576.0 | 9,176.7 | 2.61 | 769.0 | ||||||||||||||||||||||||||||||||||||
| Buckreef South | 23.6 | 1.68 | 1.3 | 35.3 | 1.95 | 2.2 | 53.8 | 1.70 | 2.9 | 58.9 | 1.84 | 3.5 | ||||||||||||||||||||||||||||||||||||
| Buckreef West | 40.3 | 3.27 | 4.3 | 204.7 | 2.52 | 16.5 | 73.9 | 2.37 | 5.6 | 245.0 | 2.64 | 20.8 | ||||||||||||||||||||||||||||||||||||
| Eastern Porphyry | 2.9 | 6.97 | 0.6 | 1,306.4 | 2.35 | 98.8 | 1,198.8 | 2.44 | 94.0 | 1,309.3 | 2.36 | 99.4 | ||||||||||||||||||||||||||||||||||||
| Stamford Bridge | — | — | — | — | — | — | 272.0 | 5.38 | 47.0 | — | — | — | ||||||||||||||||||||||||||||||||||||
| Total | 3,049.6 | 2.37 | 233 | 7,740.3 | 2.65 | 660 | 9,147.8 | 2.47 | 726 | 10,789.9 | 2.57 | 893 | ||||||||||||||||||||||||||||||||||||
Notes:
| (1) | Mineral Resources, which are not Mineral Reserves, may not have demonstrated economic viability. The estimate of Mineral Resources may be materially affected by environmental, permitting, legal, title, taxation, socio-political, marketing, or other relevant issues. |
| (2) | The Inferred Mineral Resource in this estimate has a lower level of confidence than that applied to an Indicated Mineral Resource and must not be converted to a Mineral Reserve. It is reasonably expected that the majority of the Inferred Mineral Resource could be upgraded to an Indicated Mineral Resource with continued exploration. |
| (3) | The Mineral Resources were estimated in accordance with the Canadian Institute of Mining, Metallurgy and Petroleum (CIM), CIM Standards on Mineral Resources and Reserves, Definitions and Guidelines prepared by the CIM Standing Committee on Reserve Definitions and adopted by the CIM Council. |
| (4) | Gold price used is $1,900/oz Au. |
| (5) | The pit constrained cut-off grade of 0.42 g/t Au was derived from 80% process recovery, $21.04/tonne process and G&A cost, and a royalty of 7.3%. The constraining pit optimization parameters were $3.88/t mining cost and 45-degree pit slopes. |
| (6) | The out-of-pit cut-off grade of 1.31 g/t Au was derived from 80% process recovery, $21.04/tonne process and G&A cost, a $40/tonne underground mining cost, and a royalty of 7.3%. The out-of-pit Mineral Resource grade blocks were quantified below the constraining pit shell and within the constraining mineralized wireframes. Out–of-Pit Mineral Resources are restricted to areas which exhibit geological continuity and reasonable potential for extraction by cut and fill and long hole mining methods. |
| (7) | The Stamford Bridge cut-off grade of 1.20 g/t Au was derived from 80% process recovery, $21.04/tonne process and G&A cost, a $35/tonne underground mining cost, and a royalty of 7.3%. Mineral Resources are restricted to areas which exhibit geological continuity and reasonable potential for extraction by cut and fill and long hole underground mining methods. |
| 13 |
| Management’s Discussion and Analysis May 31, 2026 |
Figure 1: Location of Buckreef Gold Project in the Lake Victoria Greenstone Belt
| 14 |
| Management’s Discussion and Analysis May 31, 2026 |
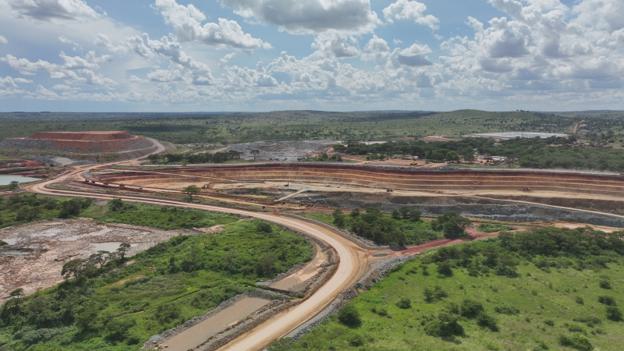
Figure 2: Buckreef Gold Open Pit Main Zone Aerial View
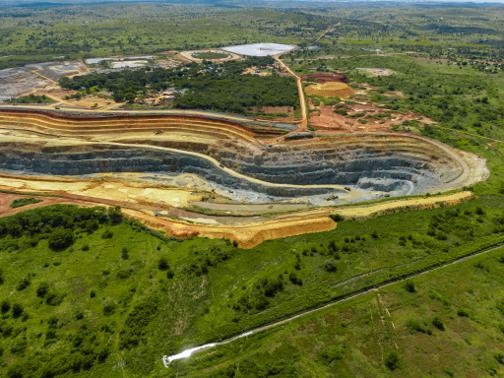
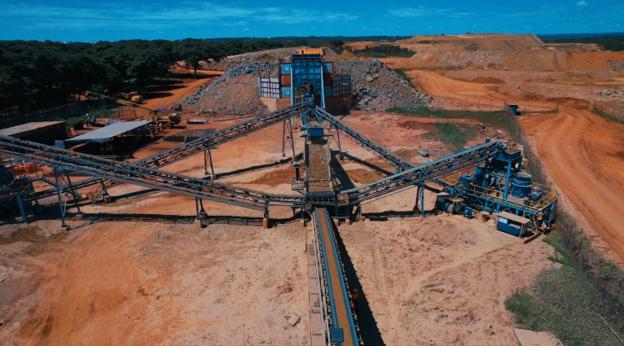
Figure 3: Buckreef Gold Crushing and Conveyor Circuit
| 15 |
| Management’s Discussion and Analysis May 31, 2026 |
Figure 4: Buckreef Gold Mining Fleet
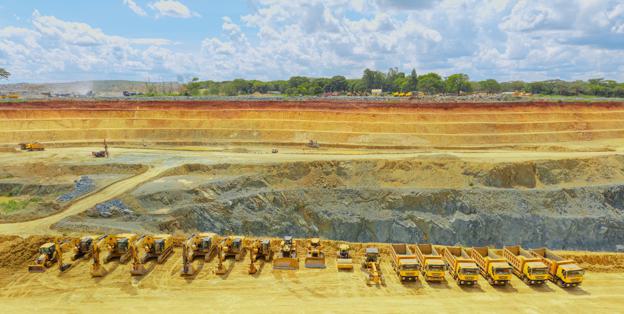
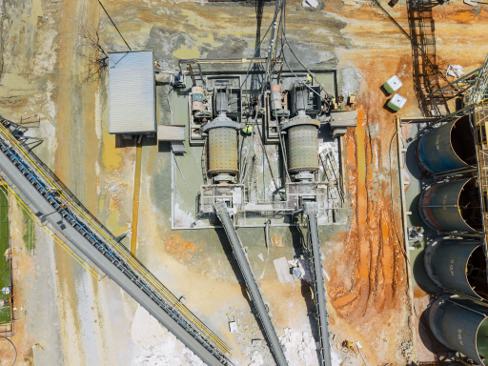
Figure 5: Buckreef Gold’s Ball Milling Circuit
| 16 |
| Management’s Discussion and Analysis May 31, 2026 |
Figure 6a: Stage 2 Expansion at Buckreef Gold

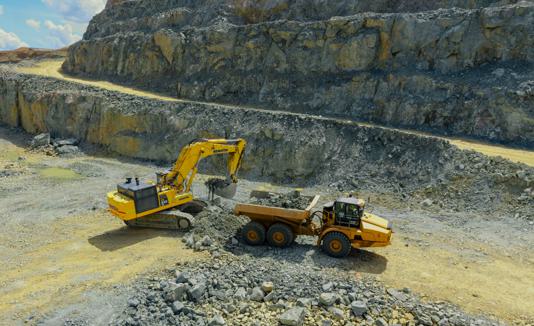
Figure 6b: Load and Haul Operations at Buckreef Gold
| 17 |
| Management’s Discussion and Analysis May 31, 2026 |
Figure 7: Revised Process Flowsheet for the Upgraded and Expanded Plant
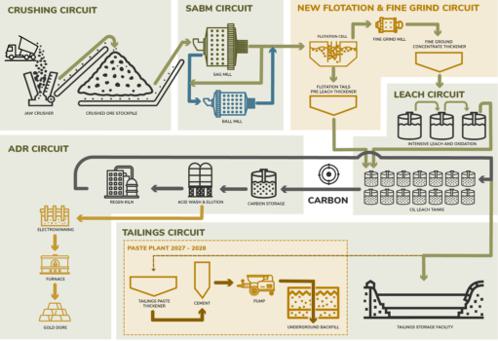
Figure 8: Installation of Oxygen Plant to Improve Slurry Oxidation
| 18 |
| Management’s Discussion and Analysis May 31, 2026 |
Figure 9: Installation of Pre-Leach Thickener
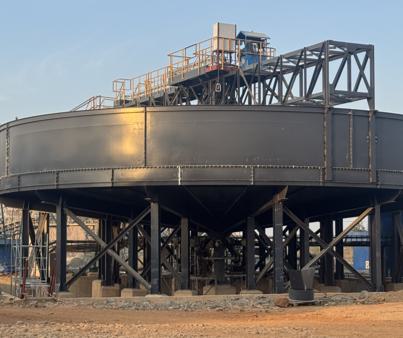
Figure 10: Aachen ® Reactor Installed and Commissioned to Improve Processing Efficiency
| 19 |
| Management’s Discussion and Analysis May 31, 2026 |
Figure 11: Buckreef Gold Inventory Stockpile
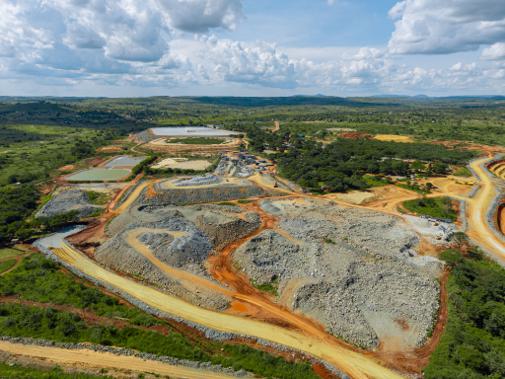
Figure 12: Buckreef Gold Open Pit Main Zone & Haul Road
| 20 |
| Management’s Discussion and Analysis May 31, 2026 |
Exploration & Mineral Resources
| · | The Company continues to evaluate the full potential of the Buckreef Gold property and identify opportunities for the discovery of additional mineral resources and their conversion to mineral reserves. Exploration activities relevant for the orogenic, shear-hosted gold deposits found in the Lake Victoria Greenstone belts include magnetic surveys, electro-resistivity surveys, soil and chip and drillhole sampling. |
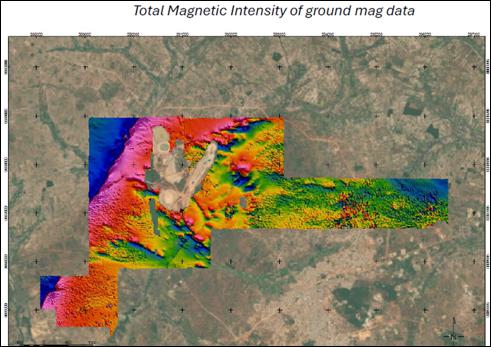
| · | During Q3 2026, the company completed its 3-stage geophysical survey that commenced in Q4 2025, which comprised of a detailed magnetic survey across the full property (Figure 13), 27 pole-dipole electro-resistivity based IP resistivity and chargeability survey lines across all high-potential structures identified in the detailed magnetic survey, and further detailed dipole-dipole electro resistivity lines across targets identified when overlapping the structural and IP anomalies (Figure 14). |
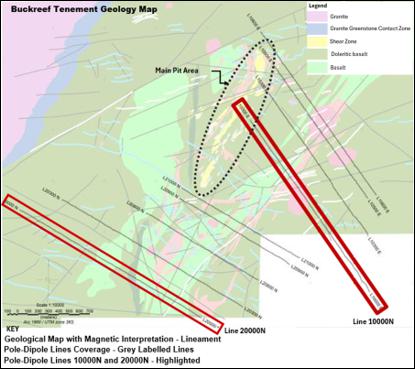
| · | During Q3 2026 a total of 9 dipole-dipole lines was completed at 50 meter dipole spacing. Lines were a minimum of 1,200 meters long and planned perpendicular to strike (Figure 15 and 16). |
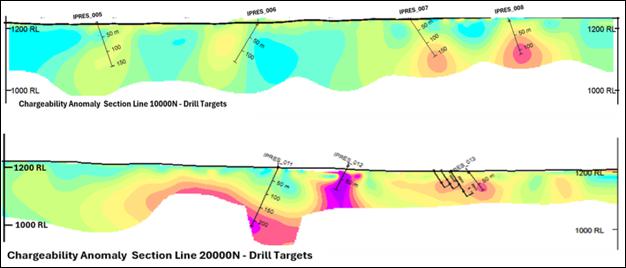
| · | Data generated during the program has been integrated with existing geological and geochemical data to generate potential drill targets. A total of 13 drillholes covering 1,850 meters has been identified across 9 sections. Sample chargeability sections with proposed drillholes are shown in Figure 17. |
| · | Buckreef Gold now has two exploration drill rigs on site, with a third drill rig in-country and scheduled for delivery in July 2026. A 4th drill rig is now enroute to Tanzania and is scheduled for commissioning in Q4 2026. The drilling program is scheduled to begin during Q4 2026 which aligns with arrival of the Buckreef Gold diamond drill rig. |
Figure 13: Raw Magnetic Survey Output
| 21 |
| Management’s Discussion and Analysis May 31, 2026 |
Figure 14: Planned IP Survey Lines Covering Target Areas Identified by the Magnetic Survey
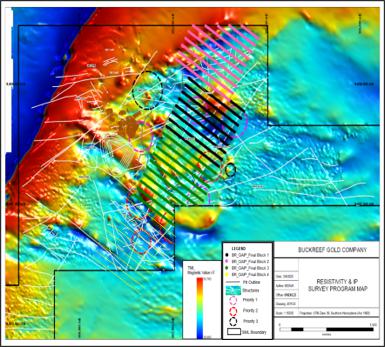
Figure 15: Buckreef Tenement Geological Map with Pole Dipole Survey Lines
| 22 |
| Management’s Discussion and Analysis May 31, 2026 |
Figure 16: Buckreef Tenement Satellite Image with Pole Dipole Survey Lines
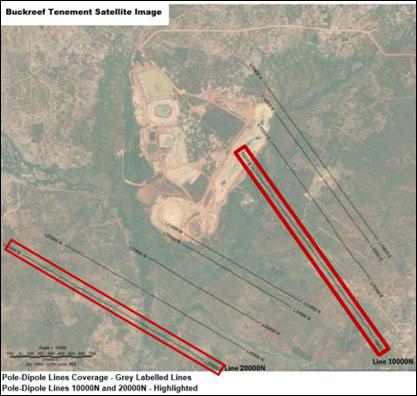
Figure 17: Sample Drill Targets Generated from Detailed Pole-Dipole Electro-resistivity Surveys
| 23 |
| Management’s Discussion and Analysis May 31, 2026 |
Resource Upgrade Drilling at Eastern Porphyry
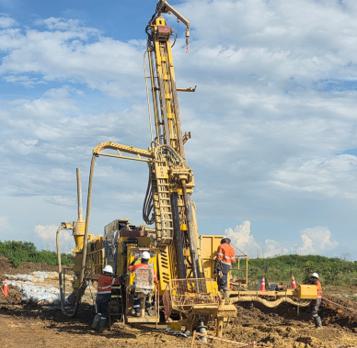
| · | During 2026 a fourteen-kilometre accumulated depth RC drilling program was commenced using the Company’s newly commissioned drill rig. The primary objective of the RC program is to upgrade the Eastern Porphyry Inferred and Indicated Mineral Resources to Indicated and Measured categories, ahead of planned production. In Q3 2026, approximately 50% of the Eastern Porphyry drill program was completed with the new RC drill rig. The remaining Eastern Porphyry drilling campaign is expected to be completed in Q1 2027. |
| · | Concurrently, a contractor’s diamond drill rig has been used to conduct a 5-hole geotechnical drilling program for a deeper open pit and an eventual move to underground mining. At the end of Q3 2026 this was approximately 60% complete and is expected to be fully completed in Q4 2026. Additional technical drilling in Q4 2026 includes a 5-hole hydro-geological drill hole program to assist with mining and site water management and planning. |
Figure 18: Reverse Circulation Drilling at Eastern Porphyry
| 24 |
| Management’s Discussion and Analysis May 31, 2026 |
Other Recent Exploration Developments:
| · | Announced in fiscal 2025 its best drill results ever, on a gram x tonne x meter (“gtm”) basis with hole BMDD315 intersecting 37 m @ 6.86 g/t Au (253.82 gtm) from 130 m. This drill hole result is approximately 250 m east of the Buckreef Main Zone, host to Buckreef Gold’s 2M+ ounce Au Mineral Resource1 and where current operations are ongoing in the Main Pit. This drill hole result comes following the Company’s previous best drill hole result, with hole BMDD310 intersecting 35.5 m @ 5.48 g/t Au (194.54 gtm) from 64 m. This drill hole result is approximately 200 m east of the Buckreef Main Zone. These drill holes led to the discovery of a promising new gold mineralization shear zone, named the “Stamford Bridge Zone” at which current drill results are revealing geological characteristics and mineral alterations similar to that at Buckreef’s Main Zone. Holes BMDD315 and BMDD310, mentioned above, are located along the Stamford Bridge Zone. During Q1 2025, the Company drilled 2,420 meters along the Stamford Bridge Zone on newly defined, high-priority targets. Thus far, drilling has covered 150 m of this newly identified mineralized structure and geological logging confirms the continuity of the structure. These results are beginning to form what can become a potential 1-kilometer “bridge” between the Buckreef Gold Main Zone, where current operations are ongoing, and the parallel, high-priority, gold mineralization zone known as the Eastern Porphyry. The latter also links to the Anfield Zone to the southeast, discovered in 2022. The Company has planned a geophysical survey campaign, which will focus on the Stamford Bridge trend line, as well as an area covering up to 500 meters to both the North and South sides of the trend line. Following the results of this campaign, a strategic drill campaign will resume on newly defined, high-priority targets. |
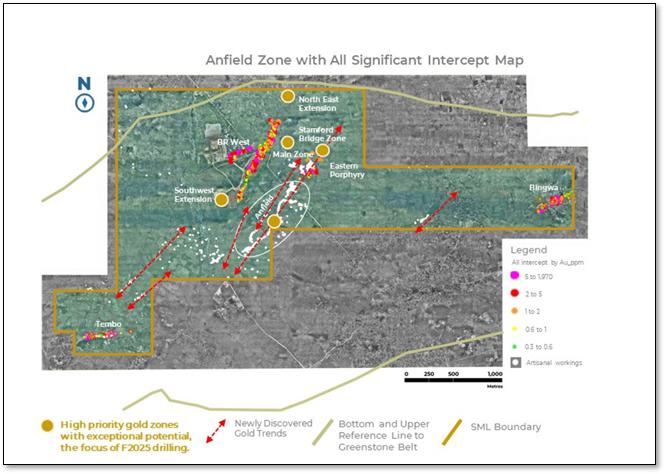
| · | Announced in fiscal 2023 near surface drilling results from the Anfield and Eastern Porphyry Zones, with highlights of 14 m @ 3.5 g/t including 3.0 m @ 10.9 g/t from 47 m from the Eastern Porphyry, and 2.94 m grading at 13.74 g/t, from 43.00 m in the Anfield zone (full results provided in Table 2). The zones are located at the northern end of a 3-kilometer-long zone of identified gold mineralization that is subparallel to the east of Buckreef Main Zone (Figure 19). The intercepts confirm multiple zones of strong mineralization towards the south-west of the known Eastern Porphyry deposit and the first diamond drill hole intersections on the Anfield Zone. Both mineralized zones are in close proximity to the Buckreef Main Zone and present an opportunity (assuming exploration success) to host future mineral resources outside of the Buckreef Main Zone. |
| · | Re-evaluated the Buckreef Main Zone for strike extensions, off-shoot splays, and at depth potential. The deposit is open in all directions. To date, the Company has tested the NE Extension and successfully identified gold mineralization over an additional 300 meters. The deposit remains open along strike to the NE and future infill drilling is warranted. The SW extension has also been tested with wide-spaced drilling, and the exploration program has returned encouraging results. The deposit now remains open along strike to the SW. |
| · | Collectively, between the NE extension and SW drilling the known strike extent of gold mineralization on the deposit structure has been expanded approximately 500 meters, or by nearly 30% since exploration was recommenced. The Company will continue to identify areas offering the best opportunity to add gold ounces to the mineral resource inventory and commence an infill drilling program. |
| 25 |
| Management’s Discussion and Analysis May 31, 2026 |
Best Drill Hole Results in History of Buckreef Gold – Announcement of Stamford Bridge Zone
During Q1 2025, the Company announced its best drill results ever, on a gtm basis with hole BMDD315 intersecting 37 m @ 6.86 g/t Au (253.82 gtm) from 130 m. This drill hole result is approximately 250 m east of the Buckreef Main Zone where current operations are ongoing. This drill hole result comes following the previous best drill result, with hole BMDD310 intersecting 35.5 m @ 5.48 g/t Au (194.54 gtm) from 64 m. This drill hole result is approximately 200 m east of the Buckreef Main Zone.
The Company also announced the discovery of a promising new gold mineralization shear zone, named the “Stamford Bridge Zone” at which current drill results are revealing geological characteristics and mineral alterations similar to that at Buckreef’s Main Zone. Holes BMDD315 and BMDD310, mentioned above, are located along the Stamford Bridge Zone.
Stamford Bridge Shear Zone Highlights:
| 1. | Hole BMDD315 intersected 37 m @ 6.86 g/t Au from 130 m; including 23 m @ 9.31 g/t Au from 139 m. |
| 2. | Hole BMDD310 intersected 35.5 m @ 5.48 g/t Au from 64 m; including 13m @8.06g/t Au. |
| 3. | Hole BMDD312 intersected 17.2 m @ 3.14 g/t Au from 164.6 m. |
| 4. | Geotechnical hole BMGT001 intersected 11.39 m @ 2.80 g/t Au from 104.0 m, and 22.0 m @ 2.36 g/t Au from 186.6 m. Both results are interpreted to be part of the Stamford Bridge Zone trend. |
| 5. | BMGT001 intersected the Buckreef Main Zone of 32.80 m @ 1.70 g/t Au (ending in mineralization) from 393.0 m. |
During Q2 2025, the Company announced three additional drill hole results (BMDD319-321) providing further evidence of gold mineralization along the Stamford Bridge Zone as follows:
| 6. | Hole BMDD319 intersected 21.0 m @ 8.63 g/t Au from 81.0 m. |
| 7. | Hole BMDD320 intersected 20.5 m @ 5.14 g/t Au from 125.5 m. |
| 8. | Hole BMDD321 intersected 5.0 m @ 2.74 g/t Au from 157.0 m. |
The Stamford Bridge Zone was discovered through detailed geological mapping of the Main Pit floor that identified a trend of high-grade mineralization on the eastern side of the Main Pit trending 070 East. This is an exceptional discovery at the Buckreef Gold Project, resulting in the most significant mineralization identified within Buckreef Gold’s drill history.
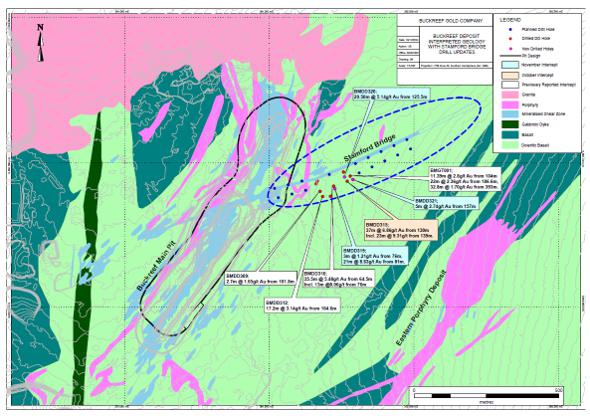
The exploration team then identified that geotechnical hole BMGT001 (one of geotechnical holes drilled as part of the Buckreef Main Zone geotechnical study completed by Terrane Geoscience Inc.) located 160 m east of the Main Pit, drilled across the Stamford Bridge (Figure 19), and was subsequently relogged (Table 1). The logging confirmed the presence of three mineralization zones, including the Stamford Bridge Zone. The zones were sampled, and the assay results are summarized below (Table 1). To date, the new Stamford Bridge Zone has shown evidence of a sheared mineralized zone with similar geological characteristics to that found in the Main Zone, i.e., zones are measured as being near vertical with strong alteration.
Thus far, drilling has covered more than 150 m of this newly identified mineralized structure and geological logging confirms the continuity of the structure. These results are beginning to form what can become a potential 1-kilometer “bridge” between the Buckreef Gold Main Zone, where current operations are ongoing, and the parallel, high-priority, gold mineralization zone known as the Eastern Porphyry. The latter also links to the Anfield Zone to the southeast, discovered in 2022.
| 26 |
| Management’s Discussion and Analysis May 31, 2026 |
The Company has planned an expanded diamond drill program to test for further mineralization along this newly developing trend. Although these are early-stage results, and only two sections along the newly identified trend have been drilled, key interpretations include:
| 1. | The Stamford Bridge Zone is potentially a significant shear zone and geologically similar to the Buckreef Main Zone. It bridges the gap between Buckreef Main Zone and the Eastern Porphyry deposit to the Southeast. |
| 2. | Pinching and swelling of the Stamford Bridge Zone has been observed in the first section drilled; 4m wide in the first drillhole and over 17 m wide on the second drillhole down dip; and |
| 3. | The second section has intercepted a significant shear zone, over 35 m wide with distorted shear fabric by alteration overprint. Therefore, a minimal number of follow-up drillholes will be required to understand geometry of this new discovery. |
Figure 19: Buckreef Gold Showing Location of Stamford Bridge Zone and Drill Hole Results
| 27 |
| Management’s Discussion and Analysis May 31, 2026 |
Table 1: Summary of Results – Stamford Bridge Zone
| Stamford Bridge Assay Results | ||||||||||||
| Hole ID | Hole Type | Drill Holes Location | Sample Depth | Width (m) | Assay Grade (gpt) | Lithology | Comment | |||||
| Easting (m) | Northing (m) | RL (m) | Azimuth | Dip | From (m) | To (m) | ||||||
| BMGT001 | DD | 391,780 | 9,658,453 | 1,218 | 270 | -50 | 105.0 | 115.4 | 10.4 | 3.03 | Msh | Stamford Bridge Mineralised shear zone with strong alteration |
| 186.6 | 208.0 | 21.4 | 2.42 | Msh | ||||||||
| 393.0 | 425.8 | 32.8 | 1.70 | Msh | Buckreef main shearzone | |||||||
| BMDD309 | DD | 391,676 | 9,658,400 | 1,217 | 334 | -60 | 101.8 | 104.5 | 2.7 | 1.65 | Msh | |
| Mineralised shear zone with strong alteration | ||||||||||||
| BMDD310 | DD | 391,723 | 9,658,418 | 1,217 | 334 | -60 | 64.5 | 100.0 | 35.5 | 5.48 | Msh | |
| BMDD312 | DD | 391,685 | 9,658,382 | 1,216 | 335 | -60 | 164.6 | 180.8 | 16.2 | 3.14 | Msh | Mineralised shear zone with strong alteration |
| BMDD315 | DD | 391,770 | 9,658,435 | 1,217 | 335 | -60 | 130.0 | 166.0 | 36.0 | 7.04 | Msh | Mineralised shear zone with strong alteration |
| BMDD319 | DD | 391,729 | 9,658,404 | 1,217 | 335 | -60 | 76.0 | 79.0 | 3.0 | 1.21 | Msh | Mineralised shear zone with strong alteration |
| BMDD319 | DD | 391,729 | 9,658,404 | 1,217 | 335 | -60 | 81.0 | 102.0 | 21.0 | 8.63 | Msh | Mineralised shear zone with strong alteration |
| BMDD320 | DD | 391,765 | 9,658,447 | 1,218 | 335 | -60 | 125.5 | 146.0 | 20.5 | 5.14 | Msh | Mineralised shear zone with strong alteration |
| BMDD321 | DD | 391,790 | 9,658,441 | 1,218 | 335 | -60 | 157.0 | 162.0 | 5.0 | 2.74 | Msh | Mineralised shear zone with strong alteration |
Notes: Sample Protocol QA/QC – see endnote 2. Sampled widths are not true widths.
Table 2: Buckreef Eastern Porphyry and Anfield Zone Sample Results Summary
| Eastern Porphyry Significant Assay Results | ||||||||||||
| Hole ID | Hole Type | Drill Holes Location | Sample Depth | Width (m) | Assay Grade (gpt) | Lithology | Comment | |||||
| Easting (m) | Northing (m) | RL (m) | Azimuth | Dip | From (m) | To (m) | ||||||
| BMDD297 | DD | 391955 | 9657841 | 1223 | 126 | 55 | 12.90 | 19.00 | 6.10 | 1.41 | FP | Oxidised Felsic pophyry with preserved shear fabric hosting quartz veins |
| 61.40 | 64.00 | 2.60 | 2.08 | FP | Slightly sheared felsic porphyry with Quartz, Carbonate pyrite alterations. | |||||||
| 70.00 | 73.82 | 3.82 | 3.10 | FP | ||||||||
| 98.80 | 113.50 | 14.70 | 1.22 | FP | Sheared unit of Felsic intrussive interfingering with mafic volanics. Quartz carbonate and pyrite altered. | |||||||
| BMDD298 | DD | 391997 | 9657844 | 1223 | 124 | 60 | 27.00 | 41.00 | 14.00 | 3.48 | FP | Oxidised Felsic porphyry with preserved shear fabric hosting quartz veins |
| Including | 27.00 | 30.00 | 3.00 | 10.96 | ||||||||
| 47.00 | 72.23 | 25.23 | 1.62 | FP | Weakly sheared felsic porphyry with moderate to strong Quatrz, Carbonate pyrite alterations. | |||||||
| 84.00 | 89.00 | 5.00 | 1.07 | FP | ||||||||
| BMDD299 | DD | 391901 | 9657813 | 1223 | 126 | 60 | 21.61 | 28.00 | 6.39 | 1.04 | FP | Moderate to weakly oxidised Felsic pophyry with preserved shear fabric |
| BMDD300 | DD | 391989 | 9657821 | 1191 | 126 | 55 | 33.65 | 37.26 | 3.61 | 6.80 | FP | Moderately oxidised Felsic pophyry with preserved shear fabric and hosting quartz vein |
| Anfield Prospect Significant Intercept Assay Results | ||||||||||||
| Hole ID | Hole Type | Drill Holes Location | Sample Depth | Width (m) | Assay Grade (gpt) | Lithology | Comment | |||||
| Easting (m) | Northing (m) | RL (m) | Azimuth | Dip | From (m) | To (m) | ||||||
| AFDD001 | DD | 391180.90 | 9657185.00 | 1210.275 | 135 | -60 | 43 | 45.94 | 2.94 | 13.74 | MB | Sheared mafic volcanic rock hosting quartz vein |
| AFDD002 | DD | 391164.50 | 9657169.00 | 1210.136 | 135 | -60 | 42.71 | 44.54 | 1.83 | 1.17 | MB | Sheared mafic volcanic rock |
| 83.42 | 88.34 | 4.92 | 0.9 | |||||||||
| AFDD004 | DD | 391209.40 | 9657173.00 | 1209.381 | 315 | -60 | 32.45 | 38.54 | 6.09 | 1.41 | MB | Sheared mafic volcanic rock |
| AFDD005 | DD | 391191.90 | 9657155.00 | 1209.368 | 315 | -60 | 17.09 | 21.35 | 4.26 | 1.01 | MB | Sheared mafic volcanic rock hosting quartz vein |
| 42.8 | 44.8 | 2.00 | 2.53 | Sheared mafic volcanic rock | ||||||||
| 47.09 | 51.15 | 4.06 | 1.27 | |||||||||
| AFDD007 | DD | 391108.36 | 9657186.36 | 1210.026 | 126 | -55 | 137.5 | 138.5 | 1.00 | 5.71 | MB | Sheared mafic volcanic rock with strong quartz carbonate pyrite alteration |
Notes: Sample Protocol QA/QC – see endnote 2. Sampled widths are not true widths.
| 28 |
| Management’s Discussion and Analysis May 31, 2026 |
Figure 20: NE Buckreef Main Zone and Location of the Eastern Porphyry - Anfield Zone Trend
| 29 |
| Management’s Discussion and Analysis May 31, 2026 |
Financial Highlights – Third Quarter and Year to Date 2026
For the three months ended May 31, 2026, Buckreef Gold poured 7,426 ounces of gold (Q3 2025: 4,687 ounces) and sold 6,983 ounces of gold (Q3 2025: 3,995 ounces) at an average realized price (net)1 of $4,703 per ounce (Q3 2025: $3,114 per ounce), recognizing revenue of $32.9 million, a 163% increase over the prior year comparative period (Q3 2025: $12.5 million).
Cost of sales, which include production costs, royalties and depreciation, was $13.4 million (Q3 2025: $8.1 million), generating gross profit of $19.5 million, a 344% increase over the prior year comparative period (Q3 2025: $4.4 million). Gross profit margins during Q3 2026 benefited from an increase in plant throughput, recovery and head grade following completion of the Stage 1 waste stripping campaign in fiscal 2025, which provided access to higher grade ore blocks benefiting production in Q3 2026. The Company recorded adjusted net income of $10.1 million (2025: $2.0 million) and generated operating cash flow of $8.8 million, an increase over the prior year comparative period (Q3 2025: $1.9 million). Q3 2026 operating cash flow was higher than the prior year comparative period mainly due to the impact of higher ounces of gold sold (Q3 2026: 6,983 ounces, Q3 2025: 3,995 ounces) and a higher average realized gold price during the quarter (Q3 2026: $4,703 per ounce, Q3 2025: $3,114 per ounce). Positive operating cash flow is being used to self-fund value creating activities, including plant expansions, exploration, and advancing the larger project as outlined in the PEA.
For the nine months ended May 31, 2026, Buckreef Gold produced and sold 21,476 and 20,789 ounces of gold, respectively (2025: 12,532 and 12,236 ounces of gold, respectively). The Company recognized revenue of $92.0 million, an increase over the prior year comparative period (2025: $34.1 million) and cost of sales was $37.3 million (2025: $22.7 million) generating a gross profit of $54.7 million (2025: $11.4 million). The Company recorded adjusted net income of $29.5 million (2025: $3.8 million) and generated operating cash flow of $20.5 million (2025: $6.2 million) which enabled further investment in the development and growth of Buckreef Gold.
Capital Expenditures
During the Q3 2026, the Company incurred a total of $7.9 million in cash capital expenditures. Net additions during the quarter included upgrades related to the 2,000 tpd plant, including payments on the pre-leach thickener, upgraded agitators & interstage screens, Aachen reactor, oxygen plant, ADR plant and new gold room, and apron feeder & belt magnet. During Q3 2026 the Company also completed an additional lift of TSF2.2, extending its useful life into Q2 2027. Concurrently, during Q3 2026, the Company continued to progress with TSF 3.0 for a long-term life of mine storage solution. For the nine months ended May 31, 2026, the Company incurred a total of $23.0 million in cash capital expenditures, mainly related to upgrades related to the 2,000 tpd plant, TSF 2.2 tailings lift and exploration drill purchases.
| 30 |
| Management’s Discussion and Analysis May 31, 2026 |
Selected Financial Information
The following information has been extracted from the Company’s Unaudited Interim Condensed Consolidated Financial Statements for the three and nine months ended May 31, 2026, prepared in accordance with IFRS.
| $(000's) | As at and for the three months ended May 31, 2026 | As at and for the May 31, 2026 | As at and for the three months ended May 31, 2025 | As at and for the nine months ended May 31, 2025 | ||||||||||||
| Net income (loss) and comprehensive income (loss) attributable to shareholders | 2,839 | (21,705 | ) | (218 | ) | (1,758 | ) | |||||||||
| Basic income (loss) per share | 0.01 | (0.07 | ) | (0.00 | ) | (0.01 | ) | |||||||||
| Total assets | 174,081 | 174,081 | 112,312 | 112,312 | ||||||||||||
| Total long term financial liabilities | 22,718 | 22,718 | 15,240 | 15,240 |
Financial Results
Three months ended May 31, 2026
| Three months ended May 31, | ||||||||
| $(000's) | 2026 | 2025 | ||||||
| Revenue | 32,848 | 12,474 | ||||||
| Cost of sales | (13,399 | ) | (8,091 | ) | ||||
| Gross profit | 19,449 | 4,383 | ||||||
| General and administrative expense | (3,743 | ) | (1,737 | ) | ||||
| Change in fair value of derivative financial instruments | - | 197 | ||||||
| Foreign exchange | 970 | 56 | ||||||
| Interest, net and other expense | (563 | ) | (290 | ) | ||||
| Income tax expense | (7,742 | ) | (1,110 | ) | ||||
| Net income and comprehensive income | 8,371 | 1,105 | ||||||
| Net income and comprehensive income | ||||||||
| attributable to non-controlling interests | 5,532 | 1,323 | ||||||
| Net income (loss) and comprehensive income (loss) | ||||||||
| attributable to shareholders | 2,839 | (218 | ) | |||||
Revenue
For the three months ended May 31, 2026, the Company recognized revenue of $32.9 million (Q3 2025: $12.5 million). The increase in revenue is primarily related to higher ounces of gold sold and a higher average realized gold price compared to the prior year comparative period. During the period, the Company sold 6,983 ounces of gold (Q3 2025: 3,995 ounces) at an average realized price (net)1 of $4,703 per ounce (Q3 2025: $3,114 per ounce).
Cost of sales
Cost of sales for the three months ended May 31, 2026, was $13.4 million (Q3 2025: $8.1 million) and is comprised of production costs (including mining, processing and site general and administrative costs), royalties and depreciation. Assets are depreciated on a straight-line basis over their useful life or depleted on a units-of-production basis over the estimated total recoverable ounces of gold to which they relate and are considered probable of economic extraction.
| 31 |
| Management’s Discussion and Analysis May 31, 2026 |
For the three months ended May 31, 2026, the Company recorded production costs of $9.3 million (Q3 2025: $6.2 million) and royalties of $2.2 million (Q3 2025: $1.0 million) based on statutory royalty rates in Tanzania. As part of the Gold Sale Service Agreement with the Bank of Tanzania (“BoT”), the Company benefits from a reduced royalty rate of 4.35% for any domestic sales made through the central bank and local refineries, where exported sales are subject to a 7.35% royalty.
Cash cost1 which includes production costs and royalties were $1,648 per ounce (Q3 2025: $1,819 per ounce). The decrease in cash cost1 compared to the prior year comparative period is primarily due to higher gold ounces produced following an increase in plant throughput, recovery and head grade, which more than offset a lower proportion of capitalized stripping costs following completion of the Stage 1 stripping campaign in fiscal 2025.
Following declaration of commercial production on November 1, 2022, capitalization of mine development costs ceased, and depreciation of capitalized mine development costs commenced. For the three months ended May 31, 2026, the Company recorded depreciation of $1.9 million (Q3 2025: $0.8 million).
General and administrative expenses
During the three months ended May 31, 2026, the Company recorded general and administrative expenses of $3.7 million compared to $1.7 million for the prior year period. The variance compared to the prior year period was mainly due to an increase in Canadian withholding tax on share based compensation as a result of equity based compensation issued for certain key management personnel.
Interest and other expense
During the three months ended May 31, 2026, the Company recorded interest and other expense of $0.6 million, compared to $0.3 million for the prior year period. The variance compared to the prior year period was mainly due to an increase in interest and other expenses related to the Stanbic VAF facility to fund downpayments on upgrades related to the 2,000 tpd processing plant.
Income tax expense
Income tax expense is recognized based on management’s estimate of the weighted average annual income tax rate expected for the full financial year. During the three months ended May 31, 2026, the Company recorded income tax expense of $7.7 million (Q3 2025: $1.1 million), comprised of a current income tax expense of $6.7 million (Q3 2025: $0.2 million) and deferred income tax expense of $1.0 million (Q3 2025: $0.9 million) based on current Tanzanian statutory tax rates.
Net income and comprehensive income
The Company reported net income for the three month period ended May 31, 2026, of $8.4 million ($2.8 million net income attributable to shareholders, basic and diluted earnings per share of $0.01) compared to net income of $1.1 million in the prior year period ($0.2 million net loss attributable to shareholders, basic and diluted loss per share of $0.00). The higher net income compared to the prior year comparative period is primarily due to an increase in gross profit following higher ounces of gold sold and a higher average realized gold price compared to the prior year comparative period. During the three month period ended May 31, 2026, the Company sold 6,983 ounces (Q3 2025: 3,995 ounces) at a record average realized price (net)1 of $4,703 per ounce (Q3 2025: $3,114 per ounce), generating gross profit of $19.5 million (Q3 2025: $4.4 million).
| 32 |
| Management’s Discussion and Analysis May 31, 2026 |
Financial Results
Nine months ended May 31, 2026
| Nine months ended May 31, | ||||||||
| $(000's) | 2026 | 2025 | ||||||
| Revenue | 92,037 | 34,109 | ||||||
| Cost of sales | (37,321 | ) | (22,748 | ) | ||||
| Gross profit | 54,716 | 11,361 | ||||||
| General and administrative expense | (10,440 | ) | (6,548 | ) | ||||
| Change in fair value of derivative financial instruments | (30,521 | ) | 1,461 | |||||
| Foreign exchange | 557 | (97 | ) | |||||
| Interest, net and other expense | (1,102 | ) | (1,931 | ) | ||||
| Income tax expense | (19,112 | ) | (2,945 | ) | ||||
| Net (loss) income and comprehensive (loss) income | (5,902 | ) | 1,301 | |||||
| Net income and comprehensive income | ||||||||
| attributable to non-controlling interests | 15,803 | 3,059 | ||||||
| Net loss and comprehensive loss | ||||||||
| attributable to shareholders | (21,705 | ) | (1,758 | ) | ||||
Revenue
For the nine months ended May 31, 2026, the Company recognized revenue of $92.0 million (2025: $34.1 million). The increase in revenue is primarily related to higher ounces of gold sold and a higher average realized gold price compared to the prior year comparative period. During the period, the Company sold 20,789 ounces of gold (2025: 12,236 ounces) at an average realized price (net)1 of $4,423 per ounce (2025: $2,829 per ounce).
Cost of sales
Cost of sales for the nine months ended May 31, 2026, was $37.3 million (2025: $22.7 million) and is comprised of production costs (including mining, processing and site general and administrative costs), royalties and depreciation.
For the nine months ended May 31, 2026, the Company recorded production costs of $26.0 million (2025: $17.9 million) and royalties of $6.3 million (2025: $2.6 million) based on statutory royalty rates in Tanzania. As part of the Gold Sale Service Agreement with the BoT, the Company benefits from a reduced royalty rate of 4.35% for any domestic sales made through the central bank and local refineries, where exported sales are subject to a 7.35% royalty.
Cash cost1 which includes production costs and royalties were $1,555 per ounce (2025: $1,635 per ounce). The decrease in cash cost1 compared to the prior year comparative period is primarily due to higher gold ounces produced following an increase in plant throughput, recovery and head grade, which more than offset a lower proportion of capitalized stripping costs following completion of the Stage 1 stripping campaign in fiscal 2025.
Following declaration of commercial production on November 1, 2022, capitalization of mine development costs ceased, and depreciation of capitalized mine development costs commenced. For the nine months ended May 31, 2026, the Company recorded depreciation of $5.0 million (2025: $2.3 million). Assets are depreciated on a straight-line basis over their useful life or depleted on a units-of-production basis over the estimated total recoverable ounces of gold to which they relate and are considered probable of economic extraction.
| 33 |
| Management’s Discussion and Analysis May 31, 2026 |
General and administrative expenses
During the nine months ended May 31, 2026, the Company recorded general and administrative expenses of $10.4 million compared to $6.5 million for the prior year period. The variance compared to the prior year period was mainly due to an increase in Canadian withholding tax on share based compensation as a result of equity based compensation issued for certain key management personnel, an increase in shareholder fees related to marketing and shareholder engagement, and an increase in professional fees related to internal controls compliance.
Change in fair value of derivative financial instruments
During the nine months ended May 31, 2026, the Company recorded a loss on change in fair value of derivative financial instruments of $30.5 million compared to a gain of $1.5 million in the prior year period. The loss on revaluation of derivative financial instruments is mainly related to the revaluation of derivative warrant liabilities. During Q2 2026, all of the Company’s derivative warrant liabilities were fully settled due to expiration or by issuing equity of the Company. The fair value of derivative warrant liabilities was calculated using the Black-Scholes Option Pricing Model as of the date of each respective warrant exercise or expiry. The loss on change in fair value was principally due to an increase in the Company’s share price (Q2 2026: $0.96-$1.83, Q4 2025: $0.37), a reduction in the remaining term of the warrants resulting from the passage of time, and an increase in the expected volatility assumption. The primary component was the difference between the share price at the time of exercise and the strike price of the warrants, which led to a non-cash loss which is included in income under IFRS. Following exercise of the Company’s warrants during Q2 2026, the Company received total gross proceeds of approximately $21.0 million and now has a clean capital structure with no remaining warrants outstanding.
Interest and other expense
During the nine months ended May 31, 2026, the Company recorded interest and other expense of $1.1 million, compared to $1.9 million for the prior year period. The variance compared to the prior year period was mainly due to lower accretion expense related to the gold prepayment facility as the Company had nil gold ounces outstanding under the Auramet Gold Prepayment Facility as at May 31, 2026. Additionally, in the prior year period, the Company expensed previously capitalized deferred financing costs upon expiry of the equity line of credit with Lincoln Park Capital Fund, LLC in mid-January 2025, and upon termination of the initial At The Market Offering Agreement with H.C. Wainwright & Co., LLC and Roth Capital Partners, LLC, prior to subsequent renewal in Q2 2025.
Income tax expense
Income tax expense is recognized based on management’s estimate of the weighted average annual income tax rate expected for the full financial year. During the nine months ended May 31, 2026, the Company recorded income tax expense of $19.1 million (2025: $2.9 million), comprised of a current income tax expense of $15.7 million (2025: $0.3 million) and deferred income tax expense of $3.5 million (2025: $2.6 million) based on current Tanzanian statutory tax rates.
Net income (loss) and comprehensive income (loss)
The Company reported a net loss for the nine month period ended May 31, 2026, of $5.9 million ($21.7 million net loss attributable to shareholders, basic and diluted loss per share of $0.07) compared to net income of $1.3 million in the prior year period ($1.8 million net loss attributable to shareholders, basic and diluted loss per share of $0.01). The higher net loss compared to the prior year comparative period is primarily due a loss on change in fair value of derivative financial instruments due to market based assumptions used in the fair market valuation of the Company’s warrant liabilities as of the date of each respective warrant exercise or expiry. During Q2 2026, all outstanding warrants of the Company were either exercised or expired, and the Company now has a clean capital structure with no remaining warrants outstanding. This was partially offset by an increase in gross profit as the Company increased the ounces of gold sold (2026: 20,789 ounces, 2025: 12,236 ounces) at a record average realized price1 of $4,423 per ounce (2025: $2,829 per ounce), generating higher gross profit of $54.7 million (2025: $11.4 million).
| 34 |
| Management’s Discussion and Analysis May 31, 2026 |
Summary of Quarterly Results
| ($(000's), except per share amounts) | ||||||||||||||||||||||||||||||||
| US$ unless otherwise stated | 2026 Q3 | 2026 Q2 | 2026 Q1 | 2025 Q4 | 2025 Q3 | 2025 Q2 | 2025 Q1 | 2024 Q4 | ||||||||||||||||||||||||
| Net income (loss) and comprehensive income (loss) | 8,371 | (13,777 | ) | (496 | ) | 5,265 | 1,105 | (1,941 | ) | 2,137 | 3,284 | |||||||||||||||||||||
| Net income (loss) and comprehensive income (loss) attributable to: | ||||||||||||||||||||||||||||||||
| Non-controlling interest | 5,532 | 6,599 | 3,672 | 2,820 | 1,323 | 580 | 1,156 | 1,229 | ||||||||||||||||||||||||
| Shareholders | 2,839 | (20,376 | ) | (4,168 | ) | 2,445 | (218 | ) | (2,521 | ) | 981 | 2,055 | ||||||||||||||||||||
| Net income (loss) and comprehensive income (loss) | 8,371 | (13,777 | ) | (496 | ) | 5,265 | 1,105 | (1,941 | ) | 2,137 | 3,284 | |||||||||||||||||||||
During the three months ended May 31, 2026, the Company reported net income of $8.4 million ($2.8 million net income attributable to shareholders), compared to a net loss of $13.8 million ($20.4 million net loss attributable to shareholders) in the prior quarter (Q2 2026). Net income in Q3 2026 is primarily due to 6,983 ounces of gold sold (Q2 2026: 7,314) at a record average realized price (net)1 of $4,703 per ounce (Q2 2026: $4,655) generating gross profit of $19.5 million (Q2 2026: $21.1 million). In Q2 2026 the Company incurred a loss on change in fair value of derivative financial instruments due to market based assumptions used in the fair market valuation of the Company’s warrant liabilities as of the date of each respective warrant exercise or expiry. During Q2 2026, all outstanding warrants of the Company were either exercised or expired. Net income (loss) has fluctuated since Q4 2024 due to a variety of factors ranging from the impact of higher average gold prices, record ounces of gold produced, and changes in fair value of derivative financial instruments.
Liquidity and Capital Resources
During Q3 2026 the Company continued to strengthen its working capital position through increased production, organically generated cashflow, improved liquidity and an increase in stockpile inventory. As a result, the Company’s current ratio has improved to a ratio of approximately 2.2 at May 31, 2026, including a cash balance of $26.8 million, an increase in net cash of approximately $19.1 million from year-end.
During Q3 2026, operating cash flow of $8.8 million was primarily offset by an increase in the capital investment in Buckreef Gold. The Company incurred a total of $7.9 million in cash capital expenditures mainly related to upgrades to the 2,000 tpd processing plant, including payments on the pre-leach thickener, upgraded agitators & interstage screens, Aachen reactor, oxygen plant, ADR plant and new gold room, and apron feeder & belt magnet. During Q3 2026 the Company completed construction works for an additional lift of TSF2.2 and progressed with testwork related to TSF3.0.
The Company has access to a Gold Prepayment Facility with Auramet International, Inc. through which Buckreef may, at its discretion, sell to up to an aggregate amount of $8.0 million of gold, up to 21 calendar days prior to delivery, on a revolving basis for a one-year term. This facility is in place to provide increased financial flexibility to help manage working capital fluctuations and to accelerate growth. As at May 31, 2026, the Company had nil gold ounces outstanding under the Auramet Gold Prepayment Facility.
During Q3 2026, the Company drew $0.6 million on the Stanbic revolving credit facility and VAF facility to fund downpayments on upgrades related to the 2,000 tpd processing plant, including payments on the pre-leach thickener, upgraded agitators & interstage screens, Aachen reactor, oxygen plant, ADR plant and new gold room, and apron feeder & belt magnet. This facility can provide access to approximately $9 million for capital requirements and working capital purposes. As at May 31, 2026, the Company had drawn $2.9 million on the Stanbic facility.
During Q3 2026, no shares were sold under the Company’s ATM pursuant to which the Company, at its discretion, may offer and sell, from time to time, common shares having an aggregate offering price of up to $25 million. During the nine months ended May 31, 2026, the Company sold 19,408 shares for net proceeds of approximately $15,255 under the ATM agreement to gain market intelligence around trading activity.
| 35 |
| Management’s Discussion and Analysis May 31, 2026 |
As of May 31, 2026, the Company has accumulated losses of $142.9 million since inception (August 31, 2025: $121.2 million).
Commitments
In order to maintain existing site mining and exploration licenses, the Company is required to pay annual license fees. As at May 31, 2026, these licenses remained in good standing, and the Company is up to date on license payments.
Contingencies
The Company can be involved in litigation and disputes arising in the normal course of operations. Management is of the opinion that the outcome of any potential litigation will not have a material adverse impact on the Company’s financial position or results of operations. Accordingly, no provisions for the settlement of outstanding litigation and potential claims have been accrued.
Off-Balance Sheet Arrangements
The Company has no off-balance sheet arrangements.
Transactions with Related Parties
The Company may enter into related party transactions that are in the normal course of business. Transactions with Related Parties disclosure can be found in Note 18 of the Unaudited Interim Condensed Consolidated Financial Statements for the three and nine months ended May 31, 2026.
Omnibus Equity Incentive Plan
Effective June 26, 2019, the Company adopted the Omnibus Equity Incentive Plan dated June 26, 2019 (the “Omnibus Plan”), which was approved by the shareholders on August 16, 2019, and subsequently reapproved by the shareholders on February 25, 2022, and February 27, 2025.
The purposes of the Omnibus Plan are: (a) to advance the interests of the Company by enhancing the ability of the Company and its subsidiaries to attract, motivate and retain employees, officers, directors, and consultants, which either of directors or officers may be consultants or employees; (b) to reward such persons for their sustained contributions; and (c) to encourage such persons to consider the long-term corporate performance of the Company.
The Omnibus Plan provides for the grant of options, restricted share units (“RSUs”), deferred share units (“DSUs”) and performance share units (“PSUs”) (collectively, the “Omnibus Plan Awards”), all of which are described in detail in the Form 40-F Annual Report for the year ended August 31, 2024, and the Information Circular dated January 15, 2025, filed on SEDAR+ on January 28, 2025.
The Omnibus Plan provides for the grant of other share-based awards to participants (“Other Share-Based Awards”), which awards would include the grant of common shares. All Other Share-Based Awards will be granted by an agreement evidencing the Other Share-Based Awards granted under the Omnibus Plan.
Subject to adjustments as provided for under the Omnibus Plan, the maximum number of shares issuable pursuant to Omnibus Plan Awards outstanding at any time under the Omnibus Plan shall not exceed 10% of the aggregate number of common shares outstanding from time to time on a non-diluted basis; provided that the acquisition of common shares by the Company for cancellation shall not constitute non-compliance with the Omnibus Plan for any Omnibus Plan Awards outstanding prior to such purchase of common shares for cancellation.
For more particulars about the Omnibus Plan, we refer you to the copy of the Omnibus Plan previously filed as an exhibit with the SEC and on SEDAR+. The Omnibus Plan replaces all previous equity compensation plans of the Company, including the Restricted Stock Unit Plan and Stock Option Plan.
| 36 |
| Management’s Discussion and Analysis May 31, 2026 |
Changes in Accounting Polices and Critical Accounting Estimates and Judgements
Material accounting policies as well as any changes in accounting policies are discussed in Note 3 “Material Accounting Policies” of the Company’s Unaudited Interim Condensed Consolidated Financial Statements for the three and nine months ended May 31, 2026.
Non-IFRS Performance Measures
Average Realized Price Per Ounce of Gold Sold
Average realized price per ounce of gold sold is a non-IFRS measure and does not constitute a measure recognized by IFRS and does not have a standardized meaning defined by IFRS. Average realized price per ounce of gold sold is calculated by dividing revenue by ounces of gold sold. It may not be comparable to information in other gold producers’ reports and filings. The following table provides a reconciliation of average realized price per ounce of gold sold to revenue per the Unaudited Interim Condensed Consolidated Financial Statements for the three and nine months ended May 31, 2026.
| Three Months Ended | Three Months Ended | Nine Months Ended | Nine Months Ended | |||||||||||||
| $(000's), except for per ounce amounts | May 31, 2026 | May 31, 2025 | May 31, 2026 | May 31, 2025 | ||||||||||||
| Revenue per financial statements | $ | 32,848 | $ | 12,474 | $ | 92,037 | $ | 34,109 | ||||||||
| Interest recognized from Auramet prepaid gold purchase agreement | (4 | ) | (34 | ) | (91 | ) | (64 | ) | ||||||||
| Revenue recognized from OCIM prepaid gold purchase agreement | — | — | — | (2,319 | ) | |||||||||||
| Revenue from gold sales | 32,844 | 12,440 | 91,946 | 31,726 | ||||||||||||
| Ounces of gold sold | 6,983 | 3,995 | 20,789 | 12,236 | ||||||||||||
| Ounces of gold sold from OCIM prepaid gold purchase agreement | — | — | — | (1,023 | ) | |||||||||||
| Ounces from gold sales (net of OCIM prepaid gold purchase agreement) | 6,983 | 3,995 | 20,789 | 11,213 | ||||||||||||
| Average realized price (gross) | $ | 4,704 | $ | 3,122 | $ | 4,427 | $ | 2,788 | ||||||||
| Average realized price (net) | $ | 4,703 | $ | 3,114 | $ | 4,423 | $ | 2,829 | ||||||||
Cash Cost Per Ounce of Gold Sold
Cash cost per ounce of gold sold is a non-IFRS performance measure and does not constitute a measure recognized by IFRS and does not have a standardized meaning defined by IFRS. Cash cost per ounce may not be comparable to information in other gold producers’ reports and filings. The following table provides a reconciliation of total cash cost per ounce of gold sold to cost of goods sold per the financial statements for the three and nine months ended May 31, 2026.
| Three Months Ended | Three Months Ended | Nine Months Ended | Nine Months Ended | |||||||||||||
| $(000's), except for per ounce amounts | May 31, 2026 | May 31, 2025 | May 31, 2026 | May 31, 2025 | ||||||||||||
| Cost of sales per financial statements | $ | 13,399 | $ | 8,091 | $ | 37,321 | $ | 22,748 | ||||||||
| Less: | ||||||||||||||||
| Depreciation | $ | (1,891 | ) | $ | (823 | ) | $ | (5,003 | ) | $ | (2,309 | ) | ||||
| Costs related to settlement of OCIM gold purchase agreement | $ | — | $ | — | $ | — | $ | (1,125 | ) | |||||||
| Total cash cost | $ | 11,508 | $ | 7,268 | $ | 32,318 | $ | 19,314 | ||||||||
| Ounces of gold sold | 6,983 | 3,995 | 20,789 | 12,236 | ||||||||||||
| Less: | ||||||||||||||||
| Ounces related to settlement of OCIM gold purchase agreement | — | — | — | (422 | ) | |||||||||||
| Total ounces of gold sold net of OCIM gold purchase agreement settlement | 6,983 | 3,995 | 20,789 | 11,814 | ||||||||||||
| Cash cost per ounce of gold sold | $ | 1,648 | $ | 1,819 | $ | 1,555 | $ | 1,635 | ||||||||
Adjusted EBITDA
Adjusted EBITDA is a non-IFRS performance measure and does not constitute a measure recognized by IFRS and does not have a standardized meaning defined by IFRS. Adjusted EBITDA may not be comparable to information in other gold producers’ reports and filings. Adjusted EBITDA is presented as a supplemental measure of the Company’s performance and ability to service its obligations. Adjusted EBITDA is frequently used by securities analysts, investors and other interested parties in the evaluation of companies in the industry, many of which present Adjusted EBITDA when reporting their results.
| 37 |
| Management’s Discussion and Analysis May 31, 2026 |
The Company presents Adjusted EBITDA because investors, analysts and rating agencies consider it useful in measuring the ability of those issuers to meet their obligations. Adjusted EBITDA represents net income (loss) before interest, income taxes, and depreciation and also eliminates the impact of a number of items that are not considered indicative of ongoing operating performance.
Certain items of expense are added, and certain items of income are deducted from net income that are not likely to recur or are not indicative of the Company’s underlying operating results for the reporting periods presented or for future operating performance.
The following table provides a reconciliation of net income (loss) and comprehensive income (loss) to Adjusted EBITDA per the financial statements for the three and nine months ended May 31, 2026.
| Three Months Ended | Three Months Ended | Nine Months Ended | Nine Months Ended | |||||||||||||
| $(000's) | May 31, 2026 | May 31, 2025 | May 31, 2026 | May 31, 2025 | ||||||||||||
| Net income (loss) and comprehensive income (loss) per financial statements | 8,371 | 1,105 | (5,902 | ) | 1,301 | |||||||||||
| Add: | ||||||||||||||||
| Depreciation | 1,891 | 823 | 5,003 | 2,309 | ||||||||||||
| Interest, net and other expense | 563 | 290 | 1,102 | 1,931 | ||||||||||||
| Non-recurring severance and legal expenses | — | 1 | — | 431 | ||||||||||||
| Income tax expense | 7,742 | 1,110 | 19,112 | 2,945 | ||||||||||||
| Change in fair value of derivative financial instruments | — | 197 | 30,521 | (1,461 | ) | |||||||||||
| Share-based payment expense | 2,113 | 453 | 4,300 | 1,882 | ||||||||||||
| Adjusted EBITDA | 20,680 | 3,979 | 54,136 | 9,338 | ||||||||||||
Adjusted Net Income
Adjusted Net Income is a non-IFRS performance measure and does not constitute a measure recognized by IFRS and does not have a standardized meaning defined by IFRS. Adjusted Net Income may not be comparable to information in other gold producers’ reports and filings. Adjusted Net Income is presented as a supplemental measure of the Company’s performance. Adjusted Net Income is frequently used by securities analysts, investors and other interested parties in the evaluation of companies in the industry, many of which present Adjusted Net Income when reporting their results.
Management uses this measure internally to evaluate the underlying operating performance for the reporting periods presented. Management believes that Adjusted Net Income is a useful measure of performance because the items excluded from Net Income do not reflect the underlying operating performance of the core mining business and are not necessarily indicative of future operating results.
The Company presents Adjusted Net Income to enable investors, analysts and rating agencies to better understand the underlying operating performance of the core mining business through the eyes of management. Adjusted Net Income is a non-IFRS financial measure which excludes the following from net income (loss): foreign exchange losses (gains), interest and other expense, change in fair value of derivative instruments, and share-based expenses, which are not considered indicative of the Company’s underlying operating results for the reporting periods presented or for future operating performance.
| 38 |
| Management’s Discussion and Analysis May 31, 2026 |
The following table provides a reconciliation of net income (loss) and comprehensive income (loss) to Adjusted Net Income per the financial statements for the three and nine months ended May 31, 2026.
| Three Months Ended | Three Months Ended | Nine Months Ended | Nine Months Ended | |||||||||||||
| $(000's) | May 31, 2026 | May 31, 2025 | May 31, 2026 | May 31, 2025 | ||||||||||||
| Net income (loss) and comprehensive income (loss) per financial statements | 8,371 | 1,105 | (5,902 | ) | 1,301 | |||||||||||
| Add: | ||||||||||||||||
| Foreign exchange (gains) losses | (970 | ) | (56 | ) | (557 | ) | 97 | |||||||||
| Interest, net and other expense | 563 | 290 | 1,102 | 1,931 | ||||||||||||
| Change in fair value of derivative financial instruments | - | 197 | 30,521 | (1,461 | ) | |||||||||||
| Share-based payment expense | 2,113 | 453 | 4,300 | 1,882 | ||||||||||||
| Adjusted net income | 10,077 | 1,989 | 29,464 | 3,750 | ||||||||||||
The Company has included “average realized price per ounce of gold sold”, “cash cost per ounce of gold sold”, “Adjusted EBITDA” and “Adjusted Net Income” as non-IFRS performance measures throughout this MD&A as TRX Gold believes that these generally accepted industry performance measures provide a useful indication of the Company’s operational performance. The Company believes that certain investors use this information to evaluate the Company’s performance and ability to generate cash flow. Accordingly, they are intended to provide additional information and should not be considered in isolation or as a substitute for measures of performance prepared in accordance with IFRS.
Disclosure of Outstanding Share Data
As at May 31, 2026, there were 327,474,009 common shares outstanding, nil share purchase warrants outstanding, 4,336,550 RSUs outstanding, nil PSUs/DSUs outstanding, and 12,802,220 stock options outstanding.
Risks Factors
The Company is subject to a number of extraneous risk factors over which it has no control. These factors are common to most mineral exploration and development companies and include, among others: project ownership, exploration and development risk, depressed equity markets and related financing risk, commodity price risk, fluctuating exchange rates, environmental risk, insurance risk, sovereign risk. For further details on the risk factors affecting the Company, please see the Company’s Form 40-F Annual Report for the year ended August 31, 2025, filed with the SEC on December 1, 2025, and on SEDAR+ as the Company’s Annual Information Form on December 1, 2025.
Disclosure Controls and Procedures and Internal Control Over Financial Reporting
The Company has filed certificates signed by the Chief Executive Officer (“CEO”) and the Chief Financial Officer (“CFO”) in accordance with National Instrument 52-109 Certification of Disclosure in Issuers’ Annual and Interim Filings. These certificates certify, among other matters, the establishment and maintenance of disclosure controls and procedures (“DC&P”) and internal control over financial reporting (“ICFR”), consistent with the principles underlying the Sarbanes-Oxley Act of 2002 (“SOX”).
Disclosure Controls and Procedures
The CEO and the CFO have designed, or caused to be designed under their supervision, DC&P to provide reasonable assurance that material information relating to the Company is made known to them on a timely basis and that information required to be disclosed in the Company’s filings and other reports under applicable securities legislation is recorded, processed, summarized and reported within the time periods specified.
| 39 |
| Management’s Discussion and Analysis May 31, 2026 |
Internal Control over Financial Reporting
The CEO and the CFO have also designed, or caused to be designed under their supervision, ICFR to provide reasonable assurance regarding the reliability of financial reporting and the preparation of financial statements for external purposes in accordance with International Financial Reporting Standards (“IFRS”). In assessing ICFR, management used the criteria established in Internal Control – Integrated Framework (2013) issued by the Committee of Sponsoring Organizations of the Treadway Commission (“COSO”), the framework commonly used for purposes of SOX-aligned internal control evaluation.
There were no material changes to the Company’s DC&P during the three and nine months ended May 31, 2026. In addition, there were no changes in the Company’s ICFR during the same period that have materially affected, or are reasonably likely to materially affect, the Company’s internal control over financial reporting.
Limitations of Controls
Any system of DC&P or ICFR, no matter how well designed, has inherent limitations. Accordingly, such controls can provide only reasonable, and not absolute, assurance that misstatements due to error or fraud will be prevented or detected.
Additional Information
The Company is a Canadian public company listed on the Toronto Stock Exchange trading under the symbol “TRX” and also listed on the NYSE American trading under the symbol “TRX”. Additional information about the Company and its business activities is available on SEDAR+ at www.sedarplus.ca; with the SEC at sec.gov; and the Company’s website at www.TRXgold.com.
Approval
The Board of Directors of TRX Gold Corporation has approved the disclosure contained in this Q3 2026 MD&A. A copy of this Q3 2026 MD&A will be provided to anyone who requests it. It is also available on the SEDAR+ website at www.sedarplus.ca.
| 40 |
| Management’s Discussion and Analysis May 31, 2026 |
Endnotes
1 Refer to “Non-IFRS Performance Measures” section.
2 Notes Regarding Sample Protocol QA/QC: The sample chain of custody is managed by the Buckreef Gold geology team on site. Reported results are from diamond drilled core samples. Intervals of core to be analyzed are split into half using a mechanized core cutter, with one half sent to the Laboratory for geochemical analysis and the remaining half kept in storage for future reference and uses. Diamond drilled core has been HQ size and recoveries are consistently 100% across all drill hole intercepts reported.
Sampling and analytical procedures are subject to a comprehensive quality assurance and quality control program. The QA/QC program involves insertion of duplicate samples, blanks and certified reference materials in the sample stream. Gold analyses were performed by standard fire assaying protocols using a 50-gram charge with atomic absorption (AAS) finish and a gravimetric finish performed for assays greater than 10 grams per tonne.
Sample Preparation and analysis were performed by independent SGS Laboratory in Mwanza, Tanzania. SGS Laboratory is ISO17025 accredited and employs a Laboratory Information Management System for sample tracking, quality control and reporting.
The results summarized in this MD&A from the “Buckreef Main Zone NEE” prospect is an extension of the known Buckreef Main Zone. The intercepts confirm a continuity of over 200 m of known Buckreef main deposit to the Northeast. The intersections reported here are a down-hole length and may not represent true width, however the true width is estimated to be between 50% - 60% of the length.
The results summarized in this MD&A from the “Stamford Bridge” target show intercepts that confirm an interpreted mineralized shear zone trending 070 degrees (ENE) that is over a km long. The intersections reported only cover the first 100 m strike length, they are a down-hole length and may not represent true width, however the true width is estimated to be between 50% - 60% of the length.
41