Pay vs Performance Disclosure - USD ($)
|
12 Months Ended |
Mar. 31, 2026 |
Mar. 31, 2025 |
Mar. 31, 2024 |
Mar. 31, 2023 |
Mar. 31, 2022 |
| Pay vs Performance Disclosure |
|
|
|
|
|
| Pay vs Performance Disclosure, Table |
| | | | | | | | | | | | | | | | | | | | | | | | | | | | | | | | Value of Initial Fixed $100 Investment Based On:(4) | | | Year(1) | Summary Compensation Table Total for PEO
($) | Compensation Actually Paid to PEO ($)(2)(3) | Average Summary Compensation Table Total for Non-PEO NEOs ($) | Average Compensation Actually Paid to Non-PEO NEOs ($)(2)(3) | Total Shareholder Return(5) ($) | Peer Group Total Shareholder Return ($)(6) | Net Income (Millions)
($) | Revenue (Millions) ($)(7) | | (a) | (b) | (c) | (d) | (e) | (f) | (g) | (h) | (i) | | 2026 | 19,586,169 | | (34,125,863) | | 2,172,654 | | (923,006) | | 43.96 | 209.64 | 196.1 | | 644.9 | | | 2025 | 17,234,989 | | 84,832,017 | | 1,332,569 | | 7,420,364 | | 109.49 | 162.45 | 223.2 | | 570.4 | | | 2024 | 298,869 | | (15,679,931) | | 2,486,614 | | 657,221 | | 50.77 | 153.41 | 147.6 | | 475.4 | | | 2023 | 243,726 | | (101,686,366) | | 1,074,218 | | (7,298,566) | | 61.09 | 105.07 | 112.8 | | 419.1 | | | 2022 | 243,388 | | 217,519,085 | | 3,225,392 | | 23,272,821 | | 98.28 | 110.08 | 154.8 | | 343.5 | |
|
|
|
|
|
| Company Selected Measure Name |
Revenue
|
|
|
|
|
| Named Executive Officers, Footnote |
Jeff Tangney was our PEO for all of the years represented in the table. The following individuals were our Non-PEO NEOs in the respective years: 2026: Anna Bryson, Jennifer Chaloemtiarana , Sid Sitaram, John T. Vaughan 2025: Anna Bryson, Nate Gross, Jennifer Chaloemtiarana 2024: Anna Bryson, Craig Overpeck, Nate Gross, Jennifer Chaloemtiarana 2023: Anna Bryson, Paul Jorgensen, Nate Gross, Jennifer Chaloemtiarana 2022: Anna Bryson, Paul Jorgensen, Joseph Kleine
|
|
|
|
|
| Peer Group Issuers, Footnote |
Represents the weighted peer group TSR of the S&P 500 Information Technology Index, weighted according to the respective companies’ stock market capitalization at the beginning of each period for which a return is indicated.
|
|
|
|
|
| PEO Total Compensation Amount |
$ 19,586,169
|
$ 17,234,989
|
$ 298,869
|
$ 243,726
|
$ 243,388
|
| PEO Actually Paid Compensation Amount |
$ (34,125,863)
|
84,832,017
|
(15,679,931)
|
(101,686,366)
|
217,519,085
|
| Adjustment To PEO Compensation, Footnote |
In accordance with Item 402(v) of Regulation S-K, the following adjustments were made to the 2026 amounts reported for our PEO and our other NEOs as a group in the “Total” column of the Summary Compensation Table for each year to calculate CAP. The assumptions used in calculating the fair value of the stock awards reported in this table are in accordance with FASB ASC 718 and set forth in Note 2 and Note 10 to our consolidated financial statements included in our Annual Report on Form 10-K for the fiscal year ended March 31, 2026. Such fair values do not take into account any estimated forfeitures related to service vesting conditions. The amounts reported in this table reflect the accounting cost for these RSUs and PSUs and do not correspond to the actual economic value that may be received by our PEO and NEOs upon the vesting and/or settlement of the RSU and PSU awards or any sale of the underlying shares of common stock. For details on the calculation of 'compensation actually paid' from 2022 through 2025, please see the 'Pay versus Performance' disclosures in our definitive proxy statements filed with the SEC on July 16, 2025 (for 2025 data), July 18, 2024 (for 2024 data), and June 14, 2023 (for 2022 and 2023 data). | | | | | | | | | | | | | | | | 2026 | | | | | | Jeff Tangney | Average Non-PEO NEOs | | | | | | | | Total Compensation from SCT | 19,586,169 | | 2,172,654 | | | | | | | | | Adjustments for equity awards: | | | | | | | | | | Grant date values in the SCT | (18,955,899) | | (1,739,921) | | | | | | | | | Year-end fair value of unvested awards granted in the current year | 7,516,906 | | 785,134 | | | | | | | | | Fair values at vest date for awards granted and vested in current year | — | | 331,516 | | | | | | | | | Change in fair values from prior year-end to current year-end of unvested awards granted in prior years | (38,336,907) | | (1,249,937) | | | | | | | | | Change in fair values from prior year-end to vest date of awards granted in prior years that vested in the year | (3,936,132) | | (292,623) | | | | | | | | | Forfeitures during current year equal to prior year-end fair value | — | | (929,829) | | | | | | | | | Dividends or dividend equivalents not otherwise included in total compensation | — | | — | | | | | | | | | Total Adjustments for Equity Awards | (53,712,032) | | (3,095,660) | | | | | | | | | Compensation Actually Paid | (34,125,863) | | (923,006) | | | | | | | |
|
|
|
|
|
| Non-PEO NEO Average Total Compensation Amount |
$ 2,172,654
|
1,332,569
|
2,486,614
|
1,074,218
|
3,225,392
|
| Non-PEO NEO Average Compensation Actually Paid Amount |
$ (923,006)
|
7,420,364
|
657,221
|
(7,298,566)
|
23,272,821
|
| Adjustment to Non-PEO NEO Compensation Footnote |
In accordance with Item 402(v) of Regulation S-K, the following adjustments were made to the 2026 amounts reported for our PEO and our other NEOs as a group in the “Total” column of the Summary Compensation Table for each year to calculate CAP. The assumptions used in calculating the fair value of the stock awards reported in this table are in accordance with FASB ASC 718 and set forth in Note 2 and Note 10 to our consolidated financial statements included in our Annual Report on Form 10-K for the fiscal year ended March 31, 2026. Such fair values do not take into account any estimated forfeitures related to service vesting conditions. The amounts reported in this table reflect the accounting cost for these RSUs and PSUs and do not correspond to the actual economic value that may be received by our PEO and NEOs upon the vesting and/or settlement of the RSU and PSU awards or any sale of the underlying shares of common stock. For details on the calculation of 'compensation actually paid' from 2022 through 2025, please see the 'Pay versus Performance' disclosures in our definitive proxy statements filed with the SEC on July 16, 2025 (for 2025 data), July 18, 2024 (for 2024 data), and June 14, 2023 (for 2022 and 2023 data). | | | | | | | | | | | | | | | | 2026 | | | | | | Jeff Tangney | Average Non-PEO NEOs | | | | | | | | Total Compensation from SCT | 19,586,169 | | 2,172,654 | | | | | | | | | Adjustments for equity awards: | | | | | | | | | | Grant date values in the SCT | (18,955,899) | | (1,739,921) | | | | | | | | | Year-end fair value of unvested awards granted in the current year | 7,516,906 | | 785,134 | | | | | | | | | Fair values at vest date for awards granted and vested in current year | — | | 331,516 | | | | | | | | | Change in fair values from prior year-end to current year-end of unvested awards granted in prior years | (38,336,907) | | (1,249,937) | | | | | | | | | Change in fair values from prior year-end to vest date of awards granted in prior years that vested in the year | (3,936,132) | | (292,623) | | | | | | | | | Forfeitures during current year equal to prior year-end fair value | — | | (929,829) | | | | | | | | | Dividends or dividend equivalents not otherwise included in total compensation | — | | — | | | | | | | | | Total Adjustments for Equity Awards | (53,712,032) | | (3,095,660) | | | | | | | | | Compensation Actually Paid | (34,125,863) | | (923,006) | | | | | | | |
|
|
|
|
|
| Compensation Actually Paid vs. Total Shareholder Return |
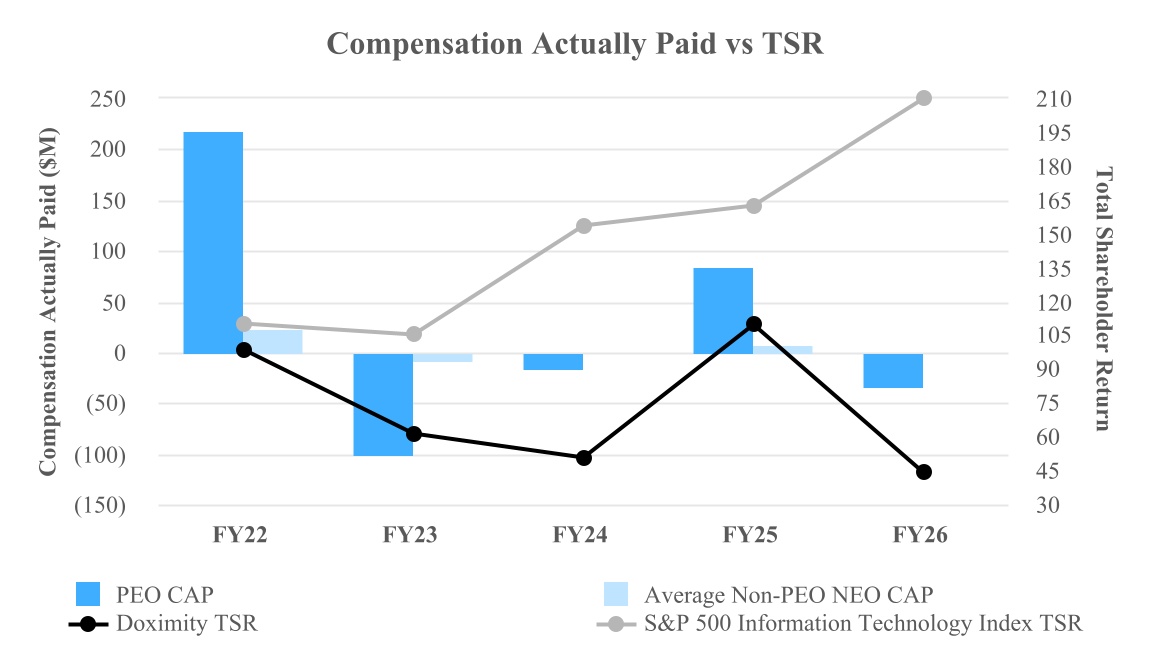
The graph below illustrates the relationship between CAP for our PEO, the average of CAP for our Non-PEO NEOs, the Company's cumulative TSR, and the cumulative TSR of the S&P 500 Information Technology Index for each of the periods presented in the Pay Versus Performance table.
|
|
|
|
|
| Compensation Actually Paid vs. Net Income |
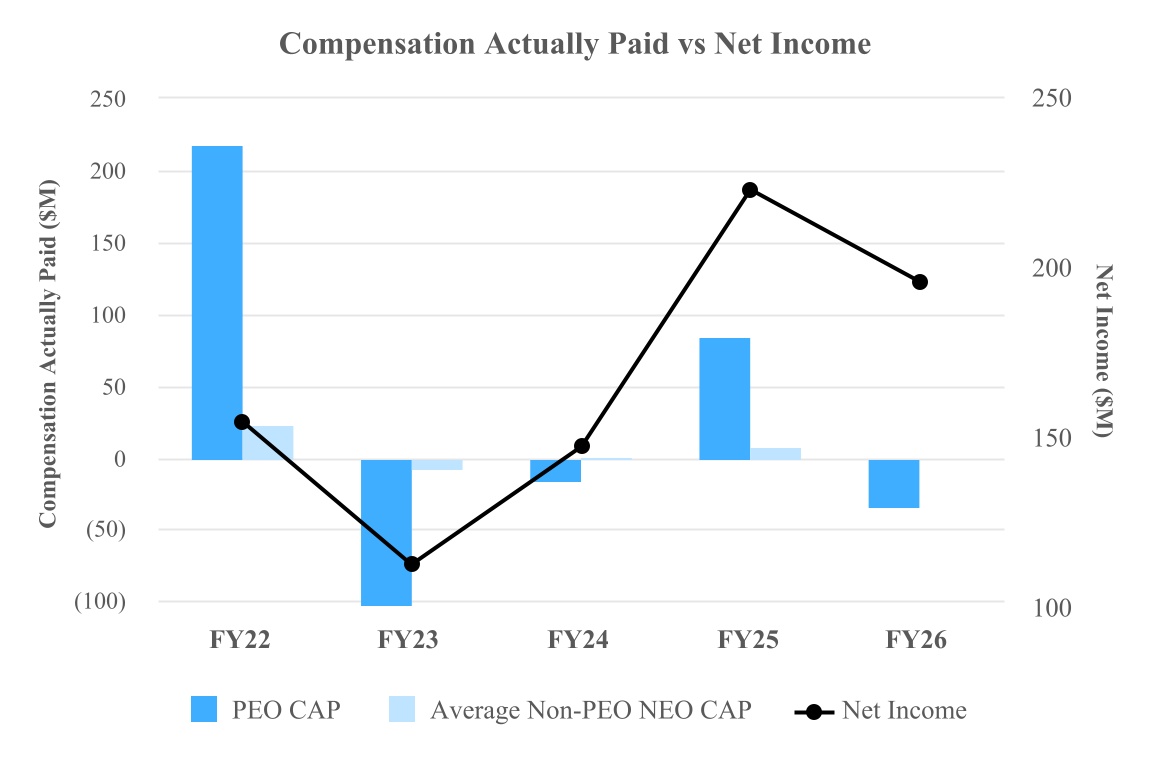
The graph below illustrates the relationship between the CAP for our PEO, the average of CAP for our Non-PEO NEOs, and the Company's net income for each of the periods presented in the Pay Versus Performance table.
|
|
|
|
|
| Compensation Actually Paid vs. Company Selected Measure |
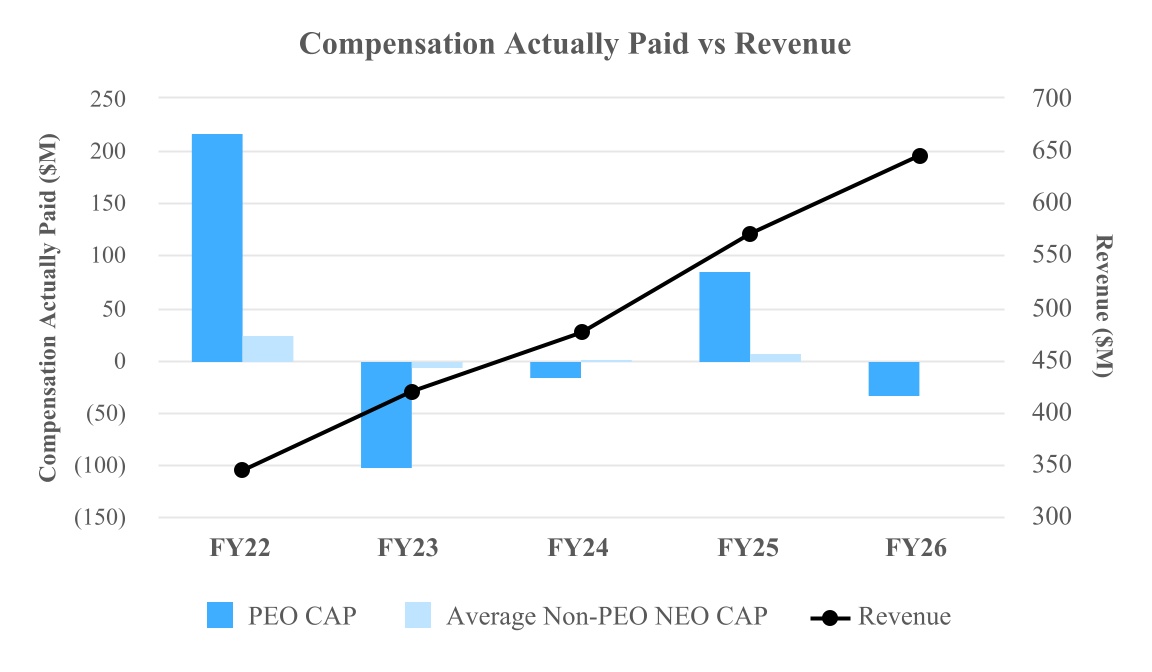
The graph below illustrates the relationship between the CAP for our PEO, the average of CAP for our Non-PEO NEOs, and the Company's revenue for each of the periods presented in the Pay Versus Performance table.
|
|
|
|
|
| Total Shareholder Return Vs Peer Group |
The graph below illustrates the relationship between CAP for our PEO, the average of CAP for our Non-PEO NEOs, the Company's cumulative TSR, and the cumulative TSR of the S&P 500 Information Technology Index for each of the periods presented in the Pay Versus Performance table.
|
|
|
|
|
| Tabular List, Table |
•Revenue •Adjusted EBITDA
|
|
|
|
|
| Total Shareholder Return Amount |
$ 43.96
|
109.49
|
50.77
|
61.09
|
98.28
|
| Peer Group Total Shareholder Return Amount |
209.64
|
162.45
|
153.41
|
105.07
|
110.08
|
| Net Income (Loss) |
$ 196,100,000
|
$ 223,200,000
|
$ 147,600,000
|
$ 112,800,000
|
$ 154,800,000
|
| Company Selected Measure Amount |
644,900,000
|
570,400,000
|
475,400,000
|
419,100,000
|
343,500,000
|
| PEO Name |
Jeff Tangney
|
|
|
|
|
| Additional 402(v) Disclosure |
The dollar amounts reported in column (c) and (e) represent the CAP to our PEO and the average CAP to our other NEOs as a group, respectively, as computed in accordance with Item 402(v) of Regulation S-K, and do not reflect the actual amount of compensation earned by or paid to our PEO or our other NEOs as a group during the applicable year. The Company and the Peer Group total shareholder return is determined based on the value of an initial fixed investment of $100 on June 24, 2021 (the date that our Class A common stock commenced trading on the NYSE) through the end of the listed year, and assumes that all dividends were reinvested.Cumulative TSR is calculated by dividing the sum of the cumulative amount of dividends for the measurement period, assuming dividend reinvestment, and the difference between the Company’s share price at the end and the beginning of the measurement period by the Company’s share price at the beginning of the measurement period.While the Company uses numerous financial and non-financial performance measures for the purpose of evaluating performance for the Company’s compensation programs, the Company has determined that Revenue is the financial performance measure that, in the Company’s assessment, represents the most important performance measure used by the Company to link compensation actually paid to the Company’s NEOs, for the most recently completed fiscal year, to Company performance. Relationship Between Compensation Actually Paid and Financial Performance Measures
As required by SEC rules, we are providing in this section a graphic analysis showing a comparison of the CAP to our NEOs and the other metrics presented in the Pay Versus Performance table: total stockholder return, net income, and revenue. Relationship between CAP, Cumulative Total Shareholder Return (“TSR”) of the Company and Cumulative TSR of the Peer Group
|
|
|
|
|
| Measure:: 1 |
|
|
|
|
|
| Pay vs Performance Disclosure |
|
|
|
|
|
| Name |
Revenue
|
|
|
|
|
| Measure:: 2 |
|
|
|
|
|
| Pay vs Performance Disclosure |
|
|
|
|
|
| Name |
Adjusted EBITDA
|
|
|
|
|
| PEO | Equity Awards Adjustments |
|
|
|
|
|
| Pay vs Performance Disclosure |
|
|
|
|
|
| Adjustment to Compensation, Amount |
$ (53,712,032)
|
|
|
|
|
| PEO | Aggregate Grant Date Fair Value of Equity Award Amounts Reported in Summary Compensation Table |
|
|
|
|
|
| Pay vs Performance Disclosure |
|
|
|
|
|
| Adjustment to Compensation, Amount |
(18,955,899)
|
|
|
|
|
| PEO | Year-end Fair Value of Equity Awards Granted in Covered Year that are Outstanding and Unvested |
|
|
|
|
|
| Pay vs Performance Disclosure |
|
|
|
|
|
| Adjustment to Compensation, Amount |
7,516,906
|
|
|
|
|
| PEO | Year-over-Year Change in Fair Value of Equity Awards Granted in Prior Years That are Outstanding and Unvested |
|
|
|
|
|
| Pay vs Performance Disclosure |
|
|
|
|
|
| Adjustment to Compensation, Amount |
(38,336,907)
|
|
|
|
|
| PEO | Vesting Date Fair Value of Equity Awards Granted and Vested in Covered Year |
|
|
|
|
|
| Pay vs Performance Disclosure |
|
|
|
|
|
| Adjustment to Compensation, Amount |
0
|
|
|
|
|
| PEO | Change in Fair Value as of Vesting Date of Prior Year Equity Awards Vested in Covered Year |
|
|
|
|
|
| Pay vs Performance Disclosure |
|
|
|
|
|
| Adjustment to Compensation, Amount |
(3,936,132)
|
|
|
|
|
| PEO | Prior Year End Fair Value of Equity Awards Granted in Any Prior Year that Fail to Meet Applicable Vesting Conditions During Covered Year |
|
|
|
|
|
| Pay vs Performance Disclosure |
|
|
|
|
|
| Adjustment to Compensation, Amount |
0
|
|
|
|
|
| PEO | Dividends or Other Earnings Paid on Equity Awards not Otherwise Reflected in Total Compensation for Covered Year |
|
|
|
|
|
| Pay vs Performance Disclosure |
|
|
|
|
|
| Adjustment to Compensation, Amount |
0
|
|
|
|
|
| Non-PEO NEO | Equity Awards Adjustments |
|
|
|
|
|
| Pay vs Performance Disclosure |
|
|
|
|
|
| Adjustment to Compensation, Amount |
(3,095,660)
|
|
|
|
|
| Non-PEO NEO | Aggregate Grant Date Fair Value of Equity Award Amounts Reported in Summary Compensation Table |
|
|
|
|
|
| Pay vs Performance Disclosure |
|
|
|
|
|
| Adjustment to Compensation, Amount |
(1,739,921)
|
|
|
|
|
| Non-PEO NEO | Year-end Fair Value of Equity Awards Granted in Covered Year that are Outstanding and Unvested |
|
|
|
|
|
| Pay vs Performance Disclosure |
|
|
|
|
|
| Adjustment to Compensation, Amount |
785,134
|
|
|
|
|
| Non-PEO NEO | Year-over-Year Change in Fair Value of Equity Awards Granted in Prior Years That are Outstanding and Unvested |
|
|
|
|
|
| Pay vs Performance Disclosure |
|
|
|
|
|
| Adjustment to Compensation, Amount |
(1,249,937)
|
|
|
|
|
| Non-PEO NEO | Vesting Date Fair Value of Equity Awards Granted and Vested in Covered Year |
|
|
|
|
|
| Pay vs Performance Disclosure |
|
|
|
|
|
| Adjustment to Compensation, Amount |
331,516
|
|
|
|
|
| Non-PEO NEO | Change in Fair Value as of Vesting Date of Prior Year Equity Awards Vested in Covered Year |
|
|
|
|
|
| Pay vs Performance Disclosure |
|
|
|
|
|
| Adjustment to Compensation, Amount |
(292,623)
|
|
|
|
|
| Non-PEO NEO | Prior Year End Fair Value of Equity Awards Granted in Any Prior Year that Fail to Meet Applicable Vesting Conditions During Covered Year |
|
|
|
|
|
| Pay vs Performance Disclosure |
|
|
|
|
|
| Adjustment to Compensation, Amount |
(929,829)
|
|
|
|
|
| Non-PEO NEO | Dividends or Other Earnings Paid on Equity Awards not Otherwise Reflected in Total Compensation for Covered Year |
|
|
|
|
|
| Pay vs Performance Disclosure |
|
|
|
|
|
| Adjustment to Compensation, Amount |
$ 0
|
|
|
|
|