ASML 2026 second-quarter results Veldhoven, the Netherlands July 15, 2026 ASML reports €9.3 billion total net sales and €2.9 billion net income in Q2 2026 ASML increases outlook, expects 2026 total net sales to be between €43 billion and €45 billion, with a gross margin between 54% and 56% Exhibit 99.2
Page 2July 15, 2026 Public • Investor key messages • Business summary • Outlook • Financial statements Agenda
Page 3July 15, 2026 Investor key messages
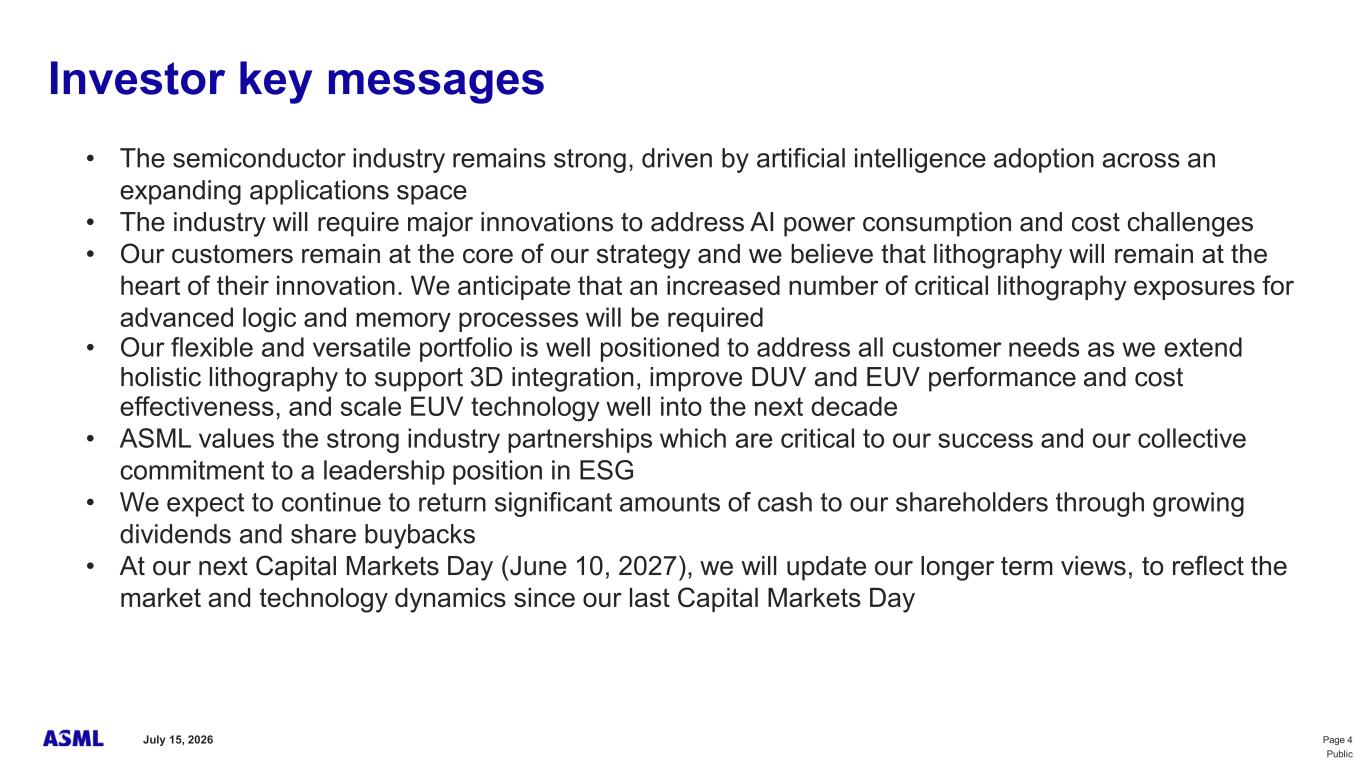
Page 4July 15, 2026 Public Investor key messages • The semiconductor industry remains strong, driven by artificial intelligence adoption across an expanding applications space • The industry will require major innovations to address AI power consumption and cost challenges • Our customers remain at the core of our strategy and we believe that lithography will remain at the heart of their innovation. We anticipate that an increased number of critical lithography exposures for advanced logic and memory processes will be required • Our flexible and versatile portfolio is well positioned to address all customer needs as we extend holistic lithography to support 3D integration, improve DUV and EUV performance and cost effectiveness, and scale EUV technology well into the next decade • ASML values the strong industry partnerships which are critical to our success and our collective commitment to a leadership position in ESG • We expect to continue to return significant amounts of cash to our shareholders through growing dividends and share buybacks • At our next Capital Markets Day (June 10, 2027), we will update our longer term views, to reflect the market and technology dynamics since our last Capital Markets Day
Page 5July 15, 2026 Business summary
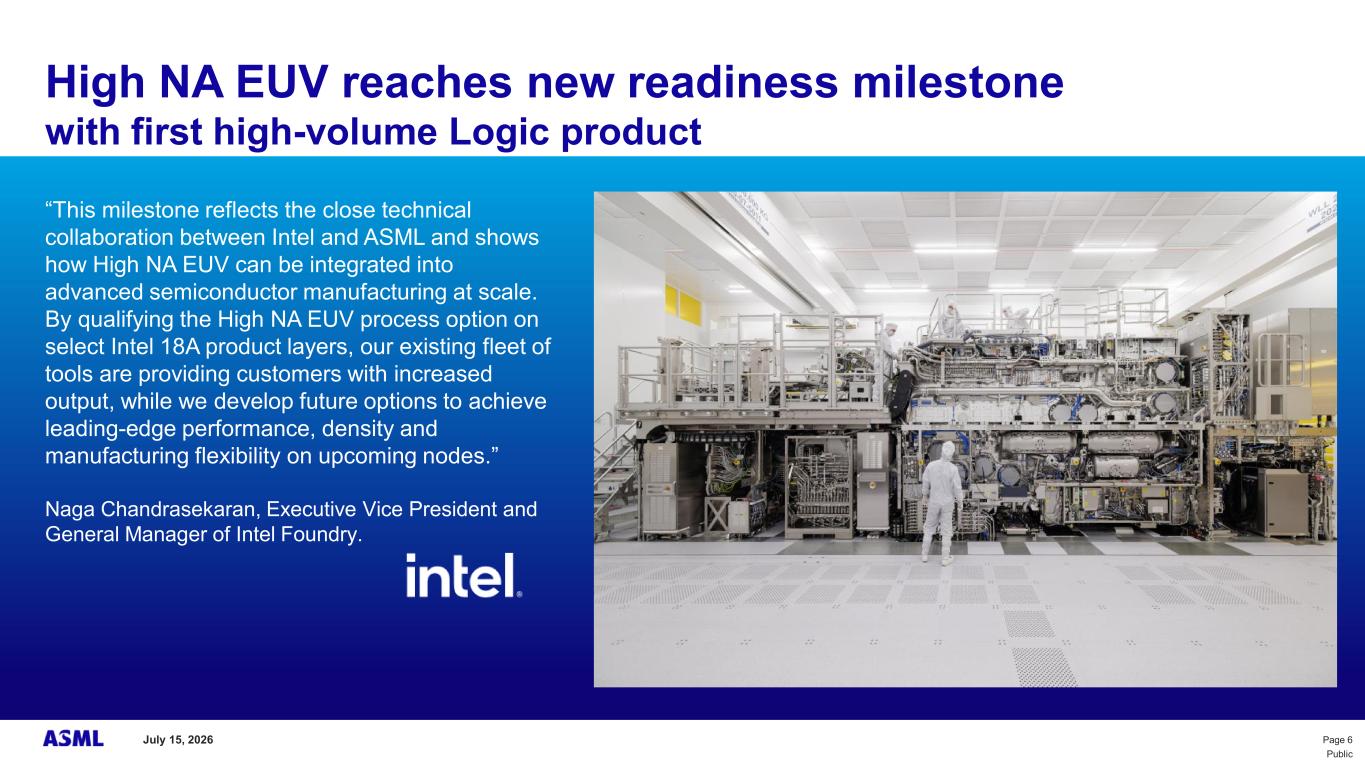
Page 6July 15, 2026 Public High NA EUV reaches new readiness milestone with first high-volume Logic product “This milestone reflects the close technical collaboration between Intel and ASML and shows how High NA EUV can be integrated into advanced semiconductor manufacturing at scale. By qualifying the High NA EUV process option on select Intel 18A product layers, our existing fleet of tools are providing customers with increased output, while we develop future options to achieve leading-edge performance, density and manufacturing flexibility on upcoming nodes.” Naga Chandrasekaran, Executive Vice President and General Manager of Intel Foundry.
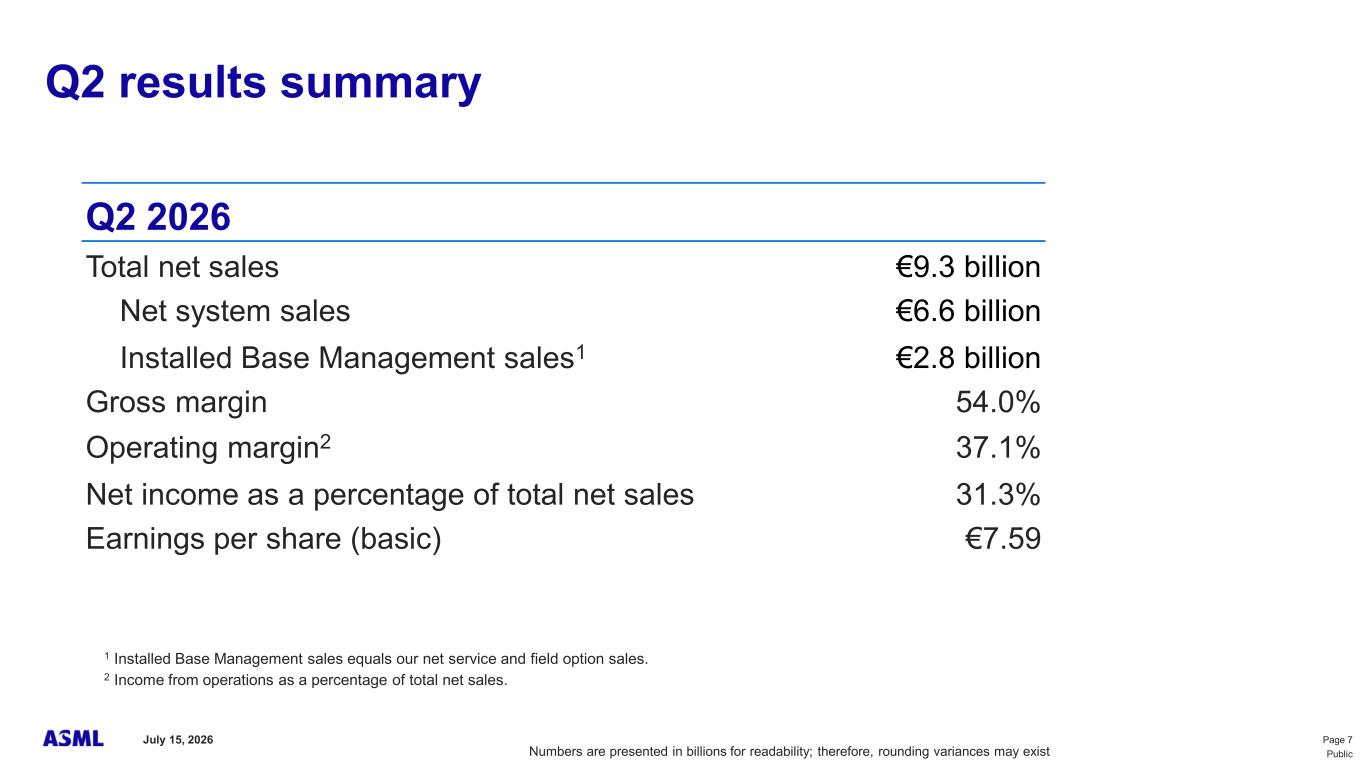
Page 7July 15, 2026 Public 1 Installed Base Management sales equals our net service and field option sales. 2 Income from operations as a percentage of total net sales. Q2 results summary Numbers are presented in billions for readability; therefore, rounding variances may exist Q2 2026 Total net sales €9.3 billion Net system sales €6.6 billion Installed Base Management sales1 €2.8 billion Gross margin 54.0% Operating margin2 37.1% Net income as a percentage of total net sales 31.3% Earnings per share (basic) €7.59
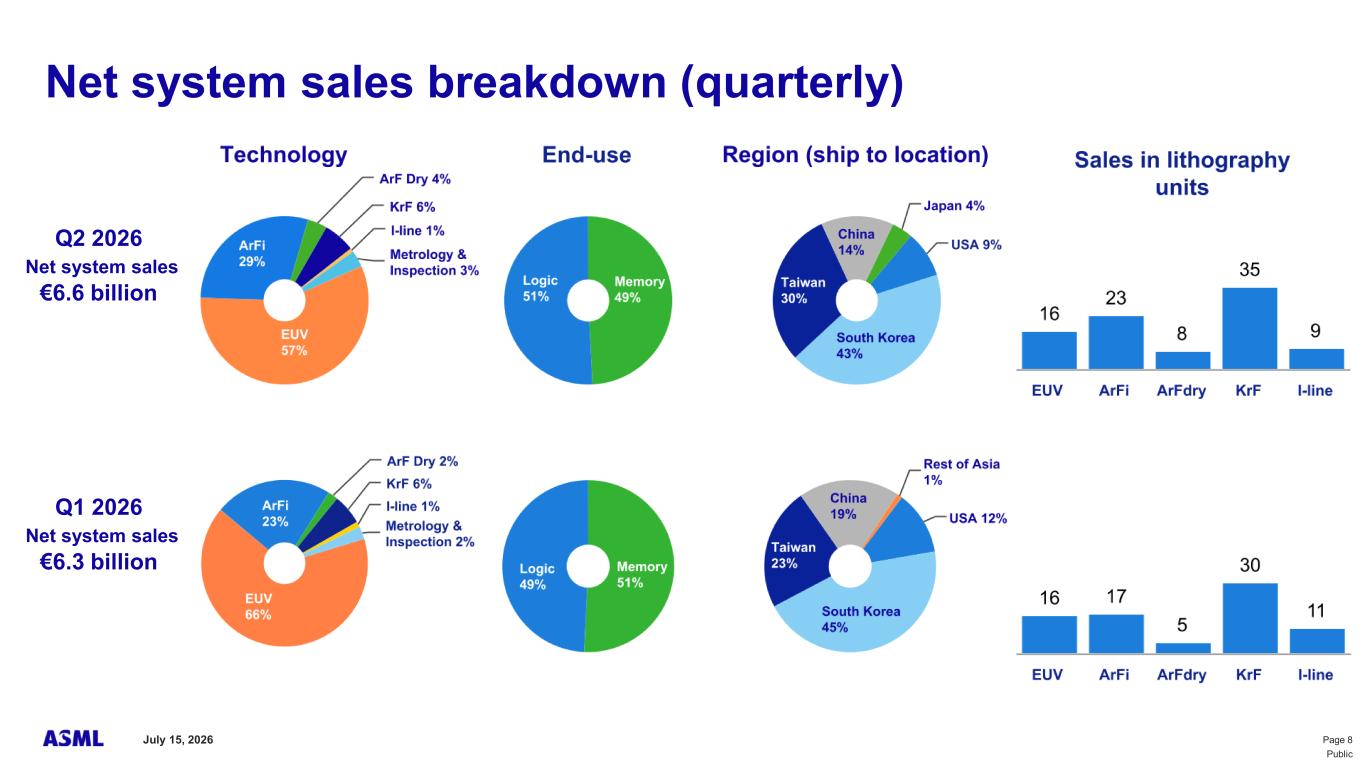
Page 8July 15, 2026 Public Net system sales breakdown (quarterly) Q2 2026 Net system sales €6.6 billion Q1 2026 Net system sales €6.3 billion
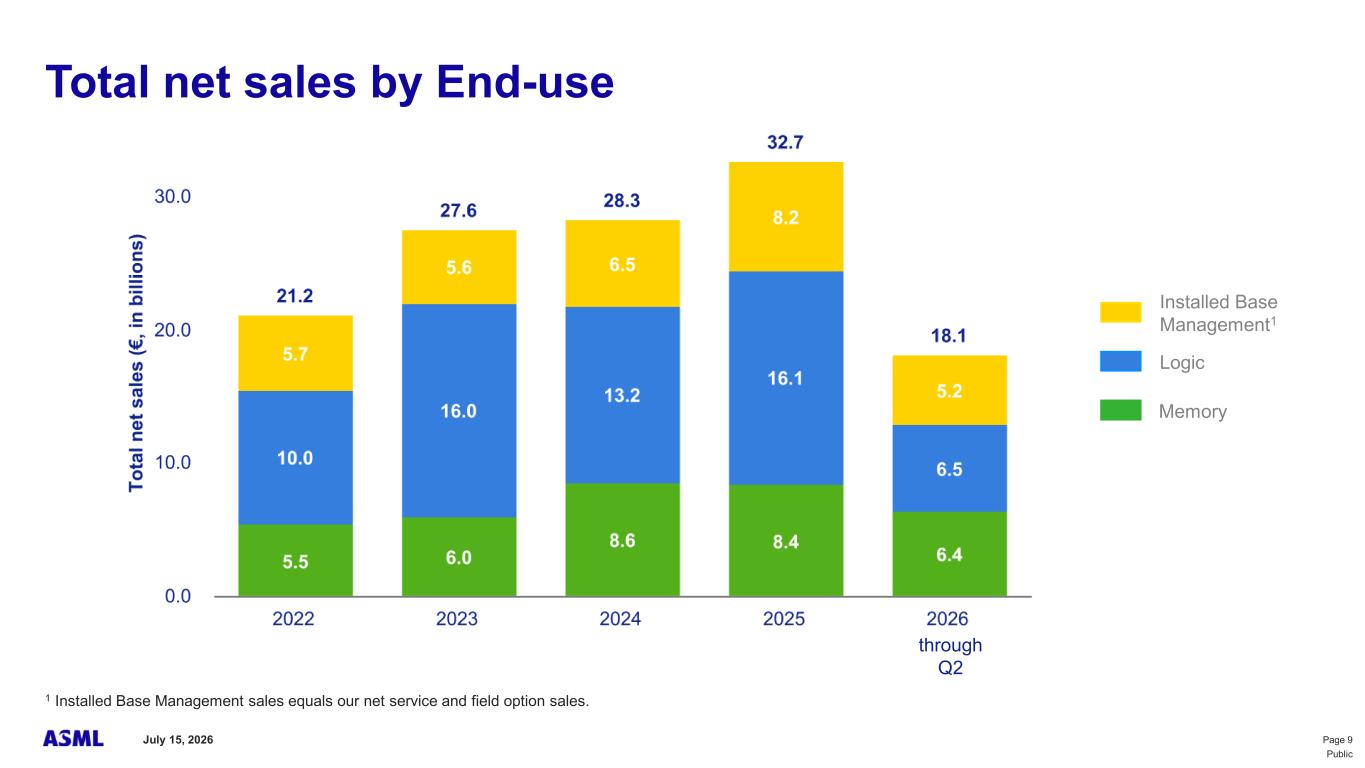
Page 9July 15, 2026 Public Logic Memory Installed Base Management1 1 Installed Base Management sales equals our net service and field option sales. Total net sales by End-use through Q2
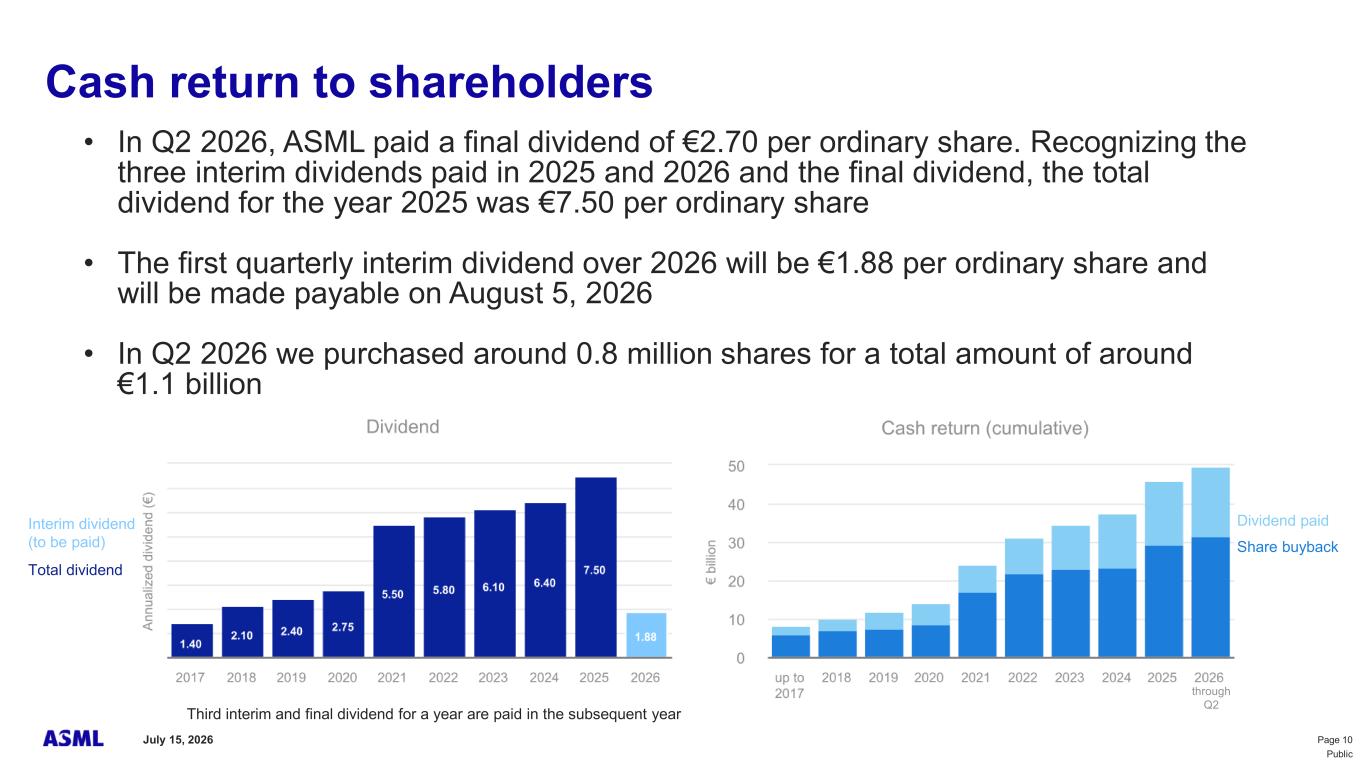
Page 10July 15, 2026 Public • In Q2 2026, ASML paid a final dividend of €2.70 per ordinary share. Recognizing the three interim dividends paid in 2025 and 2026 and the final dividend, the total dividend for the year 2025 was €7.50 per ordinary share • The first quarterly interim dividend over 2026 will be €1.88 per ordinary share and will be made payable on August 5, 2026 • In Q2 2026 we purchased around 0.8 million shares for a total amount of around €1.1 billion Cash return to shareholders Share buyback Dividend paid Third interim and final dividend for a year are paid in the subsequent year Total dividend Interim dividend (to be paid) through Q2

Page 11July 15, 2026 Outlook
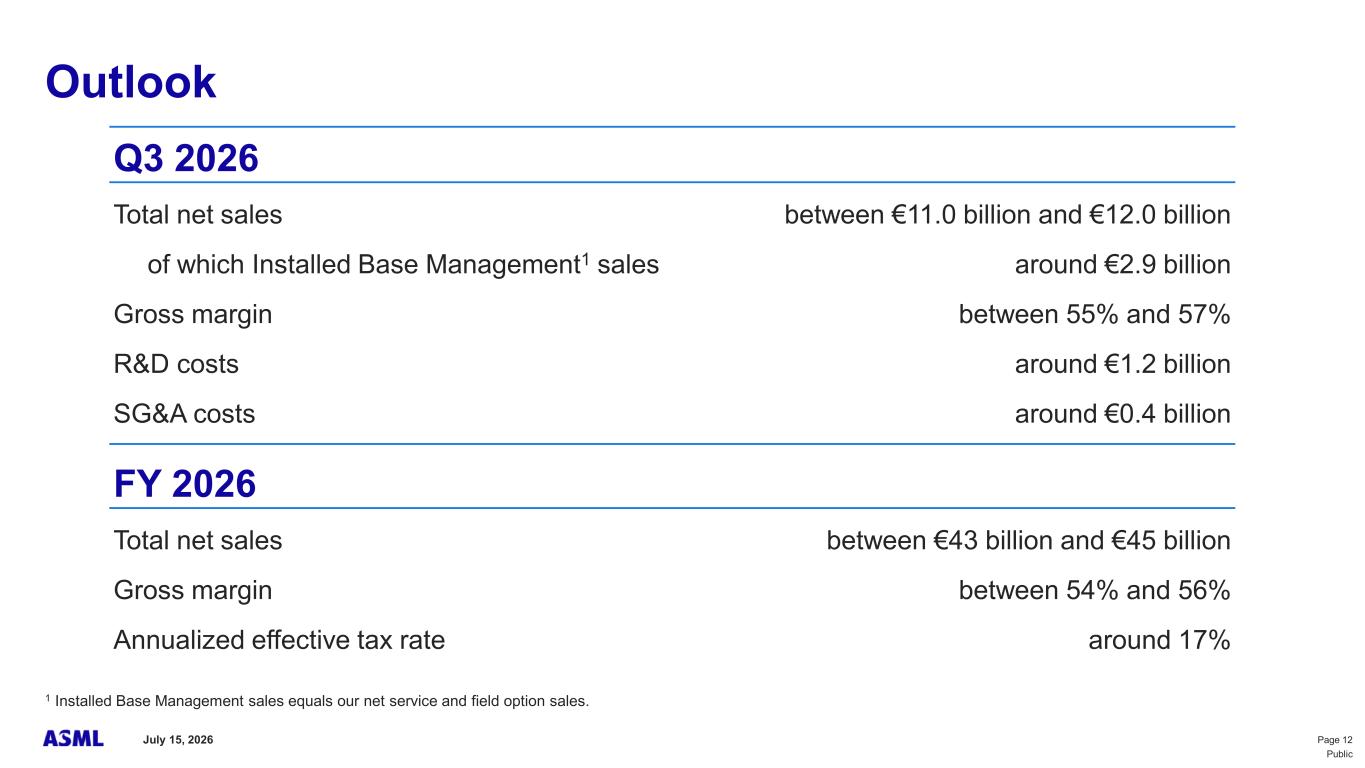
Page 12July 15, 2026 Public Outlook Q3 2026 Total net sales between €11.0 billion and €12.0 billion of which Installed Base Management1 sales around €2.9 billion Gross margin between 55% and 57% R&D costs around €1.2 billion SG&A costs around €0.4 billion FY 2026 Total net sales between €43 billion and €45 billion Gross margin between 54% and 56% Annualized effective tax rate around 17% 1 Installed Base Management sales equals our net service and field option sales.
Page 13July 15, 2026 Financial statements
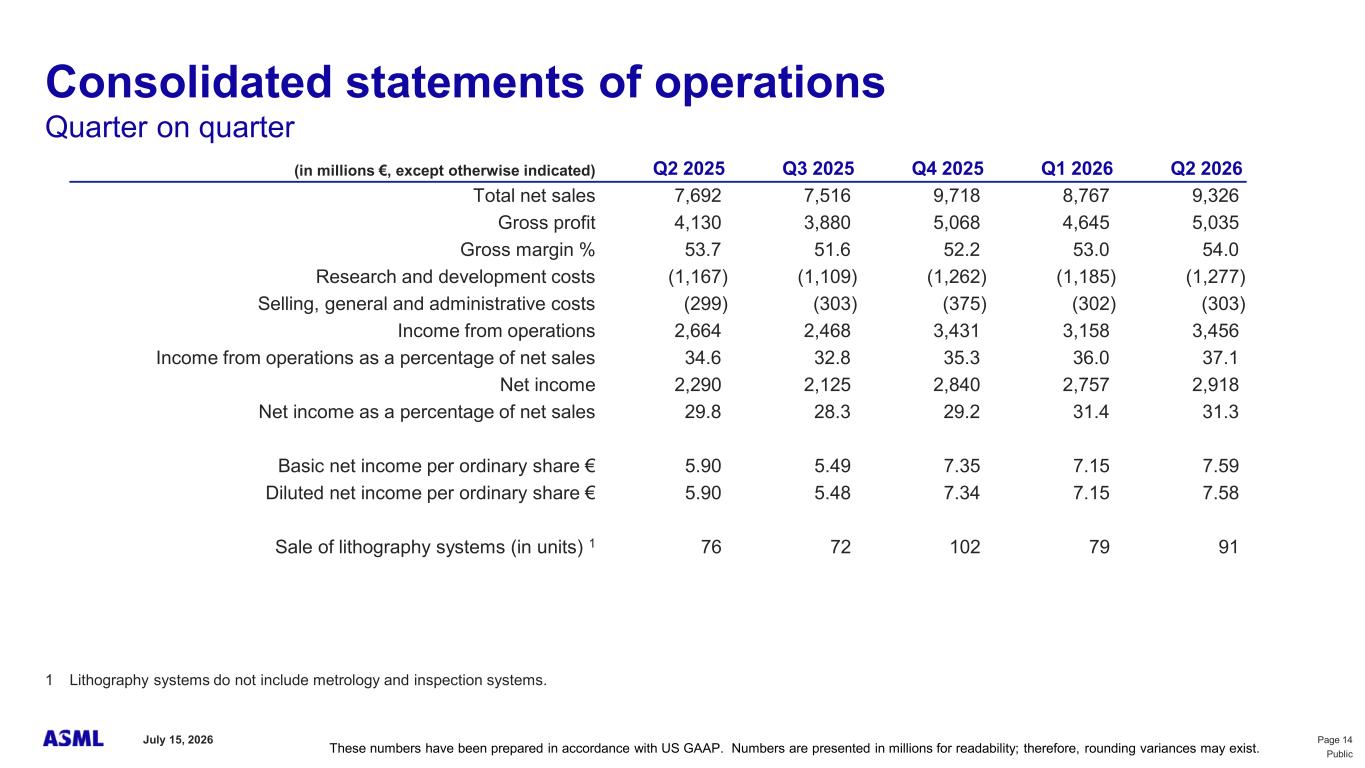
Page 14July 15, 2026 Public Consolidated statements of operations Quarter on quarter (in millions €, except otherwise indicated) Q2 2025 Q3 2025 Q4 2025 Q1 2026 Q2 2026 Total net sales 7,692 7,516 9,718 8,767 9,326 Gross profit 4,130 3,880 5,068 4,645 5,035 Gross margin % 53.7 51.6 52.2 53.0 54.0 Research and development costs (1,167) (1,109) (1,262) (1,185) (1,277) Selling, general and administrative costs (299) (303) (375) (302) (303) Income from operations 2,664 2,468 3,431 3,158 3,456 Income from operations as a percentage of net sales 34.6 32.8 35.3 36.0 37.1 Net income 2,290 2,125 2,840 2,757 2,918 Net income as a percentage of net sales 29.8 28.3 29.2 31.4 31.3 Basic net income per ordinary share € 5.90 5.49 7.35 7.15 7.59 Diluted net income per ordinary share € 5.90 5.48 7.34 7.15 7.58 Sale of lithography systems (in units) 1 76 72 102 79 91 1 Lithography systems do not include metrology and inspection systems. These numbers have been prepared in accordance with US GAAP. Numbers are presented in millions for readability; therefore, rounding variances may exist.
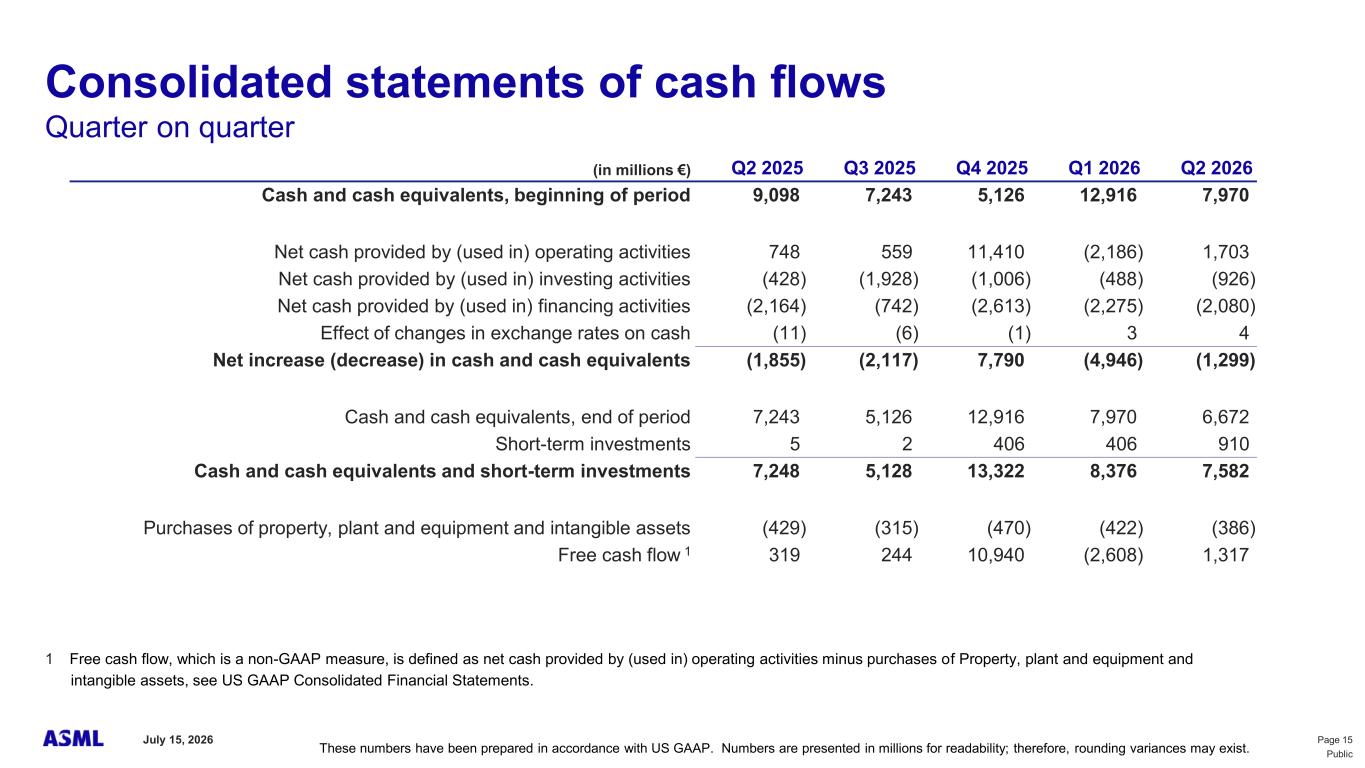
Page 15July 15, 2026 Public Consolidated statements of cash flows Quarter on quarter (in millions €) Q2 2025 Q3 2025 Q4 2025 Q1 2026 Q2 2026 Cash and cash equivalents, beginning of period 9,098 7,243 5,126 12,916 7,970 Net cash provided by (used in) operating activities 748 559 11,410 (2,186) 1,703 Net cash provided by (used in) investing activities (428) (1,928) (1,006) (488) (926) Net cash provided by (used in) financing activities (2,164) (742) (2,613) (2,275) (2,080) Effect of changes in exchange rates on cash (11) (6) (1) 3 4 Net increase (decrease) in cash and cash equivalents (1,855) (2,117) 7,790 (4,946) (1,299) Cash and cash equivalents, end of period 7,243 5,126 12,916 7,970 6,672 Short-term investments 5 2 406 406 910 Cash and cash equivalents and short-term investments 7,248 5,128 13,322 8,376 7,582 Purchases of property, plant and equipment and intangible assets (429) (315) (470) (422) (386) Free cash flow 1 319 244 10,940 (2,608) 1,317 1 Free cash flow, which is a non-GAAP measure, is defined as net cash provided by (used in) operating activities minus purchases of Property, plant and equipment and intangible assets, see US GAAP Consolidated Financial Statements. These numbers have been prepared in accordance with US GAAP. Numbers are presented in millions for readability; therefore, rounding variances may exist.
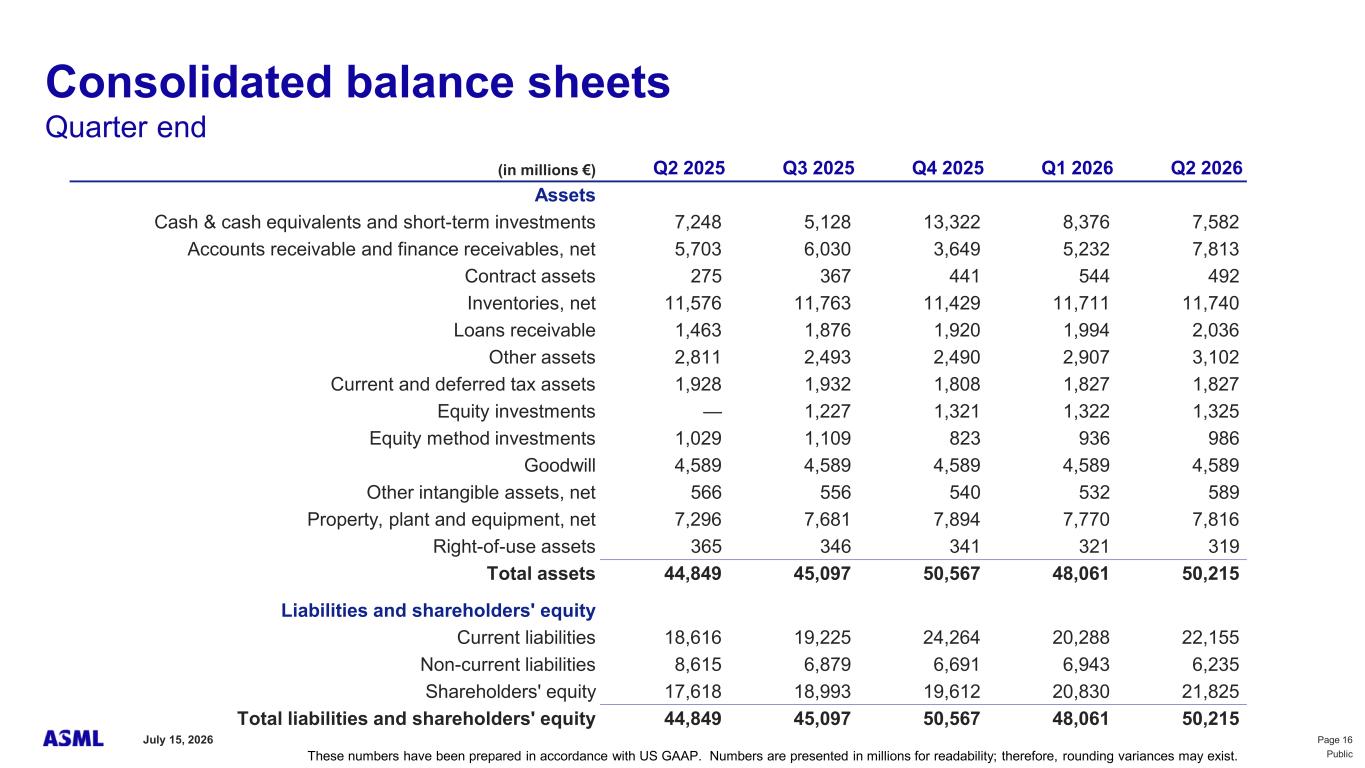
Page 16July 15, 2026 Public Consolidated balance sheets Quarter end (in millions €) Q2 2025 Q3 2025 Q4 2025 Q1 2026 Q2 2026 Assets Cash & cash equivalents and short-term investments 7,248 5,128 13,322 8,376 7,582 Accounts receivable and finance receivables, net 5,703 6,030 3,649 5,232 7,813 Contract assets 275 367 441 544 492 Inventories, net 11,576 11,763 11,429 11,711 11,740 Loans receivable 1,463 1,876 1,920 1,994 2,036 Other assets 2,811 2,493 2,490 2,907 3,102 Current and deferred tax assets 1,928 1,932 1,808 1,827 1,827 Equity investments — 1,227 1,321 1,322 1,325 Equity method investments 1,029 1,109 823 936 986 Goodwill 4,589 4,589 4,589 4,589 4,589 Other intangible assets, net 566 556 540 532 589 Property, plant and equipment, net 7,296 7,681 7,894 7,770 7,816 Right-of-use assets 365 346 341 321 319 Total assets 44,849 45,097 50,567 48,061 50,215 Liabilities and shareholders' equity Current liabilities 18,616 19,225 24,264 20,288 22,155 Non-current liabilities 8,615 6,879 6,691 6,943 6,235 Shareholders' equity 17,618 18,993 19,612 20,830 21,825 Total liabilities and shareholders' equity 44,849 45,097 50,567 48,061 50,215 These numbers have been prepared in accordance with US GAAP. Numbers are presented in millions for readability; therefore, rounding variances may exist.
Page 17July 15, 2026 Public This document and related discussions contain statements that are forward-looking within the meaning of the U.S. Private Securities Litigation Reform Act of 1995, including statements with respect to plans, strategies, expected trends, including expected trends in the semiconductor industry and end markets, business dynamics and business environment trends, the expected impact of AI investments and progress in AI technologies on demand for chips and semiconductor growth outlook and impact on our customers and our business, increasing intensity of lithography, plans and capability to increase capacity and output and expected capacity, customer plans including with respect to capacity additions, our product portfolio and portfolio roadmaps, backlog, technological developments expected shipment of systems, supply and demand trends, orders and order intake and momentum, increased visibility into longer-term demand, gross margin growth plans, outlook including expected sales of market segments and geographies, outlook and expected financial results including outlook and expected results for Q3 2026, including net sales, IBM sales, gross margin, R&D costs, SG&A costs, outlook and expectations with respect to full year 2026 including expected full year 2026 total net sales, gross margin, annualized effective tax rate and IBM sales, expectations with respect to EUV, DUV and metrology in 2026, expectations with respect to 2027 and 2028 including expected increase in wafer capacity of customers and investigation of increasing capability to add wafer capacity and system output capacity, statements made at our 2024 Investor Day, including investor key messages, our expectation to continue to return significant amounts of cash to shareholders through growing dividends and share buybacks and statements with respect to dividends, expected performance and capabilities of our systems and product roadmaps, customer outlook and plans including customer roadmaps, capital expenditures and capacity expansion plans, ESG strategy and commitments and other non-historical statements. You can generally identify these statements by the use of words like “may”, “expect”, “will”, “could”, “should”, “project”, “believe”, “anticipate”, “expect”, “plan”, “estimate”, “forecast”, “guide”, “potential”, “intend”, “continue”, “target”, “future”, “progress”, “goal”, “model”, “opportunity”, “commitment” and variations of these words or comparable words. These statements are not historical facts, but rather are based on current expectations, estimates, assumptions, plans and projections about our business and industry and our future financial results and readers should not place undue reliance on them. Forward-looking statements do not guarantee future performance and involve a number of substantial known and unknown risks and uncertainties. These risks and uncertainties include, without limitation, risks relating to customer demand, semiconductor equipment industry capacity, worldwide demand for semiconductors and semiconductor manufacturing capacity, lithography tool utilization and semiconductor inventory levels, general trends and consumer confidence in the semiconductor industry, the impact of general economic conditions, including the impact of the macroeconomic and geopolitical environment on the semiconductor industry, semiconductor market conditions, the impact of AI on our customers, the pace of customer increase in capacity, industry and business and semiconductor demand and demand for our tools, the impact of inflation, interest rate and exchange rate fluctuations, wars and geopolitical developments, the impact of pandemics, the performance of our systems, the success of technology advances and the pace of new product development and customer acceptance of and demand for new technologies, products and models and customer roadmaps, our production capacity and ability to adjust capacity to meet demand, supply chain capacity, timely availability of parts and components, raw materials, critical manufacturing equipment and qualified employees, our ability to produce systems to meet demand, the number and timing of systems ordered, shipped and recognized in revenue, risks relating to fluctuations in orders and our ability to convert orders into sales and risks relating to the realization of our backlog, the risk of order cancellations, delays or push outs and restrictions on shipments of systems, including ordered systems, under export controls, risks relating to the trade environment, import/export and national security regulations and orders and their impact on us, including the impact of changes in export regulations and the impact of such regulations on our ability to obtain necessary licenses and to sell our systems and provide services to certain customers, the impact of the tariff announcements, changes in tax rates, available liquidity and free cash flow and liquidity requirements, our ability to refinance our indebtedness, available cash and distributable reserves for, and other factors impacting, dividend payments and share repurchases, the number of shares that we repurchase under our share repurchase program, our ability to enforce patents and protect intellectual property rights and the outcome of intellectual property disputes and litigation, our ability to meet ESG goals and commitments and execute our ESG strategy, other factors that may impact ASML’s business or financial results, and other risks indicated in the risk factors included in ASML’s Annual Report on Form 20-F for the year ended December 31, 2025 and other filings with and submissions to the US Securities and Exchange Commission. These forward-looking statements are made only as of the date of this document. We undertake no obligation to update any forward-looking statements after the date of this report or to conform such statements to actual results or revised expectations, except as required by law. Forward looking statements