
P R E N E T I C S × G E N E R A L C A T A L Y S T · C U S T O M E R V A L U E F U N D $1 Billion of Capital to Create the Global Leader in Premium Supplements Non-dilutive growth financing to accelerate IM8 to global category leadership
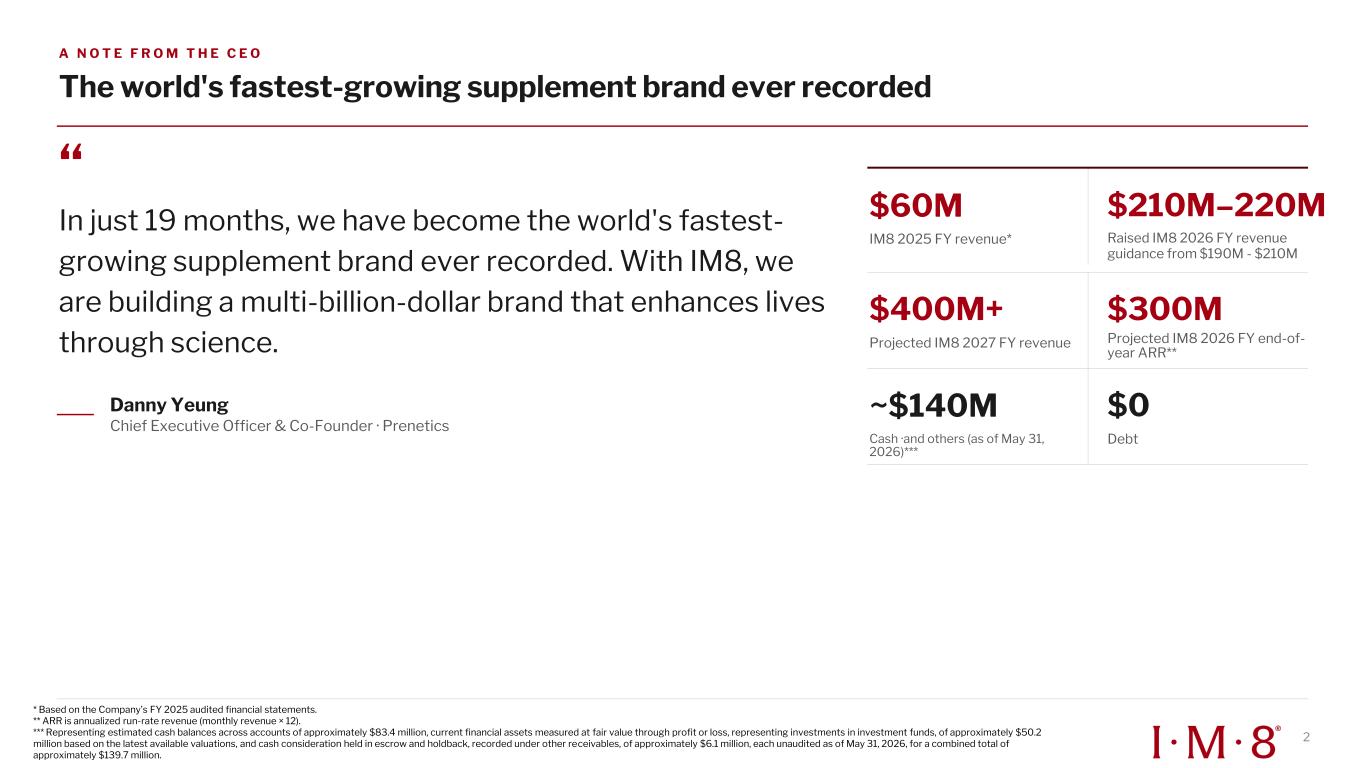
A N O T E F R O M T H E C E O The world's fastest-growing supplement brand ever recorded “ In just 19 months, we have become the world's fastest- growing supplement brand ever recorded. With IM8, we are building a multi-billion-dollar brand that enhances lives through science. Danny Yeung Chief Executive Officer & Co-Founder · Prenetics $60M IM8 2025 FY revenue* $210M–220M Raised IM8 2026 FY revenue guidance from $190M - $210M $400M+ Projected IM8 2027 FY revenue $300M Projected IM8 2026 FY end-of- year ARR** ~$140M Cash ·and others (as of May 31, 2026)*** $0 Debt * Based on the Company’s FY 2025 audited financial statements. ** ARR is annualized run-rate revenue (monthly revenue × 12). *** Representing estimated cash balances across accounts of approximately $83.4 million, current financial assets measured at fair value through profit or loss, representing investments in investment funds, of approximately $50.2 million based on the latest available valuations, and cash consideration held in escrow and holdback, recorded under other receivables, of approximately $6.1 million, each unaudited as of May 31, 2026, for a combined total of approximately $139.7 million. 2
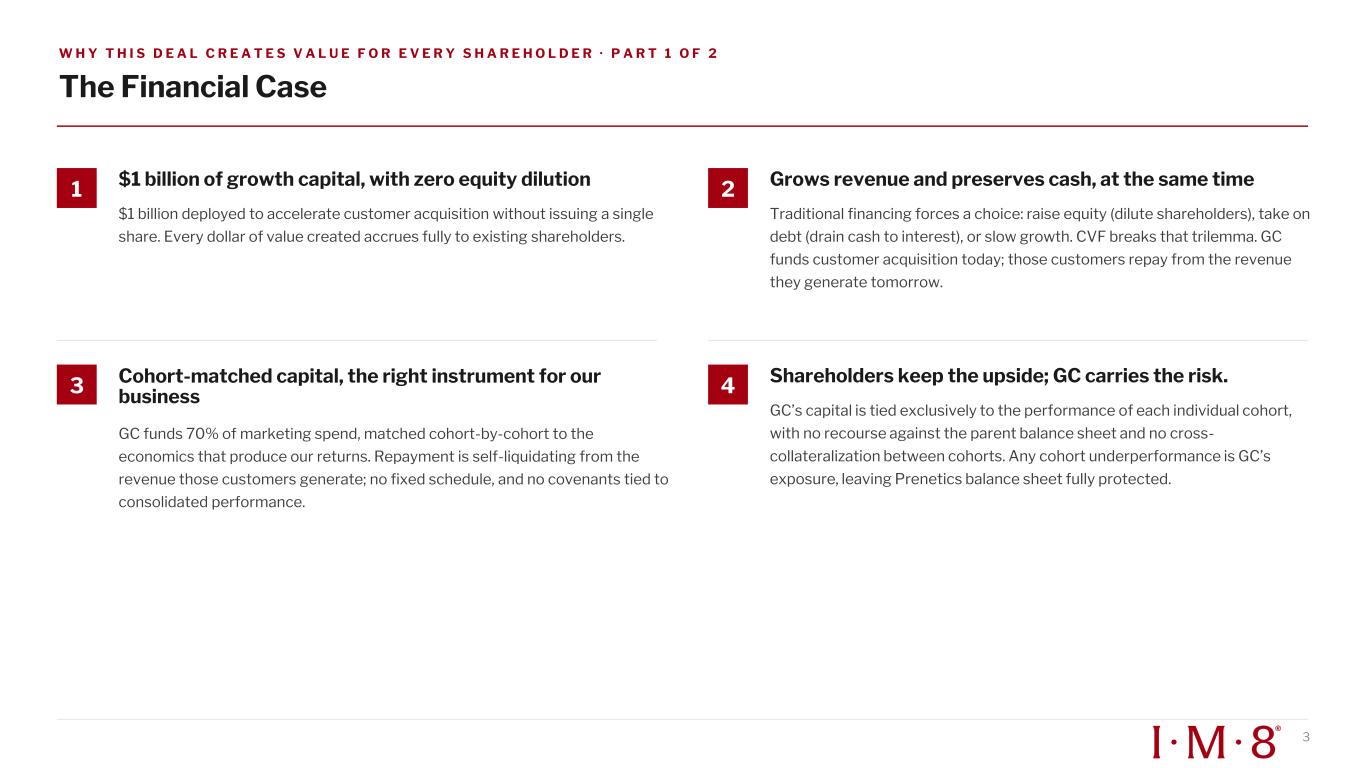
W H Y T H I S D E A L C R E A T E S V A L U E F O R E V E R Y S H A R E H O L D E R · P A R T 1 O F 2 The Financial Case 1 $1 billion of growth capital, with zero equity dilution $1 billion deployed to accelerate customer acquisition without issuing a single share. Every dollar of value created accrues fully to existing shareholders. 2 Grows revenue and preserves cash, at the same time Traditional financing forces a choice: raise equity (dilute shareholders), take on debt (drain cash to interest), or slow growth. CVF breaks that trilemma. GC funds customer acquisition today; those customers repay from the revenue they generate tomorrow. 3 Cohort-matched capital, the right instrument for our business GC funds 70% of marketing spend, matched cohort-by-cohort to the economics that produce our returns. Repayment is self-liquidating from the revenue those customers generate; no fixed schedule, and no covenants tied to consolidated performance. 4 Shareholders keep the upside; GC carries the risk. GC’s capital is tied exclusively to the performance of each individual cohort, with no recourse against the parent balance sheet and no cross- collateralization between cohorts. Any cohort underperformance is GC’s exposure, leaving Prenetics balance sheet fully protected. 3
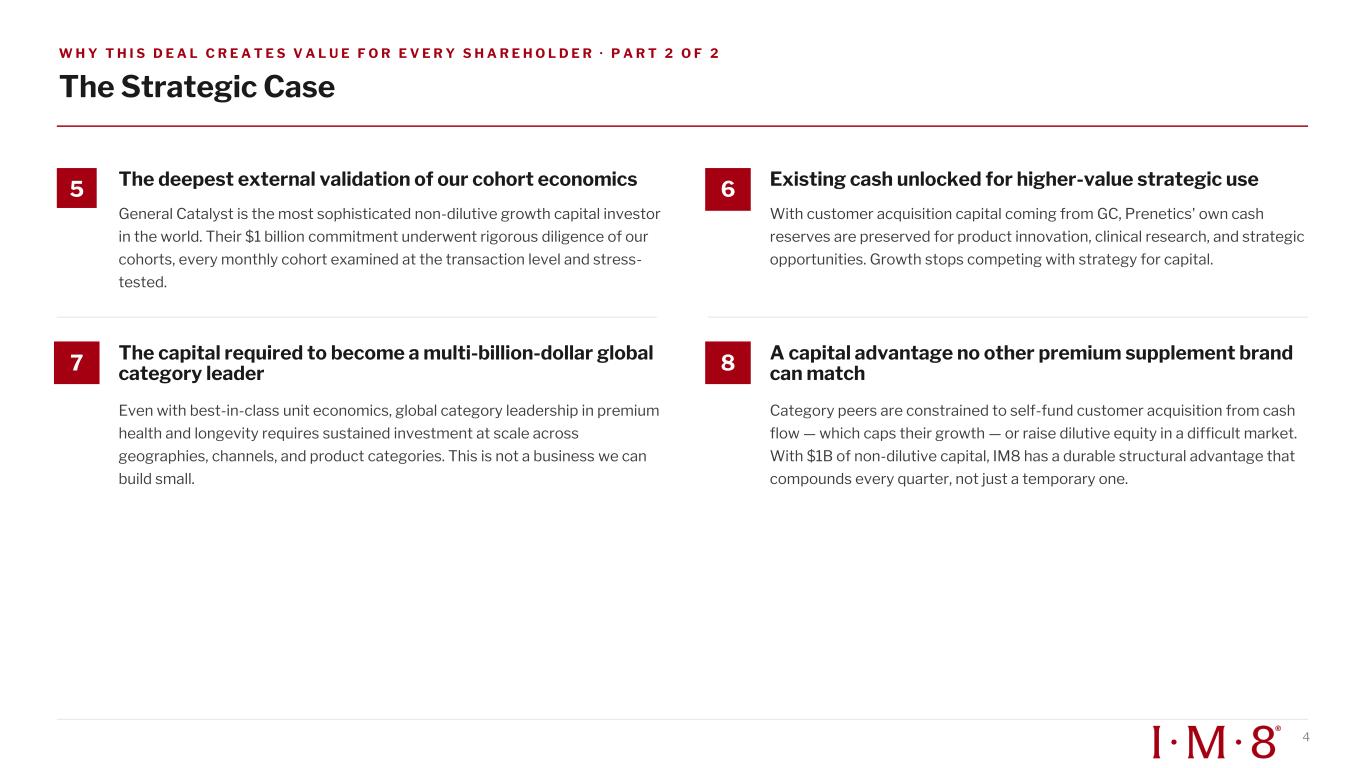
W H Y T H I S D E A L C R E A T E S V A L U E F O R E V E R Y S H A R E H O L D E R · P A R T 2 O F 2 The Strategic Case 5 The deepest external validation of our cohort economics General Catalyst is the most sophisticated non-dilutive growth capital investor in the world. Their $1 billion commitment underwent rigorous diligence of our cohorts, every monthly cohort examined at the transaction level and stress- tested. 6 Existing cash unlocked for higher-value strategic use With customer acquisition capital coming from GC, Prenetics' own cash reserves are preserved for product innovation, clinical research, and strategic opportunities. Growth stops competing with strategy for capital. 7 The capital required to become a multi-billion-dollar global category leader Even with best-in-class unit economics, global category leadership in premium health and longevity requires sustained investment at scale across geographies, channels, and product categories. This is not a business we can build small. 8 A capital advantage no other premium supplement brand can match Category peers are constrained to self-fund customer acquisition from cash flow — which caps their growth — or raise dilutive equity in a difficult market. With $1B of non-dilutive capital, IM8 has a durable structural advantage that compounds every quarter, not just a temporary one. 4
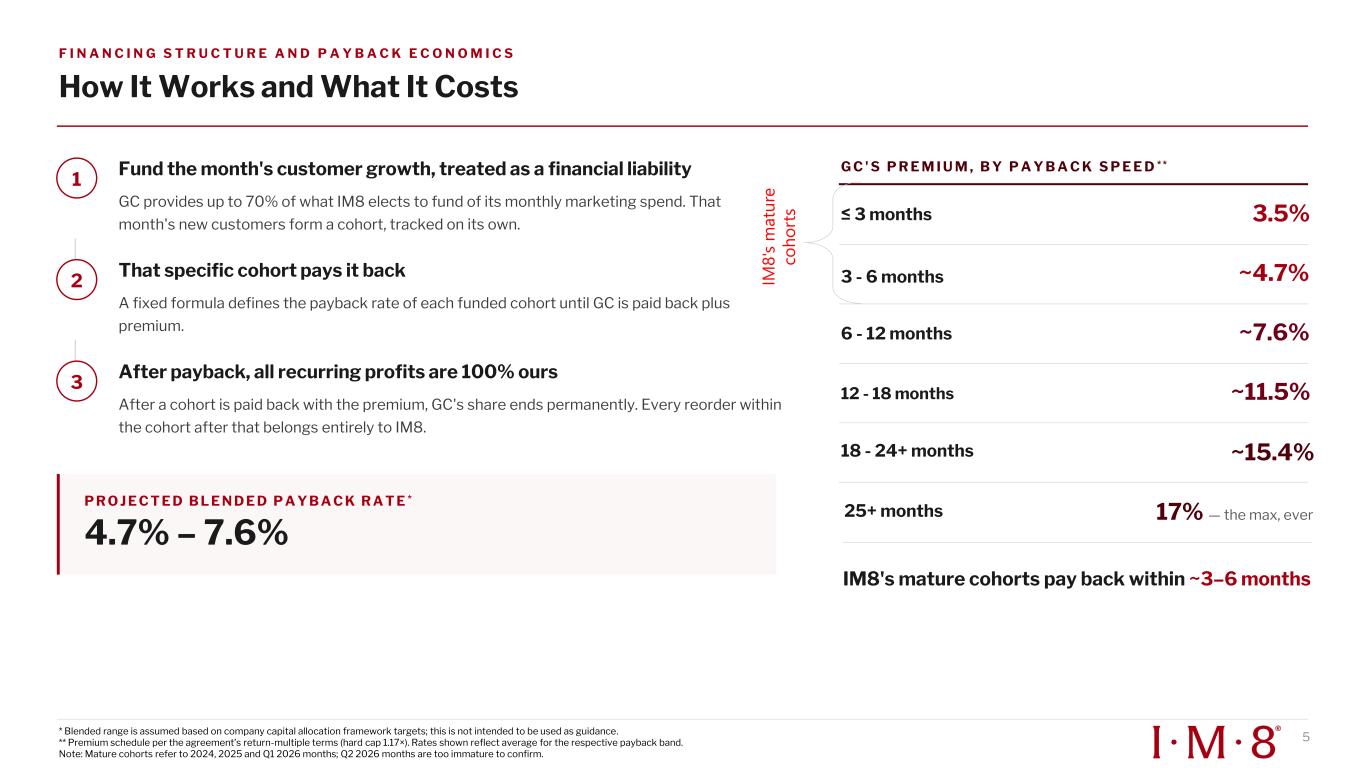
F I N A N C I N G S T R U C T U R E A N D P A Y B A C K E C O N O M I C S How It Works and What It Costs 1 Fund the month's customer growth, treated as a financial liability GC provides up to 70% of what IM8 elects to fund of its monthly marketing spend. That month's new customers form a cohort, tracked on its own. 2 That specific cohort pays it back A fixed formula defines the payback rate of each funded cohort until GC is paid back plus premium. 3 After payback, all recurring profits are 100% ours After a cohort is paid back with the premium, GC's share ends permanently. Every reorder within the cohort after that belongs entirely to IM8. P R O J E C T E D B L E N D E D P A Y B A C K R A T E * 4.7% – 7.6% G C ' S P R E M I U M , B Y P A Y B A C K S P E E D * * ≤ 3 months 3.5% 3 - 6 months ~4.7% 6 - 12 months ~7.6% 12 - 18 months ~11.5% 18 - 24+ months ~15.4% IM8's mature cohorts pay back within ~3–6 months 5 IM 8 's m a tu re co h o rt s * Blended range is assumed based on company capital allocation framework targets; this is not intended to be used as guidance. ** Premium schedule per the agreement’s return-multiple terms (hard cap 1.17×). Rates shown reflect average for the respective payback band. Note: Mature cohorts refer to 2024, 2025 and Q1 2026 months; Q2 2026 months are too immature to confirm. 25+ months 17% — the max, ever
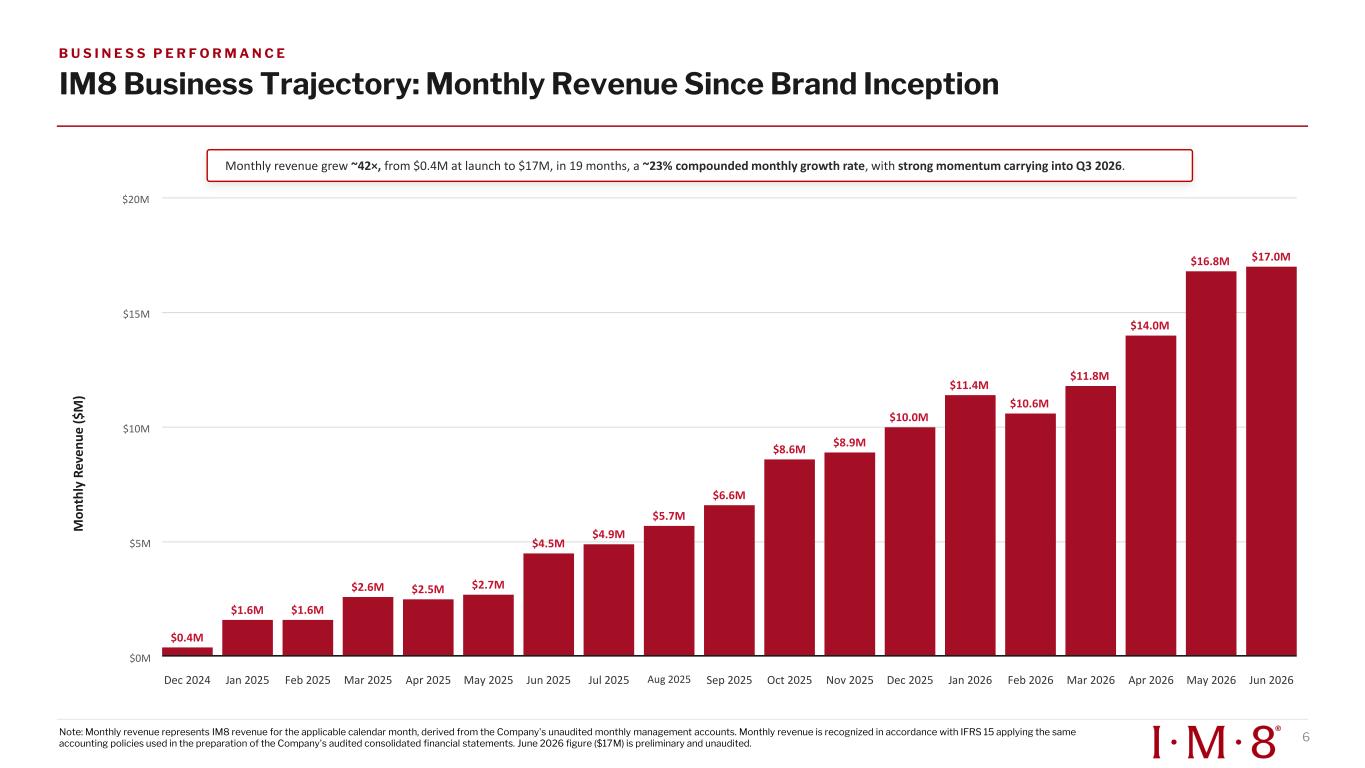
M o n th ly R ev e n u e ( $ M ) $0M $5M $10M $15M $20M $0.4M $1.6M $1.6M $2.6M $2.5M $2.7M $4.5M $4.9M $5.7M $6.6M $8.6M $8.9M $10.0M $11.4M $10.6M $11.8M $14.0M $16.8M $17.0M Monthly revenue grew ~42×, from $0.4M at launch to $17M, in 19 months, a ~23% compounded monthly growth rate, with strong momentum carrying into Q3 2026. Dec 2024 Jan 2025 Feb 2025 Mar 2025 Apr 2025 May 2025 Jun 2025 Jul 2025 Aug 2025 Sep 2025 Oct 2025 Nov 2025 Dec 2025 Jan 2026 Feb 2026 Mar 2026 Apr 2026 May 2026 Jun 2026 IM8 Business Trajectory: Monthly Revenue Since Brand Inception B U S I N E S S P E R F O R M A N C E Note: Monthly revenue represents IM8 revenue for the applicable calendar month, derived from the Company's unaudited monthly management accounts. Monthly revenue is recognized in accordance with IFRS 15 applying the same accounting policies used in the preparation of the Company's audited consolidated financial statements. June 2026 figure ($17M) is preliminary and unaudited. 6
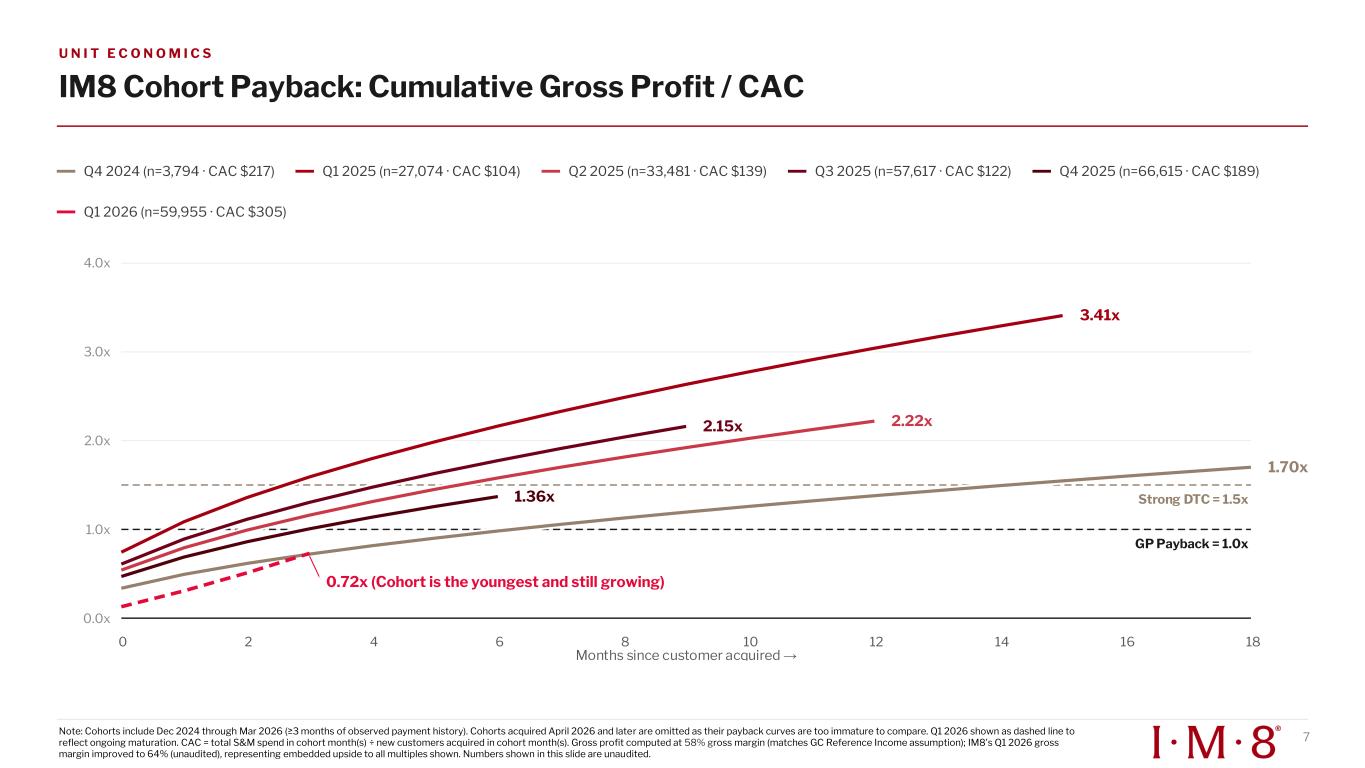
U N I T E C O N O M I C S IM8 Cohort Payback: Cumulative Gross Profit / CAC Q4 2024 (n=3,794 · CAC $217) Q1 2025 (n=27,074 · CAC $104) Q2 2025 (n=33,481 · CAC $139) Q3 2025 (n=57,617 · CAC $122) Q4 2025 (n=66,615 · CAC $189) Q1 2026 (n=59,955 · CAC $305) t on onths since customer ac uired 0.0x 1.0x 2.0x 3.0x 4.0x 1.70x 3.41x 2.22x2.15x 1.36x 0.72x (Cohort is the youngest and still growing) 0 2 4 6 8 10 12 14 16 18 7Note: Cohorts include Dec 2024 through ar 2026 (≥3 months of observed payment history). Cohorts ac uired April 2026 and later are omitted as their payback curves are too immature to compare. Q1 2026 shown as dashed line to reflect ongoing maturation. CAC = total S&M spend in cohort month(s) ÷ new customers acquired in cohort month(s). Gross profit computed at 58% gross margin (matches GC Reference Income assumption); IM8's Q1 2026 gross margin improved to 64% (unaudited), representing embedded upside to all multiples shown. Numbers shown in this slide are unaudited.
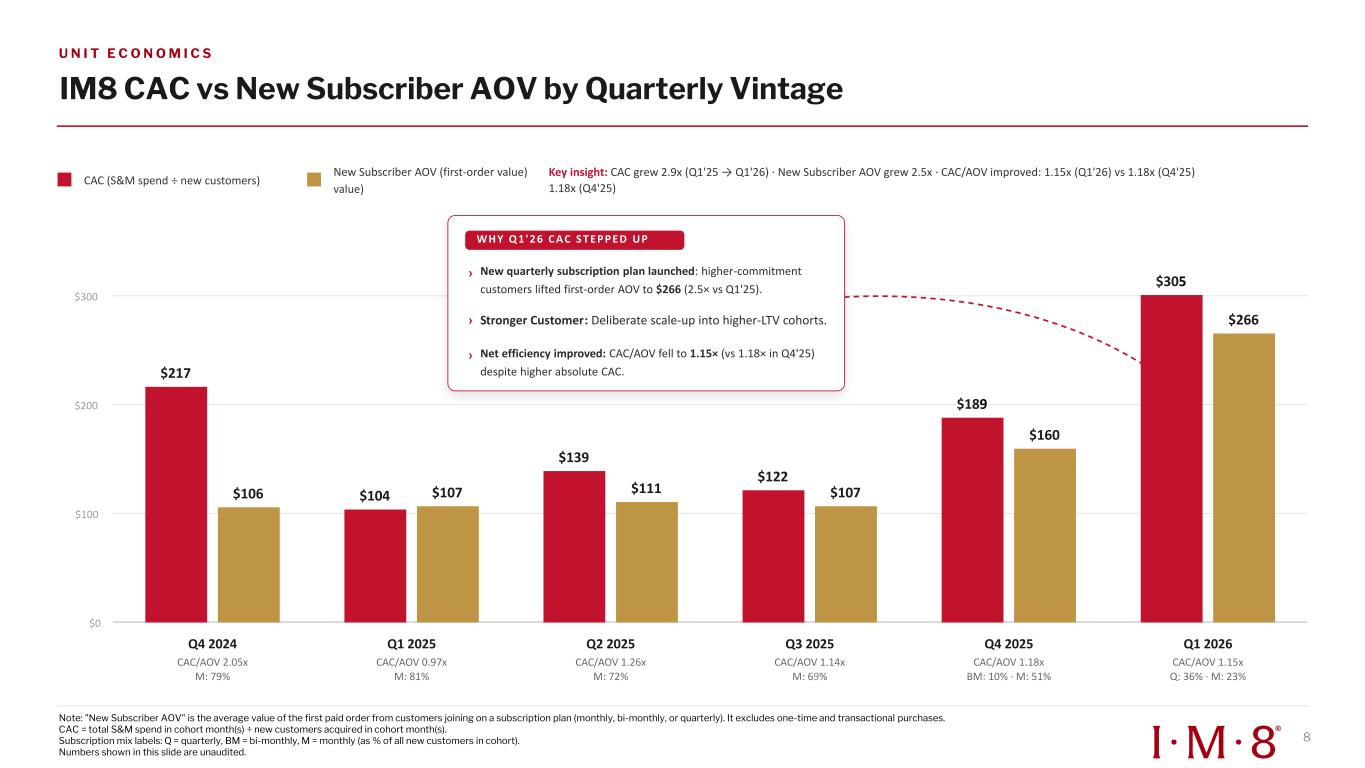
IM8 CAC vs New Subscriber AOV by Quarterly Vintage CAC (S&M spend ÷ new customers) New Subscriber AOV (first-order value) value) Key insight: CAC grew 2.9x (Q1'25 → Q1'26) · New Subscriber AOV grew 2.5x · CAC/AOV improved: 1.15x (Q1'26) vs 1.18x (Q4'25) 1.18x (Q4'25) $0 $100 $200 $300 $217 $106 $104 $107 $139 $111 $122 $107 $189 $160 $305 $266 Q4 2024 CAC/AOV 2.05x M: 79% Q1 2025 CAC/AOV 0.97x M: 81% Q2 2025 CAC/AOV 1.26x M: 72% Q3 2025 CAC/AOV 1.14x M: 69% Q4 2025 CAC/AOV 1.18x BM: 10% · M: 51% Q1 2026 CAC/AOV 1.15x Q: 36% · M: 23% WH Y Q 1' 26 C AC S T EP P ED UP › New quarterly subscription plan launched: higher-commitment customers lifted first-order AOV to $266 (2.5× vs Q1'25). › Stronger Customer: Deliberate scale-up into higher-LTV cohorts. › Net efficiency improved: CAC/AOV fell to 1.15× (vs 1.18× in Q4'25) despite higher absolute CAC. U N I T E C O N O M I C S Note: "New Subscriber AOV" is the average value of the first paid order from customers joining on a subscription plan (monthly, bi-monthly, or quarterly). It excludes one-time and transactional purchases. CAC = total S&M spend in cohort month(s) ÷ new customers acquired in cohort month(s). Subscription mix labels: Q = quarterly, BM = bi-monthly, M = monthly (as % of all new customers in cohort). Numbers shown in this slide are unaudited. 8
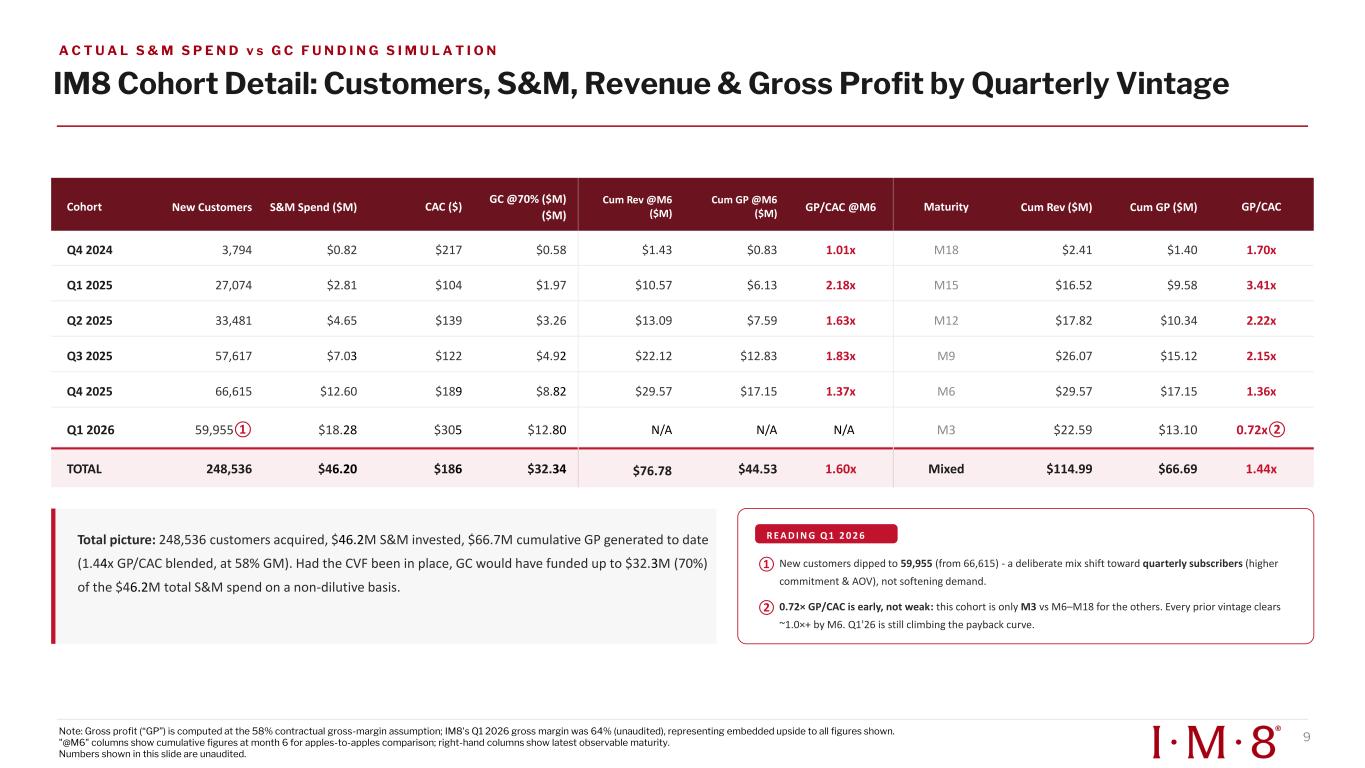
IM8 Cohort Detail: Customers, S&M, Revenue & Gross Profit by Quarterly Vintage Cohort New Customers S&M Spend ($M) CAC ($) GC @70% ($M) ($M) Cum Rev @M6 ($M) Cum GP @M6 ($M) GP/CAC @M6 Maturity Cum Rev ($M) Cum GP ($M) GP/CAC Q4 2024 3,794 $0.82 $217 $0.58 $1.43 $0.83 1.01x M18 $2.41 $1.40 1.70x Q1 2025 27,074 $2.81 $104 $1.97 $10.57 $6.13 2.18x M15 $16.52 $9.58 3.41x Q2 2025 33,481 $4.65 $139 $3.26 $13.09 $7.59 1.63x M12 $17.82 $10.34 2.22x Q3 2025 57,617 $7.03 $122 $4.92 $22.12 $12.83 1.83x M9 $26.07 $15.12 2.15x Q4 2025 66,615 $12.60 $189 $8.82 $29.57 $17.15 1.37x M6 $29.57 $17.15 1.36x Q1 2026 59,955① $18.28 $305 $12.80 N/A N/A M3 $22.59 $13.10 0.72x② TOTAL 248,536 $46.20 $186 $32.34 1.60x Mixed $114.99 $66.69 1.44x Total picture: 248,536 customers acquired, $46.2M S&M invested, $66.7M cumulative GP generated to date (1.44x GP/CAC blended, at 58% GM). Had the CVF been in place, GC would have funded up to $32.3M (70%) of the $46.2M total S&M spend on a non-dilutive basis. R E A D I N G Q 1 2 0 2 6 ① New customers dipped to 59,955 (from 66,615) - a deliberate mix shift toward quarterly subscribers (higher commitment & AOV), not softening demand. ② 0.72× GP/CAC is early, not weak: this cohort is only M3 vs M6–M18 for the others. Every prior vintage clears ~1.0×+ by M6. Q1'26 is still climbing the payback curve. A C T U A L S & M S P E N D v s G C F U N D I N G S I M U L A T I O N N/A $76.78 $44.53 9Note: Gross profit (“GP”) is computed at the 58% contractual gross-margin assumption; IM8's Q1 2026 gross margin was 64% (unaudited), representing embedded upside to all figures shown. "@M6" columns show cumulative figures at month 6 for apples-to-apples comparison; right-hand columns show latest observable maturity. Numbers shown in this slide are unaudited.
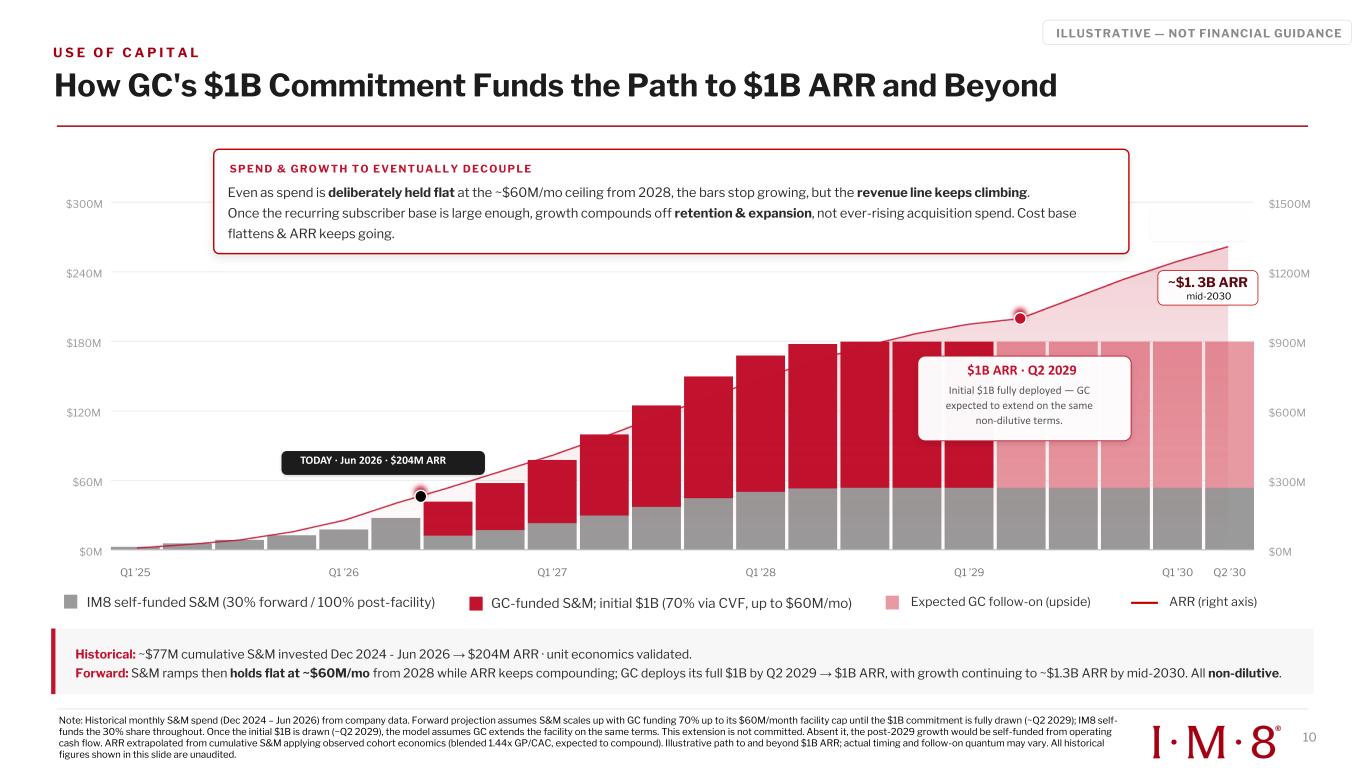
U S E O F C A P I T A L ILLUSTRATIVE — NOT FINANCIAL GUIDANCE How GC's $1B Commitment Funds the Path to $1B ARR and Beyond IM8 self-funded S&M (30% forward / 100% post-facility) GC-funded S&M; initial $1B (70% via CVF, up to $60M/mo) Expected GC follow-on (upside) ARR (right axis) $0M $60M $120M $180M $240M $300M $0M $300M $600M $900M $1200M $1500M S P E N D & G R O W T H T O E V E N T U A L L Y D E C O U P L E Even as spend is deliberately held flat at the ~$60M/mo ceiling from 2028, the bars stop growing, but the revenue line keeps climbing. Once the recurring subscriber base is large enough, growth compounds off retention & expansion, not ever-rising acquisition spend. Cost base flattens & ARR keeps going. Q1 ’25 Q1 ’26 Q1 ’27 Q1 ’28 Q1 ’29 Q1 ’30 Q2 ’30 Historical: ~$77M cumulative S&M invested Dec 2024 - Jun 2026 → $204M ARR · unit economics validated. Forward: S&M ramps then holds flat at ~$60M/mo from 2028 while ARR keeps compounding; GC deploys its full $1B by Q2 2029 → $1B ARR, with growth continuing to ~$1.3B ARR by mid-2030. All non-dilutive. 10 Note: Historical monthly S&M spend (Dec 2024 – Jun 2026) from company data. Forward projection assumes S&M scales up with GC funding 70% up to its $60M/month facility cap until the $1B commitment is fully drawn (~Q2 2029); IM8 self- funds the 30% share throughout. Once the initial $1B is drawn (~Q2 2029), the model assumes GC extends the facility on the same terms. This extension is not committed. Absent it, the post-2029 growth would be self-funded from operating cash flow. ARR extrapolated from cumulative S&M applying observed cohort economics (blended 1.44x GP/CAC, expected to compound). Illustrative path to and beyond $1B ARR; actual timing and follow-on quantum may vary. All historical figures shown in this slide are unaudited. ~$1. 3B ARR mid-2030 $1B ARR · Q2 2029 Initial $1B fully deployed — GC expected to extend on the same non-dilutive terms. TODAY · Jun 2026 · $204M ARR
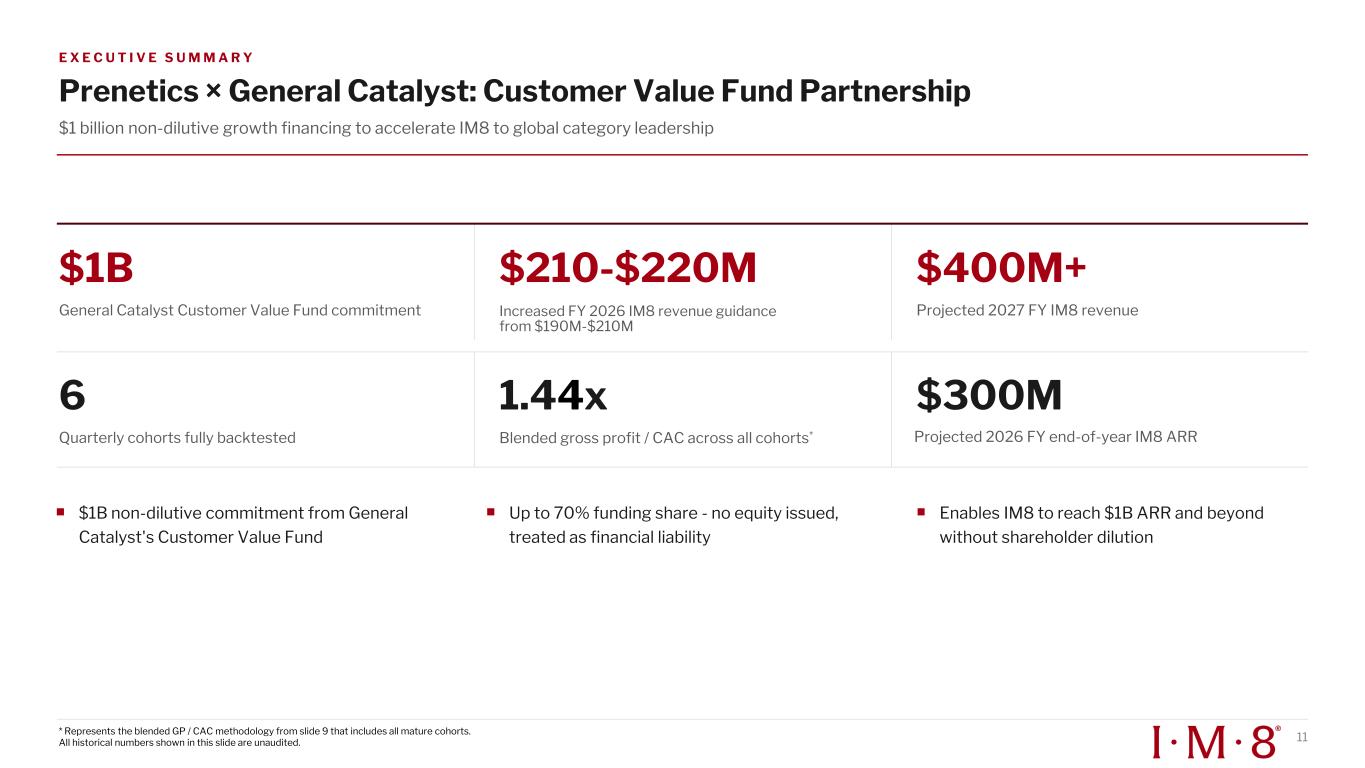
E X E C U T I V E S U M M A R Y Prenetics × General Catalyst: Customer Value Fund Partnership $1 billion non-dilutive growth financing to accelerate IM8 to global category leadership $1B General Catalyst Customer Value Fund commitment $210-$220M Increased FY 2026 IM8 revenue guidance from $190M-$210M $400M+ Projected 2027 FY IM8 revenue 6 Quarterly cohorts fully backtested 1.44x Blended gross profit / CAC across all cohorts* $300M $1B non-dilutive commitment from General Catalyst's Customer Value Fund Up to 70% funding share - no equity issued, treated as financial liability Enables IM8 to reach $1B ARR and beyond without shareholder dilution 11* Represents the blended GP / CAC methodology from slide 9 that includes all mature cohorts. All historical numbers shown in this slide are unaudited. Projected 2026 FY end-of-year IM8 ARR
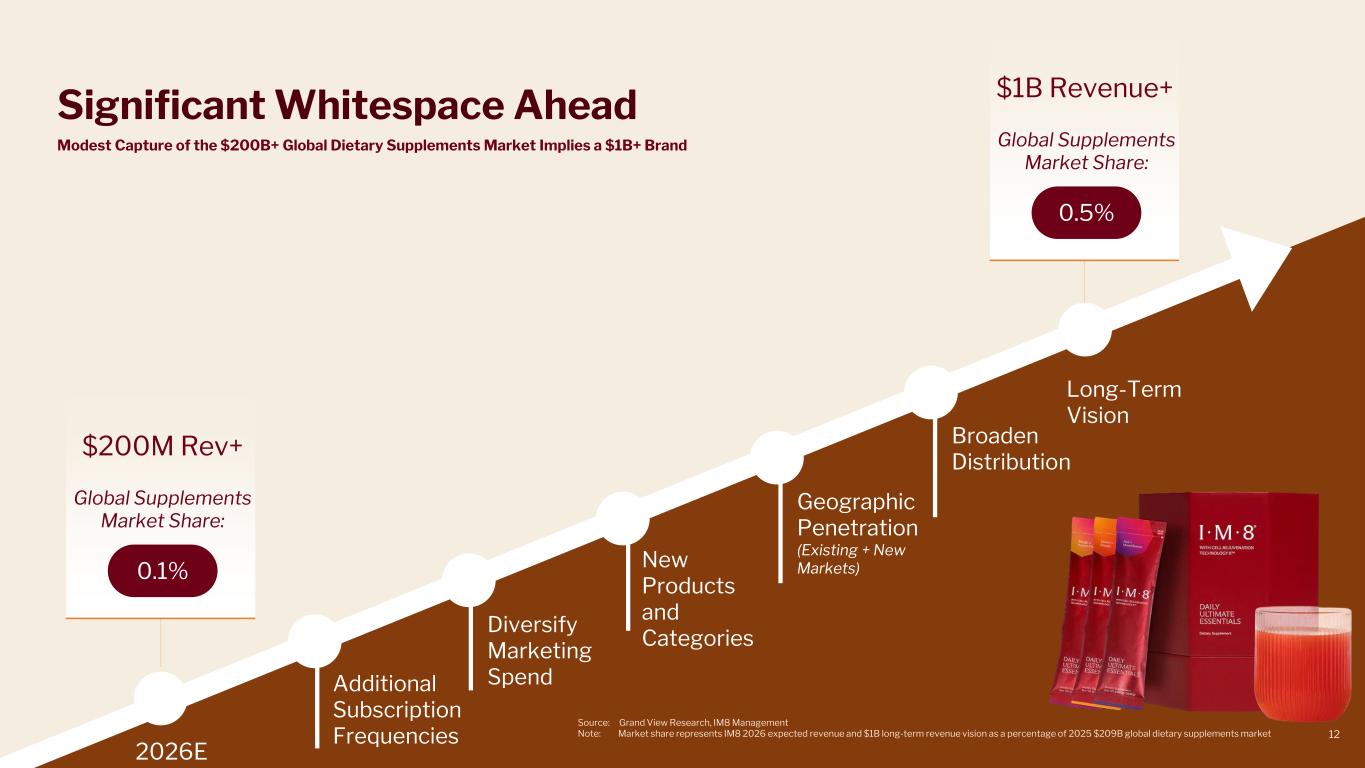
Significant Whitespace Ahead 2026E Long-Term Vision $200M Rev+ Global Supplements Market Share: 0.1% $1B Revenue+ Global Supplements Market Share: 0.5% Modest Capture of the $200B+ Global Dietary Supplements Market Implies a $1B+ Brand Additional Subscription Frequencies Diversify Marketing Spend Geographic Penetration (Existing + New Markets)New Products and Categories Source: Grand View Research, IM8 Management Note: Market share represents IM8 2026 expected revenue and $1B long-term revenue vision as a percentage of 2025 $209B global dietary supplements market 12 Broaden Distribution
D I S C L A I M E R Important information. G E N E R A L This presentation has been prepared by Prenetics Global Limited (“Prenetics” or the “Company”) and is provided for informational purposes only in connection with the Company’s discussion of the financing arrangement with General Catalyst through its Customer Value Fund ("CVF"). It should be considered together with, and not in isolation from, the Company's press release dated July 14, 2026 announcing the CVF financing arrangement, including the definitions, disclaimers and footnotes set forth therein. This presentation does not constitute an offer to sell or a solicitation of an offer to buy any securities of the Company, nor shall any securities be offered or sold in any jurisdiction in which such offer, solicitation, or sale would be unlawful. Certain operational data, customer metrics, market data, and industry information contained in this presentation are derived from the Company's internal data, internal estimates, and management's understanding of the markets in which the Company operates. While the Company believes such information to be reliable, it has not been independently verified by any third party, and no representation or warranty, express or implied, is made as to the accuracy, completeness, fairness, or reasonableness of any such information. Operational data is unaudited and may differ from data presented in the Company's reports filed or furnished with the U.S. Securities and Exchange Commission. Industry, market, and competitive position data presented herein are based on publicly available information, industry publications, and third-party sources that the Company believes to be reliable but has not independently verified. In addition, the foregoing information may involve estimates, assumptions and other risks and uncertainties, and are subject to change based on various factors. Accordingly, you should not place undue reliance on such information. P R E L I M I N A R Y U N A U D I T E D F I N A N C I A L I N F O R M A T I O N F O R W A R D - L O O K I N G S T A T E M E N T S This presentation contains forward-looking statements. These statements are made under the “safe harbor” provisions of the U.S. Private Securities Litigation Reform Act of 1995. Statements that are not historical facts, including statements about the Company’s goals, targets, projections, outlooks, beliefs, expectations, strategy, plans, objectives of management for future operations of the Company, and growth opportunities are forward-looking statements. Our guidance reflects management’s current estimates and assumptions as of the date of this release, is subject to significant risks and uncertainties, and is not a guarantee of future performance. Actual results may differ materially. In some cases, forward-looking statements can be identified by words or phrases such as “may,” “will,” “expect,” “anticipate,” “target,” “aim,” “estimate,” “intend,” “plan,” “believe,” “potential,” “continue,” “is/are likely to,” “guidance,” “outlook,” “forecast,” or other similar expressions. Forward-looking statements are based upon estimates and forecasts and reflect the views, assumptions, expectations, and opinions of the Company, which involve inherent risks and uncertainties, and therefore they should not be relied upon as being necessarily indicative of future results. A number of factors could cause actual results to differ materially from those contained in any forward-looking statement, including but not limited to: the Company may not be able to maintain and enhance its IM8 business and brand if it suffers negative publicity or fails to maintain a strong base of engaged customers and content creators, or otherwise fails to meet customers’ expectations; the Company’s ability to further develop and grow its business, including new products and services; and the Company’s ability to efficiently and effectively deploy financial and management resources towards maintaining and growing the business. In addition to the foregoing factors, you should also carefully consider the other risks and uncertainties described in the “Risk Factors” section of the Company’s most recent registration statement and the prospectus therein, and the other documents filed by the Company from time to time with the U.S. Securities and Exchange Commission. Unless otherwise specified, all information provided in this presentation is as of the date of this presentation, and the Company does not undertake any duty to update such information, except as required under applicable law. Nothing in this presentation constitutes an offer to sell, or the solicitation of an offer to buy, any securities of the Company. 1 3 The financial information disclosed in this presentation is preliminary and unaudited. Unless otherwise indicated, it reflects Prenetics’ current estimate based on information available as of the date of this presentation and is subject to its customary month-end and quarter-end close procedures. Actual reported results may differ from these preliminary estimates. Prenetics undertakes no obligation to update this preliminary information other than through its regular reporting cycle.