Exhibit 99.1
For Immediate Release Citigroup Inc. (NYSE: C) JULY 14, 2026 | |
|
SECOND QUARTER 2026 RESULTS AND KEY METRICS
| | |
Citi Chair and CEO Jane Fraser said, “With net income up 45%, this was Citi’s best quarterly revenue in a decade with double-digit revenue growth for the firm and in four out of our five businesses. Services delivered its highest ever quarterly revenue and a return of over 30%. In Markets, strong results in FX and spread products also show how much clients rely on our global network while Equities showed continued momentum with revenues up 45%. Banking revenues climbed 34% and we played a role in the majority of the top equity and debt issuances. Wealth revenues increased for the 9th straight quarter with almost two-thirds of Net New Investment Assets growth coming from deepening relationships with existing clients. Despite short-term headwinds from investments in our U.S. Consumer Cards portfolio, our resilient customer base kept fueling underlying drivers: loan growth, higher spend and better credit performance than expected. “Our growing earnings generation will allow us to increase our planned dividend by 12% and we have launched our $30 billion buyback plan. The combination of our investments, disciplined execution and focus on clients is improving our returns and creating more durable results for our investors,” Ms. Fraser concluded. | ||
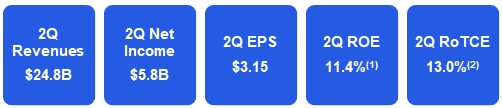
NET INCOME UP 45% RETURNED ~$5.0 BILLION IN THE FORM OF COMMON SHARE REPURCHASES AND COMMON DIVIDENDS PAYOUT RATIO OF 92%(3) COMMON EQUITY TIER 1 CAPITAL RATIO OF 12.8%(4) BOOK VALUE PER SHARE OF $114.74 TANGIBLE BOOK VALUE PER SHARE OF $100.89(5) New York, July 14, 2026 – Citigroup Inc. today reported net income for the second quarter 2026 of $5.8 billion, or $3.15 per diluted share, on revenues of $24.8 billion. This compares to net income of $4.0 billion, or $1.96 per diluted share, on revenues of $21.7 billion for the second quarter 2025. Revenues increased 14% from the prior-year period, driven by growth in each of Citi’s five interconnected businesses and Legacy Franchises in All Other, as well as the impact of foreign exchange translation, partially offset by a decline in Corporate/Other, also in All Other. Net income was $5.8 billion, compared to $4.0 billion in the prior-year period, driven by higher revenues and a lower provision for credit losses, partially offset by higher expenses. Earnings per share of $3.15 increased from $1.96 per diluted share in the prior-year period, reflecting higher net income and a lower share count due to share repurchases. Percentage comparisons throughout this press release are calculated for the second quarter 2026 versus the second quarter 2025, unless otherwise specified. | |

1
Second Quarter Financial Results
Citigroup | | 2Q’26 | | 1Q’26 | | 2Q’25 | | QoQ% | | YoY% | |||
Total revenues, net of interest expense | | 24,766 | | 24,633 | | 21,668 | | 1% | | 14% | |||
| | | | | | | | | | | |||
Total operating expenses | | 14,215 | | 14,311 | | 13,577 | | (1)% | | 5% | |||
| | | | | | | | | | | |||
Net credit losses | | 2,404 | | 2,208 | | 2,234 | | 9% | | 8% | |||
Net ACL build / (release)(a) | | 102 | | 581 | | 224 | | (82)% | | (54)% | |||
Other provisions(b) | | 16 | | 16 | | 414 | | - | | (96)% | |||
Total provision for credit losses | | 2,522 | | 2,805 | | 2,872 | | (10)% | | (12)% | |||
| | | | | | | | | | | |||
Income (loss) from continuing operations before taxes | | 8,029 | | 7,517 | | 5,219 | | 7% | | 54% | |||
Provision for income taxes | | 2,005 | | 1,578 | | 1,186 | | 27% | | 69% | |||
Income (loss) from continuing operations | | 6,024 | | 5,939 | | 4,033 | | 1% | | 49% | |||
Income (loss) from discontinued operations, net of taxes | | - | | (1) | | - | | 100% | | - | |||
Net income attributable to non-controlling interest | | 193 | | 153 | | 14 | | 26% | | NM | |||
Citigroup’s net income (loss) | | $ | 5,831 | | $ | 5,785 | | $ | 4,019 | | 1% | | 45% |
| | | | | | | | | | | |||
| | | | | | | | | |||||
EOP loans ($B) | | 794 | | 762 | | 725 | | 4% | | 9% | |||
Average loans ($B) | | 785 | | 755 | | 712 | | 4% | | 10% | |||
EOP assets ($B) | | 2,895 | | 2,778 | | 2,623 | | 4% | | 10% | |||
EOP deposits ($B) | | 1,493 | | 1,446 | | 1,358 | | 3% | | 10% | |||
Average deposits ($B) | | 1,504 | | 1,446 | | 1,343 | | 4% | | 12% | |||
| | | | | | | | | | | |||
| | | | | | | | | |||||
Book value per share | | $ | 114.74 | | $ | 112.22 | | $ | 106.94 | | 2% | | 7% |
Tangible book value per share(c) | | $ | 100.89 | | $ | 99.01 | | $ | 94.16 | | 2% | | 7% |
Common Equity Tier 1 (CET1) Capital ratio(d) | | 12.8% | | 12.7% | | 13.5% | | | | | |||
Supplementary Leverage ratio (SLR)(d) | | 5.2% | | 5.3% | | 5.5% | | | | | |||
Return on average common equity (ROE)(e) | | 11.4% | | 11.5% | | 7.7% | | (10) bps | | 370 bps | |||
Return on average tangible common equity (RoTCE)(f) | | 13.0% | | 13.1% | | 8.7% | | (10) bps | | 430 bps | |||
Efficiency Ratio (total operating expenses/total revenues, net) | | 57.4% | | 58.1% | | 62.7% | | (70) bps | | (530) bps | |||
(a) Includes credit reserve build / (release) for loans and provision / (release) for credit losses on unfunded lending commitments.
(b) Includes provisions on Other Assets, policyholder benefits and claims and HTM debt securities.
(c) Tangible book value per share is a non-GAAP financial measure. For additional information, refer to footnote 5.
(d) For additional information, please refer to Footnote 4.
(e) For additional information, please refer to Footnote 1.
(f) RoTCE is a non-GAAP financial measure. For additional information, please refer to Footnote 2.
Citigroup
Citigroup revenues of $24.8 billion in the second quarter 2026 increased 14%, driven by growth in each of Citi’s five interconnected businesses and Legacy Franchises, as well as the impact of foreign exchange translation, partially offset by a decline in Corporate/Other. Net interest income increased 13%, driven by growth across each of Citi’s five businesses and Legacy Franchises, partially offset by a decline in Corporate/Other. Non-interest revenue increased 18%, driven by growth in All Other, Banking, Services and Wealth, partially offset by declines in U.S. Consumer Cards (USCC) and Markets.
Citigroup operating expenses of $14.2 billion were up 5%, driven by higher compensation and benefits, transactional and product servicing expenses, deposit insurance costs, as well as the impact of foreign exchange translation, partially offset by lower professional services expenses.
Citigroup provision for credit losses was $2.5 billion, reflecting $2.4 billion of net credit losses and a net allowance for credit losses (ACL) build of $118 million, driven by portfolio growth and changes to certain macroeconomic variables, offset by net improvements in portfolio quality, including seasonal changes in USCC. Net credit losses were up 8% from the prior-year period, driven by increases in Banking and Legacy Franchises. The provision in the prior-year period was $2.9 billion, reflecting $2.2 billion of net credit losses and a net ACL build of $638 million, driven by transfer risk, portfolio growth and changes to certain macroeconomic variables, partially offset by changes in credit quality.
Citigroup net income was $5.8 billion in the second quarter 2026, compared to net income of $4.0 billion in the prior-year period, driven by higher revenues and a lower provision for credit losses, partially offset by higher expenses. Citigroup’s effective tax rate was approximately 25% in the current quarter compared to 23% in the second quarter 2025.
2
Citigroup’s total allowance for credit losses was $22.2 billion at quarter end, compared to $23.7 billion at the end of the prior-year period. Total ACL on loans was $20.0 billion at quarter end, compared to $19.1 billion at the end of the prior-year period, with a reserve-to-funded loans ratio of 2.5%, down from 2.7% in the prior-year period. Total non-accrual loans decreased $0.1 billion, or 4% from the prior-year period to $3.2 billion. Corporate non-accrual loans increased 1% from the prior-year period to $1.7 billion, driven by idiosyncratic downgrades in Services and Banking, offset by upgrades and repayments in Markets. Consumer non-accrual loans decreased $0.2 billion, or 9% from the prior-year period to $1.5 billion, driven by repayments in Wealth.
Citigroup’s end-of-period loans were $794 billion at quarter end, up 9% versus the prior-year period, primarily driven by higher loans in Markets, USCC and Services. Citigroup’s average loans were $785 billion in the second quarter 2026, up 10% versus the prior-year period, driven by Markets, Wealth, USCC and Services.
Citigroup’s end-of-period deposits were approximately $1.5 trillion at quarter end, up 10% versus the prior-year period, driven by an increase in Services. Citigroup’s average deposits were approximately $1.5 trillion in the second quarter 2026, up 12% versus the prior-year period, driven by an increase in Services.
Citigroup’s book value per share of $114.74 at quarter end increased 7% versus the prior-year period, and tangible book value per share of $100.89 at quarter end also increased 7% versus the prior-year period. The increases were driven by net income and beneficial net movements in accumulated other comprehensive income (AOCI), partially offset by the payment of common and preferred dividends and reductions in additional paid-in capital (APIC). In addition, common share repurchases were dilutive to tangible book value per share and book value per share. At quarter end, Citigroup’s preliminary CET1 Capital ratio(4) was 12.8% versus 12.7% at the end of the prior quarter, the increase was driven by net income, the net impact from Citi's sale of a 22.6% equity stake in Banamex and lower deferred tax assets, primarily offset by common share repurchases, the payment of common and preferred dividends and higher risk-weighted assets. Citigroup’s Supplementary Leverage ratio(4) for the second quarter 2026 was 5.2%, versus 5.3% at the end of the prior quarter. During the quarter, Citigroup returned approximately $5.0 billion to common shareholders in the form of share repurchases and dividends.
3
Services | | 2Q’26 | | 1Q’26 | | 2Q’25 | | QoQ% | | YoY% | |||
Net interest income | | 3,541 | | 3,424 | | 2,949 | | 3% | | 20% | |||
Non-interest revenue | | | 1,198 | | | 1,192 | | | 1,063 | | 1% | | 13% |
Treasury and Trade Solutions | | | 4,739 | | | 4,616 | | | 4,012 | | 3% | | 18% |
Net interest income | | | 750 | | | 719 | | | 681 | | 4% | | 10% |
Non-interest revenue | | | 893 | | | 768 | | | 737 | | 16% | | 21% |
Securities Services | | | 1,643 | | | 1,487 | | | 1,418 | | 10% | | 16% |
Total Services revenues | | 6,382 | | 6,103 | | 5,430 | | 5% | | 18% | |||
| | | | | | | | | | | | | |
Total operating expenses | | | 2,803 | | | 2,935 | | | 2,679 | | (4)% | | 5% |
| | | | | | | | | | | | | |
Net credit losses | | | 5 | | | 3 | | | 20 | | 67% | | (75)% |
Net ACL build / (release)(a) | | | 46 | | | 86 | | | 47 | | (47)% | | (2)% |
Other provisions(b) | | | 7 | | | 5 | | | 286 | | 40% | | (98)% |
Total provision for credit losses | | 58 | | 94 | | 353 | | (38)% | | (84)% | |||
| | | | | | | | | | | | | |
Net income | | $ | 2,584 | | $ | 2,228 | | $ | 1,712 | | 16% | | 51% |
| | | | | | | | | | | | | |
| | | | | | | | | | | | | |
Services Key Statistics and Metrics ($B) | | | | | | | | | | | | | |
Allocated Average TCE(c) | | | 34 | | | 34 | | | 33 | | - | | 2% |
RoTCE(c) | | | 30.9% | | | 27.0% | | | 20.8% | | 390 bps | | 1,010 bps |
Average loans | | | 103 | | | 99 | | | 94 | | 4% | | 10% |
Average deposits | | | 1,017 | | | 961 | | | 857 | | 6% | | 19% |
Cross border transaction value(d) | | | 115 | | | 106 | | | 101 | | 8% | | 13% |
US dollar clearing volume (#MM)(e) | | | 46 | | | 44 | | | 44 | | 5% | | 5% |
Commercial card spend volume(f) | | | 20 | | | 19 | | | 18 | | 8% | | 12% |
Assets under custody and/or administration (AUC/AUA) ($T)(g) | | | 35 | | | 32 | | | 28 | | 9% | | 22% |
(a) Includes credit reserve build / (release) for loans and provision / (release) for credit losses on unfunded lending commitments.
(b) Includes provisions on Other Assets and for HTM debt securities.
(c) TCE and RoTCE are non-GAAP financial measures. For additional information, refer to Footnote 2.
(d) Cross border transaction value is defined as the total value of cross-border foreign exchange payments processed through Citi’s proprietary Worldlink and Cross Border Funds Transfer platforms, including payments from consumer, corporate, financial institution and public sector clients.
(e) U.S. dollar clearing volume is defined as the number of USD clearing payment instructions processed by Citi on behalf of U.S. and foreign-domiciled entities (primarily financial institutions). Amounts in the table are stated in millions of payment instructions processed.
(f) Commercial card spend volume is defined as total global spend volumes using Citi issued commercial cards net of refunds and returns.
(g) 2Q'26 is preliminary.
Services
Services revenues of $6.4 billion were up 18%, driven by growth in Treasury and Trade Solutions and Securities Services. Net interest income increased 18%, primarily driven by an increase in average deposit balances. Non-interest revenue increased 16%, primarily driven by continued momentum in fees and underlying drivers across the business, particularly cross-border transaction value and assets under custody and administration.
Treasury and Trade Solutions revenues of $4.7 billion were up 18%, driven by a 20% increase in net interest income and a 13% increase in non-interest revenue. The increase in net interest income was driven by higher average deposit balances and deposit spreads. The increase in non-interest revenue was driven by a smaller impact from currency devaluation in Argentina and growth in underlying drivers, including an increase in cross-border transaction value of 13% and an increase in U.S. dollar clearing volume of 5%.
Securities Services revenues of $1.6 billion were up 16%, driven by a 21% increase in non-interest revenue and a 10% increase in net interest income. The increase in non-interest revenue was primarily driven by higher fees, which benefited from a 22% increase in assets under custody and administration, which includes the impact of market valuations as well as new assets onboarded. The increase in net interest income was driven by higher average deposit balances, partially offset by lower deposit spreads.
Services operating expenses of $2.8 billion increased 5%, driven by higher volume-related expenses, as well as higher performance-related and other compensation expenses.
Services provision for credit losses was $58 million, reflecting a net ACL build of $53 million, primarily driven by exposure growth, and $5 million of net credit losses. The provision in the prior-year period was $353 million, reflecting a net ACL build of $333 million, primarily driven by transfer risk, and $20 million of net credit losses.
Services net income of $2.6 billion increased 51%, driven by higher revenues and a lower provision for credit losses, partially offset by higher expenses.
4
Markets | | 2Q’26 | | 1Q’26 | | 2Q’25 | | QoQ% | | YoY% | |||
Rates and currencies | | | 3,247 | | | 3,311 | | | 3,221 | | (2)% | | 1% |
Spread products / other fixed income | | | 1,459 | | | 1,855 | | | 1,167 | | (21)% | | 25% |
Fixed Income markets | | | 4,706 | | | 5,166 | | | 4,388 | | (9)% | | 7% |
Equity markets | | | 2,301 | | | 2,080 | | | 1,592 | | 11% | | 45% |
Total Markets revenues | | | 7,007 | | | 7,246 | | | 5,980 | | (3)% | | 17% |
| | | | | | | | |
| | | ||
Total operating expenses | | | 3,784 | | | 3,835 | | | 3,508 | | (1)% | | 8% |
| | | | | | | | | | | | | |
Net credit losses (recoveries) | | | (10) | | | (3) | | | 8 | | (233)% | | NM |
Net ACL build / (release)(a) | | | 127 | | | - | | | 45 | | NM | | 182% |
Other provisions(b) | | | (8) | | | (12) | | | 55 | | 33% | | NM |
Total provision for credit losses | | | 109 | | | (15) | | | 108 | | NM | | 1% |
| | | | | | | | |
| | | ||
Net income | | $ | 2,387 | | $ | 2,595 | | $ | 1,803 | | (8)% | | 32% |
| | | | | | | | |
| | | ||
| | | | | | | |
| |
| |||
Markets Key Statistics and Metrics ($B) | | | | | | | | |
| | | ||
Allocated Average TCE(c) | | | 56 | | | 56 | | | 54 | | - | | 5% |
RoTCE(c) | | | 17.0% | | | 18.7% | | | 13.5% | | (170) bps | | 350 bps |
Average trading account assets | | | 603 | | | 573 | | | 547 | | 5% | | 10% |
Average loans | | | 176 | | | 162 | | | 136 | | 9% | | 29% |
Average VaR ($ in MM)(d) | | | 122 | | | 127 | | | 117 | | (4)% | | 4% |
(a) Includes credit reserve build / (release) for loans and provision / (release) for credit losses on unfunded lending commitments.
(b) Includes provisions on Other Assets and HTM debt securities.
(c) TCE and RoTCE are non-GAAP financial measures. For additional information, refer to Footnote 2.
(d) VaR estimates, at a 99% confidence level, the potential decline in the value of a position or a portfolio under normal market conditions assuming a one-day holding period. VaR statistics, which are based on historical data, can be materially different across firms due to differences in portfolio composition, VaR methodologies and model parameters.
Markets
Markets revenues of $7.0 billion increased 17%, driven by growth in Equity markets and Fixed Income markets revenues.
Fixed Income markets revenues of $4.7 billion increased 7%, driven by growth in spread products and other fixed income. Rates and currencies revenues were up 1%, driven by revenue growth in the foreign exchange business on higher volumes, primarily offset by lower revenue in rates. Spread products and other fixed income revenues increased 25%, driven by growth across both financing and credit trading in spread products, as well as growth in commodities.
Equity markets revenues of $2.3 billion increased 45%, driven by growth in derivatives on higher client activity and prime services. Prime balances(6) were up nearly 60%.
Markets operating expenses of $3.8 billion increased 8%, driven by higher performance-related compensation and volume-related expenses.
Markets provision for credit losses was $109 million, reflecting a net ACL build of $119 million, primarily driven by changes in portfolio composition, including exposure growth, and $10 million of net credit recoveries. The provision in the prior-year period was $108 million, reflecting a net ACL build of $100 million, driven by changes in portfolio composition, including exposure growth, and $8 million of net credit losses.
Markets net income of $2.4 billion increased 32%, driven by higher revenues, partially offset by higher expenses.
5
Banking | | 2Q’26 | | 1Q’26 | | 2Q’25 | | QoQ% | | YoY% | |||
Investment Banking | | | 1,548 | | | 1,326 | | | 1,073 | | 17% | | 44% |
Corporate Lending(a) | | | 406 | | | 391 | | | 423 | | 4% | | (4)% |
Total Banking revenues(a) | | | 1,954 | | | 1,717 | | | 1,496 | | 14% | | 31% |
Gain / (loss) on loan hedges(a) | | | (32) | | | 50 | | | (62) | | NM | | 48% |
Total Banking revenues including gain/(loss) on loan hedges(a) | | | 1,922 | | | 1,767 | | | 1,434 | | 9% | | 34% |
| | | | | | | | | | | | | |
Total operating expenses | | | 1,212 | | | 1,240 | | | 1,137 | | (2)% | | 7% |
Net credit losses | | | 138 | | | 6 | | | 16 | | NM | | NM |
Net ACL build / (release)(b) | | | 100 | | | 124 | | | 139 | | (19)% | | (28)% |
Other provisions(c) | | | 4 | | | 2 | | | 18 | | 100% | | (78)% |
Total provision for credit losses | | | 242 | | | 132 | | | 173 | | 83% | | 40% |
| | | | | | | | | | | | | |
Net income | | $ | 350 | | $ | 304 | | $ | 93 | | 15% | | 276% |
| | | | | | | | | | | | | |
| | | | | | | | | | ||||
Banking Key Statistics and Metrics | | | | | | | | | | | | | |
Allocated Average TCE(d) ($B) | | | 8 | | | 8 | | | 9 | | - | | (15)% |
RoTCE(d) | | | 18.0% | | | 15.8% | | | 4.1% | | 220 bps | | 1,390 bps |
Average loans ($B) | | | 88 | | | 83 | | | 84 | | 6% | | 5% |
| | | | | | | | | | | | | |
Advisory | | | 390 | | | 505 | | | 407 | | (23)% | | (4)% |
Equity underwriting | | | 426 | | | 257 | | | 222 | | 66% | | 92% |
Debt underwriting | | | 732 | | | 564 | | | 444 | | 30% | | 65% |
Investment Banking revenues(e) | | | 1,548 | | | 1,326 | | | 1,073 | | 17% | | 44% |
(a) Excludes gain / (loss) on credit derivatives as well as the mark-to-market on loans at fair value. For additional information, see Footnote 8.
(b) Includes credit reserve build / (release) for loans and provision for credit losses on unfunded lending commitments.
(c) Includes provisions on Other Assets and HTM debt securities.
(d) TCE and RoTCE are non-GAAP financial measures. For additional information, refer to Footnote 2.
(e) For additional information, refer to Footnote 7.
Banking
Banking revenues of $1.9 billion increased 34%, driven by growth in Investment Banking, partially offset by a decline in Corporate Lending, excluding mark-to-market on loan hedges (8).
Investment Banking revenues of $1.5 billion increased 44%, driven by growth in Debt Capital Markets (DCM) and Equity Capital Markets (ECM), partially offset by a decline in Advisory. DCM revenues increased 65%, primarily driven by growth across both leveraged finance and investment grade. ECM revenues increased 92% amid very strong market conditions, driven by growth across products, with strength in initial public offerings and follow-ons. Advisory revenues decreased 4%, compared to strong performance in the prior-year period.
Corporate Lending revenues of $406 million, excluding mark-to-market on loan hedges(8), decreased 4%, driven by lower loan spreads and balances. Overall, average loans increased 5%, as growth in loans associated with episodic investment banking activity more than offset the decline in corporate lending balances.
Banking operating expenses of $1.2 billion increased 7%, driven by higher performance-related compensation and investments, as well as increased volume-related expenses.
Banking provision for credit losses was $242 million, reflecting $138 million of net credit losses and a net ACL build of $104 million. Net credit losses were driven by loan sales, which were previously reserved for. The net ACL build was driven by exposure growth, largely offset by reserve releases on the loan sales. The provision in the prior-year period was $173 million, reflecting a net ACL build of $157 million, primarily driven by changes in portfolio composition, and $16 million of net credit losses.
Banking net income of $350 million increased 276%, driven by higher revenues, partially offset by higher expenses and a higher provision for credit losses.
6
Wealth | | 2Q’26 | | 1Q’26 | | 2Q’25 | | QoQ% | | YoY% | |||
Citigold and Retail Banking | | 2,181 | | 2,062 | | 1,862 | | 6% | | 17% | |||
Private Bank | | | 769 | | | 757 | | | 731 | | 2% | | 5% |
Wealth at Work | | | 227 | | | 246 | | | 221 | | (8)% | | 3% |
Total revenues, net of interest expense | | | 3,177 | | | 3,065 | | | 2,814 | | 4% | | 13% |
| | | | | | | | | | | | | |
Total operating expenses | | 2,377 | | 2,415 | | 2,313 | | (2)% | | 3% | |||
| | | | | | | | | | | | | |
Net credit losses | | | 57 | | | 88 | | | 73 | | (35)% | | (22)% |
Net ACL build / (release)(a) | | | 2 | | | 13 | | | (66) | | (85)% | | NM |
Other provisions(b) | | | - | | | - | | | - | | - | | - |
Total provision for credit losses | | 59 | | 101 | | 7 | | (42)% | | NM | |||
| | | | | | | | | | | | | |
Net income | | $ | 583 | | $ | 432 | | $ | 385 | | 35% | | 51% |
| | | | | | | | | | | | | |
| | | | | | | | | | | | ||
Wealth Key Statistics and Metrics ($B) | | | | | | | | | | | | | |
Allocated Average TCE(c) | | | 16 | | | 16 | | | 15 | | - | | 5% |
RoTCE(c) | | | 14.4% | | | 10.8% | | | 10.0% | | 360 bps | | 440 bps |
| | | | | | | | | | | | | |
Loans | | | 208 | | | 205 | | | 200 | | 2% | | 4% |
Deposits | | | 415 | | | 418 | | | 400 | | (1)% | | 4% |
Client investment assets(d) | | | 727 | | | 676 | | | 635 | | 8% | | 14% |
EOP client balances | | | 1,350 | | | 1,299 | | | 1,235 | | 4% | | 9% |
Net New Investment Assets (NNIA)(e) | | | 16 | | | 15 | | | 2 | | 7% | | NM |
(a) Includes credit reserve build / (release) for loans and provision / (release) for credit losses on unfunded lending commitments.
(b) Includes provisions on Other Assets and policyholder benefits and claims.
(c) TCE and RoTCE are non-GAAP financial measures. For additional information, refer to Footnote 2.
(d) 2Q'26 Client investment assets are preliminary. Includes assets under management, trust and custody assets. Starting in 1Q'26, Client investment assets include an additional $10B associated with the value of client insurance policies that were not previously reported.
(e) 2Q'26 Net new investment assets are preliminary. Represents investment asset inflows, including dividends, interest and distributions, less investment asset outflows.
Wealth
Wealth revenues of $3.2 billion increased 13%, driven by growth across all businesses. Net interest income of $2.2 billion increased 18%, driven by higher deposit spreads and average deposit balances, partially offset by lower mortgage spreads. Non-interest revenue of $1.0 billion increased 4%, driven by higher investment fee revenues, with growth in client investment assets of 14%, primarily offset by the absence of an approximate $80 million gain on sale of an alternative investments fund platform, which occurred in the second quarter 2025, as well as the loss of fee revenue from the sale of the trust business in the third quarter 2025.
Citigold and Retail Banking revenues of $2.2 billion increased 17%, driven by higher deposit spreads and higher investment fee revenues.
Private Bank revenues of $769 million increased 5%, driven by higher deposit spreads and investment fee revenues, primarily offset by the absence of an approximate $80 million gain on sale of an alternative investments fund platform, which occurred in the second quarter 2025, as well as the loss of fee revenue from the sale of the trust business in the third quarter 2025 and lower mortgage spreads.
Wealth at Work revenues of $227 million increased 3%, driven by higher deposit spreads and average balances, primarily offset by lower mortgage spreads.
Wealth operating expenses of $2.4 billion increased 3%, driven by higher technology costs and performance-related compensation.
Wealth provision for credit losses was $59 million, reflecting $57 million of net credit losses, driven by Citigold and Retail Banking, and a net ACL build of $2 million. The provision in the prior-year period was $7 million, reflecting $73 million of net credit losses and a net ACL release of $66 million, primarily driven by changes to certain macroeconomic variables and credit quality.
Wealth net income of $583 million increased 51%, driven by higher revenues, partially offset by higher expenses and a higher provision for credit losses.
7
USCC(a) ($ in millions, except as otherwise noted) | | 2Q’26 | | 1Q’26 | | 2Q’25 | | QoQ% | | YoY% | |||
Net interest income | | | 5,180 | | | 5,116 | | | 4,918 | | 1% | | 5% |
Non-interest revenue | | | (659) | | | (359) | | | (447) | | (84)% | | (47)% |
Total revenues, net of interest expense | | | 4,521 | | | 4,757 | | | 4,471 | | (5)% | | 1% |
| | | | | | | | | | | | | |
Total operating expenses | | 1,794 | | 1,711 | | 1,626 | | 5% | | 10% | |||
| | | | | | | | | | | | | |
Net credit losses | | | 1,850 | | | 1,742 | | | 1,856 | | 6% | | - |
Net ACL build / (release)(b) | | | (232) | | | 348 | | | (5) | | NM | | NM |
Other provisions(c) | | | - | | | 2 | | | 1 | | (100)% | | (100)% |
Total provision for credit losses | | 1,618 | | 2,092 | | 1,852 | | (23)% | | (13)% | |||
| | | | | | | | | | | | | |
Net income | | $ | 852 | | $ | 732 | | $ | 758 | | 16% | | 12% |
| | | | | | | | | | | | | |
| | | | | | | | | | | |||
USCC Key Statistics and Metrics ($B) | | | | | | | | | | | | | |
Allocated average TCE(d) | | | 16 | | | 16 | | | 20 | | - | | (24)% |
RoTCE(d) | | | 22.0% | | | 19.2% | | | 15.0% | | 280 bps | | 700 bps |
Average loans | | | 177 | | | 171 | | | 168 | | 4% | | 5% |
U.S. credit card spend volume | | | 176 | | | 152 | | | 159 | | 15% | | 11% |
New credit cards account acquisitions (in thousands)(e) | | | 5,376 | | | 2,942 | | | 3,255 | | 83% | | 65% |
(a) Includes impact from the onboarding of additional American Airlines co-branded card portfolio in the second quarter of 2026.
(b) Includes credit reserve build / (release) for loans and provision / (release) for credit losses on unfunded lending commitments.
(c) Includes provisions on policyholder benefits and claims and Other Assets.
(d) TCE and RoTCE are non-GAAP financial measures. For additional information, refer to Footnote 2.
(e) New credit cards account acquisitions represent the number of new credit card accounts opened.
U.S. Consumer Cards (USCC)
USCC revenues of $4.5 billion increased 1%, driven by growth in net interest income, primarily offset by a decline in non-interest revenue. Net interest income increased 5%, driven by higher interest earning balances. Non-interest revenue decreased 47%, driven by higher partner payment accruals and new account acquisition costs, reflecting increased investments, partially offset by higher annual fees and net interchange.
USCC operating expenses of $1.8 billion increased 10%, driven by higher severance, customer engagement costs, and legal and marketing expenses.
USCC provision for credit losses was $1.6 billion, reflecting $1.9 billion of net credit losses and a net ACL release of $232 million, driven by improvements in portfolio quality, including seasonal changes, largely offset by higher volume and changes to certain macroeconomic variables. The provision in the prior-year period was $1.9 billion, reflecting $1.9 billion of net credit losses and a net ACL release of $4 million.
USCC net income of $852 million increased 12%, driven by a lower provision for credit losses and higher revenue, largely offset by higher expenses.
8
All Other (Managed Basis)(a)(b) | | 2Q’26 | | 1Q’26 | | 2Q’25 | | QoQ% | | YoY% | |||
Legacy Franchises (managed basis) | | 2,053 | | 2,161 | | 1,691 | | (5)% | | 21% | |||
Corporate / Other | | (316) | | (479) | | 25 | | 34% | | NM | |||
Total revenues | | 1,737 | | 1,682 | | 1,716 | | 3% | | 1% | |||
| | | | | | | | | | | |||
Total operating expenses | | 2,220 | | 2,144 | | 2,277 | | 4% | | (3)% | |||
| | | | | | | | | | | |||
Net credit losses | | 366 | | 371 | | 256 | | (1)% | | 43% | |||
Net ACL build / (release)(c) | | 59 | | 10 | | 64 | | 490% | | (8)% | |||
Other provisions(d) | | 13 | | 19 | | 54 | | (32)% | | (76)% | |||
Total provision for credit losses | | 438 | | 400 | | 374 | | 10% | | 17% | |||
| | | | | | | | | | | |||
Income (loss) from continuing operations | | (761) | | (388) | | (573) | | (96)% | | (33)% | |||
Income (loss) from discontinued operations, net of taxes | | - | | (1) | | - | | 100% | | - | |||
Noncontrolling interests | | 162 | | 105 | | (21) | | 54% | | NM | |||
Net (loss) | | (923) | | (494) | | (552) | | (87)% | | (67)% | |||
| | | | | | | | | | | |||
| | | | | | | | | | | |||
All Other Key Statistics and Metrics ($B) | | | | | | | | | | | |||
Allocated Average TCE(e) | | 40 | | 40 | | 41 | | - | | (2)% | |||
(a) Includes Legacy Franchises and certain unallocated costs of global staff functions (including finance, risk, human resources, legal and compliance-related costs), other corporate expenses, and unallocated global operations and technology expenses and income taxes, as well as Corporate Treasury investment activities and discontinued operations.
(b) Reflects results on a managed basis, which excludes divestiture-related impacts related to Citi’s divestitures of its Asia consumer banking businesses and Mexico Consumer/SBMM within Legacy Franchises. For additional information, please refer to Footnote 9.
(c) Includes credit reserve build / (release) for loans and provision / (release) for credit losses on unfunded lending commitments.
(d) Includes provisions on policyholder benefits and claims, Other Assets and HTM debt securities.
(e) TCE is a non-GAAP financial measure. For additional information, refer to Footnote 2.
All Other (Managed Basis)(9)
All Other (managed basis) revenues of $1.7 billion increased 1%, driven by growth in Legacy Franchises, offset by a decline in Corporate/Other.
Legacy Franchises (managed basis)(9) revenues of $2.1 billion increased 21%, driven by growth in Mexico, including momentum in the underlying businesses and the impact of Mexican peso appreciation, partially offset by continued lower revenues from closed exit and wind-down markets.
Corporate/Other revenues of $(316) million decreased from $25 million in the prior-year period, driven by lower net interest income, which included actions taken, such as those to reduce Citi’s asset sensitivity due to a lower interest rate environment, largely offset by higher non-interest revenue, reflecting episodic activity.
All Other (managed basis) expenses of $2.2 billion decreased 3%, driven by a decline in Legacy Franchises, as lower expenses related to exits and wind-downs were primarily offset by the impact of Mexican peso appreciation, as well as a decline in Corporate Other, which included lower transformation expenses and severance charges.
All Other (managed basis) provision for credit losses was $438 million, reflecting $366 million of net credit losses and a net ACL build of $72 million, primarily driven by higher volume. Net credit losses were up 43% from the prior-year period, driven by higher volume and portfolio seasoning in Mexico Consumer. The provision in the prior-year period was $374 million, reflecting $256 million of net credit losses and a net ACL build of $118 million, largely driven by higher volume and transfer risk.
All Other (managed basis) net loss was $(923) million, compared to $(552) million in the prior-year period, driven by lower revenues in Corporate/Other, partially offset by underlying growth in Mexico Consumer/SBMM net of amounts attributed to noncontrolling interests.
9
Citigroup will host a conference call today at 11:00 AM (ET). A live webcast of the presentation, as well as financial results and presentation materials, will be available at https://www.citigroup.com/global/investors. The live webcast of the presentation can also be accessed at https://citi-second-quarter-2026-earnings-results.open-exchange.net/.
Additional financial, statistical and business-related information, as well as business and segment trends, is included in a Quarterly Financial Data Supplement. Both this earnings release and Citigroup’s Second Quarter 2026 Quarterly Financial Data Supplement are available on Citigroup’s website at www.citigroup.com.
Citi is a preeminent banking partner for institutions with cross-border needs, a global leader in wealth management and a valued personal bank in its home market of the United States. Citi does business in more than 180 countries and jurisdictions, providing corporations, governments, investors, institutions and individuals with a broad range of financial products and services.
Additional information may be found at www.citigroup.com | X: @Citi | YouTube: www.youtube.com/citi | Blog: http://blog.citigroup.com | Facebook: www.facebook.com/citi | LinkedIn: www.linkedin.com/company/citi
Certain statements in this release are “forward-looking statements” within the meaning of the Private Securities Litigation Reform Act of 1995. These statements are based on management's current expectations and are subject to uncertainty and changes in circumstances. These statements are not guarantees of future results or occurrences. Actual results and capital and other financial condition may differ materially from those included in these statements due to a variety of factors. These factors include, among others, macroeconomic, geopolitical and other challenges and uncertainties, including elevated inflation and conflicts in the Middle East; and the precautionary statements included in this release. These factors also consist of those contained in Citigroup's filings with the U.S. Securities and Exchange Commission, including without limitation the “Risk Factors” section of Citigroup’s 2025 Form 10-K. Any forward-looking statements made by or on behalf of Citigroup speak only as to the date they are made, and Citi does not undertake to update forward-looking statements to reflect the impact of circumstances or events that arise after the date the forward-looking statements were made.
Contacts:
Investors: Jennifer Landis (investorrelations@citi.com)
Press: Danielle Romero-Apsilos (danielle.romeroapsilos@citi.com)
10
(1) Ratios as of June 30, 2026 are preliminary. Citigroup’s return on average common stockholders’ equity (ROE) is calculated using net income less preferred stock dividends divided by average common stockholders’ equity.
(2) Ratios as of June 30, 2026 are preliminary. Citigroup’s allocated average tangible common equity (TCE) and return on average tangible common equity (RoTCE) are non-GAAP financial measures. RoTCE represents annualized net income available to common shareholders as a percentage of average TCE. For the components of these calculations and for a reconciliation of common equity to TCE, refer to the Citigroup Inc. Quarterly Financial Data Supplement for the quarter ended June 30, 2026 (the 2Q26 Financial Supplement), which is Exhibit 99.2 to Citigroup's Current Report on Form 8-K furnished with the U.S. Securities and Exchange Commission on July 14, 2026.
(3) Citigroup’s payout ratio is the sum of common dividends and common share repurchases divided by net income available to common shareholders.
(4) Ratios as of June 30, 2026 are preliminary. For the composition of Citigroup’s CET1 Capital and ratio and Citigroup’s Supplementary Leverage ratio, refer to the 2Q26 Financial Supplement.
(5) Citigroup’s tangible book value per share is a non-GAAP financial measure. For a reconciliation of common equity to tangible common equity and resulting calculation of tangible book value per share, refer to the 2Q26 Financial Supplement.
(6) Prime balances are defined as clients’ billable balances where Citigroup provides cash or synthetic prime brokerage services.
(7) Beginning in the second quarter of 2026, the investment banking fees metric for Banking was replaced with investment banking revenues. This metric includes investment banking fees, other fee revenue, principal transactions, and net interest income from loans generated from investment banking business activities. Prior-period amounts have been conformed to reflect this change in presentation. Citi believes investment banking revenues provides investors with a more comprehensive measure of investment banking performance.
(8) Credit derivatives are used to economically hedge a portion of the Corporate Lending portfolio that includes both accrual loans and loans at fair value. Gain/(loss) on loan hedges includes the mark-to-market on the credit derivatives and the mark-to-market on the loans in the portfolio that are at fair value. The fixed premium costs of these hedges are netted against the Corporate Lending revenues to reflect the cost of credit protection. Citigroup’s results of operations excluding the impact of gain/(loss) on loan hedges are non-GAAP financial measures. For a reconciliation to reported results, refer to the 2Q26 Financial Supplement.
(9) All Other (managed basis) reflects results on a managed basis, which excludes divestiture-related impacts, for all periods, related to Citigroup’s divestitures of its Asia consumer banking businesses and Mexico Consumer/SBMM businesses within Legacy Franchises. Certain of the results of operations of All Other (managed basis) and Legacy Franchises (managed basis) that exclude divestiture-related impacts are non-GAAP financial measures. For additional information and a reconciliation of these results, refer to the 2Q26 Financial Supplement.
11