Exhibit 99.2
Company Confidential 1 2026 Investor Day July 14, 2026
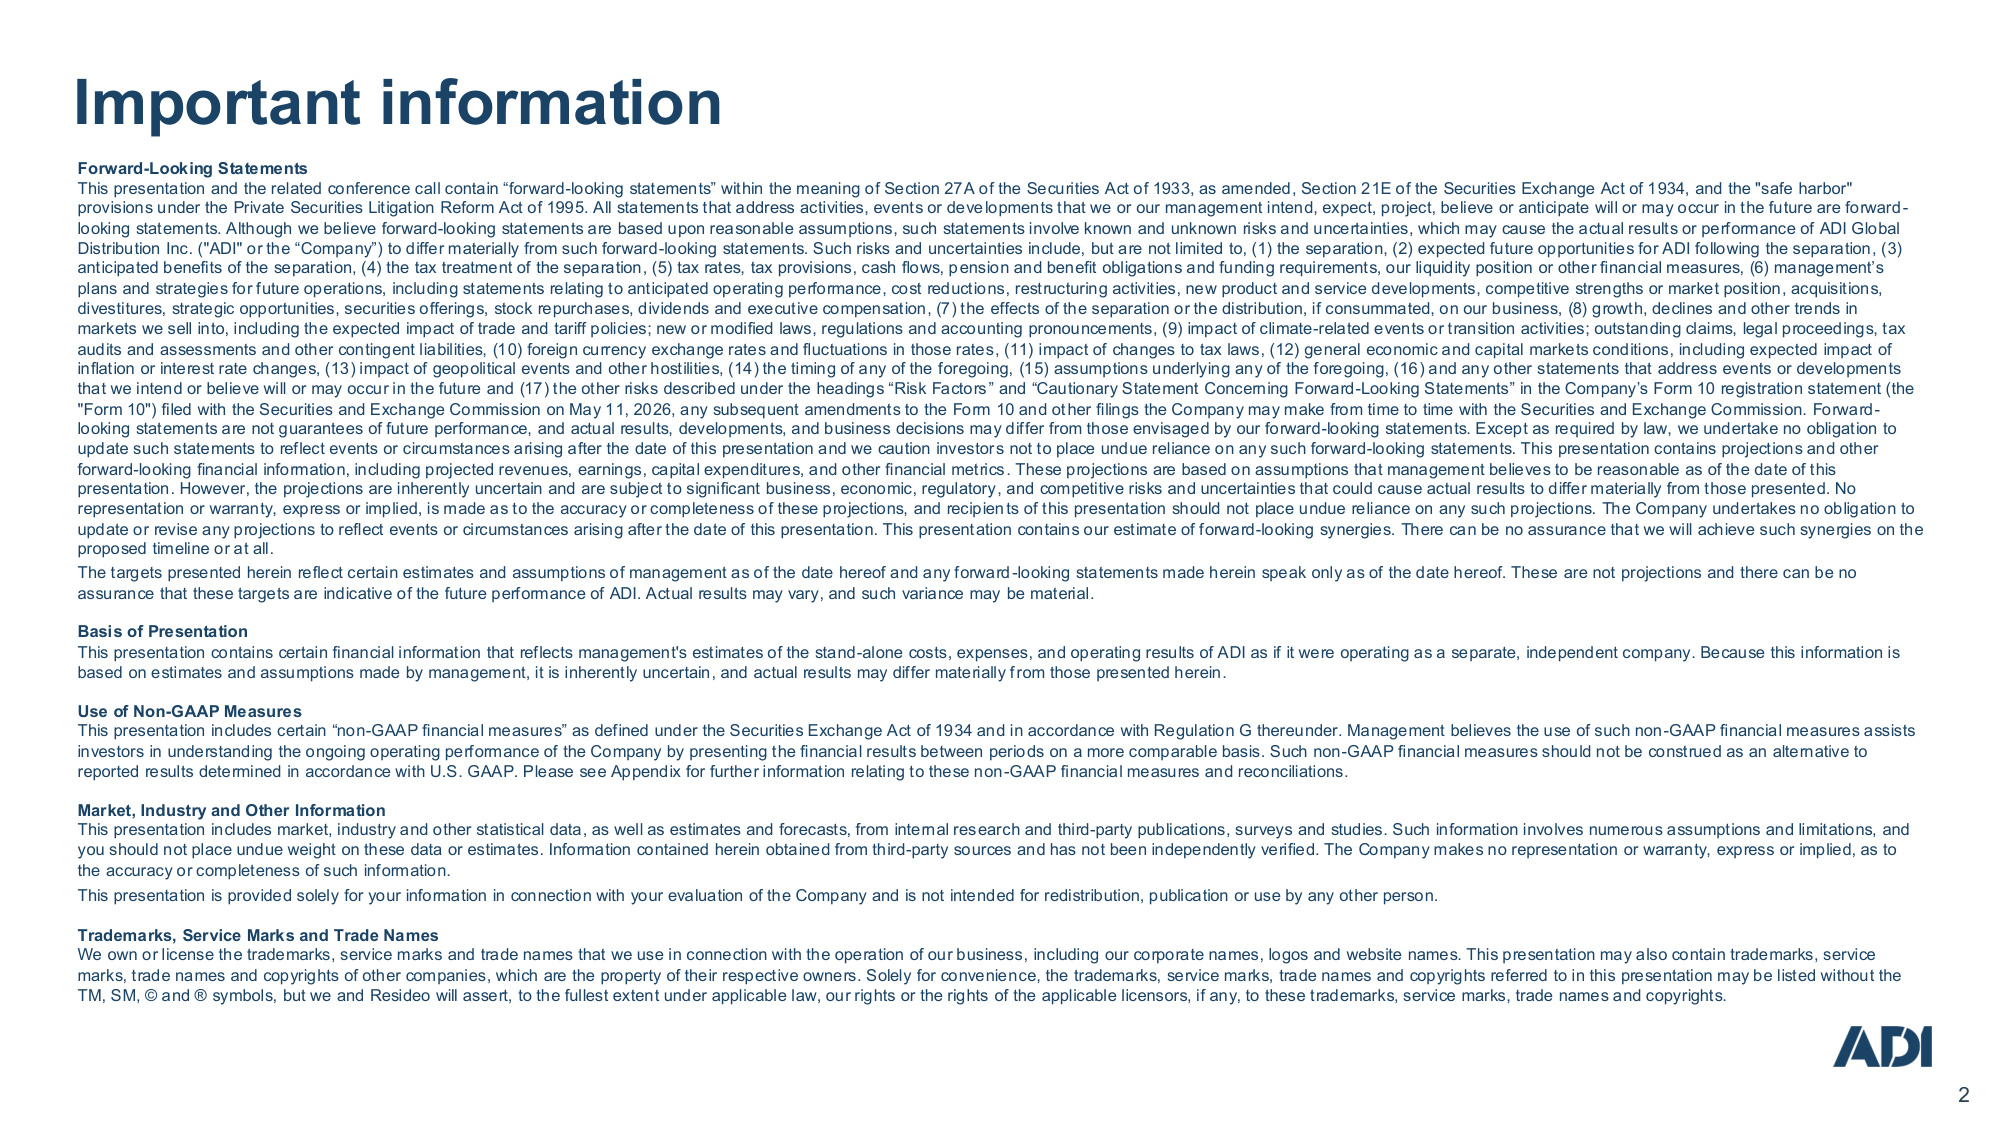
Company Confidential 2 Forward-Looking Statements This presentation and the related conference call contain "forward-looking statements" within the meaning of Section 27A of the Securities Act of 1933, as amended, Section 21E of the Securities Exchange Act of 1934, and the "safe harbor" provisions under the Private Securities Litigation Reform Act of 1995. All statements that address activities, events or developments that we or our management intend, expect, project, believe or anticipate will or may occur in the future are forward- looking statements. Although we believe forward-looking statements are based upon reasonable assumptions, such statements involve known and unknown risks and uncertainties, which may cause the actual results or performance of ADI Global Distribution Inc. ("ADI" or the "Company") to differ materially from such forward-looking statements. Such risks and uncertainties include, but are not limited to, (1) the separation, (2) expected future opportunities for ADI following the separation, (3) anticipated benefits of the separation, (4) the tax treatment of the separation, (5) tax rates, tax provisions, cash flows, pension and benefit obligations and funding requirements, our liquidity position or other financial measures, (6) management's plans and strategies for future operations, including statements relating to anticipated operating performance, cost reductions, restructuring activities, new product and service developments, competitive strengths or market position, acquisitions, divestitures, strategic opportunities, securities offerings, stock repurchases, dividends and executive compensation, (7) the effects of the separation or the distribution, if consummated, on our business, (8) growth, declines and other trends in markets we sell into, including the expected impact of trade and tariff policies; new or modified laws, regulations and accounting pronouncements, (9) impact of climate-related events or transition activities; outstanding claims, legal proceedings, tax audits and assessments and other contingent liabilities, (10) foreign currency exchange rates and fluctuations in those rates, (11) impact of changes to tax laws, (12) general economic and capital markets conditions, including expected impact of inflation or interest rate changes, (13) impact of geopolitical events and other hostilities, (14) the timing of any of the foregoing, (15) assumptions underlying any of the foregoing, (16) and any other statements that address events or developments that we intend or believe will or may occur in the future and (17) the other risks described under the headings "Risk Factors" and "Cautionary Statement Concerning Forward-Looking Statements" in the Company's Form 10 registration statement (the "Form 10") filed with the Securities and Exchange Commission on May 11, 2026, any subsequent amendments to the Form 10 and other filings the Company may make from time to time with the Securities and Exchange Commission. Forward- looking statements are not guarantees of future performance, and actual results, developments, and business decisions may differ from those envisaged by our forward-looking statements. Except as required by law, we undertake no obligation to update such statements to reflect events or circumstances arising after the date of this presentation and we caution investors not to place undue reliance on any such forward-looking statements. This presentation contains projections and other forward-looking financial information, including projected revenues, earnings, capital expenditures, and other financial metrics. These projections are based on assumptions that management believes to be reasonable as of the date of this presentation. However, the projections are inherently uncertain and are subject to significant business, economic, regulatory, and competitive risks and uncertainties that could cause actual results to differ materially from those presented. No representation or warranty, express or implied, is made as to the accuracy or completeness of these projections, and recipients of this presentation should not place undue reliance on any such projections. The Company undertakes no obligation to update or revise any projections to reflect events or circumstances arising after the date of this presentation. This presentation contains our estimate of forward-looking synergies. There can be no assurance that we will achieve such synergies on the proposed timeline or at all. The targets presented herein reflect certain estimates and assumptions of management as of the date hereof and any forward-looking statements made herein speak only as of the date hereof. These are not projections and there can be no assurance that these targets are indicative of the future performance of ADI. Actual results may vary, and such variance may be material. Basis of Presentation This presentation contains certain financial information that reflects management's estimates of the stand-alone costs, expenses, and operating results of ADI as if it were operating as a separate, independent company. Because this information is based on estimates and assumptions made by management, it is inherently uncertain, and actual results may differ materially from those presented herein. Use of Non-GAAP Measures This presentation includes certain "non-GAAP financial measures" as defined under the Securities Exchange Act of 1934 and in accordance with Regulation G thereunder. Management believes the use of such non-GAAP financial measures assists investors in understanding the ongoing operating performance of the Company by presenting the financial results between periods on a more comparable basis. Such non-GAAP financial measures should not be construed as an alternative to reported results determined in accordance with U.S. GAAP. Please see Appendix for further information relating to these non-GAAP financial measures and reconciliations. Market, Industry and Other Information This presentation includes market, industry and other statistical data, as well as estimates and forecasts, from internal research and third-party publications, surveys and studies. Such information involves numerous assumptions and limitations, and you should not place undue weight on these data or estimates. Information contained herein obtained from third-party sources and has not been independently verified. The Company makes no representation or warranty, express or implied, as to the accuracy or completeness of such information. This presentation is provided solely for your information in connection with your evaluation of the Company and is not intended for redistribution, publication or use by any other person. Trademarks, Service Marks and Trade Names We own or license the trademarks, service marks and trade names that we use in connection with the operation of our business, including our corporate names, logos and website names. This presentation may also contain trademarks, service marks, trade names and copyrights of other companies, which are the property of their respective owners. Solely for convenience, the trademarks, service marks, trade names and copyrights referred to in this presentation may be listed without the TM, SM, © and ® symbols, but we and Resideo will assert, to the fullest extent under applicable law, our rights or the rights of the applicable licensors, if any, to these trademarks, service marks, trade names and copyrights. Important information
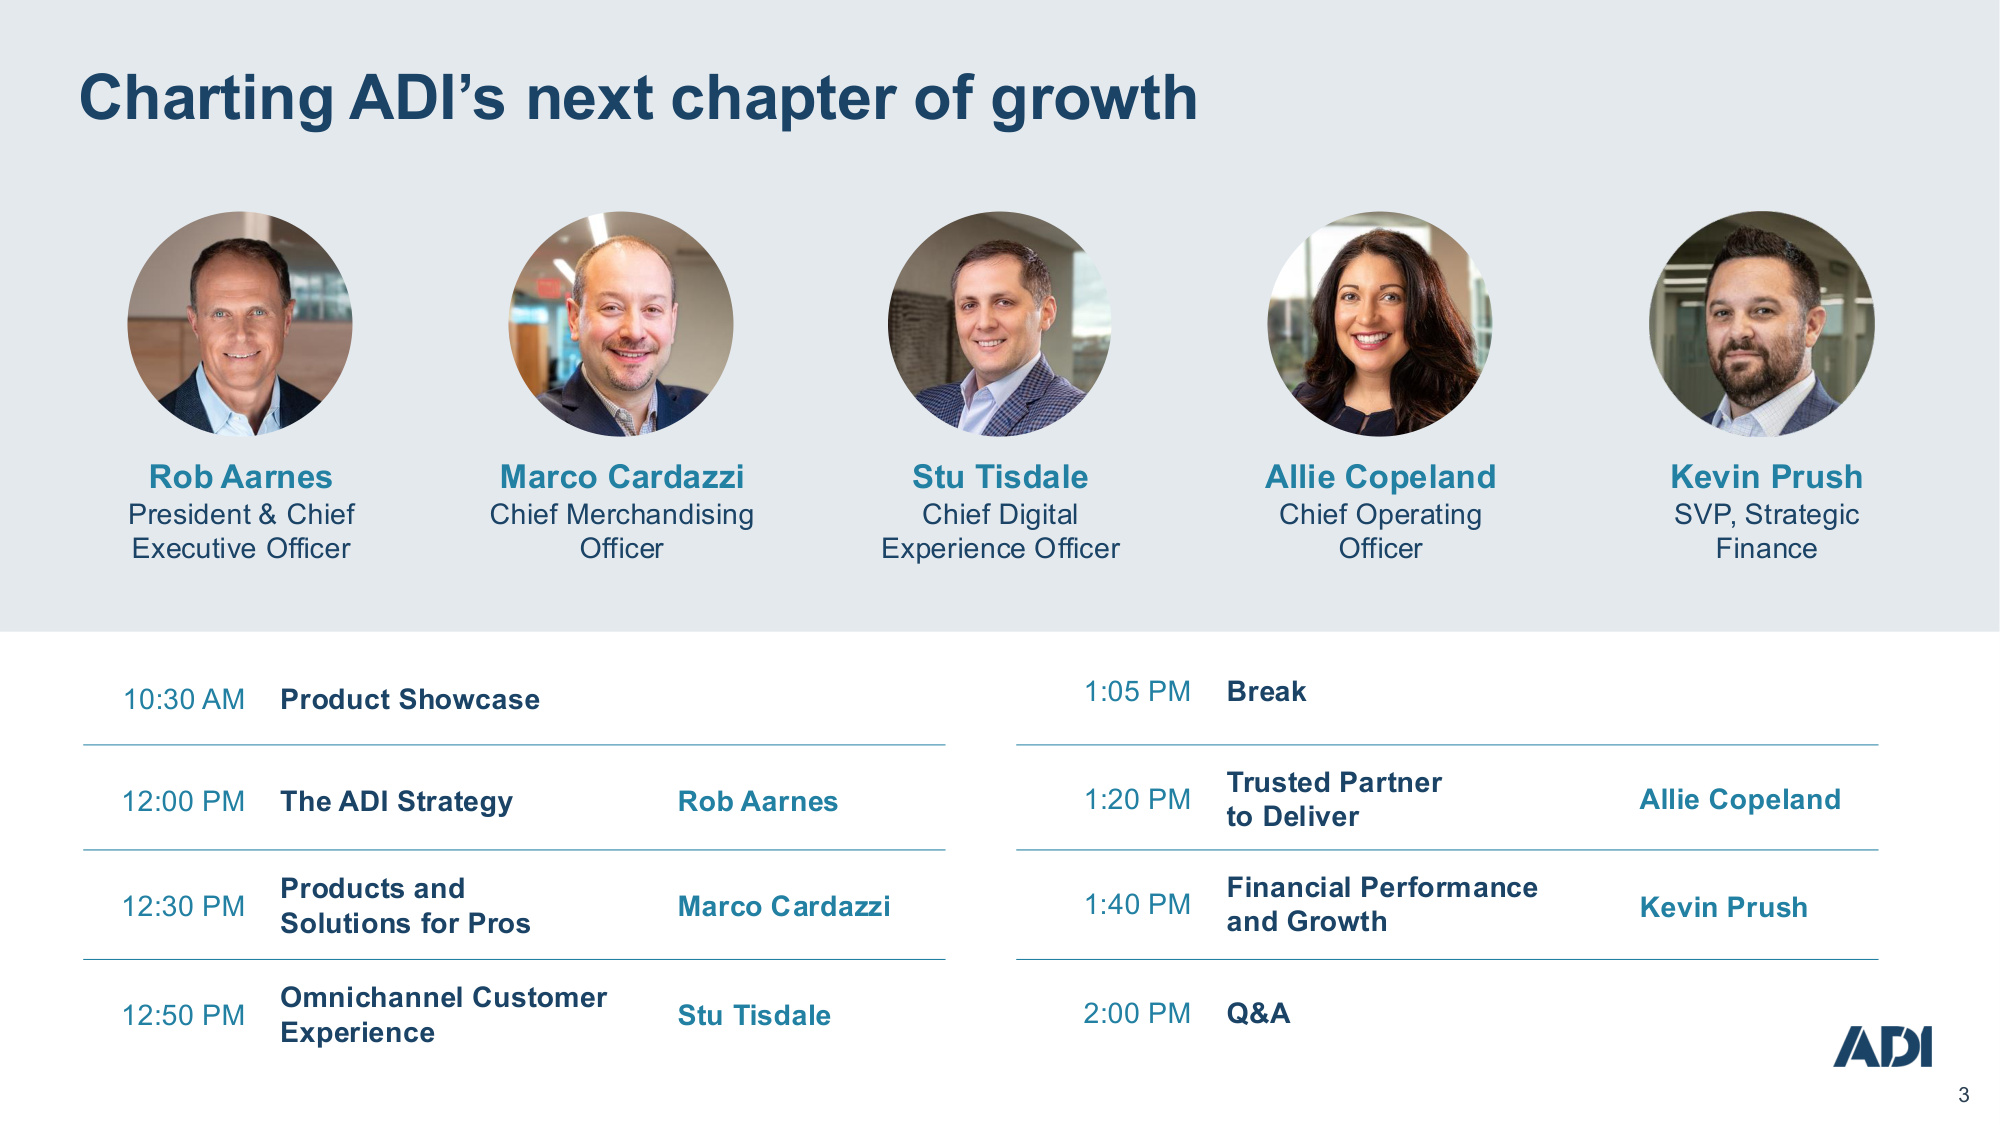
Company Confidential 3 Rob Aarnes President & Chief Executive Officer Marco Cardazzi Chief Merchandising Officer Stu Tisdale Chief Digital Experience Officer Allie Copeland Chief Operating Officer Kevin Prush SVP, Strategic Finance 12:00 PM 12:30 PM The ADI Strategy Products and Solutions for Pros 12:50 PM Omnichannel Customer Experience 1:05 PM Break 1:20 PM Trusted Partner to Deliver 1:40 PM Financial Performance and Growth 2:00 PM Q&A Rob Aarnes Marco Cardazzi Stu Tisdale Allie Copeland Kevin Prush 10:30 AM Product Showcase Charting ADI's next chapter of growth
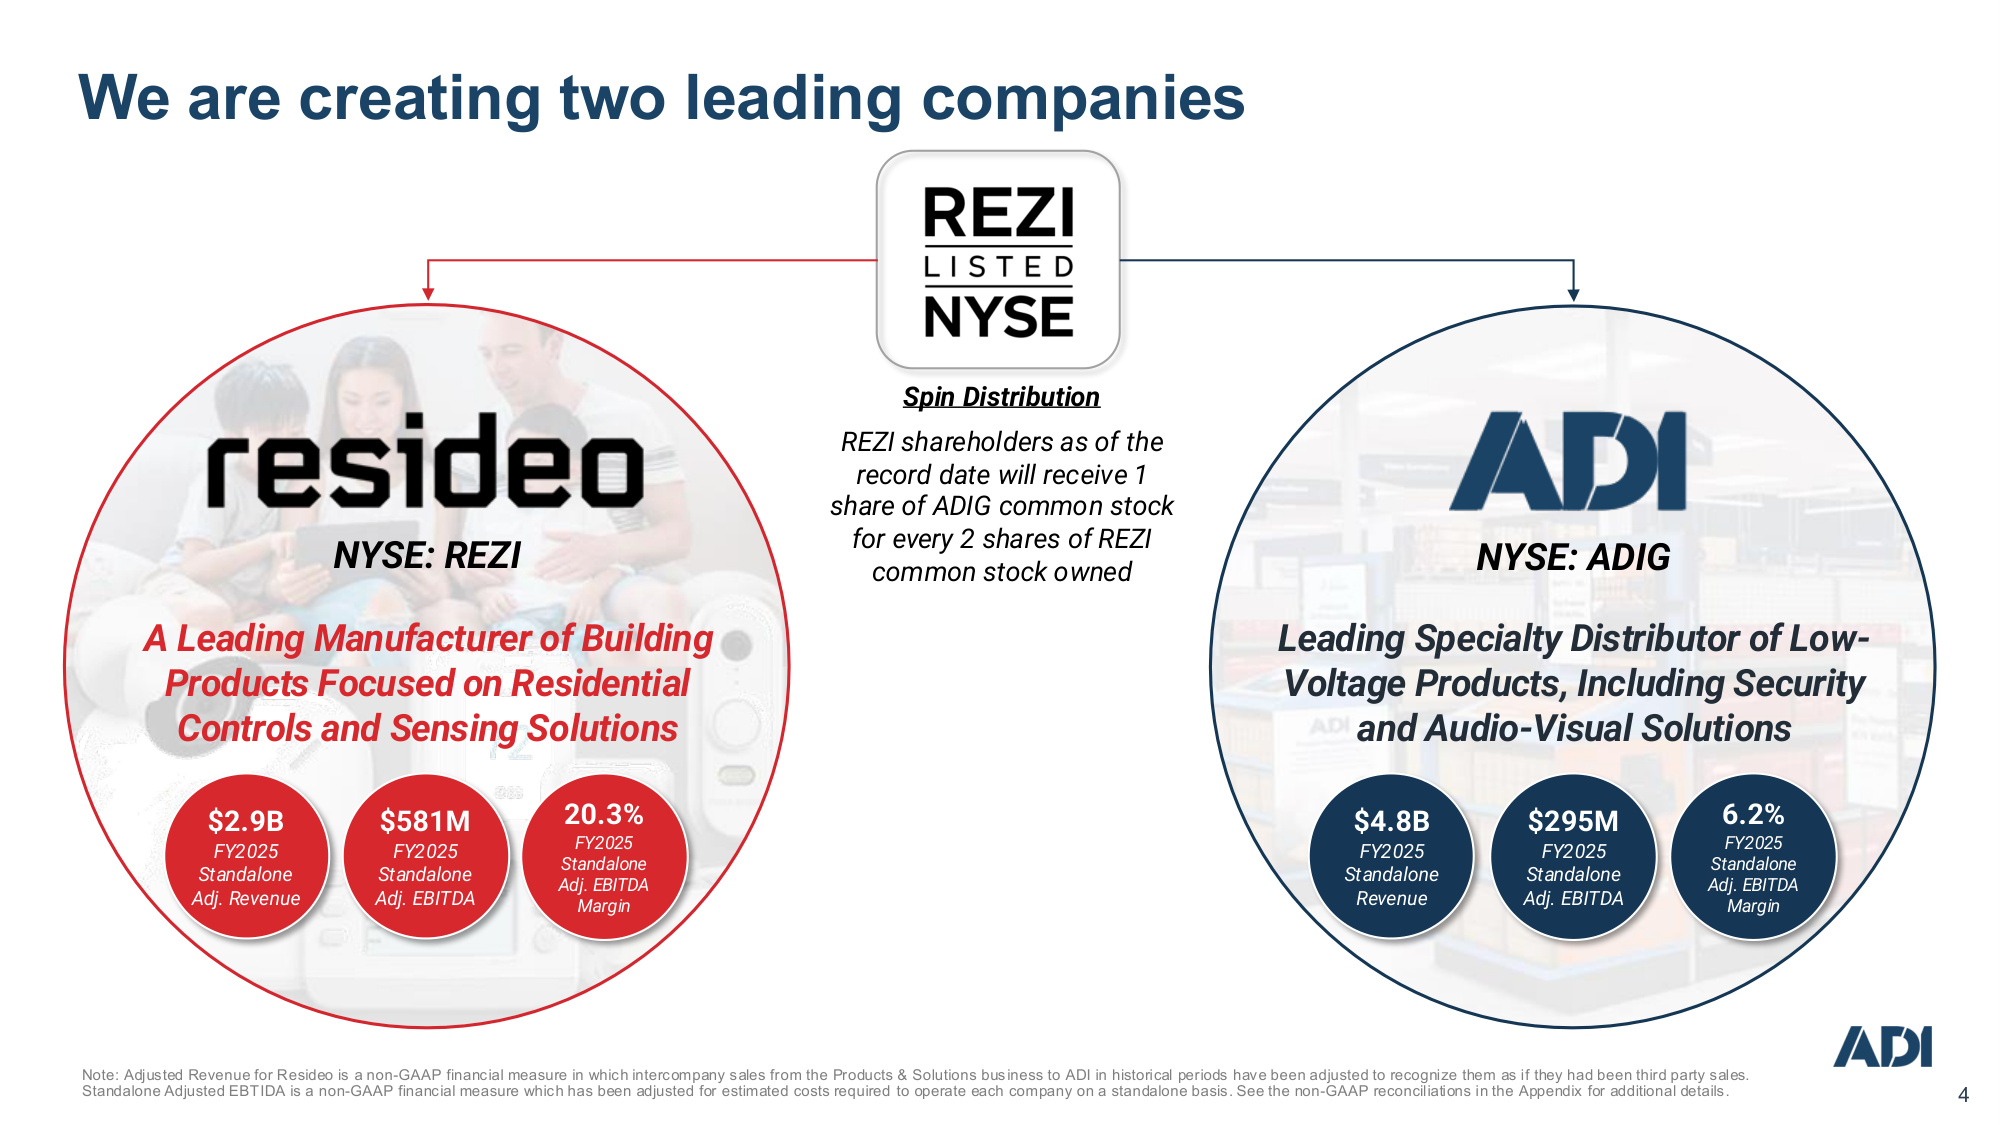
Company Confidential 4 We are creating two leading companies Note: Adjusted Revenue for Resideo is a non-GAAP financial measure in which intercompany sales from the Products & Solutions business to ADI in historical periods have been adjusted to recognize them as if they had been third party sales. Standalone Adjusted EBTIDA is a non-GAAP financial measure which has been adjusted for estimated costs required to operate each company on a standalone basis. See the non-GAAP reconciliations in the Appendix for additional details. A Leading Manufacturer of Building Products Focused on Residential Controls and Sensing Solutions $2.9B FY2025 Standalone Adj. Revenue Leading Specialty Distributor of Low- Voltage Products, Including Security and Audio-Visual Solutions $4.8B FY2025 Standalone Revenue $581M FY2025 Standalone Adj. EBITDA $295M FY2025 Standalone Adj. EBITDA Spin Distribution REZI shareholders as of the record date will receive 1 share of ADIG common stock for every 2 shares of REZI common stock owned NYSE: REZI NYSE: ADIG 20.3% FY2025 Standalone Adj. EBITDA Margin 6.2% FY2025 Standalone Adj. EBITDA Margin
Company Confidential 5 Rob Aarnes President & Chief Executive Officer Be the indispensable Partner of choice The ADI Strategy 5
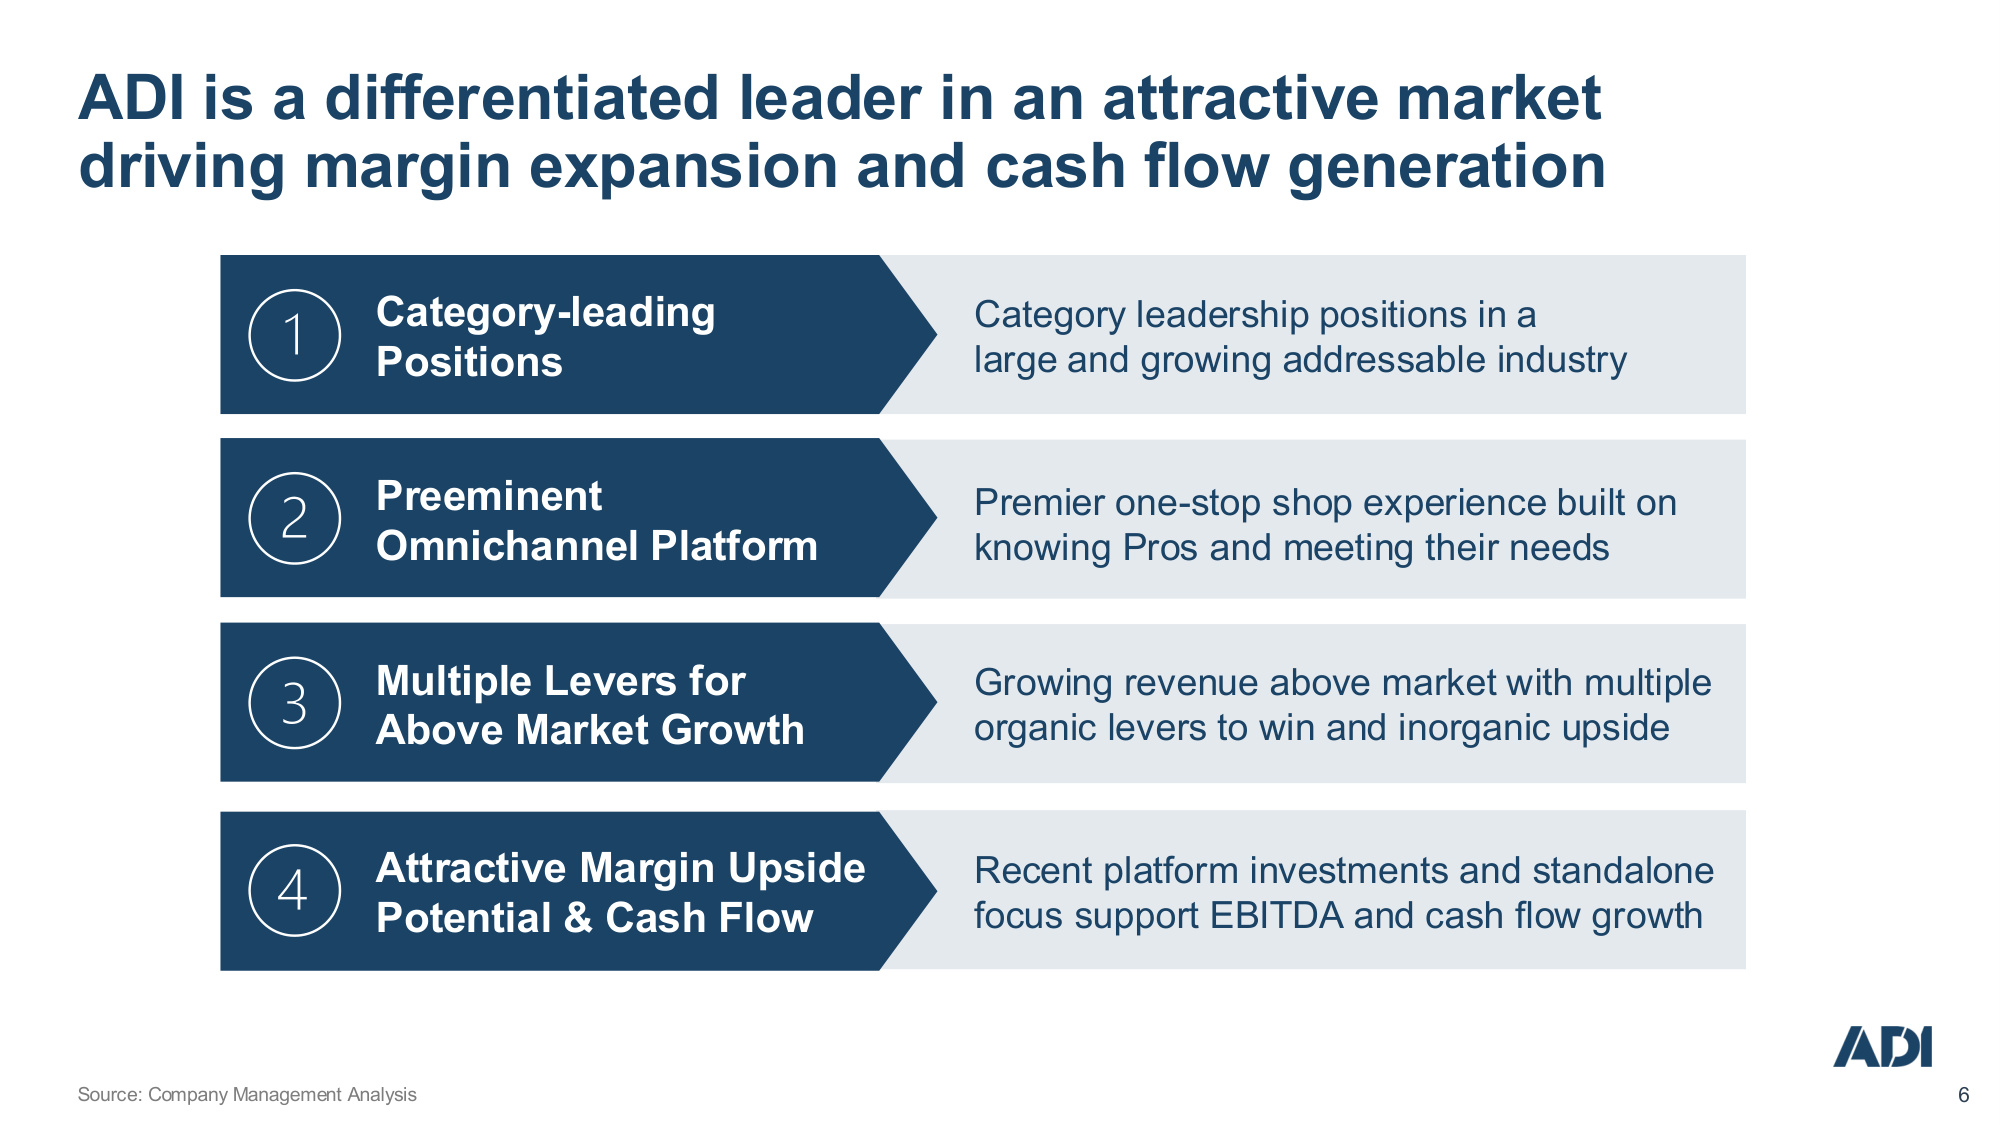
Company Confidential 6 Category-leading Positions Preeminent Omnichannel Platform Multiple Levers for Above Market Growth Attractive Margin Upside Potential & Cash Flow Category leadership positions in a large and growing addressable industry Premier one-stop shop experience built on knowing Pros and meeting their needs Growing revenue above market with multiple organic levers to win and inorganic upside Recent platform investments and standalone focus support EBITDA and cash flow growth Source: Company Management Analysis ADI is a differentiated leader in an attractive market driving margin expansion and cash flow generation
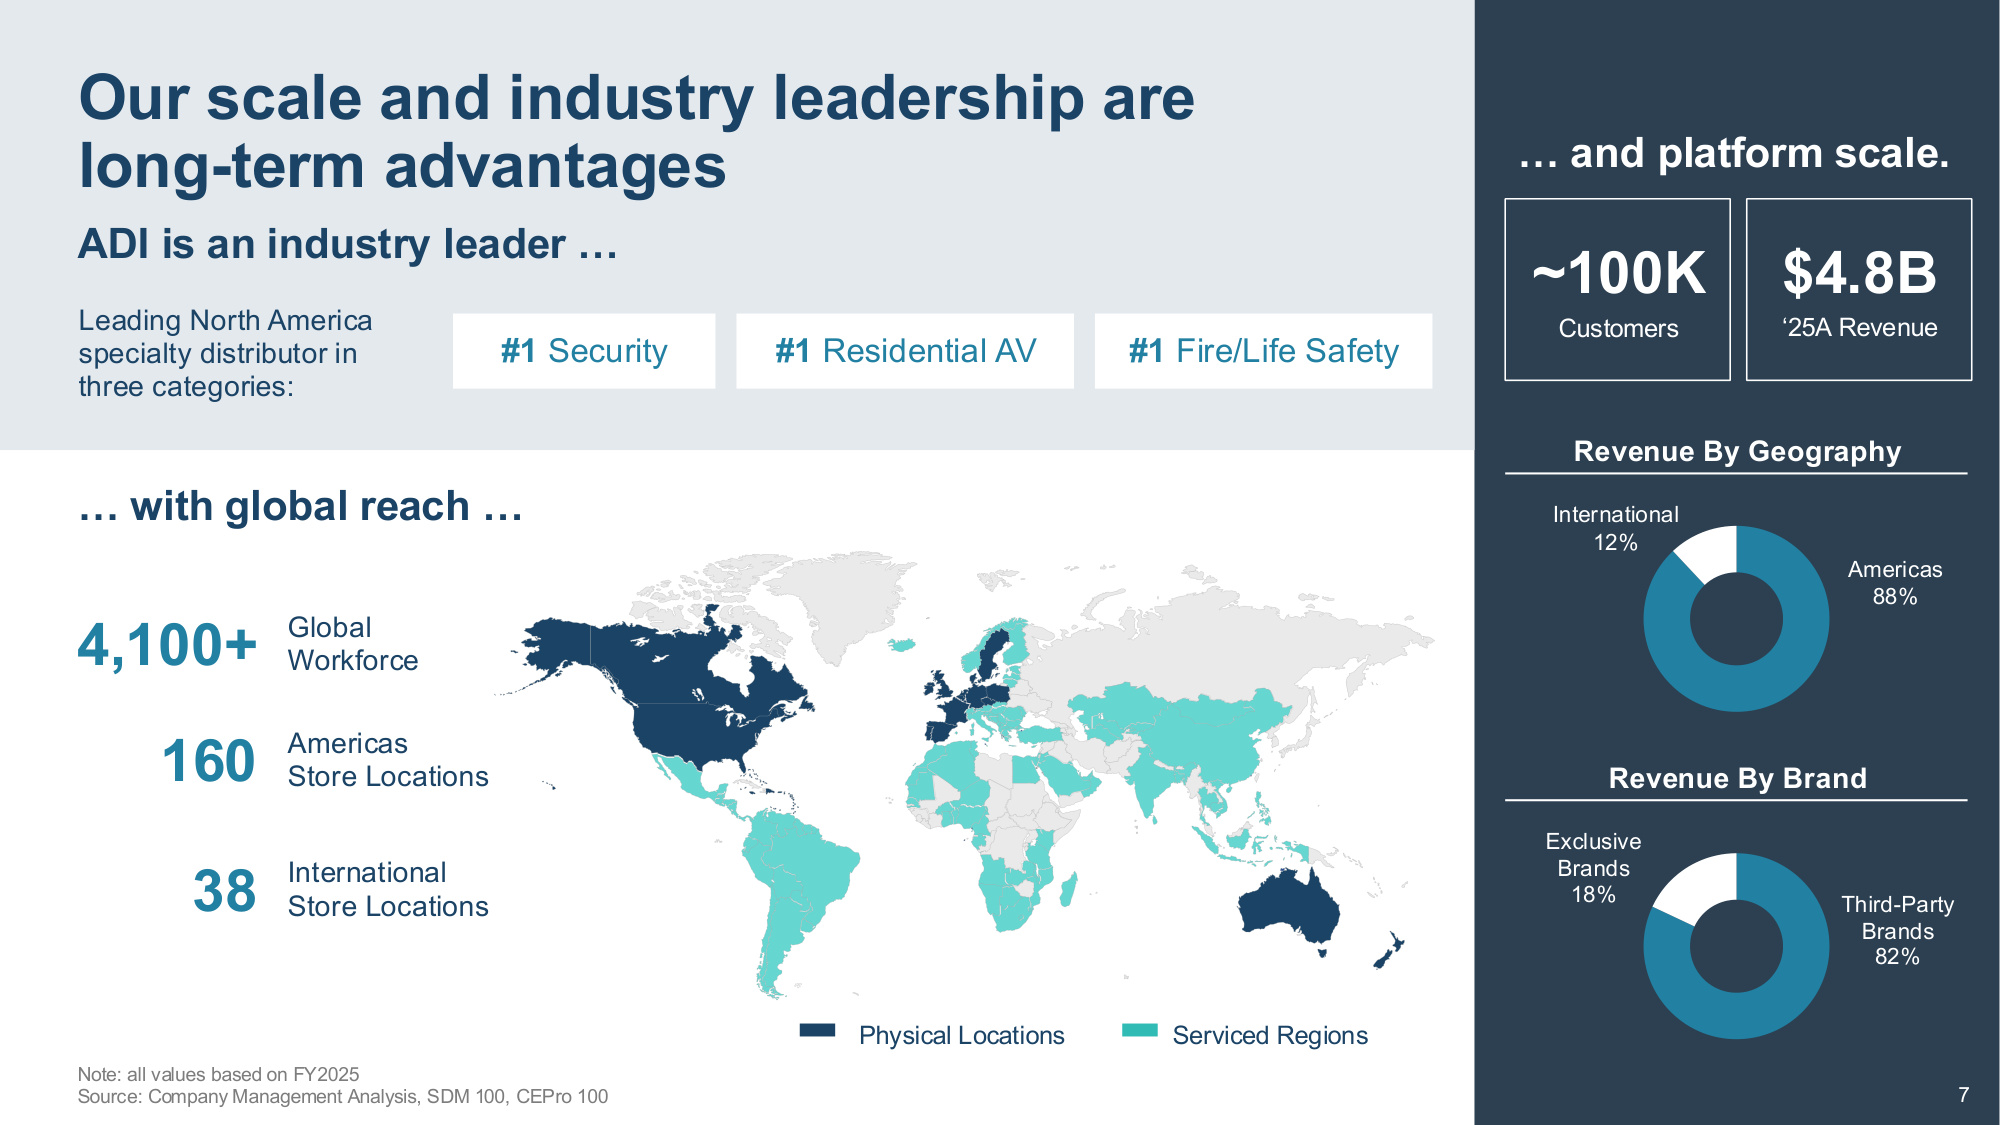
Company Confidential 7 ... and platform scale. $4.8B '25A Revenue ~100K Customers ... with global reach ... Americas Store Locations International Store Locations Serviced Regions Physical Locations Global Workforce 160 38 4,100+ Note: all values based on FY2025 Source: Company Management Analysis, SDM 100, CEPro 100 Our scale and industry leadership are long-term advantages ADI is an industry leader ... #1 Security #1 Residential AV #1 Fire/Life Safety Leading North America specialty distributor in three categories: 7 Americas 88% International 12% Third-Party Brands 82% Exclusive Brands 18% Revenue By Brand Revenue By Geography
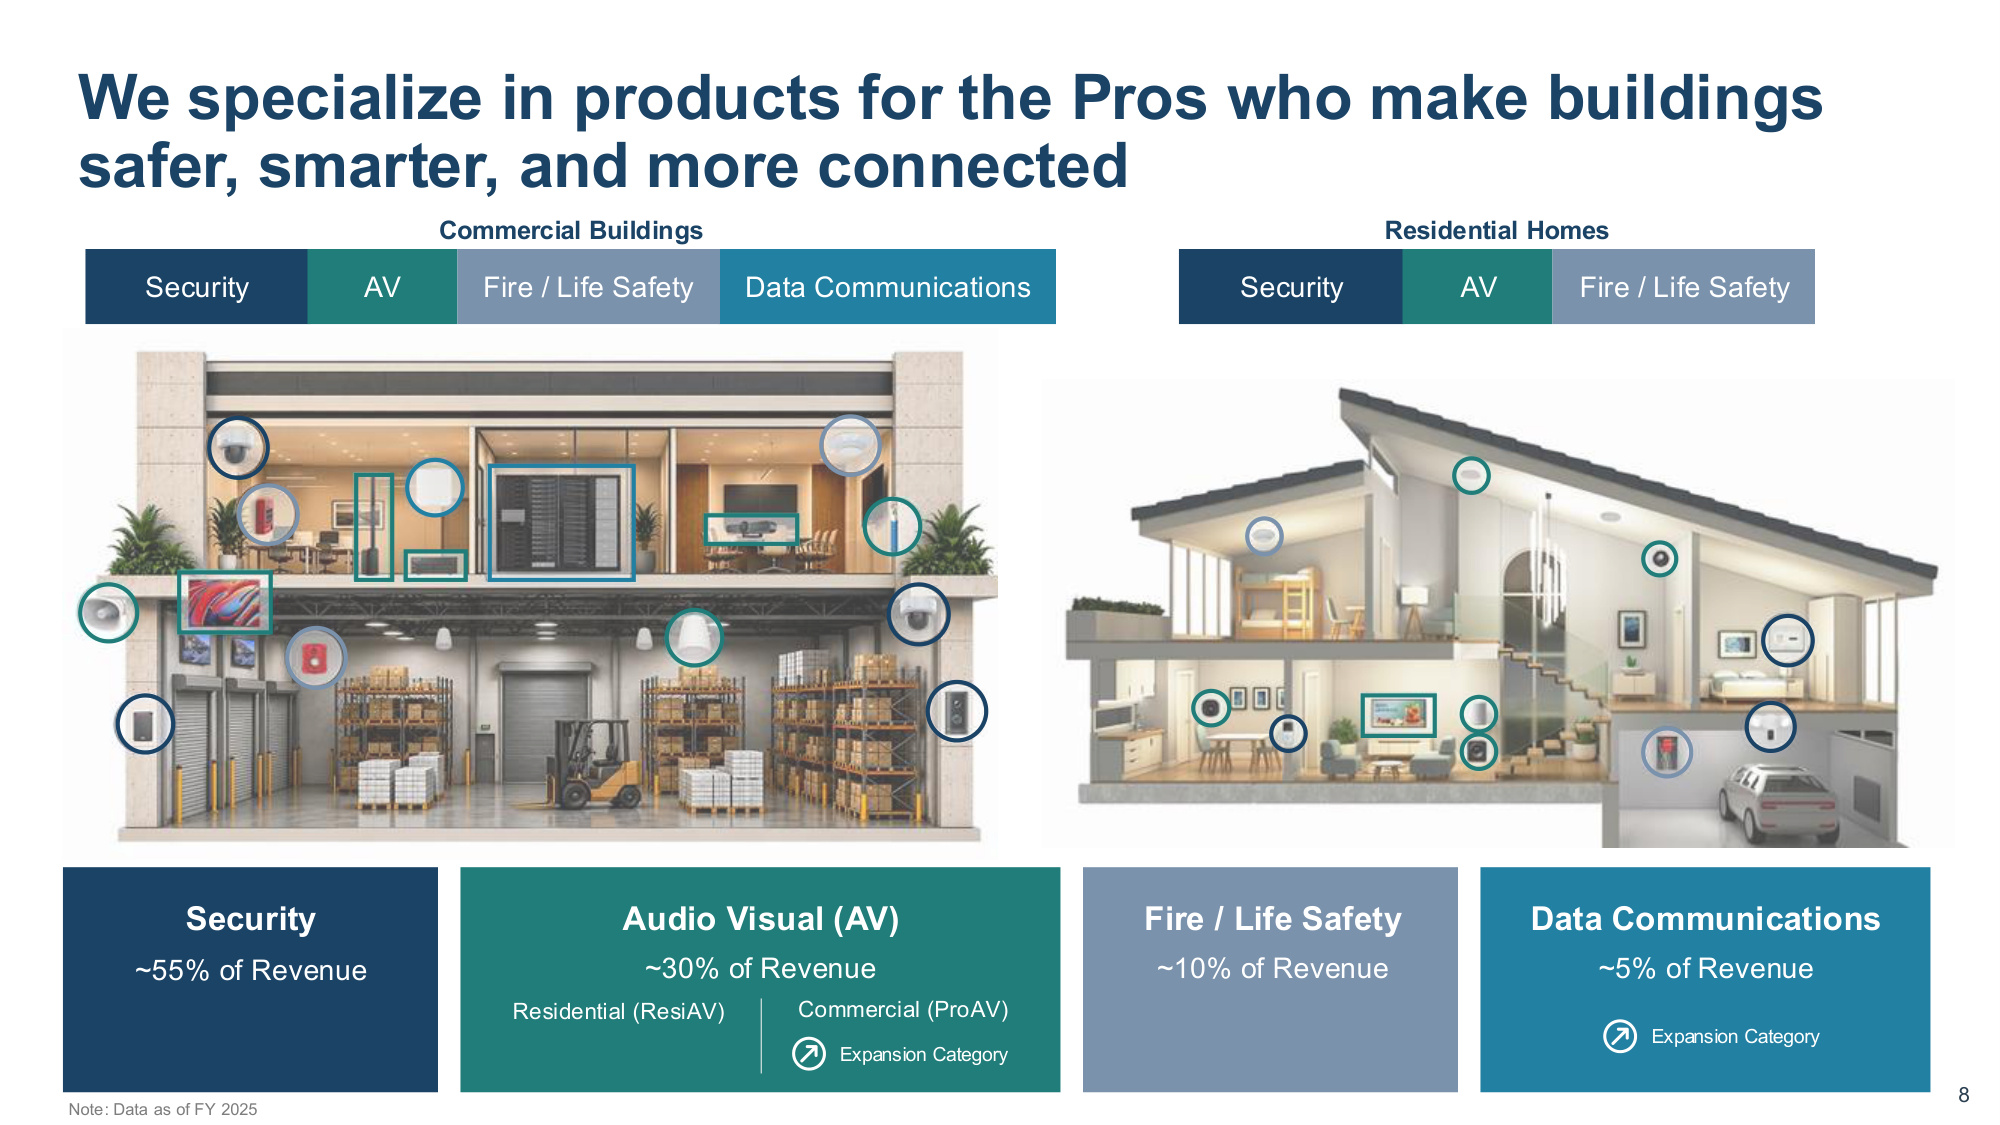
Company Confidential 8 Security Audio Visual (AV) Data Communications Residential (ResiAV) Commercial (ProAV) Fire / Life Safety ~55% of Revenue ~30% of Revenue ~10% of Revenue ~5% of Revenue Security AV Data Communications Fire / Life Safety Expansion Category Expansion Category Security AV Fire / Life Safety Residential Homes Commercial Buildings We specialize in products for the Pros who make buildings safer, smarter, and more connected Note: Data as of FY 2025
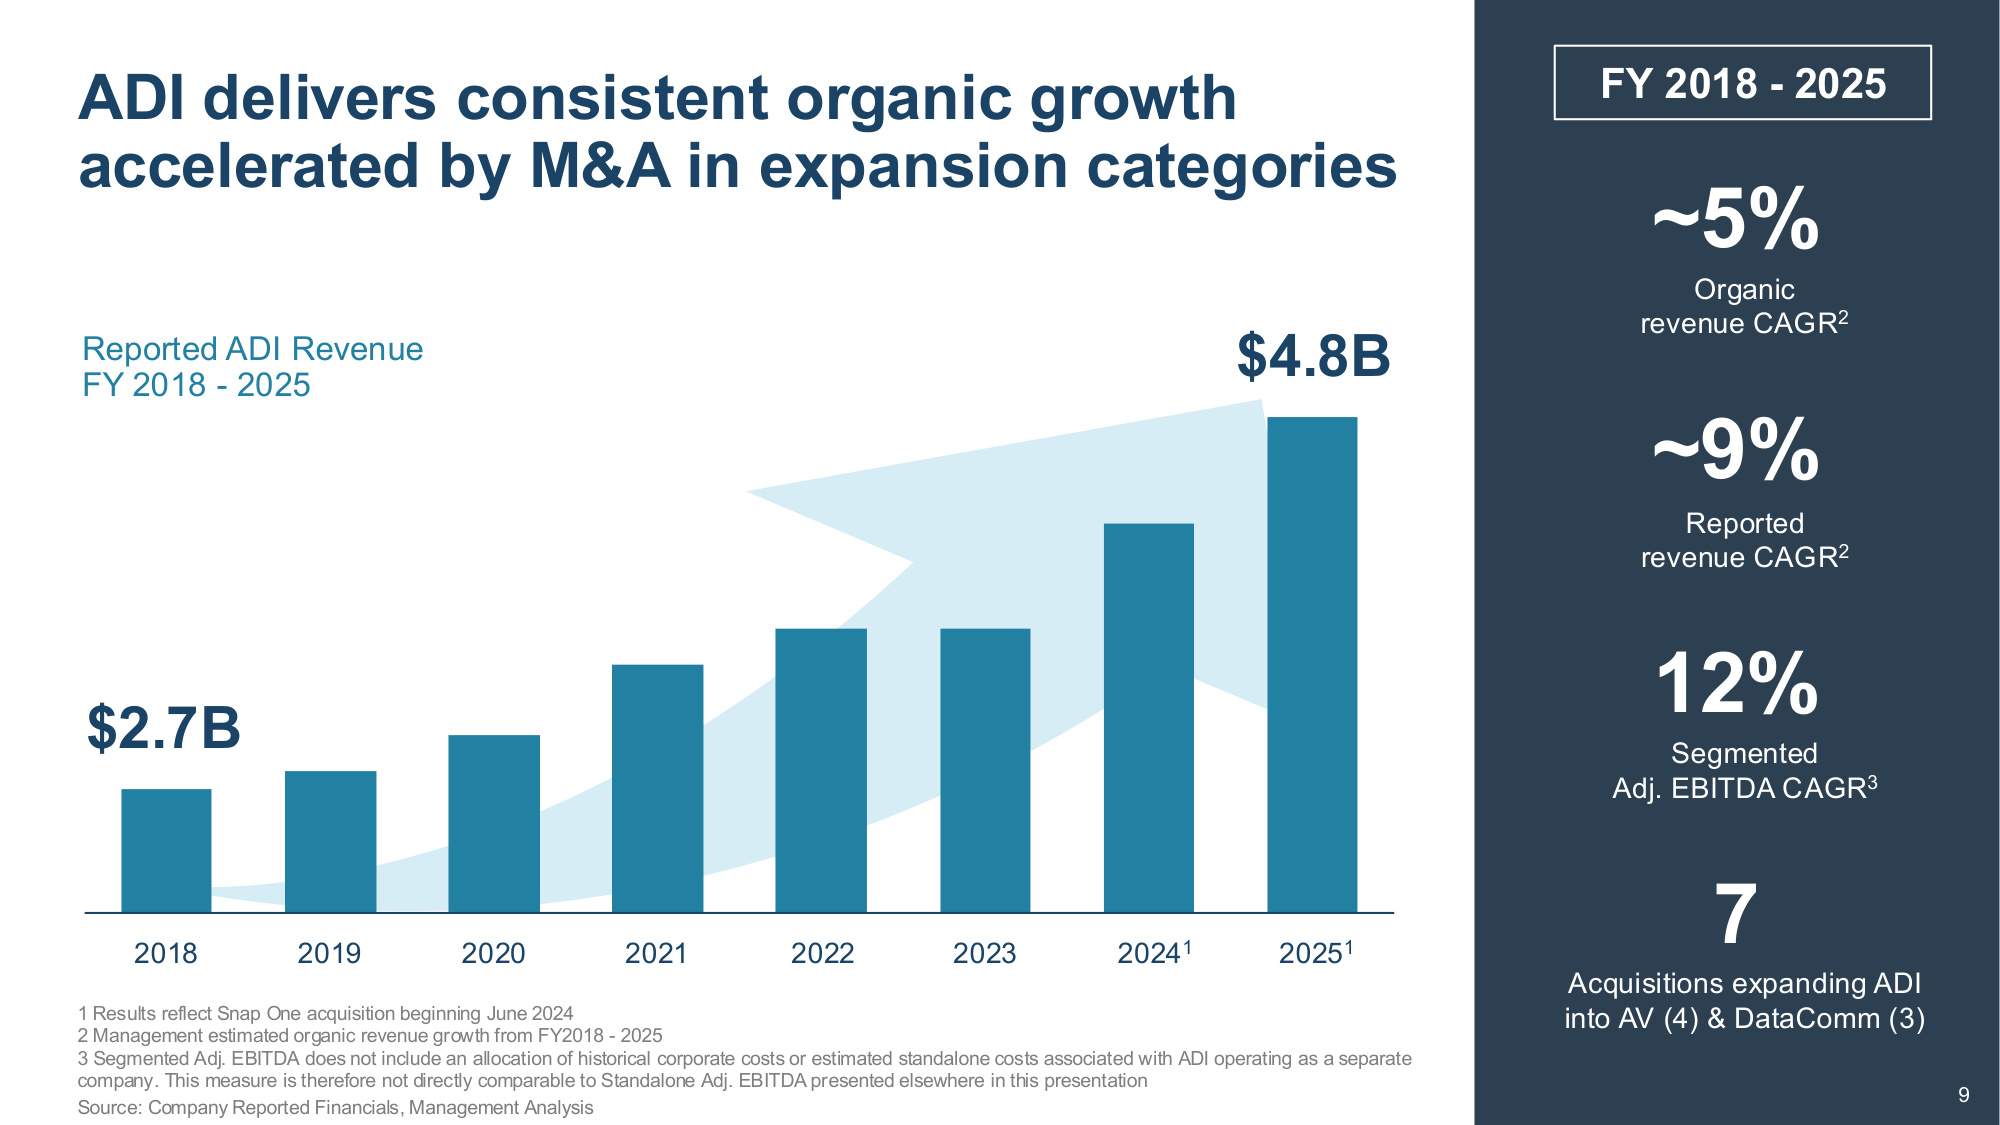
Company Confidential 9 $2.7B Segmented Adj. EBITDA CAGR3 12% Reported revenue CAGR2 ~9% Acquisitions expanding ADI into AV (4) & DataComm (3) 7 Organic revenue CAGR2 ~5% $4.8B Source: Company Reported Financials, Management Analysis Reported ADI Revenue FY 2018 - 2025 2018 2019 2020 2021 2022 2023 20241 20251 1 Results reflect Snap One acquisition beginning June 2024 2 Management estimated organic revenue growth from FY2018 - 2025 3 Segmented Adj. EBITDA does not include an allocation of historical corporate costs or estimated standalone costs associated with ADI operating as a separate company. This measure is therefore not directly comparable to Standalone Adj. EBITDA presented elsewhere in this presentation ADI delivers consistent organic growth accelerated by M&A in expansion categories 9 FY 2018 - 2025
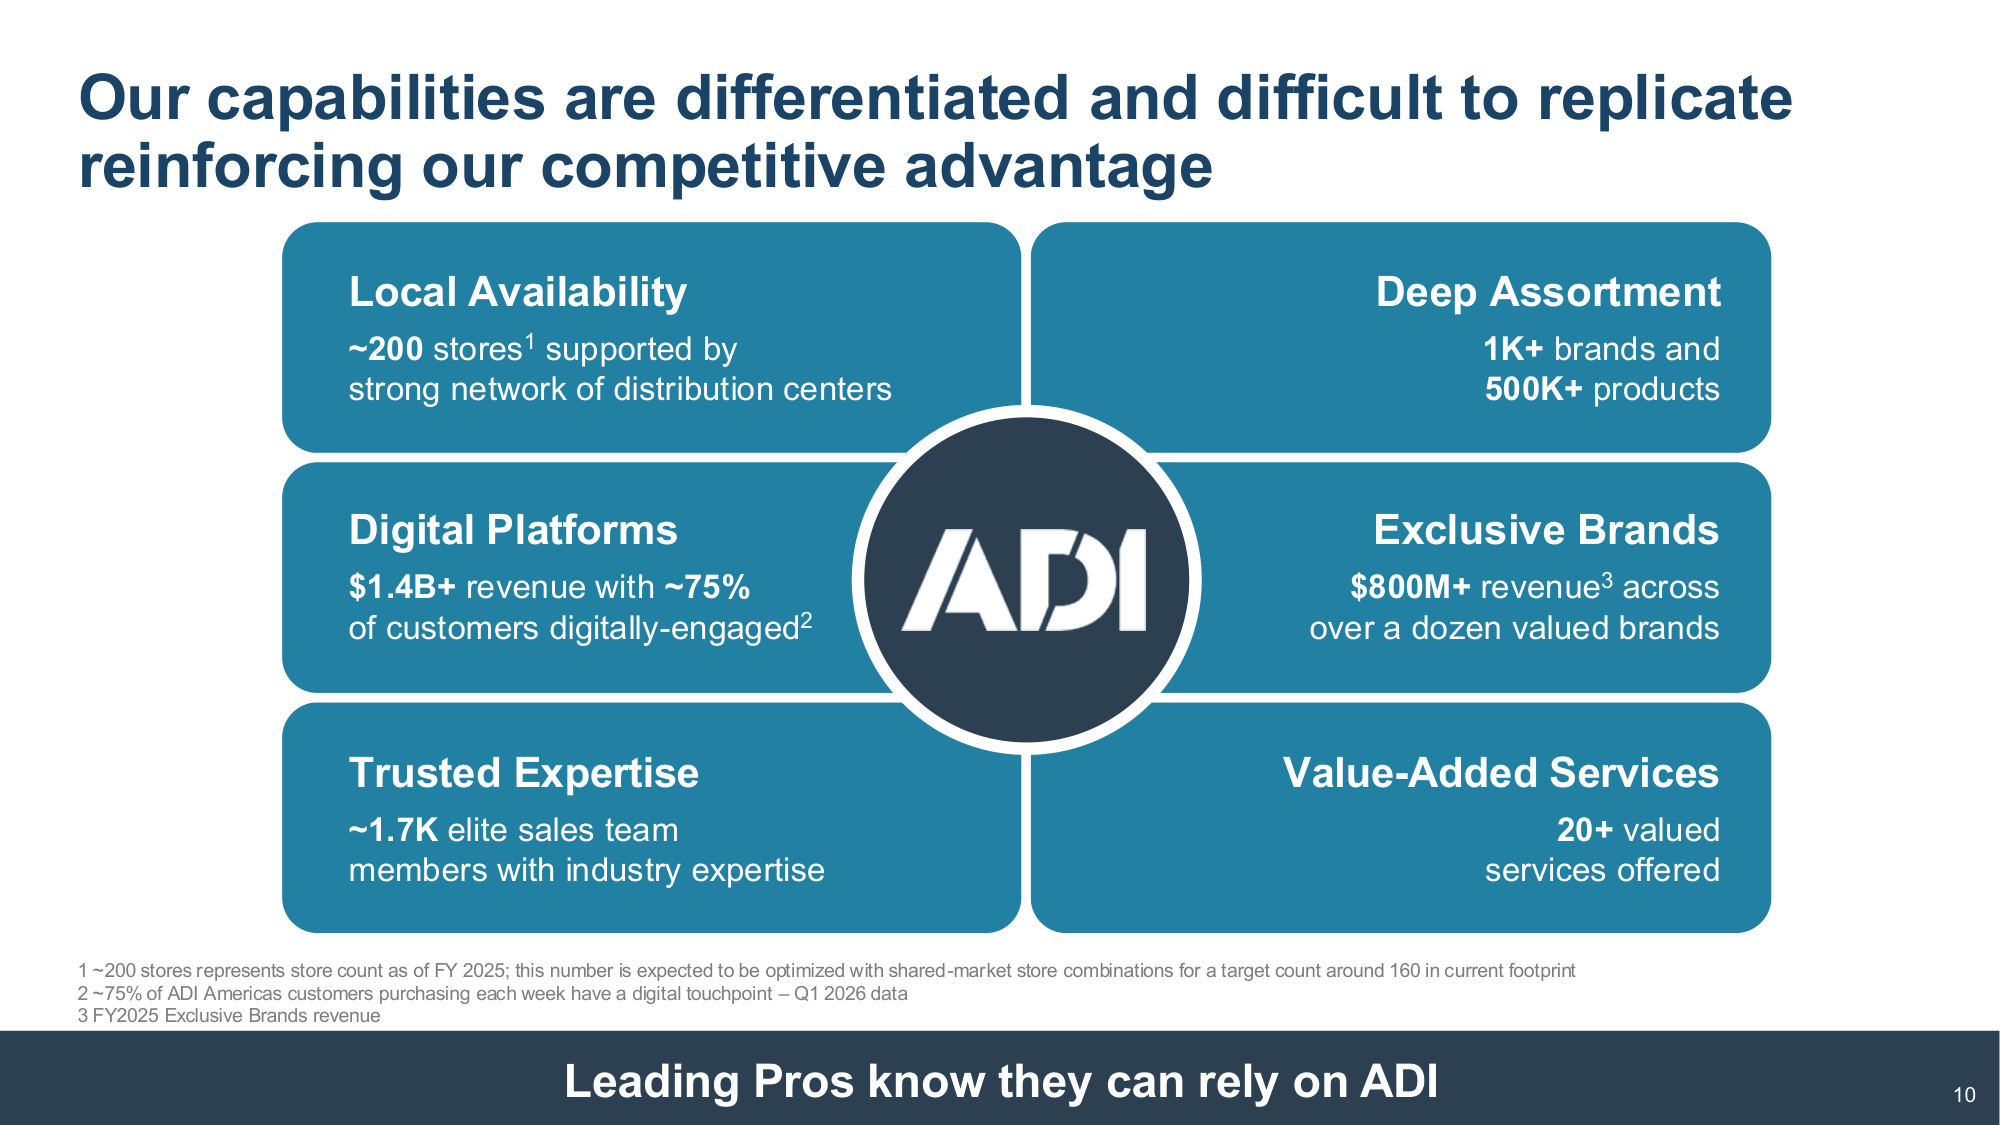
Company Confidential 10 10 Leading Pros know they can rely on ADI 1 ~200 stores represents store count as of FY 2025; this number is expected to be optimized with shared-market store combinations for a target count around 160 in current footprint 2 ~75% of ADI Americas customers purchasing each week have a digital touchpoint – Q1 2026 data 3 FY2025 Exclusive Brands revenue Deep Assortment 1K+ brands and 500K+ products Exclusive Brands $800M+ revenue3 across over a dozen valued brands Value-Added Services 20+ valued services offered Local Availability ~200 stores1 supported by strong network of distribution centers Digital Platforms $1.4B+ revenue with ~75% of customers digitally-engaged2 Trusted Expertise ~1.7K elite sales team members with industry expertise Our capabilities are differentiated and difficult to replicate reinforcing our competitive advantage 10
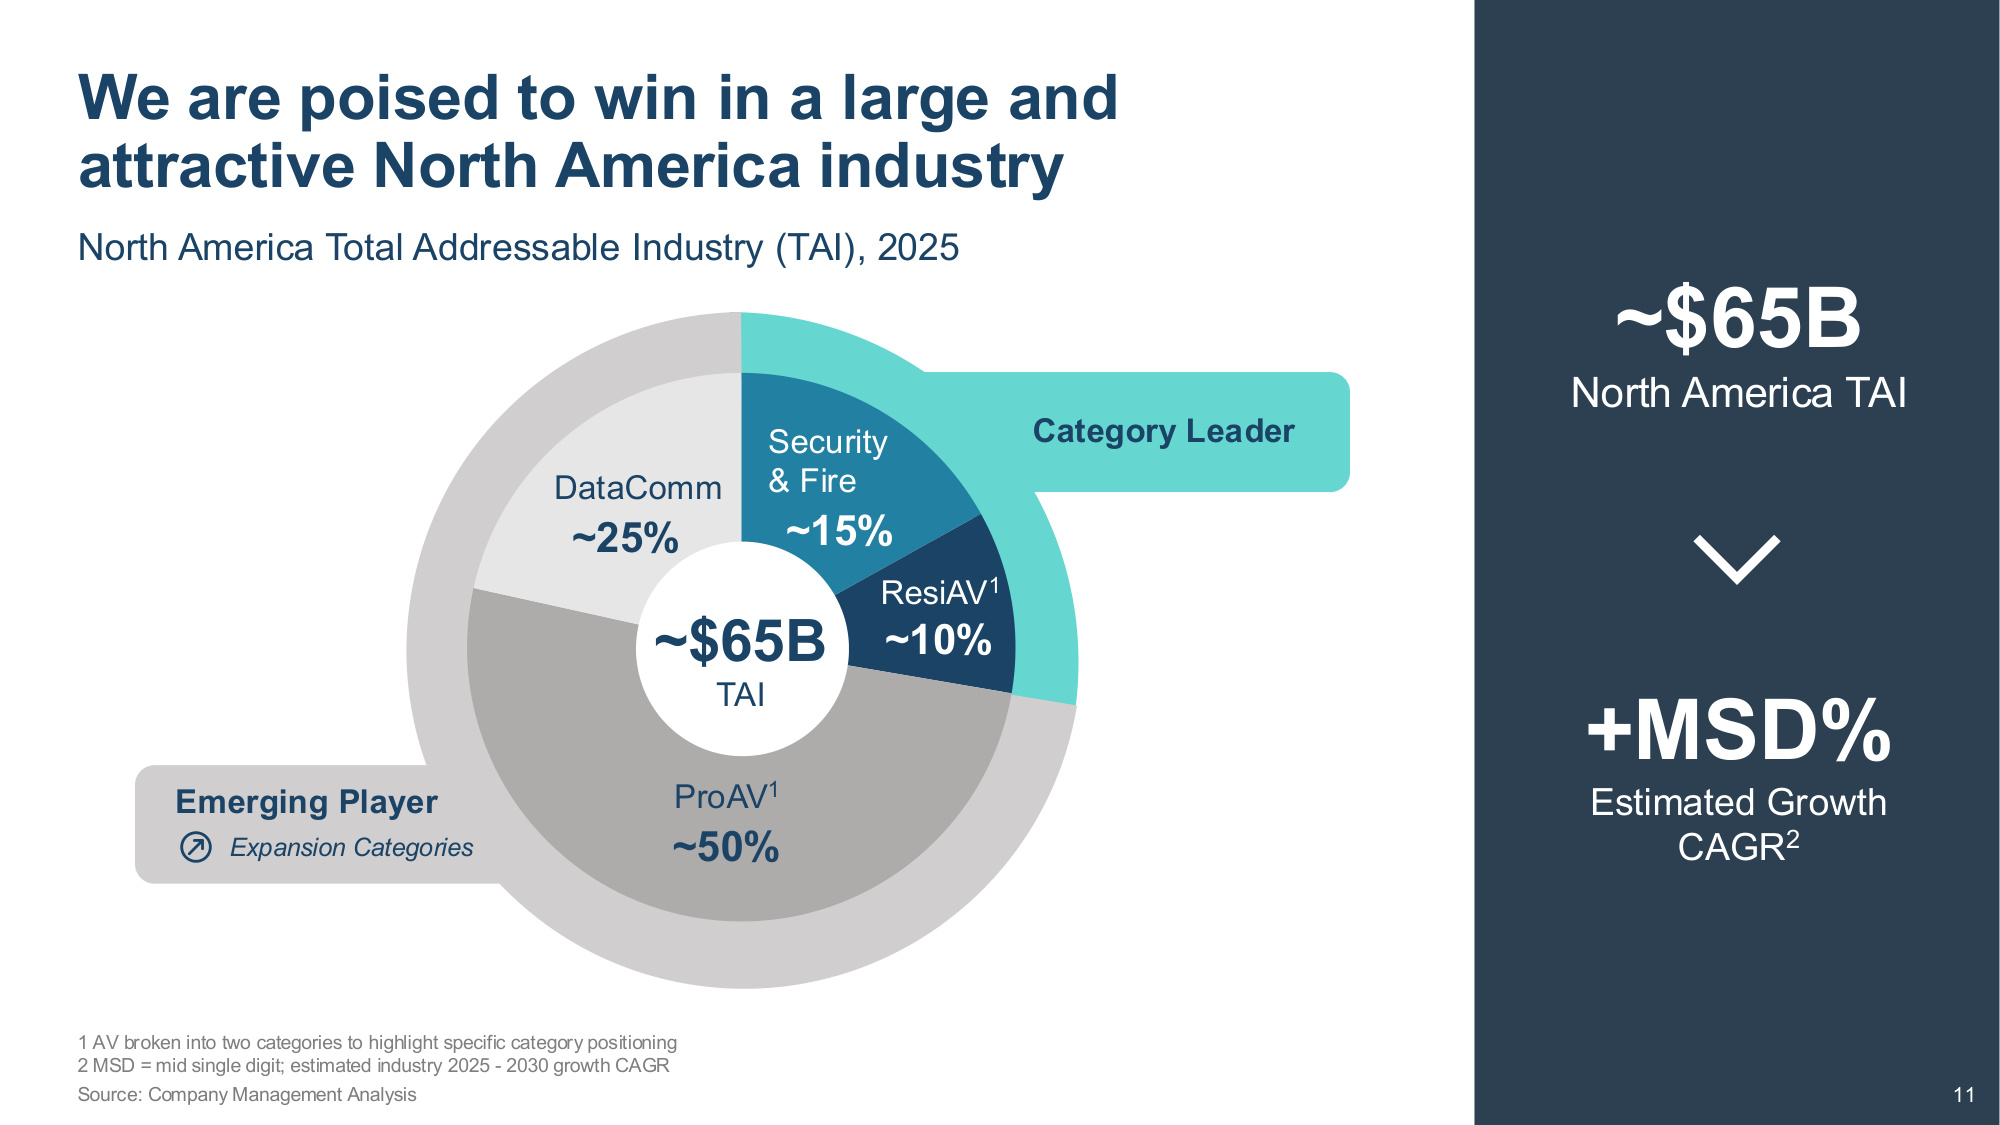
Company Confidential 11 Category Leader ~$65B North America TAI North America Total Addressable Industry (TAI), 2025 Emerging Player ~15% ~10% ~50% ~25% ~$65B TAI ProAV1 DataComm Security & Fire ResiAV1 Source: Company Management Analysis 1 AV broken into two categories to highlight specific category positioning 2 MSD = mid single digit; estimated industry 2025 - 2030 growth CAGR +MSD% Estimated Growth CAGR2 We are poised to win in a large and attractive North America industry Expansion Categories 11
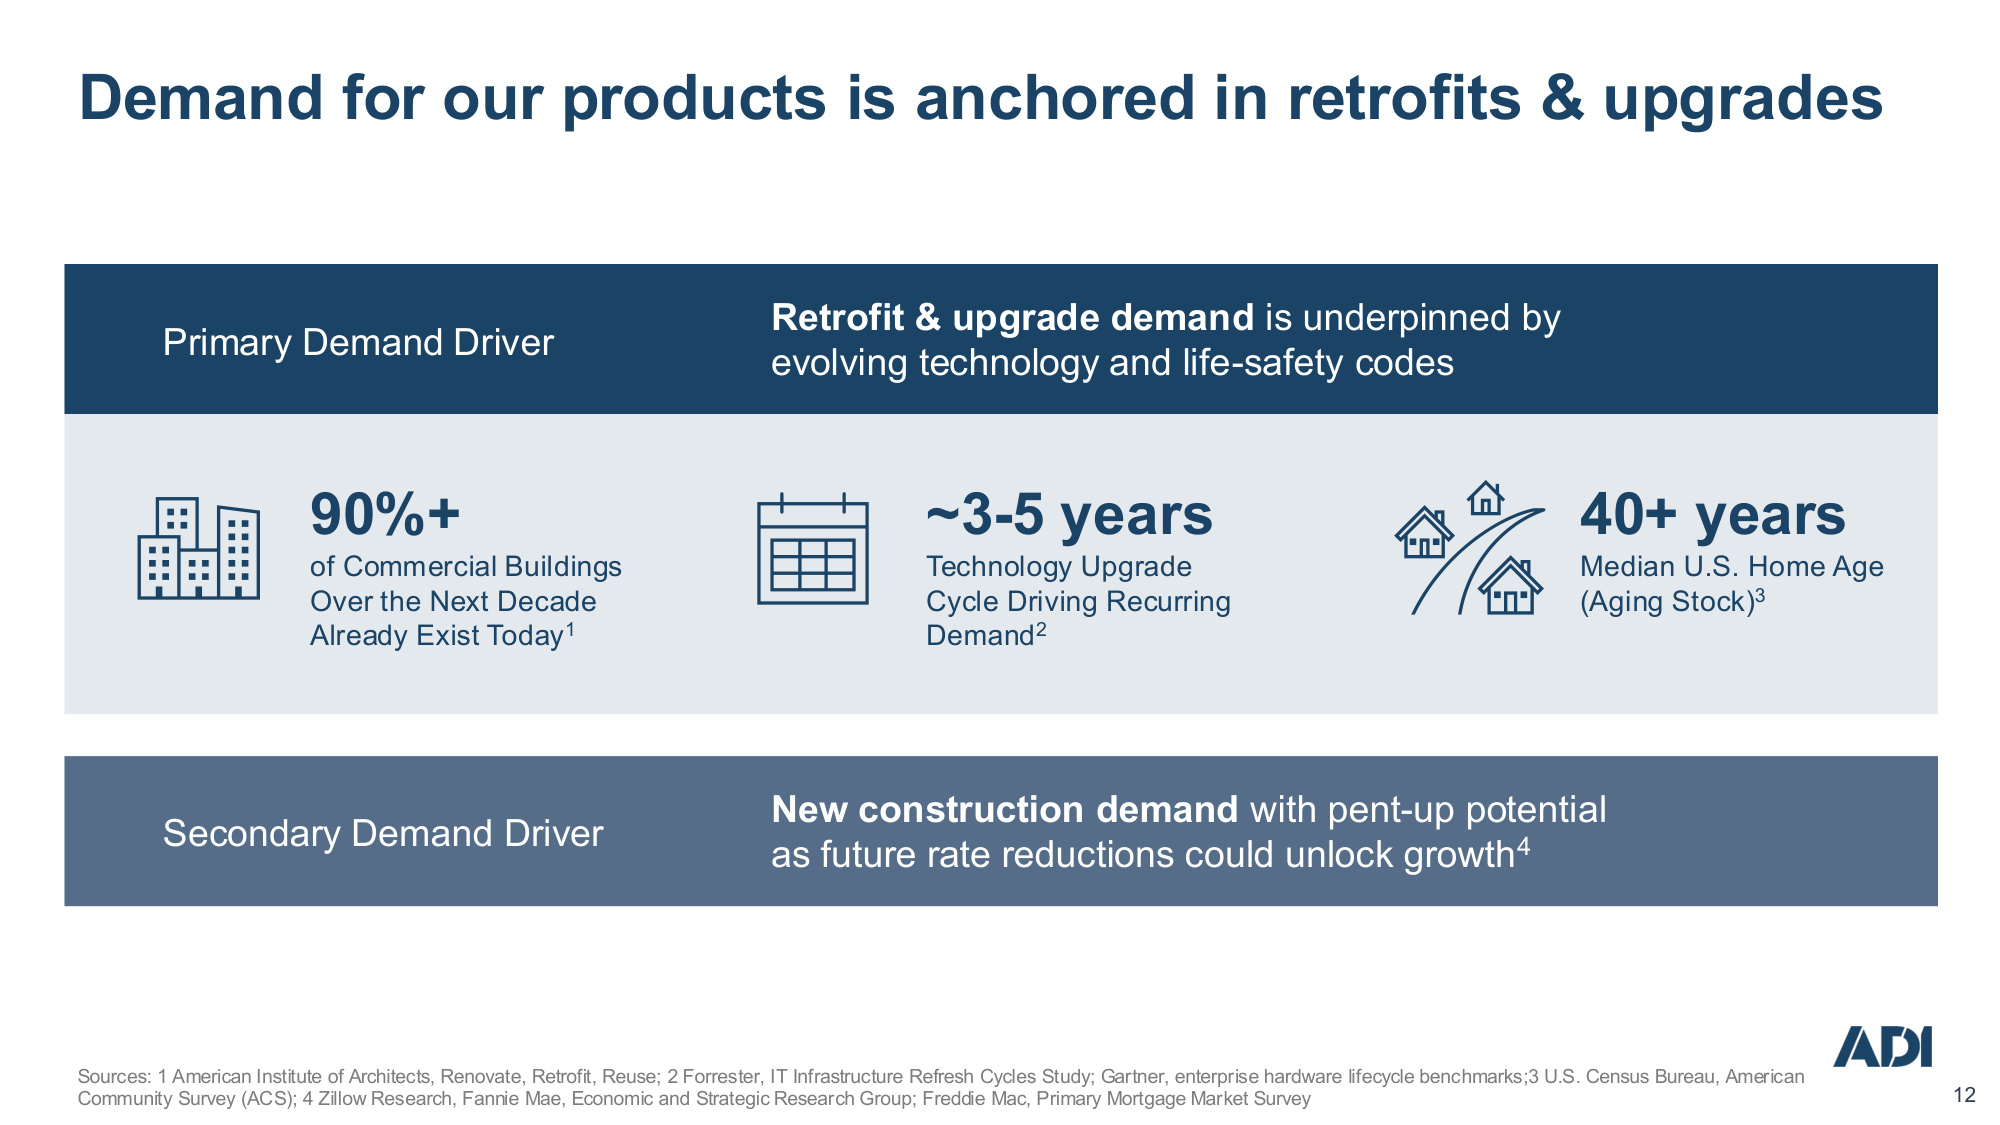
Company Confidential 12 12 Retrofit & upgrade demand is underpinned by evolving technology and life-safety codes New construction demand with pent-up potential as future rate reductions could unlock growth4 Primary Demand Driver Secondary Demand Driver Sources: 1 American Institute of Architects, Renovate, Retrofit, Reuse; 2 Forrester, IT Infrastructure Refresh Cycles Study; Gartner, enterprise hardware lifecycle benchmarks; 3 U.S. Census Bureau, American Community Survey (ACS); 4 Zillow Research, Fannie Mae, Economic and Strategic Research Group; Freddie Mac, Primary Mortgage Market Survey 90%+ of Commercial Buildings Over the Next Decade Already Exist Today1 ~3-5 years Technology Upgrade Cycle Driving Recurring Demand2 40+ years Median U.S. Home Age (Aging Stock)3 Demand for our products is anchored in retrofits & upgrades
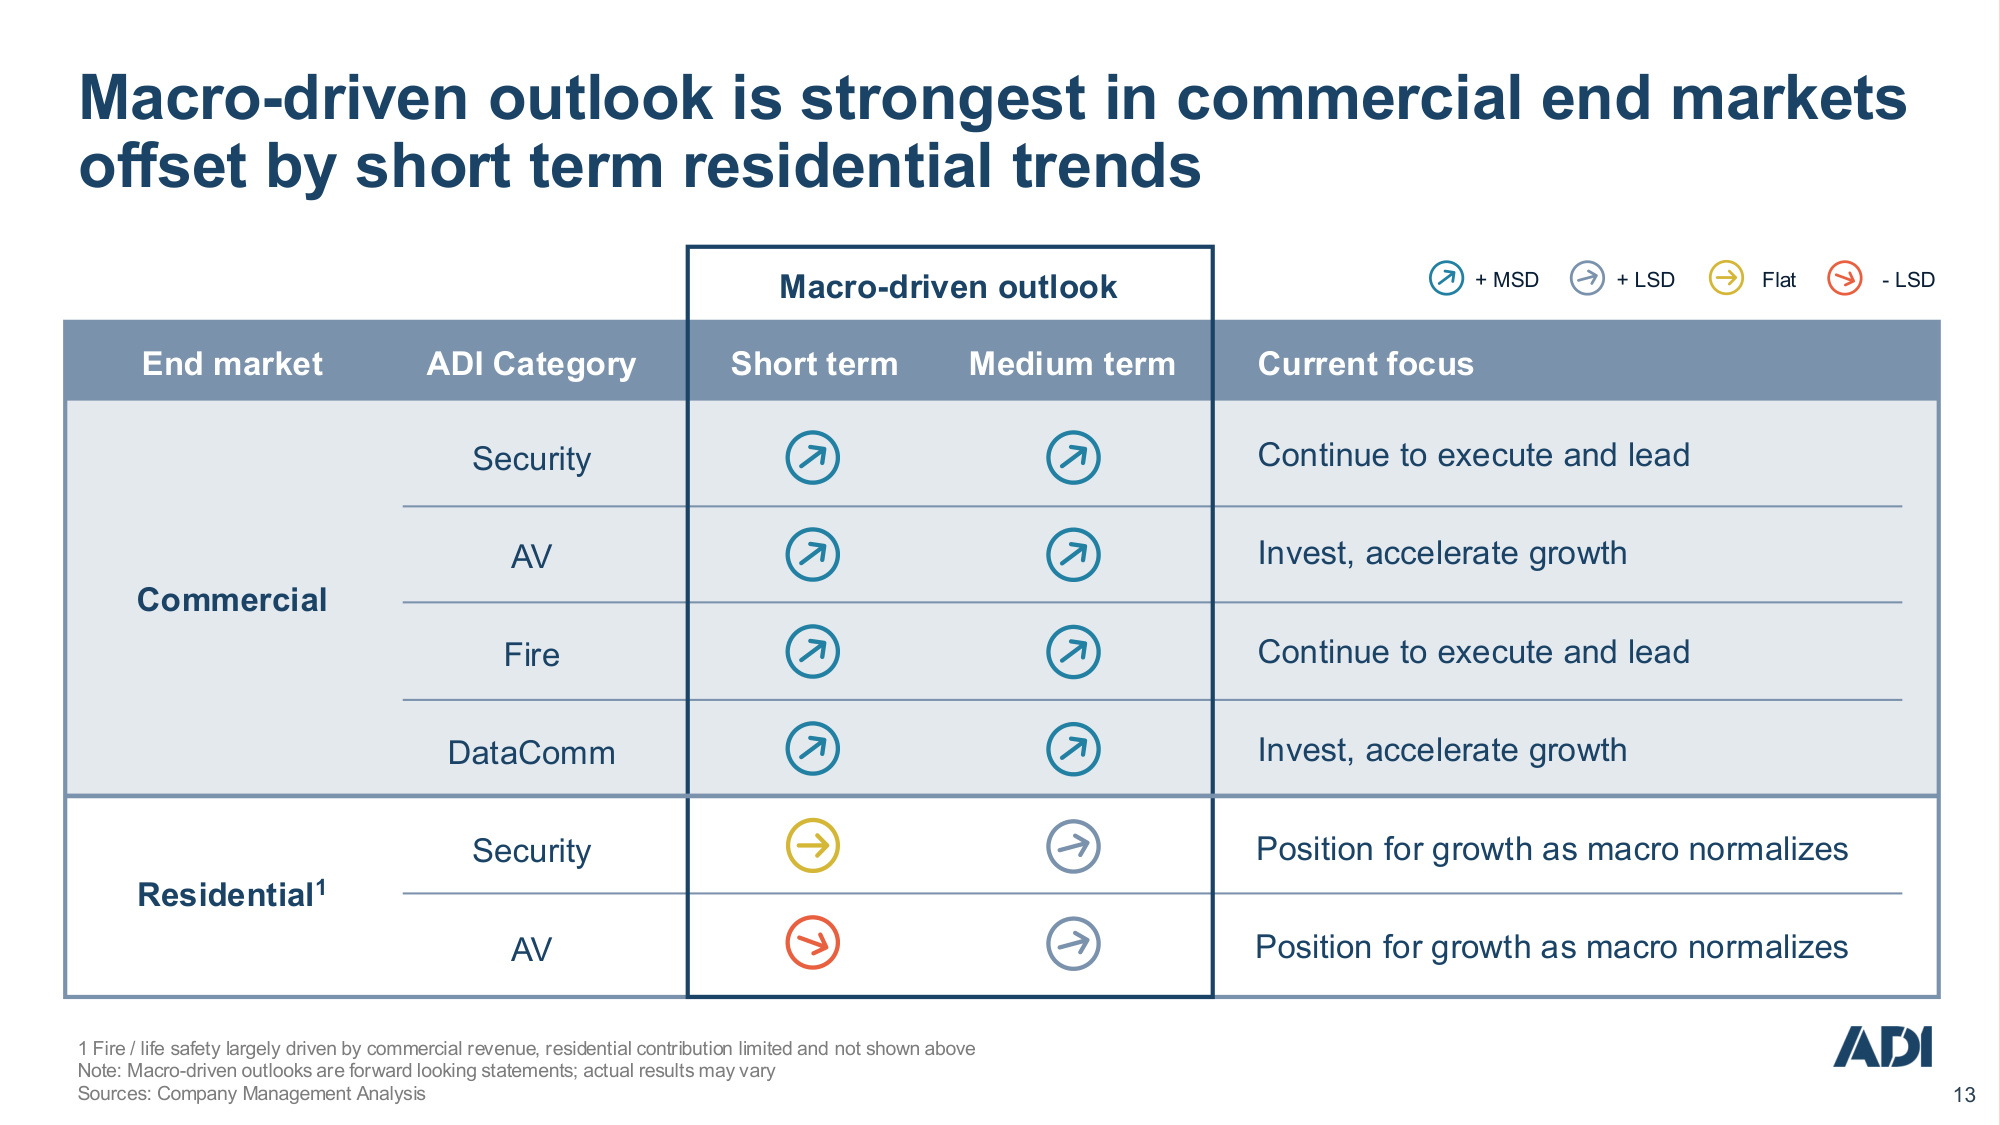
Company Confidential 13 13 1 Fire / life safety largely driven by commercial revenue, residential contribution limited and not shown above Note: Macro-driven outlooks are forward looking statements; actual results may vary Sources: Company Management Analysis Macro-driven outlook is strongest in commercial end markets offset by short term residential trends Residential1 Commercial End market ADI Category Security AV Fire DataComm Security AV Short term + MSD + LSD Flat - LSD Medium term Current focus Continue to execute and lead Invest, accelerate growth Invest, accelerate growth Continue to execute and lead Position for growth as macro normalizes Position for growth as macro normalizes Macro-driven outlook
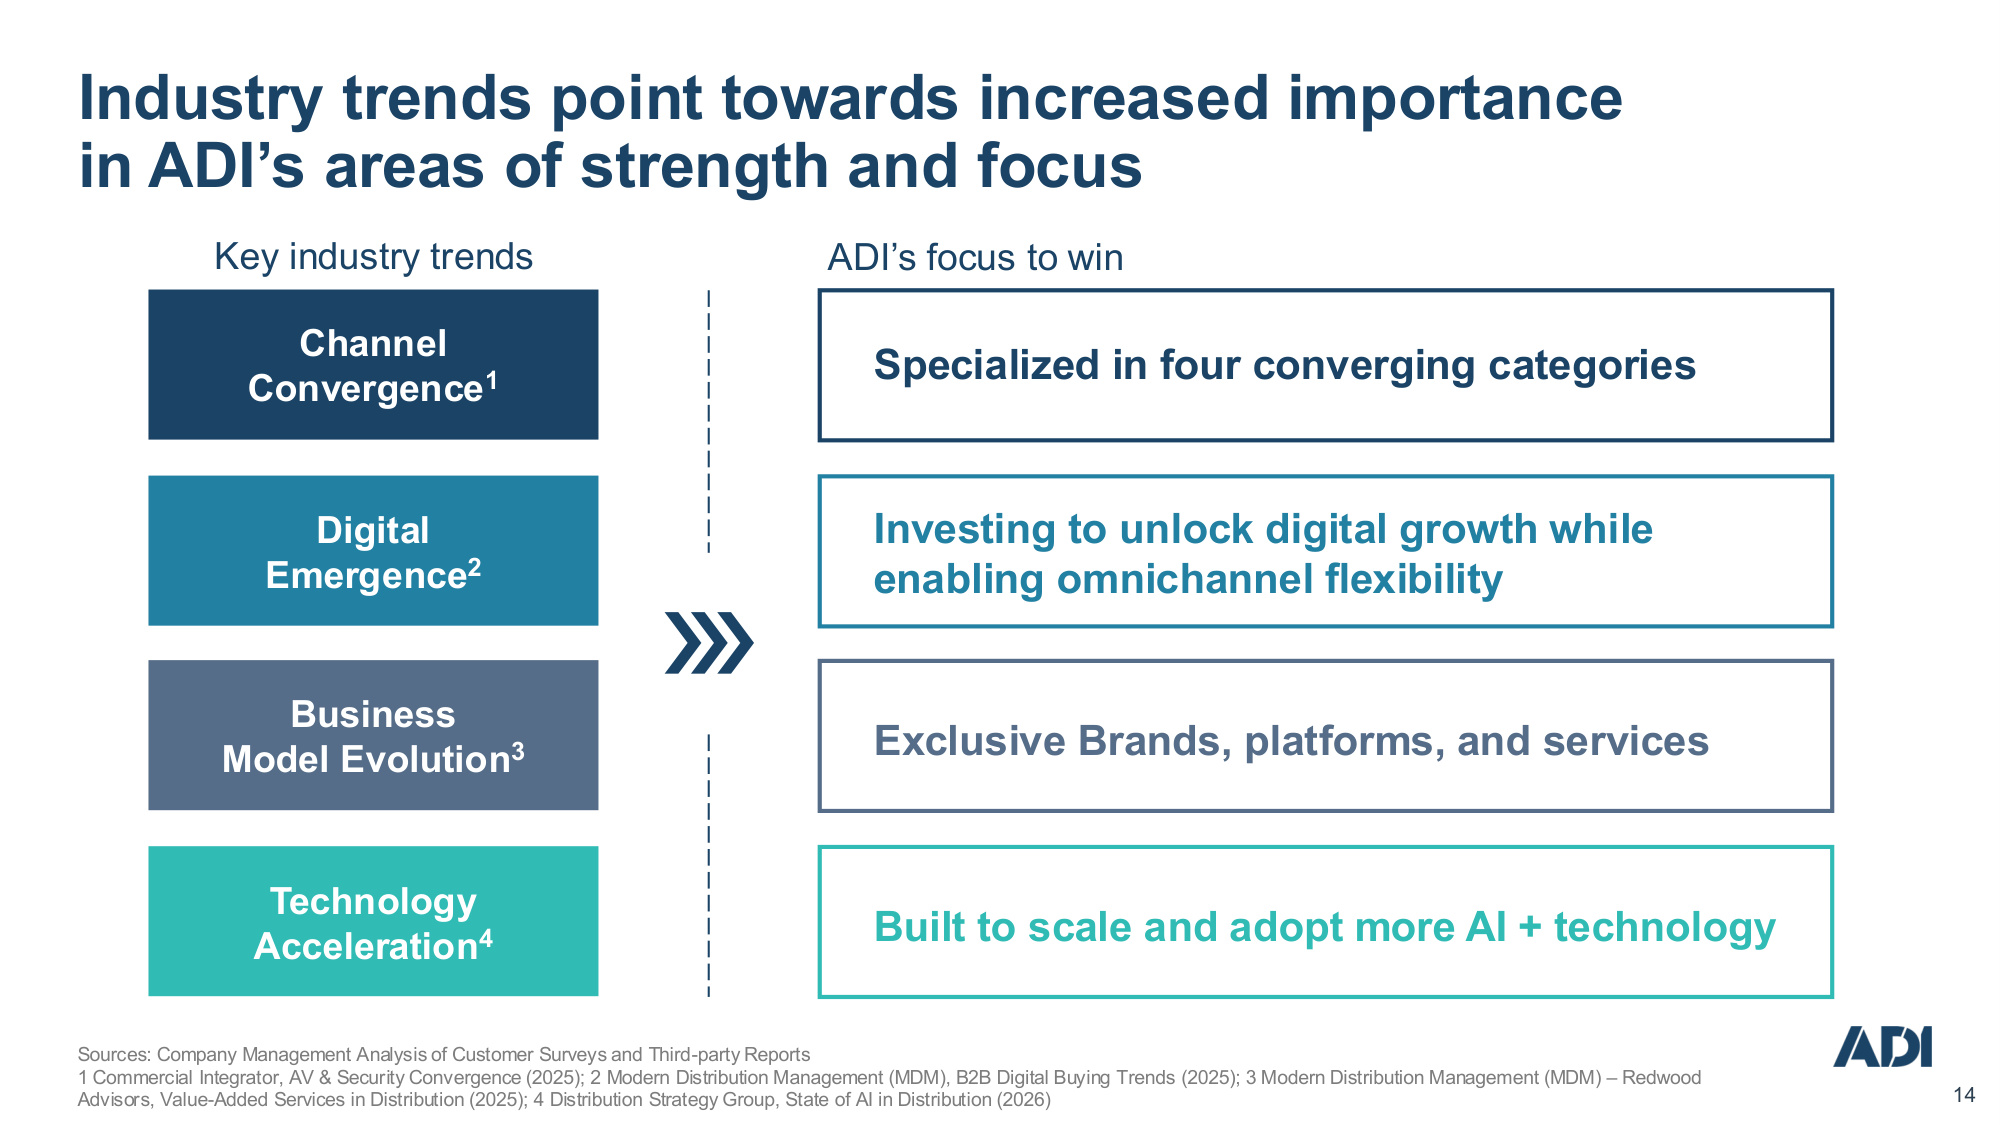
Company Confidential 14 14 Sources: Company Management Analysis of Customer Surveys and Third-party Reports 1 Commercial Integrator, AV & Security Convergence (2025); 2 Modern Distribution Management (MDM), B2B Digital Buying Trends (2025); 3 Modern Distribution Management (MDM) – Redwood Advisors, Value-Added Services in Distribution (2025); 4 Distribution Strategy Group, State of AI in Distribution (2026) Channel Convergence1 Digital Emergence2 Business Model Evolution3 Technology Acceleration4 Specialized in four converging categories Investing to unlock digital growth while enabling omnichannel flexibility Exclusive Brands, platforms, and services Built to scale and adopt more AI + technology Key industry trends ADI's focus to win Industry trends point towards increased importance in ADI's areas of strength and focus
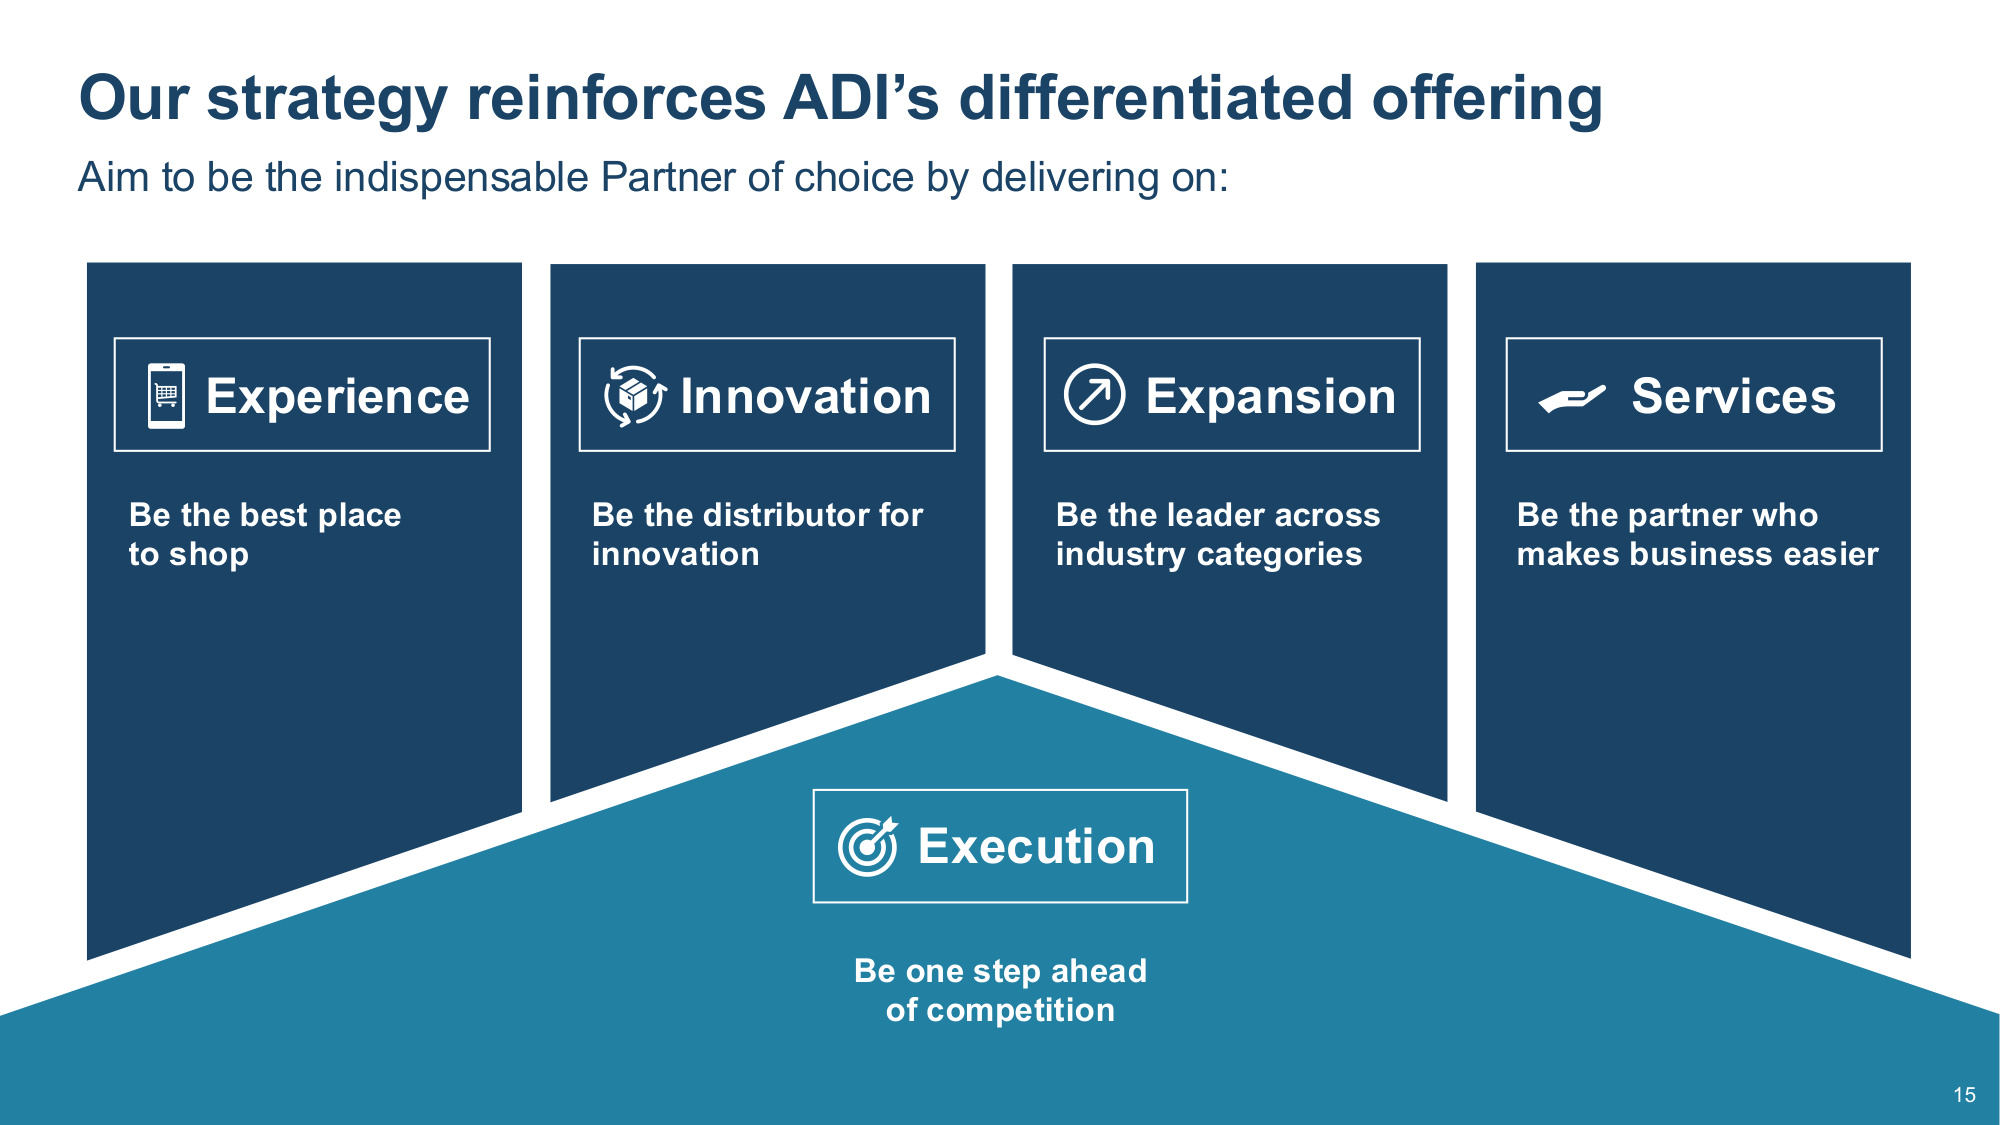
Company Confidential 15 15 Our strategy reinforces ADI's differentiated offering Be the distributor for innovation Be the best place to shop Be the leader across industry categories Be the partner who makes business easier Expansion Services Be one step ahead of competition Experience Innovation Execution Aim to be the indispensable Partner of choice by delivering on: 15
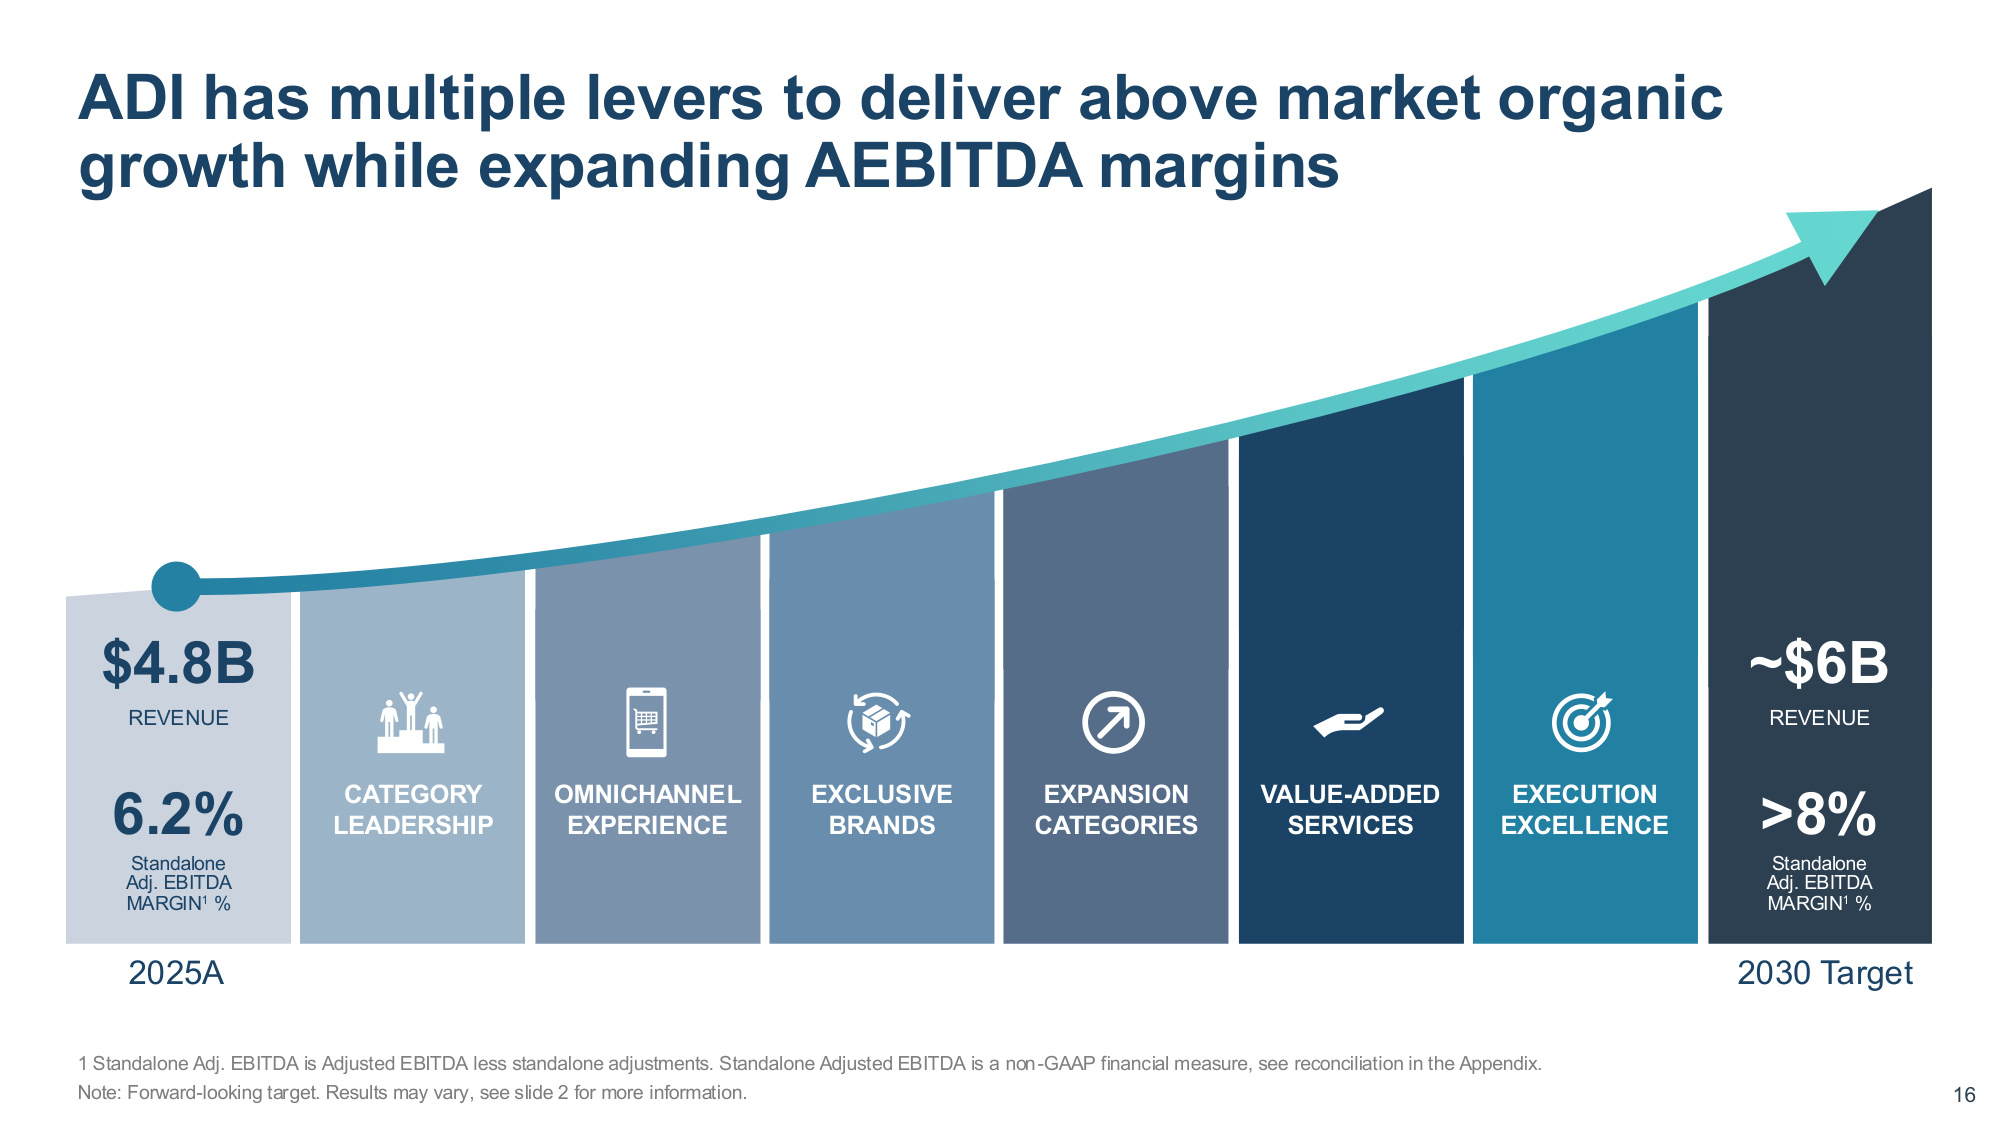
Company Confidential 16 16 2025A 2030 Target $4.8B REVENUE 6.2% Standalone Adj. EBITDA MARGIN1 % ~$6B REVENUE >8% Standalone Adj. EBITDA MARGIN1 % ADI has multiple levers to deliver above market organic growth while expanding AEBITDA margins CATEGORY LEADERSHIP OMNICHANNEL EXPERIENCE EXCLUSIVE BRANDS EXPANSION CATEGORIES VALUE-ADDED SERVICES EXECUTION EXCELLENCE 1 Standalone Adj. EBITDA is Adjusted EBITDA less standalone adjustments. Standalone Adjusted EBITDA is a non-GAAP financial measure, see reconciliation in the Appendix. Note: Forward-looking target. Results may vary, see slide 2 for more information.
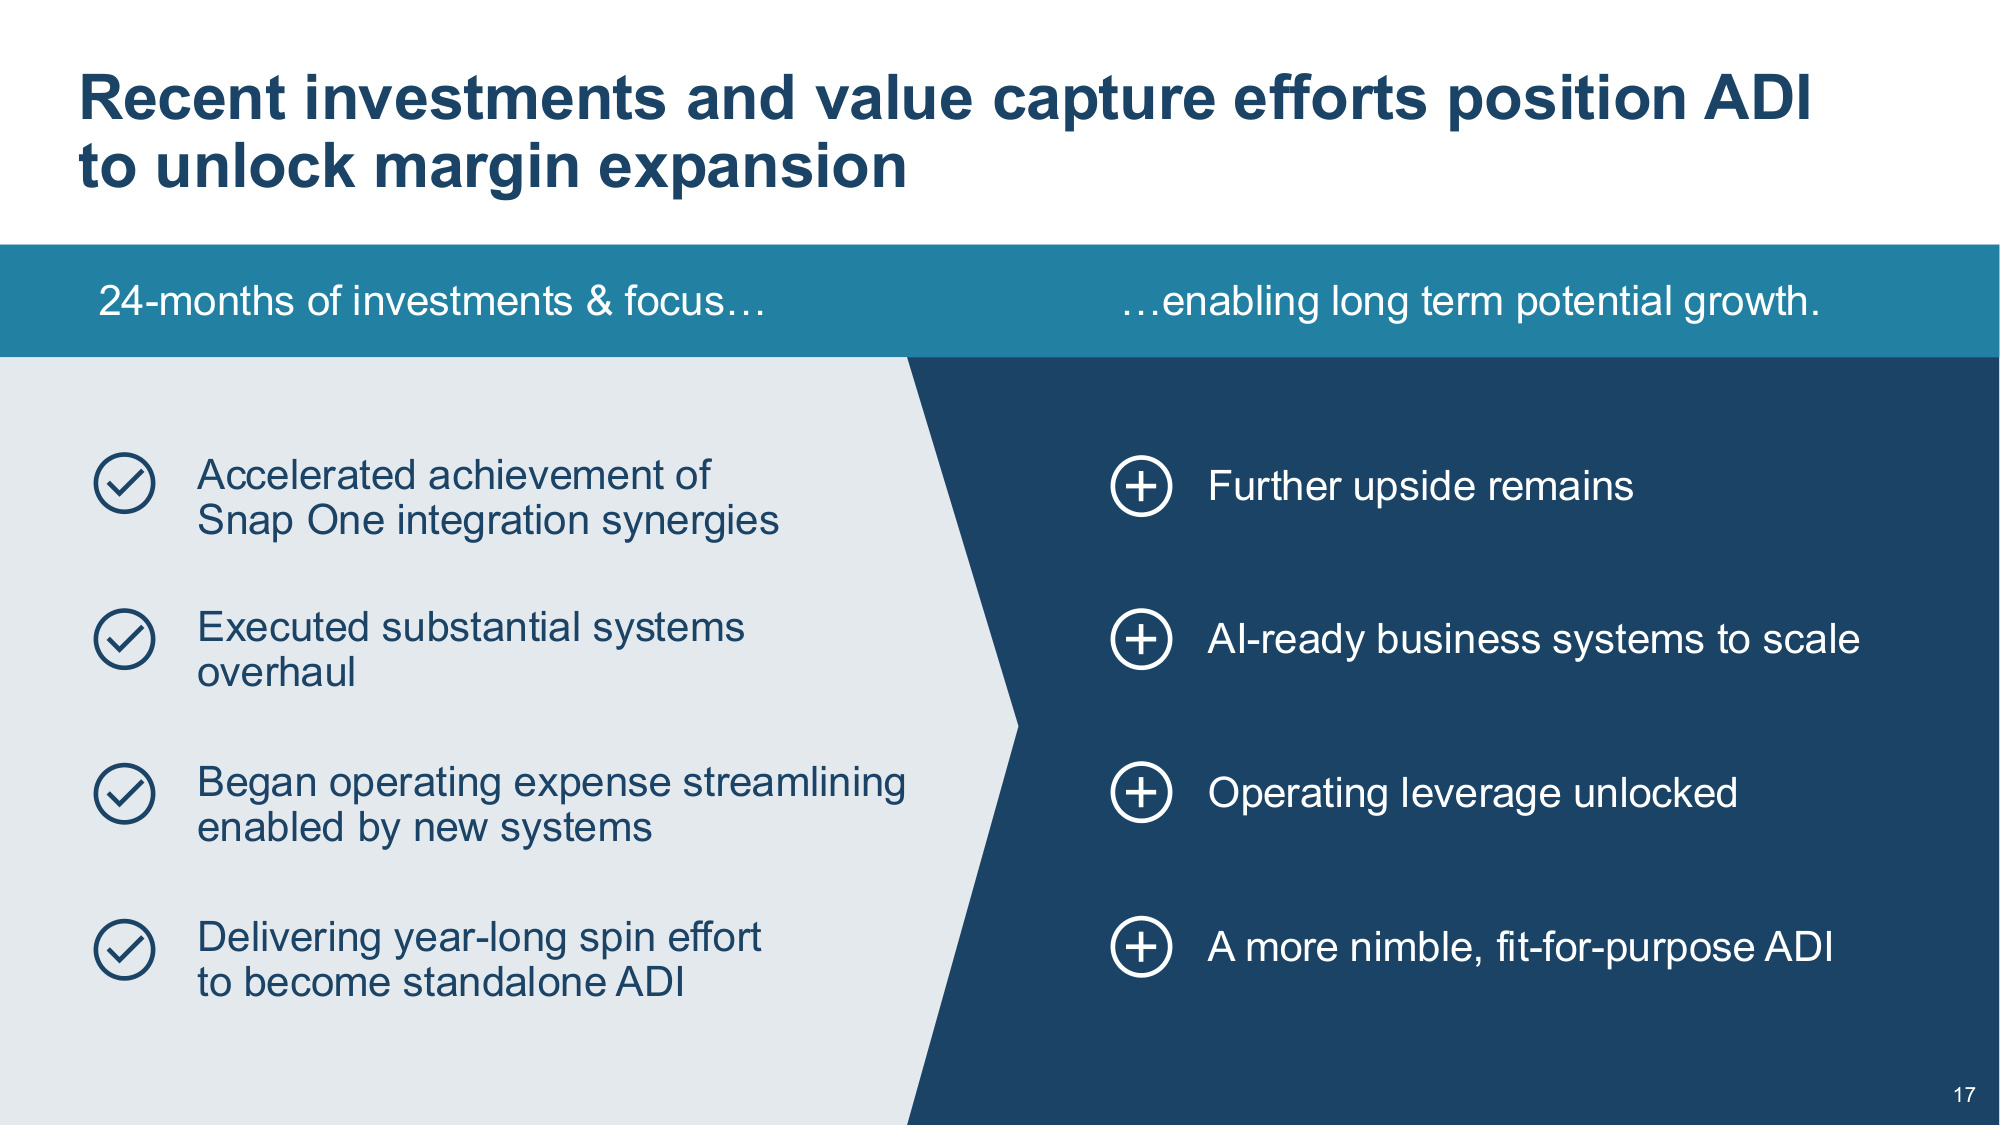
Company Confidential 17 17 Executed substantial systems overhaul Accelerated achievement of Snap One integration synergies Began operating expense streamlining enabled by new systems Delivering year-long spin effort to become standalone ADI AI-ready business systems to scale Further upside remains Operating leverage unlocked A more nimble, fit-for-purpose ADI Recent investments and value capture efforts position ADI to unlock margin expansion 24-months of investments & focus... ...enabling long term potential growth. 17
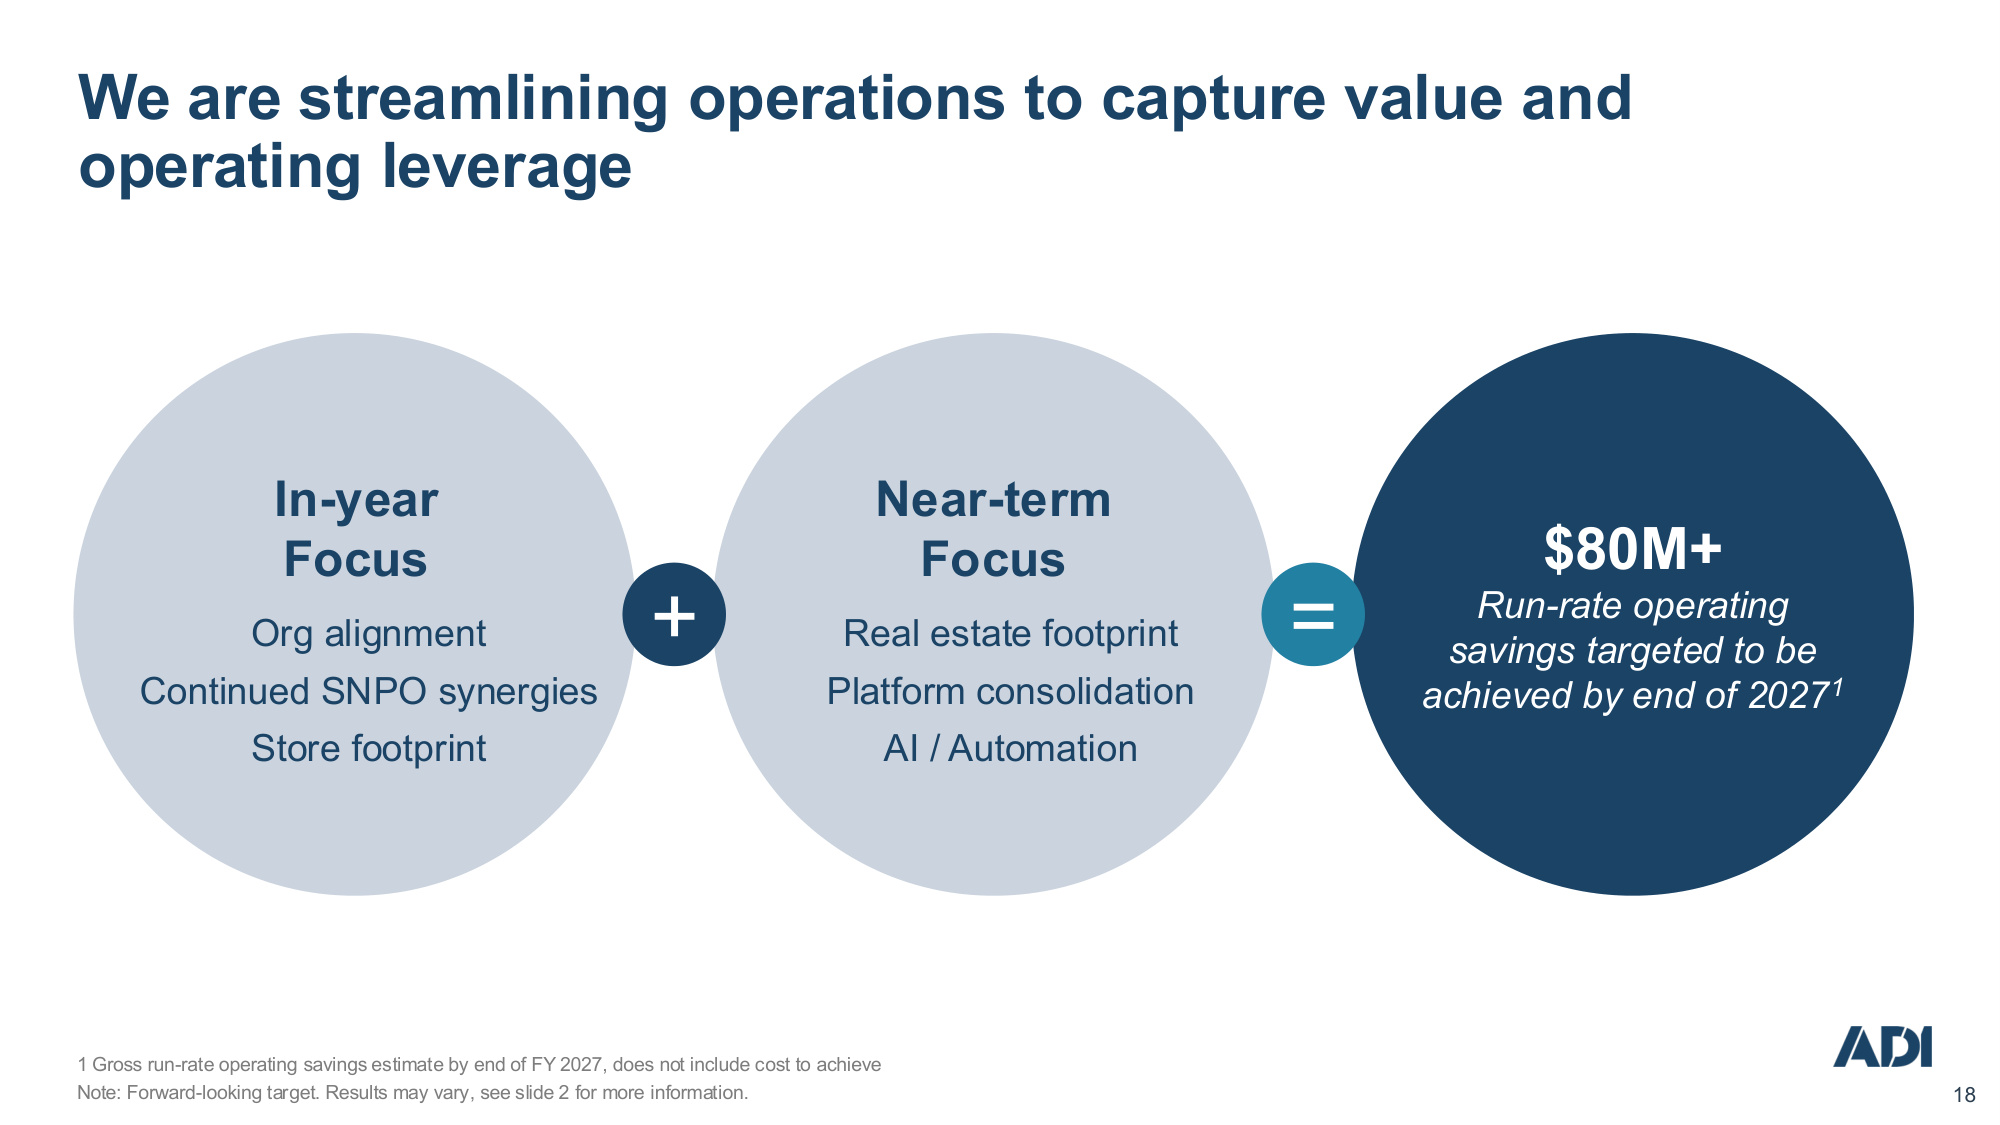
Company Confidential 18 18 + = $80M+ Run-rate operating savings targeted to be achieved by end of 20271 In-year Focus Near-term Focus Org alignment Continued SNPO synergies Store footprint Real estate footprint Platform consolidation AI / Automation 1 Gross run-rate operating savings estimate by end of FY 2027, does not include cost to achieve Note: Forward-looking target. Results may vary, see slide 2 for more information. We are streamlining operations to capture value and operating leverage
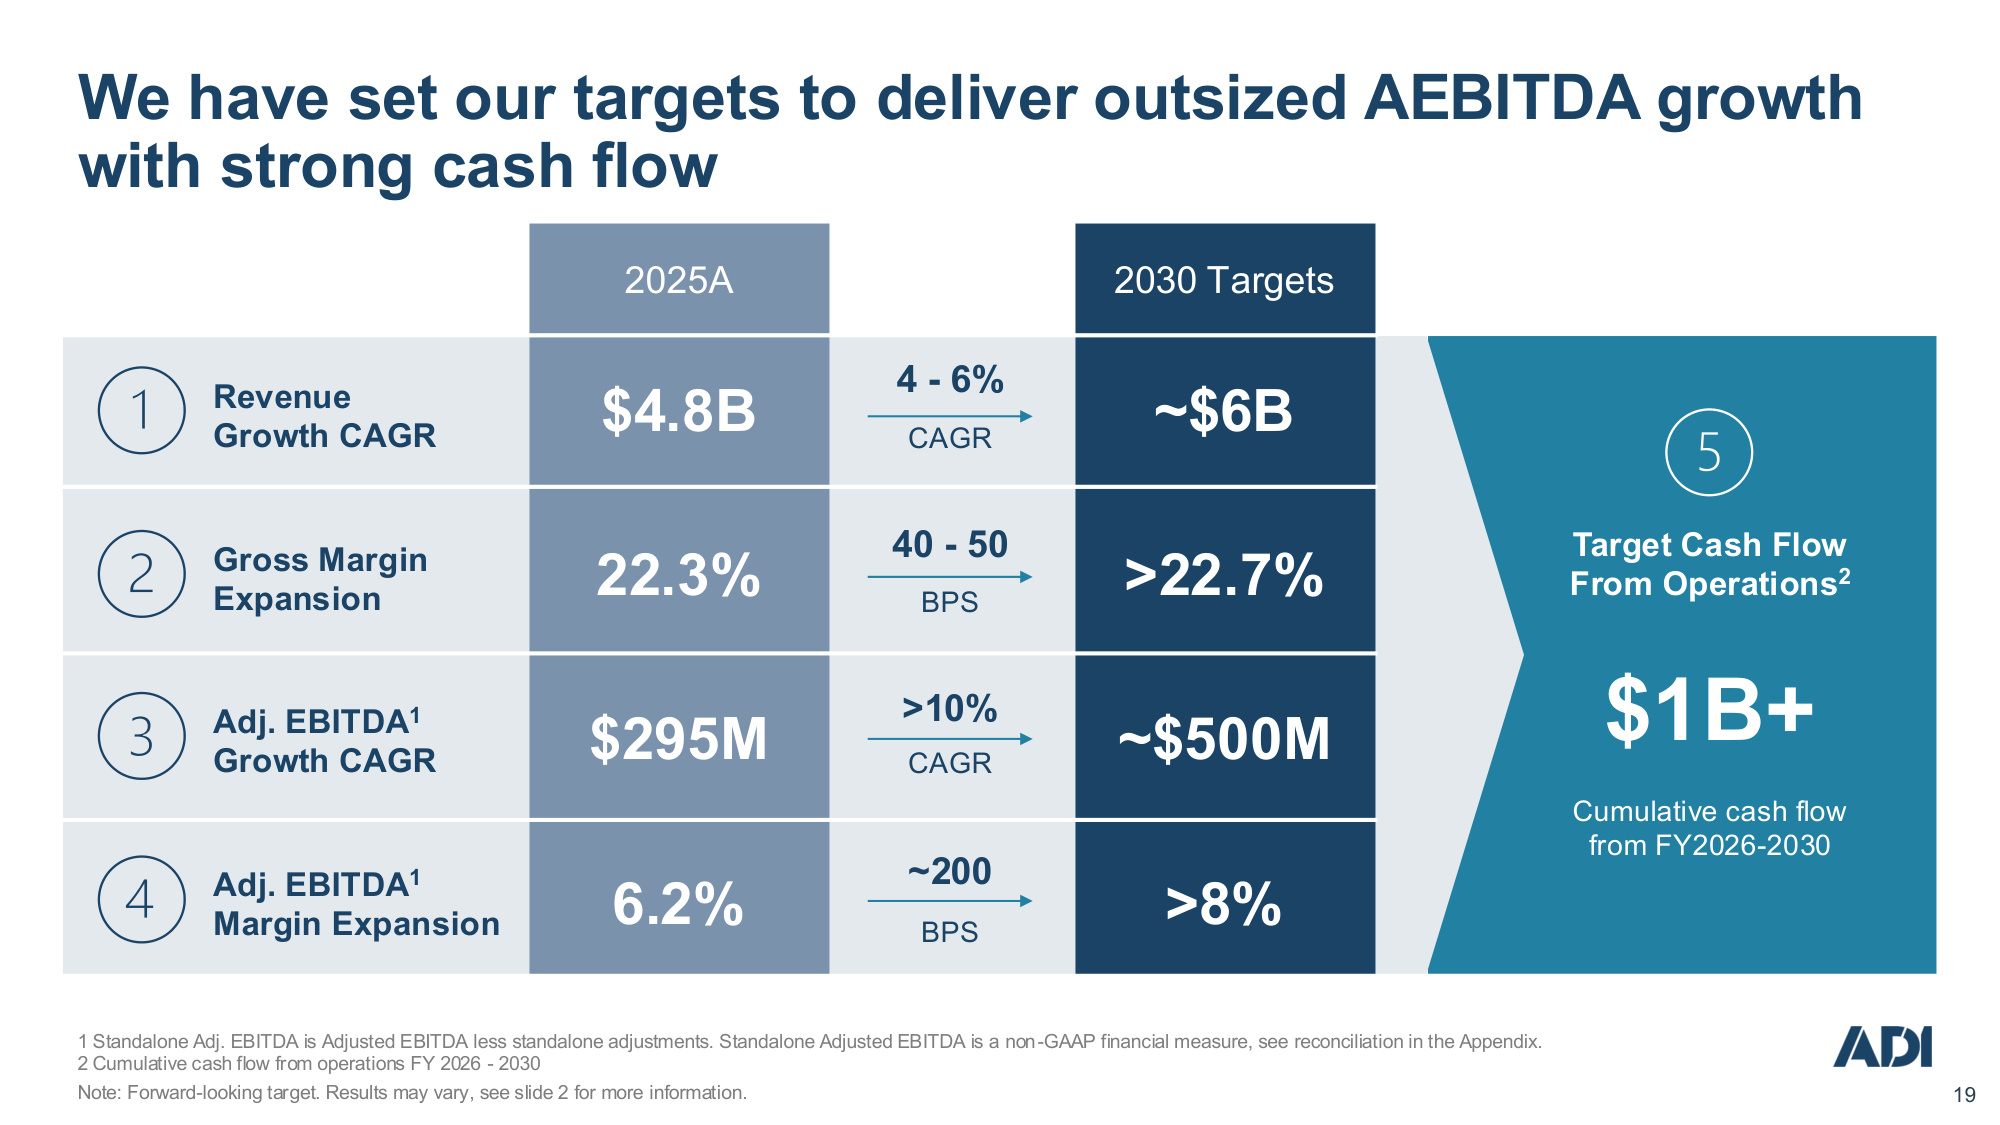
Company Confidential 19 19 1 Standalone Adj. EBITDA is Adjusted EBITDA less standalone adjustments. Standalone Adjusted EBITDA is a non-GAAP financial measure, see reconciliation in the Appendix. 2 Cumulative cash flow from operations FY 2026 - 2030 Note: Forward-looking target. Results may vary, see slide 2 for more information. We have set our targets to deliver outsized AEBITDA growth with strong cash flow $1B+ 2025A 2030 Targets Adj. EBITDA1 Growth CAGR Revenue Growth CAGR Gross Margin Expansion ~$6B $4.8B >22.7% 22.3% ~$500M $295M Adj. EBITDA1 Margin Expansion >8% 6.2% 4 - 6% CAGR 40 - 50 BPS >10% CAGR ~200 BPS Cumulative cash flow from FY2026-2030 Target Cash Flow From Operations2

Company Confidential 20 20 Rob Aarnes President & CEO 20+ years Mike Carlet Chief Financial Officer Allie Copeland Chief Operating Officer Stu Tisdale Chief Digital Experience Officer Jeannine Lane General Counsel James Olender Chief Information Officer Marco Cardazzi Chief Merchandising Officer Leigh Ann Angelini Chief People Officer 20+ years 20+ years 25+ years 25+ years 30+ years 10+ years 20+ years 1 Industry experience defined as experience in distribution and/or with REZI / HON Years of Industry Experience1 Prior Experience Deep industry tenure and expertise are hallmarks of the ADI leadership team
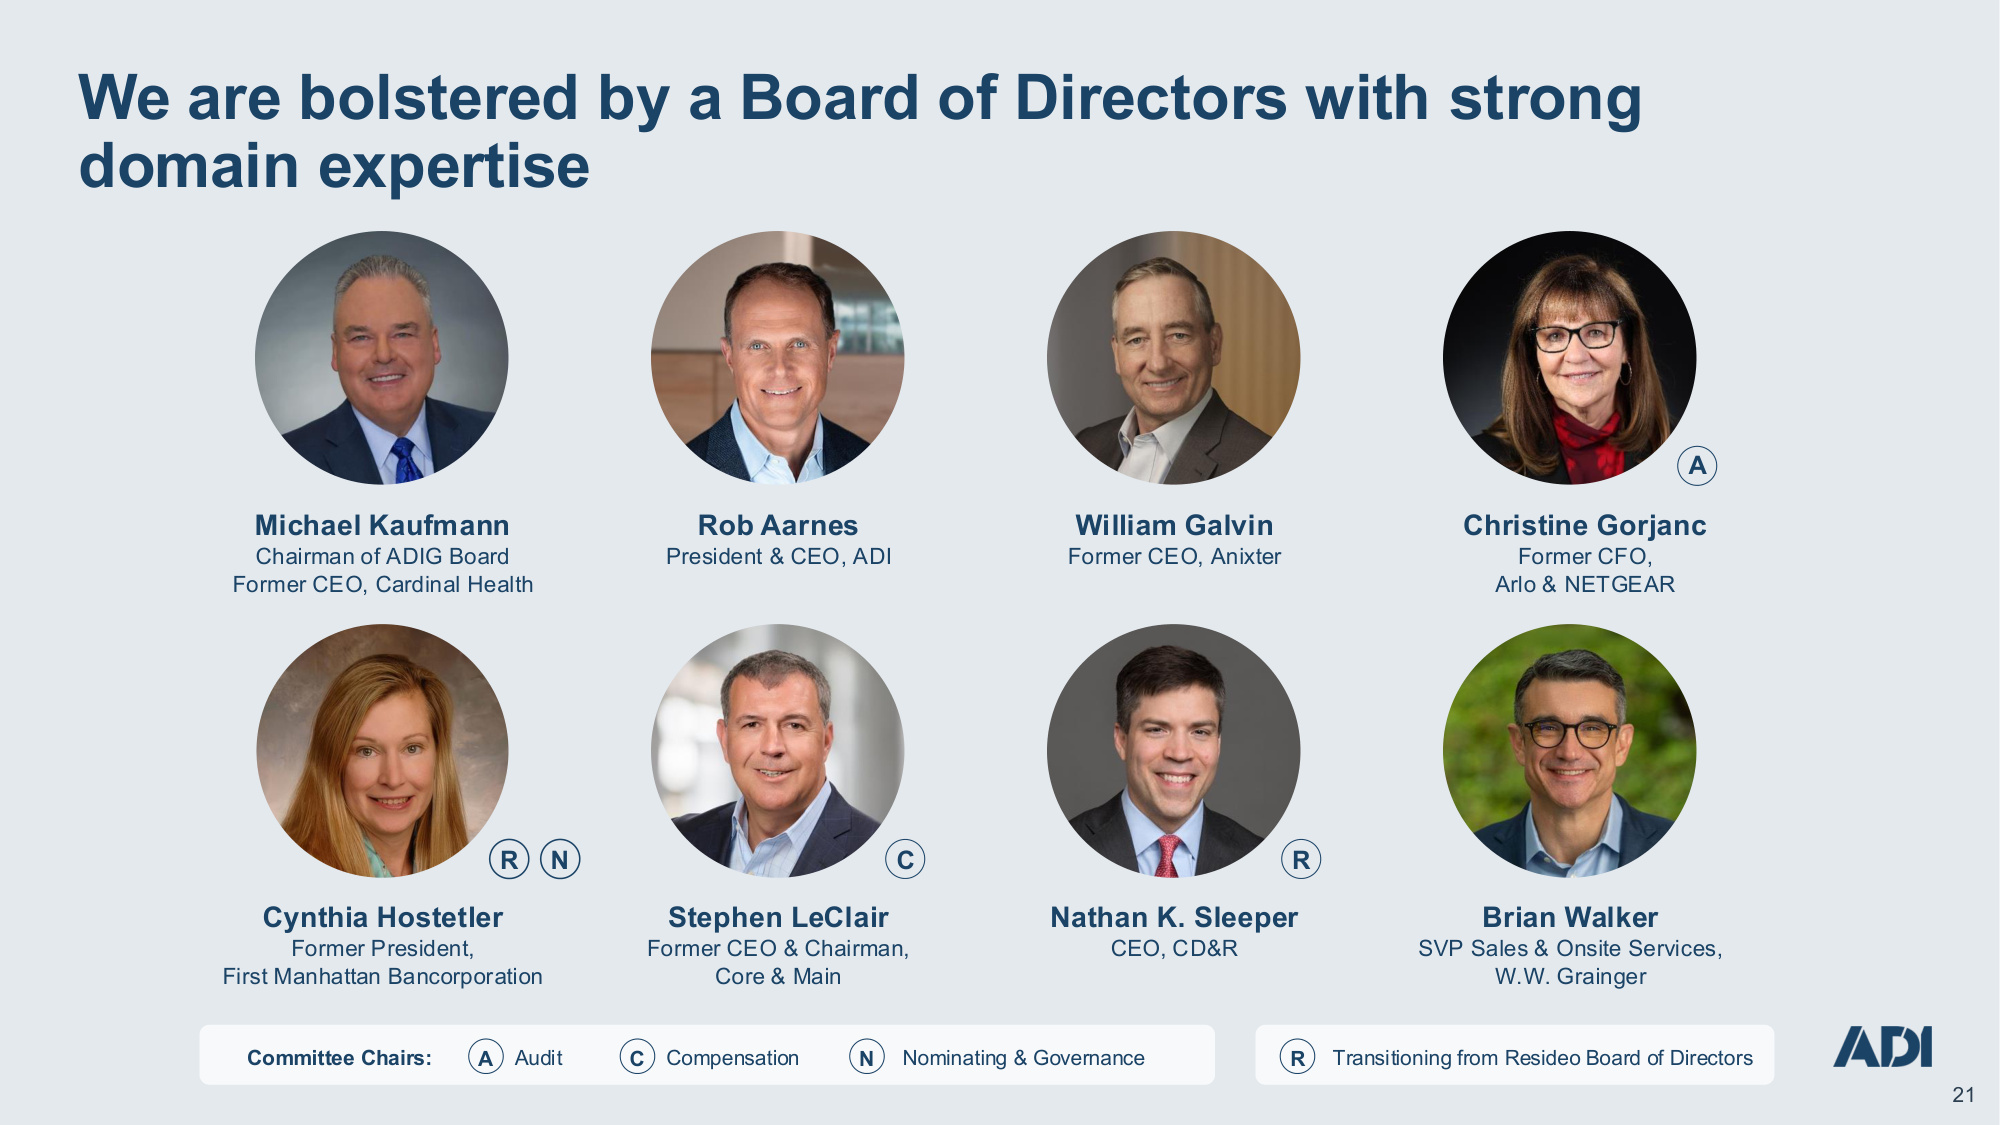
Company Confidential 21 21 We are bolstered by a Board of Directors with strong domain expertise 21 Rob Aarnes President & CEO, ADI Michael Kaufmann Chairman of ADIG Board Former CEO, Cardinal Health Christine Gorjanc Former CFO, Arlo & NETGEAR Brian Walker SVP Sales & Onsite Services, W.W. Grainger William Galvin Former CEO, Anixter Cynthia Hostetler Former President, First Manhattan Bancorporation Nathan K. Sleeper CEO, CD&R Stephen LeClair Former CEO & Chairman, Core & Main A C N R R A C N R Audit Compensation Nominating & Governance Transitioning from Resideo Board of Directors Committee Chairs:
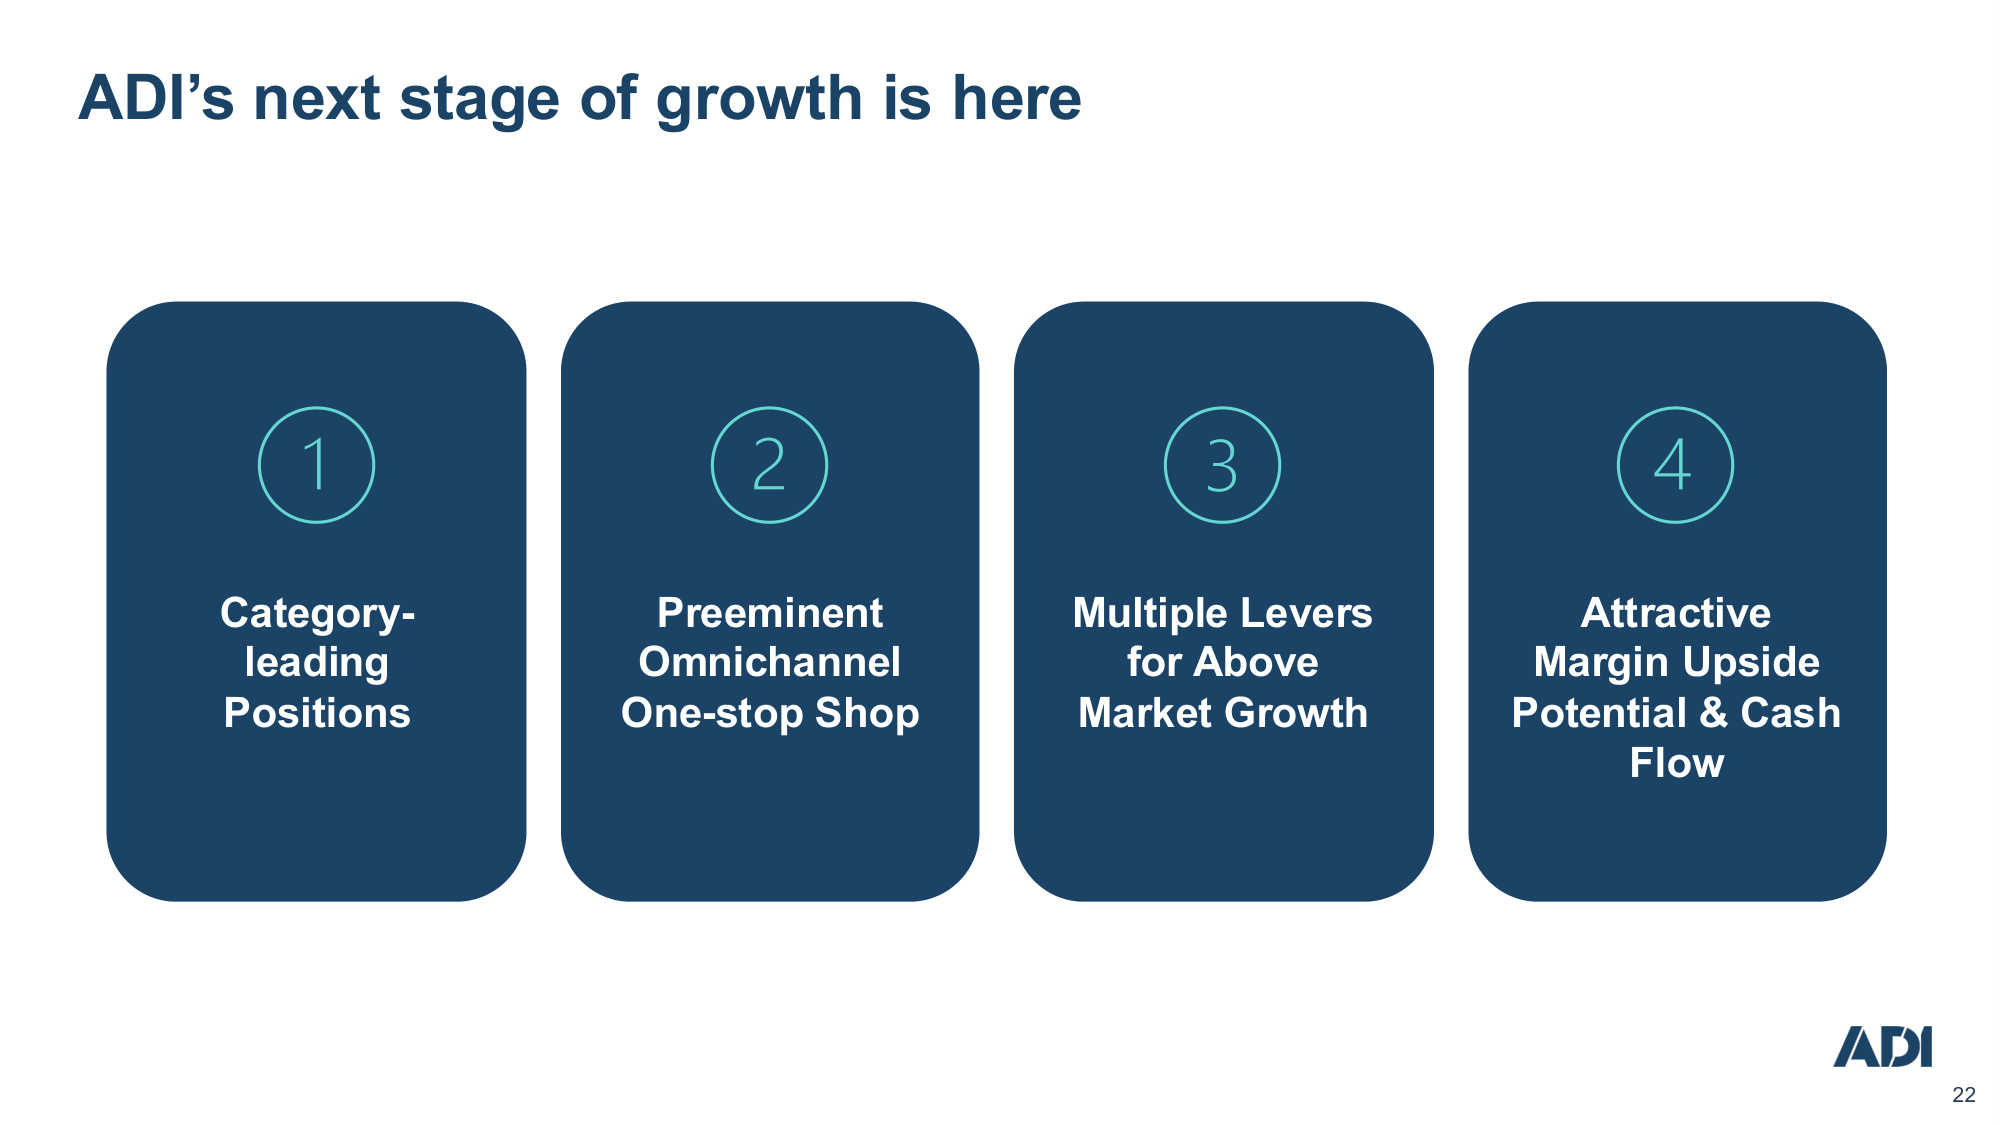
Company Confidential 22 22 Category- leading Positions Preeminent Omnichannel One-stop Shop Multiple Levers for Above Market Growth Attractive Margin Upside Potential & Cash Flow ADI's next stage of growth is here

Company Confidential 23 23 Marco Cardazzi SVP, Chief Merchandising Officer Products and Solutions for Pros Be the catalyst for growth for Pros and suppliers 23
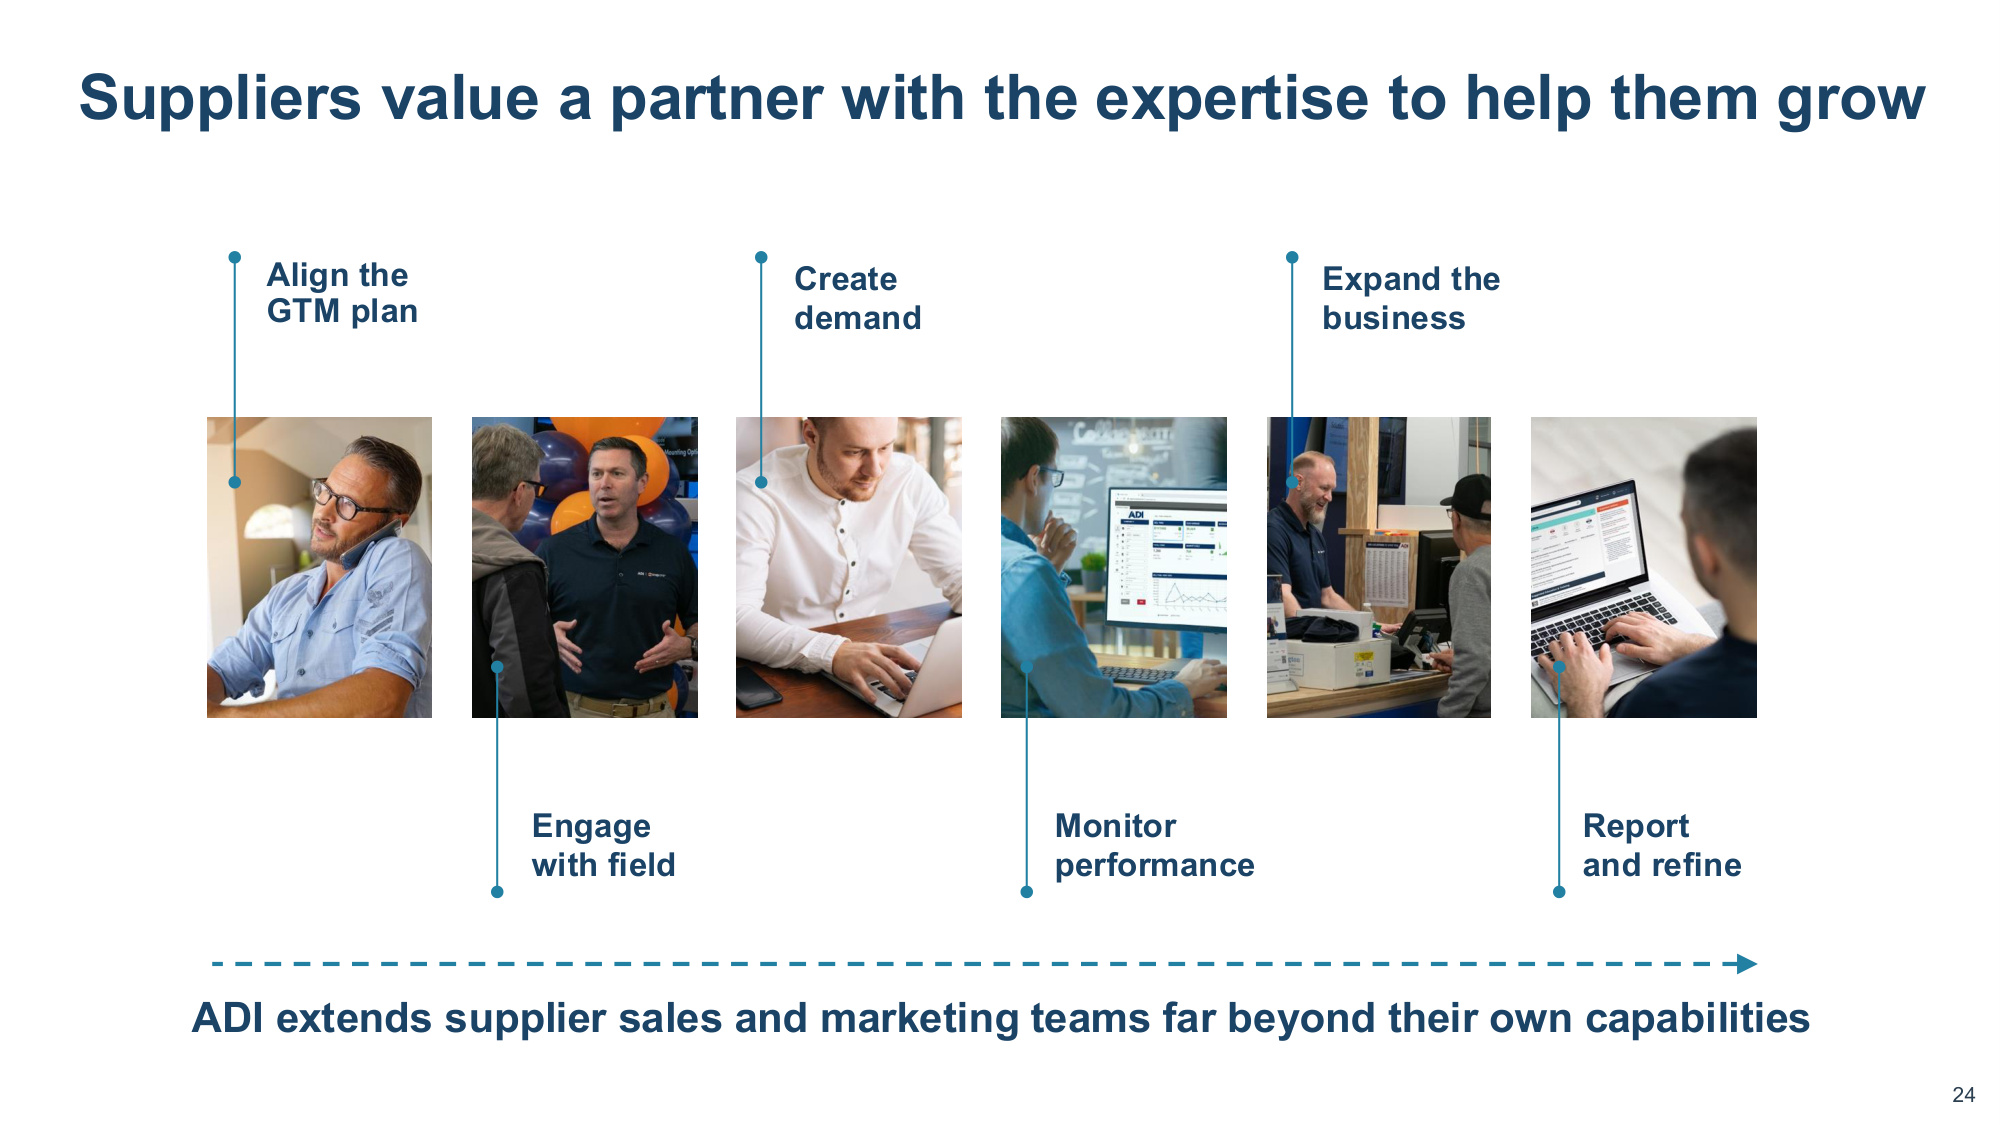
Company Confidential 24 24 ADI extends supplier sales and marketing teams far beyond their own capabilities Align the GTM plan Engage with field Monitor performance Create demand Expand the business Report and refine Suppliers value a partner with the expertise to help them grow
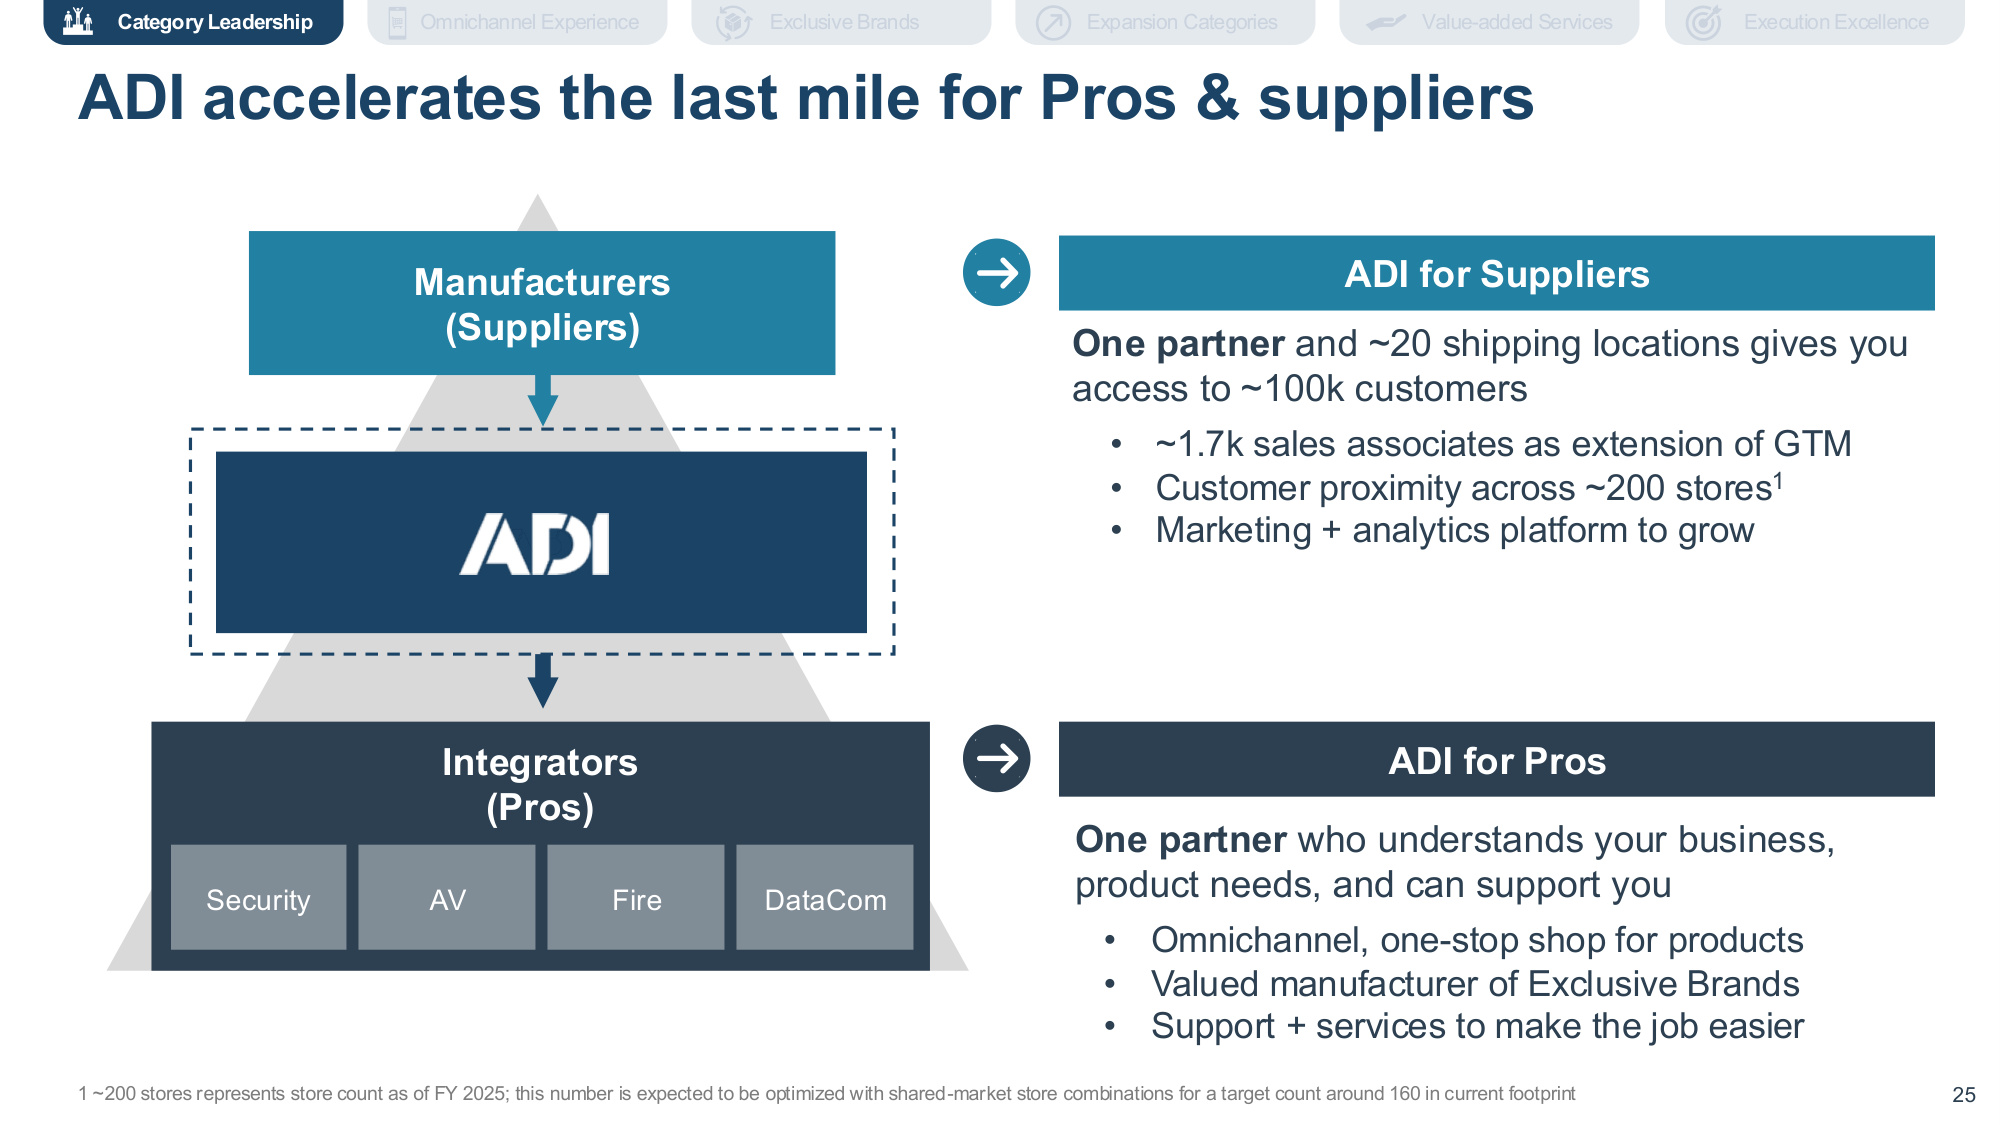
Company Confidential 25 25 Manufacturers (Suppliers) Integrators (Pros) Security AV DataCom Fire ADI for Suppliers ADI for Pros One partner and ~20 shipping locations gives you access to ~100k customers • ~1.7k sales associates as extension of GTM • Customer proximity across ~200 stores1 • Marketing + analytics platform to grow One partner who understands your business, product needs, and can support you • Omnichannel, one-stop shop for products • Valued manufacturer of Exclusive Brands • Support + services to make the job easier ADI accelerates the last mile for Pros & suppliers 1 ~200 stores represents store count as of FY 2025; this number is expected to be optimized with shared-market store combinations for a target count around 160 in current footprint Execution Excellence Expansion Categories Exclusive Brands Value-added Services Omnichannel Experience Category Leadership
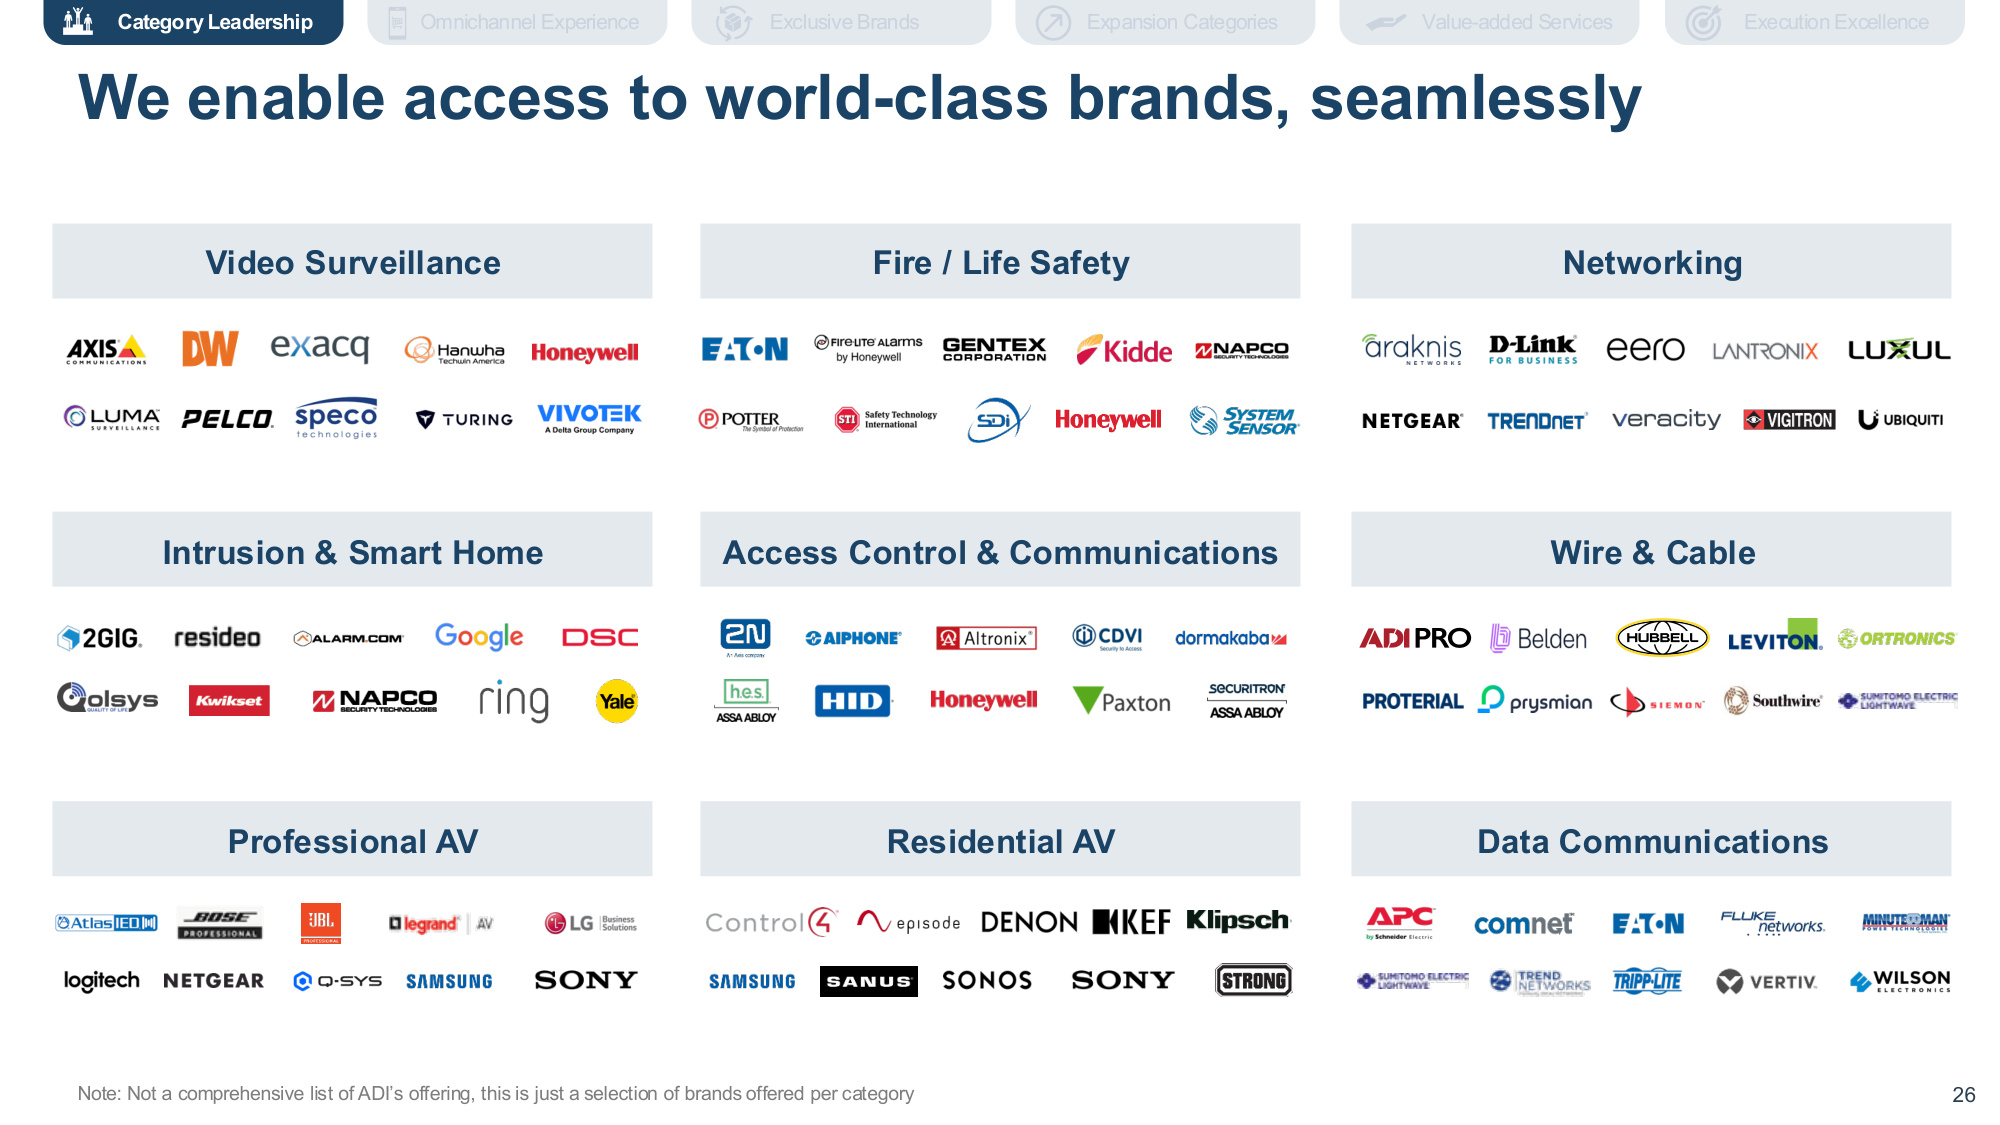
Company Confidential 26 26 Intrusion & Smart Home Video Surveillance Professional AV Fire / Life Safety Access Control & Communications Residential AV Data Communications Wire & Cable Networking We enable access to world-class brands, seamlessly Execution Excellence Expansion Categories Exclusive Brands Value-added Services Omnichannel Experience Category Leadership Note: Not a comprehensive list of ADI's offering, this is just a selection of brands offered per category
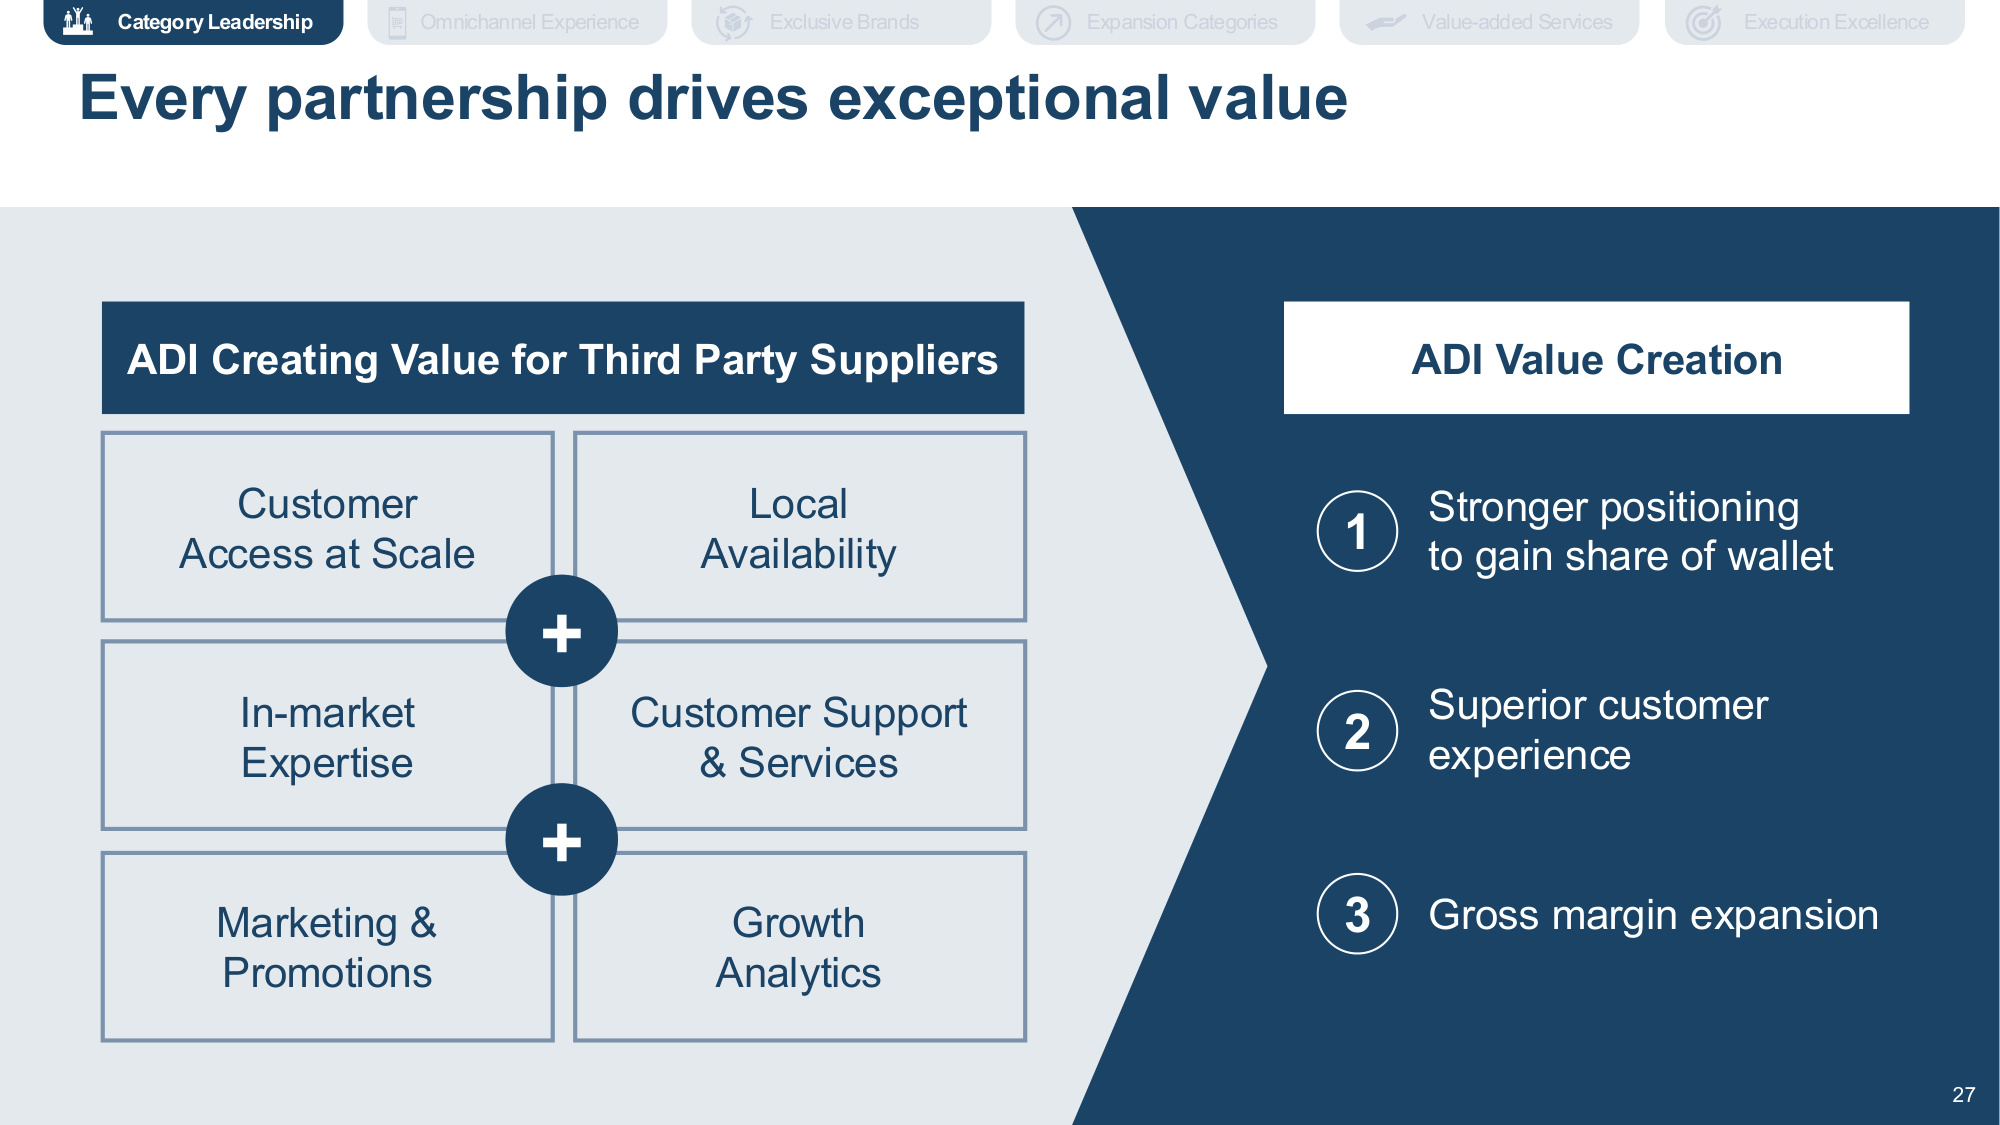
Company Confidential 27 27 Customer Access at Scale Local Availability Customer Support & Services Marketing & Promotions ADI Creating Value for Third Party Suppliers Gross margin expansion Superior customer experience ADI Value Creation In-market Expertise Growth Analytics Stronger positioning to gain share of wallet + + Every partnership drives exceptional value 1 2 3 27 Category Leadership Execution Excellence Expansion Categories Exclusive Brands Value-added Services Omnichannel Experience
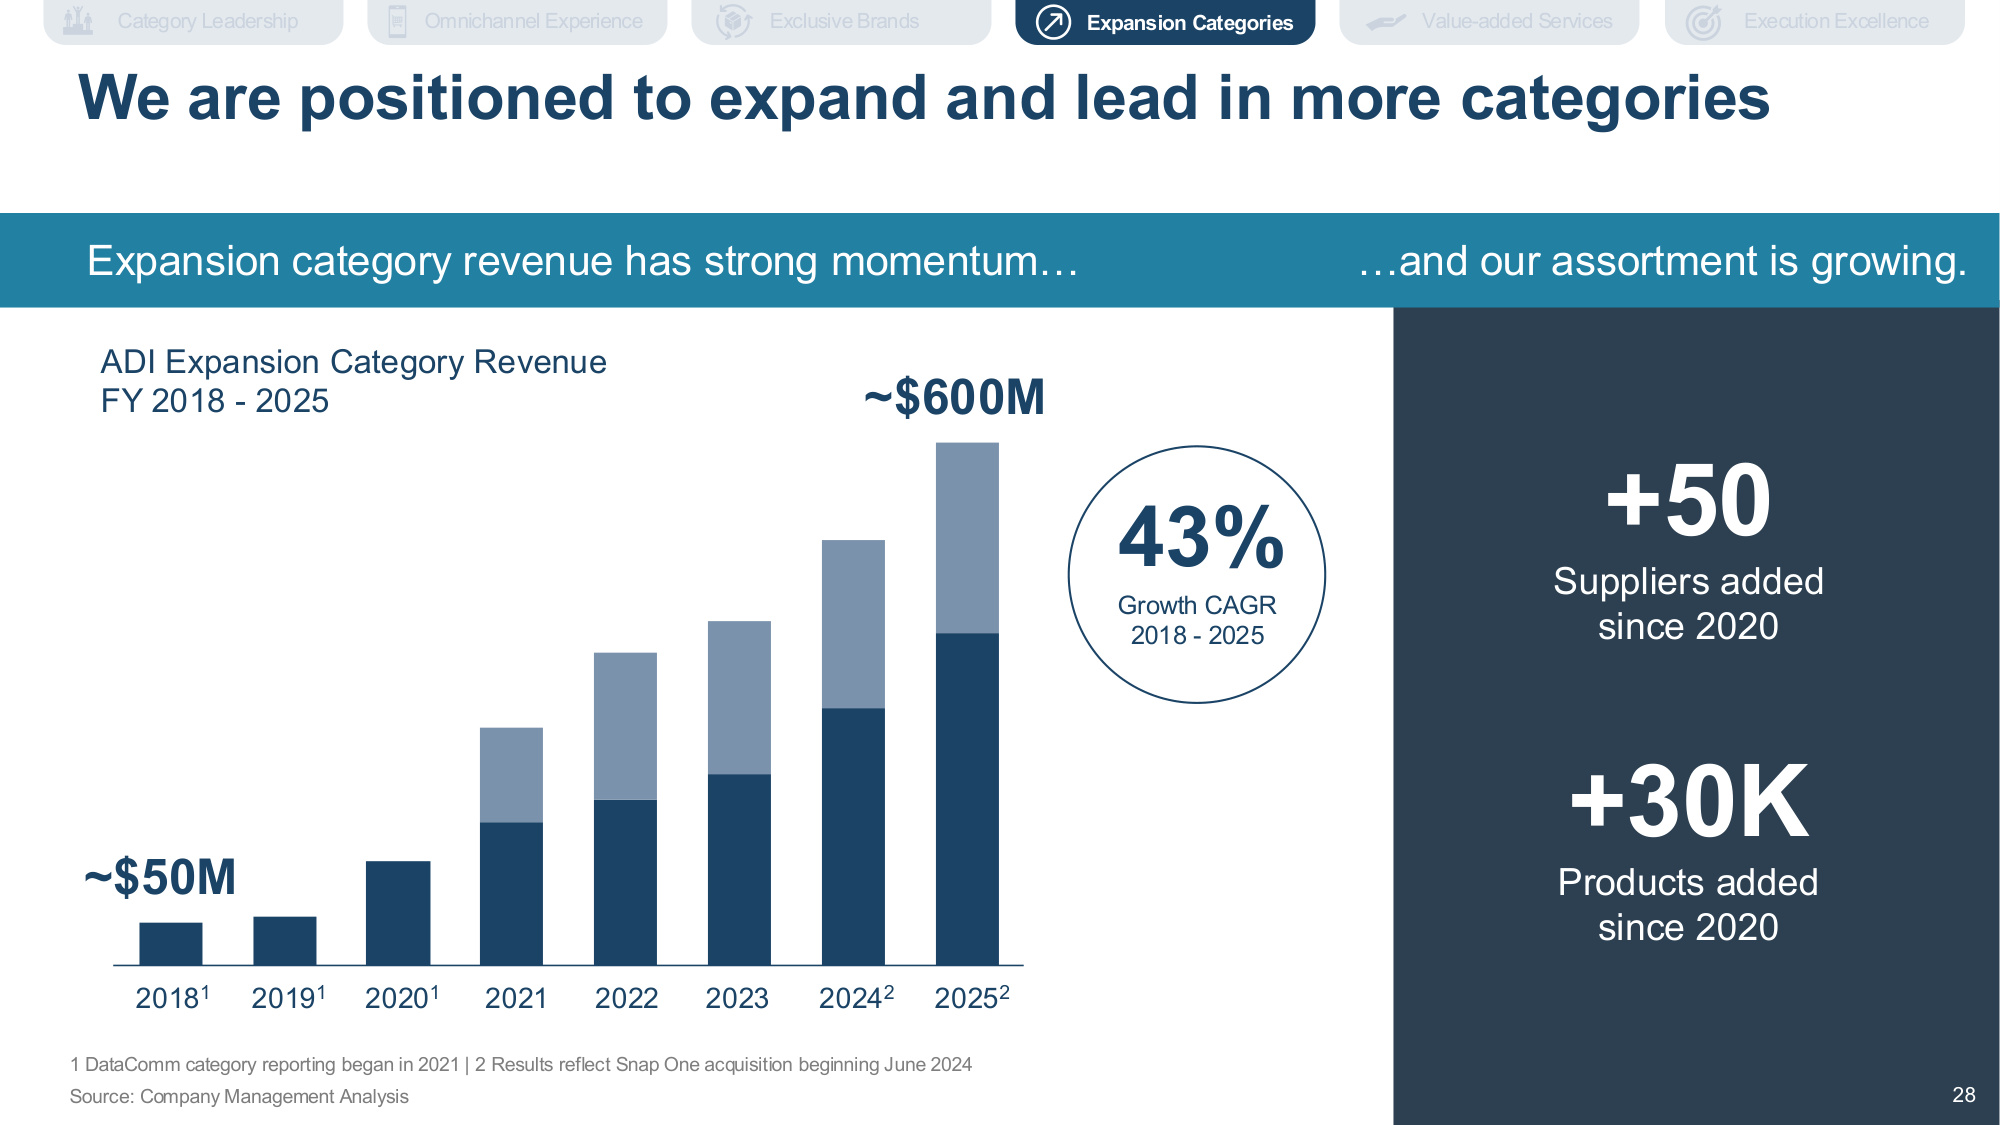
Company Confidential 28 28 20181 20191 20201 2021 2022 2023 20242 20252 ADI Expansion Category Revenue FY 2018 - 2025 ~$50M ~$600M Growth CAGR 2018 - 2025 43% Source: Company Management Analysis Expansion category revenue has strong momentum... ...and our assortment is growing. +50 Suppliers added since 2020 +30K Products added since 2020 We are positioned to expand and lead in more categories 28 1 DataComm category reporting began in 2021 | 2 Results reflect Snap One acquisition beginning June 2024 Execution Excellence Expansion Categories Exclusive Brands Value-added Services Category Leadership Omnichannel Experience
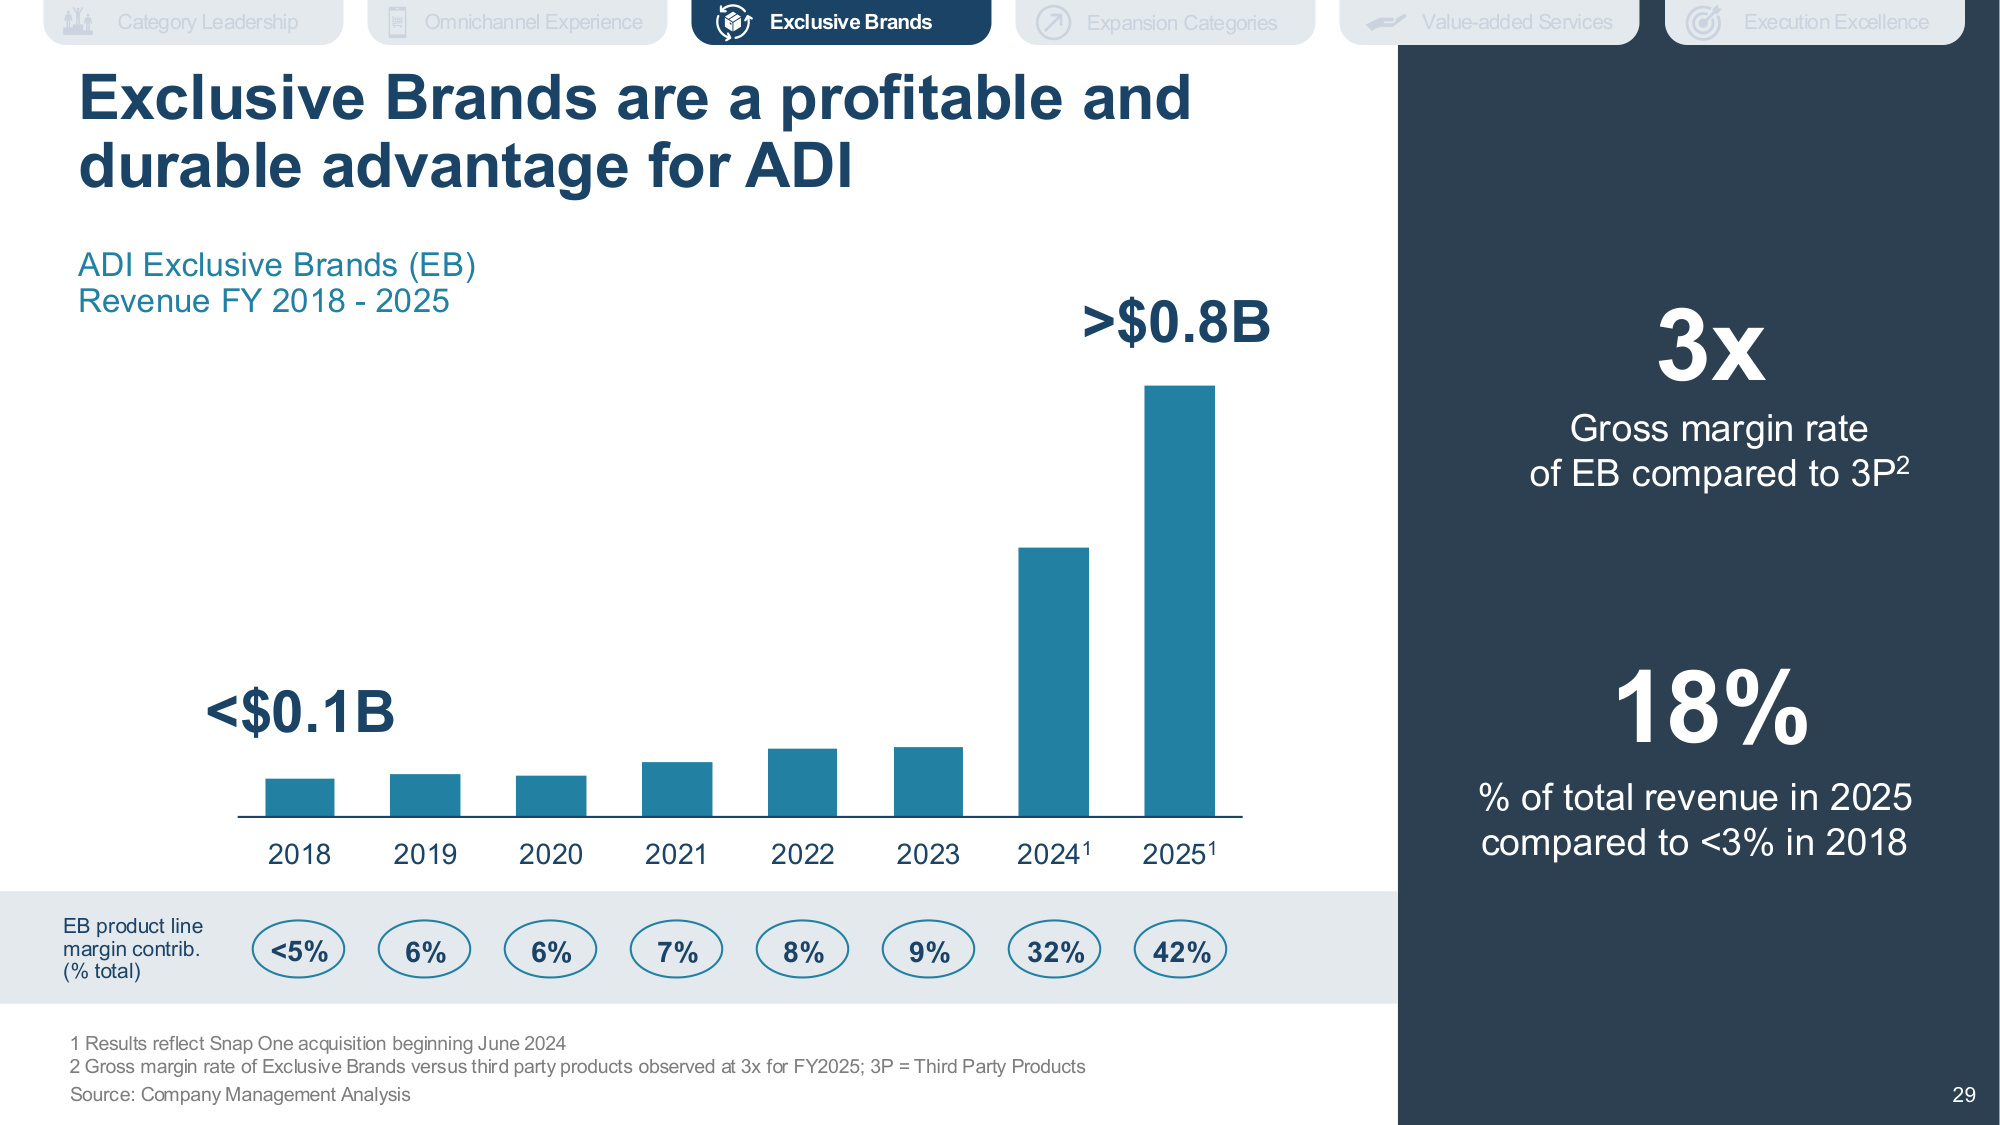
Company Confidential 29 29 % of total revenue in 2025 compared to <3% in 2018 18% Gross margin rate of EB compared to 3P2 3x Source: Company Management Analysis ADI Exclusive Brands (EB) Revenue FY 2018 - 2025 2018 2019 2020 2021 2022 2023 20241 20251 <$0.1B >$0.8B <5% 6% 6% 7% 8% 9% 32% 42% EB product line margin contrib. (% total) 1 Results reflect Snap One acquisition beginning June 2024 2 Gross margin rate of Exclusive Brands versus third party products observed at 3x for FY2025; 3P = Third Party Products Exclusive Brands are a profitable and durable advantage for ADI 29 Execution Excellence Expansion Categories Exclusive Brands Value-added Services Omnichannel Experience Category Leadership
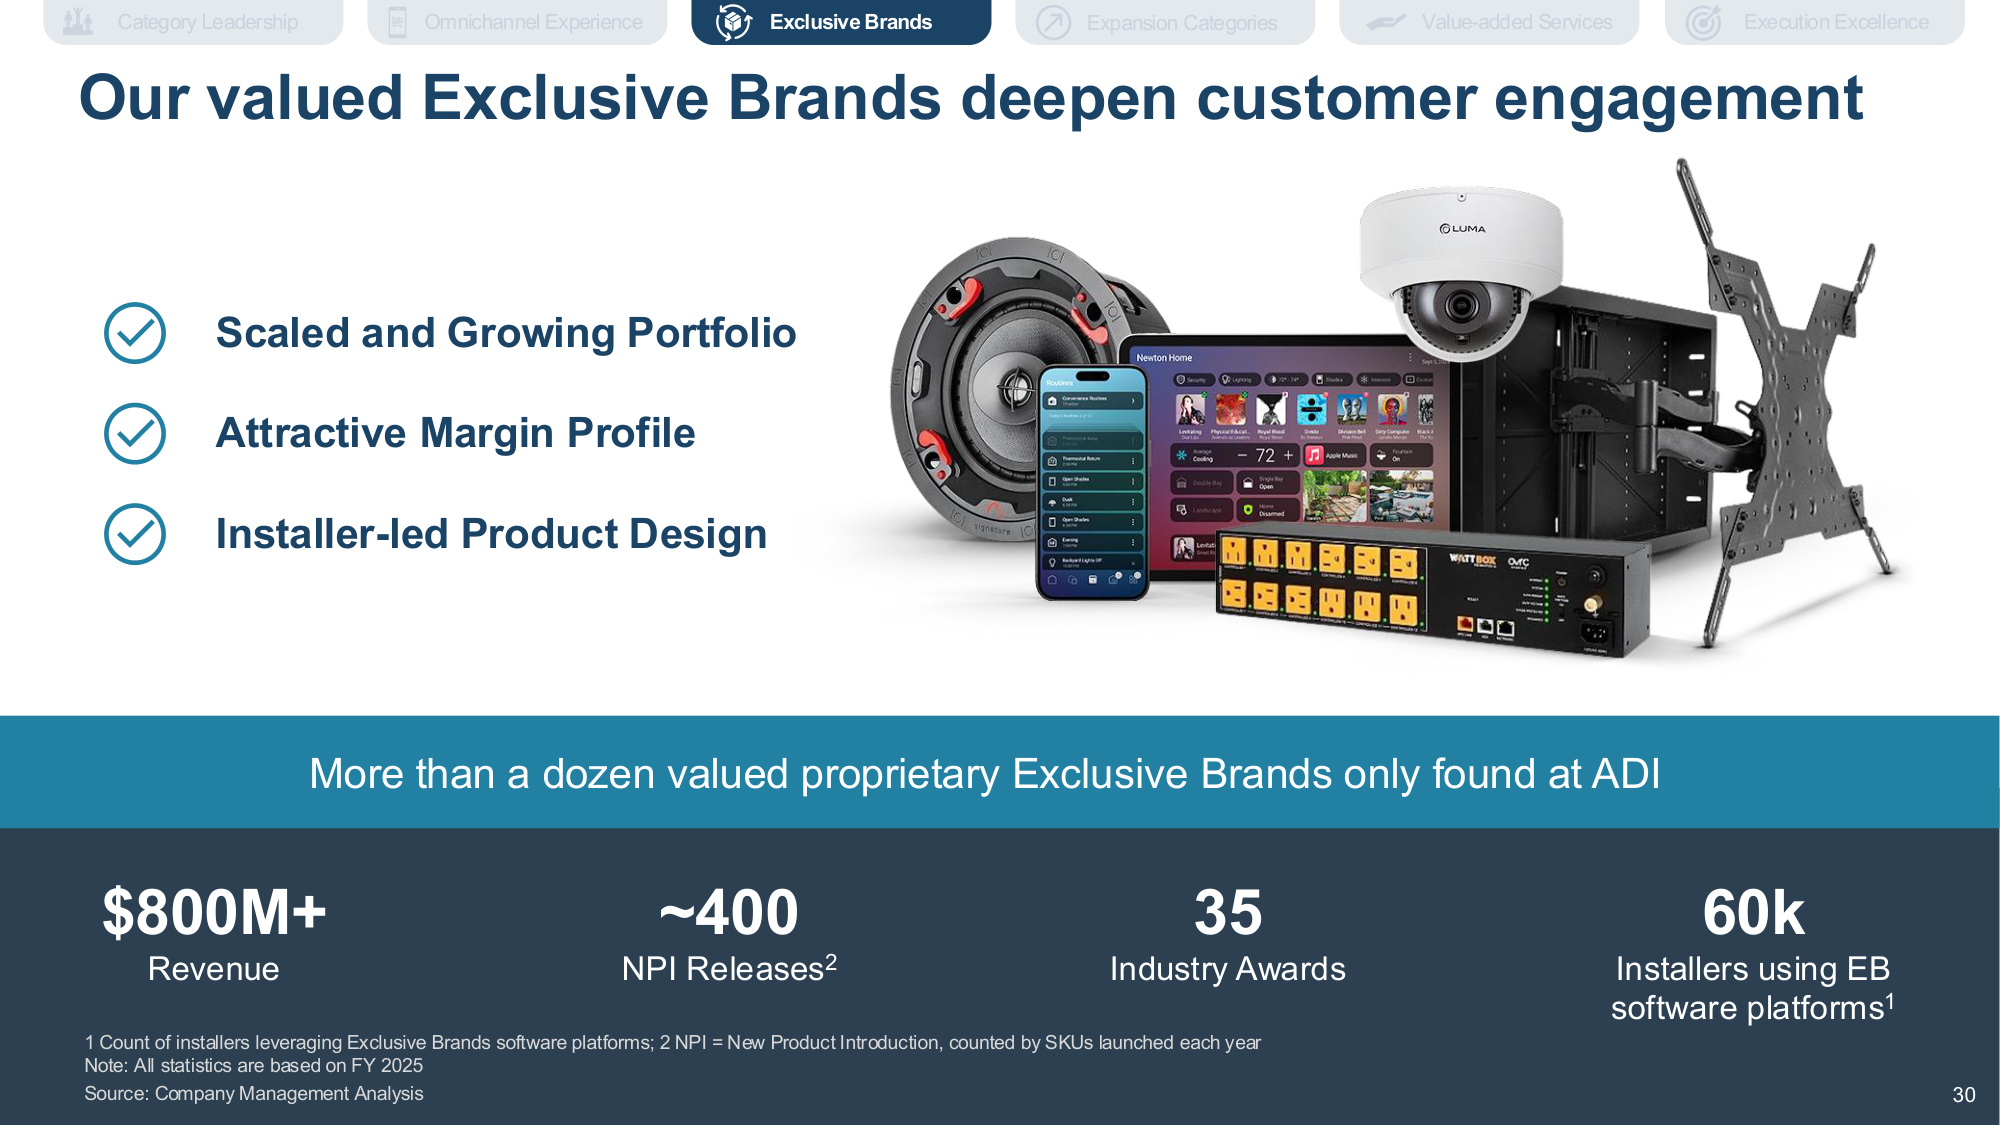
Company Confidential 30 30 60k Installers using EB software platforms1 35 Industry Awards ~400 NPI Releases2 $800M+ Revenue More than a dozen valued proprietary Exclusive Brands only found at ADI Scaled and Growing Portfolio Attractive Margin Profile Installer-led Product Design 1 Count of installers leveraging Exclusive Brands software platforms; 2 NPI = New Product Introduction, counted by SKUs launched each year Note: All statistics are based on FY 2025 Source: Company Management Analysis Our valued Exclusive Brands deepen customer engagement 30 Execution Excellence Expansion Categories Exclusive Brands Value-added Services Omnichannel Experience Category Leadership
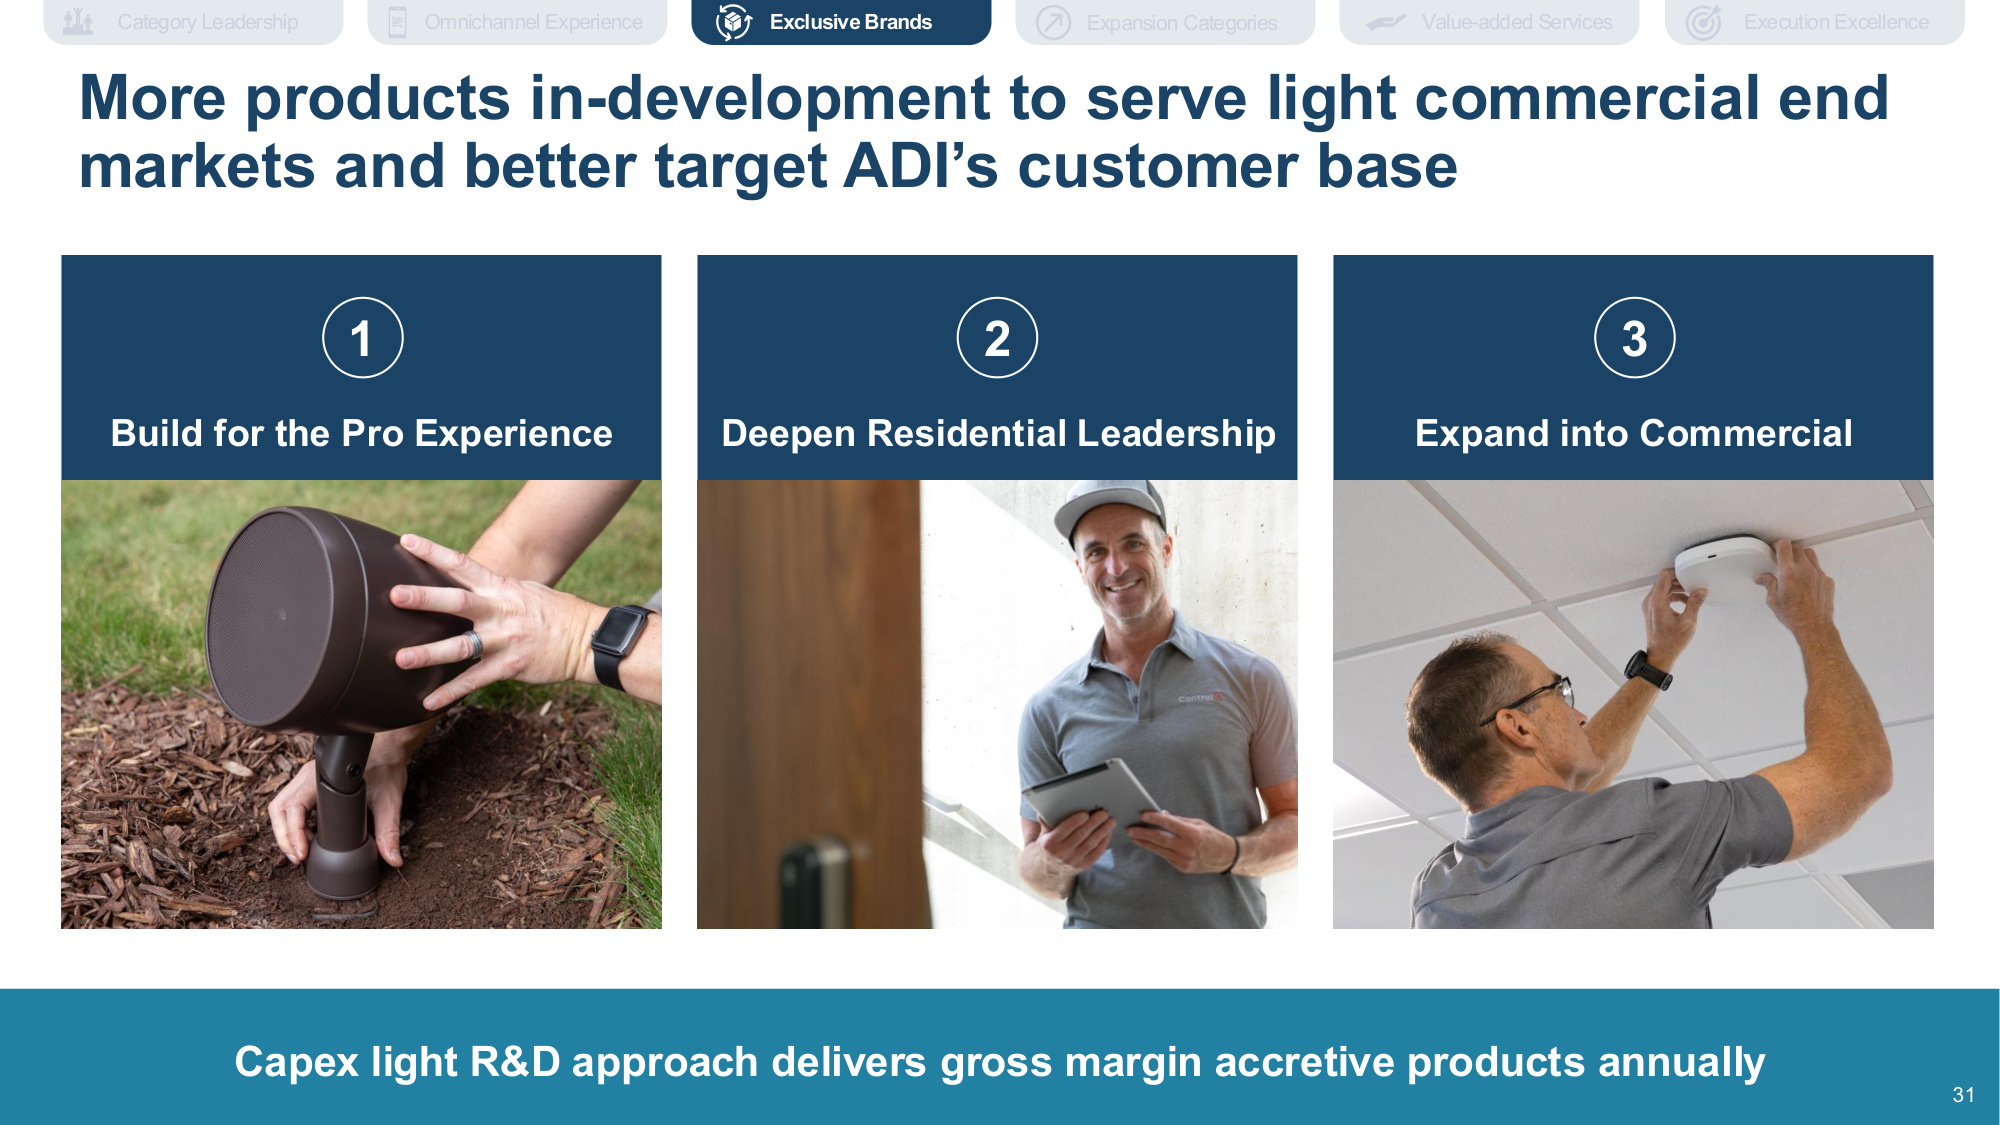
Company Confidential 31 31 Build for the Pro Experience Deepen Residential Leadership Expand into Commercial Capex light R&D approach delivers gross margin accretive products annually 1 2 3 31 More products in-development to serve light commercial end markets and better target ADI's customer base Innovation Execution Excellence Expansion Categories Exclusive Brands Value-added Services Omnichannel Experience Category Leadership
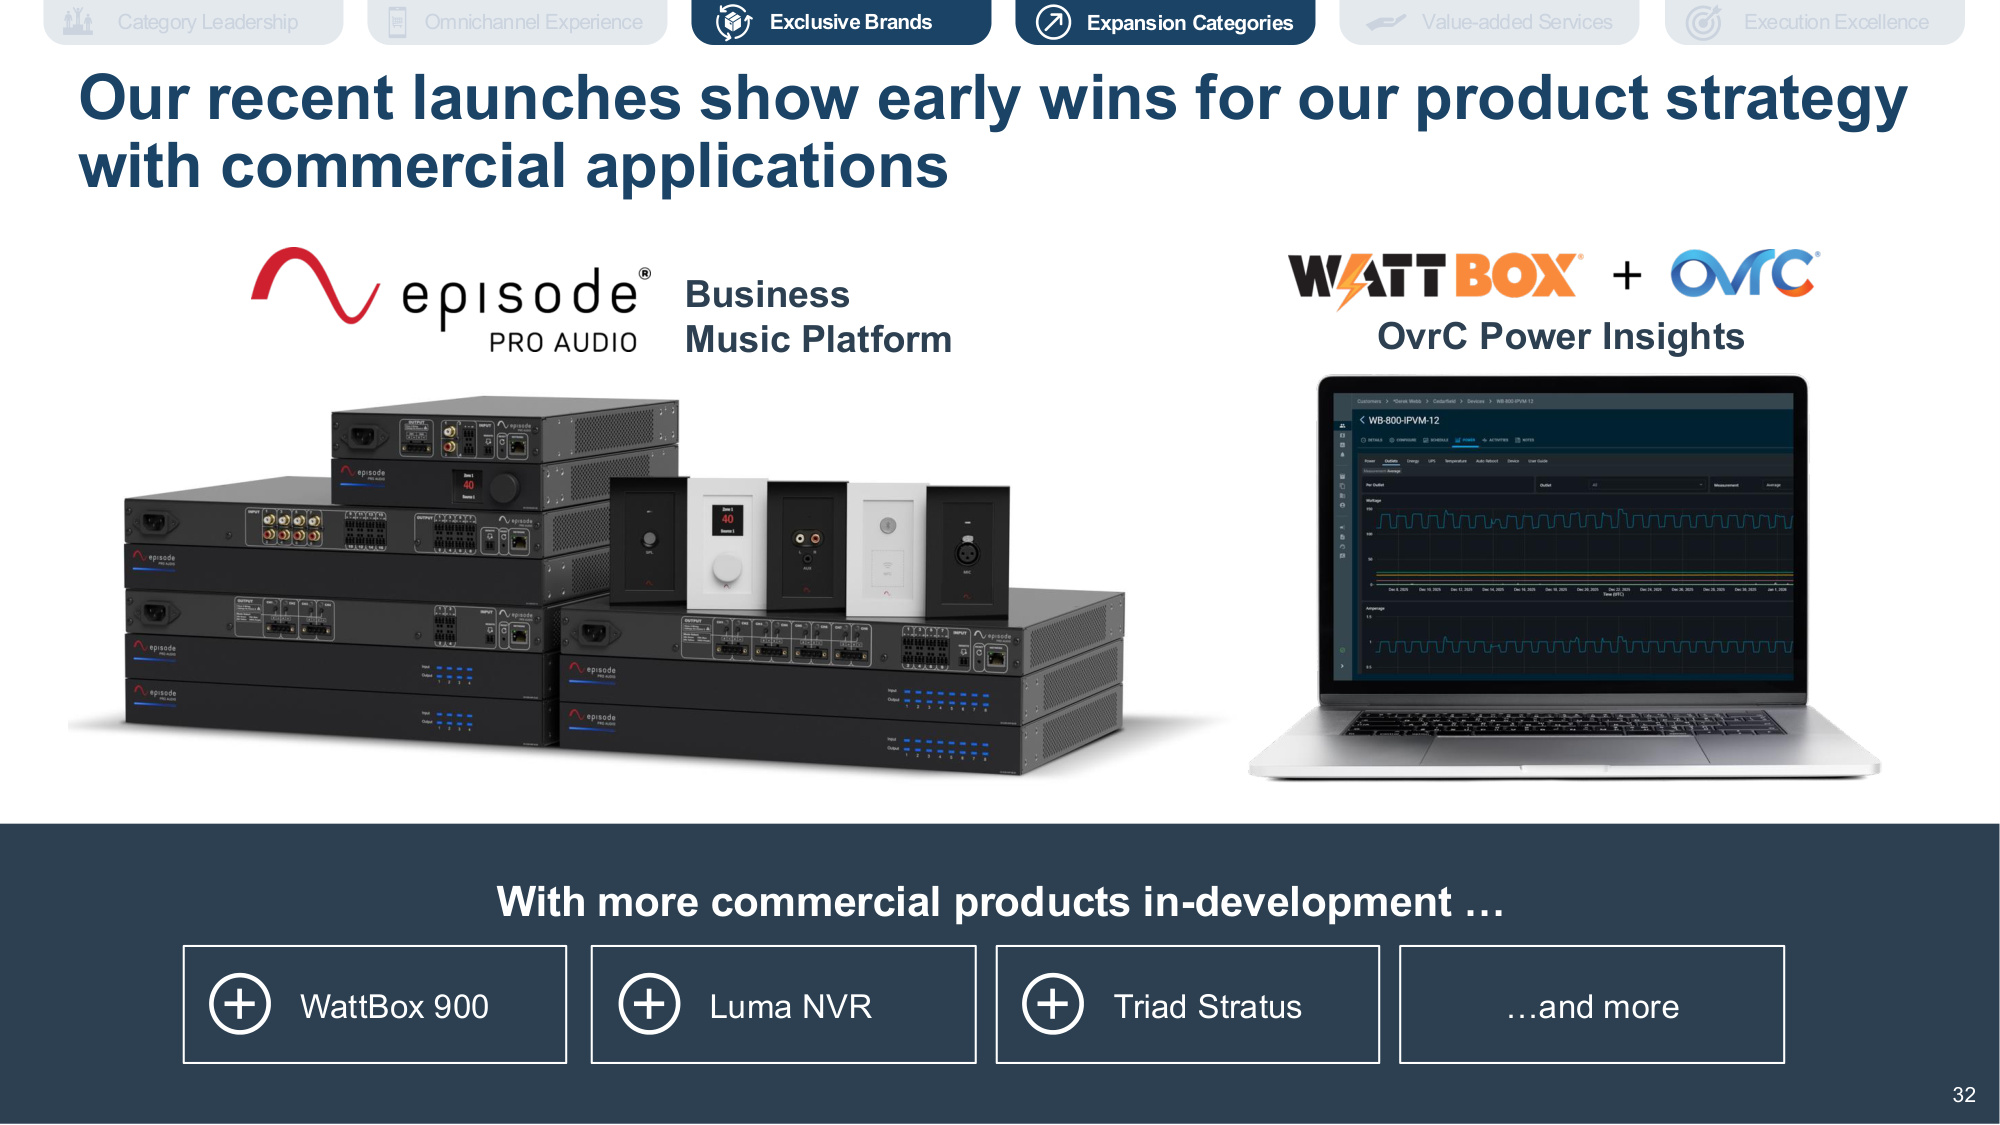
Company Confidential 32 32 Business Music Platform OvrC Power Insights With more commercial products in-development ... WattBox 900 Triad Stratus Luma NVR ...and more 32 Our recent launches show early wins for our product strategy with commercial applications Expansion Categories Execution Excellence Exclusive Brands Value-added Services Omnichannel Experience Category Leadership
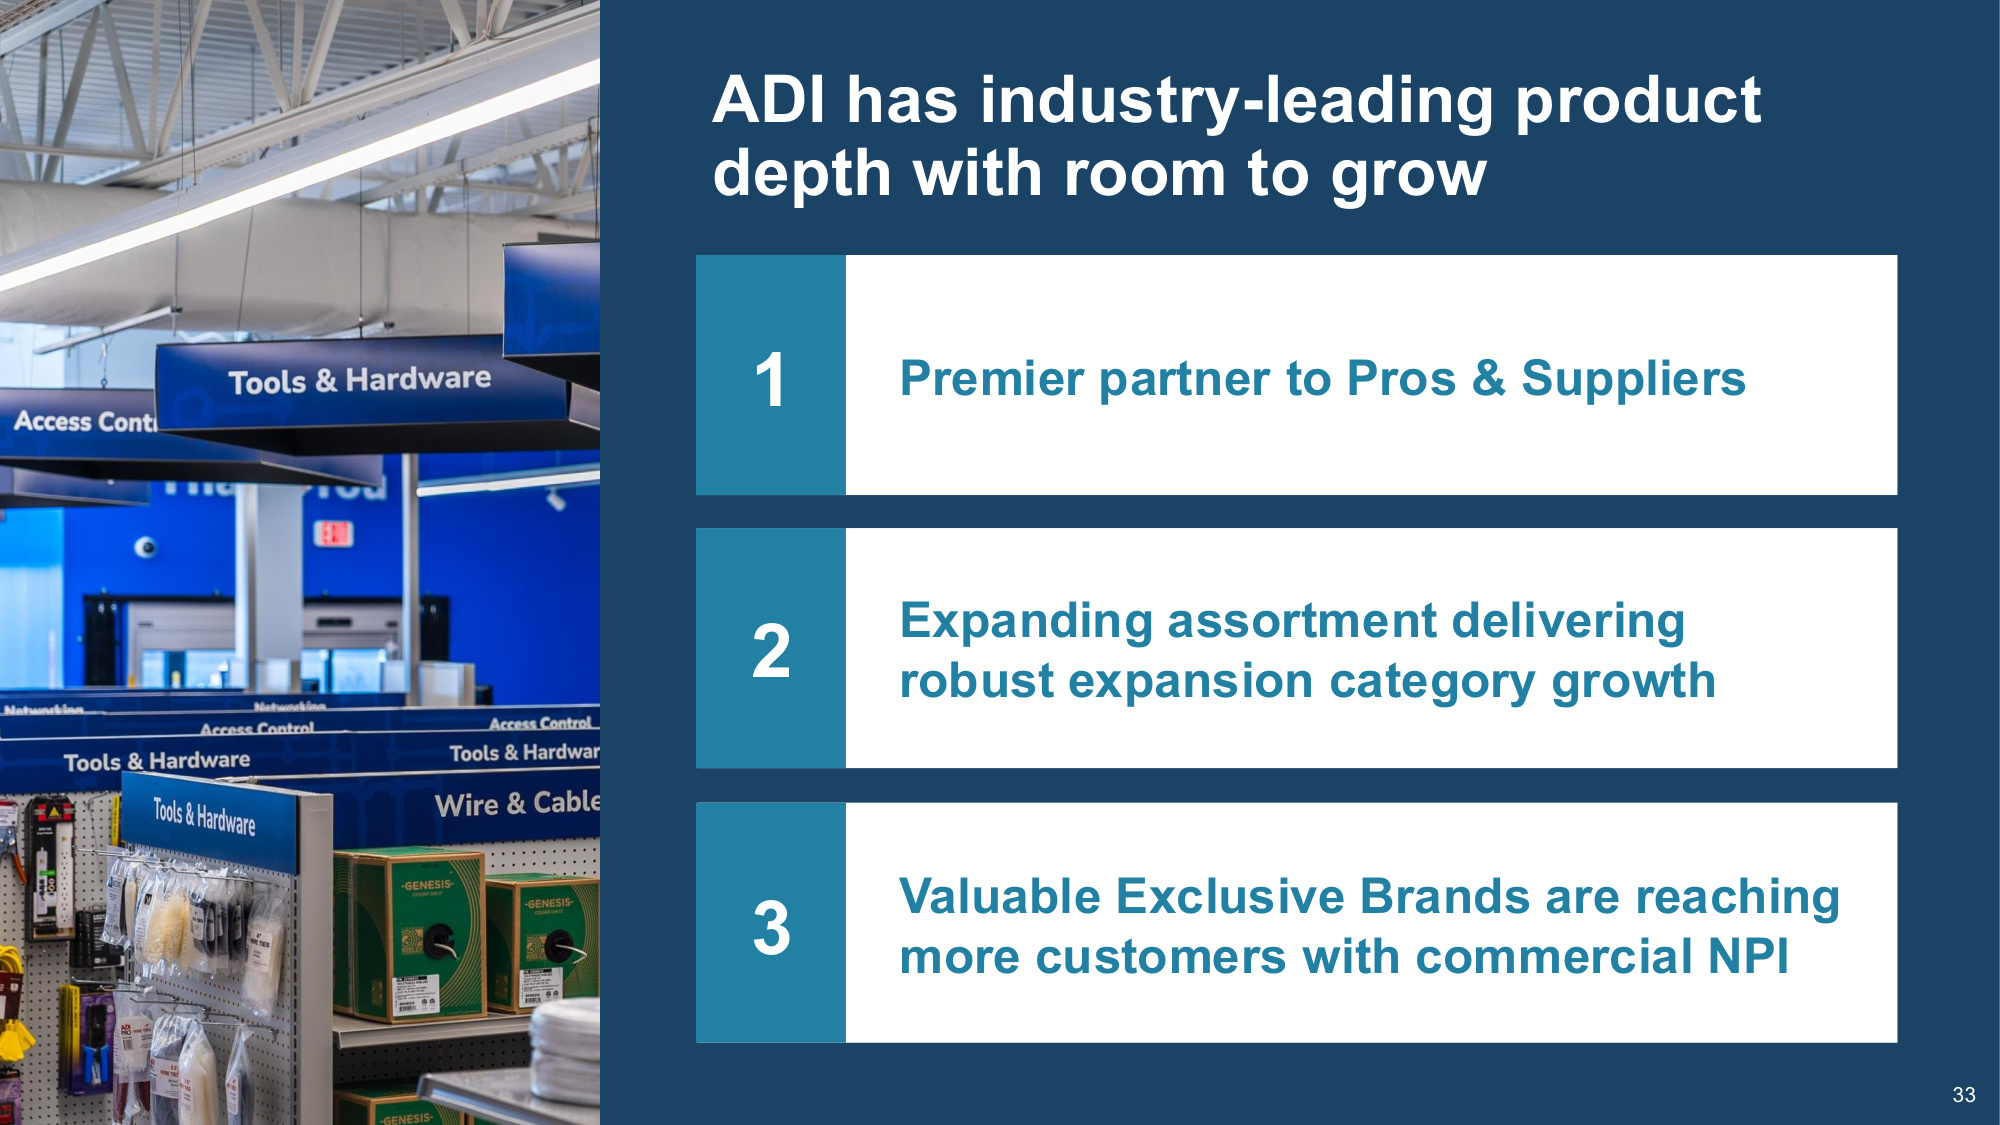
Company Confidential 33 33 c Premier partner to Pros & Suppliers Expanding assortment delivering robust expansion category growth Valuable Exclusive Brands are reaching more customers with commercial NPI 1 2 3 ADI has industry-leading product depth with room to grow

Company Confidential 34 34 Stu Tisdale SVP, Chief Digital Experience Officer Omnichannel Customer Experience Be the premier omnichannel platform for the industry 34
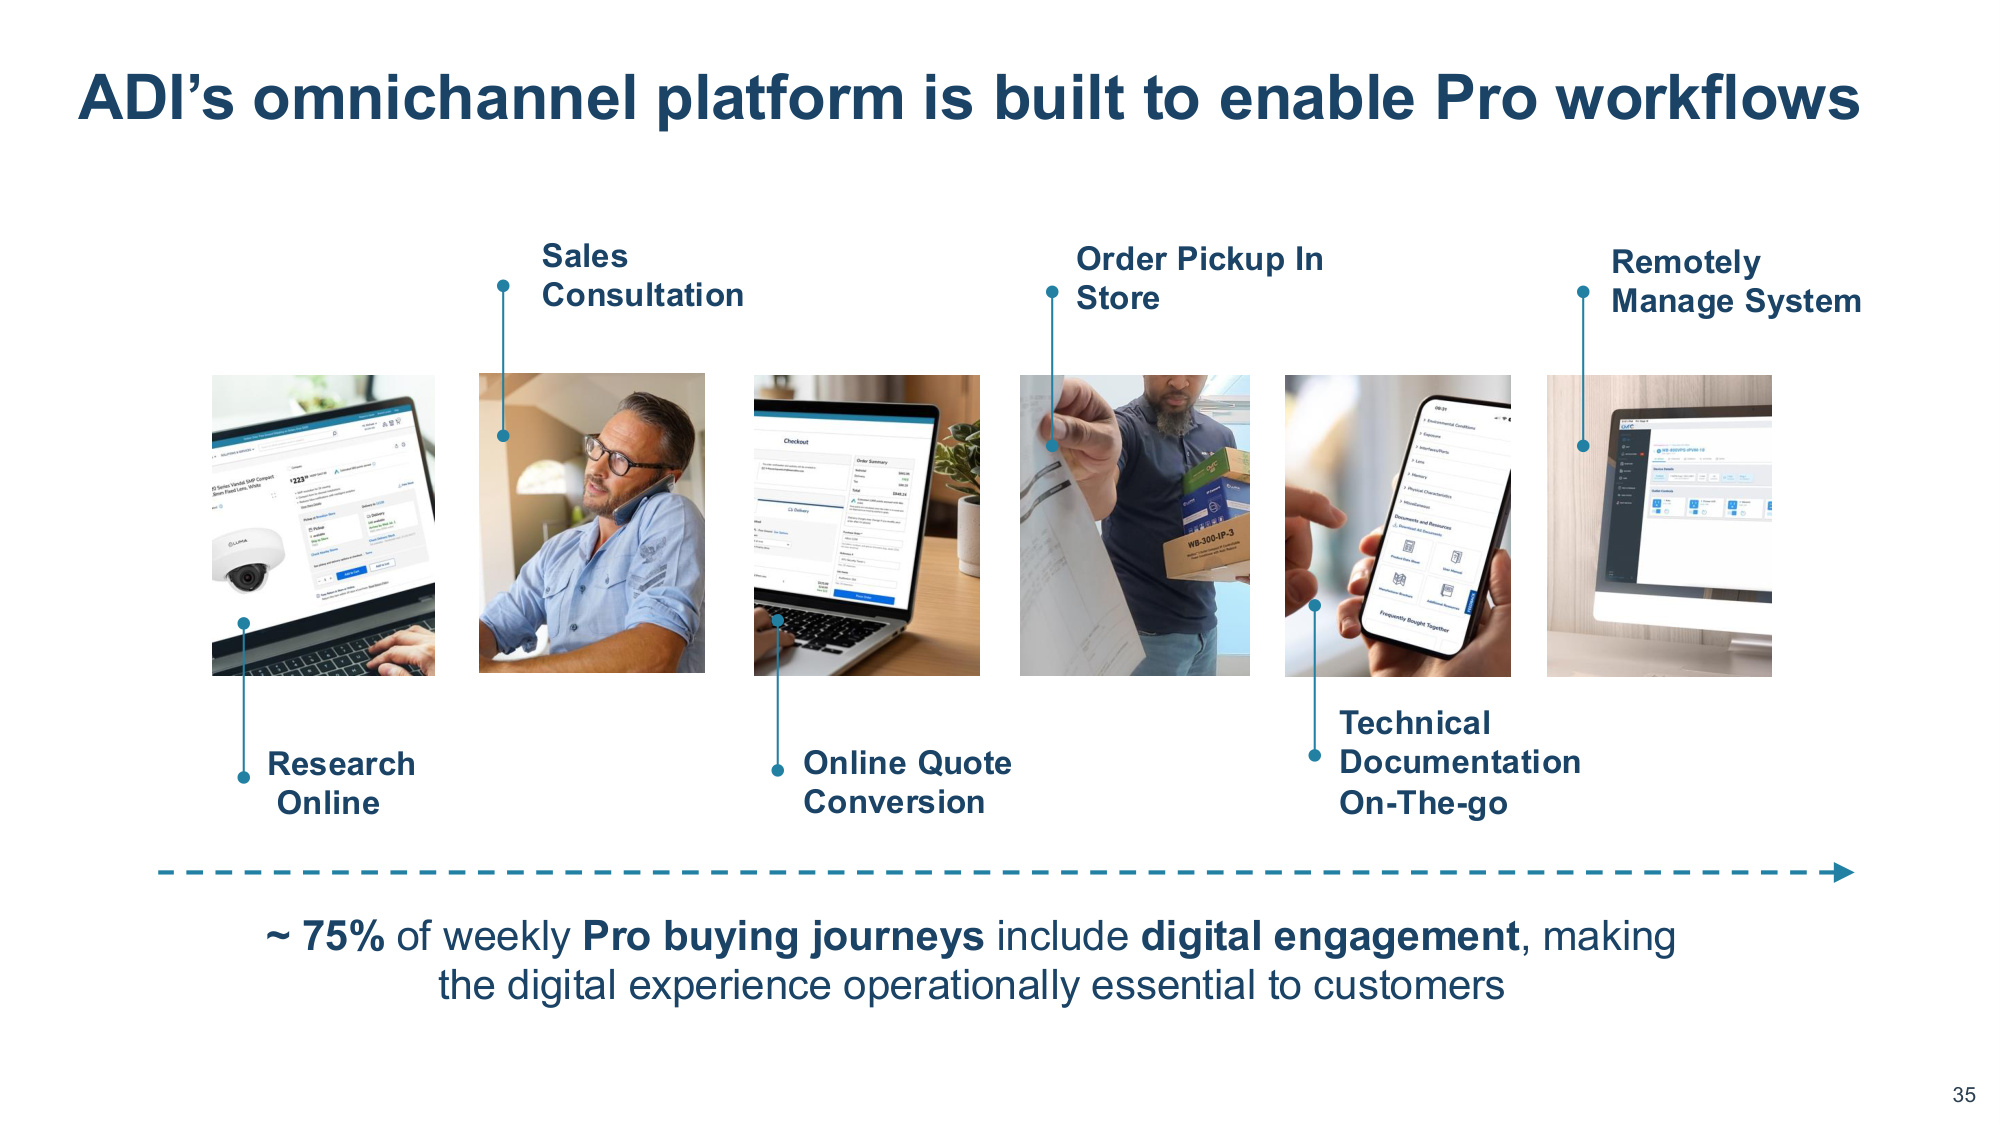
Company Confidential 35 35 Research Online Online Quote Conversion Order Pickup In Store ~ 75% of weekly Pro buying journeys include digital engagement, making the digital experience operationally essential to customers Technical Documentation On-The-go Remotely Manage System Sales Consultation ADI's omnichannel platform is built to enable Pro workflows
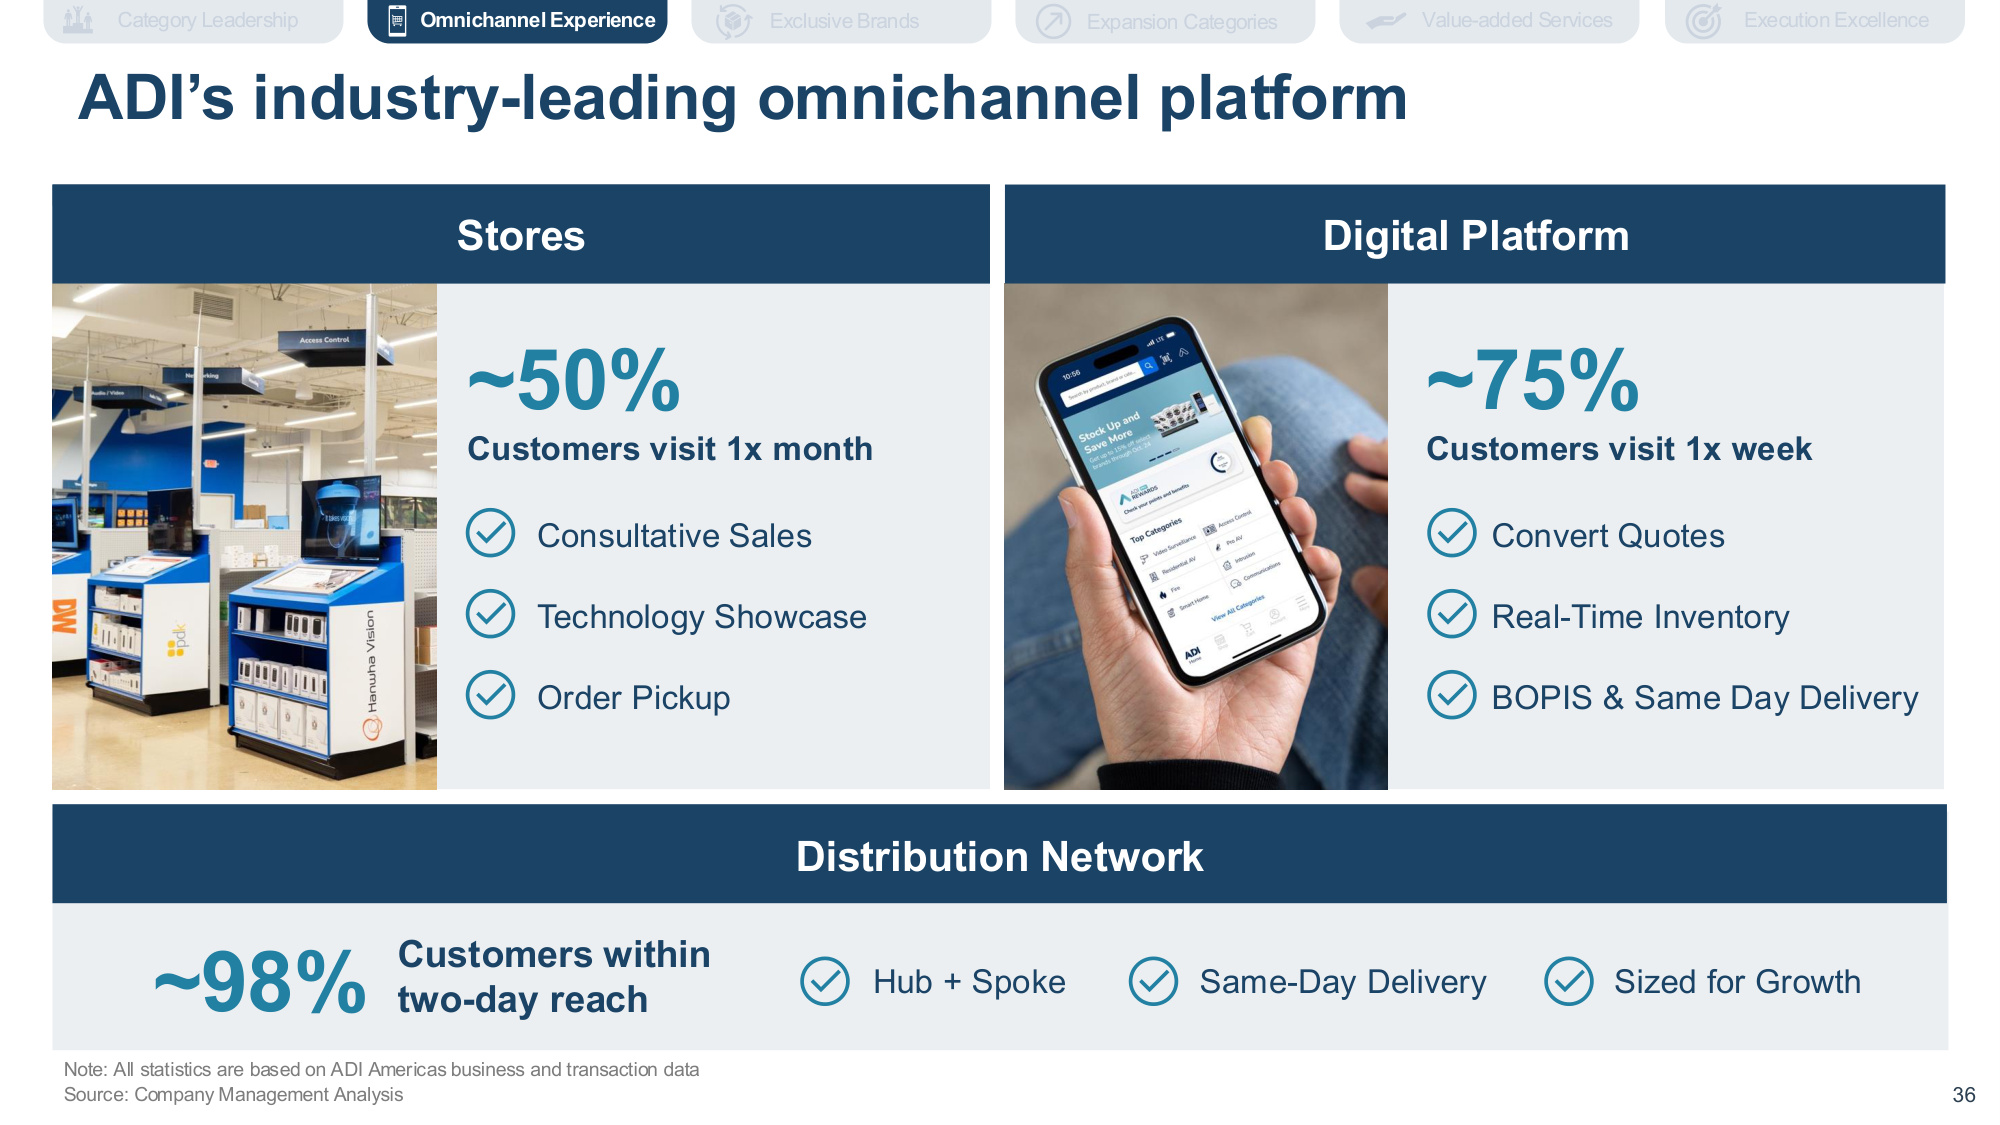
Company Confidential 36 36 ~98% Sized for Growth Source: Company Management Analysis Customers within two-day reach Distribution Network Hub + Spoke Same-Day Delivery Digital Platform ~75% Customers visit 1x week Convert Quotes Real-Time Inventory BOPIS & Same Day Delivery Stores Stores ~50% Customers visit 1x month Consultative Sales Technology Showcase Order Pickup ADI's industry-leading omnichannel platform Execution Excellence Expansion Categories Value-added Services Omnichannel Experience Category Leadership Exclusive Brands Note: All statistics are based on ADI Americas business and transaction data
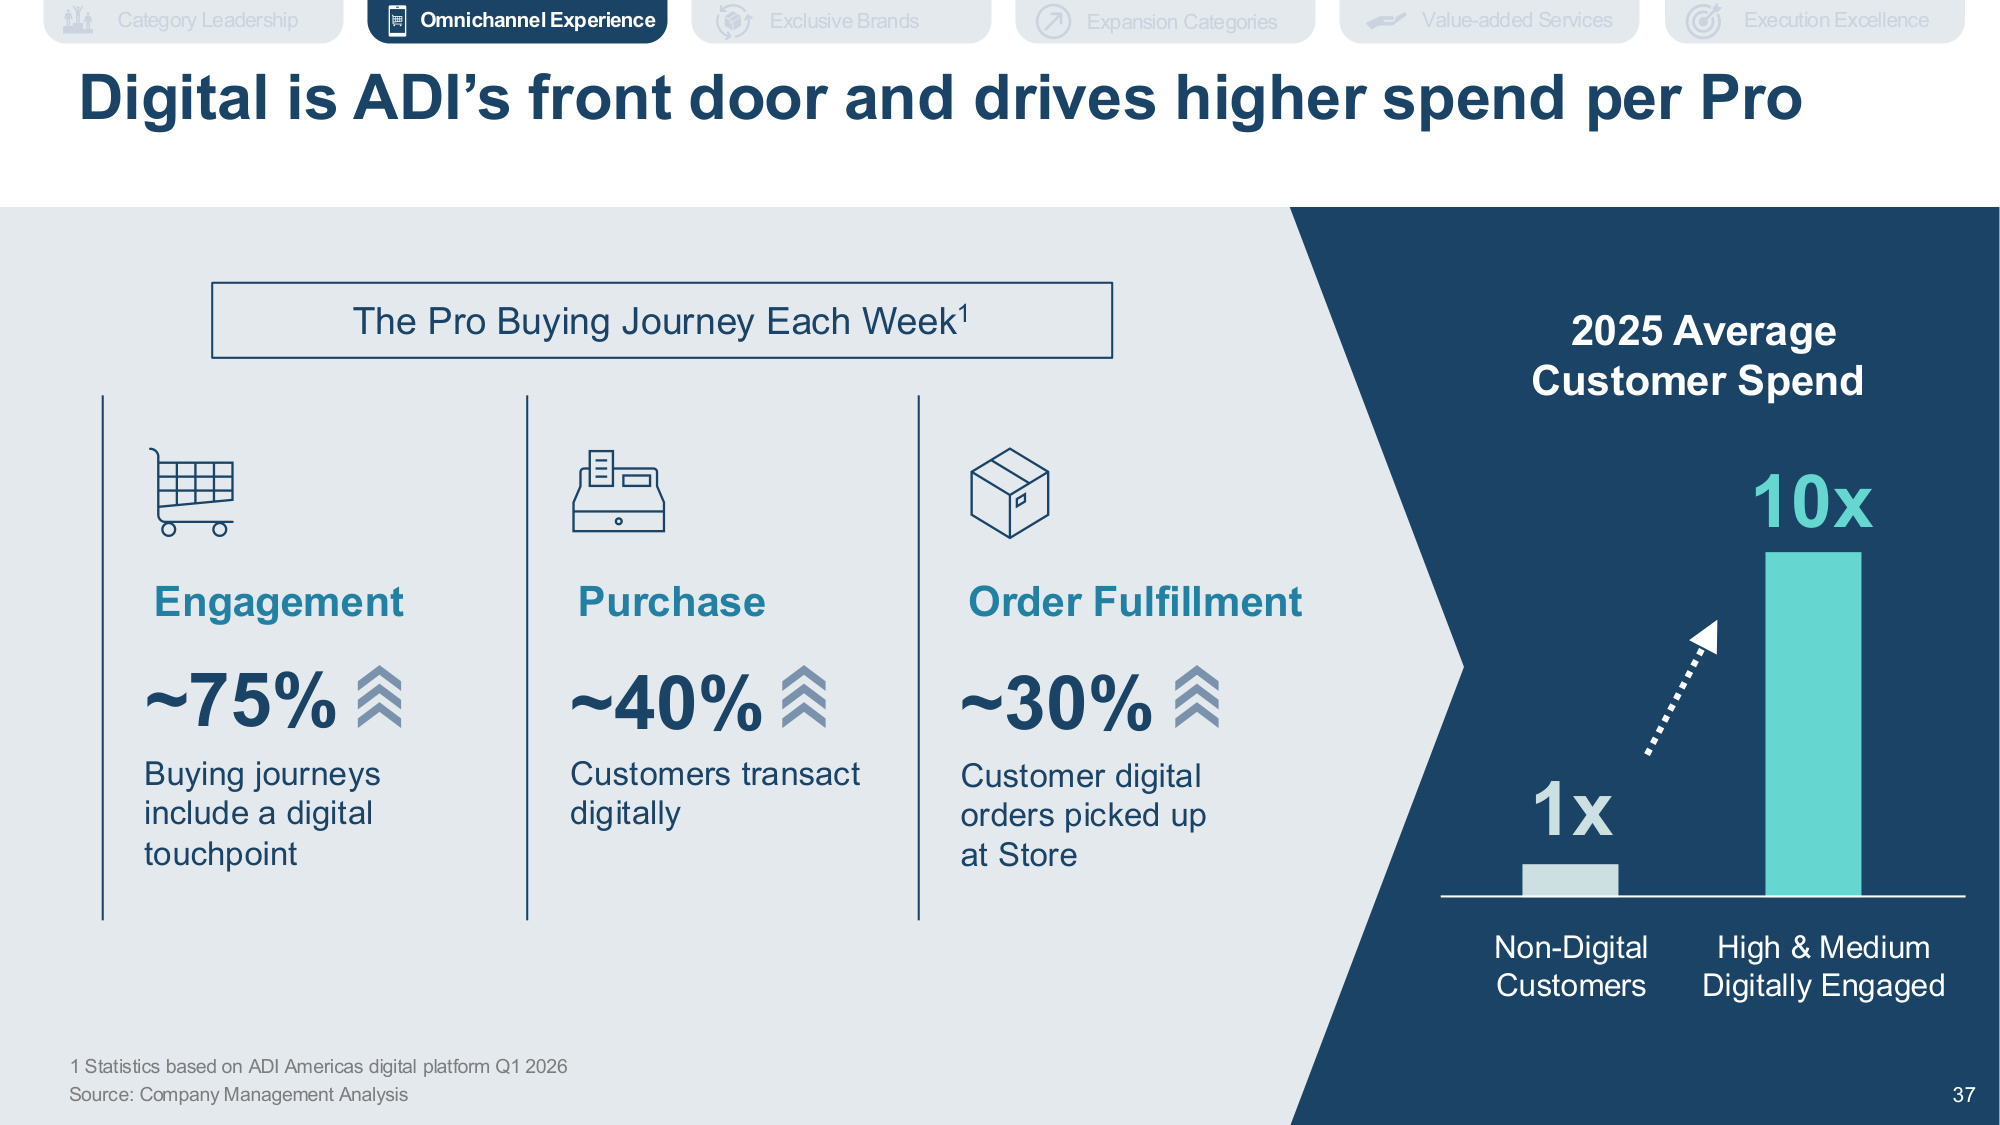
Company Confidential 37 37 ~40% Customers transact digitally ~75% Buying journeys include a digital touchpoint Non-Digital Customers High & Medium Digitally Engaged 1x 10x 2025 Average Customer Spend Engagement Purchase ~30% Customer digital orders picked up at Store Order Fulfillment Source: Company Management Analysis 37 Digital is ADI's front door and drives higher spend per Pro The Pro Buying Journey Each Week1 1 Statistics based on ADI Americas digital platform Q1 2026 Execution Excellence Expansion Categories Value-added Services Omnichannel Experience Category Leadership Exclusive Brands
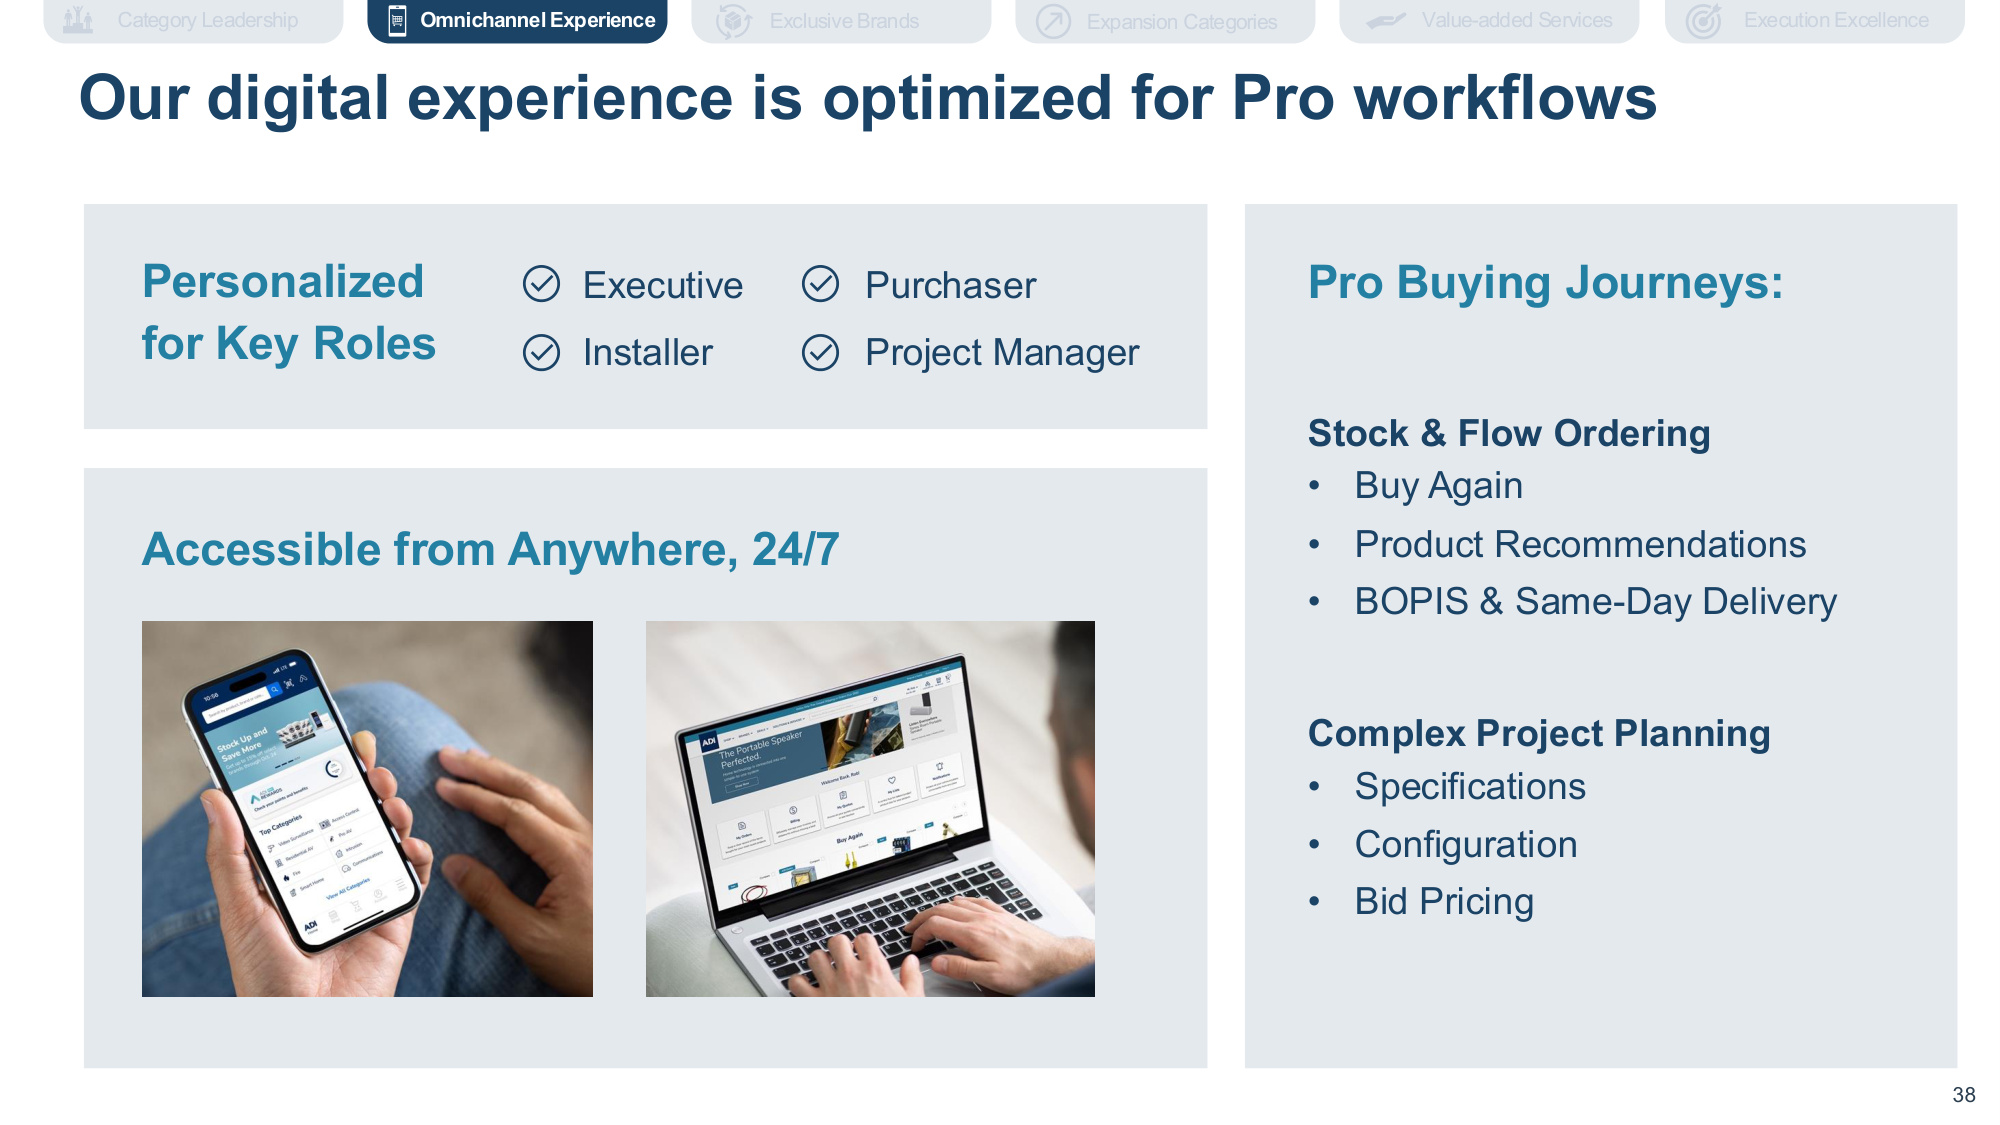
Company Confidential 38 38 Stock & Flow Ordering • Buy Again • Product Recommendations • BOPIS & Same-Day Delivery Complex Project Planning • Specifications • Configuration • Bid Pricing Pro Buying Journeys: Personalized for Key Roles Accessible from Anywhere, 24/7 Executive Installer Purchaser Project Manager Our digital experience is optimized for Pro workflows Execution Excellence Expansion Categories Value-added Services Omnichannel Experience Category Leadership Exclusive Brands
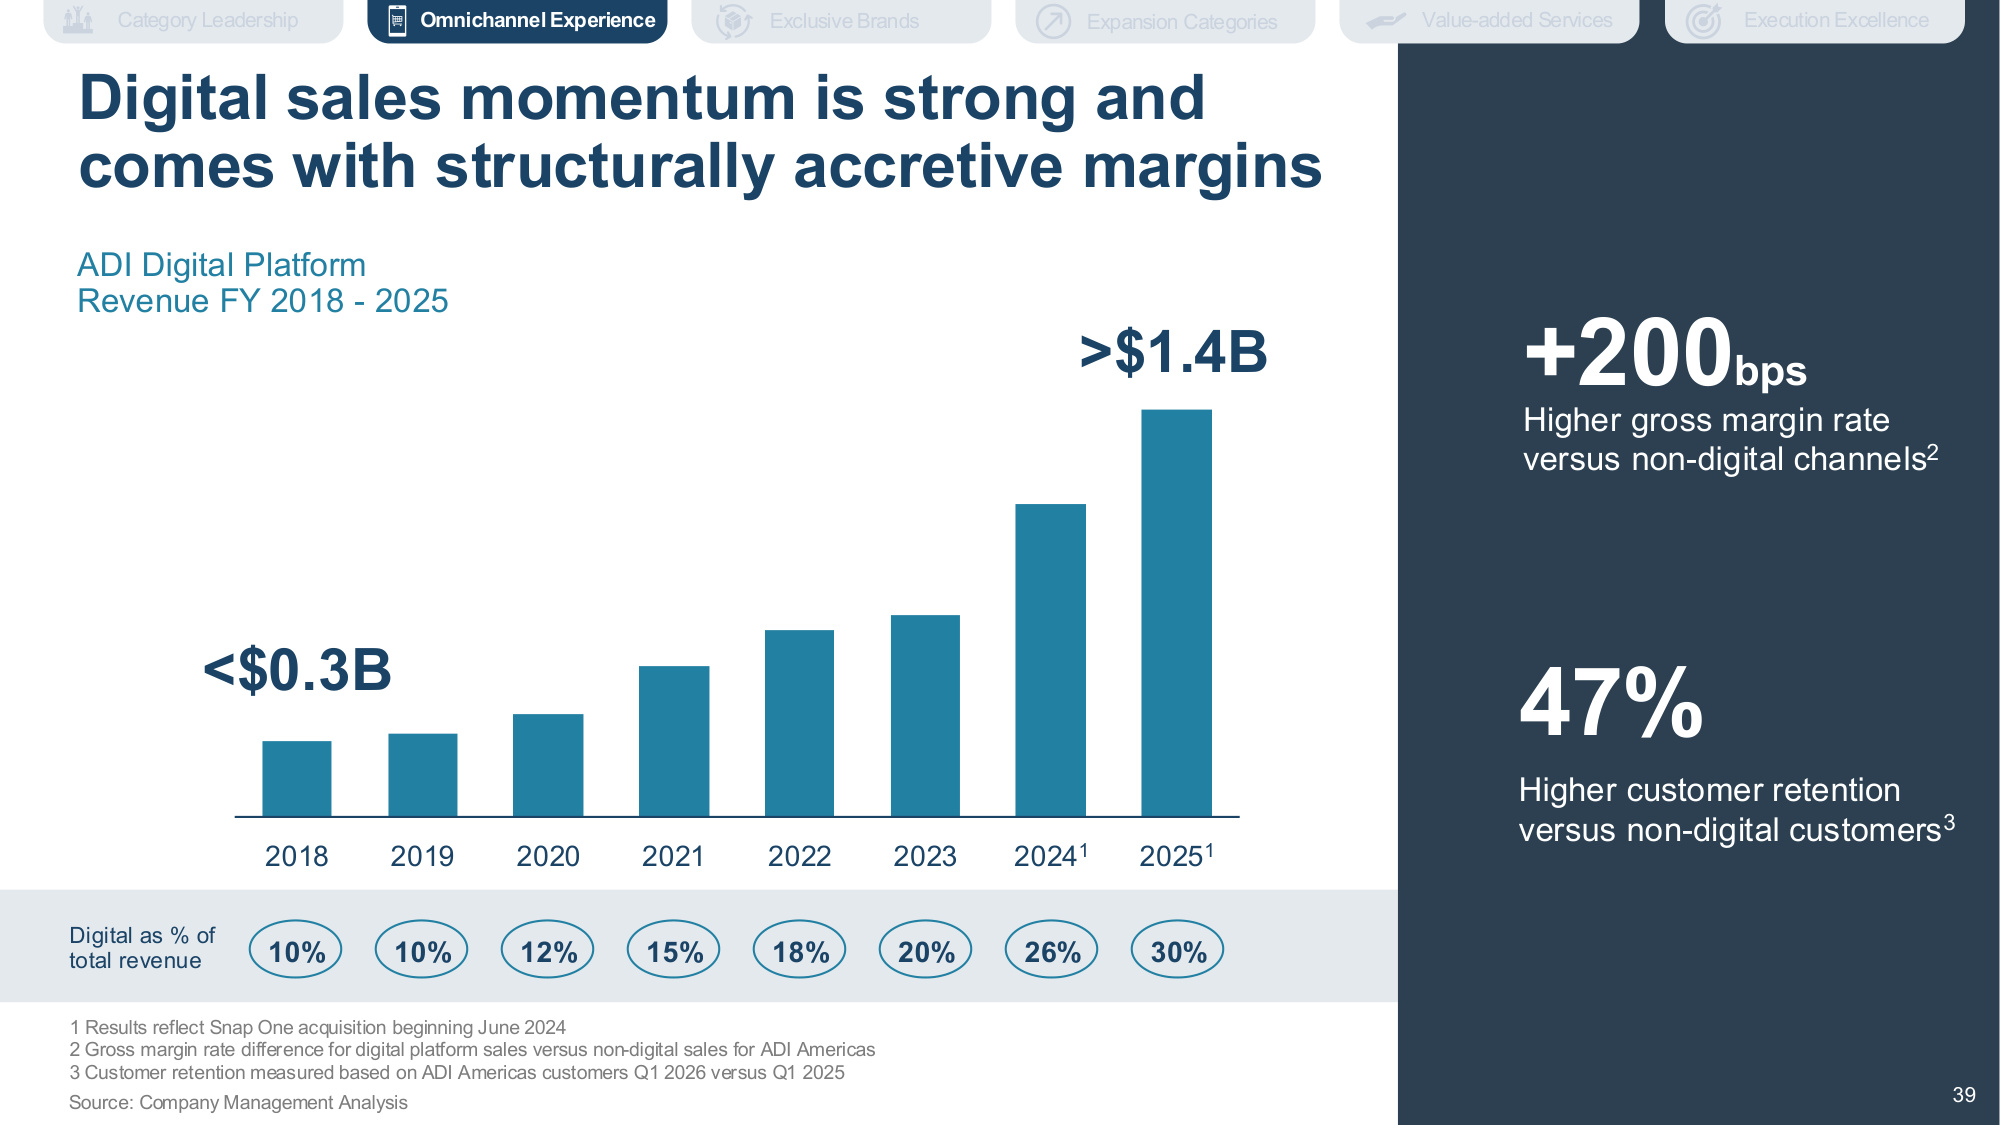
Company Confidential 39 39 Source: Company Management Analysis ADI Digital Platform Revenue FY 2018 - 2025 2018 2019 2020 2021 2022 2023 20241 20251 <$0.3B >$1.4B Higher gross margin rate versus non-digital channels2 +200bps 10% 10% 12% 15% 18% 20% 26% 30% Digital as % of total revenue 39 Digital sales momentum is strong and comes with structurally accretive margins 1 Results reflect Snap One acquisition beginning June 2024 2 Gross margin rate difference for digital platform sales versus non-digital sales for ADI Americas 3 Customer retention measured based on ADI Americas customers Q1 2026 versus Q1 2025 Higher customer retention versus non-digital customers3 47% Execution Excellence Expansion Categories Value-added Services Omnichannel Experience Category Leadership Exclusive Brands
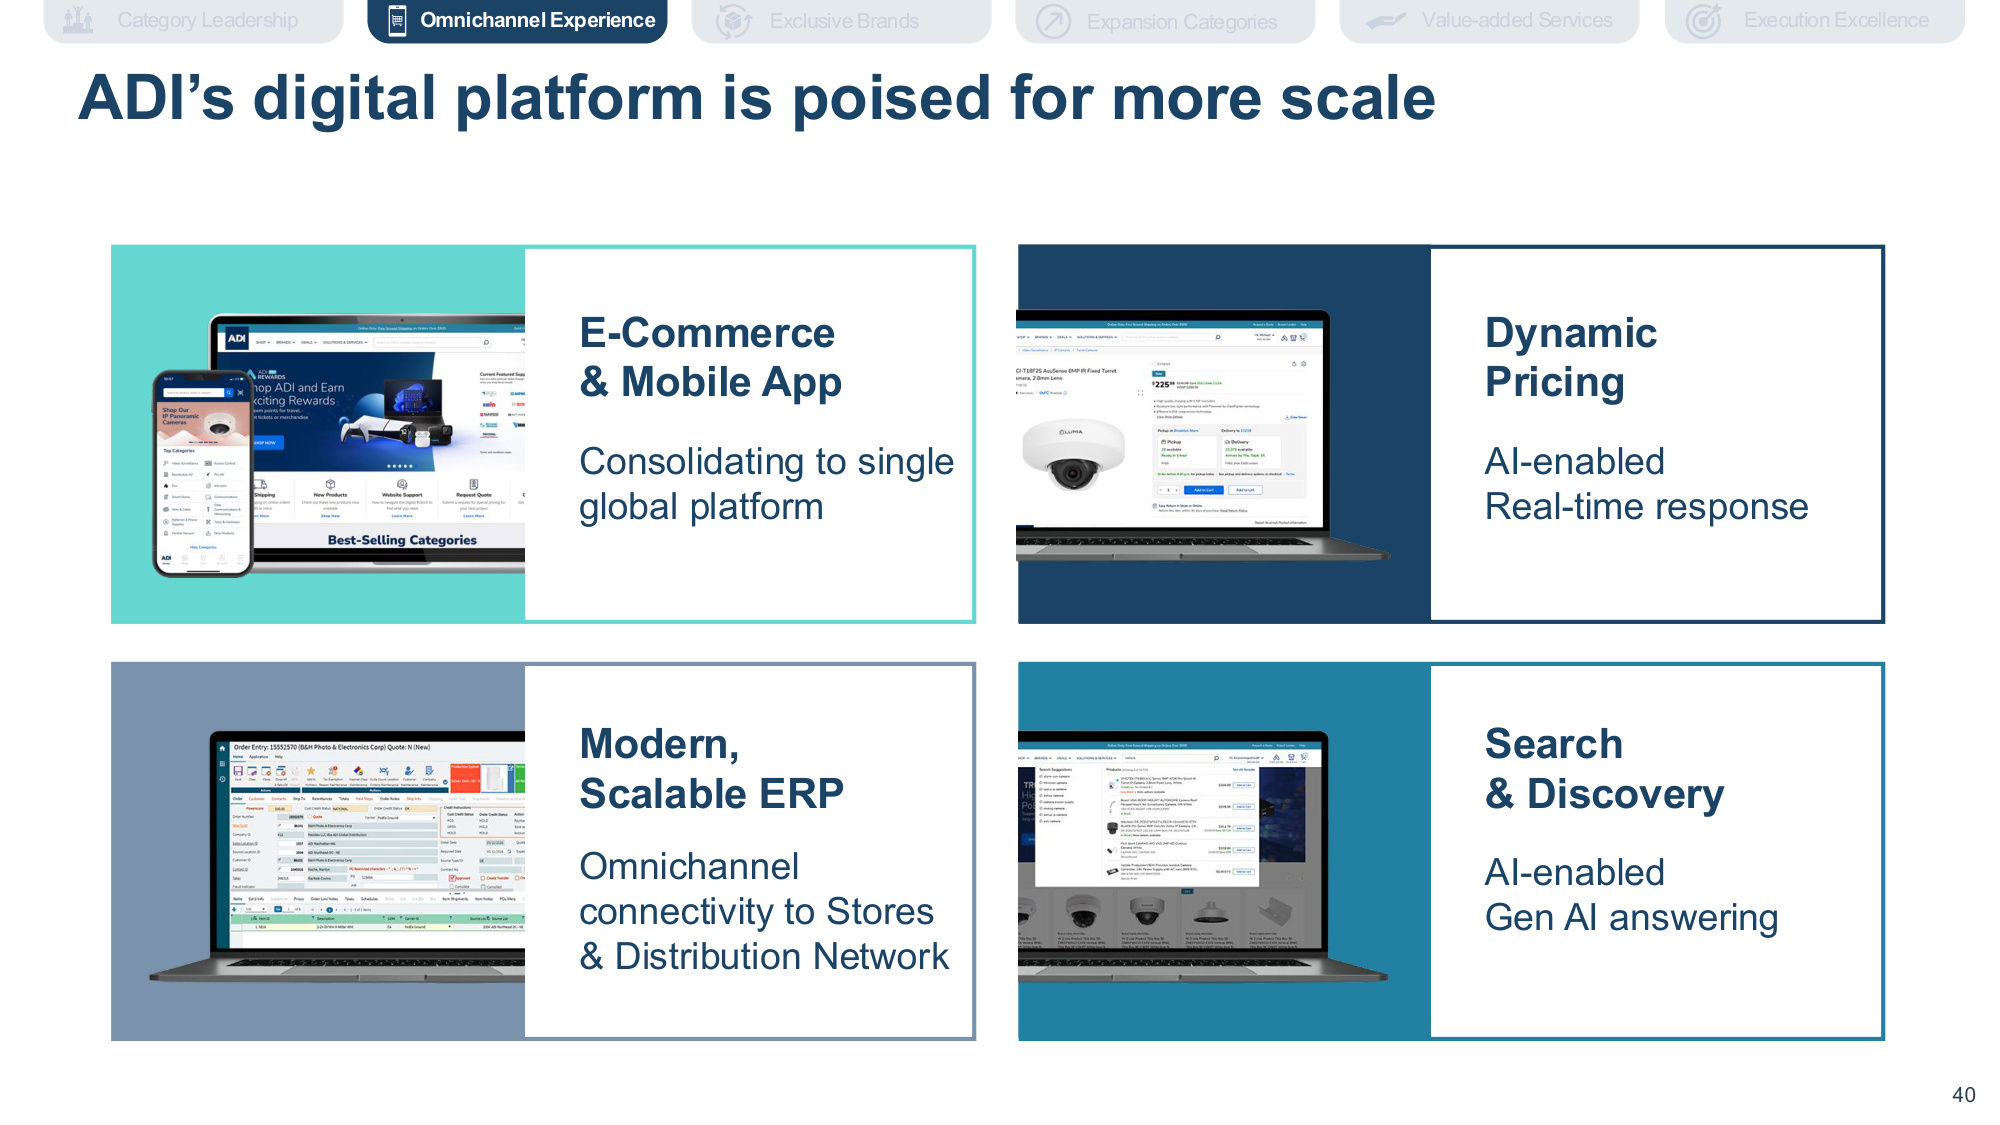
Company Confidential 40 40 E-Commerce & Mobile App Dynamic Pricing Search & Discovery Consolidating to single global platform AI-enabled Real-time response AI-enabled Gen AI answering Modern, Scalable ERP Omnichannel connectivity to Stores & Distribution Network Pic Pic Pic ADI's digital platform is poised for more scale Execution Excellence Expansion Categories Value-added Services Omnichannel Experience Category Leadership Exclusive Brands
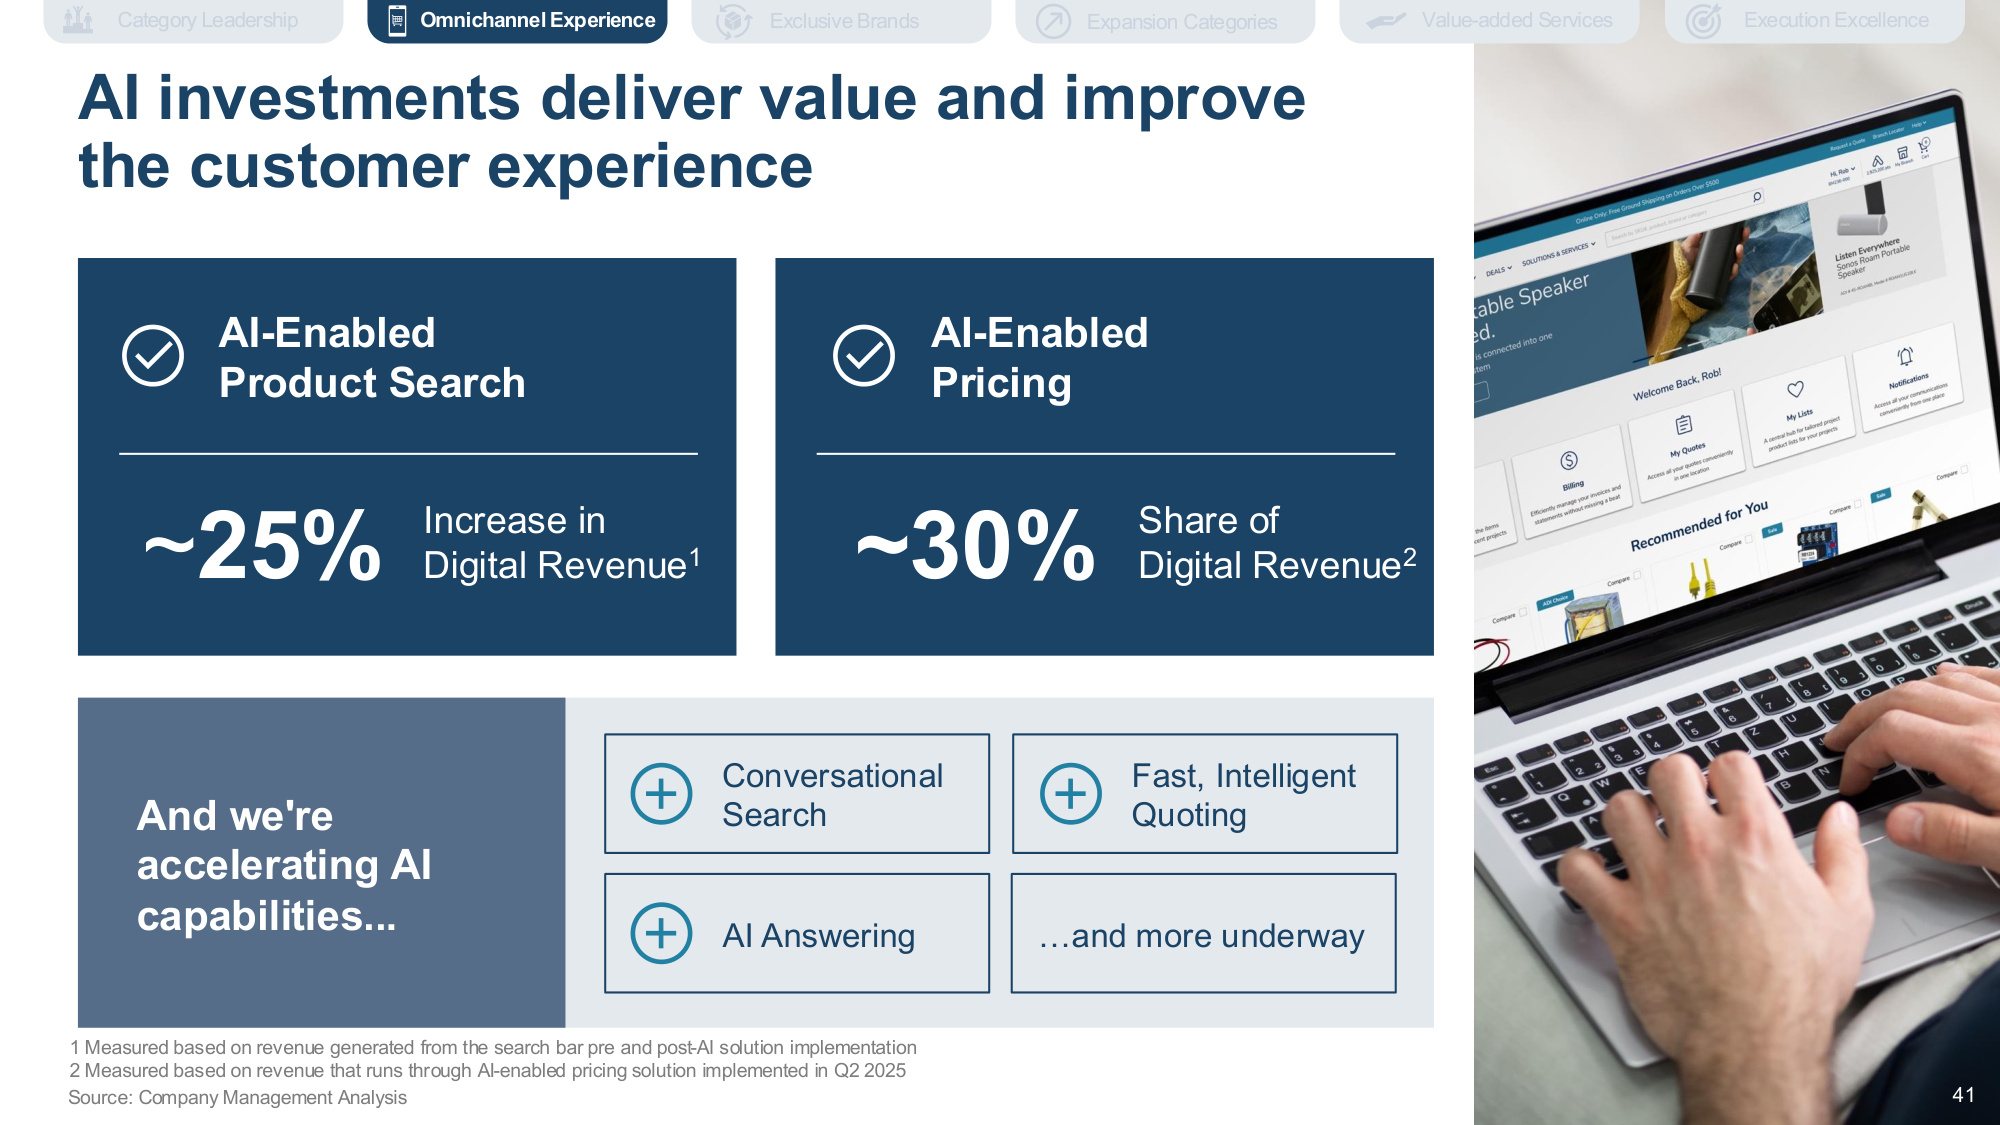
Company Confidential 41 Source: Company Management Analysis And we're accelerating AI capabilities... AI-Enabled Product Search Increase in Digital Revenue1 ~25% AI-Enabled Pricing Share of Digital Revenue2 ~30% Conversational Search AI Answering Fast, Intelligent Quoting ...and more underway AI investments deliver value and improve the customer experience 1 Measured based on revenue generated from the search bar pre and post-AI solution implementation 2 Measured based on revenue that runs through AI-enabled pricing solution implemented in Q2 2025 Execution Excellence Expansion Categories Value-added Services Omnichannel Experience Category Leadership Exclusive Brands 41
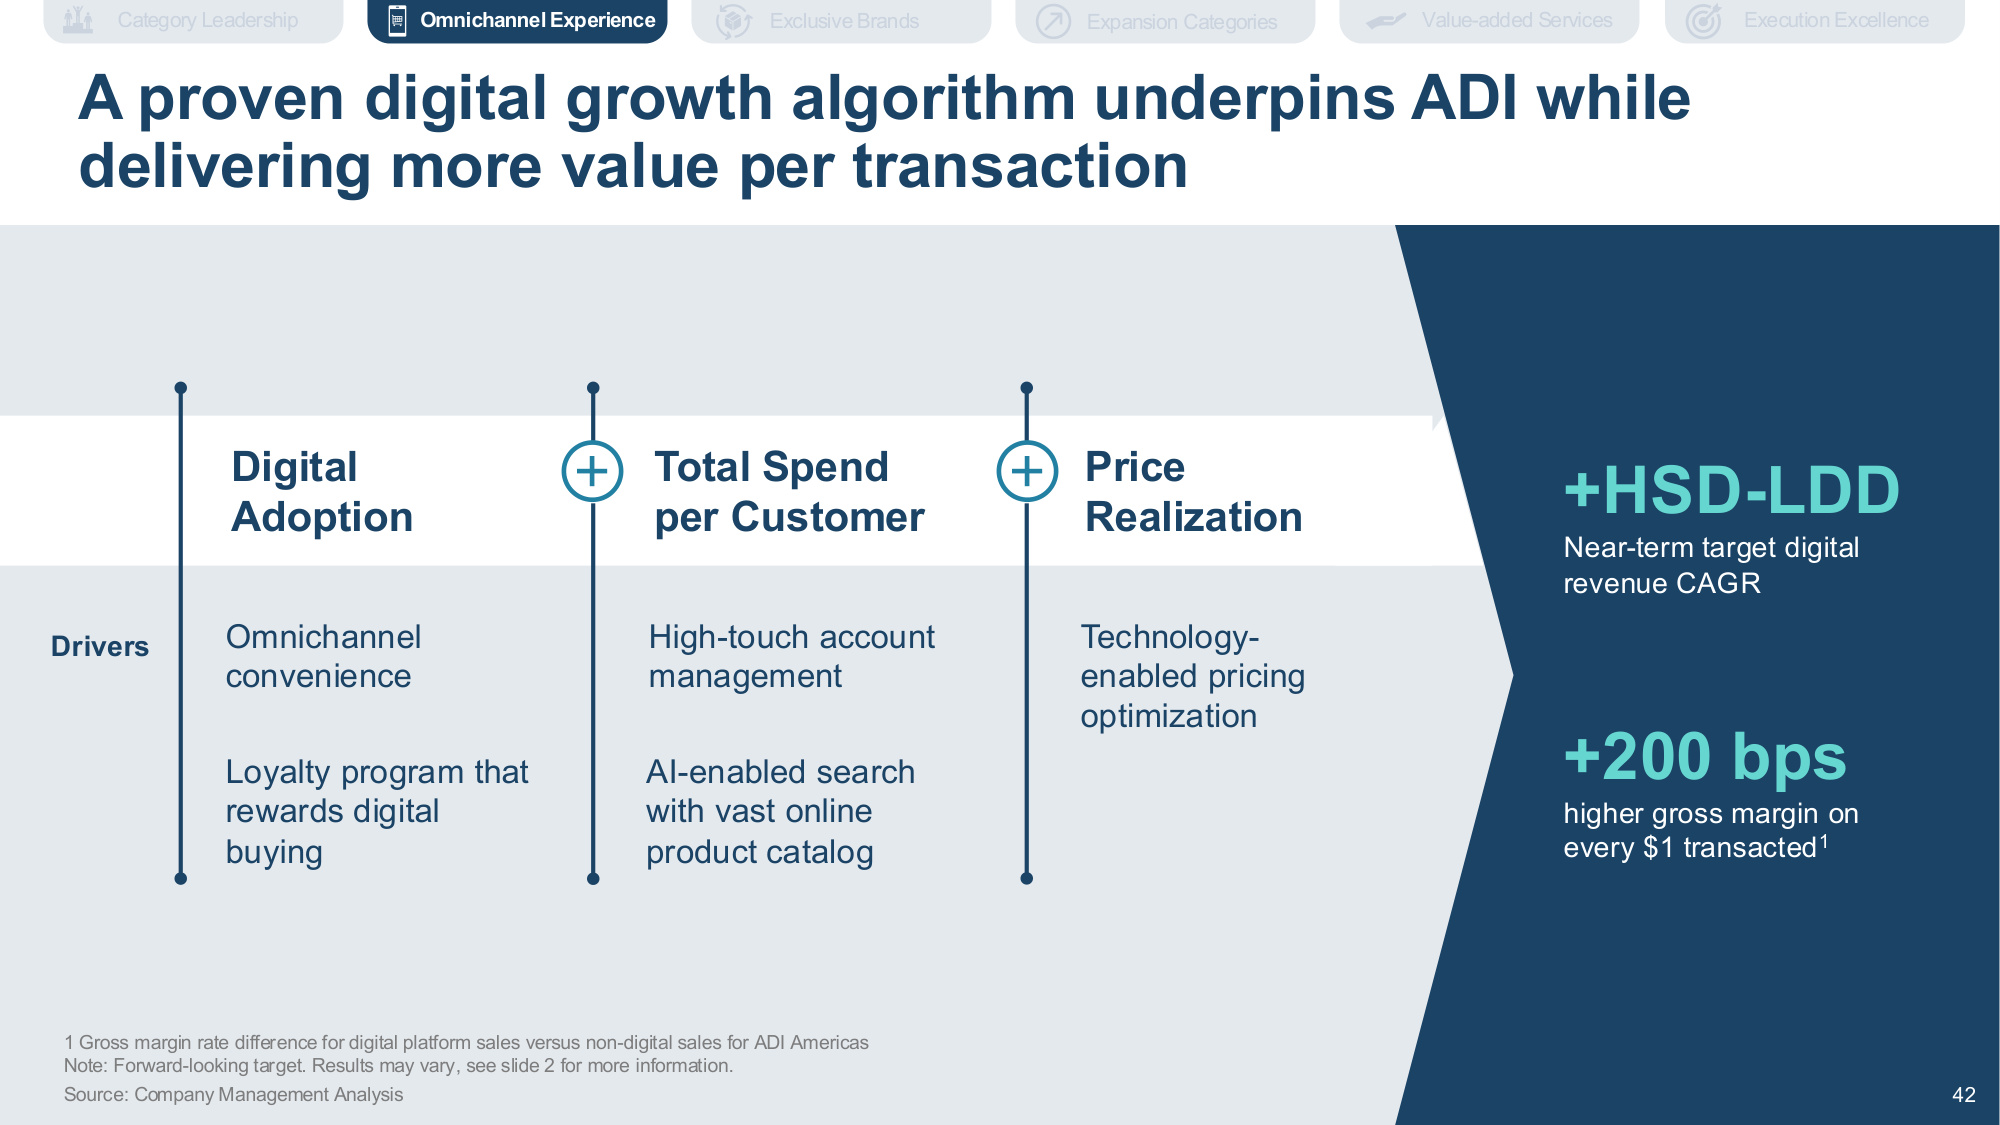
Company Confidential 42 42 +HSD-LDD Near-term target digital revenue CAGR +200 bps higher gross margin on every $1 transacted1 Total Spend per Customer Price Realization Drivers Omnichannel convenience AI-enabled search with vast online product catalog High-touch account management Technology- enabled pricing optimization Digital Adoption Loyalty program that rewards digital buying Source: Company Management Analysis 1 Gross margin rate difference for digital platform sales versus non-digital sales for ADI Americas Note: Forward-looking target. Results may vary, see slide 2 for more information. 42 A proven digital growth algorithm underpins ADI while delivering more value per transaction Execution Excellence Expansion Categories Value-added Services Omnichannel Experience Category Leadership Exclusive Brands
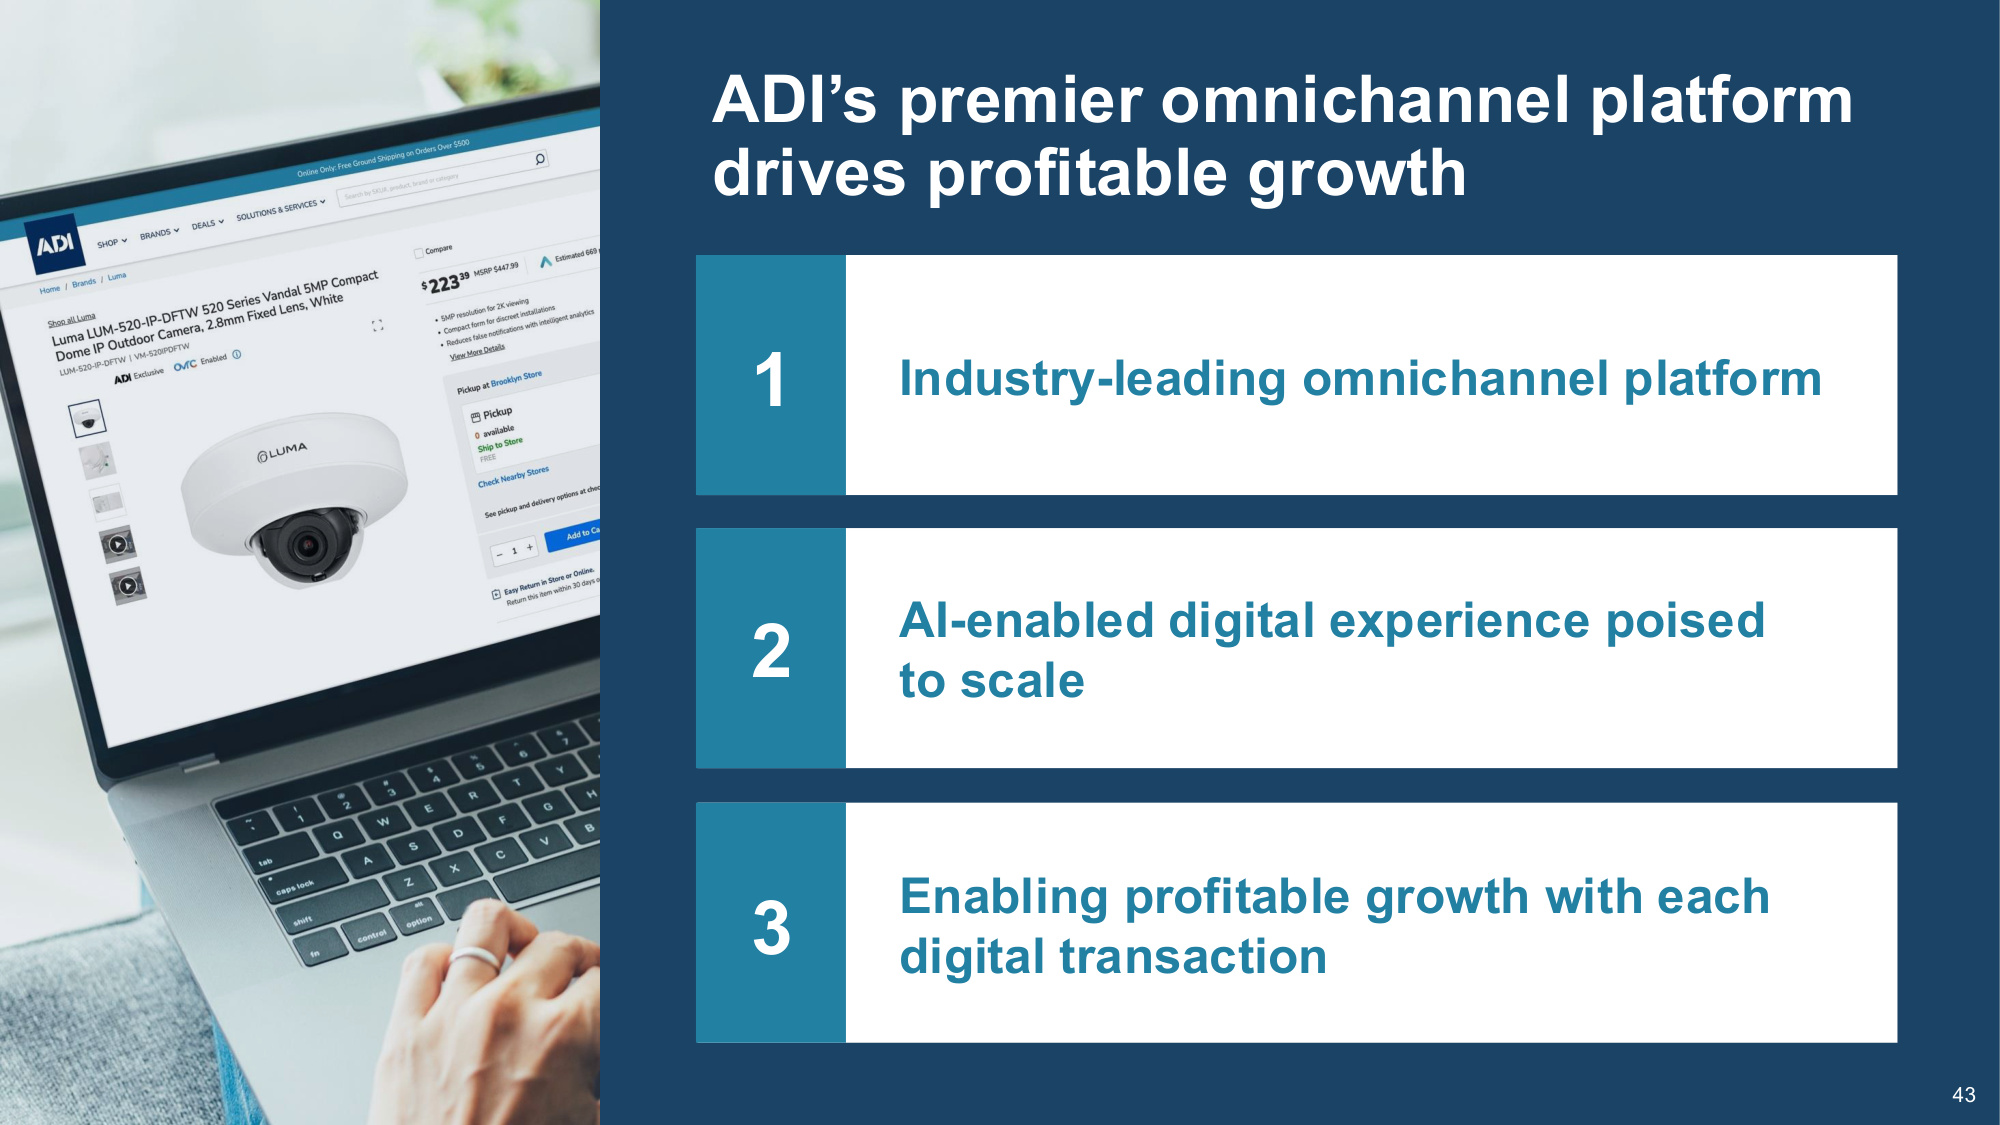
Company Confidential 43 43 c Industry-leading omnichannel platform AI-enabled digital experience poised to scale Enabling profitable growth with each digital transaction 1 2 3 ADI's premier omnichannel platform drives profitable growth
Company Confidential 44 44 Allie Copeland SVP, Chief Operating Officer Trusted Partner to Deliver Be the trusted Partner counted on to deliver when it matters 44
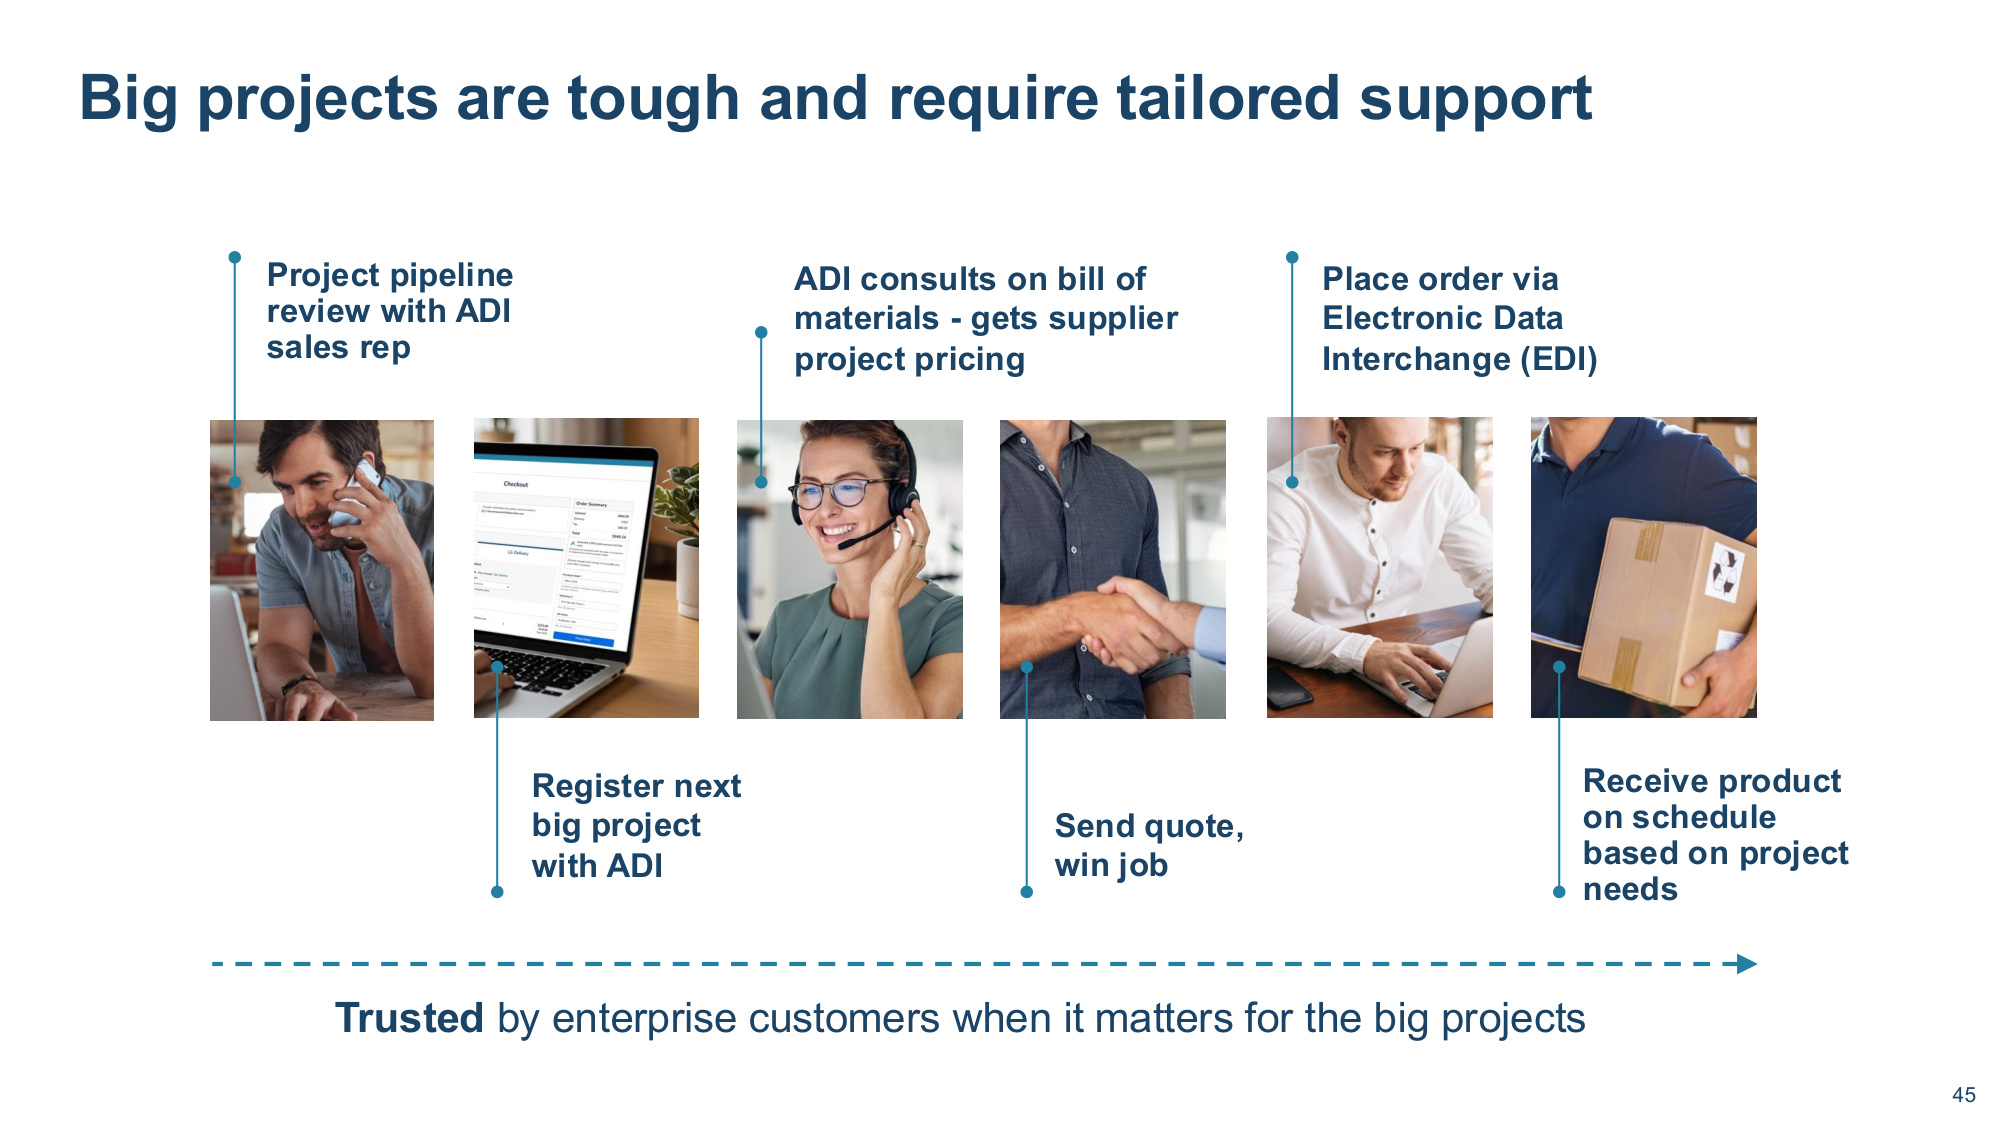
Company Confidential 45 45 Register next big project with ADI Send quote, win job ADI consults on bill of materials - gets supplier project pricing Place order via Electronic Data Interchange (EDI) Trusted by enterprise customers when it matters for the big projects Receive product on schedule based on project needs 45 Big projects are tough and require tailored support Project pipeline review with ADI sales rep
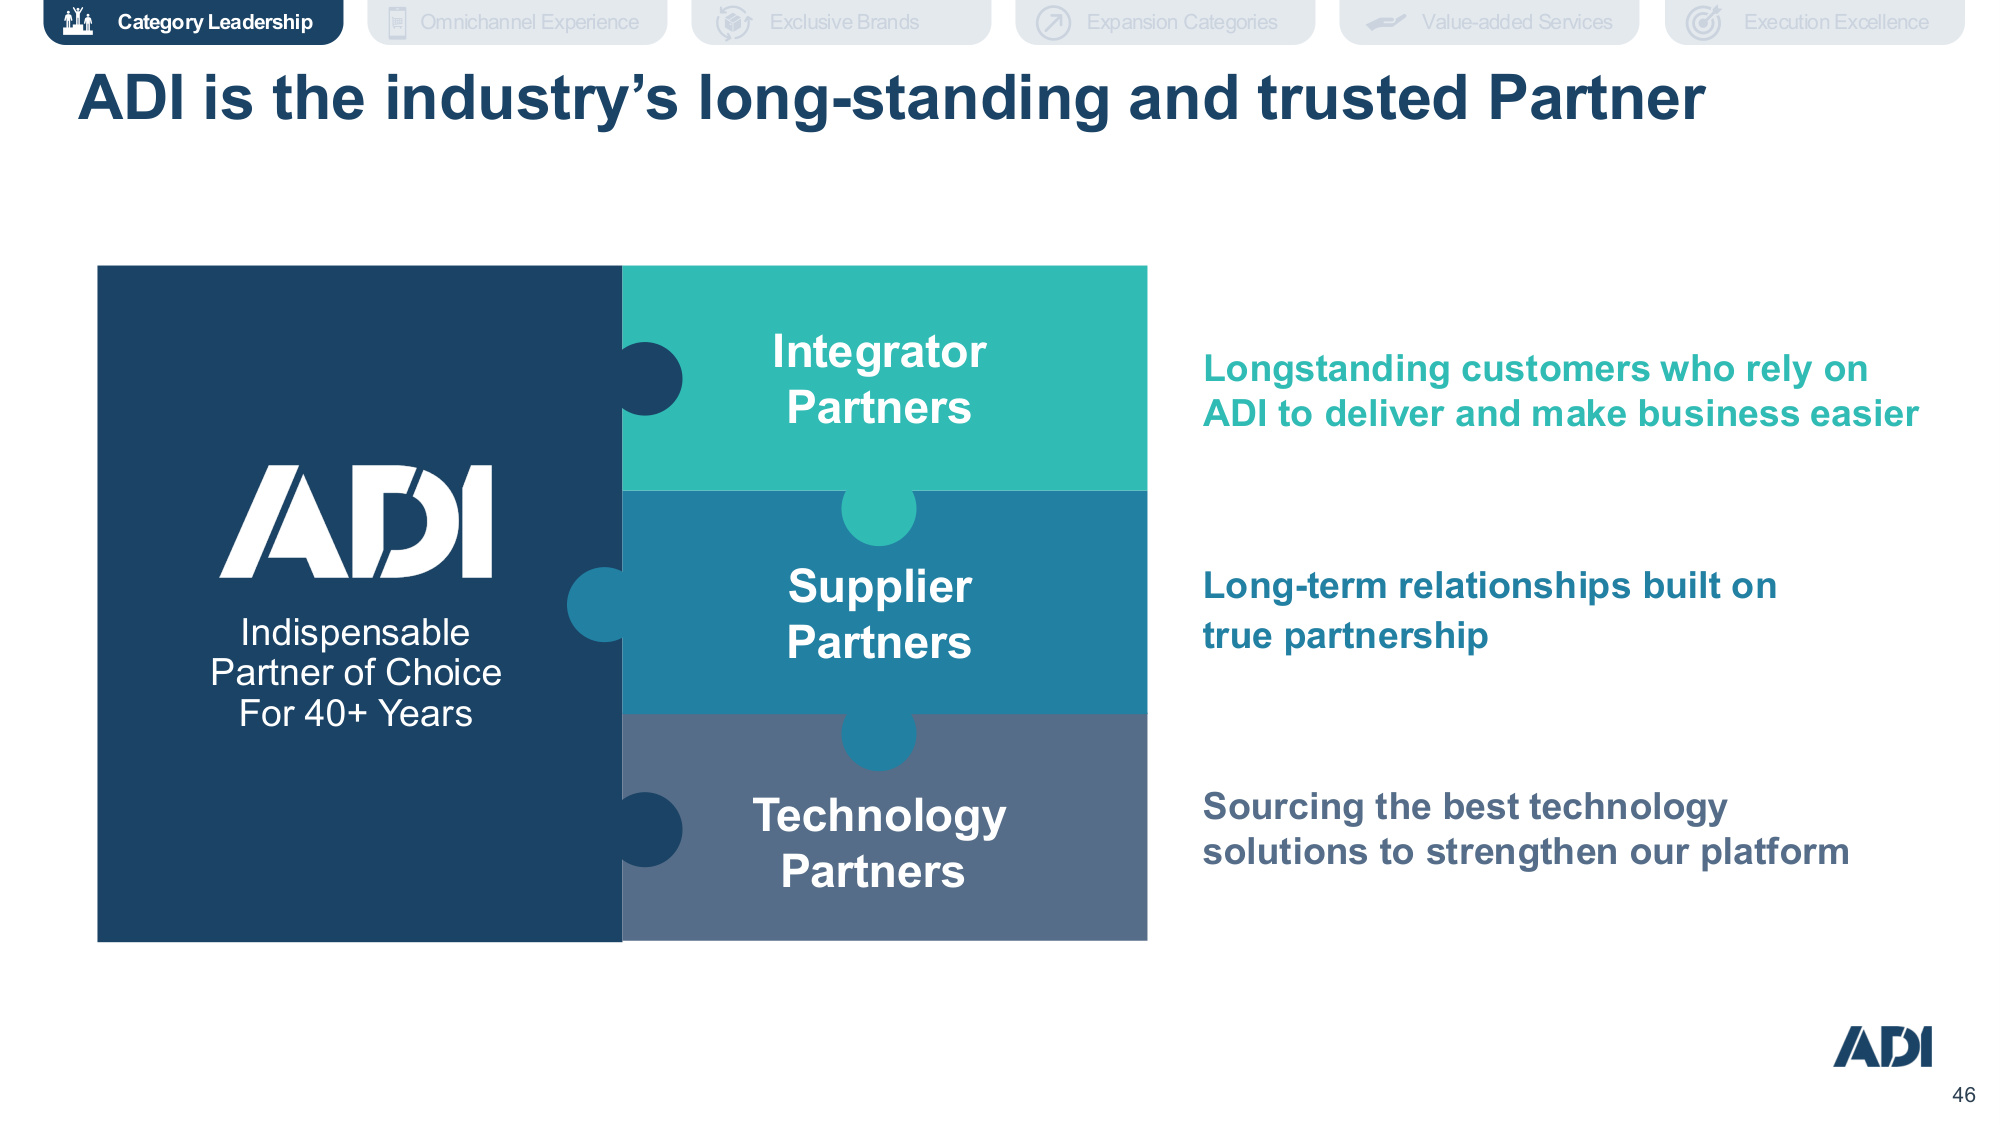
Company Confidential 46 46 ADI is the industry's long-standing and trusted Partner Longstanding customers who rely on ADI to deliver and make business easier Sourcing the best technology solutions to strengthen our platform Long-term relationships built on true partnership Integrator Partners Supplier Partners Technology Partners Indispensable Partner of Choice For 40+ Years Execution Excellence Expansion Categories Exclusive Brands Value-added Services Omnichannel Experience Category Leadership
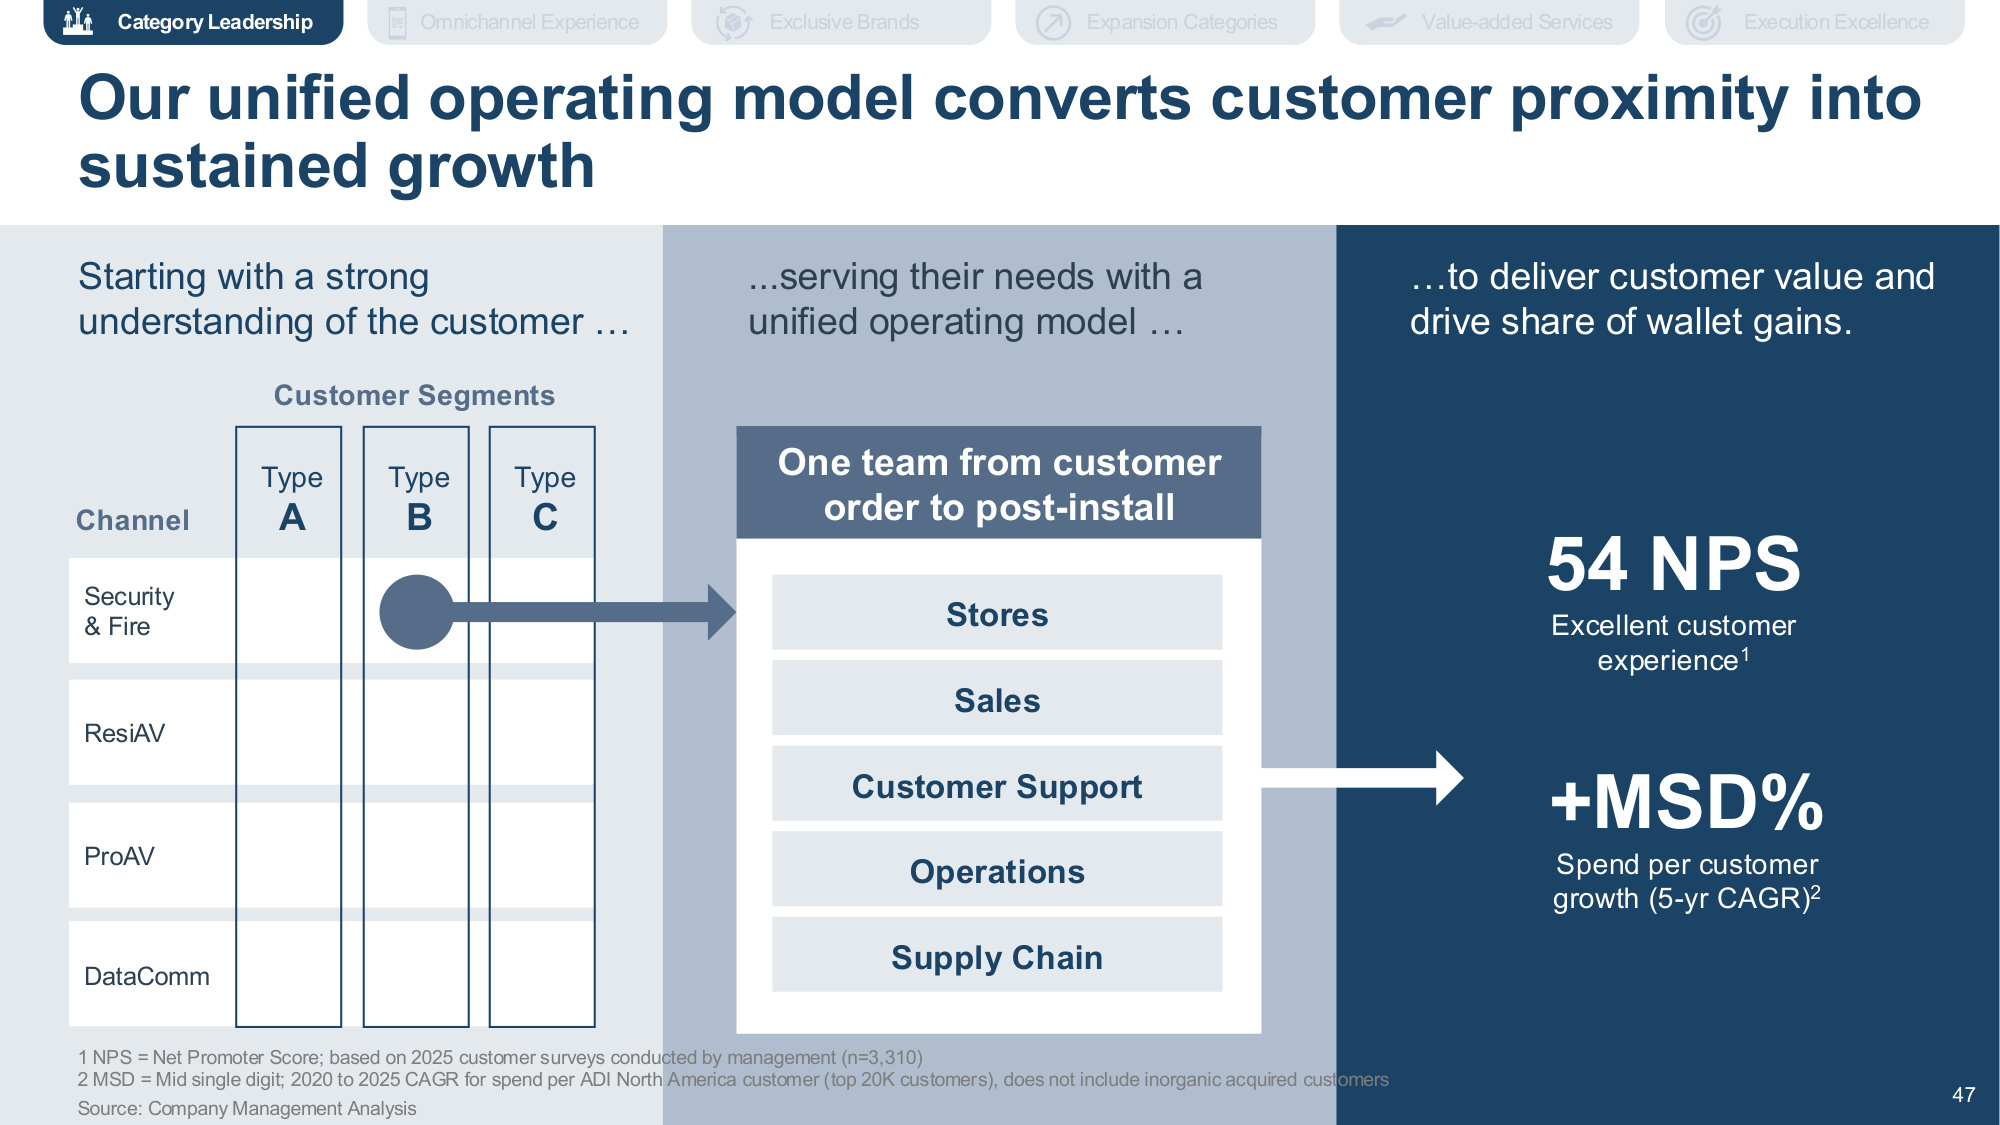
Company Confidential 47 47 Starting with a strong understanding of the customer ... ...serving their needs with a unified operating model ... ...to deliver customer value and drive share of wallet gains. Security & Fire ResiAV ProAV DataComm Customer Segments Type A Type B Type C Channel One team from customer order to post-install Stores Sales Customer Support Operations Supply Chain 54 NPS Excellent customer experience1 +MSD% Spend per customer growth (5-yr CAGR)2 1 NPS = Net Promoter Score; based on 2025 customer surveys conducted by management (n=3,310) 2 MSD = Mid single digit; 2020 to 2025 CAGR for spend per ADI North America customer (top 20K customers), does not include inorganic acquired customers Source: Company Management Analysis 47 Our unified operating model converts customer proximity into sustained growth Execution Excellence Expansion Categories Exclusive Brands Value-added Services Omnichannel Experience Category Leadership
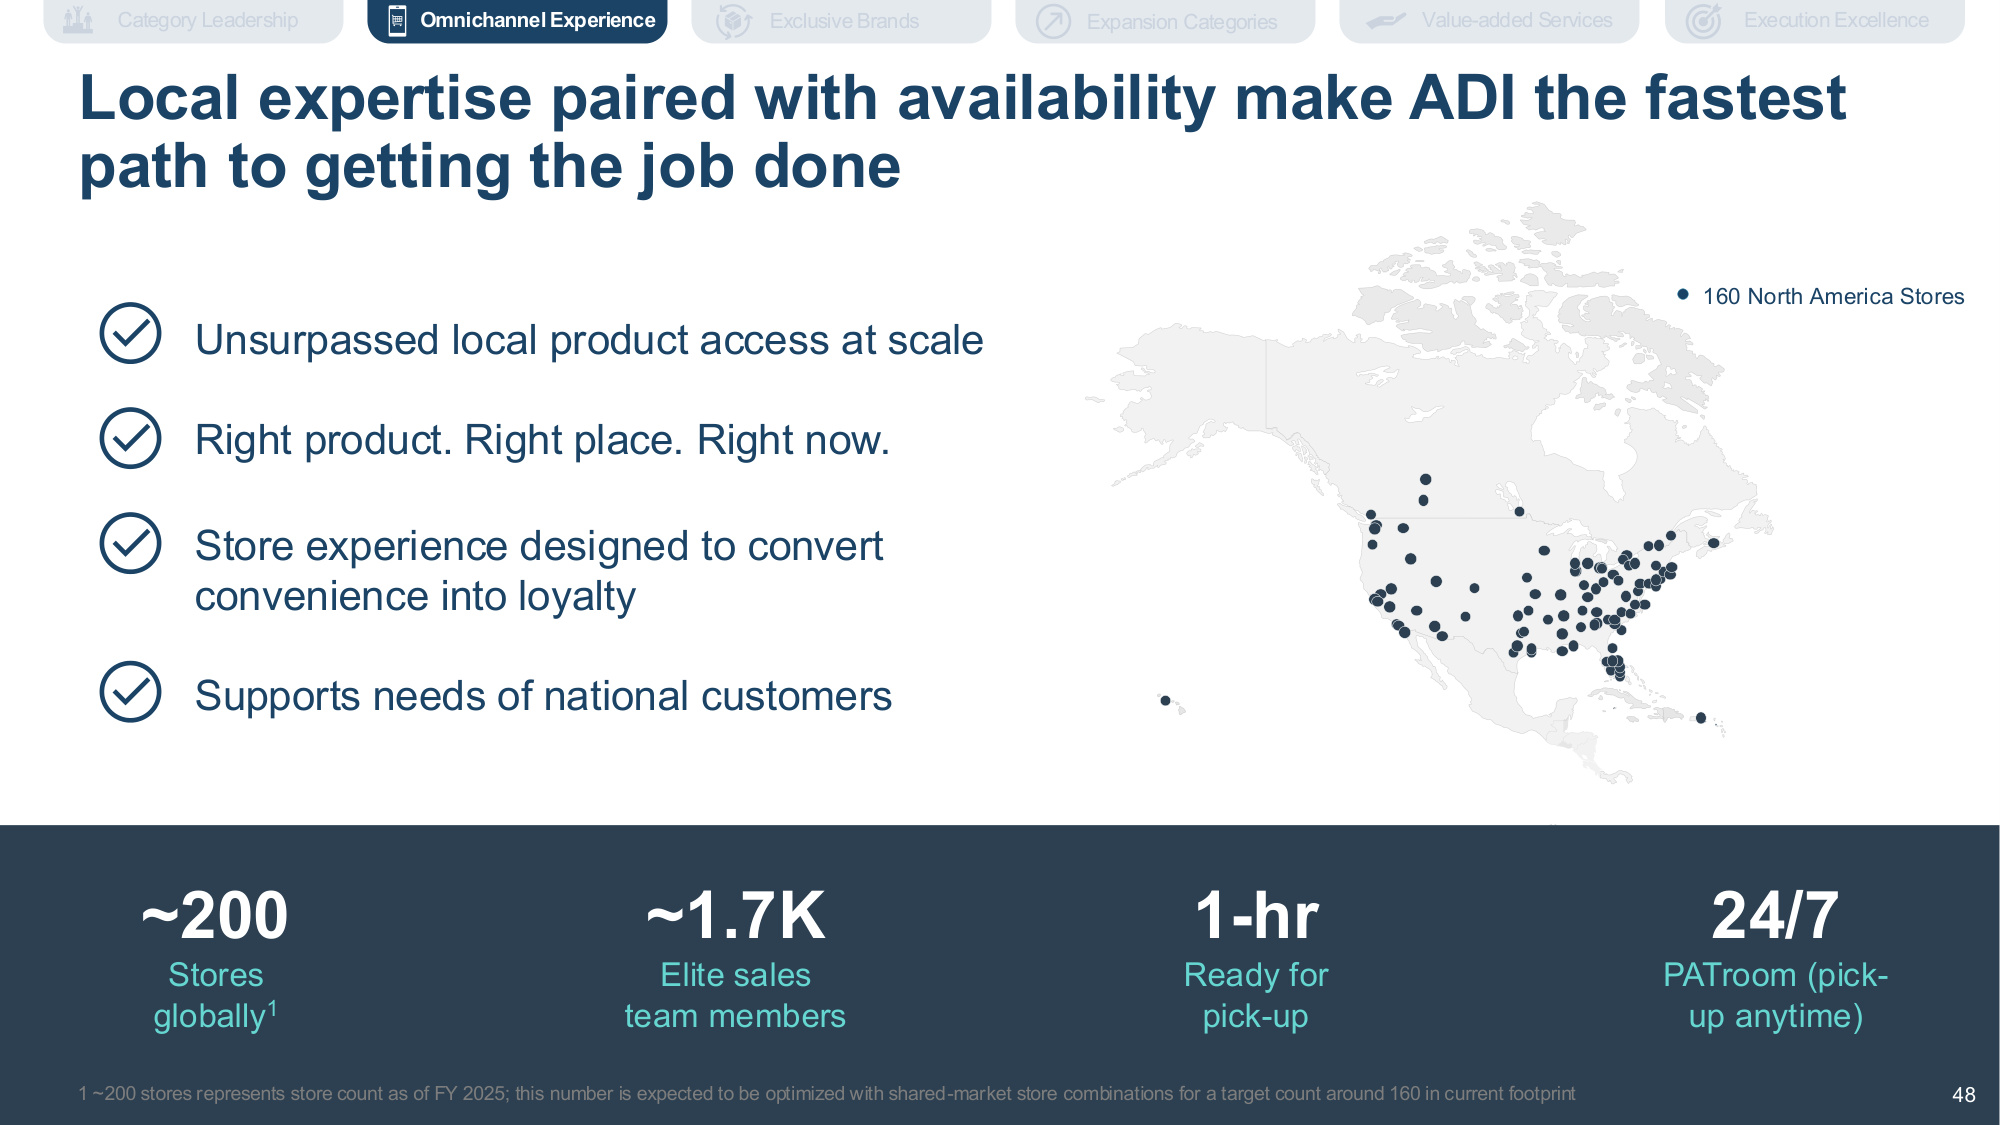
Company Confidential 48 48 ~1.7K Elite sales team members 1-hr Ready for pick-up ~200 Stores globally1 24/7 PATroom (pick- up anytime) Local expertise paired with availability make ADI the fastest path to getting the job done Unsurpassed local product access at scale Right product. Right place. Right now. Store experience designed to convert convenience into loyalty Supports needs of national customers 160 North America Stores 48 1 ~200 stores represents store count as of FY 2025; this number is expected to be optimized with shared-market store combinations for a target count around 160 in current footprint Execution Excellence Expansion Categories Value-added Services Omnichannel Experience Category Leadership Exclusive Brands
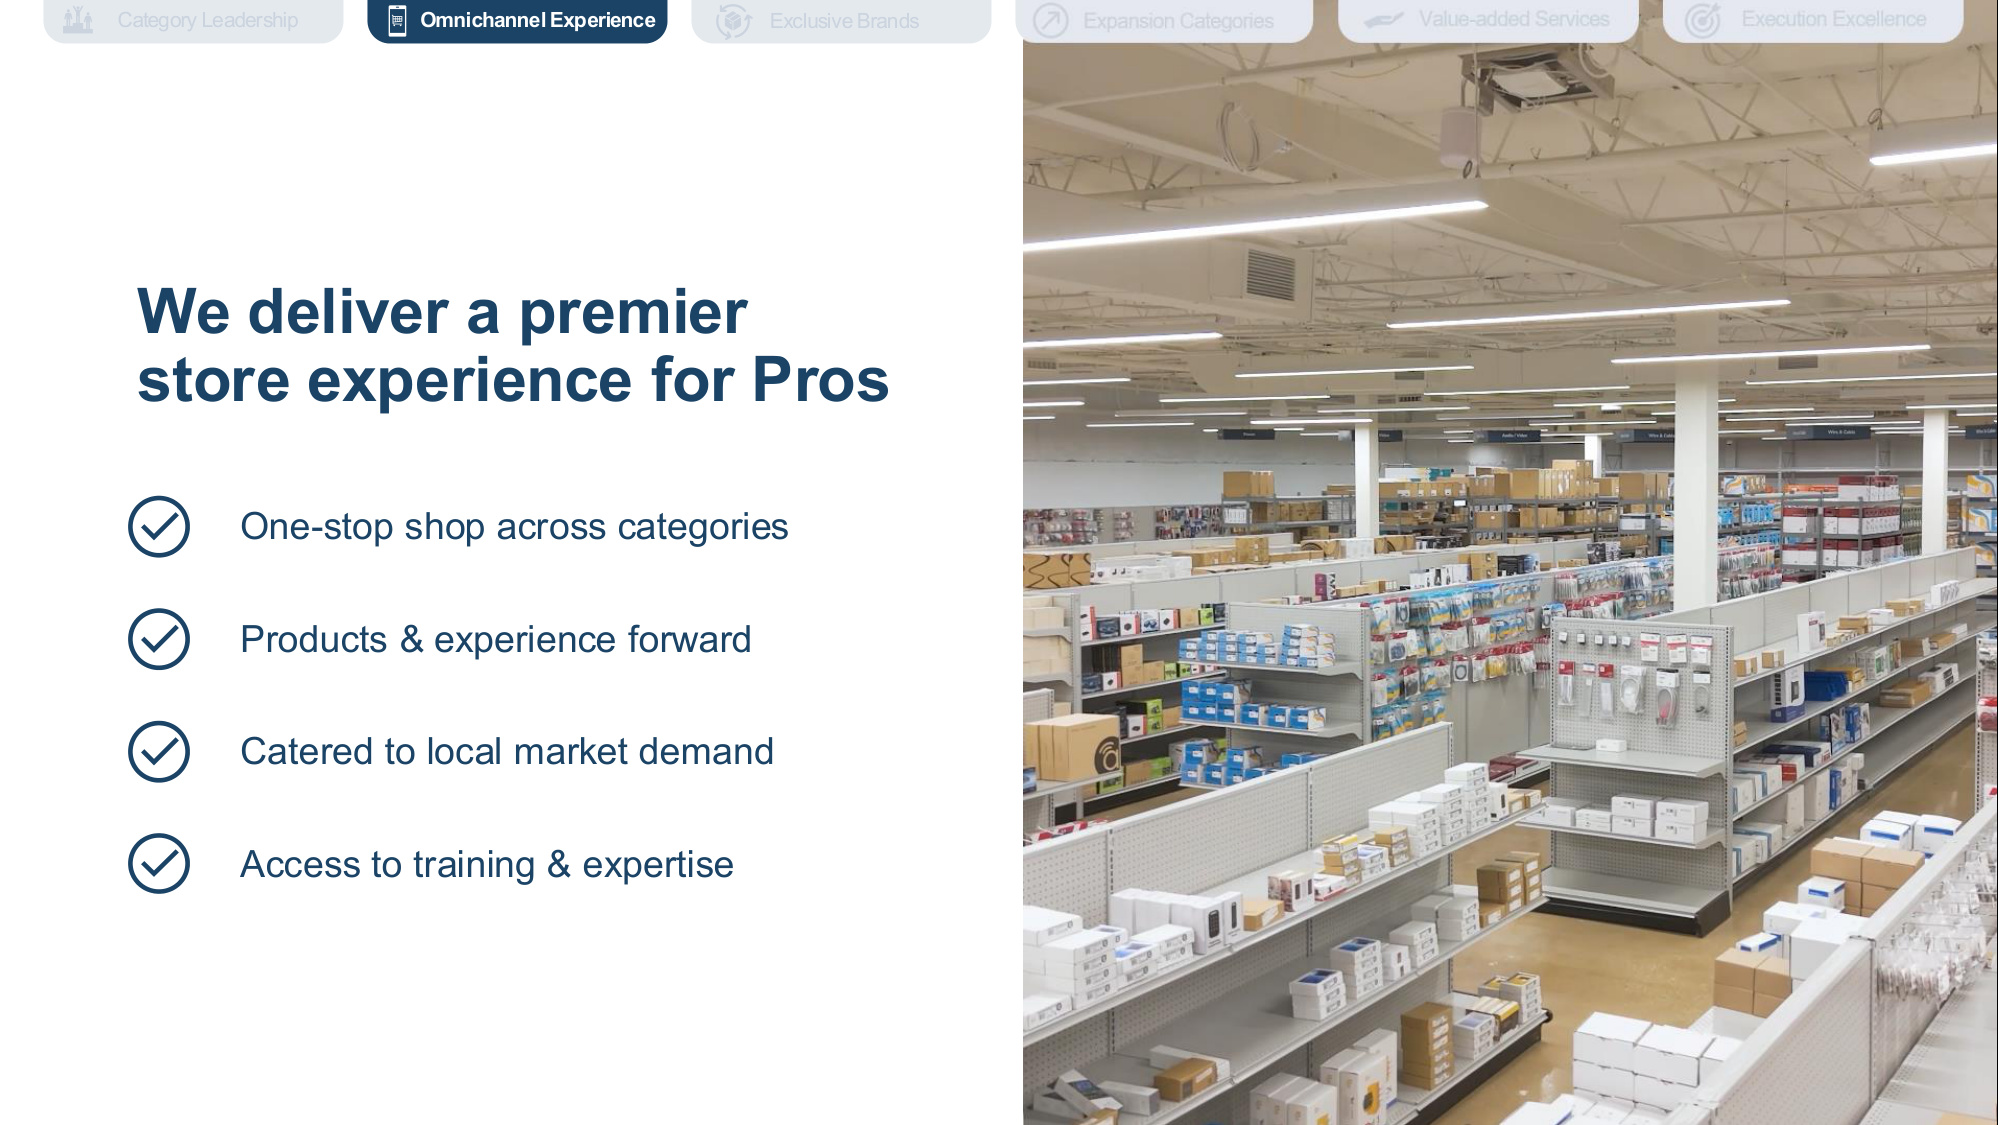
Company Confidential 49 We deliver a premier store experience for Pros One-stop shop across categories Products & experience forward Catered to local market demand Access to training & expertise 49 Execution Excellence Expansion Categories Value-added Services Omnichannel Experience Category Leadership Exclusive Brands
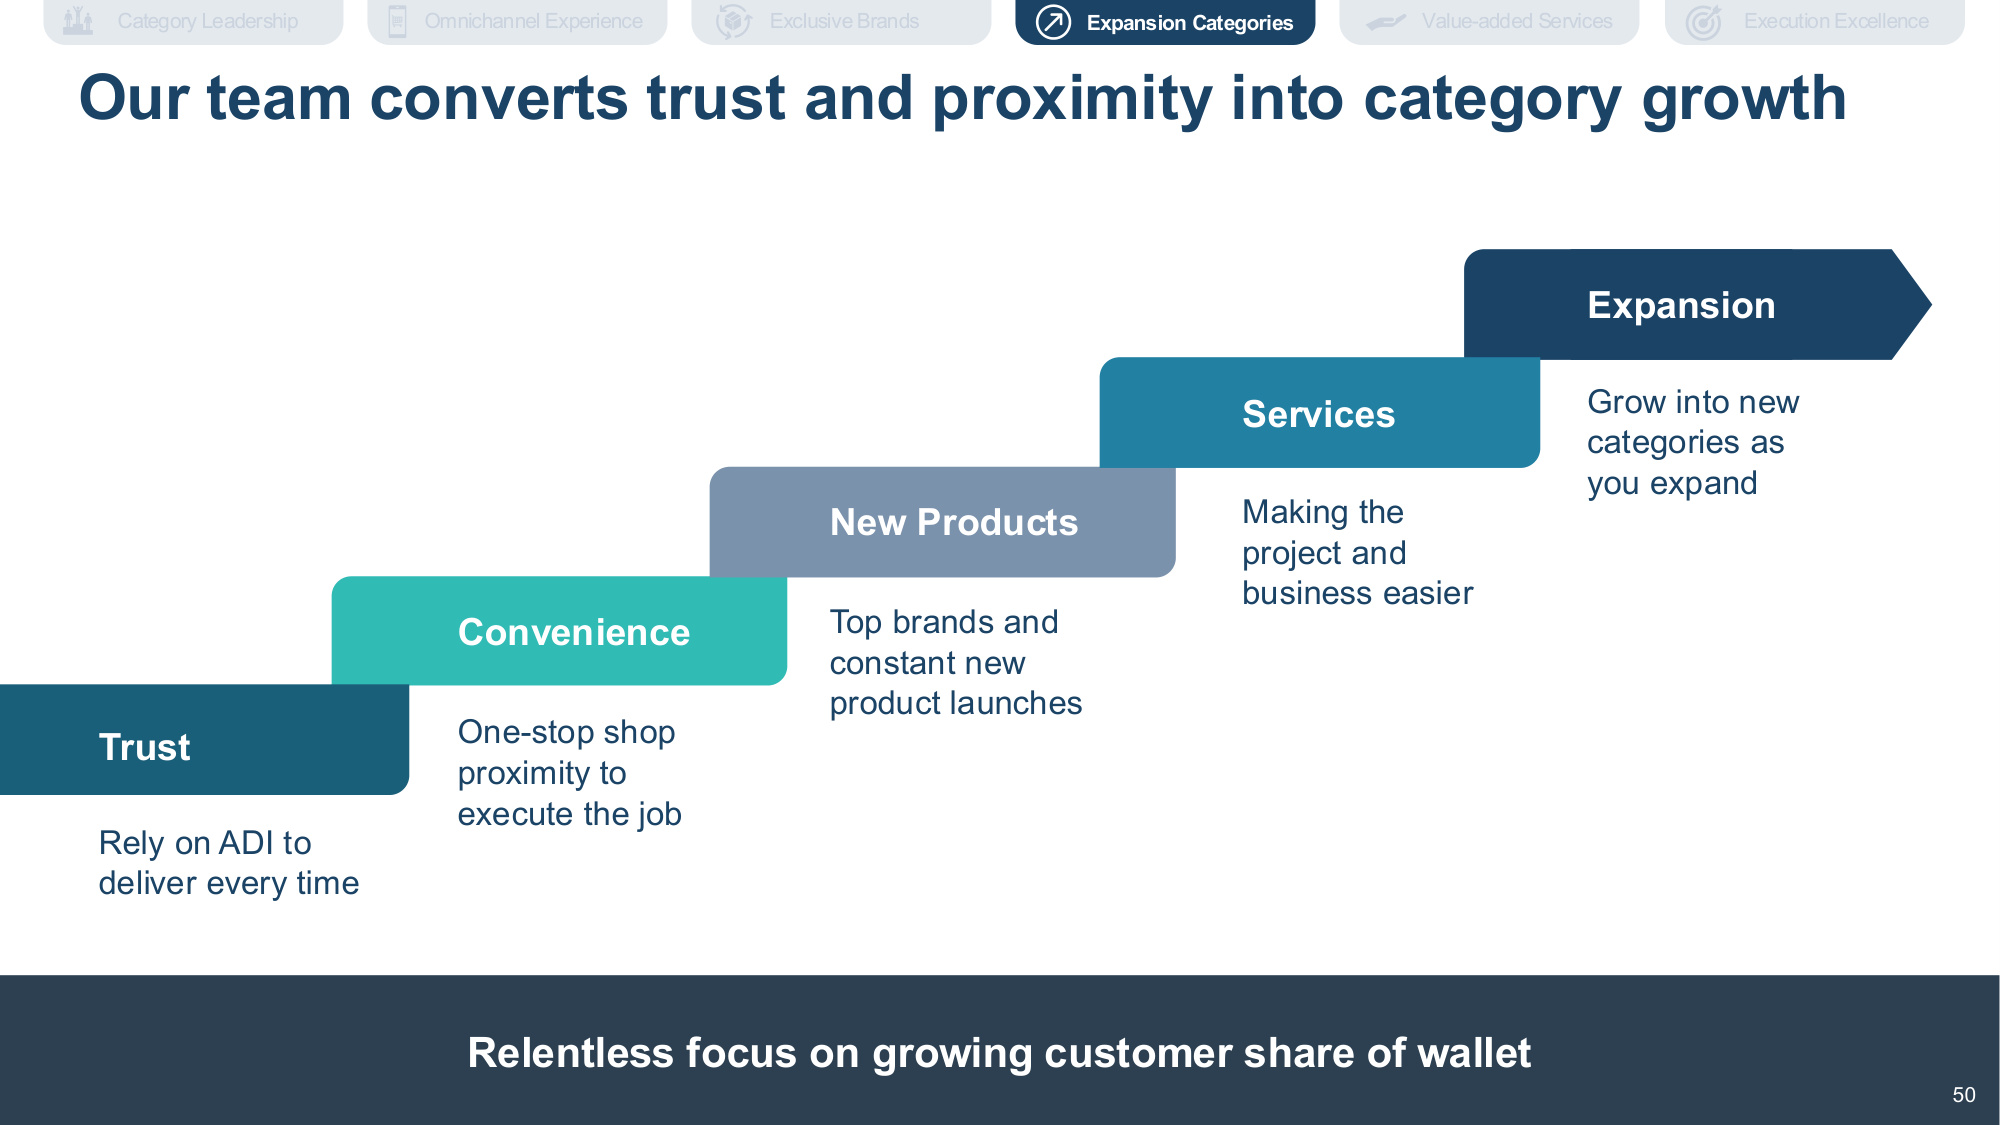
Company Confidential 50 50 One-stop shop proximity to execute the job Top brands and constant new product launches Making the project and business easier Convenience Grow into new categories as you expand Expansion New Products Services Relentless focus on growing customer share of wallet Rely on ADI to deliver every time Trust 50 Our team converts trust and proximity into category growth Execution Excellence Expansion Categories Exclusive Brands Value-added Services Category Leadership Omnichannel Experience
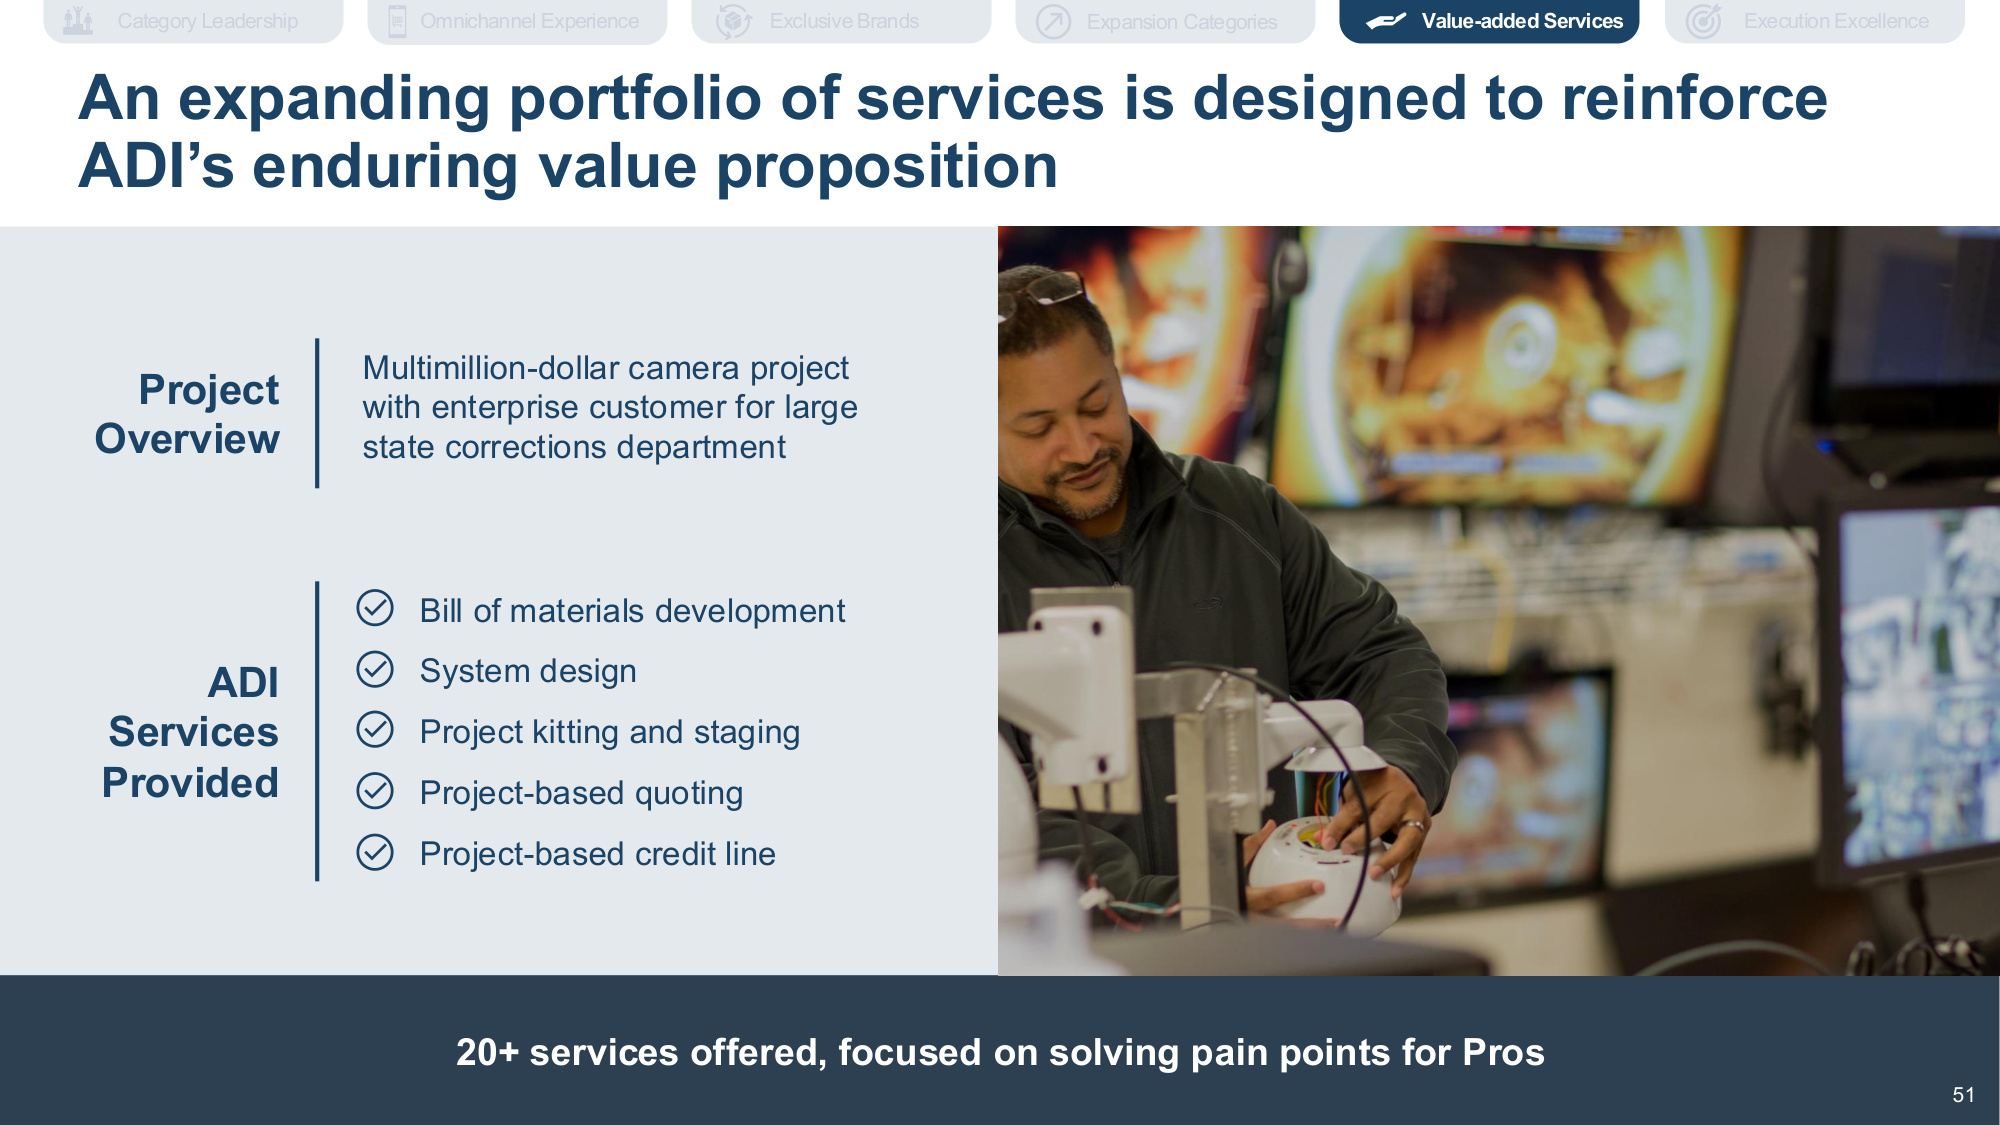
Company Confidential 51 51 20+ services offered, focused on solving pain points for Pros ADI Services Provided 51 Project Overview Multimillion-dollar camera project with enterprise customer for large state corrections department An expanding portfolio of services is designed to reinforce ADI's enduring value proposition Bill of materials development System design Project kitting and staging Project-based quoting Project-based credit line Execution Excellence Expansion Categories Exclusive Brands Value-added Services Category Leadership Omnichannel Experience
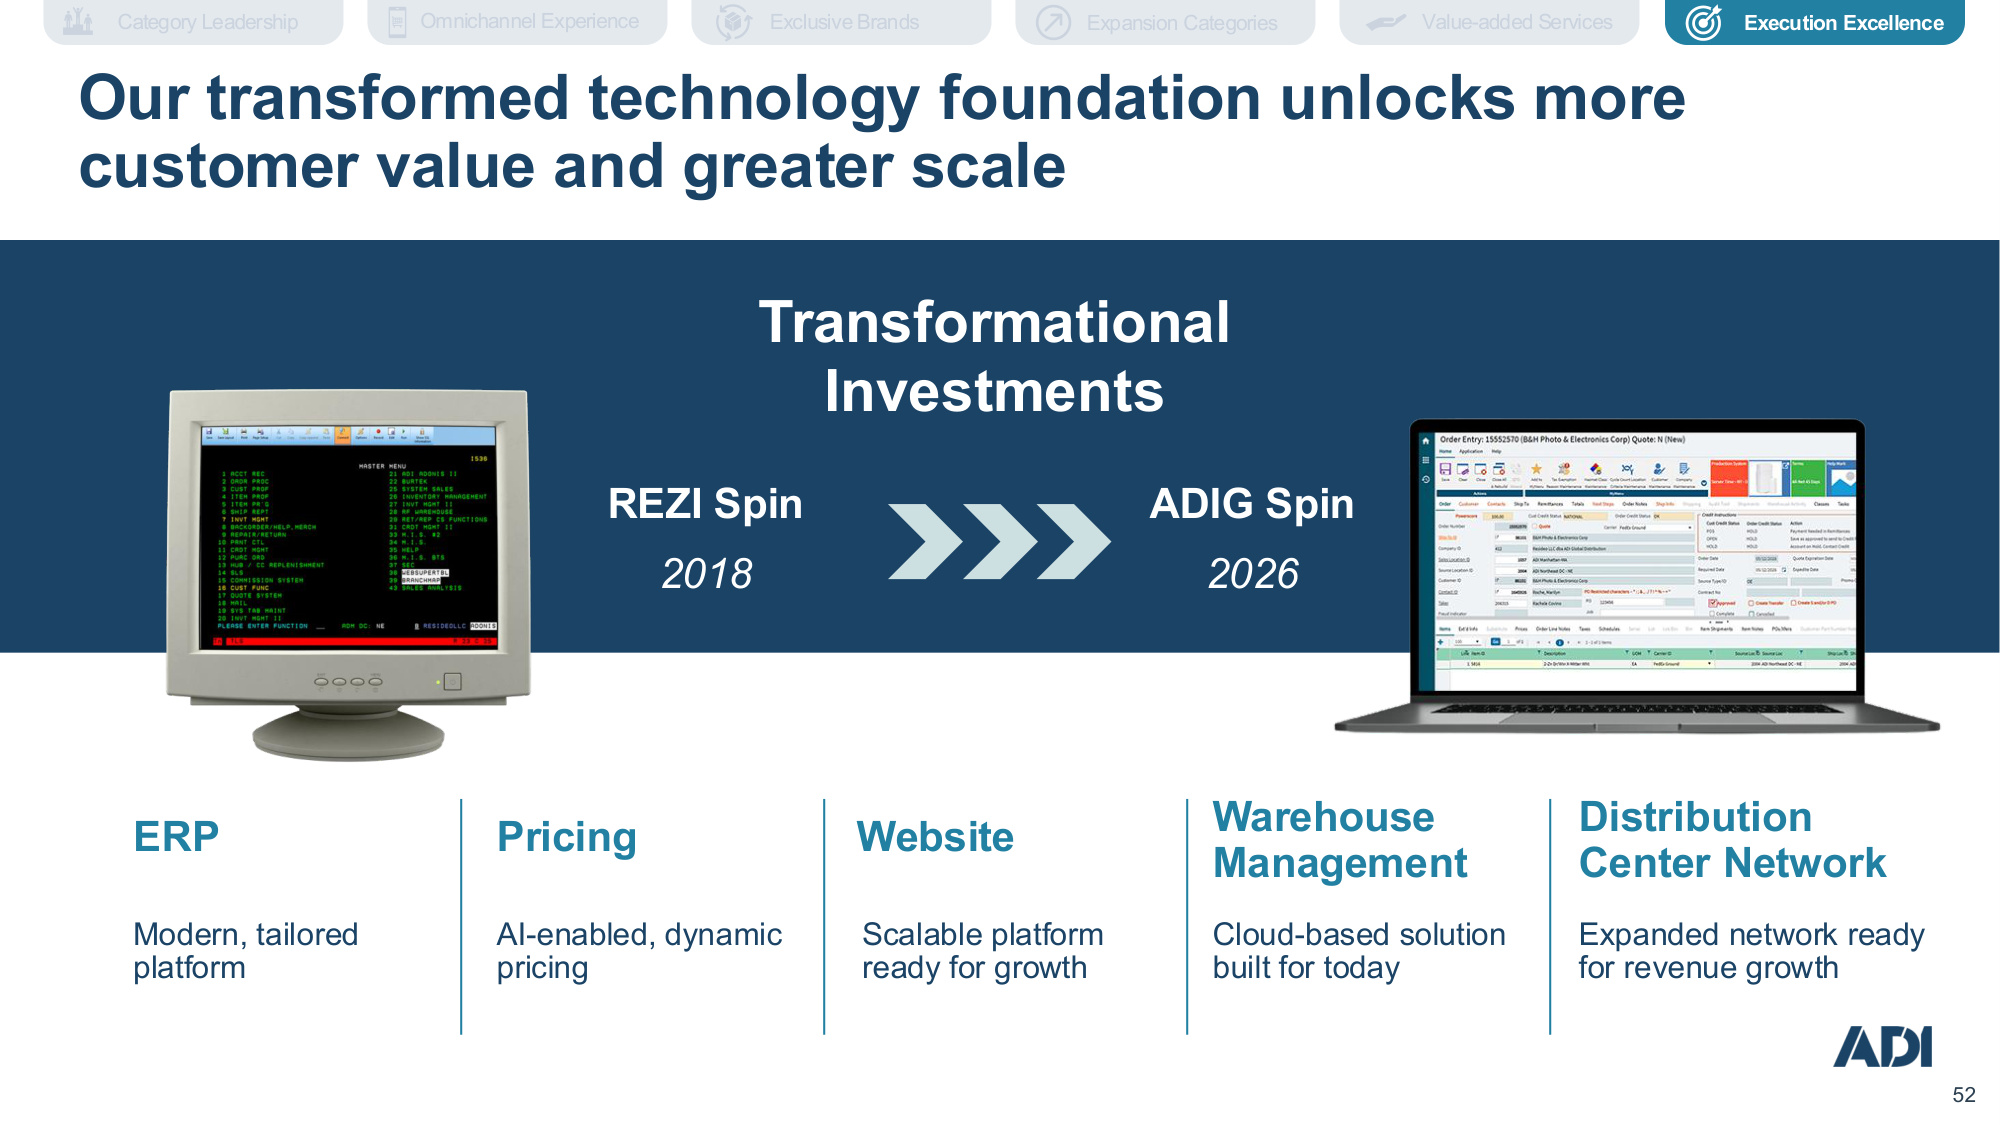
Company Confidential 52 52 Transformational Investments REZI Spin 2018 ADIG Spin 2026 Pricing Website Warehouse Management Distribution Center Network ERP AI-enabled, dynamic pricing Cloud-based solution built for today Scalable platform ready for growth Expanded network ready for revenue growth Modern, tailored platform Our transformed technology foundation unlocks more customer value and greater scale Execution Excellence Expansion Categories Exclusive Brands Value-added Services Category Leadership Omnichannel Experience
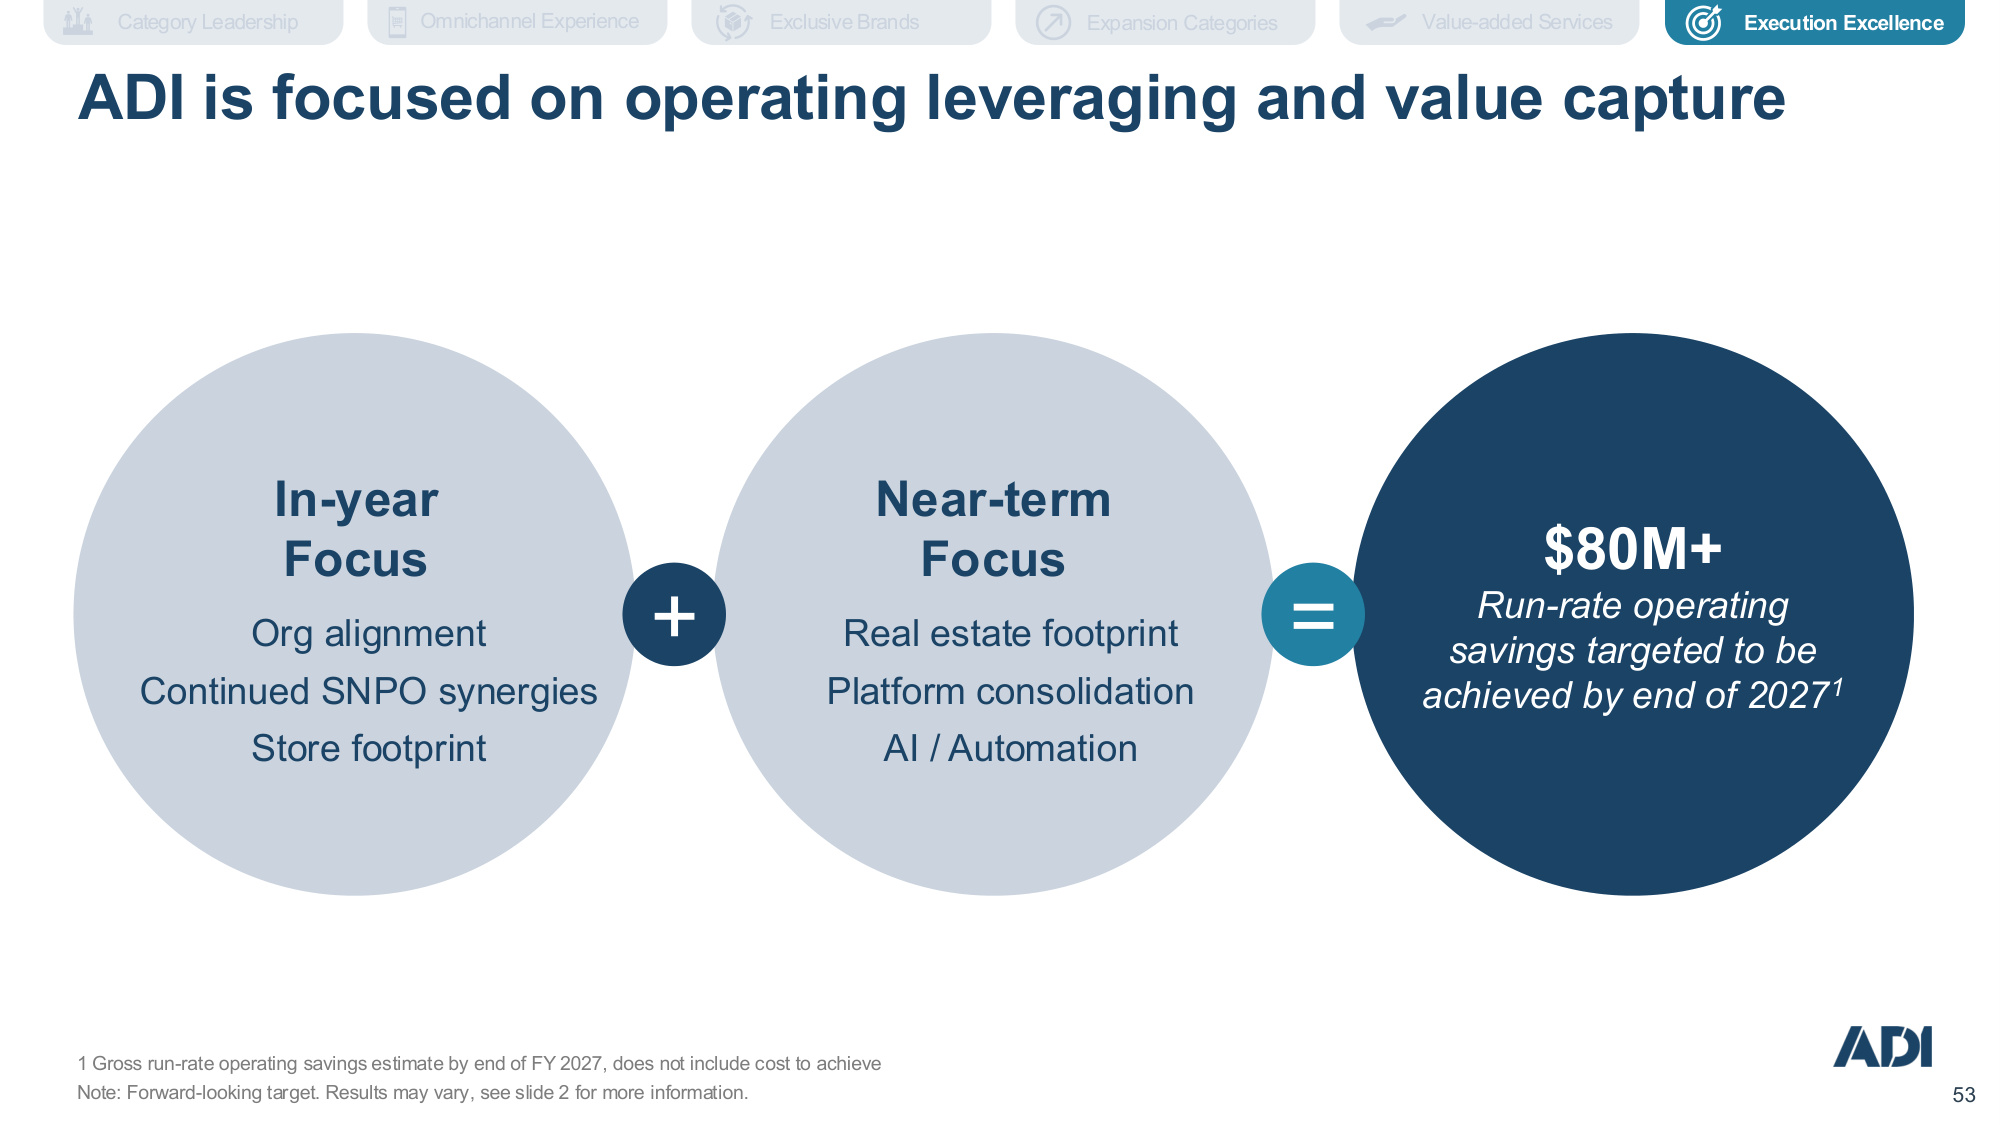
Company Confidential 53 53 + = $80M+ Run-rate operating savings targeted to be achieved by end of 20271 In-year Focus Near-term Focus Org alignment Continued SNPO synergies Store footprint Real estate footprint Platform consolidation AI / Automation ADI is focused on operating leveraging and value capture 1 Gross run-rate operating savings estimate by end of FY 2027, does not include cost to achieve Note: Forward-looking target. Results may vary, see slide 2 for more information. Execution Excellence Expansion Categories Exclusive Brands Value-added Services Category Leadership Omnichannel Experience
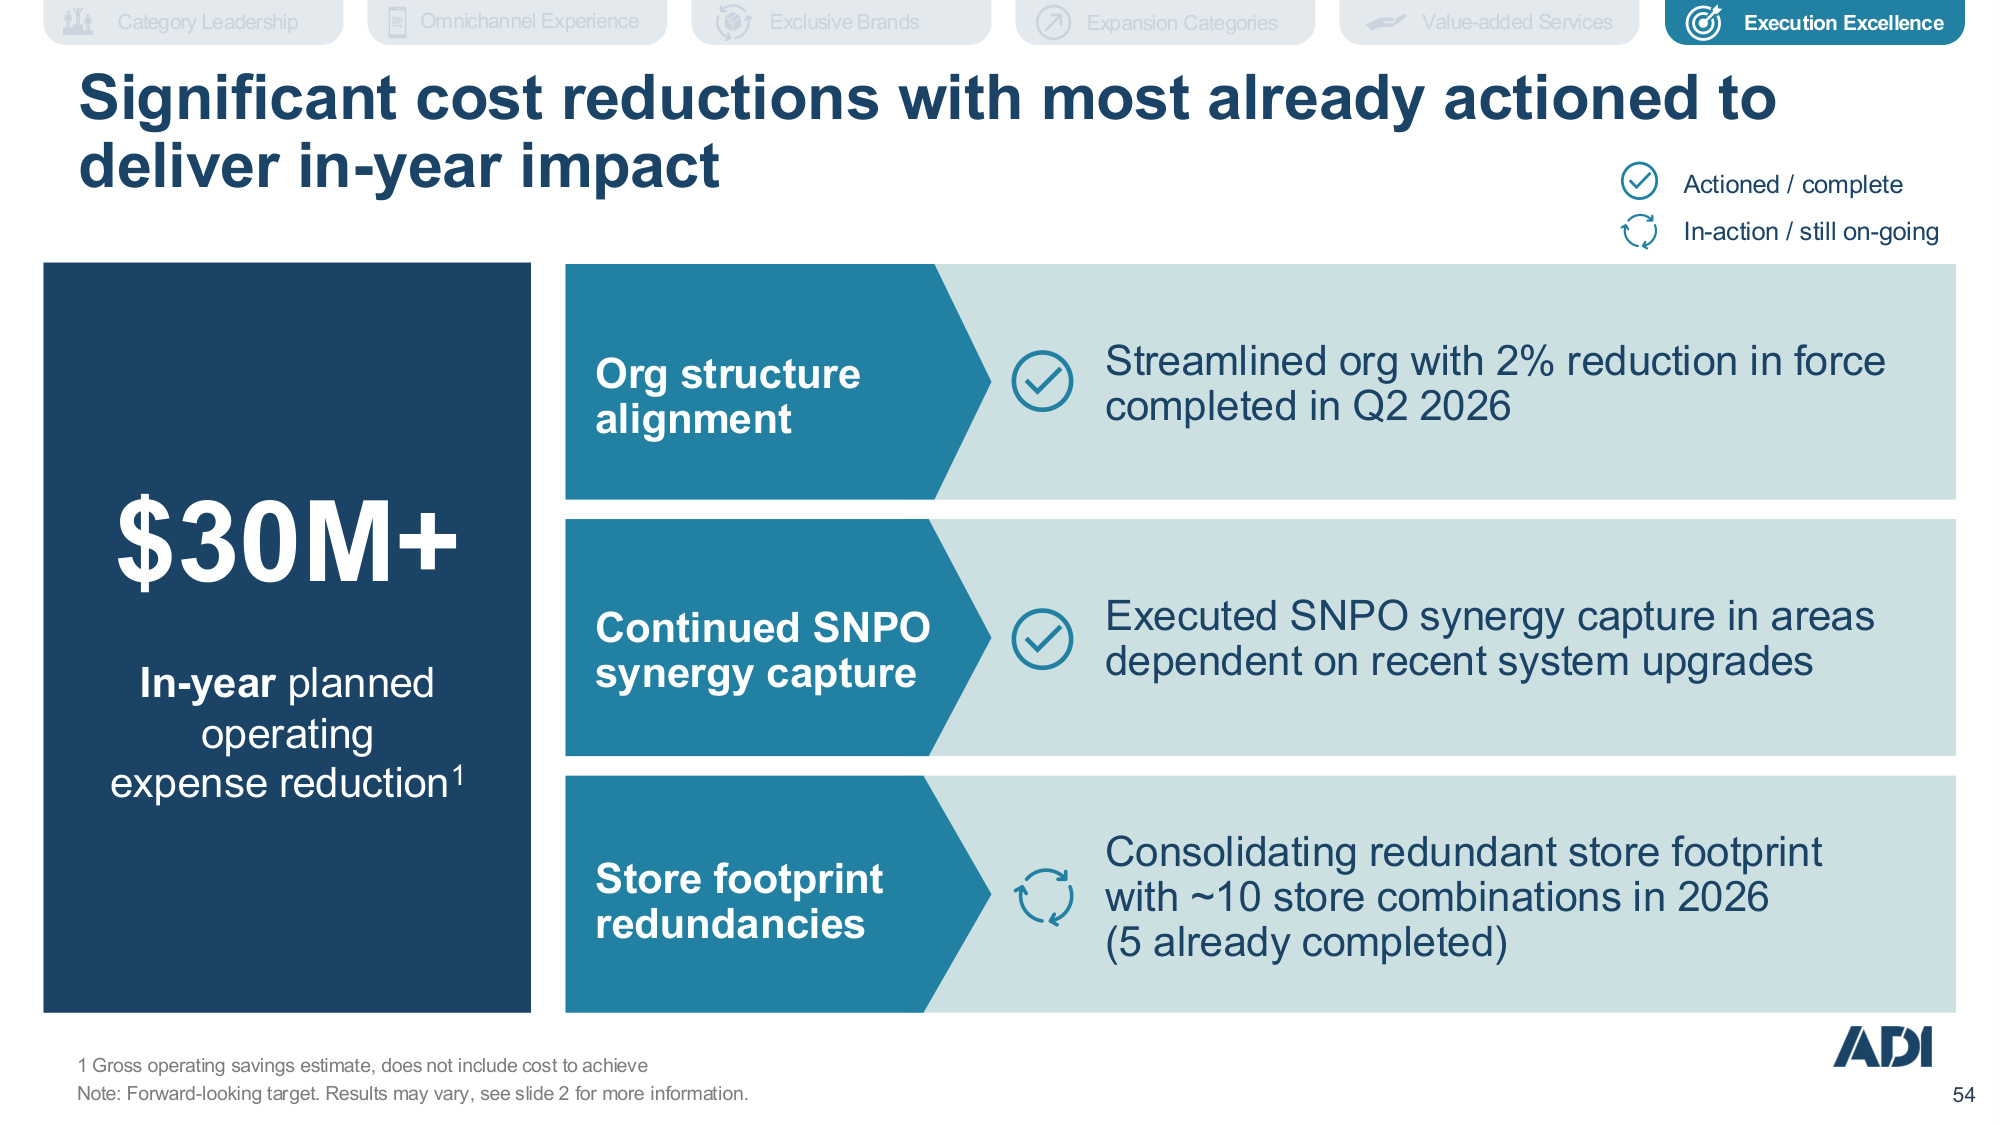
Company Confidential 54 54 Streamlined org with 2% reduction in force completed in Q2 2026 $30M+ In-year planned operating expense reduction1 Org structure alignment Store footprint redundancies Continued SNPO synergy capture Executed SNPO synergy capture in areas dependent on recent system upgrades Consolidating redundant store footprint with ~10 store combinations in 2026 (5 already completed) Significant cost reductions with most already actioned to deliver in-year impact Execution Excellence Expansion Categories Exclusive Brands Value-added Services Category Leadership Omnichannel Experience Actioned / complete In-action / still on-going 1 Gross operating savings estimate, does not include cost to achieve Note: Forward-looking target. Results may vary, see slide 2 for more information.
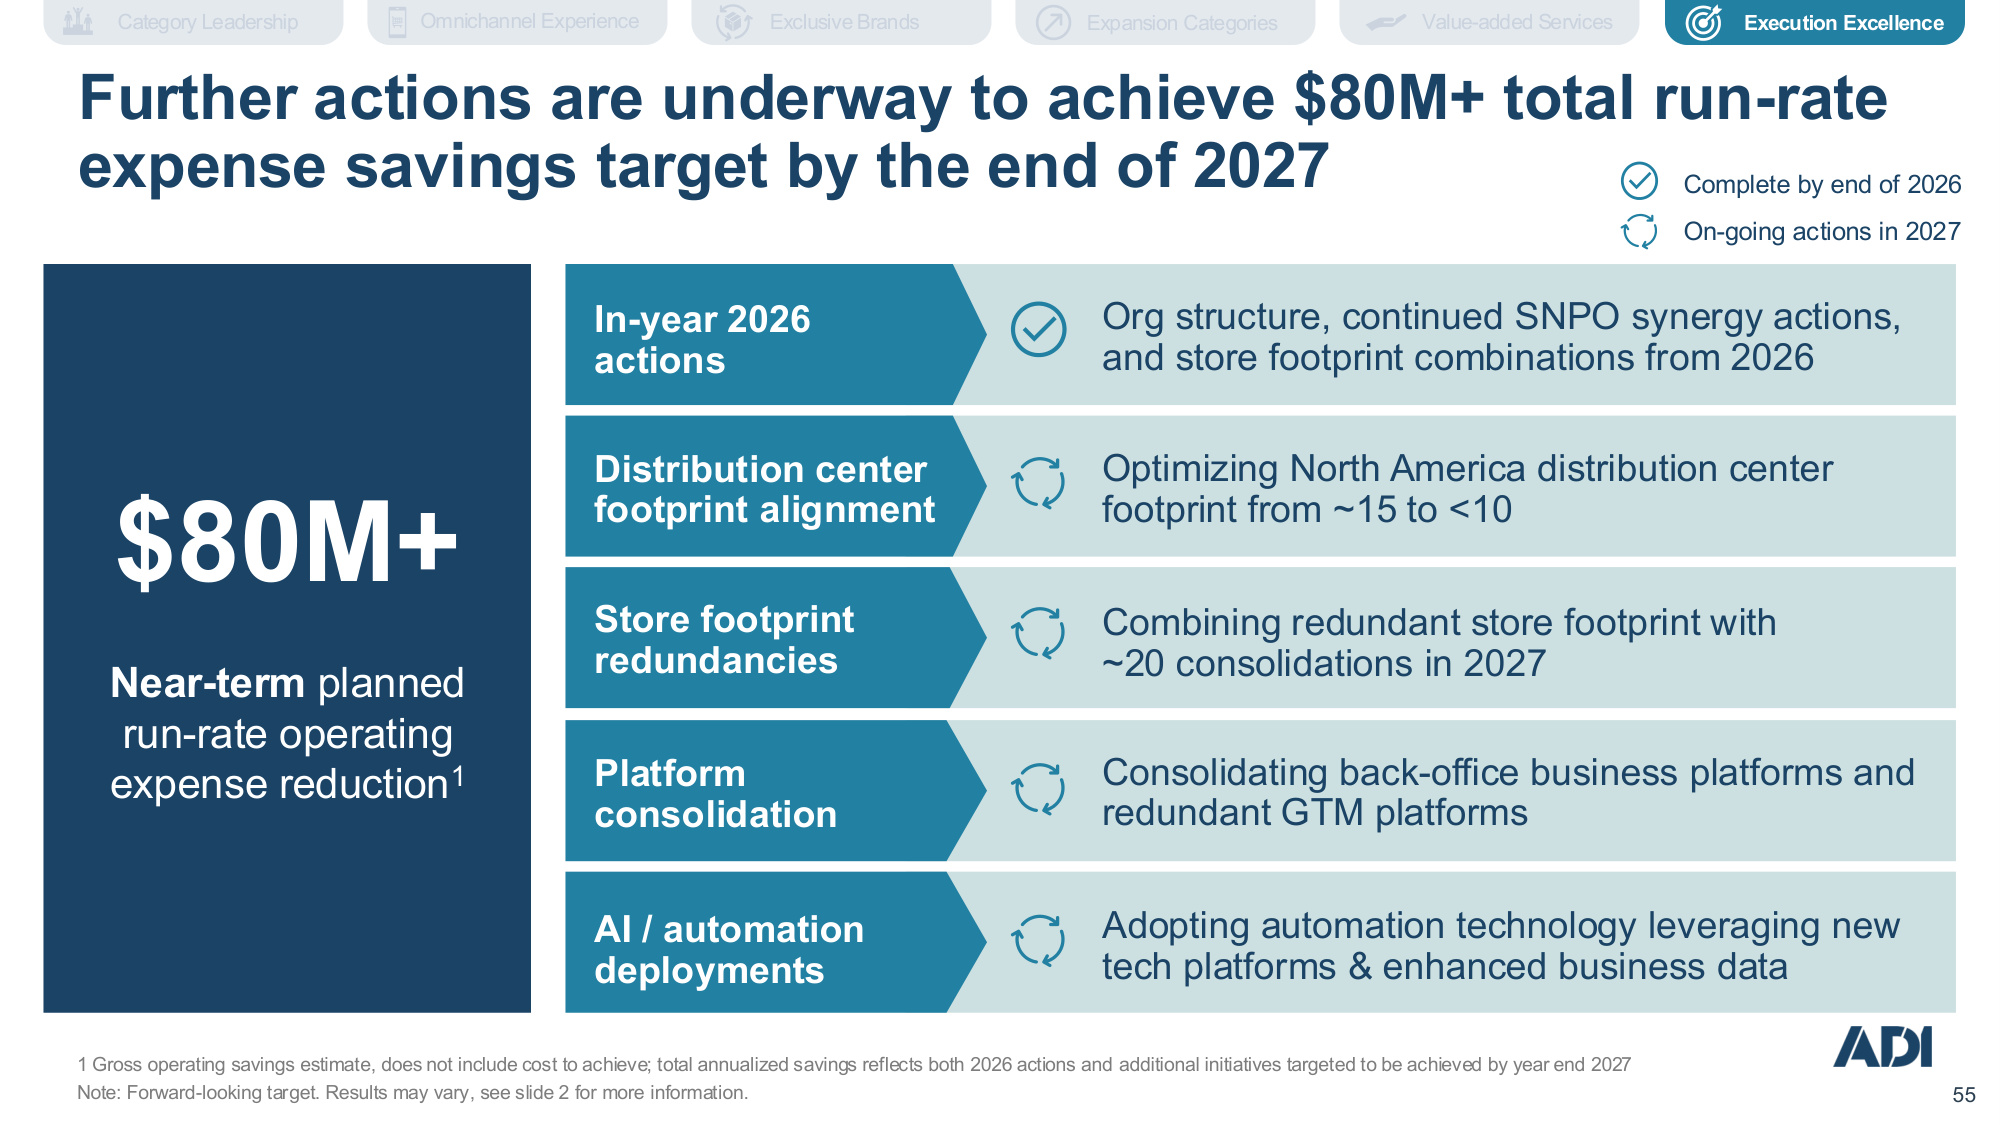
Company Confidential 55 55 $80M+ Near-term planned run-rate operating expense reduction1 Optimizing North America distribution center footprint from ~15 to <10 Distribution center footprint alignment AI / automation deployments Adopting automation technology leveraging new tech platforms & enhanced business data Platform consolidation Consolidating back-office business platforms and redundant GTM platforms Store footprint redundancies Combining redundant store footprint with ~20 consolidations in 2027 Further actions are underway to achieve $80M+ total run-rate expense savings target by the end of 2027 Execution Excellence Expansion Categories Exclusive Brands Value-added Services Category Leadership Omnichannel Experience 1 Gross operating savings estimate, does not include cost to achieve; total annualized savings reflects both 2026 actions and additional initiatives targeted to be achieved by year end 2027 Note: Forward-looking target. Results may vary, see slide 2 for more information. Org structure, continued SNPO synergy actions, and store footprint combinations from 2026 In-year 2026 actions Complete by end of 2026 On-going actions in 2027
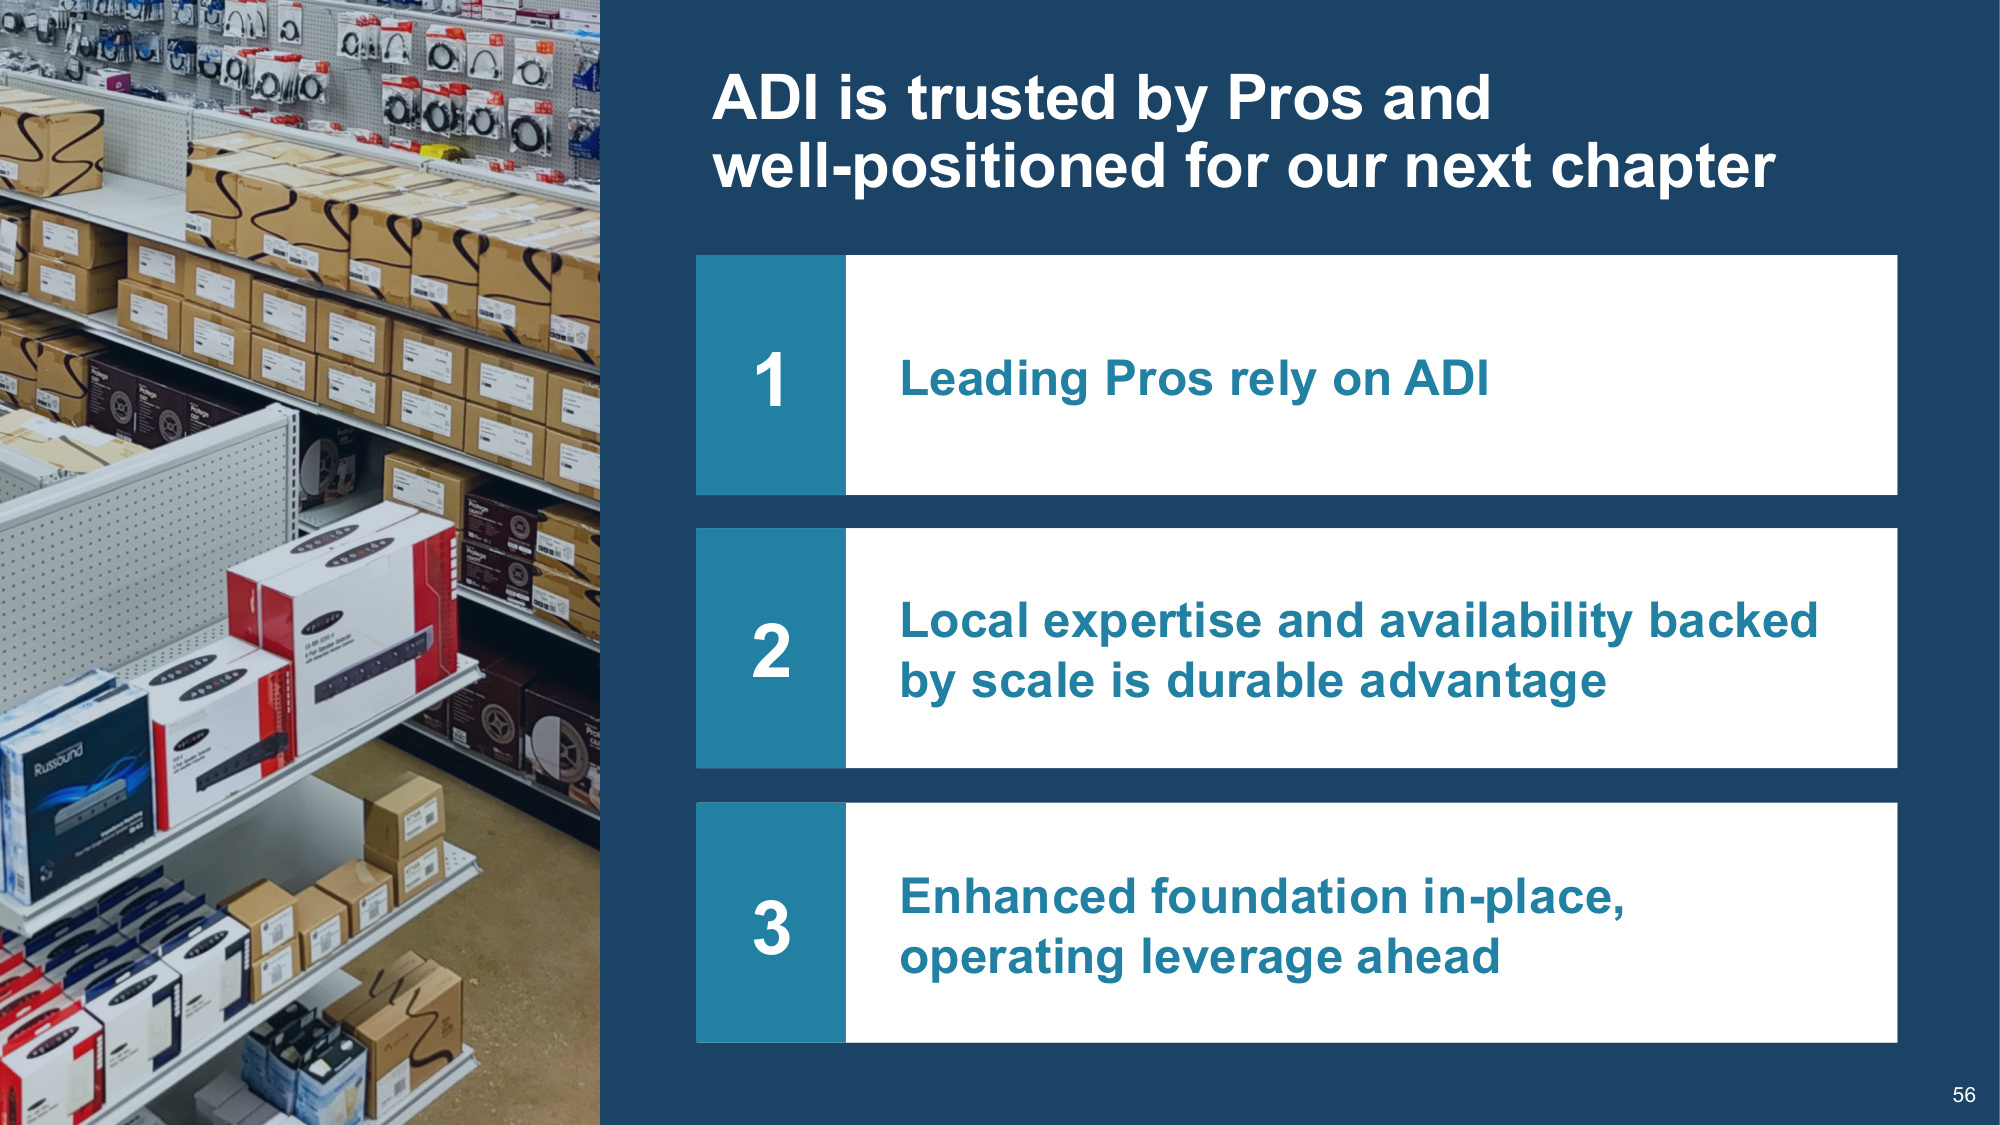
Company Confidential 56 c Leading Pros rely on ADI Local expertise and availability backed by scale is durable advantage Enhanced foundation in-place, operating leverage ahead 1 2 3 56 ADI is trusted by Pros and well-positioned for our next chapter

Company Confidential 57 57 Kevin Prush SVP, Strategic Finance Financial Performance The pathway to growth and robust margin expansion 57
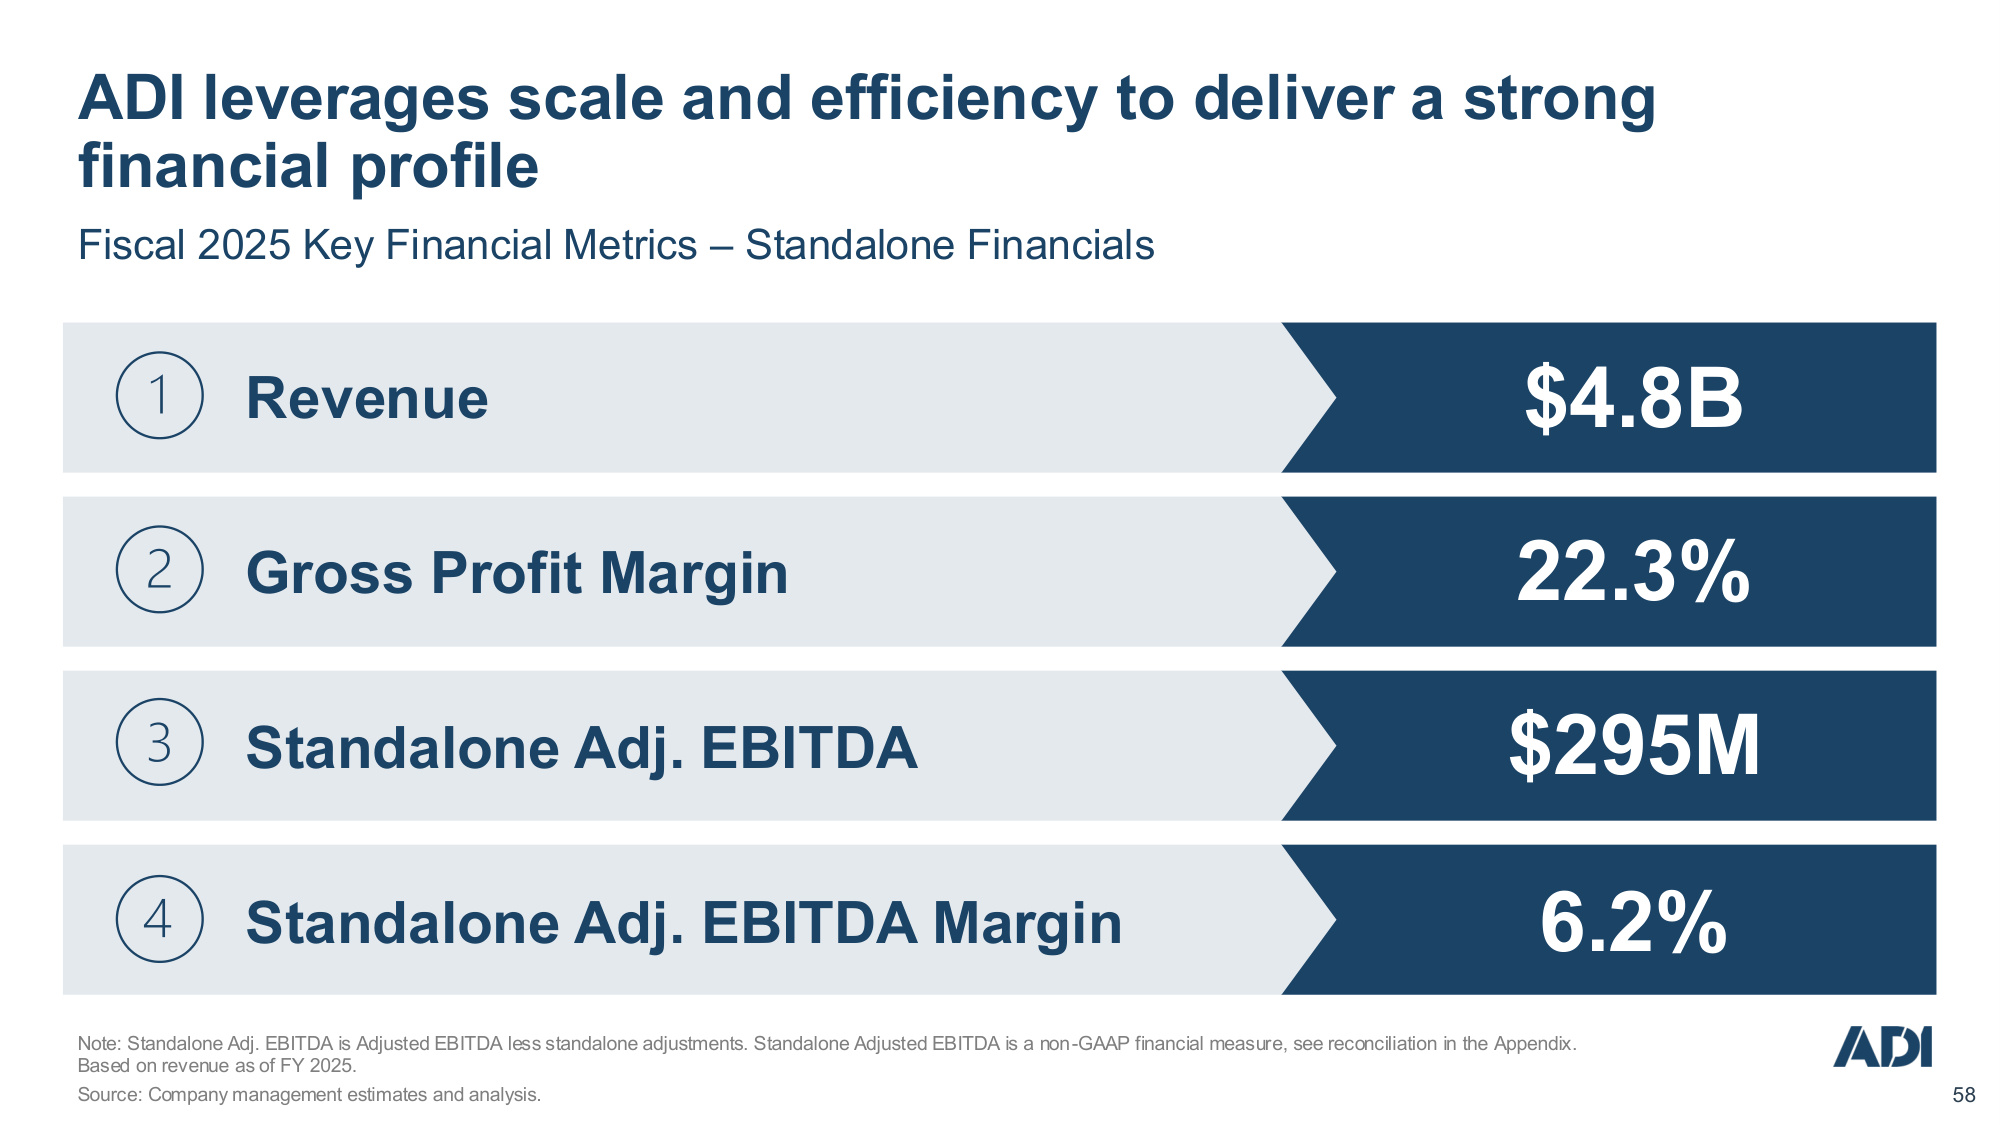
Company Confidential 58 58 Revenue Gross Profit Margin Standalone Adj. EBITDA Standalone Adj. EBITDA Margin $4.8B 22.3% $295M 6.2% Fiscal 2025 Key Financial Metrics – Standalone Financials Note: Standalone Adj. EBITDA is Adjusted EBITDA less standalone adjustments. Standalone Adjusted EBITDA is a non-GAAP financial measure, see reconciliation in the Appendix. Based on revenue as of FY 2025. Source: Company management estimates and analysis. ADI leverages scale and efficiency to deliver a strong financial profile
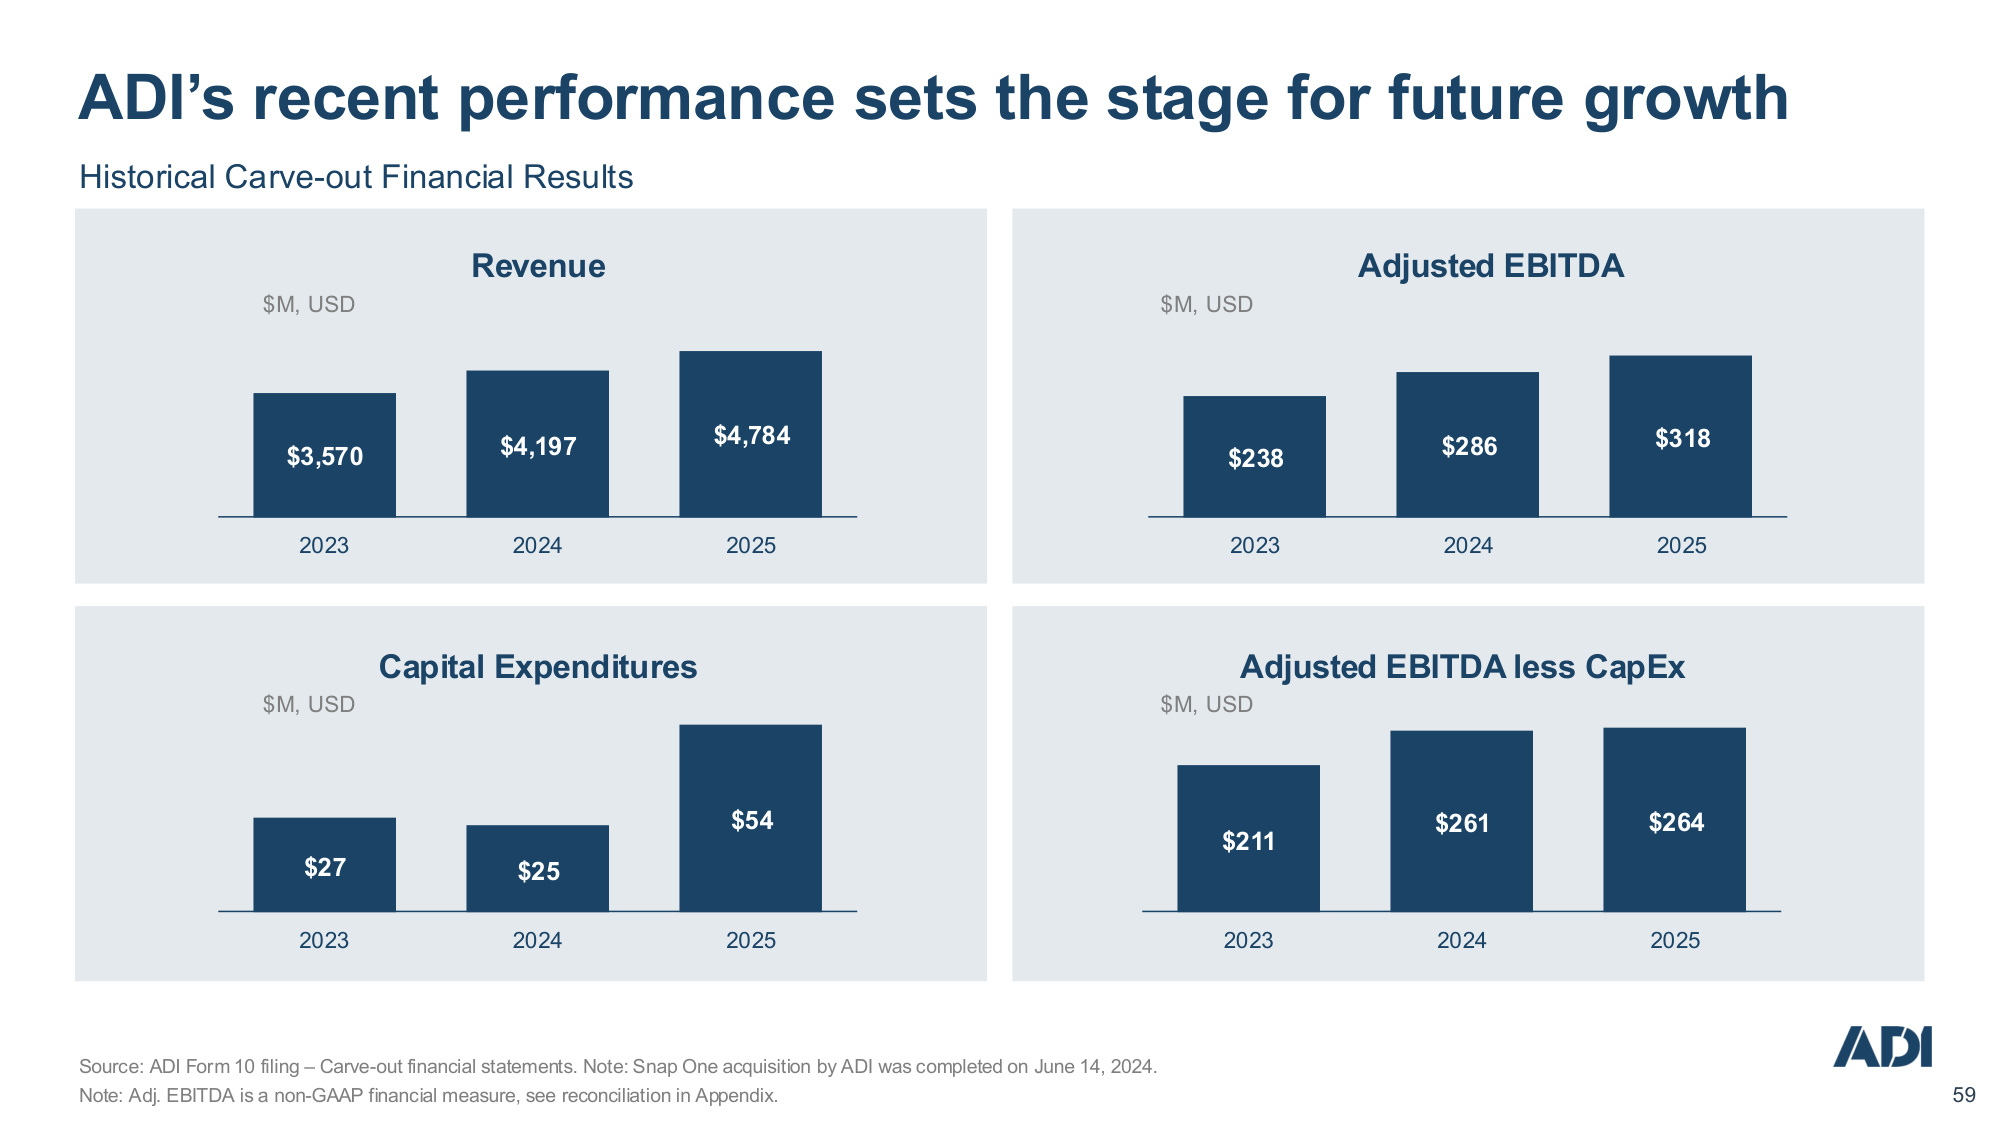
Company Confidential 59 59 $3,570 $4,197 $4,784 2023 2024 2025 Revenue $27 $25 $54 2023 2024 2025 Capital Expenditures $211 $261 $264 2023 2024 2025 Adjusted EBITDA less CapEx Historical Carve-out Financial Results ADI's recent performance sets the stage for future growth $238 $286 $318 2023 2024 2025 Adjusted EBITDA Source: ADI Form 10 filing – Carve-out financial statements. Note: Snap One acquisition by ADI was completed on June 14, 2024. Note: Adj. EBITDA is a non-GAAP financial measure, see reconciliation in Appendix. $M, USD $M, USD $M, USD $M, USD
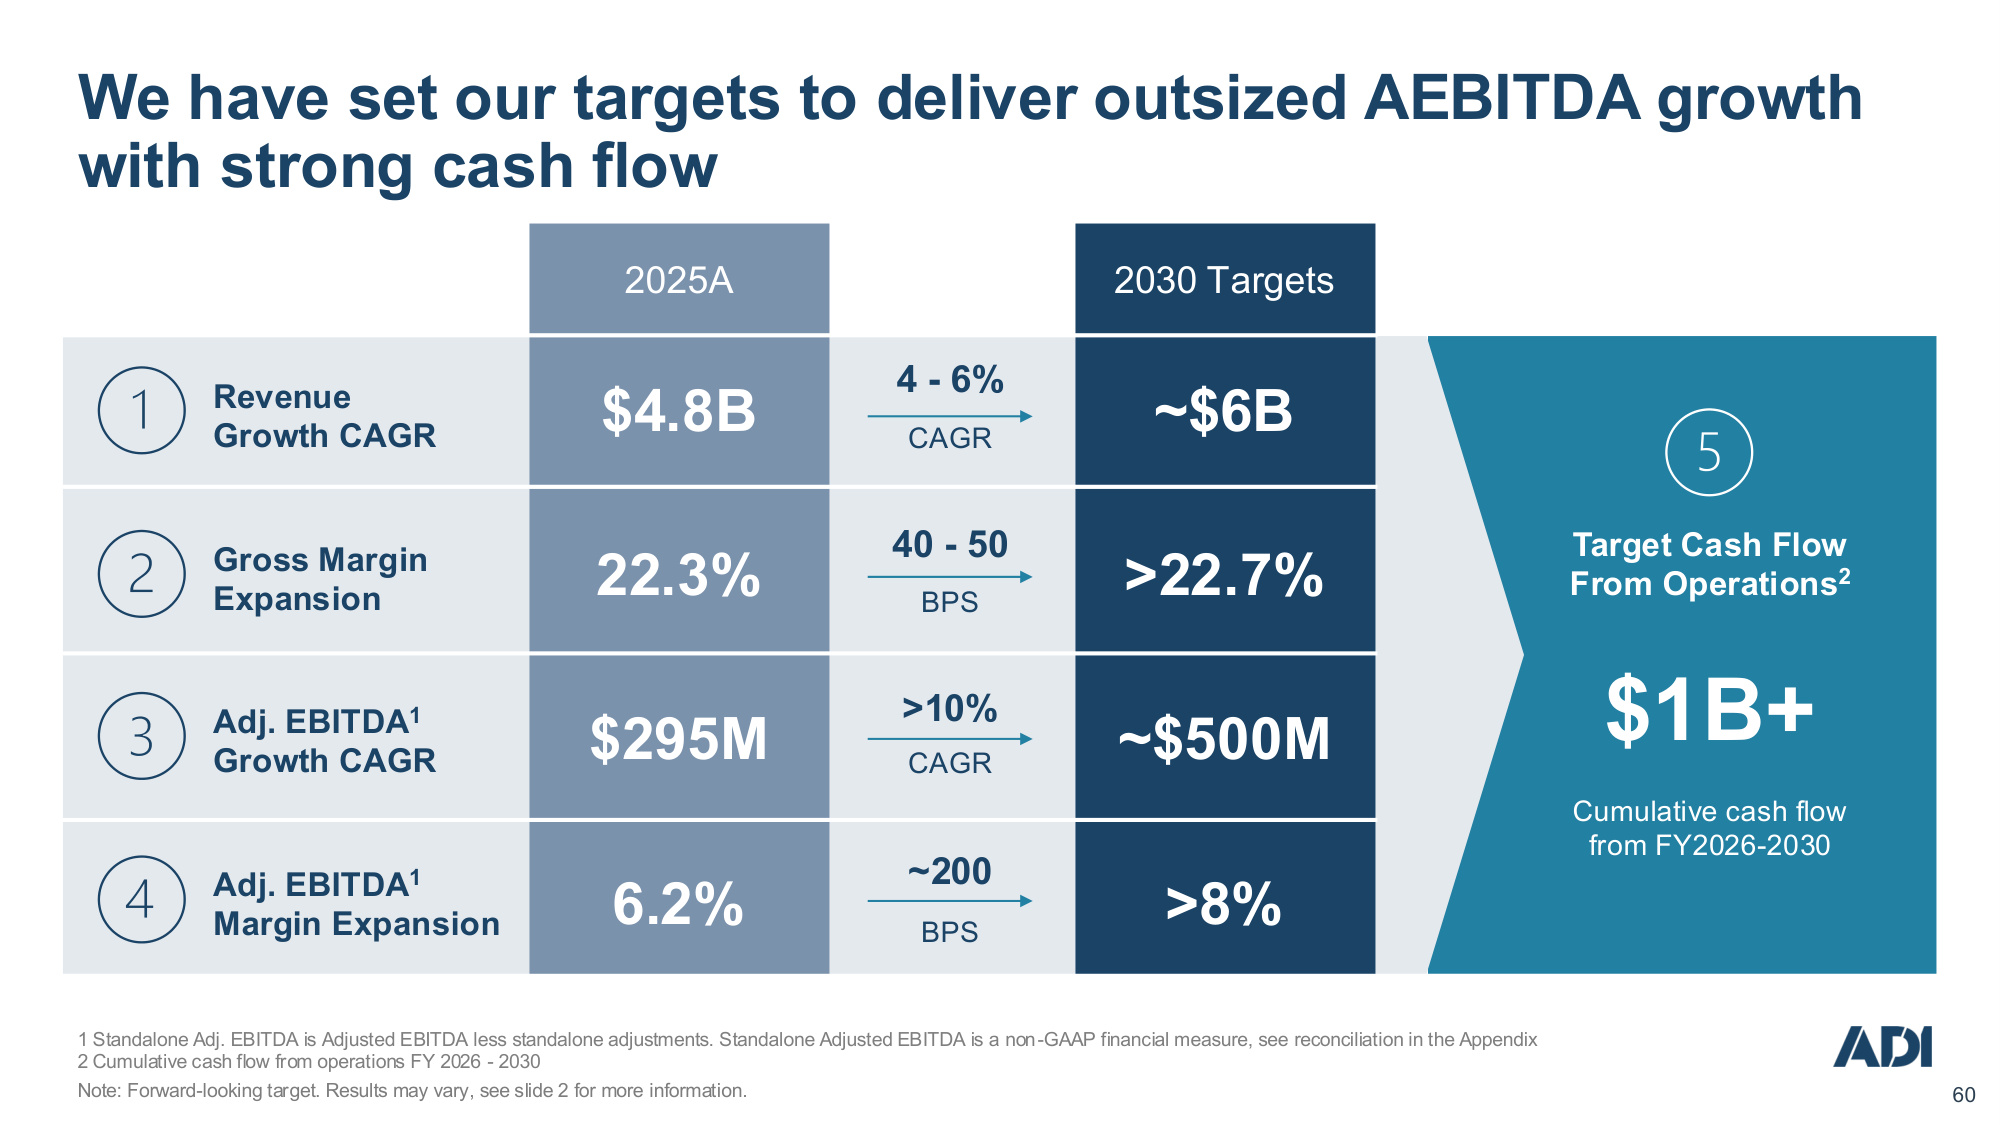
Company Confidential 60 60 1 Standalone Adj. EBITDA is Adjusted EBITDA less standalone adjustments. Standalone Adjusted EBITDA is a non-GAAP financial measure, see reconciliation in the Appendix 2 Cumulative cash flow from operations FY 2026 - 2030 Note: Forward-looking target. Results may vary, see slide 2 for more information. We have set our targets to deliver outsized AEBITDA growth with strong cash flow $1B+ 2025A 2030 Targets Adj. EBITDA1 Growth CAGR Revenue Growth CAGR Gross Margin Expansion ~$6B $4.8B >22.7% 22.3% ~$500M $295M Adj. EBITDA1 Margin Expansion >8% 6.2% 4 - 6% CAGR 40 - 50 BPS >10% CAGR ~200 BPS Cumulative cash flow from FY2026-2030 Target Cash Flow From Operations2
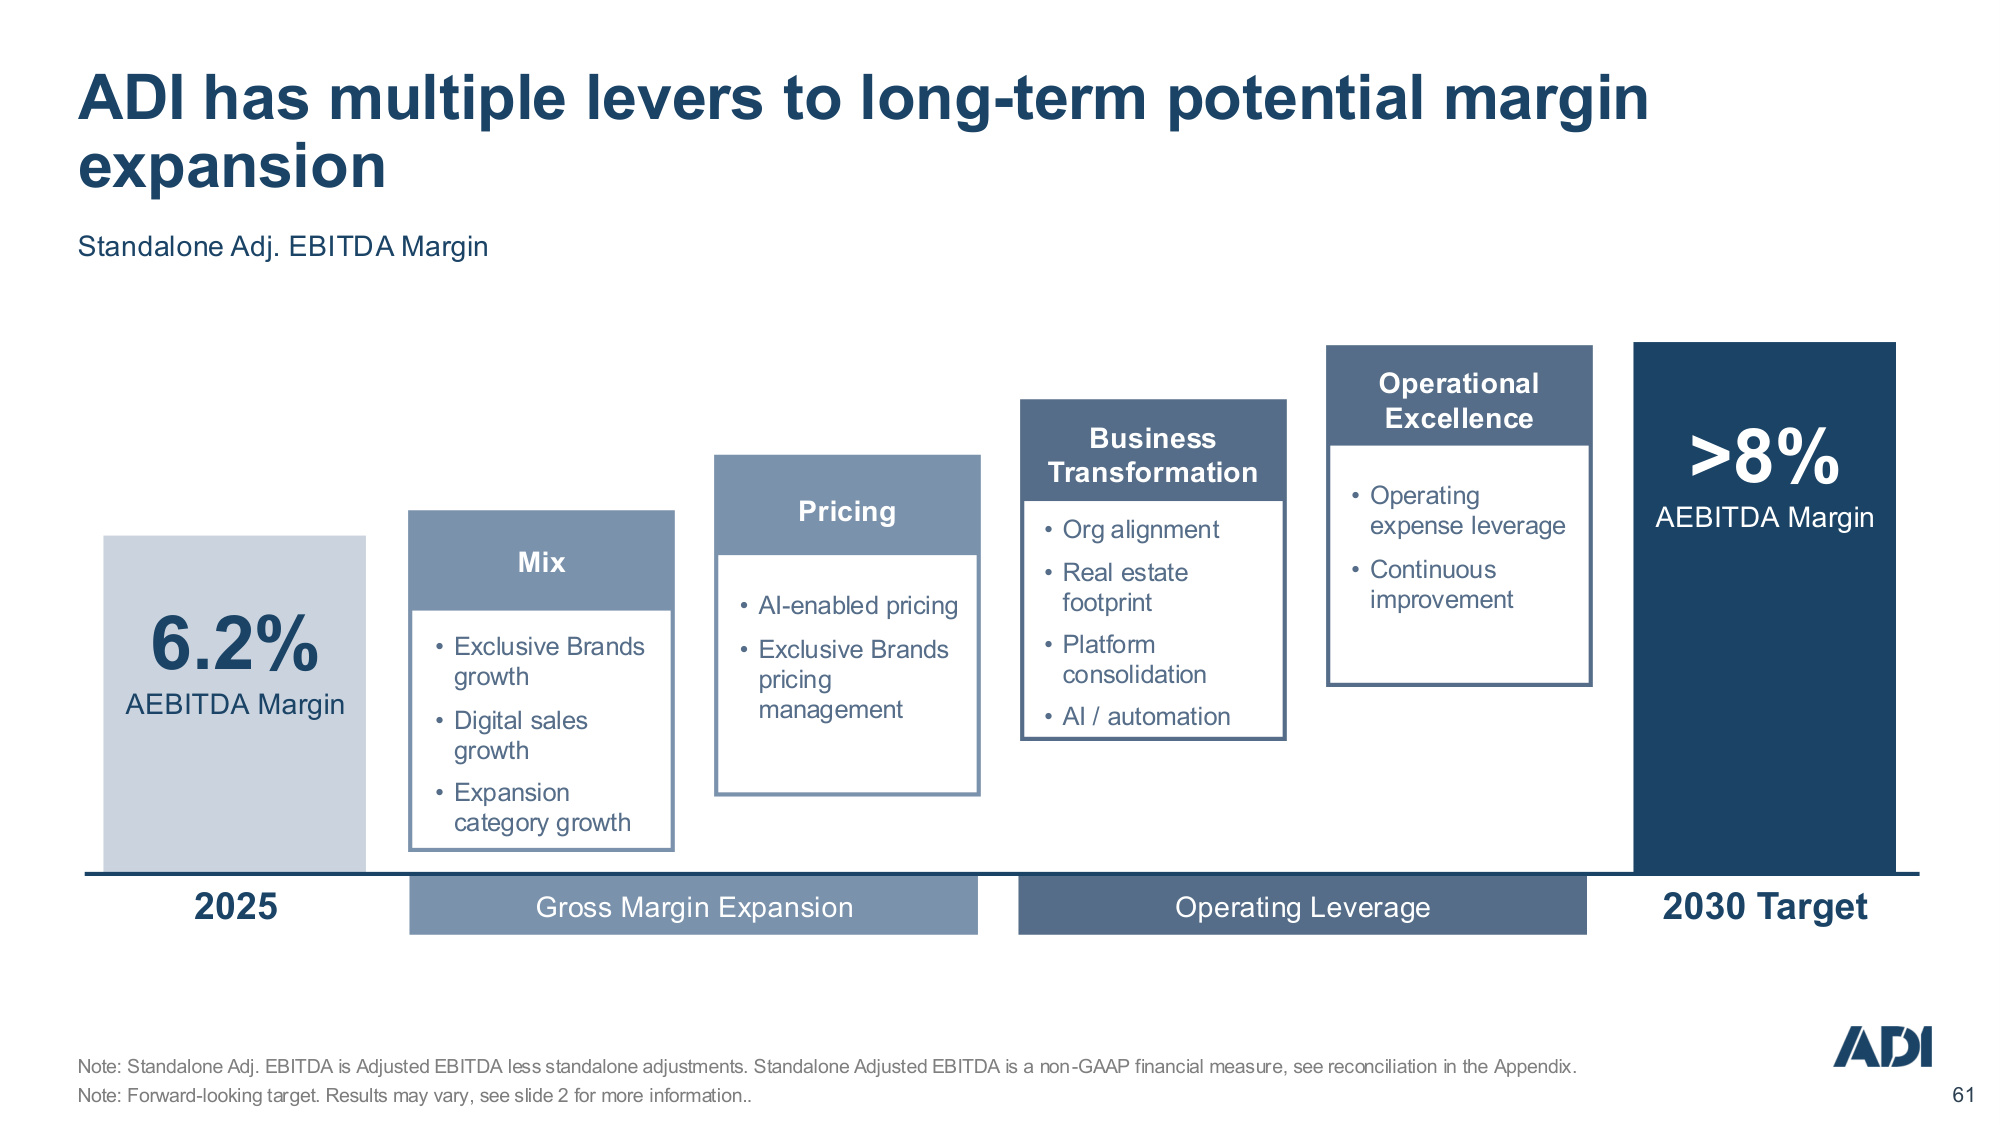
Company Confidential 61 61 6.2% AEBITDA Margin >8% AEBITDA Margin 2025 2030 Target Gross Margin Expansion Operating Leverage ADI has multiple levers to long-term potential margin expansion Standalone Adj. EBITDA Margin Mix • Exclusive Brands growth • Digital sales growth • Expansion category growth Pricing • AI-enabled pricing • Exclusive Brands pricing management Business Transformation • Org alignment • Real estate footprint • Platform consolidation • AI / automation Operational Excellence • Operating expense leverage • Continuous improvement Note: Standalone Adj. EBITDA is Adjusted EBITDA less standalone adjustments. Standalone Adjusted EBITDA is a non-GAAP financial measure, see reconciliation in the Appendix. Note: Forward-looking target. Results may vary, see slide 2 for more information..
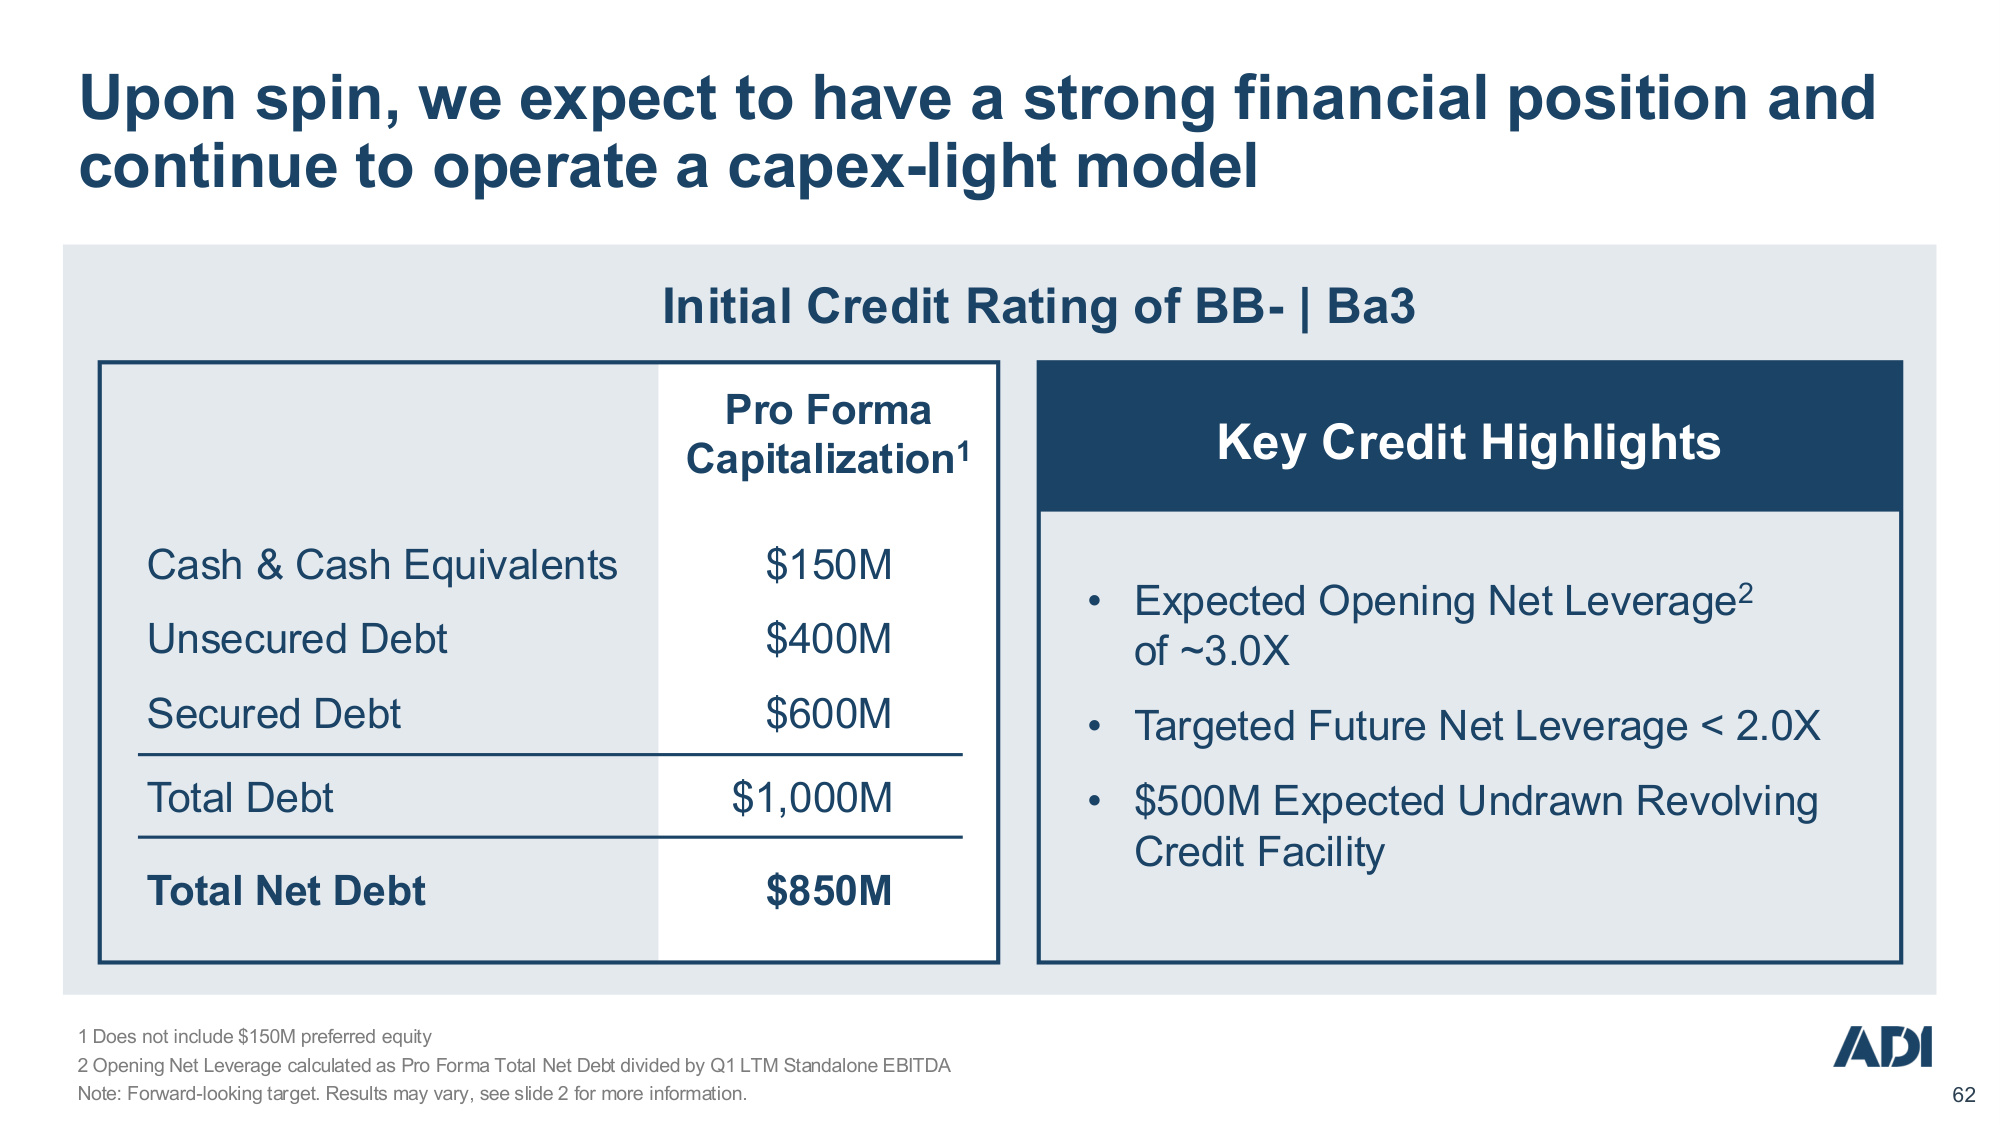
Company Confidential 62 62 Initial Credit Rating of BB- | Ba3 Pro Forma Capitalization1 Cash & Cash Equivalents $150M Unsecured Debt $400M Secured Debt $600M Total Debt $1,000M Total Net Debt $850M Key Credit Highlights • Expected Opening Net Leverage2 of ~3.0X • Targeted Future Net Leverage < 2.0X • $500M Expected Undrawn Revolving Credit Facility Upon spin, we expect to have a strong financial position and continue to operate a capex-light model 1 Does not include $150M preferred equity 2 Opening Net Leverage calculated as Pro Forma Total Net Debt divided by Q1 LTM Standalone EBITDA Note: Forward-looking target. Results may vary, see slide 2 for more information.
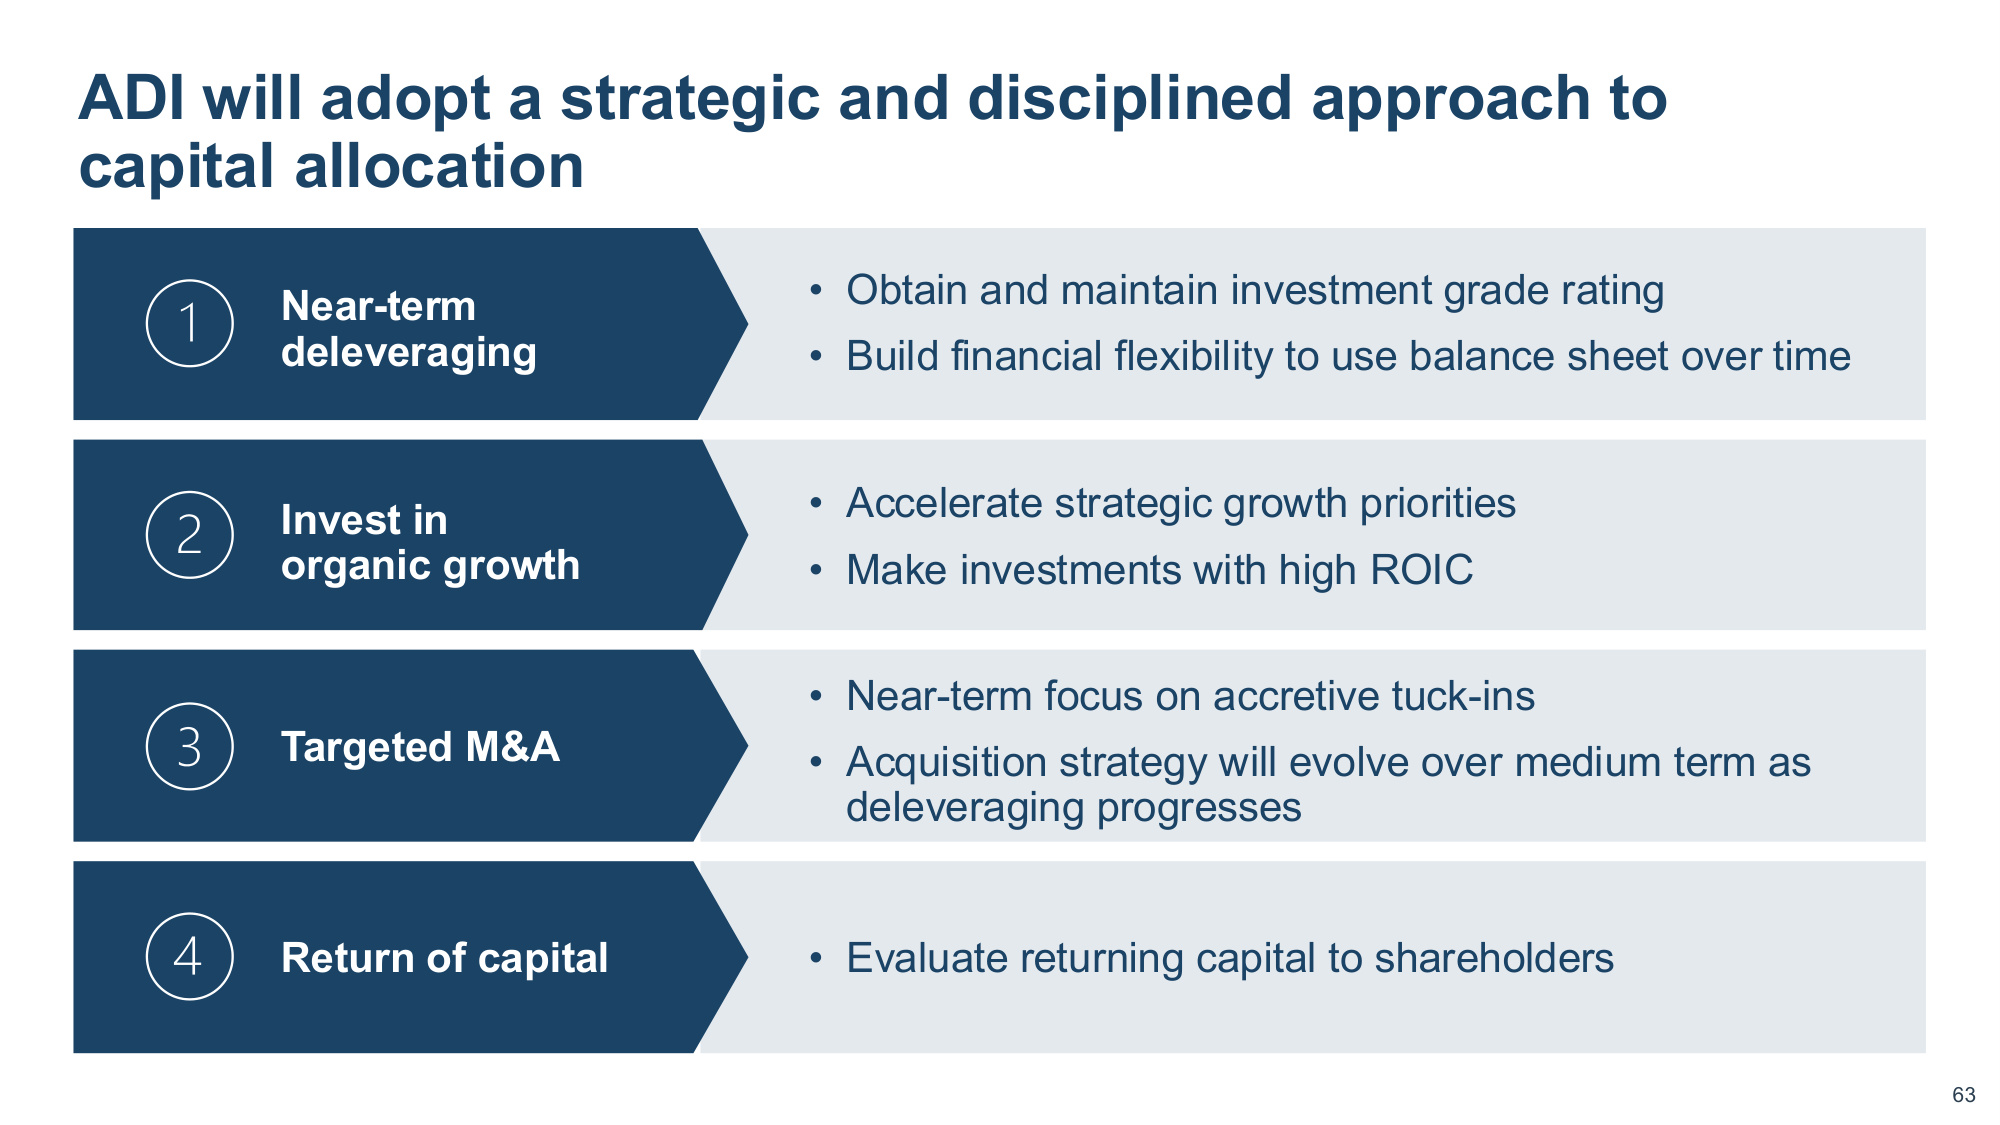
Company Confidential 63 63 ADI will adopt a strategic and disciplined approach to capital allocation Targeted M&A • Near-term focus on accretive tuck-ins • Acquisition strategy will evolve over medium term as deleveraging progresses Return of capital • Evaluate returning capital to shareholders • Accelerate strategic growth priorities • Make investments with high ROIC Invest in organic growth Near-term deleveraging • Obtain and maintain investment grade rating • Build financial flexibility to use balance sheet over time
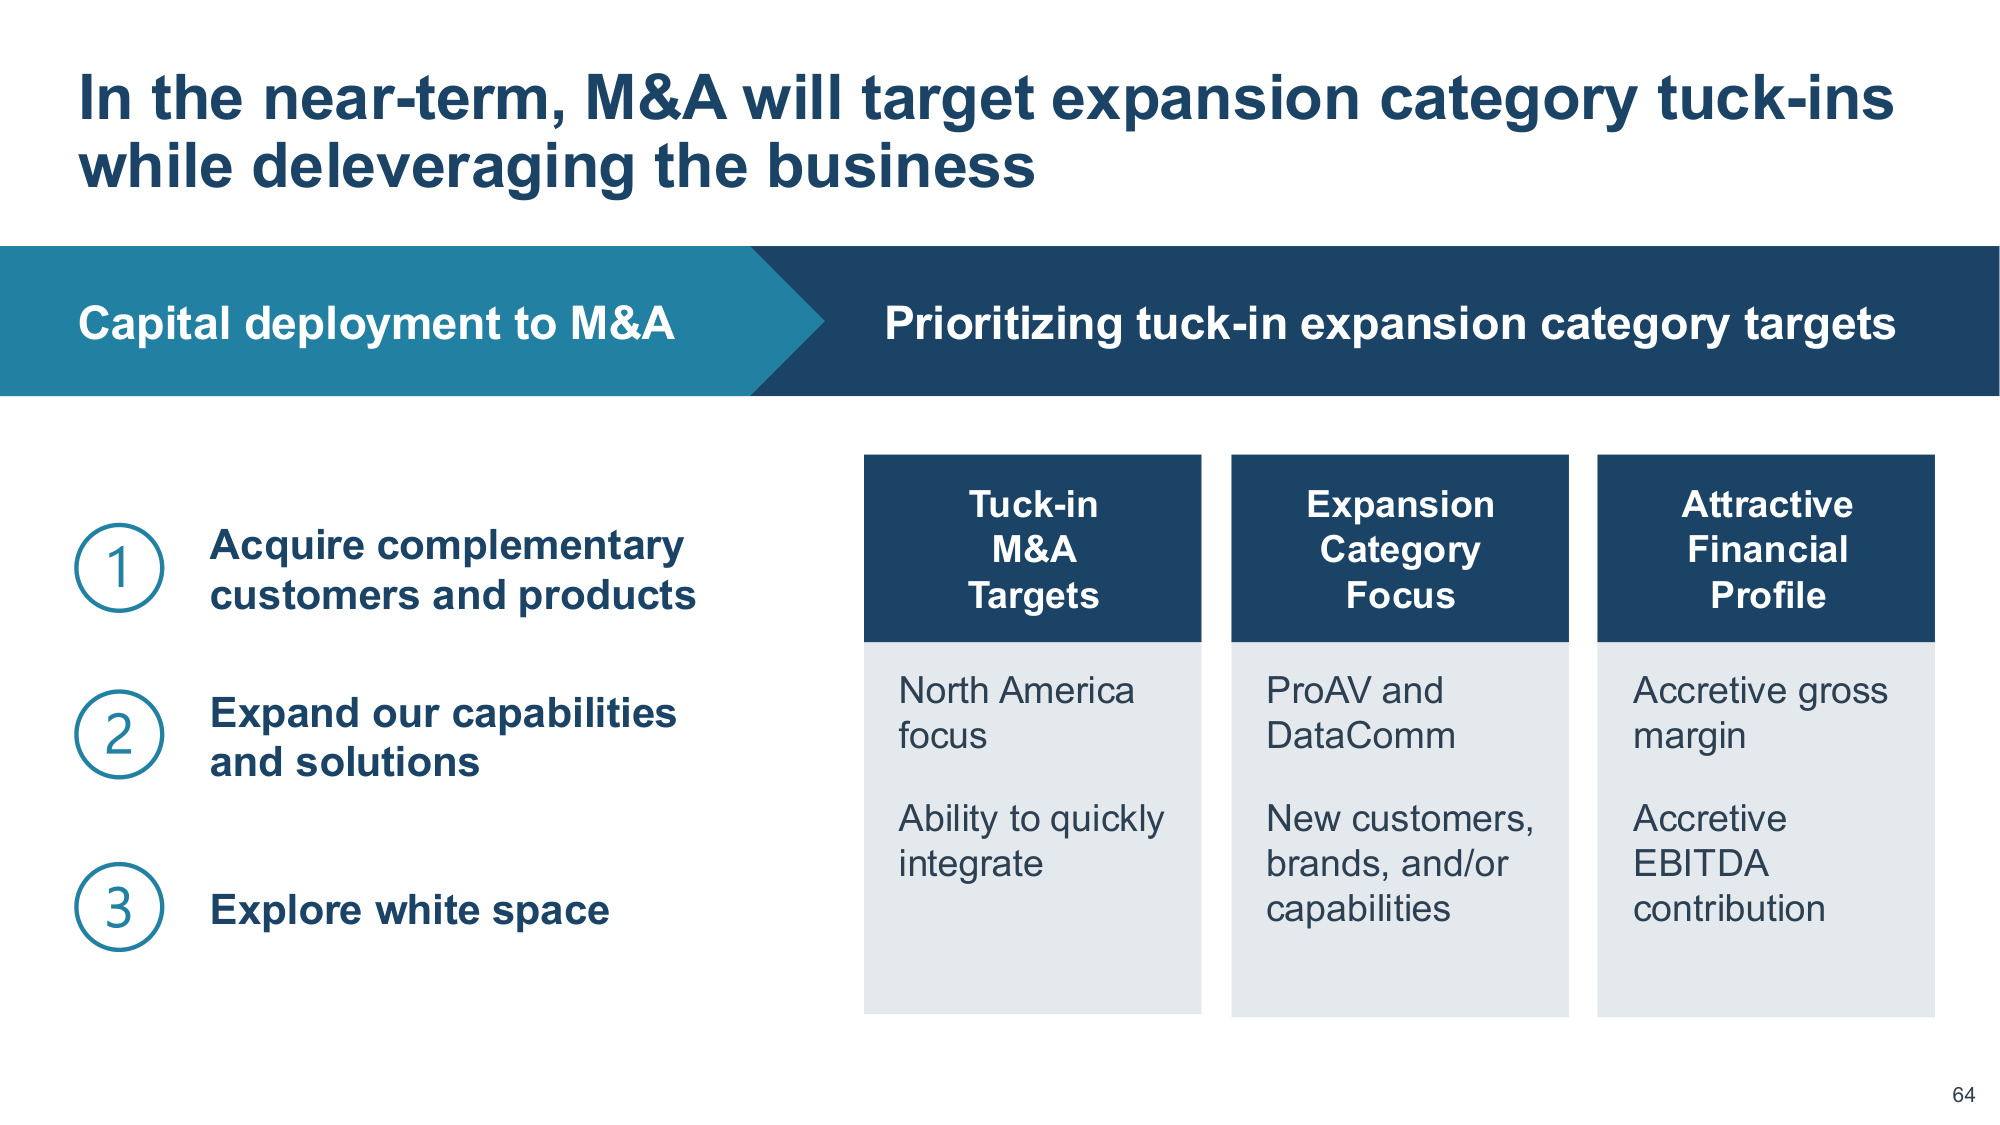
Company Confidential 64 64 Tuck-in M&A Targets Expansion Category Focus Attractive Financial Profile Capital deployment to M&A Prioritizing tuck-in expansion category targets North America focus Ability to quickly integrate ProAV and DataComm New customers, brands, and/or capabilities Accretive gross margin Accretive EBITDA contribution In the near-term, M&A will target expansion category tuck-ins while deleveraging the business Acquire complementary customers and products Expand our capabilities and solutions Explore white space
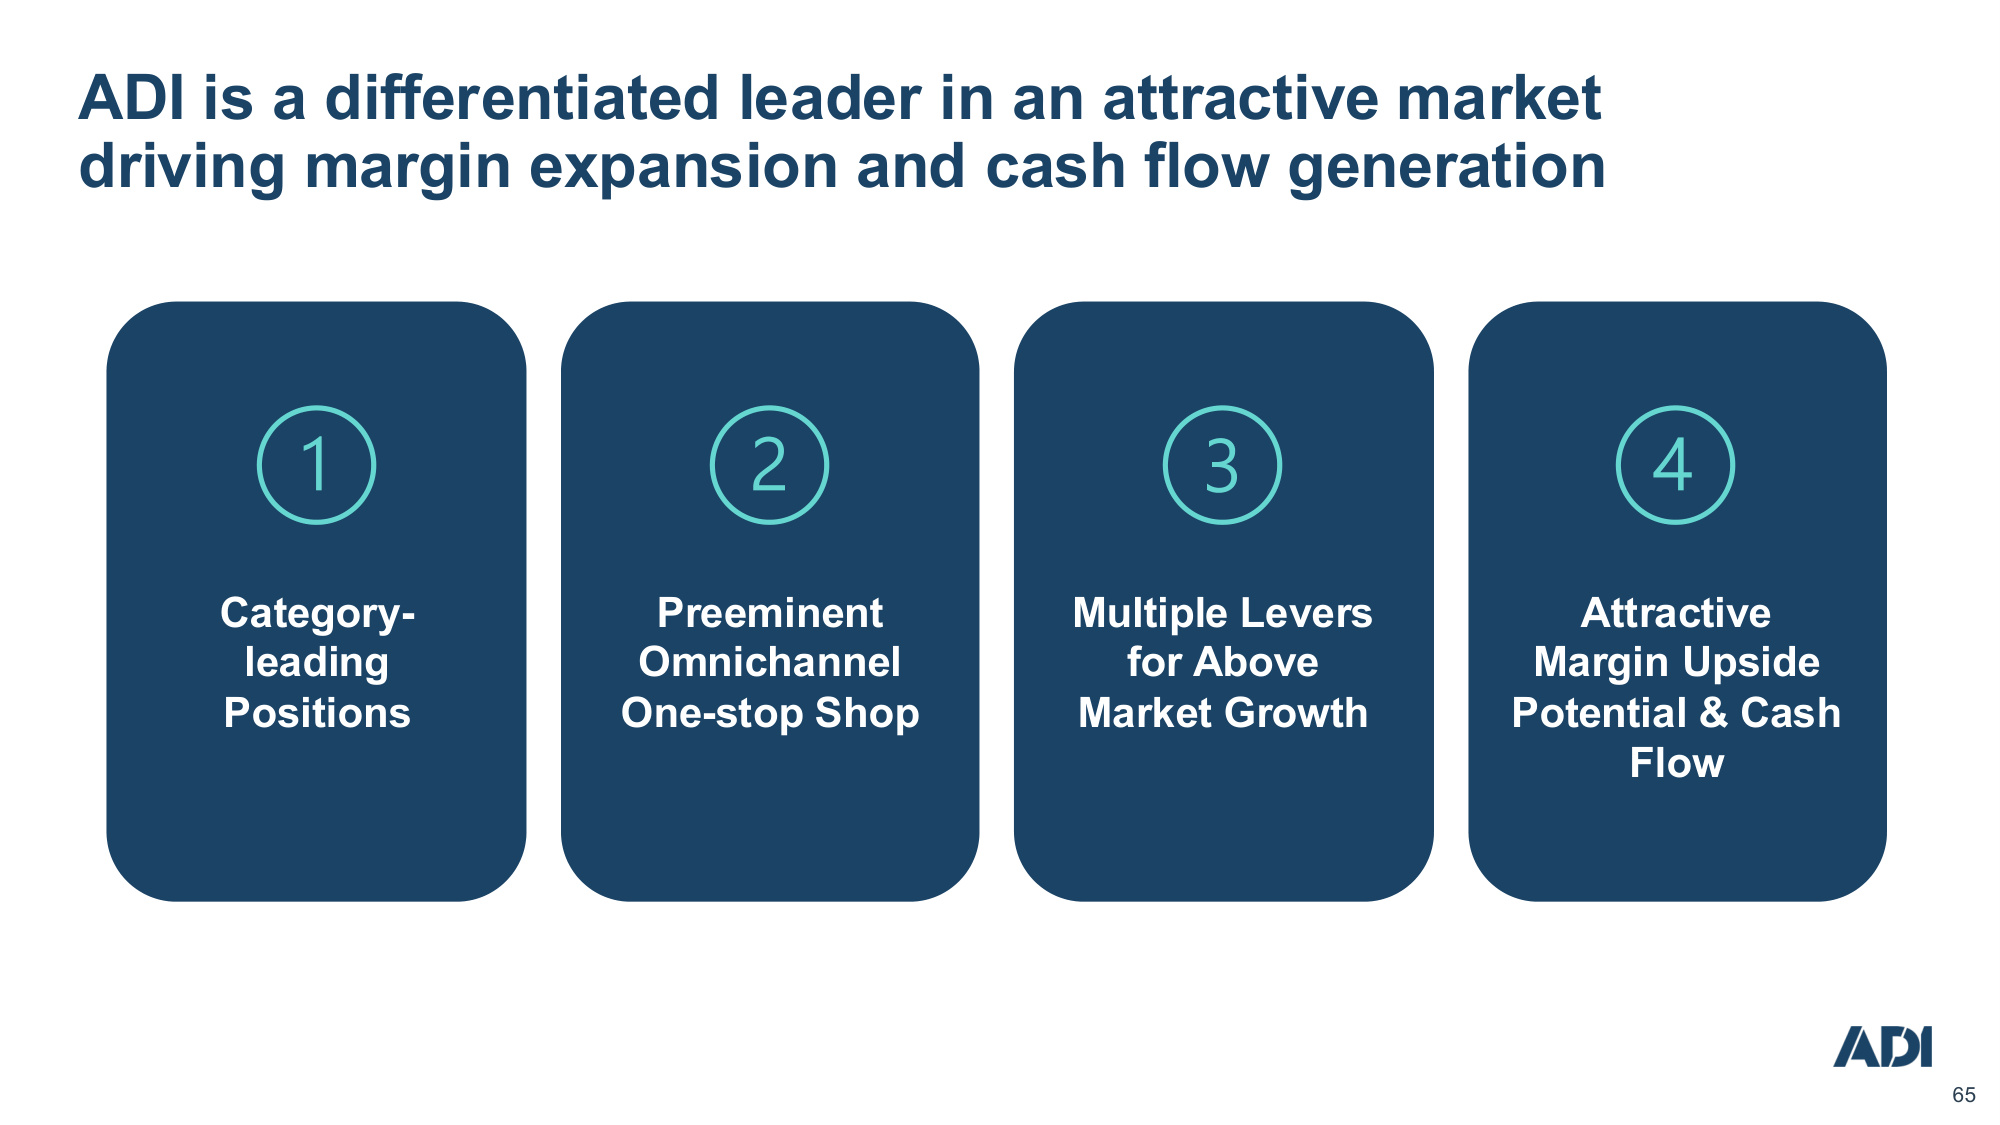
Company Confidential 65 65 Category- leading Positions Preeminent Omnichannel One-stop Shop Multiple Levers for Above Market Growth Attractive Margin Upside Potential & Cash Flow ADI is a differentiated leader in an attractive market driving margin expansion and cash flow generation
Company Confidential 66 66 For virtual attendee Q&A, please send questions to: investorrelations@adiglobal.com

Company Confidential 67 APPENDIX
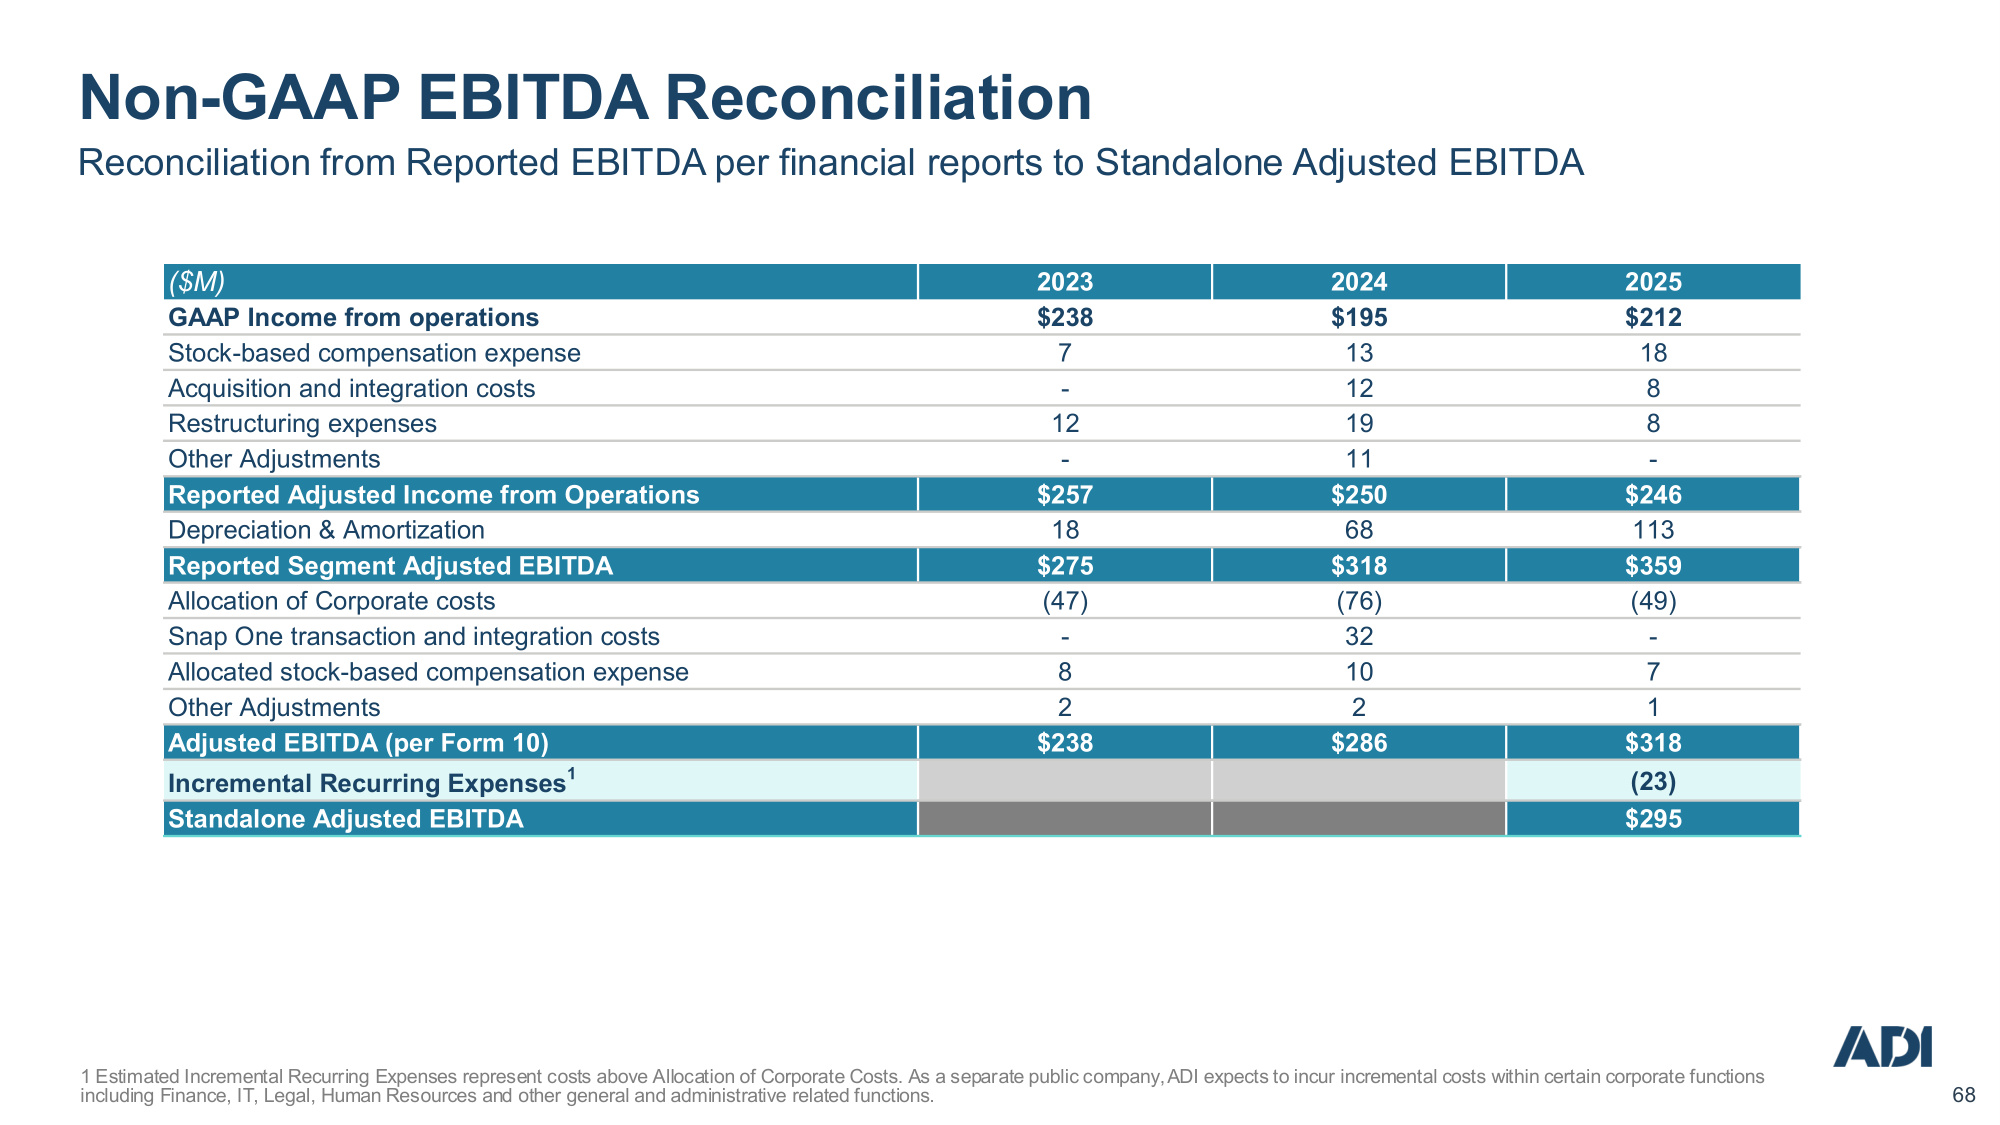
Company Confidential 68 68 Non-GAAP EBITDA Reconciliation Reconciliation from Reported EBITDA per financial reports to Standalone Adjusted EBITDA 1 Estimated Incremental Recurring Expenses represent costs above Allocation of Corporate Costs. As a separate public company, ADI expects to incur incremental costs within certain corporate functions including Finance, IT, Legal, Human Resources and other general and administrative related functions. ($M) 2023 2024 2025 GAAP Income from operations $238 $195 $212 Stock-based compensation expense 7 13 18 Acquisition and integration costs - 12 8 Restructuring expenses 12 19 8 Other Adjustments - 11 - Reported Adjusted Income from Operations $257 $250 $246 Depreciation & Amortization 18 68 113 Reported Segment Adjusted EBITDA $275 $318 $359 Allocation of Corporate costs (47) (76) (49) Snap One transaction and integration costs - 32 - Allocated stock-based compensation expense 8 10 7 Other Adjustments 2 2 1 Adjusted EBITDA (per Form 10) $238 $286 $318 Incremental Recurring Expenses1 (23) Standalone Adjusted EBITDA $295
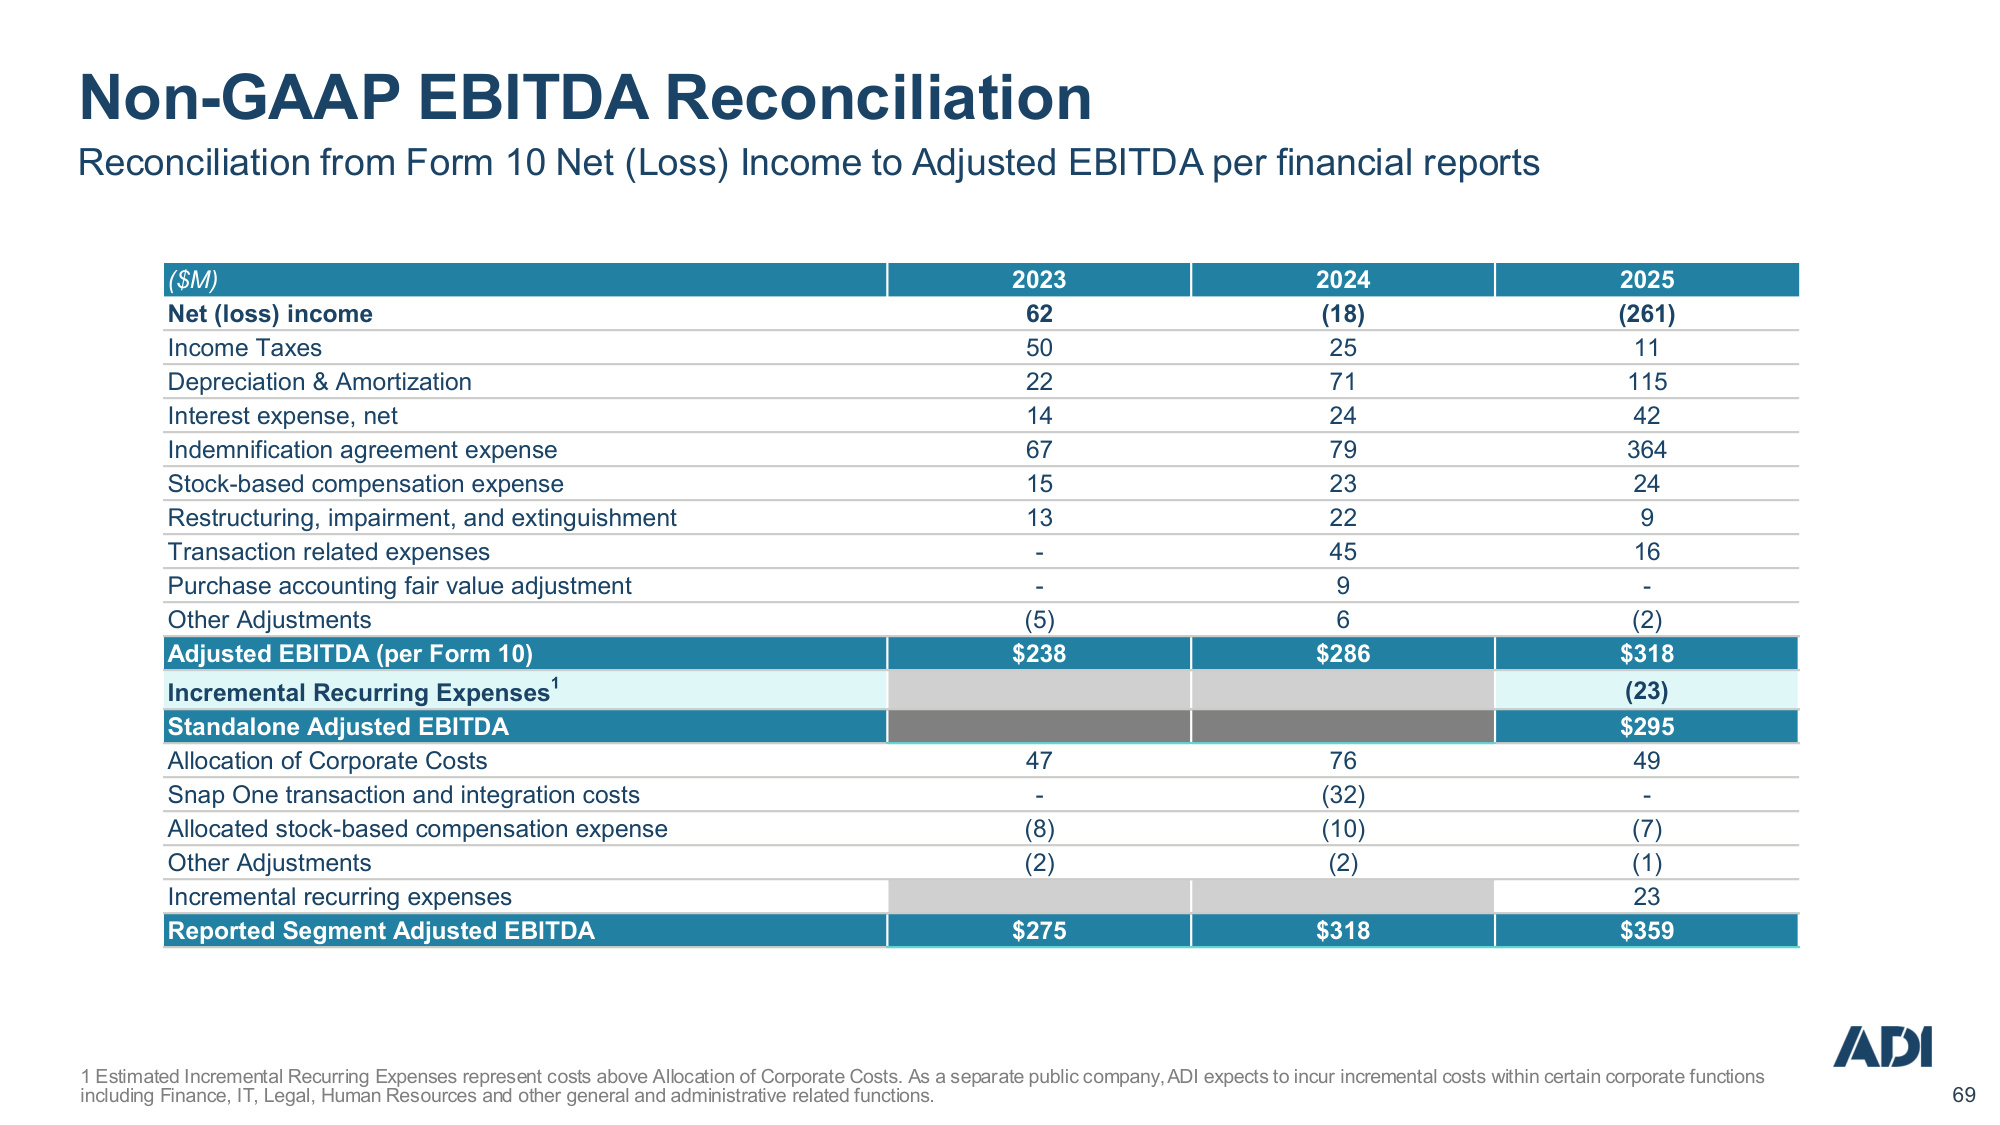
Company Confidential 69 69 Non-GAAP EBITDA Reconciliation Reconciliation from Form 10 Net (Loss) Income to Adjusted EBITDA per financial reports 1 Estimated Incremental Recurring Expenses represent costs above Allocation of Corporate Costs. As a separate public company, ADI expects to incur incremental costs within certain corporate functions including Finance, IT, Legal, Human Resources and other general and administrative related functions. ($M) 2023 2024 2025 Net (loss) income 62 (18) (261) Income Taxes 50 25 11 Depreciation & Amortization 22 71 115 Interest expense, net 14 24 42 Indemnification agreement expense 67 79 364 Stock-based compensation expense 15 23 24 Restructuring, impairment, and extinguishment 13 22 9 Transaction related expenses - 45 16 Purchase accounting fair value adjustment - 9 - Other Adjustments (5) 6 (2) Adjusted EBITDA (per Form 10) $238 $286 $318 Incremental Recurring Expenses1 (23) Standalone Adjusted EBITDA $295 Allocation of Corporate Costs 47 76 49 Snap One transaction and integration costs - (32) - Allocated stock-based compensation expense (8) (10) (7) Other Adjustments (2) (2) (1) Incremental recurring expenses 23 Reported Segment Adjusted EBITDA $275 $318 $359