First Bancorp July 14, 2026 Acquisition of First Carolina Bancshares Corporation
Important Information Caution Regarding Forward-Looking Statements This presentation contains certain forward-looking statements within the meaning of Section 21E of the Securities Exchange Act of 1934 and the Private Securities Litigation Reform Act of 1995, including those regarding First Bancorp's expectations or predictions of future financial or business performance or conditions. The forward-looking statements are inherently subject to risks and uncertainties. Forward-looking statements are typically identified by words such as "believe," "expect," "anticipate," "intend," "target," "estimate," "continue," "positions," "prospects" or "potential," by future conditional verbs such as "will," "would," "should," "could" or "may", or by variations of such words or by similar expressions. Such forward-looking statements include, but are not limited to, statements about future financial and operating results, expected cost savings, expected impact on future earnings, the Company's plans, objectives, expectations and intentions and other statements that are not historical facts. These forward-looking statements are subject to numerous assumptions, risks and uncertainties which change over time. Forward-looking statements speak only as of the date they are made and you are cautioned not to place undue reliance on any forward-looking statements. We assume no duty to update forward-looking statements. In addition to factors previously disclosed in First Bancorp’s reports filed with the Securities and Exchange Commission (“SEC”), including without limitation its Annual Reports on Form 10-K, its Quarterly Reports on Form 10-Q, and its Current Reports on Form 8-K, the following factors, among others, could cause actual results to differ materially from forward-looking statements: ability to obtain regulatory approvals and meet other closing conditions to the merger, including approval by First Carolina Bancshares Corporation's shareholders, on the expected terms and schedule; delay in closing the merger; difficulties and delays in integrating the First Bancorp and First Carolina Bancshares Corporation businesses or fully realizing cost savings and other benefits; business disruption following the proposed transaction; changes in asset quality and credit risk; the inability to sustain revenue and earnings growth; changes in interest rates and capital markets; inflation; customer borrowing, repayment, investment and deposit practices; the introduction, withdrawal, success and timing of business initiatives; competitive conditions; the inability to realize cost savings or revenues or to implement integration plans and other consequences associated with mergers, acquisitions and divestitures; economic conditions; the reaction to the transaction of the companies' customers, employees and counterparties; and the impact, extent and timing of technological changes, capital management activities, and other actions of the Board of Governors of the Federal Reserve and legislative and regulatory actions and reforms. This presentation contains financial information, performance measures and statements that include non-GAAP (Generally Accepted Accounting Principles) measures and should be read along with related earnings releases and Forms 10-Q/K for the respective quarters and period ends, which provide a reconciliation of non-GAAP measures to GAAP measures. Management believes that these non-GAAP measures provide additional useful information that allows readers to evaluate the ongoing performance of First Bancorp. Non-GAAP measures should not be considered as an alternative to any measure of performance or financial condition as determined in accordance with GAAP, and investors should consider the Company’s performance and financial condition as reported under GAAP and all other relevant information when assessing the performance or financial condition of First Bancorp. Non-GAAP measures have limitations as analytical tools, and investors should not consider them in isolation or as a substitute for analysis of the Company’s results or financial condition as reported under GAAP. Non-GAAP Measures 2
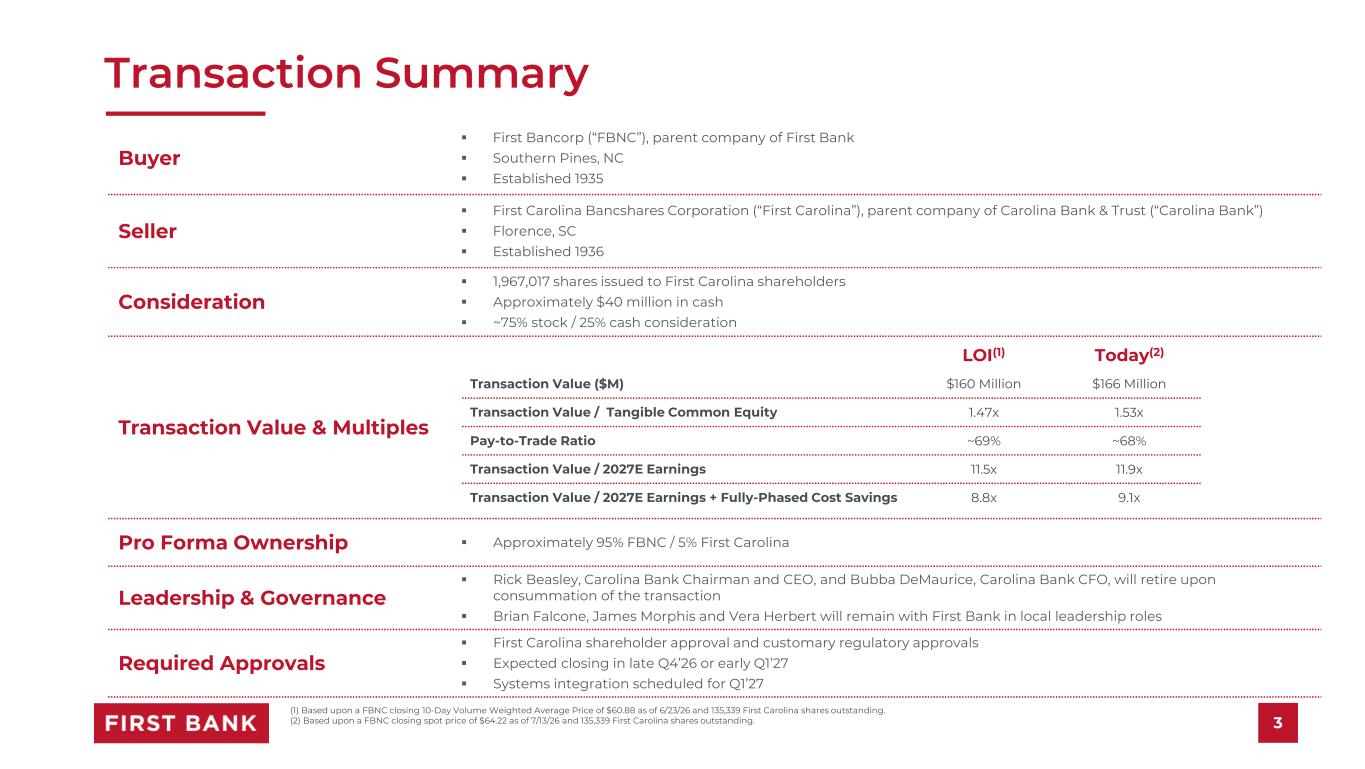
Transaction Summary First Bancorp (“FBNC”), parent company of First Bank Southern Pines, NC Established 1935 Buyer First Carolina Bancshares Corporation (“First Carolina”), parent company of Carolina Bank & Trust (“Carolina Bank”) Florence, SC Established 1936 Seller 1,967,017 shares issued to First Carolina shareholders Approximately $40 million in cash ~75% stock / 25% cash consideration Consideration Transaction Value & Multiples Approximately 95% FBNC / 5% First CarolinaPro Forma Ownership Rick Beasley, Carolina Bank Chairman and CEO, and Bubba DeMaurice, Carolina Bank CFO, will retire upon consummation of the transaction Brian Falcone, James Morphis and Vera Herbert will remain with First Bank in local leadership roles Leadership & Governance First Carolina shareholder approval and customary regulatory approvals Expected closing in late Q4’26 or early Q1’27 Systems integration scheduled for Q1’27 Required Approvals (1) Based upon a FBNC closing 10-Day Volume Weighted Average Price of $60.88 as of 6/23/26 and 135,339 First Carolina shares outstanding. (2) Based upon a FBNC closing spot price of $64.22 as of 7/13/26 and 135,339 First Carolina shares outstanding. 3 $166 Million$160 MillionTransaction Value ($M) 1.53x1.47xTransaction Value / Tangible Common Equity ~68%~69%Pay-to-Trade Ratio 11.9x11.5xTransaction Value / 2027E Earnings 9.1x8.8xTransaction Value / 2027E Earnings + Fully-Phased Cost Savings LOI(1) Today(2)
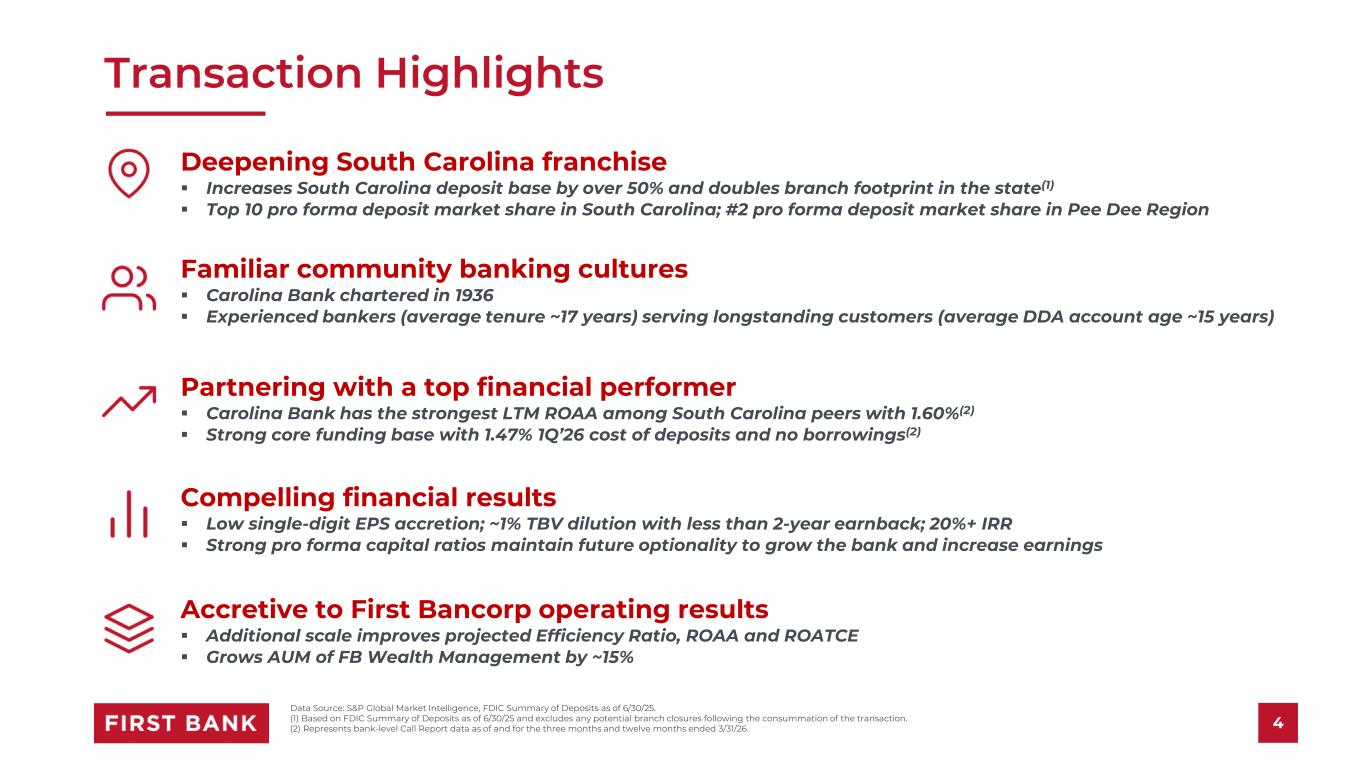
Familiar community banking cultures Carolina Bank chartered in 1936 Experienced bankers (average tenure ~17 years) serving longstanding customers (average DDA account age ~15 years) Transaction Highlights Deepening South Carolina franchise Increases South Carolina deposit base by over 50% and doubles branch footprint in the state(1) Top 10 pro forma deposit market share in South Carolina; #2 pro forma deposit market share in Pee Dee Region Compelling financial results Low single-digit EPS accretion; ~1% TBV dilution with less than 2-year earnback; 20%+ IRR Strong pro forma capital ratios maintain future optionality to grow the bank and increase earnings Accretive to First Bancorp operating results Additional scale improves projected Efficiency Ratio, ROAA and ROATCE Grows AUM of FB Wealth Management by ~15% Partnering with a top financial performer Carolina Bank has the strongest LTM ROAA among South Carolina peers with 1.60%(2) Strong core funding base with 1.47% 1Q’26 cost of deposits and no borrowings(2) 4 Data Source: S&P Global Market Intelligence, FDIC Summary of Deposits as of 6/30/25. (1) Based on FDIC Summary of Deposits as of 6/30/25 and excludes any potential branch closures following the consummation of the transaction. (2) Represents bank-level Call Report data as of and for the three months and twelve months ended 3/31/26.
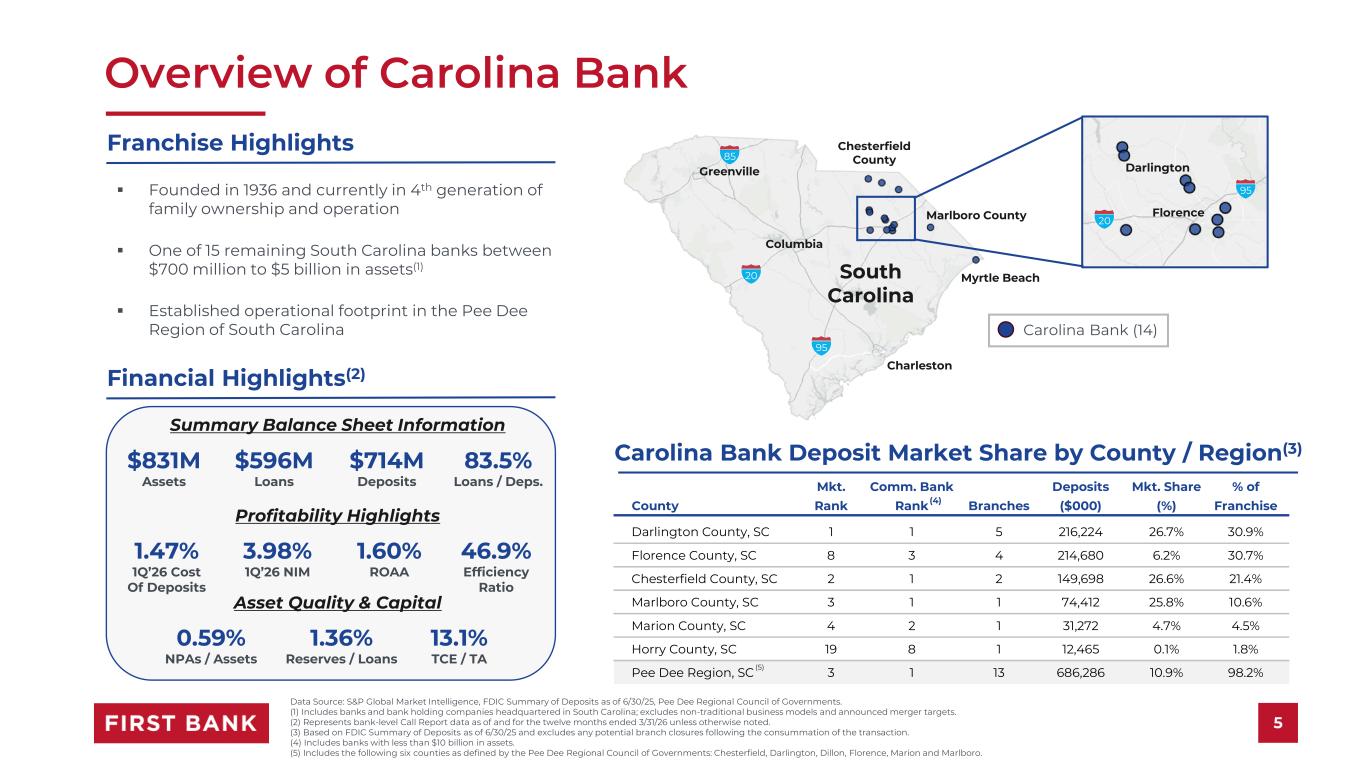
Overview of Carolina Bank Franchise Highlights South Carolina 95 20 85 Charleston Columbia Greenville Myrtle Beach Chesterfield County Marlboro County Florence Darlington 95 20 Carolina Bank (14) Founded in 1936 and currently in 4th generation of family ownership and operation One of 15 remaining South Carolina banks between $700 million to $5 billion in assets(1) Established operational footprint in the Pee Dee Region of South Carolina Financial Highlights(2) Summary Balance Sheet Information Profitability Highlights Asset Quality & Capital $831M Assets $596M Loans $714M Deposits 83.5% Loans / Deps. 1.47% 1Q’26 Cost Of Deposits 3.98% 1Q’26 NIM 1.60% ROAA 0.59% NPAs / Assets 1.36% Reserves / Loans 13.1% TCE / TA 46.9% Efficiency Ratio Carolina Bank Deposit Market Share by County / Region(3) Mkt. Comm. Bank Deposits Mkt. Share % of County Rank Rank Branches ($000) (%) Franchise Darlington County, SC 1 1 5 216,224 26.7% 30.9% Florence County, SC 8 3 4 214,680 6.2% 30.7% Chesterfield County, SC 2 1 2 149,698 26.6% 21.4% Marlboro County, SC 3 1 1 74,412 25.8% 10.6% Marion County, SC 4 2 1 31,272 4.7% 4.5% Horry County, SC 19 8 1 12,465 0.1% 1.8% Pee Dee Region, SC 3 1 13 686,286 10.9% 98.2% Data Source: S&P Global Market Intelligence, FDIC Summary of Deposits as of 6/30/25, Pee Dee Regional Council of Governments. (1) Includes banks and bank holding companies headquartered in South Carolina; excludes non-traditional business models and announced merger targets. (2) Represents bank-level Call Report data as of and for the twelve months ended 3/31/26 unless otherwise noted. (3) Based on FDIC Summary of Deposits as of 6/30/25 and excludes any potential branch closures following the consummation of the transaction. (4) Includes banks with less than $10 billion in assets. (5) Includes the following six counties as defined by the Pee Dee Regional Council of Governments: Chesterfield, Darlington, Dillon, Florence, Marion and Marlboro. (5) 5 (4)
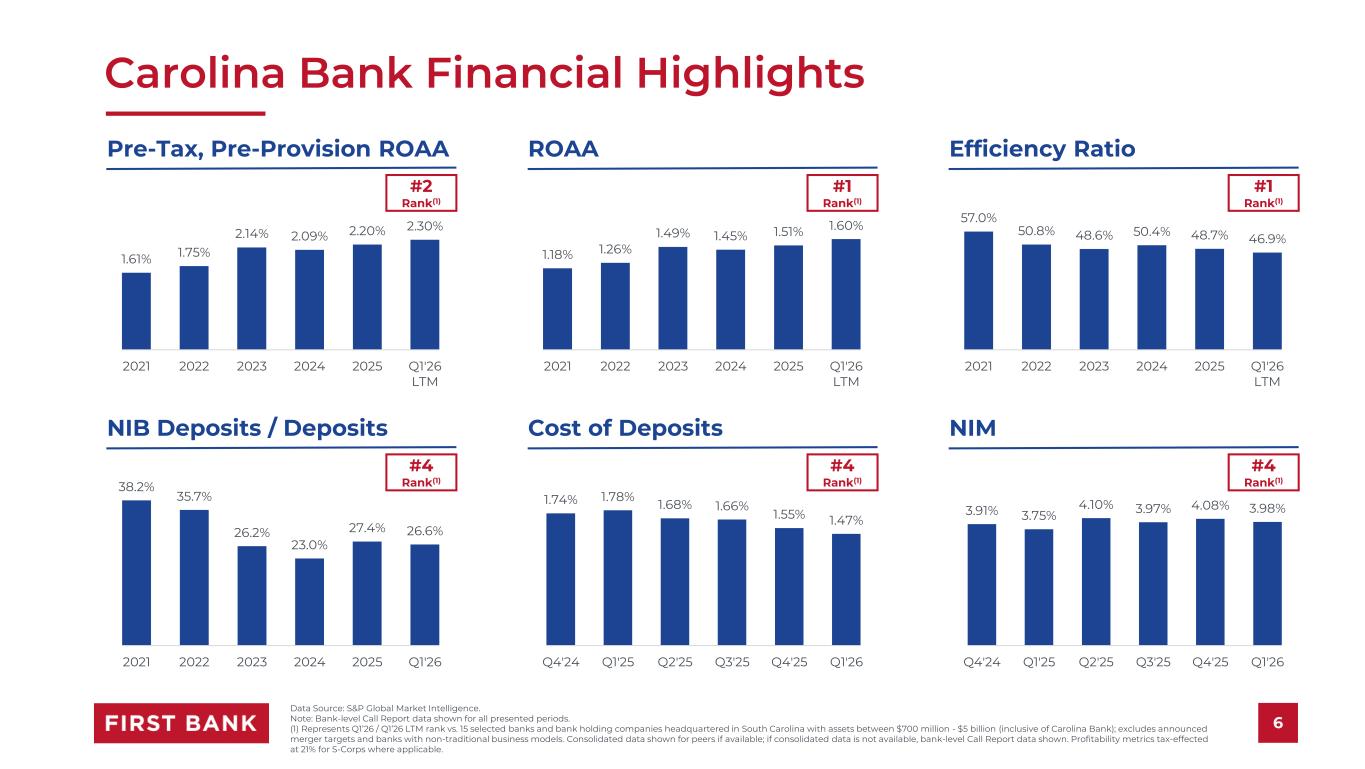
1.18% 1.26% 1.49% 1.45% 1.51% 1.60% 2021 2022 2023 2024 2025 Q1'26 LTM 3.91% 3.75% 4.10% 3.97% 4.08% 3.98% Q4'24 Q1'25 Q2'25 Q3'25 Q4'25 Q1'26 1.74% 1.78% 1.68% 1.66% 1.55% 1.47% Q4'24 Q1'25 Q2'25 Q3'25 Q4'25 Q1'26 38.2% 35.7% 26.2% 23.0% 27.4% 26.6% 2021 2022 2023 2024 2025 Q1'26 57.0% 50.8% 48.6% 50.4% 48.7% 46.9% 2021 2022 2023 2024 2025 Q1'26 LTM 1.61% 1.75% 2.14% 2.09% 2.20% 2.30% 2021 2022 2023 2024 2025 Q1'26 LTM Carolina Bank Financial Highlights 6 Pre-Tax, Pre-Provision ROAA ROAA Efficiency Ratio NIB Deposits / Deposits Cost of Deposits NIM Data Source: S&P Global Market Intelligence. Note: Bank-level Call Report data shown for all presented periods. (1) Represents Q1’26 / Q1’26 LTM rank vs. 15 selected banks and bank holding companies headquartered in South Carolina with assets between $700 million - $5 billion (inclusive of Carolina Bank); excludes announced merger targets and banks with non-traditional business models. Consolidated data shown for peers if available; if consolidated data is not available, bank-level Call Report data shown. Profitability metrics tax-effected at 21% for S-Corps where applicable. #4 Rank(1) #4 Rank(1) #4 Rank(1) #2 Rank(1) #1 Rank(1) #1 Rank(1)
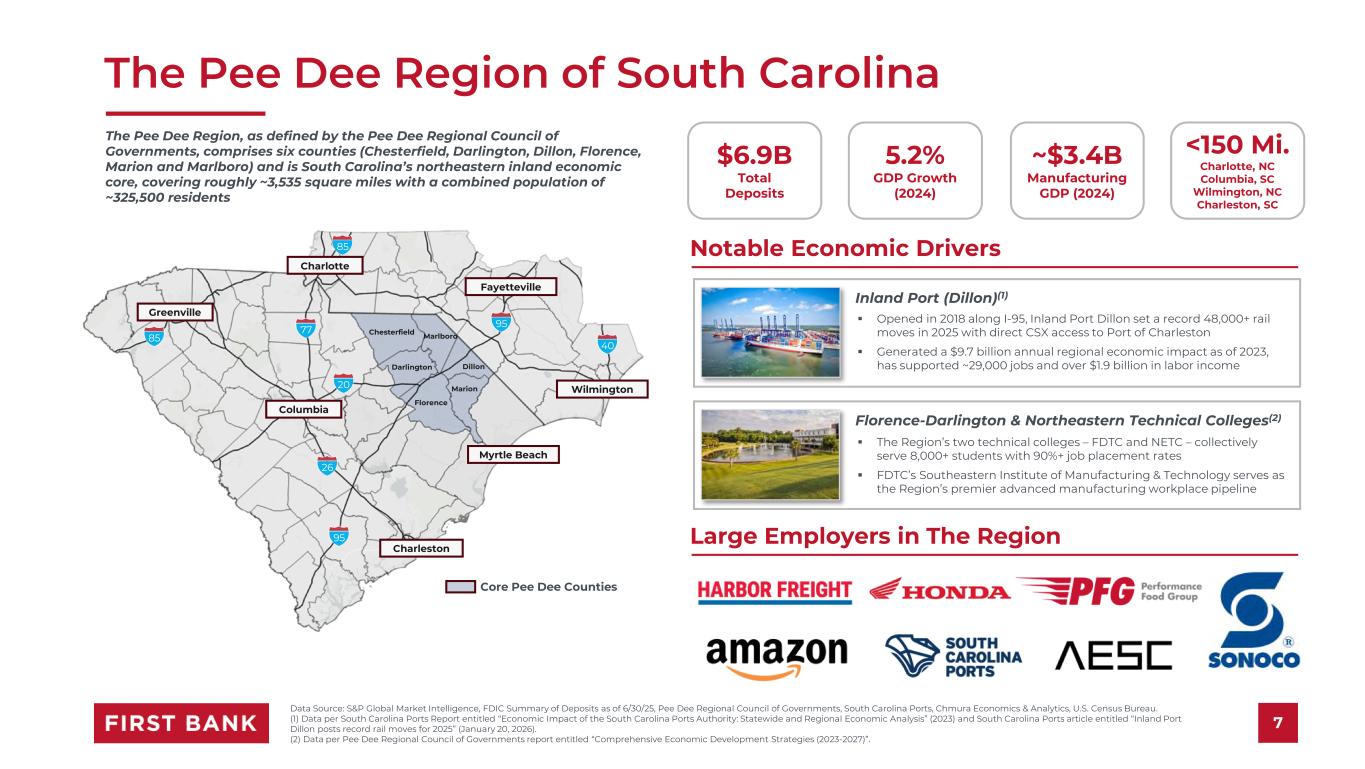
The Pee Dee Region of South Carolina Data Source: S&P Global Market Intelligence, FDIC Summary of Deposits as of 6/30/25, Pee Dee Regional Council of Governments, South Carolina Ports, Chmura Economics & Analytics, U.S. Census Bureau. (1) Data per South Carolina Ports Report entitled “Economic Impact of the South Carolina Ports Authority: Statewide and Regional Economic Analysis” (2023) and South Carolina Ports article entitled “Inland Port Dillon posts record rail moves for 2025” (January 20, 2026). (2) Data per Pee Dee Regional Council of Governments report entitled “Comprehensive Economic Development Strategies (2023-2027)”. 7 The Pee Dee Region, as defined by the Pee Dee Regional Council of Governments, comprises six counties (Chesterfield, Darlington, Dillon, Florence, Marion and Marlboro) and is South Carolina’s northeastern inland economic core, covering roughly ~3,535 square miles with a combined population of ~325,500 residents Notable Economic Drivers $6.9B Total Deposits ~$3.4B Manufacturing GDP (2024) <150 Mi. Charlotte, NC Columbia, SC Wilmington, NC Charleston, SC 5.2% GDP Growth (2024) Inland Port (Dillon)(1) Opened in 2018 along I-95, Inland Port Dillon set a record 48,000+ rail moves in 2025 with direct CSX access to Port of Charleston Generated a $9.7 billion annual regional economic impact as of 2023, has supported ~29,000 jobs and over $1.9 billion in labor income Florence-Darlington & Northeastern Technical Colleges(2) The Region’s two technical colleges – FDTC and NETC – collectively serve 8,000+ students with 90%+ job placement rates FDTC’s Southeastern Institute of Manufacturing & Technology serves as the Region’s premier advanced manufacturing workplace pipeline Large Employers in The Region Chesterfield Marlboro Dillon Marion 95 20 95 Florence Darlington 26 77 85 40 85 Core Pee Dee Counties Charlotte Greenville Columbia Charleston Wilmington Fayetteville Myrtle Beach
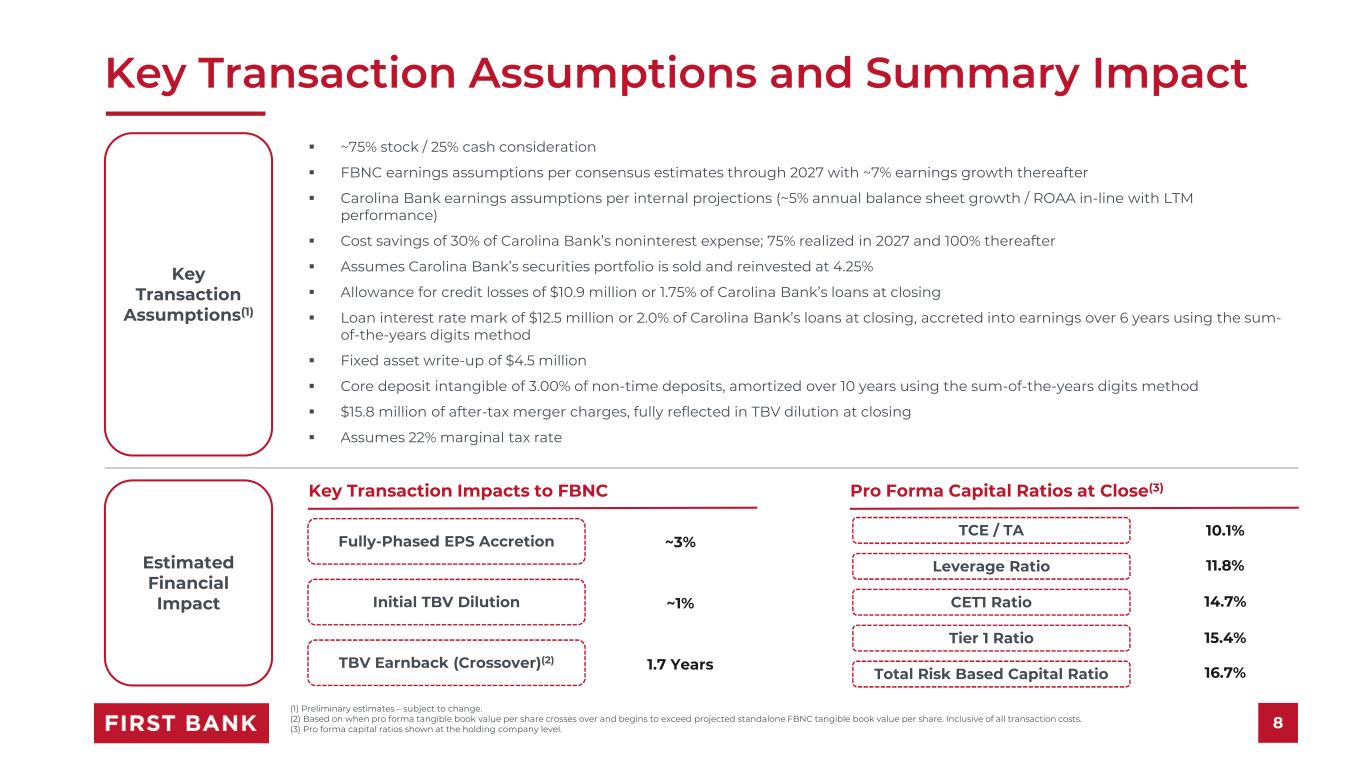
Key Transaction Assumptions and Summary Impact Key Transaction Assumptions(1) Estimated Financial Impact ~75% stock / 25% cash consideration FBNC earnings assumptions per consensus estimates through 2027 with ~7% earnings growth thereafter Carolina Bank earnings assumptions per internal projections (~5% annual balance sheet growth / ROAA in-line with LTM performance) Cost savings of 30% of Carolina Bank’s noninterest expense; 75% realized in 2027 and 100% thereafter Assumes Carolina Bank’s securities portfolio is sold and reinvested at 4.25% Allowance for credit losses of $10.9 million or 1.75% of Carolina Bank’s loans at closing Loan interest rate mark of $12.5 million or 2.0% of Carolina Bank’s loans at closing, accreted into earnings over 6 years using the sum- of-the-years digits method Fixed asset write-up of $4.5 million Core deposit intangible of 3.00% of non-time deposits, amortized over 10 years using the sum-of-the-years digits method $15.8 million of after-tax merger charges, fully reflected in TBV dilution at closing Assumes 22% marginal tax rate Key Transaction Impacts to FBNC Pro Forma Capital Ratios at Close(3) Fully-Phased EPS Accretion Initial TBV Dilution TBV Earnback (Crossover)(2) ~3% ~1% 1.7 Years TCE / TA Leverage Ratio CET1 Ratio Tier 1 Ratio Total Risk Based Capital Ratio 10.1% 11.8% 14.7% 15.4% 16.7% (1) Preliminary estimates – subject to change. (2) Based on when pro forma tangible book value per share crosses over and begins to exceed projected standalone FBNC tangible book value per share. Inclusive of all transaction costs. (3) Pro forma capital ratios shown at the holding company level. 8
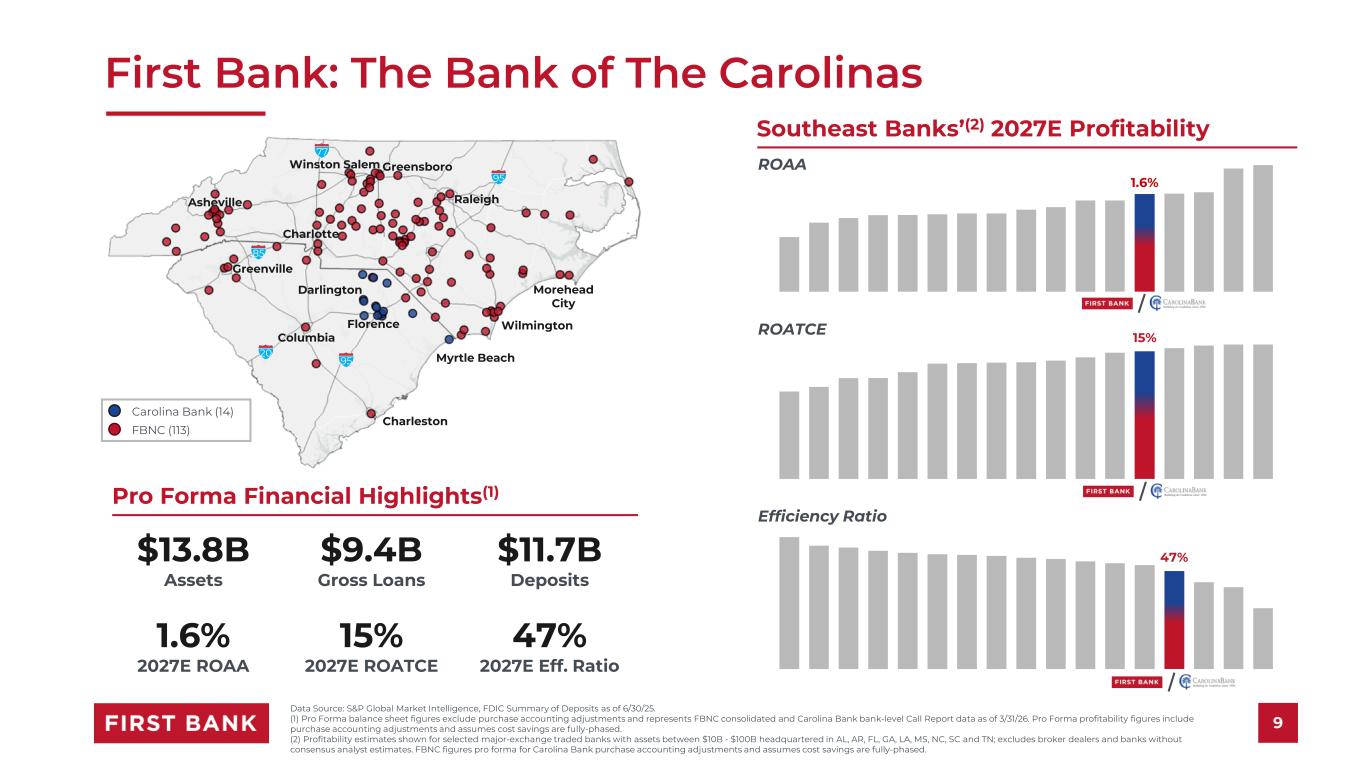
1.6% First Bank: The Bank of The Carolinas Pro Forma Financial Highlights(1) $13.8B Assets $9.4B Gross Loans $11.7B Deposits 1.6% 2027E ROAA 15% 2027E ROATCE 47% 2027E Eff. Ratio Data Source: S&P Global Market Intelligence, FDIC Summary of Deposits as of 6/30/25. (1) Pro Forma balance sheet figures exclude purchase accounting adjustments and represents FBNC consolidated and Carolina Bank bank-level Call Report data as of 3/31/26. Pro Forma profitability figures include purchase accounting adjustments and assumes cost savings are fully-phased. (2) Profitability estimates shown for selected major-exchange traded banks with assets between $10B - $100B headquartered in AL, AR, FL, GA, LA, MS, NC, SC and TN; excludes broker dealers and banks without consensus analyst estimates. FBNC figures pro forma for Carolina Bank purchase accounting adjustments and assumes cost savings are fully-phased. 95 85 20 77 95 Charleston Columbia Greenville Myrtle Beach Wilmington Morehead City GreensboroWinston Salem Charlotte Asheville Raleigh Florence Carolina Bank (14) FBNC (113) Darlington Southeast Banks’(2) 2027E Profitability 9 ROAA ROATCE Efficiency Ratio 15% 47%
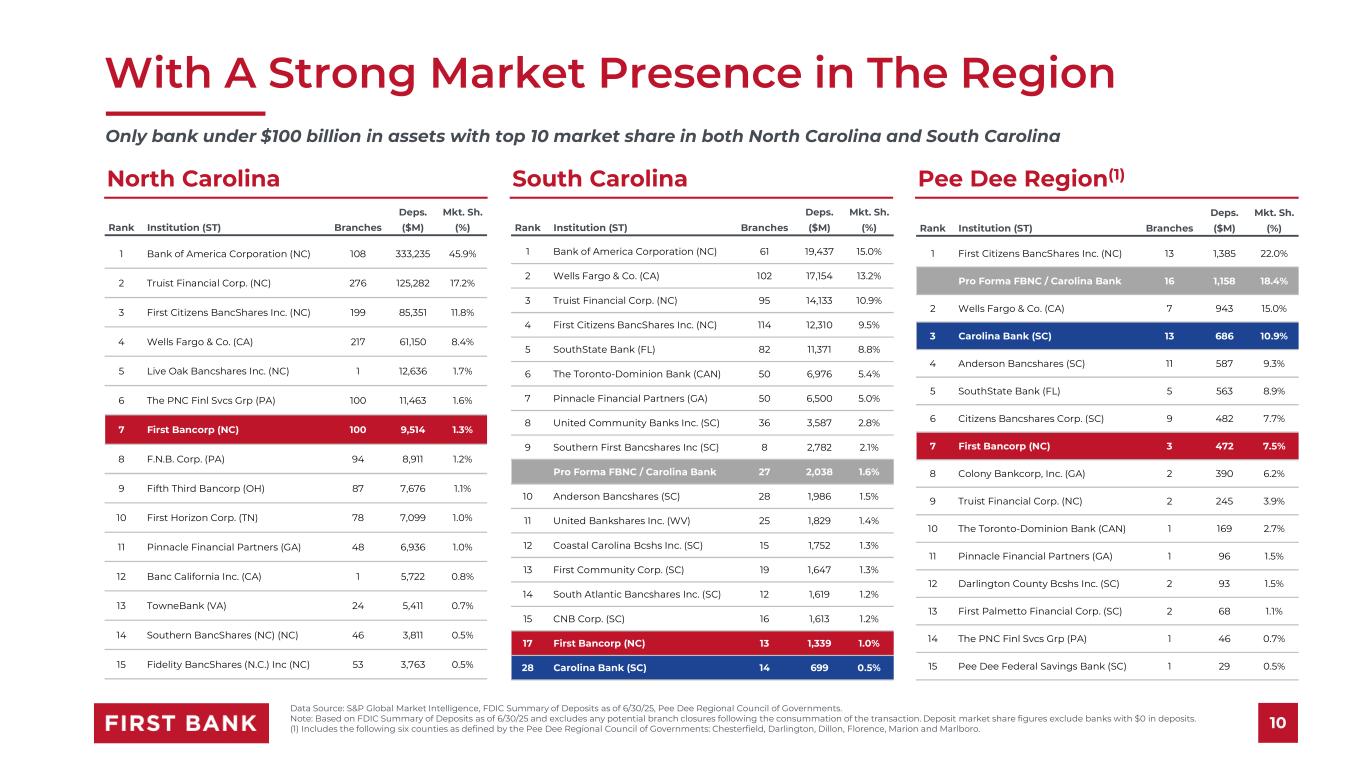
With A Strong Market Presence in The Region Data Source: S&P Global Market Intelligence, FDIC Summary of Deposits as of 6/30/25, Pee Dee Regional Council of Governments. Note: Based on FDIC Summary of Deposits as of 6/30/25 and excludes any potential branch closures following the consummation of the transaction. Deposit market share figures exclude banks with $0 in deposits. (1) Includes the following six counties as defined by the Pee Dee Regional Council of Governments: Chesterfield, Darlington, Dillon, Florence, Marion and Marlboro. 10 North Carolina South Carolina Pee Dee Region(1) Only bank under $100 billion in assets with top 10 market share in both North Carolina and South Carolina Deps. Mkt. Sh. Rank Institution (ST) Branches ($M) (%) 1 Bank of America Corporation (NC) 108 333,235 45.9% 2 Truist Financial Corp. (NC) 276 125,282 17.2% 3 First Citizens BancShares Inc. (NC) 199 85,351 11.8% 4 Wells Fargo & Co. (CA) 217 61,150 8.4% 5 Live Oak Bancshares Inc. (NC) 1 12,636 1.7% 6 The PNC Finl Svcs Grp (PA) 100 11,463 1.6% 7 First Bancorp (NC) 100 9,514 1.3% 8 F.N.B. Corp. (PA) 94 8,911 1.2% 9 Fifth Third Bancorp (OH) 87 7,676 1.1% 10 First Horizon Corp. (TN) 78 7,099 1.0% 11 Pinnacle Financial Partners (GA) 48 6,936 1.0% 12 Banc California Inc. (CA) 1 5,722 0.8% 13 TowneBank (VA) 24 5,411 0.7% 14 Southern BancShares (NC) (NC) 46 3,811 0.5% 15 Fidelity BancShares (N.C.) Inc (NC) 53 3,763 0.5% Deps. Mkt. Sh. Rank Institution (ST) Branches ($M) (%) 1 Bank of America Corporation (NC) 61 19,437 15.0% 2 Wells Fargo & Co. (CA) 102 17,154 13.2% 3 Truist Financial Corp. (NC) 95 14,133 10.9% 4 First Citizens BancShares Inc. (NC) 114 12,310 9.5% 5 SouthState Bank (FL) 82 11,371 8.8% 6 The Toronto-Dominion Bank (CAN) 50 6,976 5.4% 7 Pinnacle Financial Partners (GA) 50 6,500 5.0% 8 United Community Banks Inc. (SC) 36 3,587 2.8% 9 Southern First Bancshares Inc (SC) 8 2,782 2.1% Pro Forma FBNC / Carolina Bank 27 2,038 1.6% 10 Anderson Bancshares (SC) 28 1,986 1.5% 11 United Bankshares Inc. (WV) 25 1,829 1.4% 12 Coastal Carolina Bcshs Inc. (SC) 15 1,752 1.3% 13 First Community Corp. (SC) 19 1,647 1.3% 14 South Atlantic Bancshares Inc. (SC) 12 1,619 1.2% 15 CNB Corp. (SC) 16 1,613 1.2% 17 First Bancorp (NC) 13 1,339 1.0% 28 Carolina Bank (SC) 14 699 0.5% Deps. Mkt. Sh. Rank Institution (ST) Branches ($M) (%) 1 First Citizens BancShares Inc. (NC) 13 1,385 22.0% Pro Forma FBNC / Carolina Bank 16 1,158 18.4% 2 Wells Fargo & Co. (CA) 7 943 15.0% 3 Carolina Bank (SC) 13 686 10.9% 4 Anderson Bancshares (SC) 11 587 9.3% 5 SouthState Bank (FL) 5 563 8.9% 6 Citizens Bancshares Corp. (SC) 9 482 7.7% 7 First Bancorp (NC) 3 472 7.5% 8 Colony Bankcorp, Inc. (GA) 2 390 6.2% 9 Truist Financial Corp. (NC) 2 245 3.9% 10 The Toronto-Dominion Bank (CAN) 1 169 2.7% 11 Pinnacle Financial Partners (GA) 1 96 1.5% 12 Darlington County Bcshs Inc. (SC) 2 93 1.5% 13 First Palmetto Financial Corp. (SC) 2 68 1.1% 14 The PNC Finl Svcs Grp (PA) 1 46 0.7% 15 Pee Dee Federal Savings Bank (SC) 1 29 0.5%
Appendix
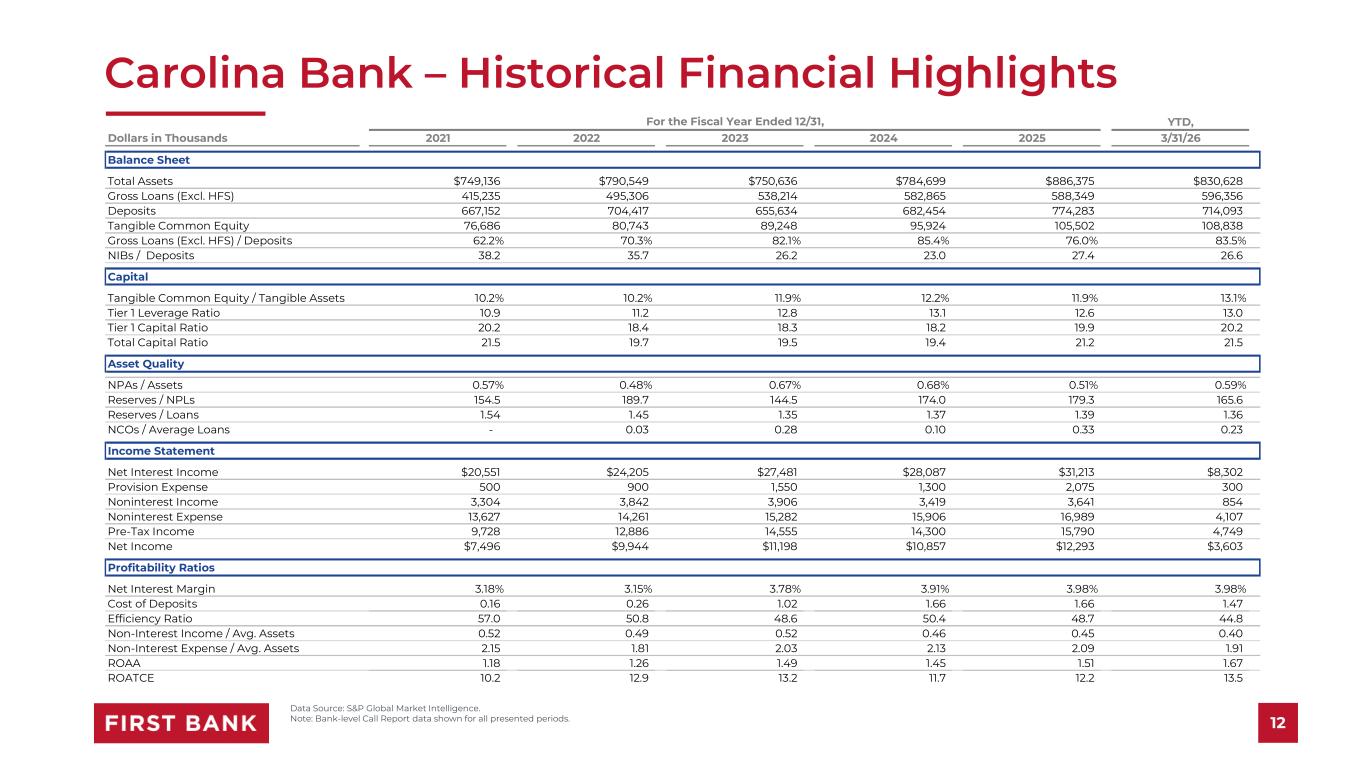
Carolina Bank – Historical Financial Highlights 12 Data Source: S&P Global Market Intelligence. Note: Bank-level Call Report data shown for all presented periods. YTD, Dollars in Thousands 2021 2022 2023 2024 2025 3/31/26 Balance Sheet Total Assets $749,136 $790,549 $750,636 $784,699 $886,375 $830,628 Gross Loans (Excl. HFS) 415,235 495,306 538,214 582,865 588,349 596,356 Deposits 667,152 704,417 655,634 682,454 774,283 714,093 Tangible Common Equity 76,686 80,743 89,248 95,924 105,502 108,838 Gross Loans (Excl. HFS) / Deposits 62.2% 70.3% 82.1% 85.4% 76.0% 83.5% NIBs / Deposits 38.2 35.7 26.2 23.0 27.4 26.6 Capital Tangible Common Equity / Tangible Assets 10.2% 10.2% 11.9% 12.2% 11.9% 13.1% Tier 1 Leverage Ratio 10.9 11.2 12.8 13.1 12.6 13.0 Tier 1 Capital Ratio 20.2 18.4 18.3 18.2 19.9 20.2 Total Capital Ratio 21.5 19.7 19.5 19.4 21.2 21.5 Asset Quality NPAs / Assets 0.57% 0.48% 0.67% 0.68% 0.51% 0.59% Reserves / NPLs 154.5 189.7 144.5 174.0 179.3 165.6 Reserves / Loans 1.54 1.45 1.35 1.37 1.39 1.36 NCOs / Average Loans - 0.03 0.28 0.10 0.33 0.23 Income Statement Net Interest Income $20,551 $24,205 $27,481 $28,087 $31,213 $8,302 Provision Expense 500 900 1,550 1,300 2,075 300 Noninterest Income 3,304 3,842 3,906 3,419 3,641 854 Noninterest Expense 13,627 14,261 15,282 15,906 16,989 4,107 Pre-Tax Income 9,728 12,886 14,555 14,300 15,790 4,749 Net Income $7,496 $9,944 $11,198 $10,857 $12,293 $3,603 Profitability Ratios Net Interest Margin 3.18% 3.15% 3.78% 3.91% 3.98% 3.98% Cost of Deposits 0.16 0.26 1.02 1.66 1.66 1.47 Efficiency Ratio 57.0 50.8 48.6 50.4 48.7 44.8 Non-Interest Income / Avg. Assets 0.52 0.49 0.52 0.46 0.45 0.40 Non-Interest Expense / Avg. Assets 2.15 1.81 2.03 2.13 2.09 1.91 ROAA 1.18 1.26 1.49 1.45 1.51 1.67 ROATCE 10.2 12.9 13.2 11.7 12.2 13.5 For the Fiscal Year Ended 12/31,
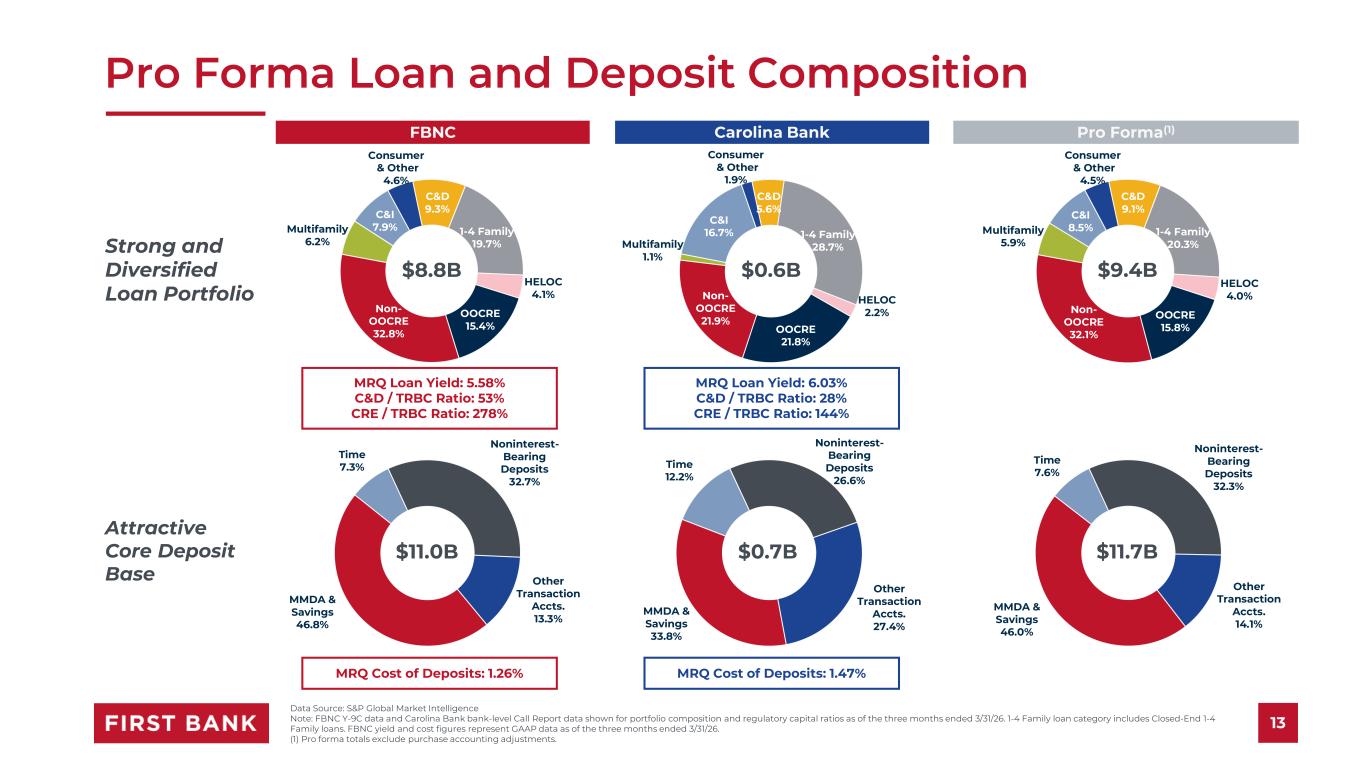
Noninterest- Bearing Deposits 32.7% Other Transaction Accts. 13.3% MMDA & Savings 46.8% Time 7.3% Noninterest- Bearing Deposits 26.6% Other Transaction Accts. 27.4% MMDA & Savings 33.8% Time 12.2% Noninterest- Bearing Deposits 32.3% Other Transaction Accts. 14.1% MMDA & Savings 46.0% Time 7.6% C&D 9.1% 1-4 Family 20.3% HELOC 4.0% OOCRE 15.8% Non- OOCRE 32.1% Multifamily 5.9% C&I 8.5% Consumer & Other 4.5% C&D 5.6% 1-4 Family 28.7% HELOC 2.2% OOCRE 21.8% Non- OOCRE 21.9% Multifamily 1.1% C&I 16.7% Consumer & Other 1.9% Pro Forma Loan and Deposit Composition Data Source: S&P Global Market Intelligence Note: FBNC Y-9C data and Carolina Bank bank-level Call Report data shown for portfolio composition and regulatory capital ratios as of the three months ended 3/31/26. 1-4 Family loan category includes Closed-End 1-4 Family loans. FBNC yield and cost figures represent GAAP data as of the three months ended 3/31/26. (1) Pro forma totals exclude purchase accounting adjustments. 13 FBNC Pro Forma(1)Carolina Bank Strong and Diversified Loan Portfolio Attractive Core Deposit Base C&D 9.3% 1-4 Family 19.7% HELOC 4.1% OOCRE 15.4% Non- OOCRE 32.8% Multifamily 6.2% C&I 7.9% Consumer & Other 4.6% $8.8B $0.6B $9.4B $11.0B $0.7B $11.7B MRQ Loan Yield: 5.58% C&D / TRBC Ratio: 53% CRE / TRBC Ratio: 278% MRQ Loan Yield: 6.03% C&D / TRBC Ratio: 28% CRE / TRBC Ratio: 144% MRQ Cost of Deposits: 1.26% MRQ Cost of Deposits: 1.47%
Additional Information 14 Additional Information About the Proposed Transaction and Where to Find It This communication is being made in respect of the proposed transaction involving First Bancorp and First Carolina Bancshares Corporation. This material is not a solicitation of any vote or approval by the shareholders of First Carolina Bancshares Corporation and is not a substitute for the proxy statement/prospectus or any other documents which First Carolina Bancshares Corporation may send to its shareholders in connection with the proposed transaction. This communication does not constitute an offer to sell or the solicitation of an offer to buy any securities. In connection with the proposed transaction, First Bancorp intends to file with the SEC a Registration Statement on Form S-4 (the “Registration Statement”) that will include a proxy statement of First Carolina Bancshares Corporation and a prospectus of First Bancorp, as well as other relevant documents concerning the proposed transaction. Investors and security holders are also urged to carefully review and consider First Bancorp’s public filings with the SEC, including but not limited to its Annual Reports on Form 10-K, its proxy statements, its Current Reports on Form 8-K and its Quarterly Reports on Form 10-Q. First Carolina Bancshares Corporation will mail the proxy statement/prospectus to its shareholders. BEFORE MAKING ANY VOTING OR INVESTMENT DECISIONS, INVESTORS AND SHAREHOLDERS OF FIRST CAROLINA BANCSHARES CORPORATION ARE URGED TO CAREFULLY READ THE ENTIRE REGISTRATION STATEMENT AND PROXY STATEMENT/PROSPECTUS REGARDING THE PROPOSED TRANSACTION WHEN THEY BECOME AVAILABLE AND ANY OTHER RELEVANT DOCUMENTS FILED WITH THE SEC, AS WELL AS ANY AMENDMENTS OR SUPPLEMENTS TO THOSE DOCUMENTS, BECAUSE THEY WILL CONTAIN IMPORTANT INFORMATION ABOUT THE PROPOSED TRANSACTION. Investors and security holders may obtain a free copy of the proxy statement/prospectus (when available) and other filings containing information about First Bancorp at the SEC’s website www.sec.gov. Investors and security holders may also obtain free copies of the documents filed with the SEC by First Bancorp on its website at www.localfirstbank.com. First Bancorp, First Carolina Bancshares Corporation and certain of their respective directors and executive officers, under the SEC’s rules, may be deemed to be participants in the solicitation of proxies of First Carolina Bancshares Corporation’s shareholders in connection with the proposed transaction. Information about First Bancorp’s directors and executive officers and their ownership of First Bancorp common stock is set forth in the proxy statement for First Bancorp’s 2026 Annual Meeting of Shareholders, as filed with the SEC on Schedule 14A on March 19, 2026. Other information regarding the persons who may, under the SEC’s rules, be deemed to be participants in the solicitation of proxies of First Carolina Bancshares Corporation’s shareholders in connection with the proposed transaction, and a description of their direct and indirect interests, by security holdings or otherwise, will be contained in the proxy statement/prospectus regarding the proposed transaction and other relevant materials to be filed with the SEC when they become available. Free copies of this document may be obtained as described in the preceding paragraph.