Business and Capital Allocation Update NASDAQ Listed I RWAY I RWAYL I RWAYI I SWKHL Website runwaygrowth.com Date July 14, 2026
Forward-Looking Statements This presentation dated July 2026 is being provided by Runway Growth Finance Corp. (“Runway Growth” or the “Company”) for discussion purposes only and is neither an offer to sell, nor a solicitation of an offer to purchase, an interest in the Company. It is solely intended to describe the general business, investment objectives and investment strategy of the Company and should be considered in conjunction with the Company’s Securities and Exchange Commission (“SEC”) filings. The foregoing information is confidential and proprietary to the Company and Runway Growth Capital LLC. The performance information contained herein has not been examined by any independent third party, including any independent accounting firm. There is no guarantee that any of the estimates, targets or projections illustrated in this presentation will be achieved. The case studies, and any other references herein to any of the Company’s past or present investments or its past or present performance, have been provided for illustrative purposes only. It should not be assumed that these investments were or will be profitable or that any future investments by the Company will be profitable or will equal the performance of these investments. This presentation contains "forward-looking statements" that are subject to risks and uncertainties. Forward‐looking statements can be identified by terminology such as “anticipate,” “believe,” “could,” “could increase the likelihood,” “estimate,” “expect,” “intend,” “is planned,” “may,” “should,” “will,” “will enable,” “would be expected,” “look forward,” “may provide,” “would” or similar terms, variations of such terms or the negative of those terms. These statements represent the Company’s belief regarding future events that, by their nature, are uncertain and outside of the Company’s control. Forward-looking statements are subject to risks and uncertainties that could cause actual results to differ materially from those in such statements. As a result of such risks, uncertainties and factors, actual results may differ materially from those expressed or implied in the Company’s forward-looking statements and reflect numerous assumptions, which may or may not materialize as projected. The Company makes no express or implied representation of warranty with respect to such projections, and expressly disclaims any and all liability for representations, expressed or implied, contained in, or omissions from, this presentation. These statements are subject to the risks and uncertainties described in the Company’s Form 10-K filed March 12, 2026, and its Form 10-Q for the quarter ended March 31, 2026, including without limitation risks relating to: changes in economic or market conditions, interest rate volatility, the speculative and illiquid nature of investments, the ability to realize anticipated benefits of the SWK acquisition, and potential stockholder litigation related thereto. All of the information in this presentation is presented as of the date of this presentation (except as otherwise specified), is subject to change without notice, and may have changed (possibly materially) between the date of this presentation and the date this presentation was received. No member of the Company or Runway Growth Capital LLC has any obligation to update the information in this presentation to account for changes subsequent to any date as of which such information is given. Past performance is not an indication of future results.
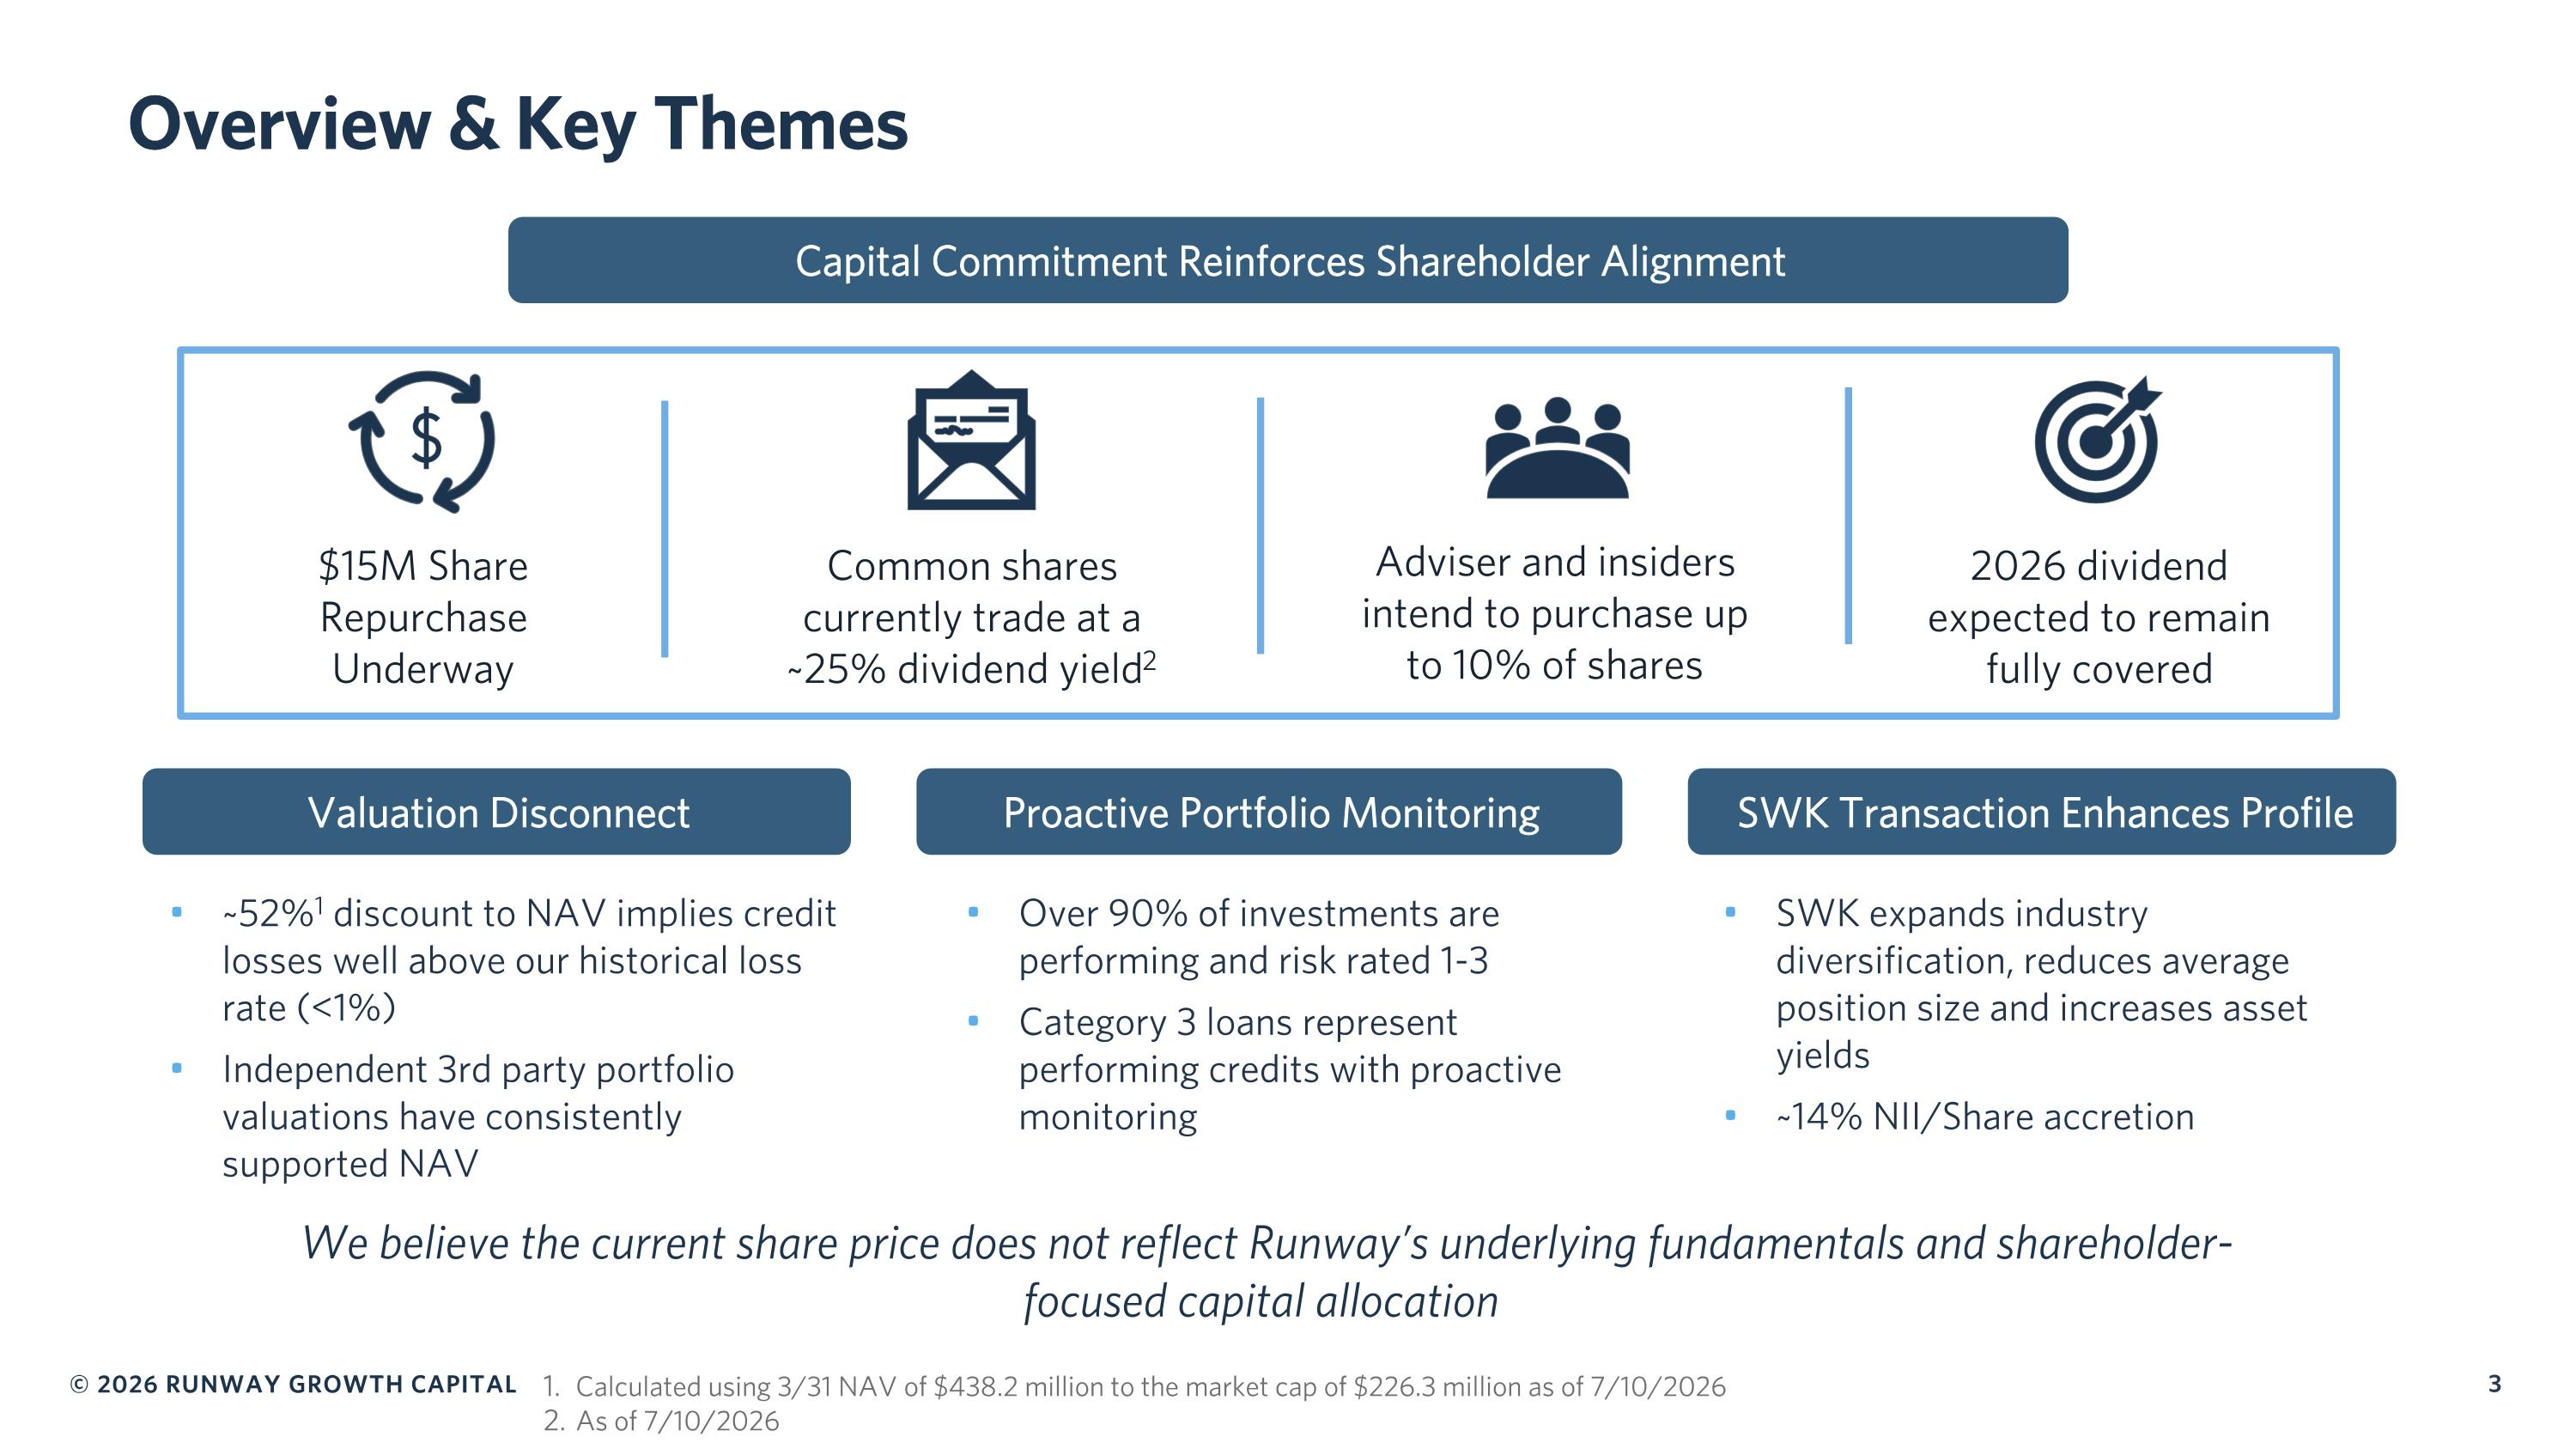
Overview & Key Themes Capital Commitment Reinforces Shareholder Alignment We believe the current share price does not reflect Runway’s underlying fundamentals and shareholder-focused capital allocation $15M Share Repurchase Underway Common shares currently trade at a ~25% dividend yield2 Adviser and insiders intend to purchase up to 10% of shares 2026 dividend expected to remain fully covered Valuation Disconnect Proactive Portfolio Monitoring SWK Transaction Enhances Profile ~52%1 discount to NAV implies credit losses well above our historical loss rate (<1%) Independent 3rd party portfolio valuations have consistently supported NAV Over 90% of investments are performing and risk rated 1-3 Category 3 loans represent performing credits with proactive monitoring SWK expands industry diversification, reduces average position size and increases asset yields ~14% NII/Share accretion Calculated using 3/31 NAV of $438.2 million to the market cap of $226.3 million as of 7/10/2026 As of 7/10/2026
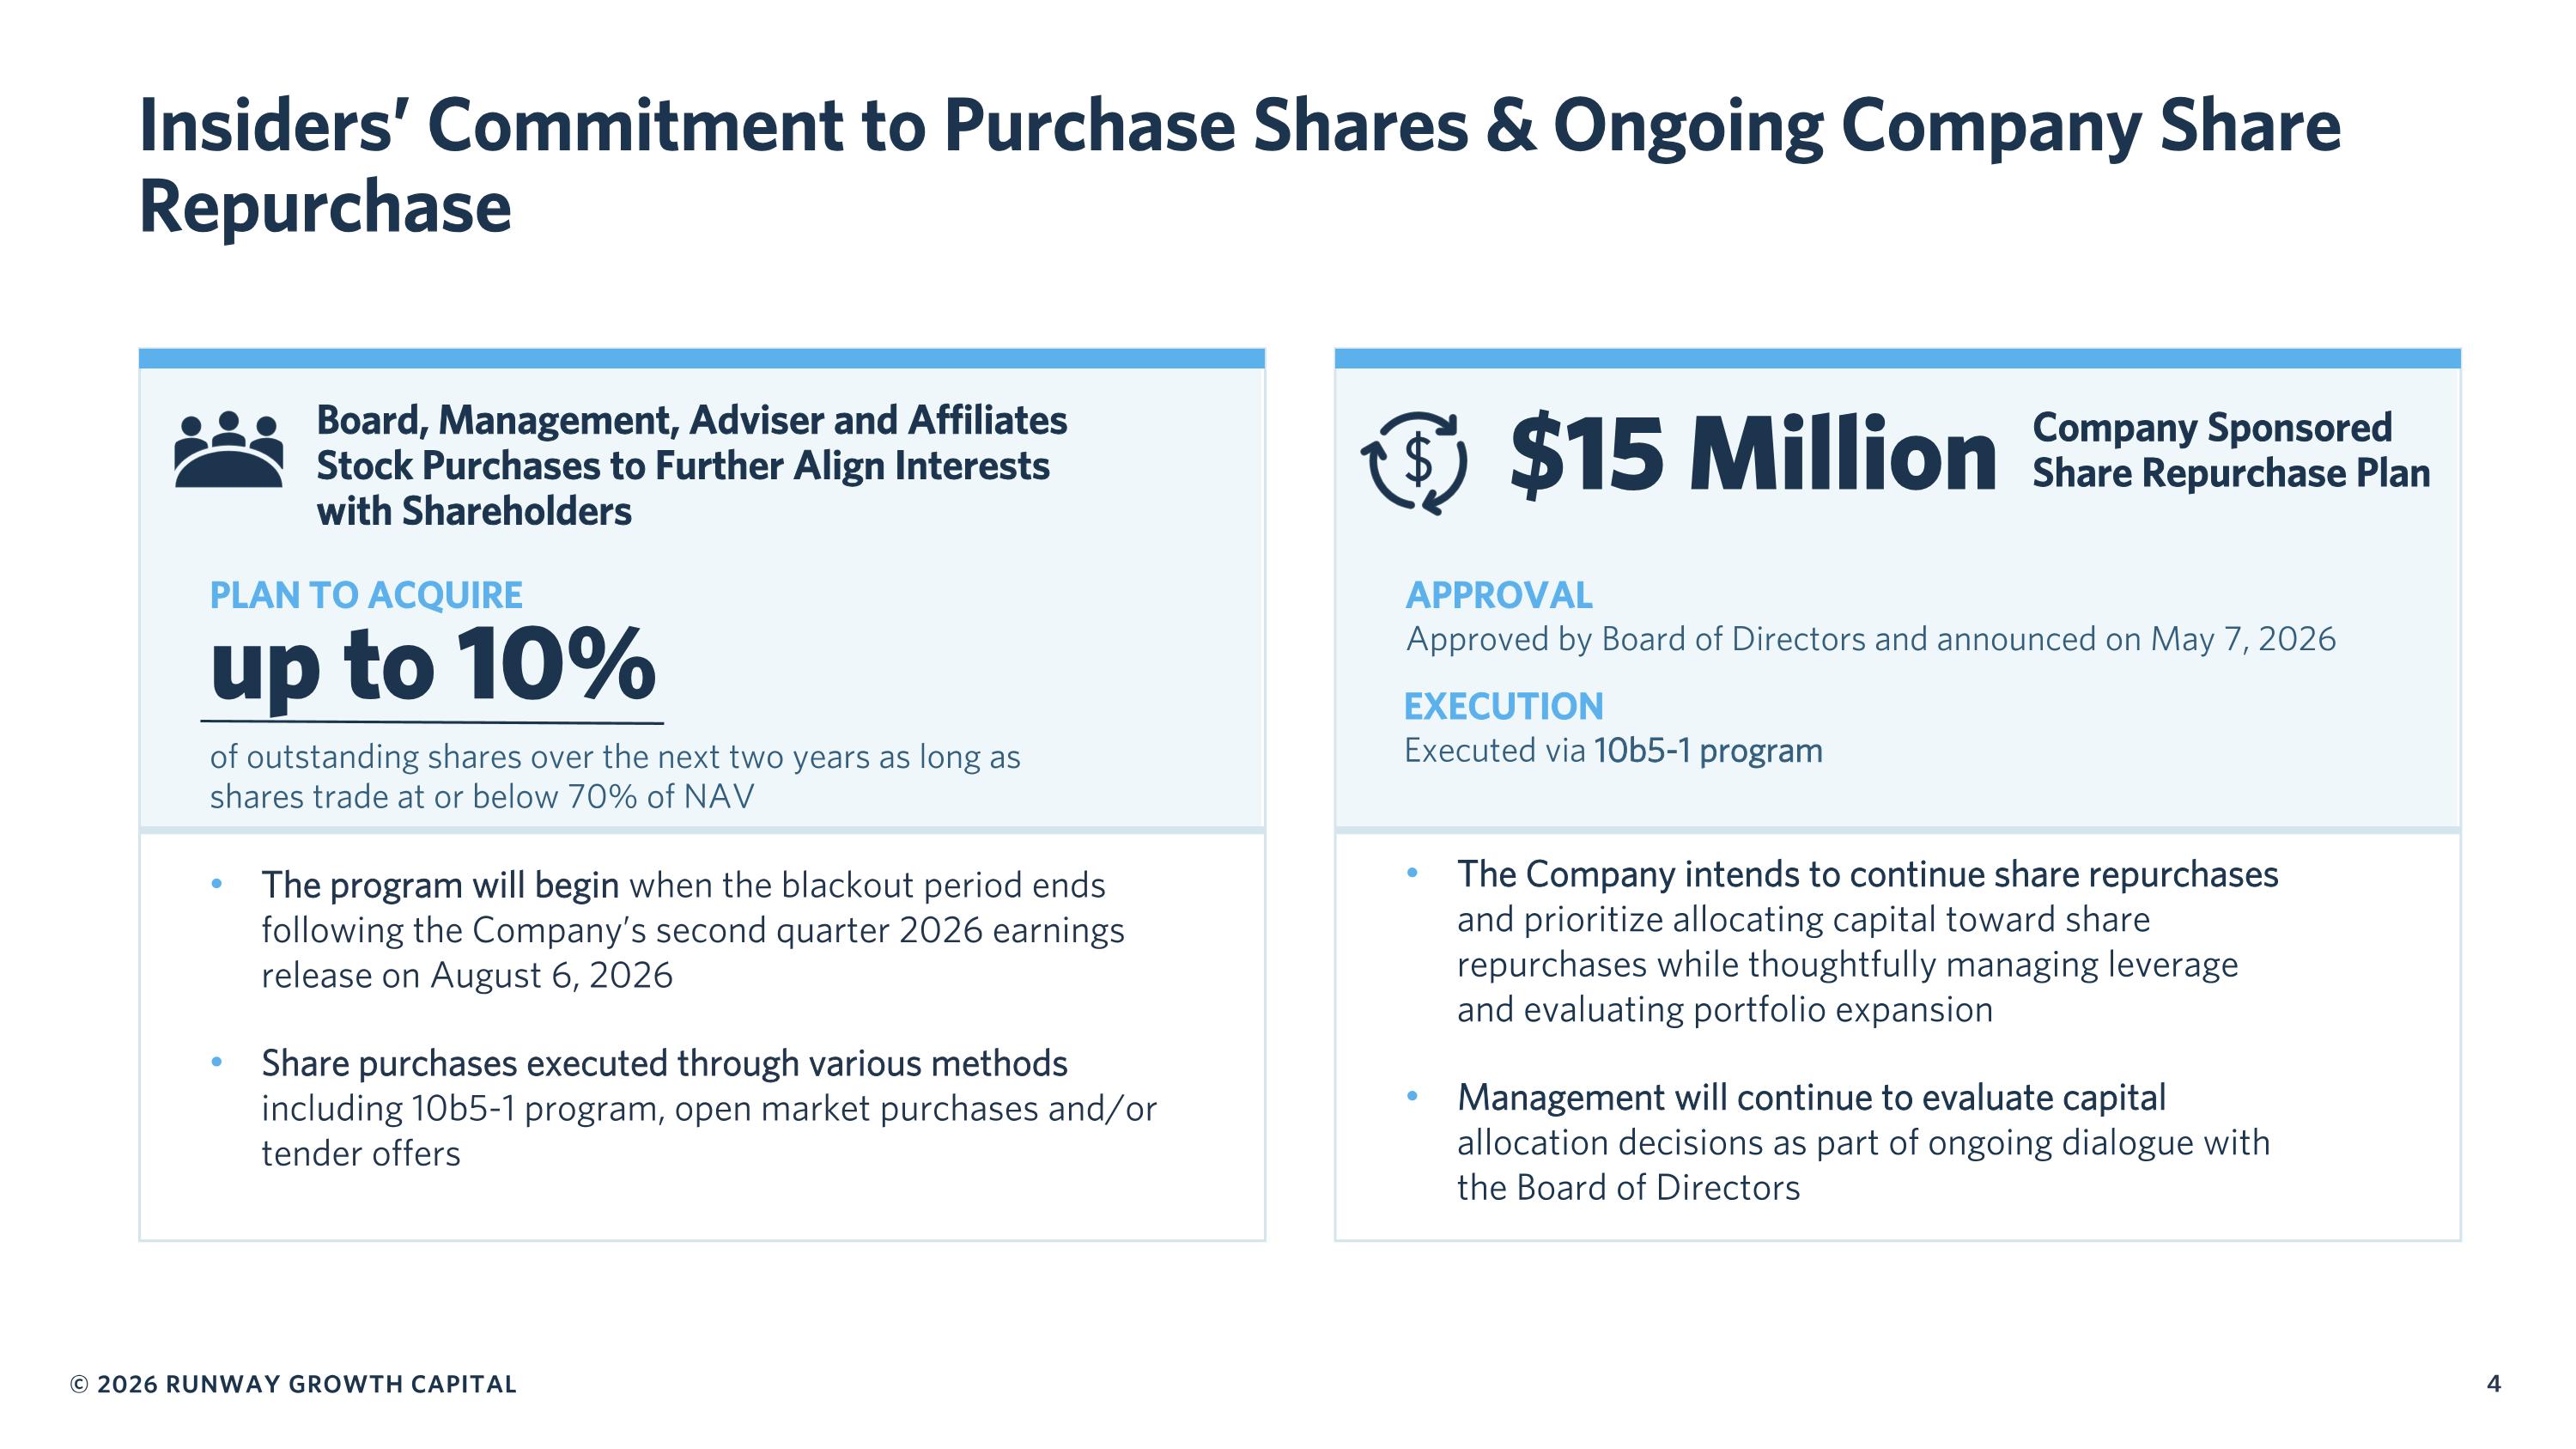
Insiders’ Commitment to Purchase Shares & Ongoing Company Share Repurchase up to 10% The program will begin when the blackout period ends following the Company’s second quarter 2026 earnings release on August 6, 2026 Share purchases executed through various methods including 10b5-1 program, open market purchases and/or tender offers PLAN TO ACQUIRE of outstanding shares over the next two years as long as shares trade at or below 70% of NAV Board, Management, Adviser and Affiliates Stock Purchases to Further Align Interests with Shareholders The Company intends to continue share repurchases and prioritize allocating capital toward share repurchases while thoughtfully managing leverage and evaluating portfolio expansion Management will continue to evaluate capital allocation decisions as part of ongoing dialogue with the Board of Directors $15 Million Company Sponsored Share Repurchase Plan APPROVAL Approved by Board of Directors and announced on May 7, 2026 EXECUTION Executed via 10b5-1 program
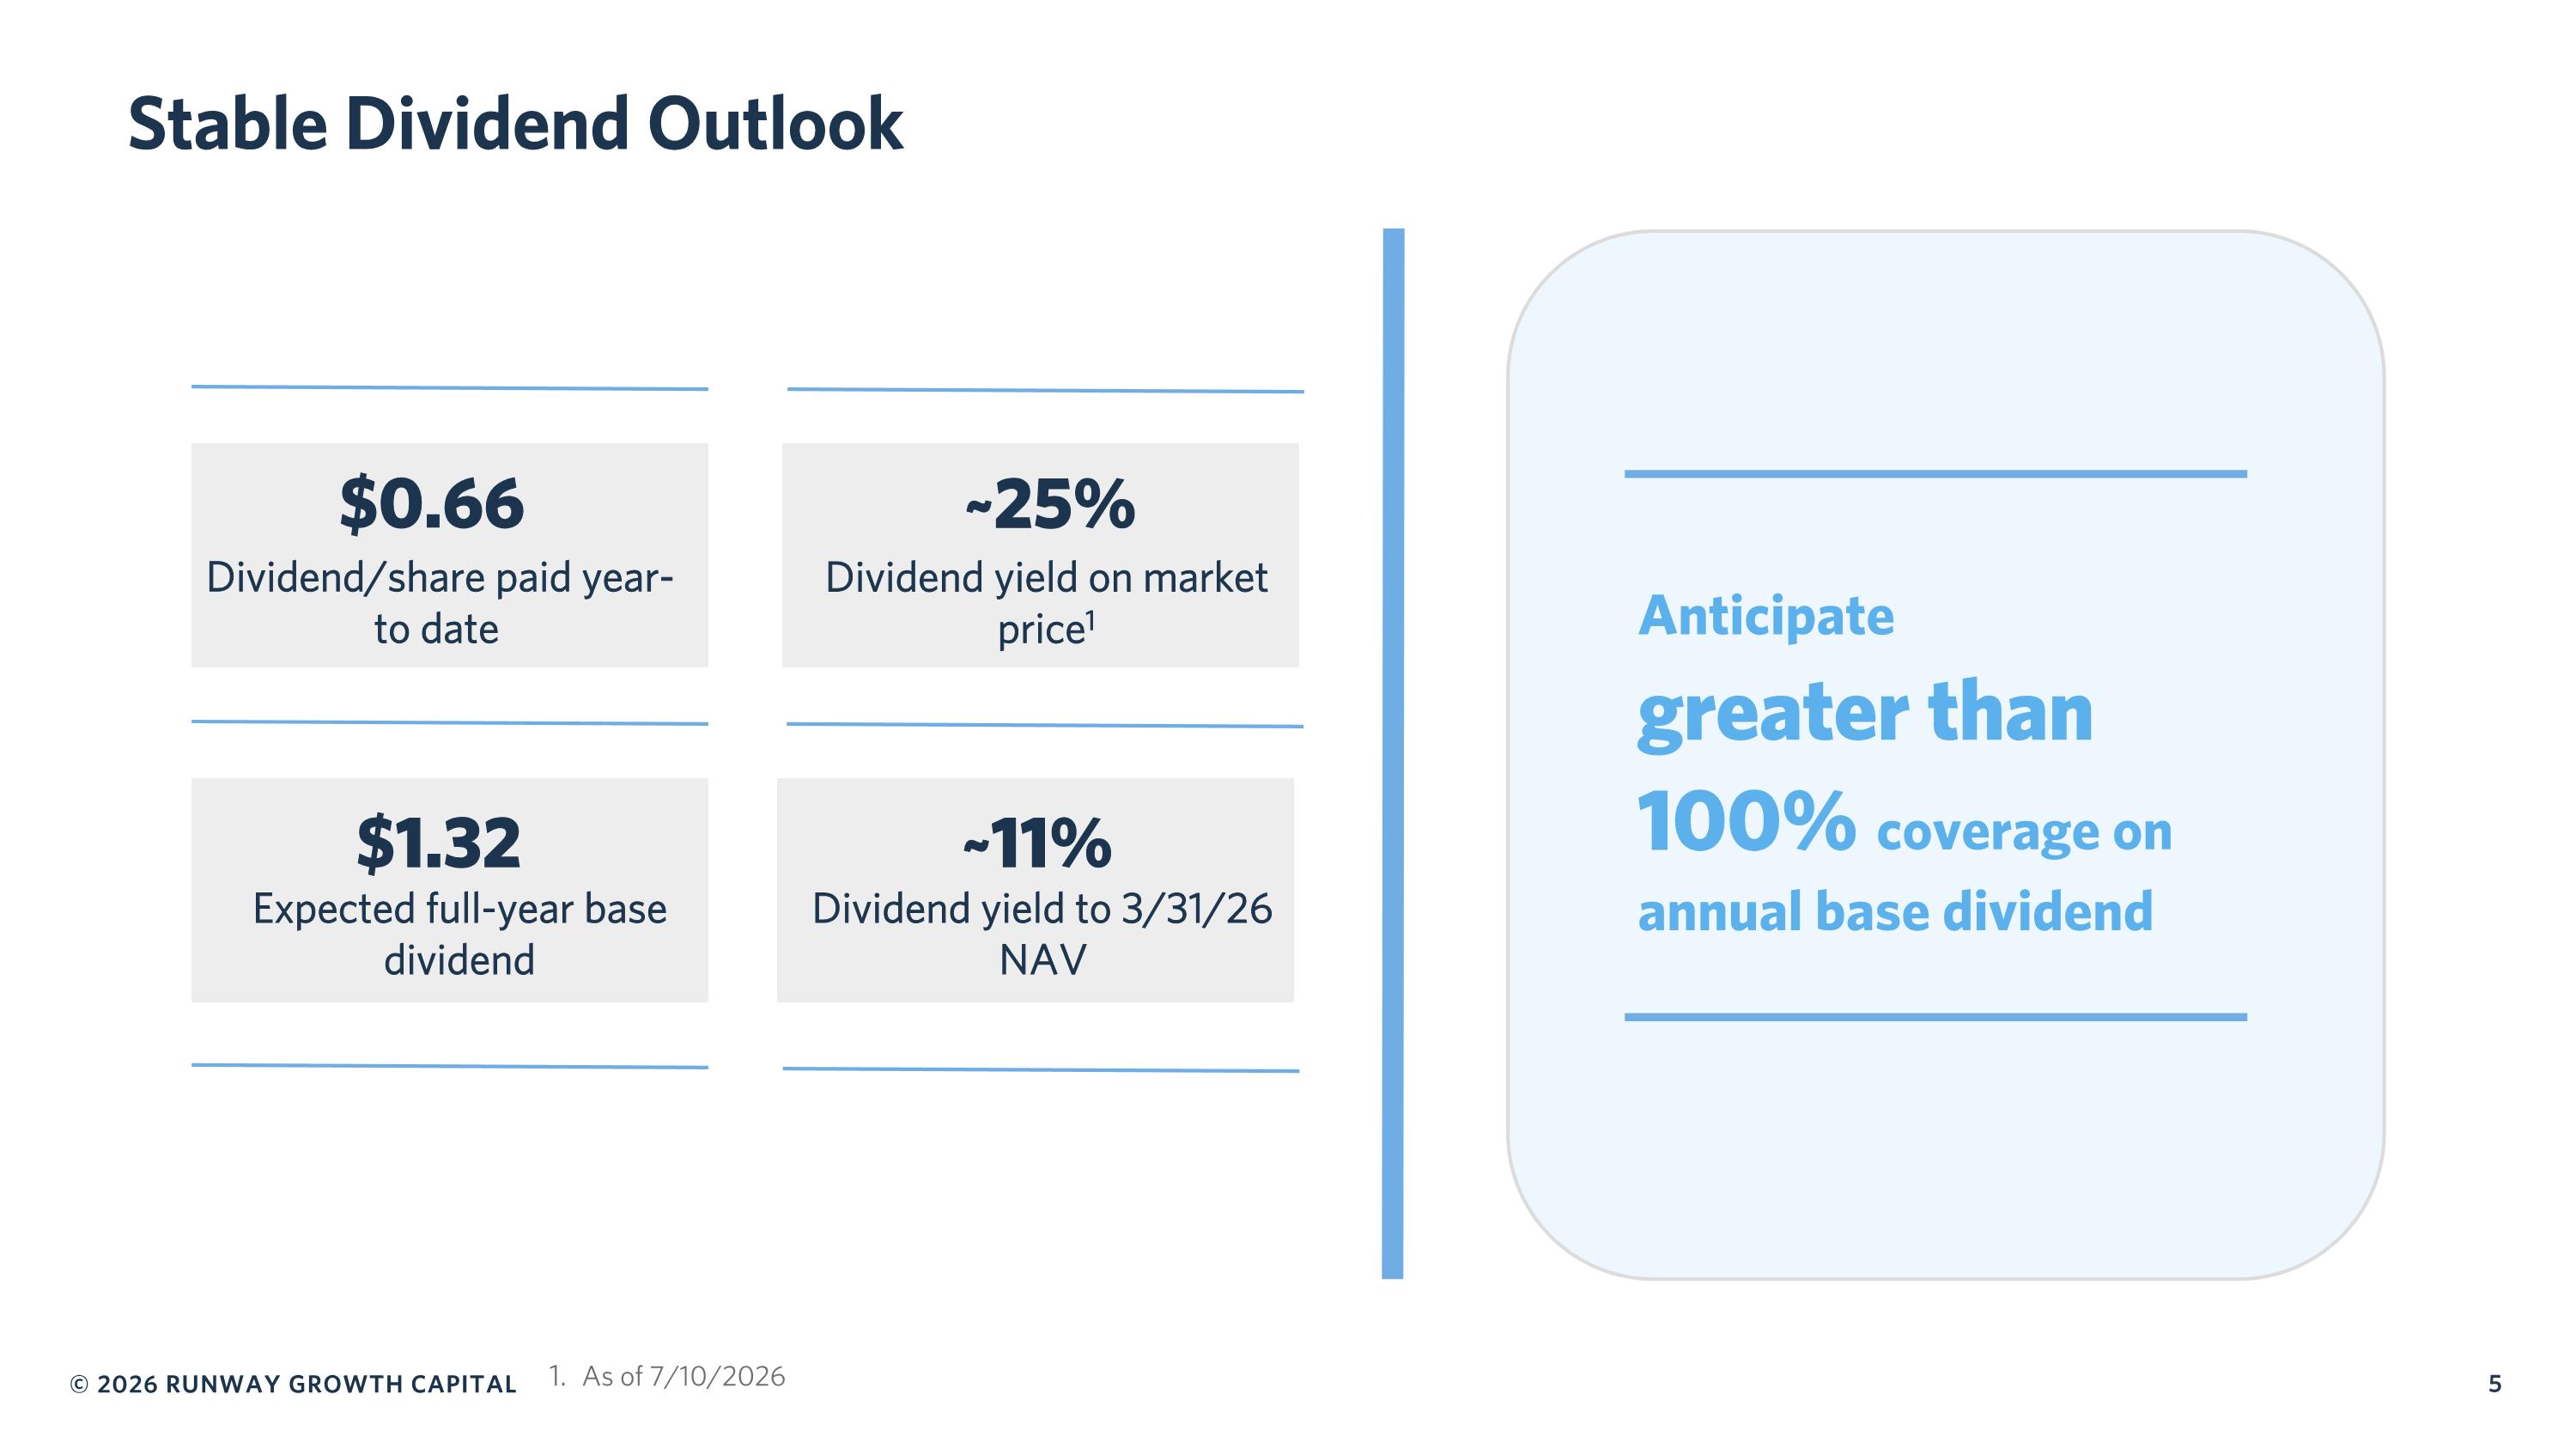
Stable Dividend Outlook Anticipate greater than 100% coverage on annual base dividend $0.66 Dividend/share paid year-to date $1.32 Expected full-year base dividend ~25% Dividend yield on market price1 ~11% Dividend yield to 3/31/26 NAV As of 7/10/2026
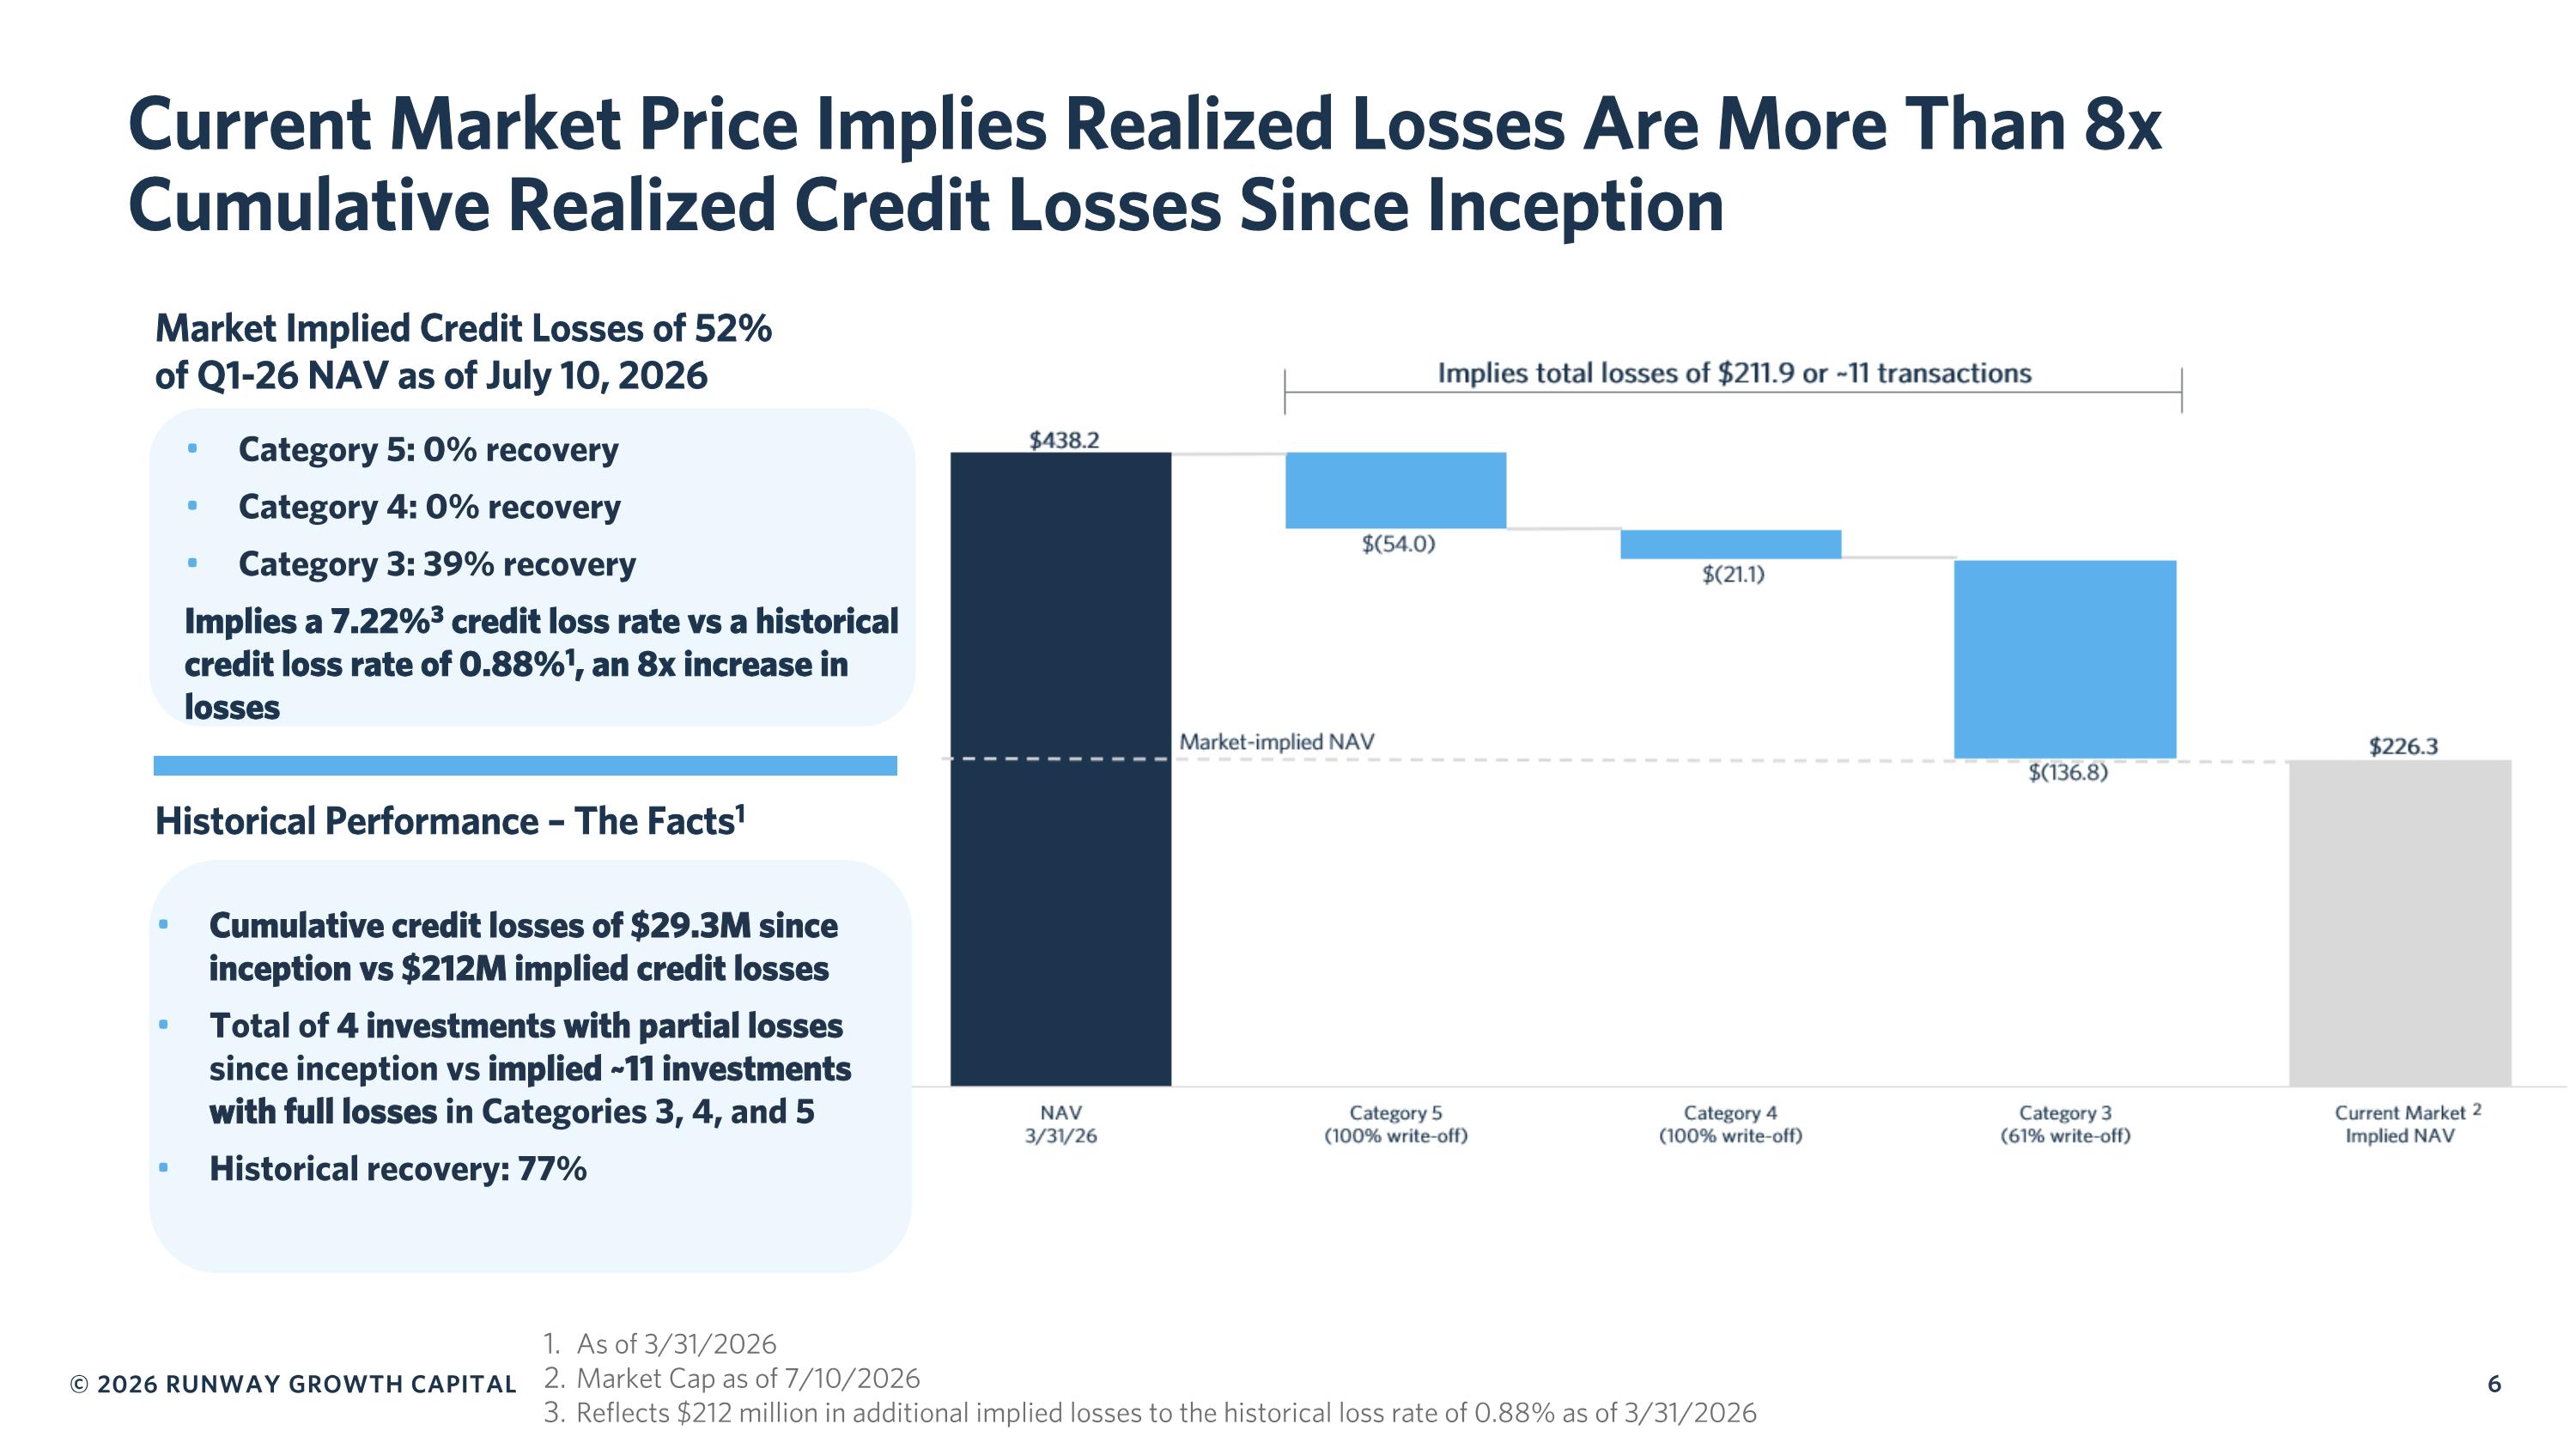
Current Market Price Implies Realized Losses Are More Than 8x Cumulative Realized Credit Losses Since Inception Historical Performance – The Facts1 Category 5: 0% recovery Category 4: 0% recovery Category 3: 39% recovery Implies a 7.22%3 credit loss rate vs a historical credit loss rate of 0.88%1, an 8x increase in losses Cumulative credit losses of $29.3M since inception vs $212M implied credit losses Total of 4 investments with partial losses since inception vs implied ~11 investments with full losses in Categories 3, 4, and 5 Historical recovery: 77% As of 3/31/2026 Market Cap as of 7/10/2026 Reflects $212 million in additional implied losses to the historical loss rate of 0.88% as of 3/31/2026 Market Implied Credit Losses of 52% of Q1-26 NAV as of July 10, 2026
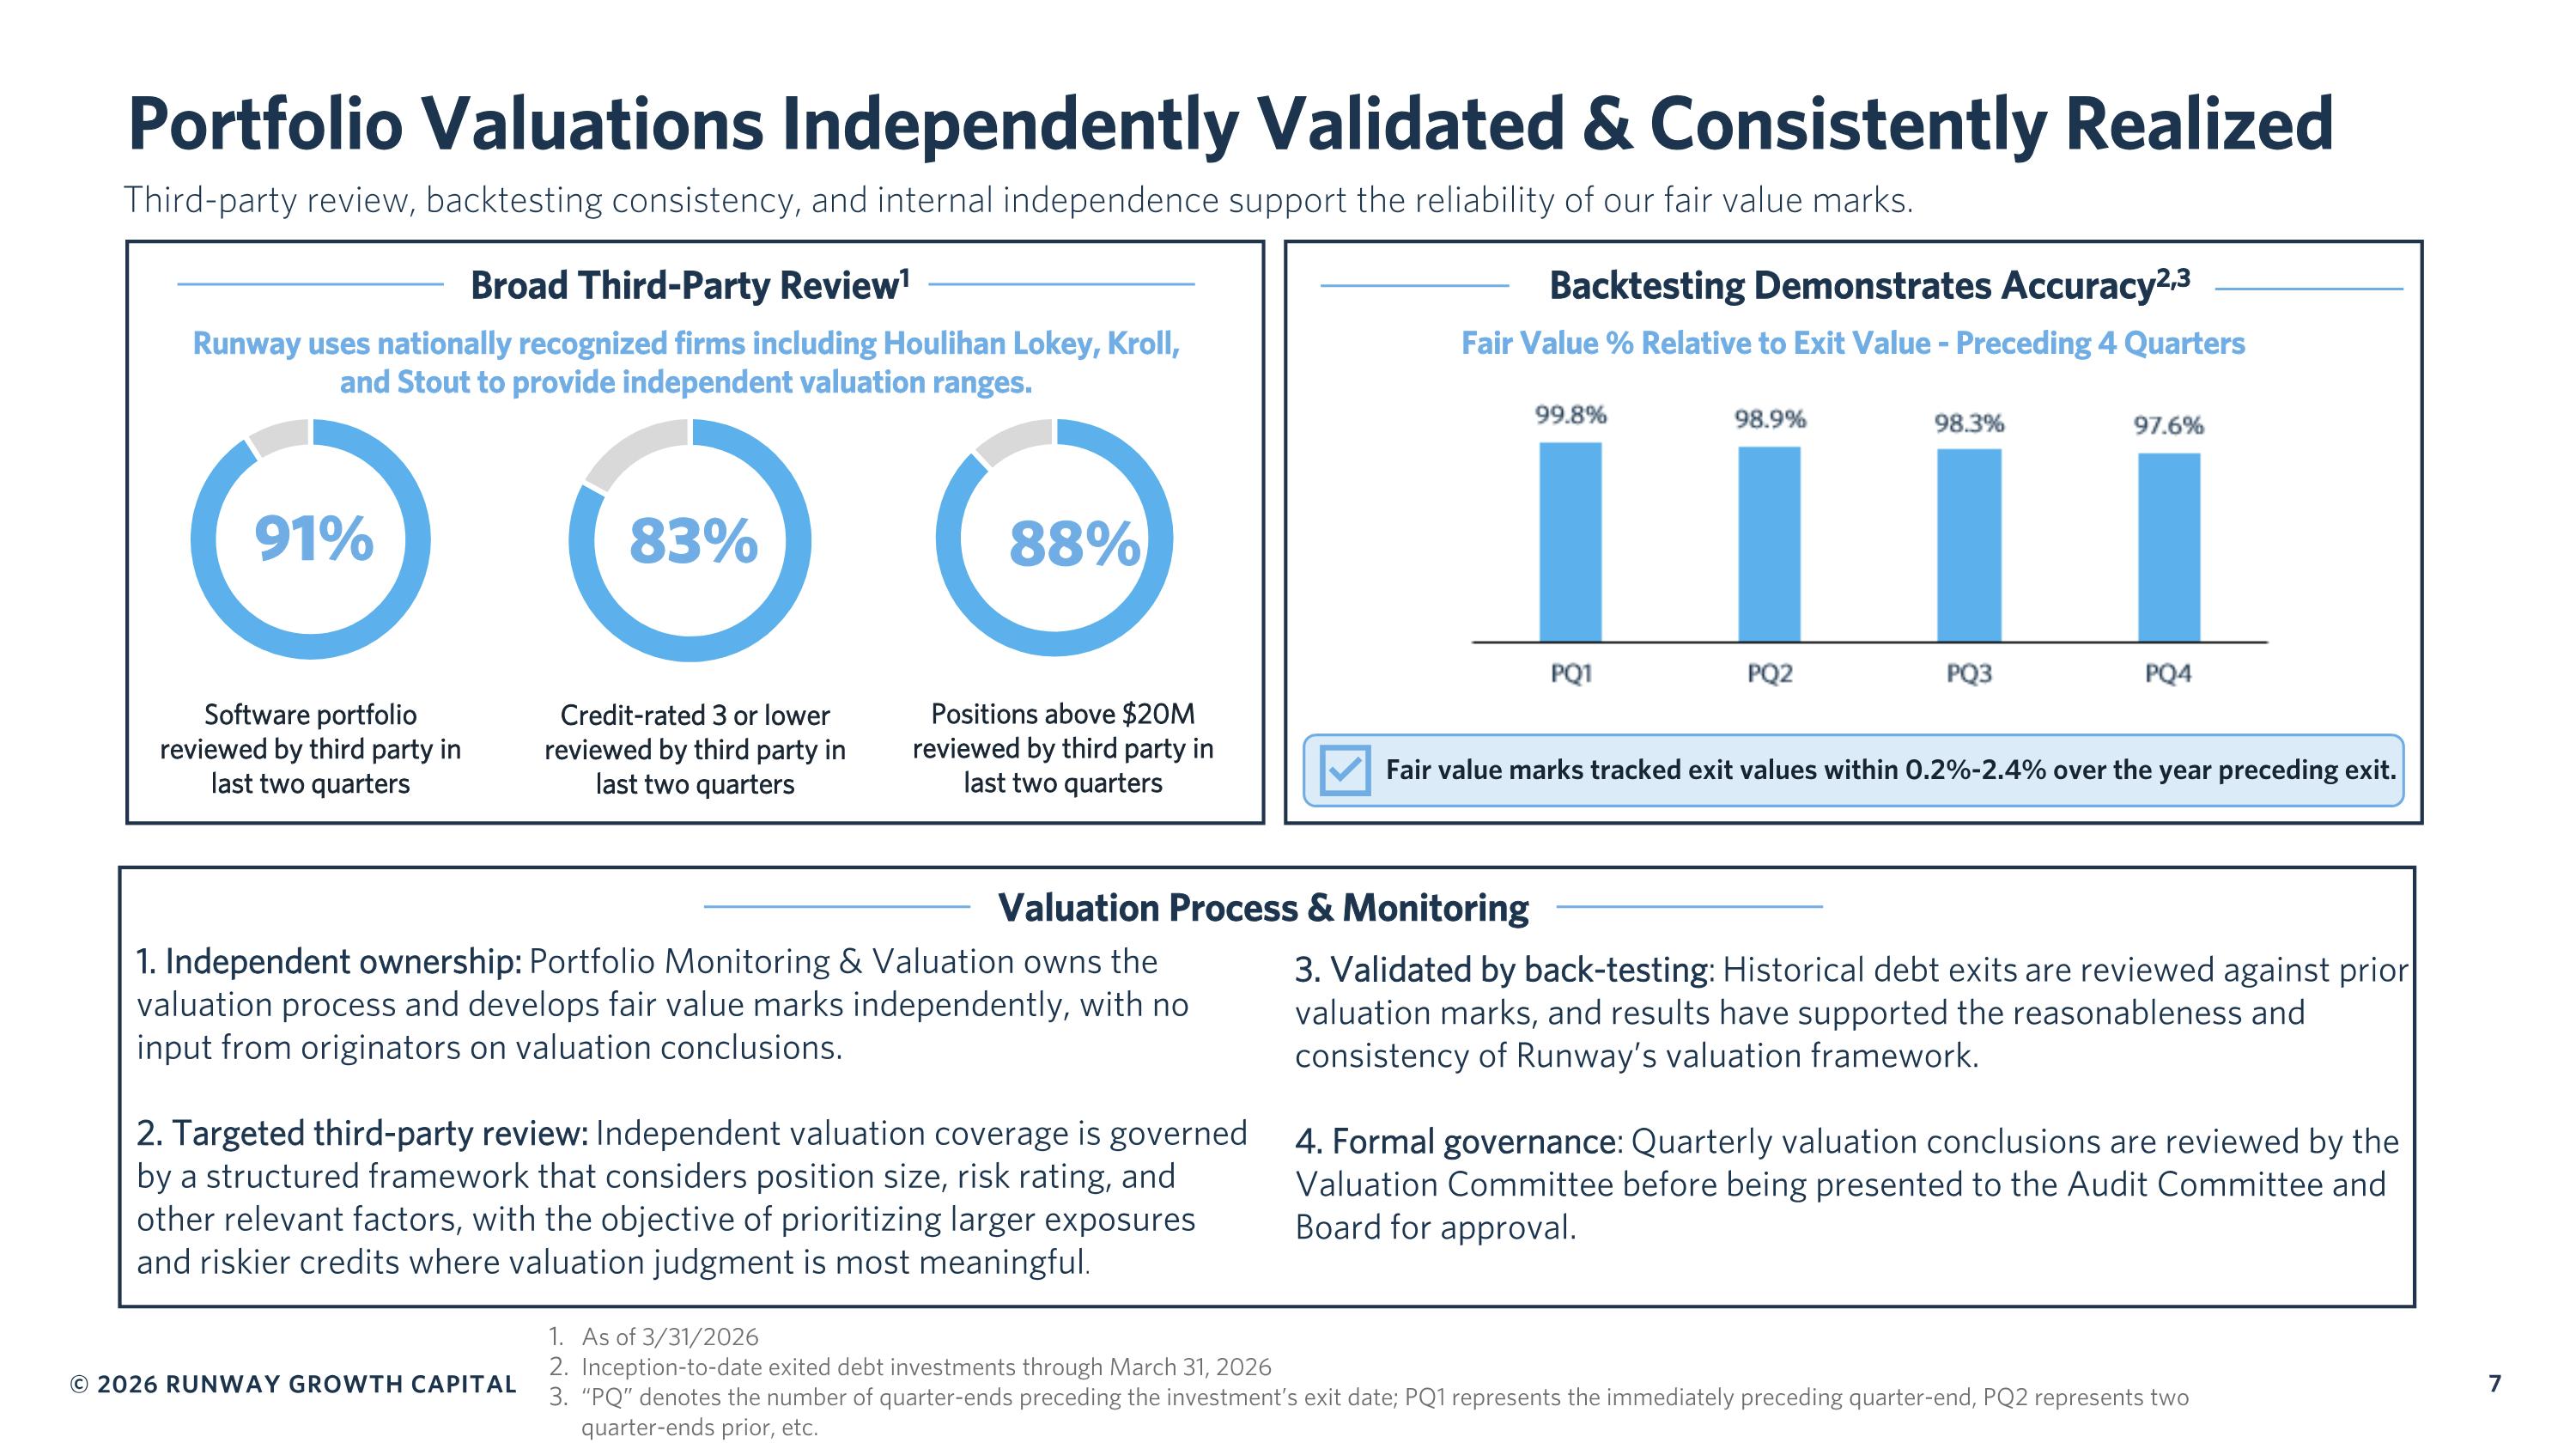
Portfolio Valuations Independently Validated & Consistently Realized Broad Third-Party Review1 Backtesting Demonstrates Accuracy2,3 Third-party review, backtesting consistency, and internal independence support the reliability of our fair value marks. Fair value marks tracked exit values within 0.2%-2.4% over the year preceding exit. 1. Independent ownership: Portfolio Monitoring & Valuation owns the valuation process and develops fair value marks independently, with no input from originators on valuation conclusions. 2. Targeted third-party review: Independent valuation coverage is governed by a structured framework that considers position size, risk rating, and other relevant factors, with the objective of prioritizing larger exposures and riskier credits where valuation judgment is most meaningful. Software portfolio reviewed by third party in last two quarters Credit-rated 3 or lower reviewed by third party in last two quarters Positions above $20M reviewed by third party in last two quarters 91% 83% 88% Fair Value % Relative to Exit Value - Preceding 4 Quarters Runway uses nationally recognized firms including Houlihan Lokey, Kroll, and Stout to provide independent valuation ranges. As of 3/31/2026 Inception-to-date exited debt investments through March 31, 2026 “PQ” denotes the number of quarter-ends preceding the investment’s exit date; PQ1 represents the immediately preceding quarter-end, PQ2 represents two quarter-ends prior, etc. 3. Validated by back-testing: Historical debt exits are reviewed against prior valuation marks, and results have supported the reasonableness and consistency of Runway’s valuation framework. 4. Formal governance: Quarterly valuation conclusions are reviewed by the Valuation Committee before being presented to the Audit Committee and Board for approval. Valuation Process & Monitoring
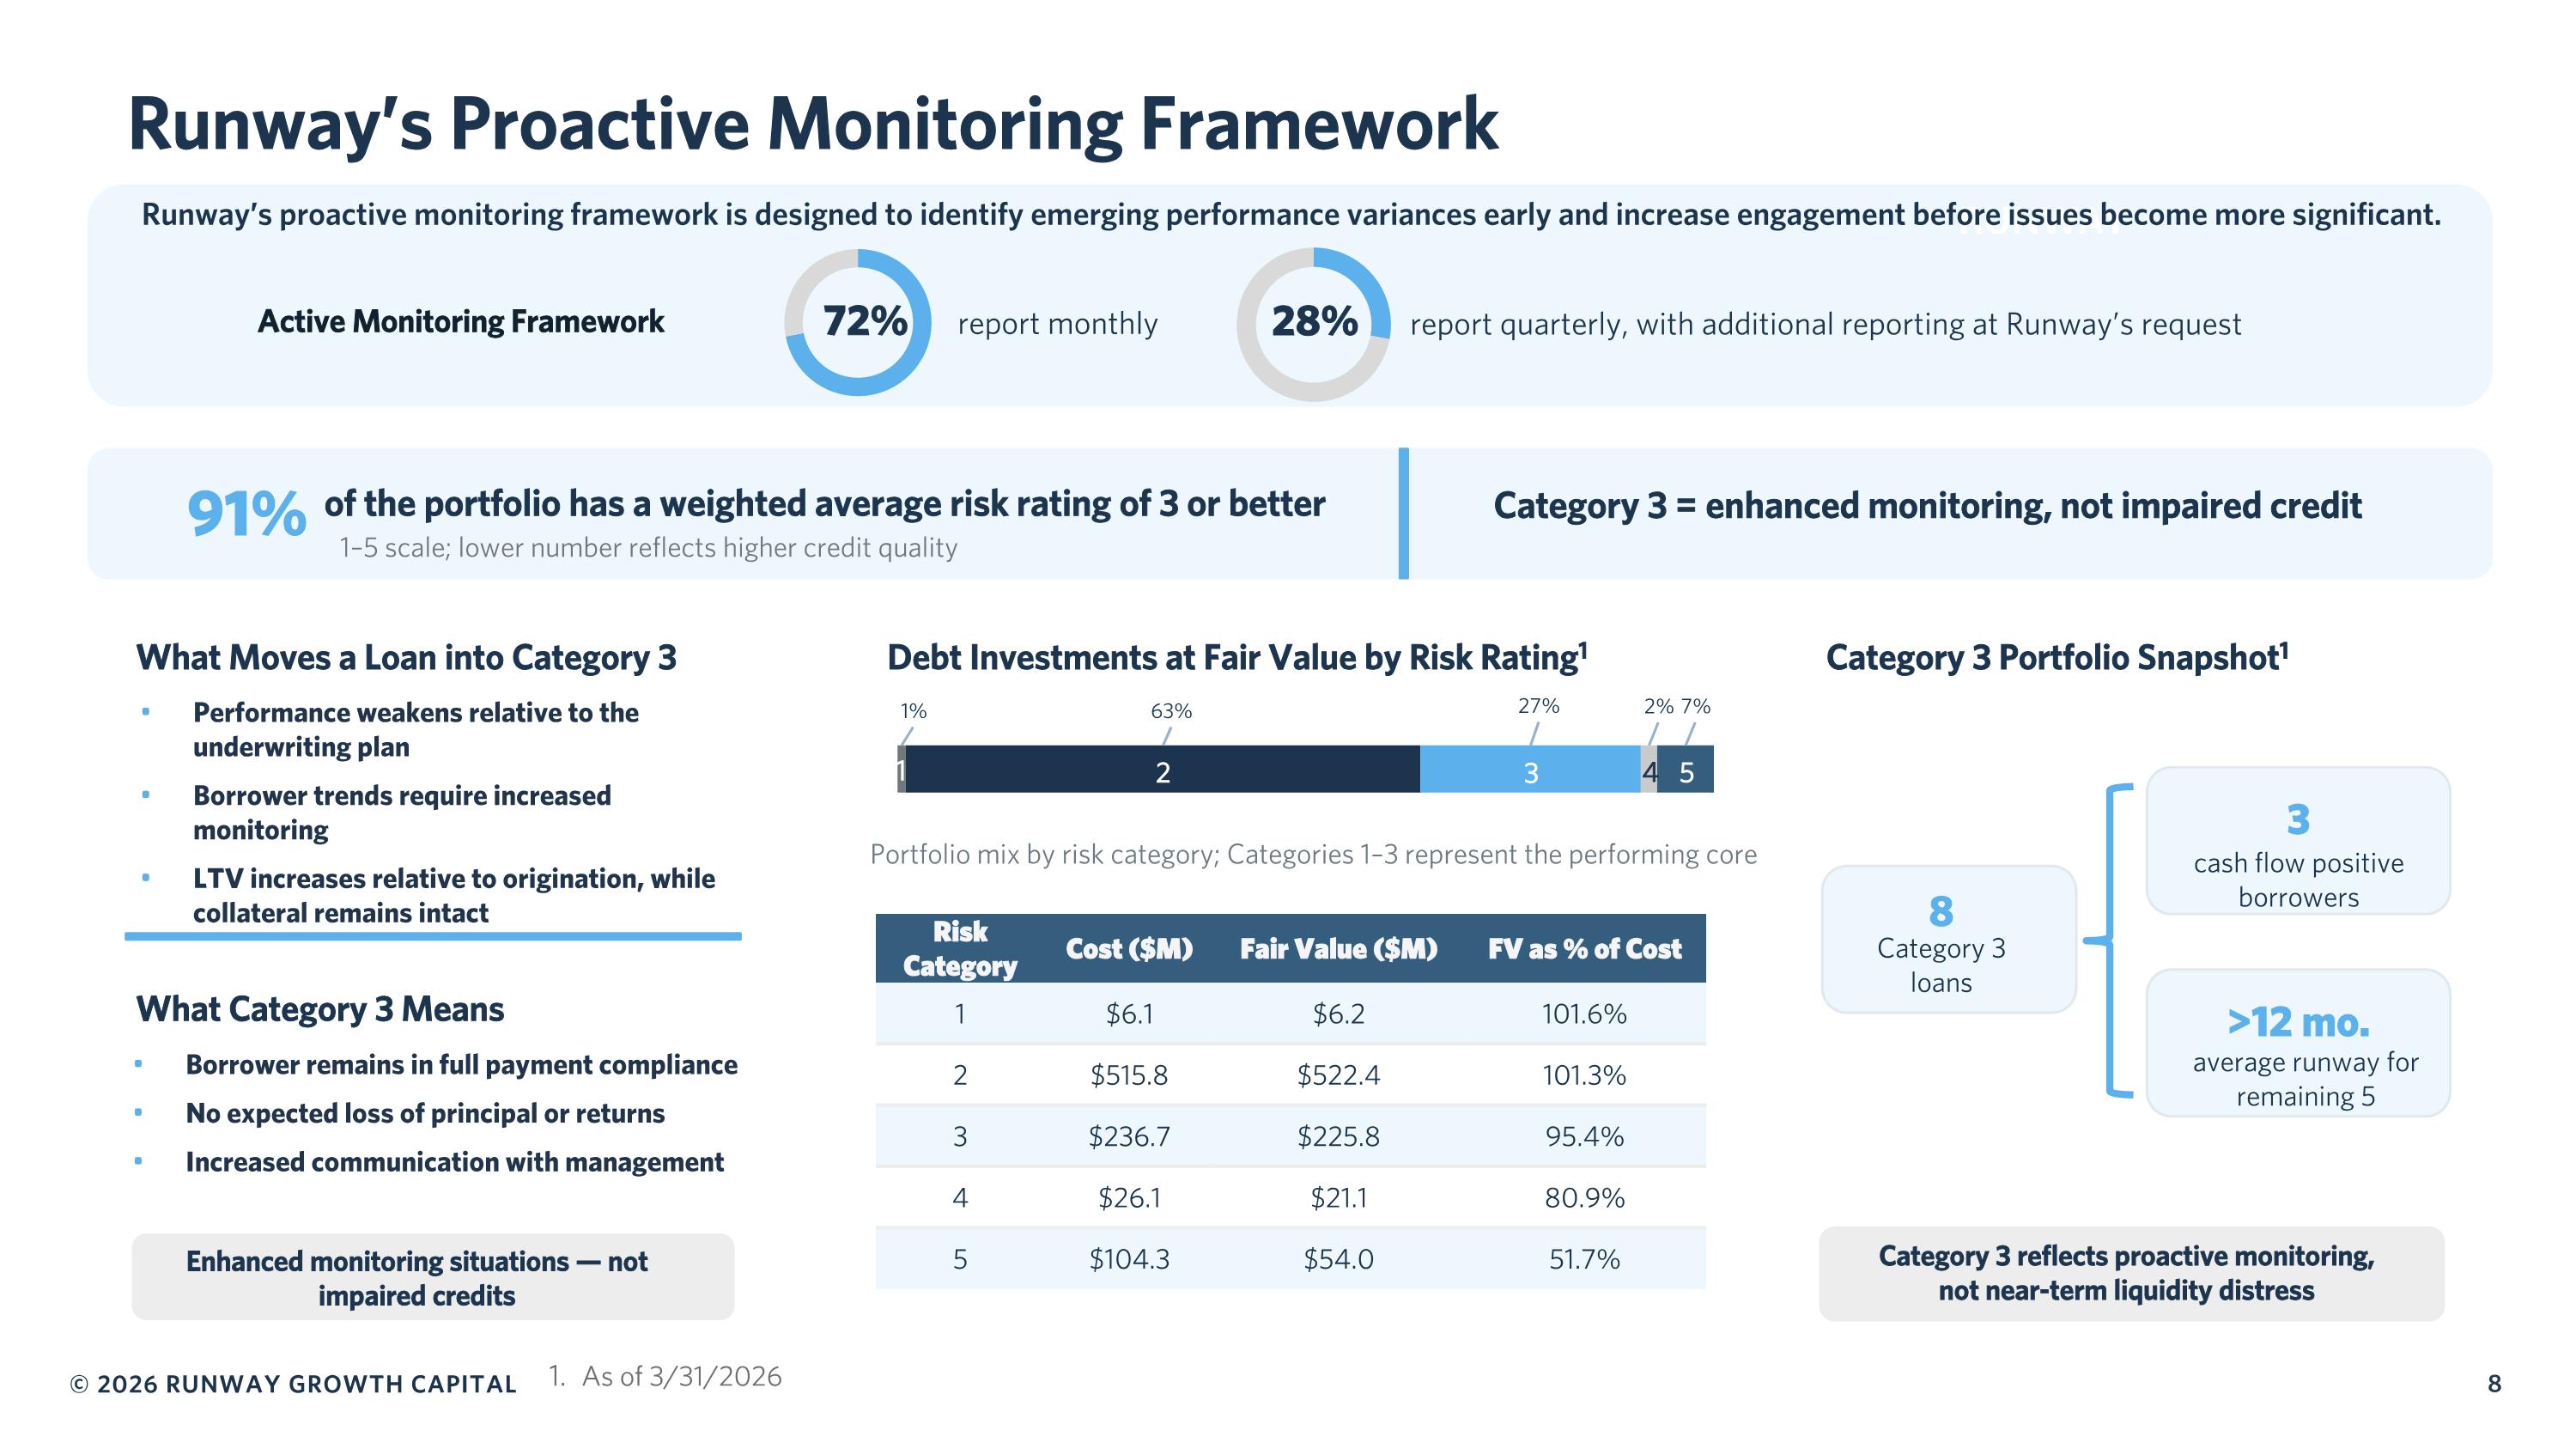
1 2 3 4 5 RUNWAY 91% of the portfolio has a weighted average risk rating of 3 or better 1–5 scale; lower number reflects higher credit quality Category 3 = enhanced monitoring, not impaired credit What Moves a Loan into Category 3 Performance weakens relative to the underwriting plan Borrower trends require increased monitoring LTV increases relative to origination, while collateral remains intact What Category 3 Means Borrower remains in full payment compliance No expected loss of principal or returns Increased communication with management Enhanced monitoring situations — not impaired credits Debt Investments at Fair Value by Risk Rating1 Portfolio mix by risk category; Categories 1–3 represent the performing core Category 3 Portfolio Snapshot1 8 Category 3 loans 3 cash flow positive borrowers >12 mo. average runway for remaining 5 Category 3 reflects proactive monitoring, not near-term liquidity distress Active Monitoring Framework report monthly report quarterly, with additional reporting at Runway’s request Runway’s proactive monitoring framework is designed to identify emerging performance variances early and increase engagement before issues become more significant. Runway’s Proactive Monitoring Framework Risk Category Cost ($M) Fair Value ($M) FV as % of Cost 1 $6.1 $6.2 101.6% 2 $515.8 $522.4 101.3% 3 $236.7 $225.8 95.4% 4 $26.1 $21.1 80.9% 5 $104.3 $54.0 51.7% 72% 28% 8 As of 3/31/2026
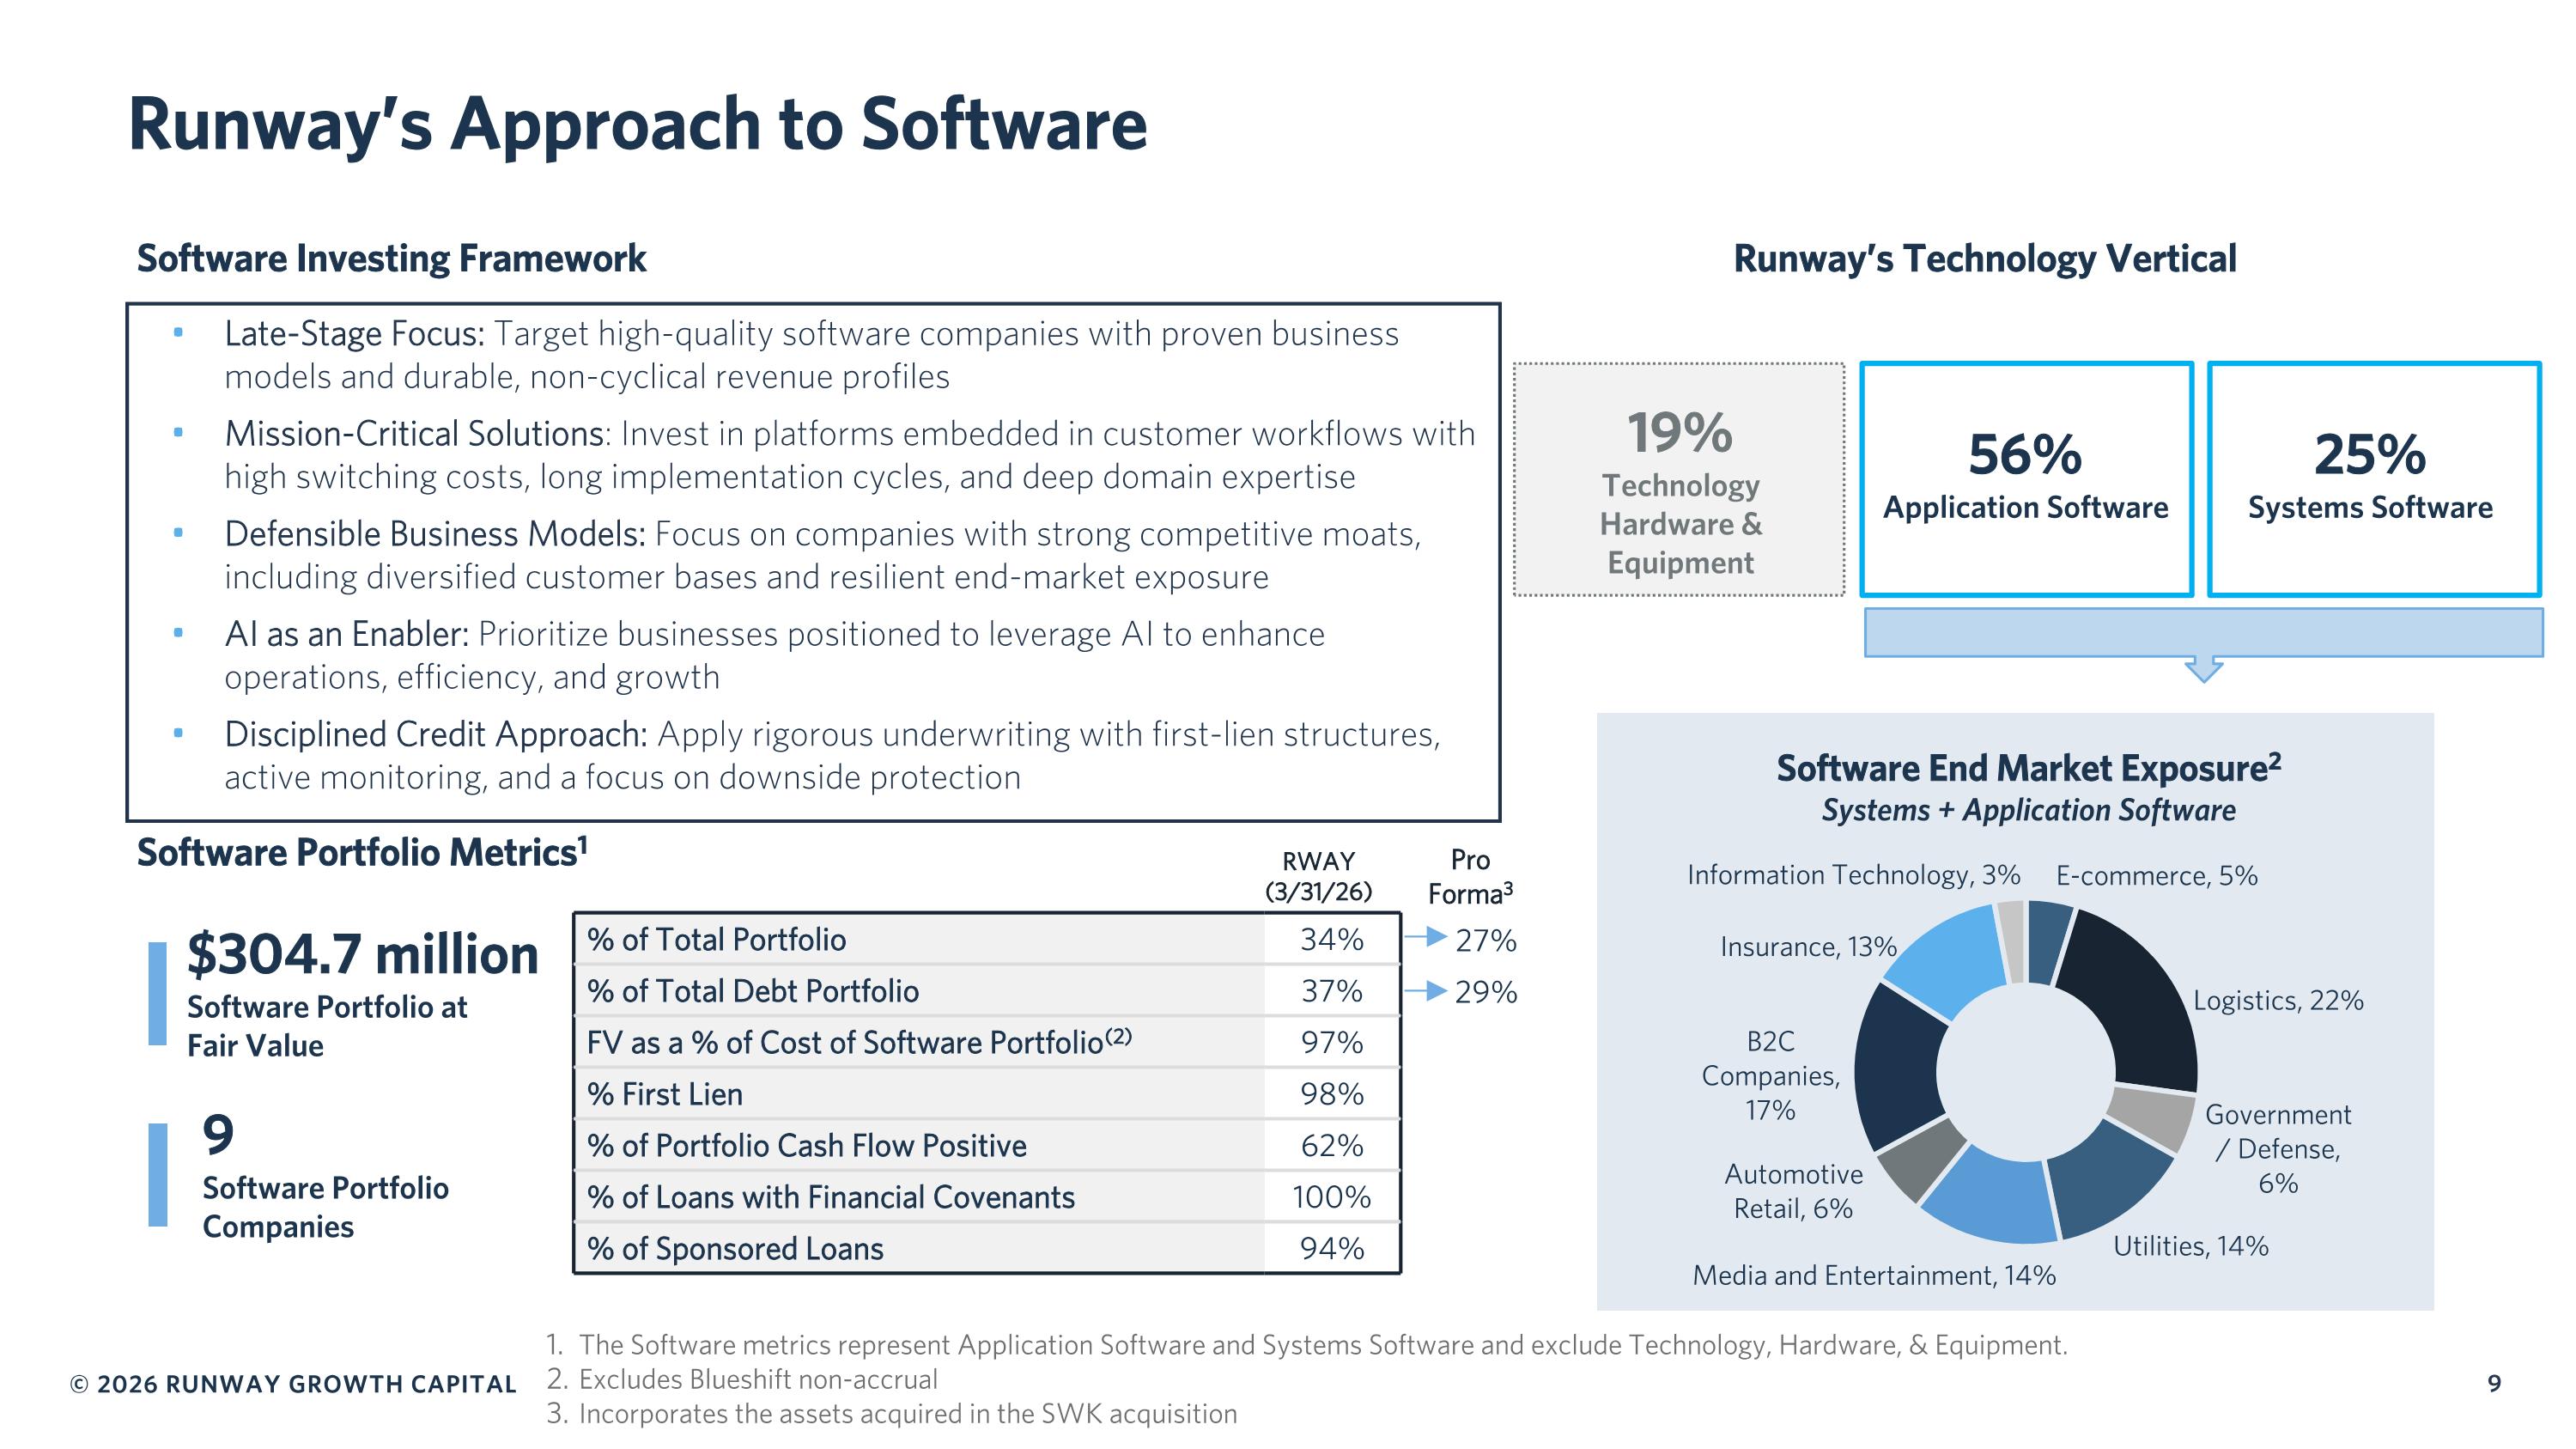
Runway’s Approach to Software The Software metrics represent Application Software and Systems Software and exclude Technology, Hardware, & Equipment. Excludes Blueshift non-accrual Incorporates the assets acquired in the SWK acquisition % of Total Portfolio 34% % of Total Debt Portfolio 37% FV as a % of Cost of Software Portfolio(2) 97% % First Lien 98% % of Portfolio Cash Flow Positive 62% % of Loans with Financial Covenants 100% % of Sponsored Loans 94% Software Portfolio Metrics1 $304.7 million Software Portfolio at Fair Value 9 Software Portfolio Companies Software Investing Framework Late-Stage Focus: Target high-quality software companies with proven business models and durable, non-cyclical revenue profiles Mission-Critical Solutions: Invest in platforms embedded in customer workflows with high switching costs, long implementation cycles, and deep domain expertise Defensible Business Models: Focus on companies with strong competitive moats, including diversified customer bases and resilient end-market exposure AI as an Enabler: Prioritize businesses positioned to leverage AI to enhance operations, efficiency, and growth Disciplined Credit Approach: Apply rigorous underwriting with first-lien structures, active monitoring, and a focus on downside protection Software End Market Exposure2 Systems + Application Software RWAY (3/31/26) Pro Forma3 Runway’s Technology Vertical 27% 29% 19% Technology Hardware & Equipment 56% Application Software 25% Systems Software
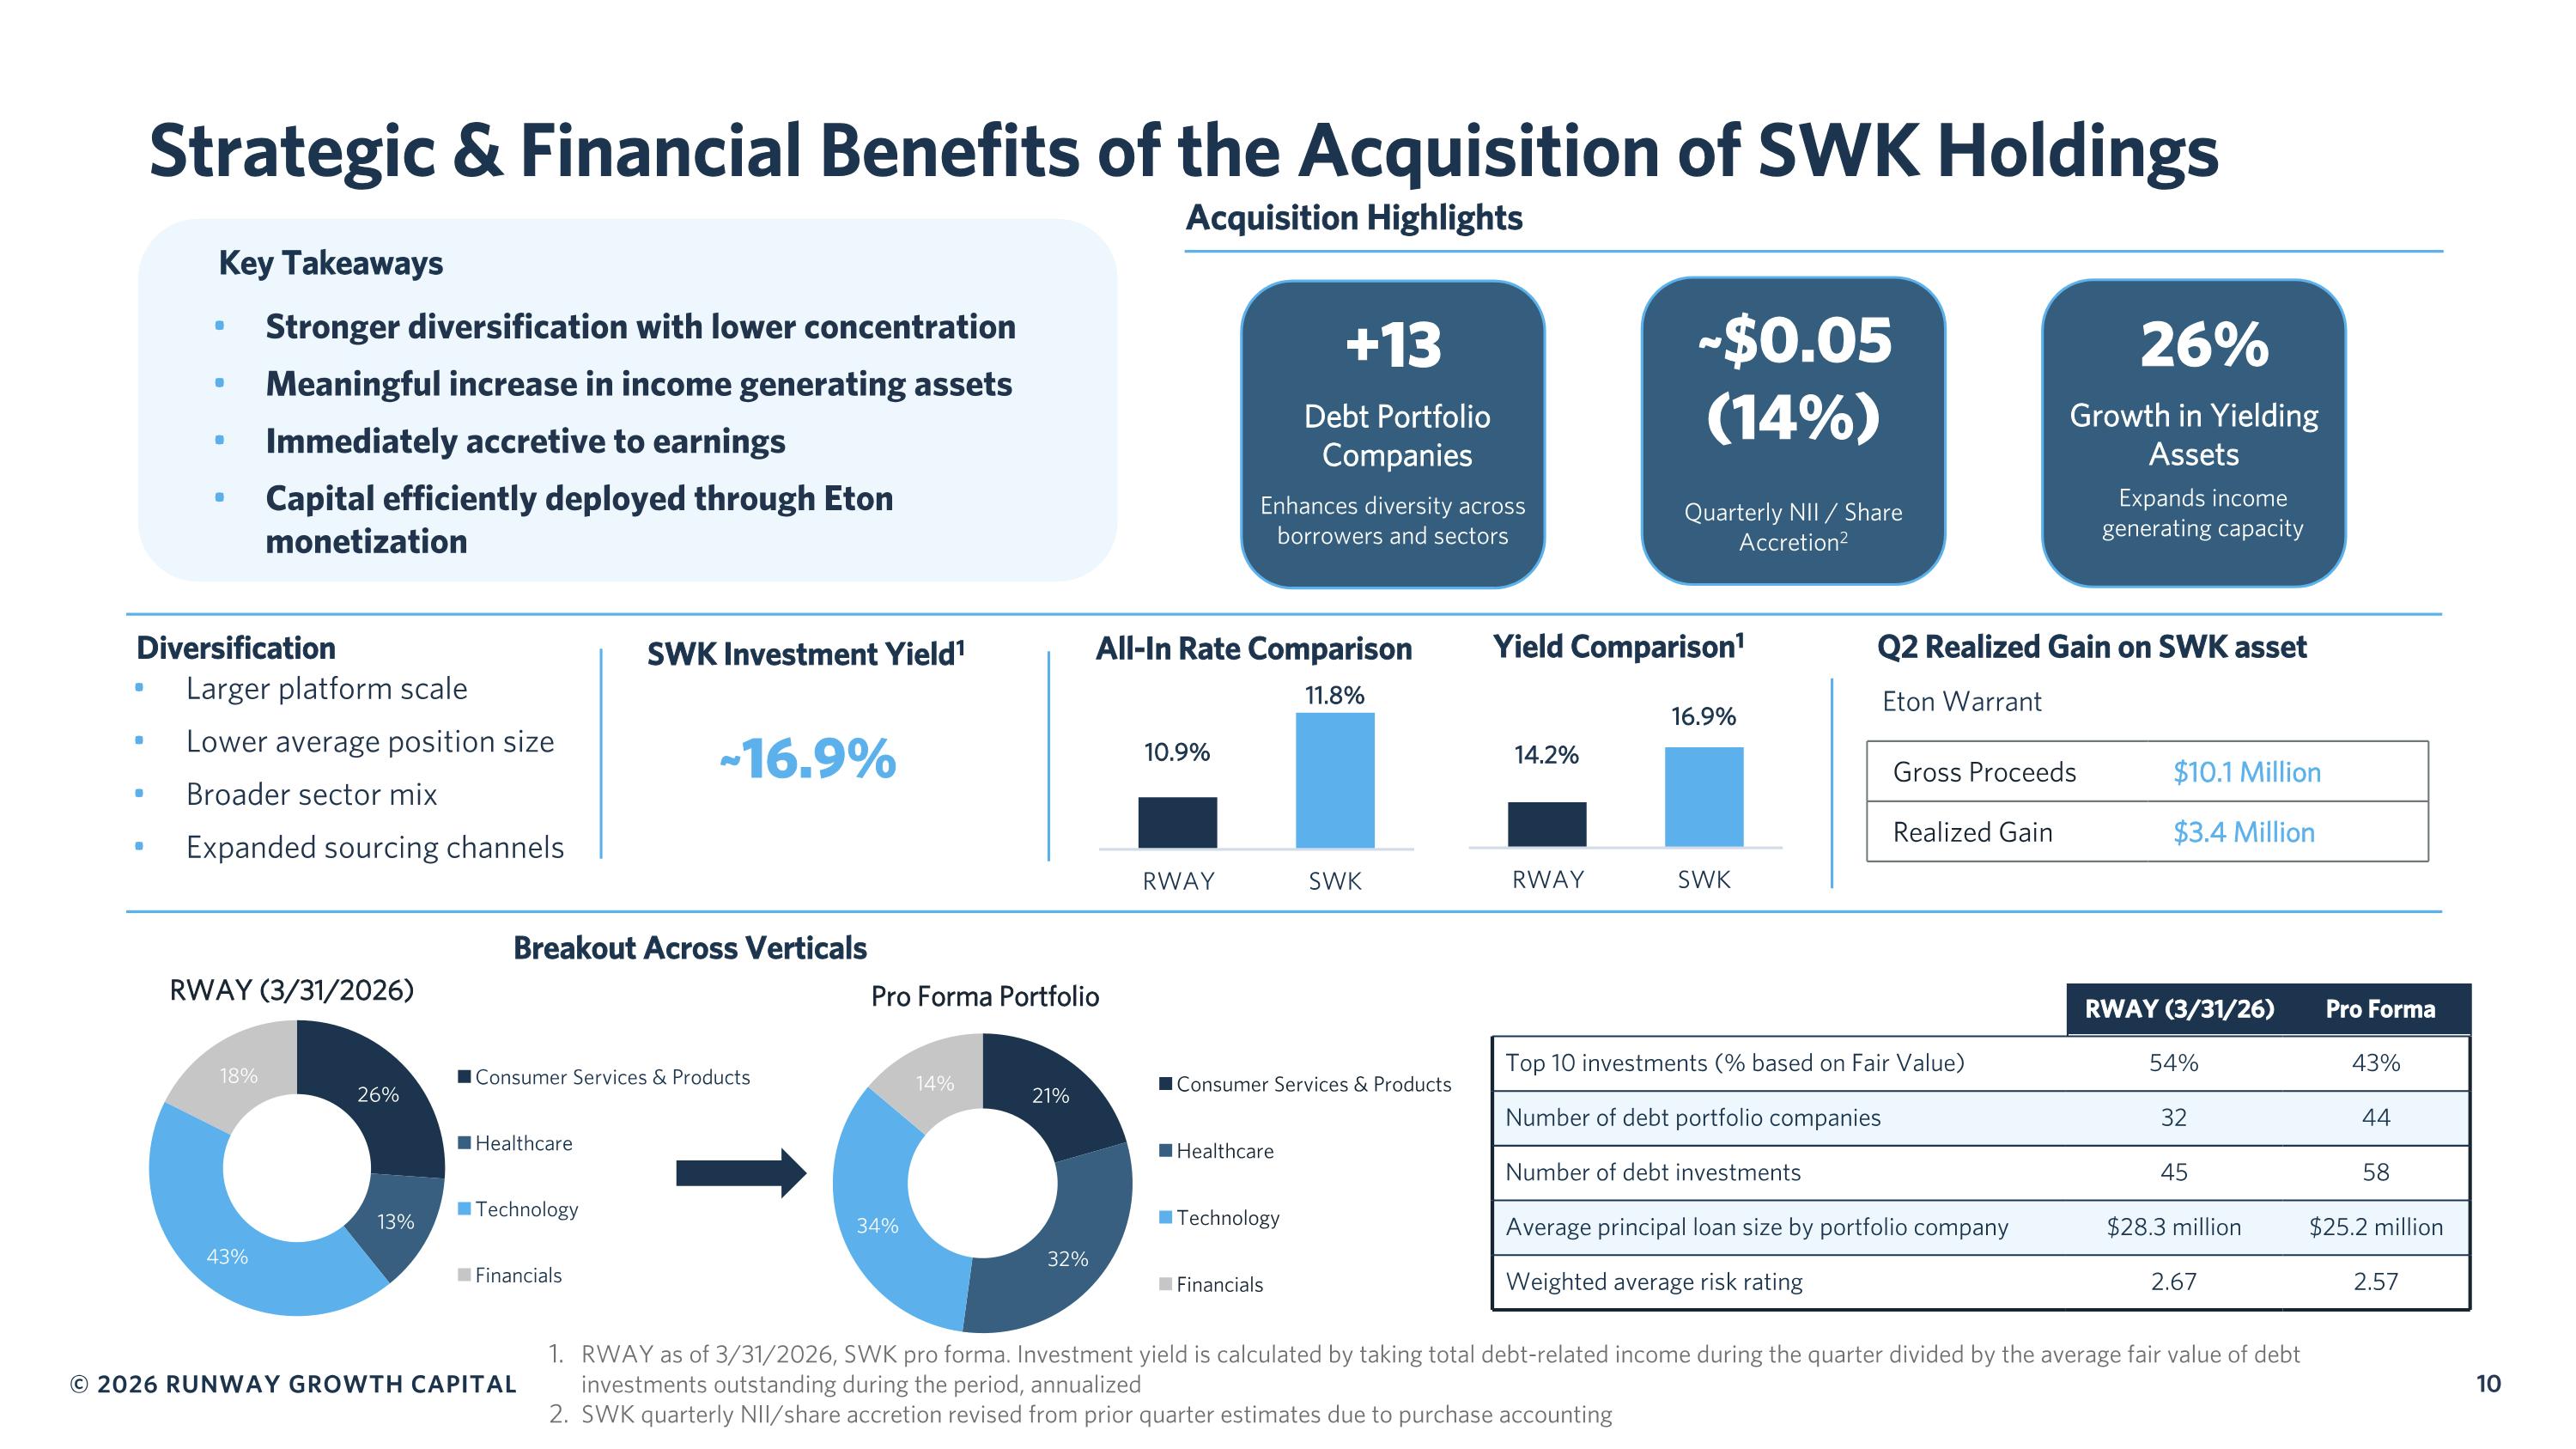
Strategic & Financial Benefits of the Acquisition of SWK Holdings Acquisition Highlights Debt Portfolio Companies Enhances diversity across borrowers and sectors ~$0.05 (14%) Quarterly NII / Share Accretion2 Growth in Yielding Assets Expands income generating capacity Diversification Larger platform scale Lower average position size Broader sector mix Expanded sourcing channels SWK Investment Yield1 ~16.9% Breakout Across Verticals RWAY (3/31/2026) Pro Forma Portfolio Q2 Realized Gain on SWK asset Eton Warrant Gross Proceeds $10.1 Million Realized Gain $3.4 Million Key Takeaways Stronger diversification with lower concentration Meaningful increase in income generating assets Immediately accretive to earnings Capital efficiently deployed through Eton monetization All-In Rate Comparison Yield Comparison1 RWAY as of 3/31/2026, SWK pro forma. Investment yield is calculated by taking total debt-related income during the quarter divided by the average fair value of debt investments outstanding during the period, annualized SWK quarterly NII/share accretion revised from prior quarter estimates due to purchase accounting +13 26% RWAY (3/31/26) Pro Forma Top 10 investments (% based on Fair Value) 54% 43% Number of debt portfolio companies 32 44 Number of debt investments 45 58 Average principal loan size by portfolio company $28.3 million $25.2 million Weighted average risk rating 2.67 2.57