v3.26.1
Pay vs Performance Disclosure - USD ($)
3 Months Ended 5 Months Ended 7 Months Ended 9 Months Ended 12 Months Ended 46 Months Ended
Jun. 30, 2025
Aug. 31, 2021
Mar. 31, 2022
Mar. 31, 2026
Mar. 31, 2026
Mar. 31, 2025
Mar. 31, 2024
Mar. 31, 2023
Mar. 31, 2022
Jun. 30, 2025
Pay vs Performance Disclosure                    
Pay vs Performance Disclosure, Table        

Pay Versus Performance

The following table sets forth the compensation information of our principal executive officer (the “PEO”) and the average compensation information of our other named executive officers (“non-PEO NEOs”), both as reported in the Summary Compensation Table in this proxy statement and with certain adjustments to reflect the “compensation actually paid” to such individuals, as defined under the SEC’s pay versus performance disclosure rules, for each of fiscal year 2026, fiscal year 2025, fiscal year 2024, fiscal year 2023 and fiscal year 2022. For further information concerning our pay-for-performance philosophy and how we align executive compensation with Company financial performance, refer to the CD&A in this proxy statement.


Year

Summary
Compensation
Table Total
for First PEO
(1)


Summary
Compensation
Table Total
for Second
PEO
(2)


Summary
Compensation
Table Total
for Third
PEO
(3)


Compensation
“Actually
Paid” to First PEO
(4)


Compensation
“Actually
Paid” to
Second PEO
(4)


Compensation
“Actually
Paid” to
Third PEO
(4)


Average
Summary
Compensation
Table Total
for non-PEO
NEOs
(5)


Average
Compensation
“Actually
Paid” to non-
PEO NEOs
(6)


Value of
Initial Fixed
$100
Investment
Based On
Total
Shareholder
Return
(7)


Value of
Initial Fixed
$100
Investment
Based On
Peer Group Total Shareholder Return
(8)


Net
Income
(9)


Adjusted
EBITDA
(10)


2026

$

1,809,120


$

679,842


$

4,239,571


$

4,979,430


$

786,430


$

2,150,498


$

567.83


$

207.51


$

12,500


$

25,995


2025


$

1,853,374


$

2,695,627


$

827,687


$

1,044,729


$

207.36


$

130.79


$

12,230


$

22,429


2024


$

2,251,043


$

4,758,685


$

876,231


$

1,780,074


$

196.28


$

113.56


$

4,556


$

13,282


2023


$

1,074,557


$

1,849,004


$

597,638


$

832,497


$

94.11


$

93.92


$

367


$

8,541


2022


$

950,904


$

1,064,678


$

815,028


$

(212,834

)

$

565,042


$

836,226


$

55.47


$

99.65


$

(8,773

)

$

(4,191

)


(1)
Reflects total compensation reported for Matthew J. Malone (our first PEO) as reported in the Summary Compensation Table for the corresponding fiscal year. Mr. Malone has served as our Chief Executive Officer since June 2025.
(2)
Reflects total compensation reported for Daniel J. Thoren (our second PEO) as reported in the Summary Compensation Table for the corresponding fiscal year. Mr. Thoren served as our Chief Executive Officer from September 2021 to June 2025.
(3)
Reflects total compensation reported for James R. Lines (our third PEO) as reported in the Summary Compensation Table for the corresponding fiscal year. Mr. Lines retired from the Company effective as of August 31, 2021.
(4)
The dollar amounts reported represent the amount of compensation “actually paid” to each of our PEOs in the applicable fiscal year, as computed in accordance with the SEC’s pay versus performance disclosure rules. The dollar amounts do not necessarily reflect the actual amount of compensation earned by or paid to our PEOs during the applicable fiscal year. The following table provides additional information as to the amounts deducted from and added to the Summary Compensation Table Total for fiscal year 2026 for our first and second PEO pursuant to the SEC’s rules to determine Compensation “Actually Paid” to PEO:


First PEO


Second PEO


2026


Summary Compensation Table Total for PEO


$

1,809,120


$

679,842


Adjustments for defined benefit pension plan


(Deduct): Aggregate change in actuarial present value included in Summary
   Compensation Table Total for the covered fiscal year


$


$


Add: Service cost for the covered fiscal year


$


$


Add: Prior service cost for the covered fiscal year


$


$


Adjustments for stock awards and option awards


(Deduct): Aggregate value for stock awards and option awards included in
   Summary Compensation Table Total for the covered fiscal year


$

600,004


$

125,008


Add: Fair value at year end of awards granted during the covered fiscal year
   that were outstanding and unvested at the covered fiscal year end


$

1,804,585


$

375,975


Add: Year-over-year change in fair value at covered fiscal year end of awards
   granted in any prior fiscal year that were outstanding and unvested at the
   covered fiscal year end


$

1,350,145


$

4,356,746


Add: Vesting date fair value of awards granted and vested during the covered
   fiscal year


$


$


Add: Change as of the vesting date (from the end of the prior fiscal year) in
   fair value of awards granted in any prior fiscal year for which vesting
   conditions were satisfied during the covered fiscal year


$

181,880


$

508,259


(Deduct): Fair value at end of prior fiscal year of awards granted in any prior
   fiscal year that failed to meet the applicable vesting conditions during the
   covered fiscal year


$

306,155


$

816,384


Add: Change in incremental fair value of awards modified during the covered
   fiscal year


$


$


Add: Dividends or other earnings paid on awards in the covered fiscal year
   prior to vesting if not otherwise included in the Summary Compensation
   Table Total for the covered fiscal year


$


$


Compensation “Actually Paid” to PEO


$

4,239,571


$

4,979,430


(5)
Reflects the average compensation information for the non-PEO NEOs as a group based on total compensation reported in the Summary Compensation Table for the corresponding year. The non-PEO NEOs for fiscal year 2026 were Christopher J. Thome, Alan E. Smith and Michael Dixon, the non-PEO NEOs for fiscal year 2025 and 2024 were Christopher J. Thome, Alan E. Smith and Matthew J. Malone, the non-PEO NEOs for fiscal year 2023 were Christopher J. Thome and Matthew J. Malone, and the non-PEO NEOs for fiscal year 2022 were Matthew J. Malone and Jeffrey F. Glajch.
(6)
The dollar amounts reported represent the average amount of compensation “actually paid” to the non-PEO NEOs in the applicable year, as computed in accordance with the SEC’s pay versus performance disclosure rules. The dollar amounts do not necessarily reflect the actual average amount of compensation earned by or paid to the non-PEO NEOs during the applicable fiscal year. The following table provides additional information as to the amounts deducted from and added to the Average Summary Compensation Table Total for fiscal year 2026 for non-PEO NEOs pursuant to the SEC’s rules to determine Average Compensation “Actually Paid” to non-PEO NEOs:


Other Non-PEO NEOs (Average)


2026


Summary Compensation Table Total for Non-PEO NEOs


$

786,430


Adjustments for stock awards and option awards


Deduct: Aggregate value for stock awards and option awards included in
   Summary Compensation Table Total for the covered fiscal year


$

214,565


Add: Fair value at year end of awards granted during the covered fiscal year
   that were outstanding and unvested at the covered fiscal year end


$

645,329


Add: Year-over-year change in fair value at covered fiscal year end of awards
   granted in any prior fiscal year that were outstanding and unvested at the
   covered fiscal year end


$

959,048


Add: Vesting date fair value of awards granted and vested during the covered
   fiscal year


$


Add: Change as of the vesting date (from the end of the prior fiscal year) in
   fair value of awards granted in any prior fiscal year for which vesting
   conditions were satisfied during the covered fiscal year


$

174,949


Deduct: Fair value at end of prior fiscal year of awards granted in any prior
   fiscal year that failed to meet the applicable vesting conditions during the
   covered fiscal year


$

200,693


Add: Change in incremental fair value of awards modified during the covered
   fiscal year


$


Add: Dividends or other earnings paid on awards in the covered fiscal year
   prior to vesting if not otherwise included in the Summary Compensation
   Table Total for the covered fiscal year


$


Compensation “Actually Paid” to Non-PEO NEOs


$

2,150,498


(7)
Total Stockholder Return (“TSR”) is cumulative for the measurement periods calculated in accordance with Item 201(e) of Regulation S-K. Cumulative Company TSR is calculated by dividing the difference between the Company’s stock price at the end and the beginning of the measurement period by the Company’s stock price at the beginning of the measurement period. The value assumes $100 invested on March 31, 2021.
(8)
The Peer Group is the State Street SPDR S&P Aerospace & Defense ETF disclosed in the Performance Graph of SEC Form 10-K, filed June 8, 2026. The value assumes $100 invested on March 31, 2021.
(9)
The dollar amounts reported represent the amount of net income reflected in the Company’s audited financial statements for the applicable fiscal year, in thousands.

(10) Adjusted EBITDA is defined as consolidated net income (loss) before net interest expense, income taxes, depreciation, amortization, other acquisition related expenses, equity-based compensation, ERP implementation costs, and other unusual/nonrecurring expense. Adjusted EBITDA is a non-GAAP measure, which management believes is important in evaluating the operating performance of the Company. The reconciliation of such is available in the Management's Discussion & Analysis section of SEC Form 10-K, filed June 8, 2026. The dollar amounts reported represent the amount of Adjusted EBITDA for the applicable fiscal year, in thousands.

         
Company Selected Measure Name         Adjusted EBITDA          
Named Executive Officers, Footnote        
(1)
Reflects total compensation reported for Matthew J. Malone (our first PEO) as reported in the Summary Compensation Table for the corresponding fiscal year. Mr. Malone has served as our Chief Executive Officer since June 2025.
(2)
Reflects total compensation reported for Daniel J. Thoren (our second PEO) as reported in the Summary Compensation Table for the corresponding fiscal year. Mr. Thoren served as our Chief Executive Officer from September 2021 to June 2025.
(3)
Reflects total compensation reported for James R. Lines (our third PEO) as reported in the Summary Compensation Table for the corresponding fiscal year. Mr. Lines retired from the Company effective as of August 31, 2021.
(5)
Reflects the average compensation information for the non-PEO NEOs as a group based on total compensation reported in the Summary Compensation Table for the corresponding year. The non-PEO NEOs for fiscal year 2026 were Christopher J. Thome, Alan E. Smith and Michael Dixon, the non-PEO NEOs for fiscal year 2025 and 2024 were Christopher J. Thome, Alan E. Smith and Matthew J. Malone, the non-PEO NEOs for fiscal year 2023 were Christopher J. Thome and Matthew J. Malone, and the non-PEO NEOs for fiscal year 2022 were Matthew J. Malone and Jeffrey F. Glajch.
         
Peer Group Issuers, Footnote        
(8)
The Peer Group is the State Street SPDR S&P Aerospace & Defense ETF disclosed in the Performance Graph of SEC Form 10-K, filed June 8, 2026. The value assumes $100 invested on March 31, 2021.
         
Adjustment To PEO Compensation, Footnote        


First PEO


Second PEO


2026


Summary Compensation Table Total for PEO


$

1,809,120


$

679,842


Adjustments for defined benefit pension plan


(Deduct): Aggregate change in actuarial present value included in Summary
   Compensation Table Total for the covered fiscal year


$


$


Add: Service cost for the covered fiscal year


$


$


Add: Prior service cost for the covered fiscal year


$


$


Adjustments for stock awards and option awards


(Deduct): Aggregate value for stock awards and option awards included in
   Summary Compensation Table Total for the covered fiscal year


$

600,004


$

125,008


Add: Fair value at year end of awards granted during the covered fiscal year
   that were outstanding and unvested at the covered fiscal year end


$

1,804,585


$

375,975


Add: Year-over-year change in fair value at covered fiscal year end of awards
   granted in any prior fiscal year that were outstanding and unvested at the
   covered fiscal year end


$

1,350,145


$

4,356,746


Add: Vesting date fair value of awards granted and vested during the covered
   fiscal year


$


$


Add: Change as of the vesting date (from the end of the prior fiscal year) in
   fair value of awards granted in any prior fiscal year for which vesting
   conditions were satisfied during the covered fiscal year


$

181,880


$

508,259


(Deduct): Fair value at end of prior fiscal year of awards granted in any prior
   fiscal year that failed to meet the applicable vesting conditions during the
   covered fiscal year


$

306,155


$

816,384


Add: Change in incremental fair value of awards modified during the covered
   fiscal year


$


$


Add: Dividends or other earnings paid on awards in the covered fiscal year
   prior to vesting if not otherwise included in the Summary Compensation
   Table Total for the covered fiscal year


$


$


Compensation “Actually Paid” to PEO


$

4,239,571


$

4,979,430


Non-PEO NEO Average Total Compensation Amount         $ 786,430 $ 827,687 $ 876,231 $ 597,638 $ 565,042  
Non-PEO NEO Average Compensation Actually Paid Amount         $ 2,150,498 1,044,729 1,780,074 832,497 836,226  
Adjustment to Non-PEO NEO Compensation Footnote        


Other Non-PEO NEOs (Average)


2026


Summary Compensation Table Total for Non-PEO NEOs


$

786,430


Adjustments for stock awards and option awards


Deduct: Aggregate value for stock awards and option awards included in
   Summary Compensation Table Total for the covered fiscal year


$

214,565


Add: Fair value at year end of awards granted during the covered fiscal year
   that were outstanding and unvested at the covered fiscal year end


$

645,329


Add: Year-over-year change in fair value at covered fiscal year end of awards
   granted in any prior fiscal year that were outstanding and unvested at the
   covered fiscal year end


$

959,048


Add: Vesting date fair value of awards granted and vested during the covered
   fiscal year


$


Add: Change as of the vesting date (from the end of the prior fiscal year) in
   fair value of awards granted in any prior fiscal year for which vesting
   conditions were satisfied during the covered fiscal year


$

174,949


Deduct: Fair value at end of prior fiscal year of awards granted in any prior
   fiscal year that failed to meet the applicable vesting conditions during the
   covered fiscal year


$

200,693


Add: Change in incremental fair value of awards modified during the covered
   fiscal year


$


Add: Dividends or other earnings paid on awards in the covered fiscal year
   prior to vesting if not otherwise included in the Summary Compensation
   Table Total for the covered fiscal year


$


Compensation “Actually Paid” to Non-PEO NEOs


$

2,150,498


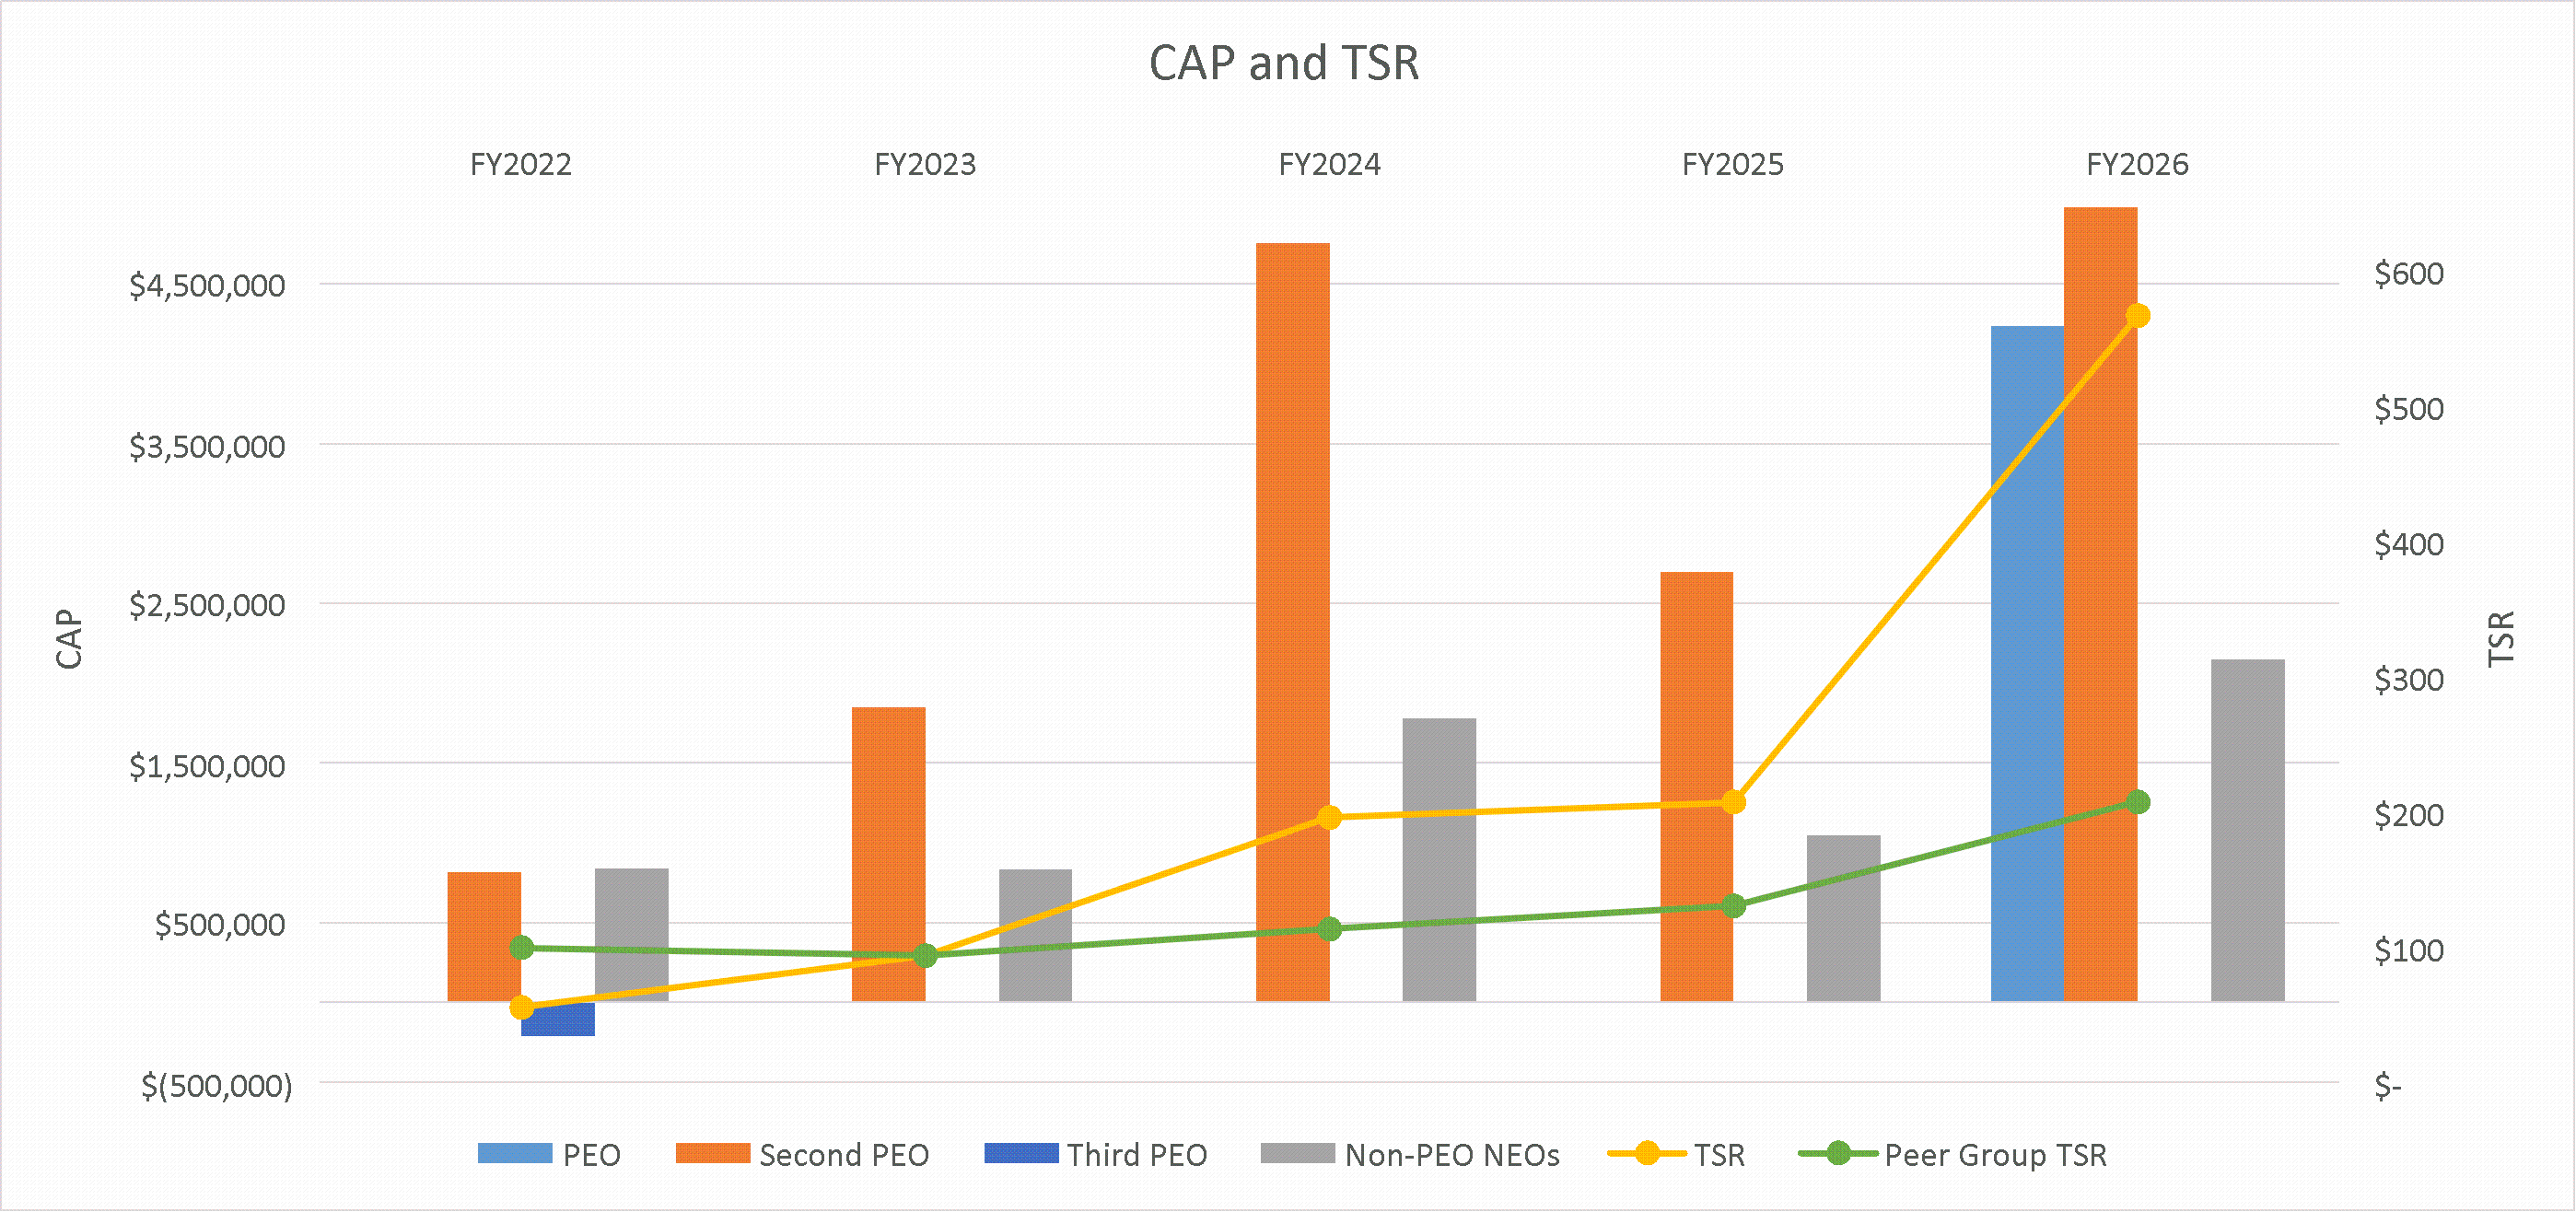
Compensation Actually Paid vs. Total Shareholder Return        

img28131548_38.gif

         
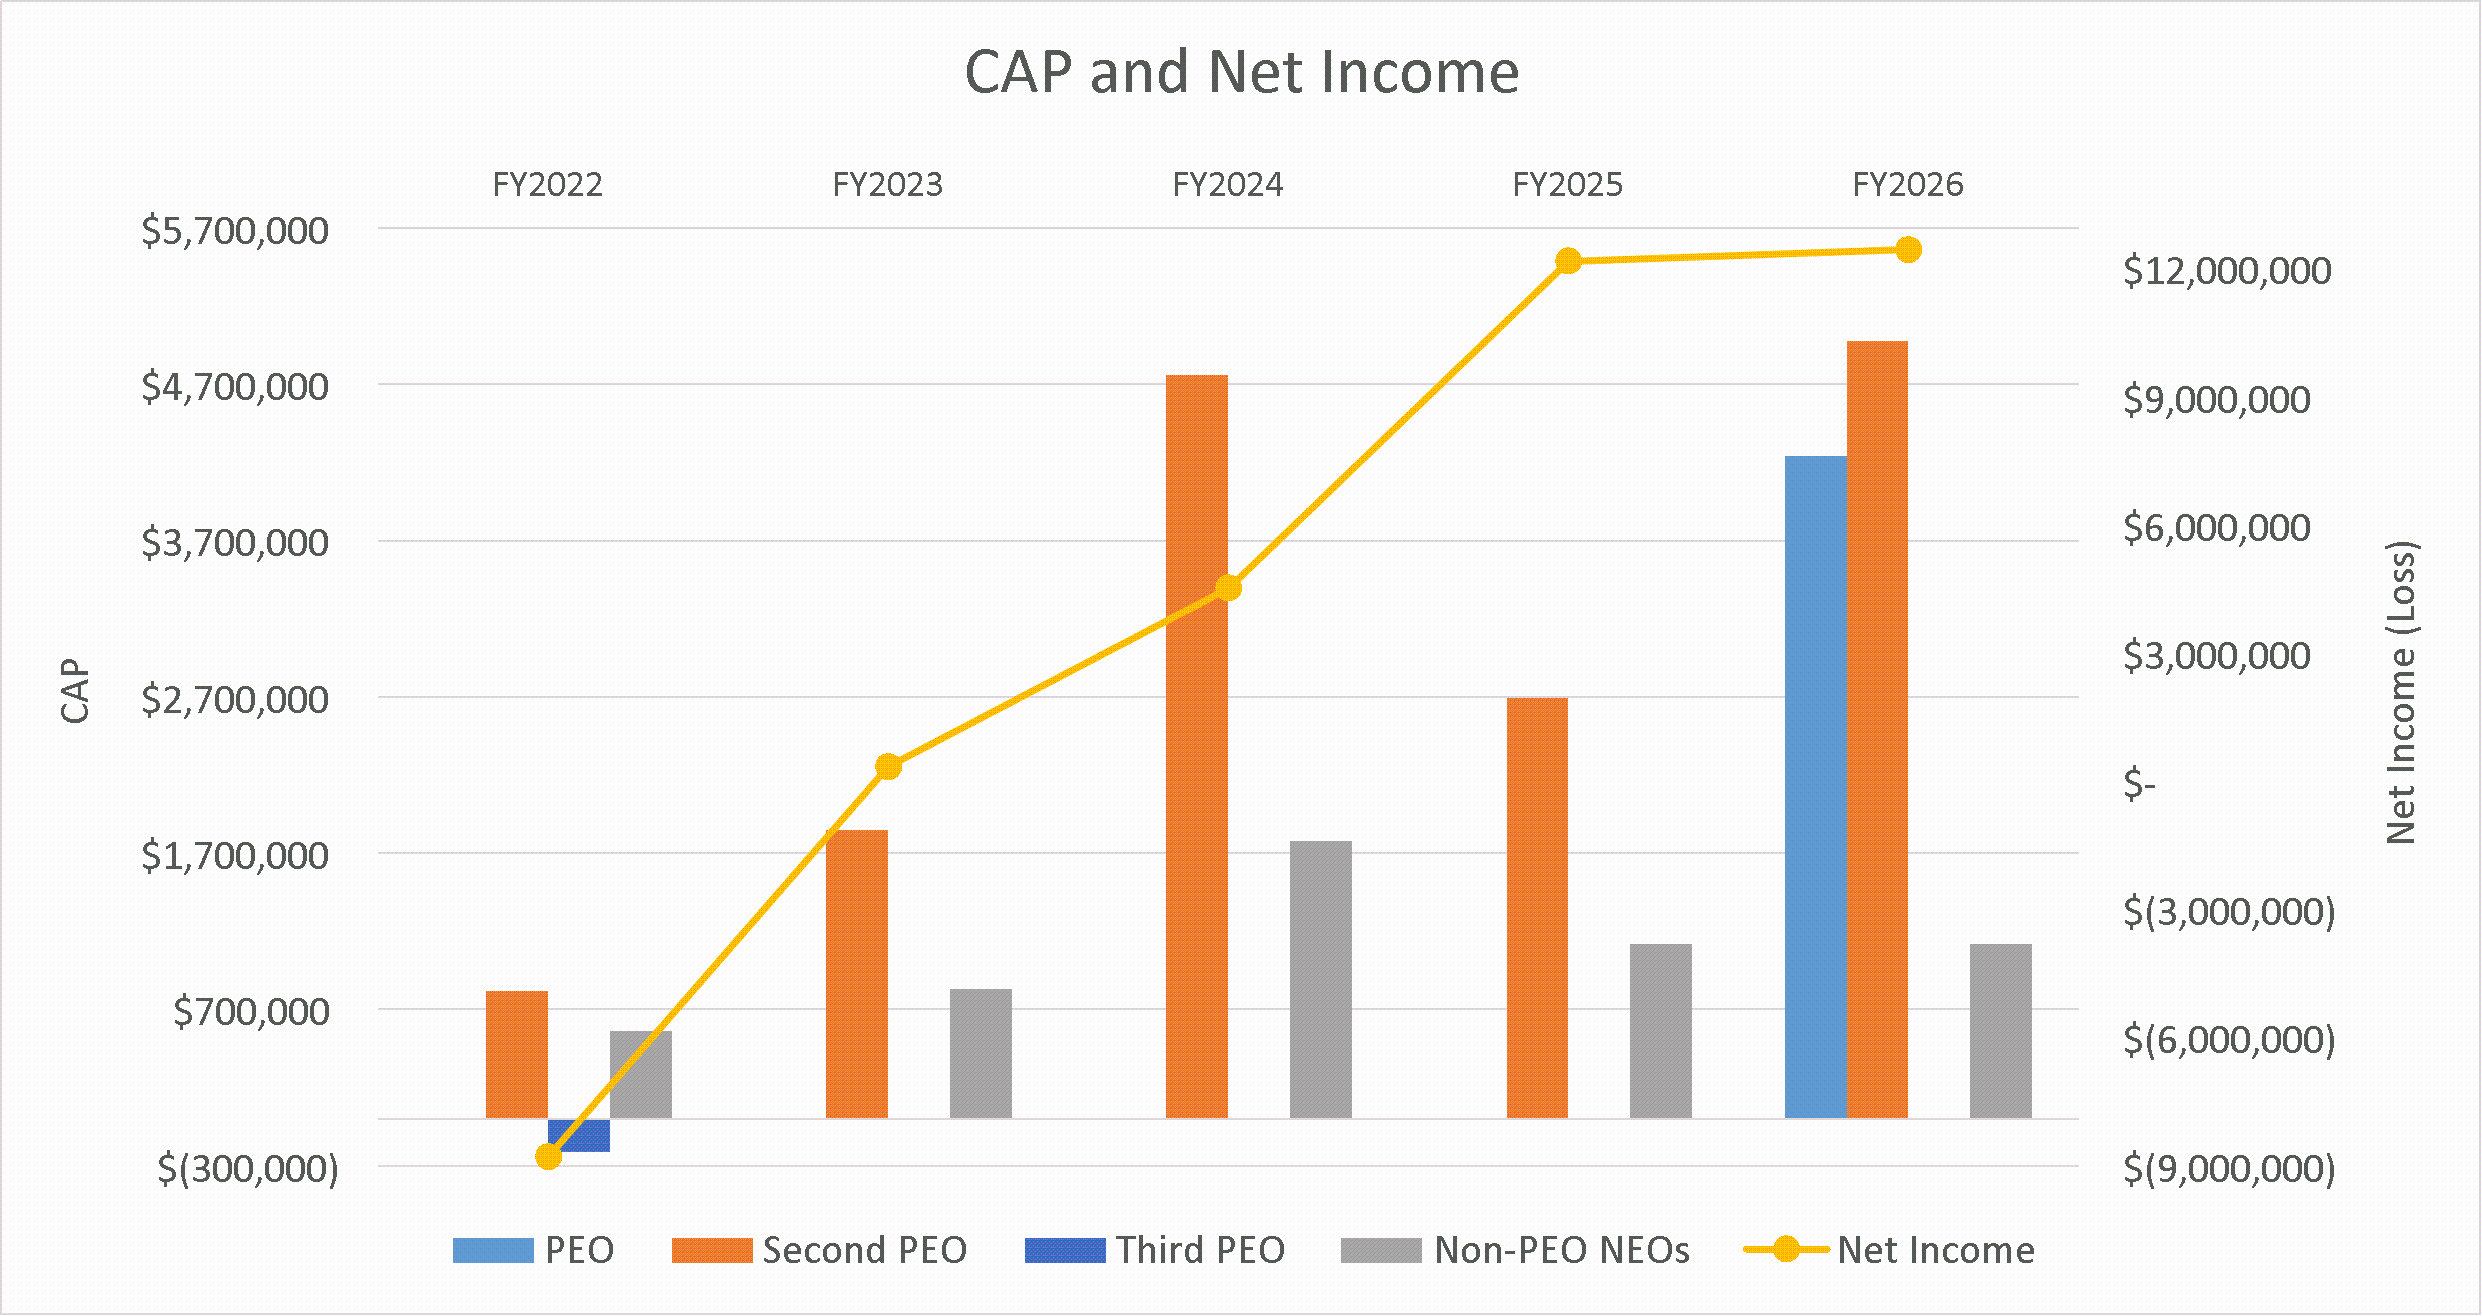
Compensation Actually Paid vs. Net Income        

img28131548_39.gif

         
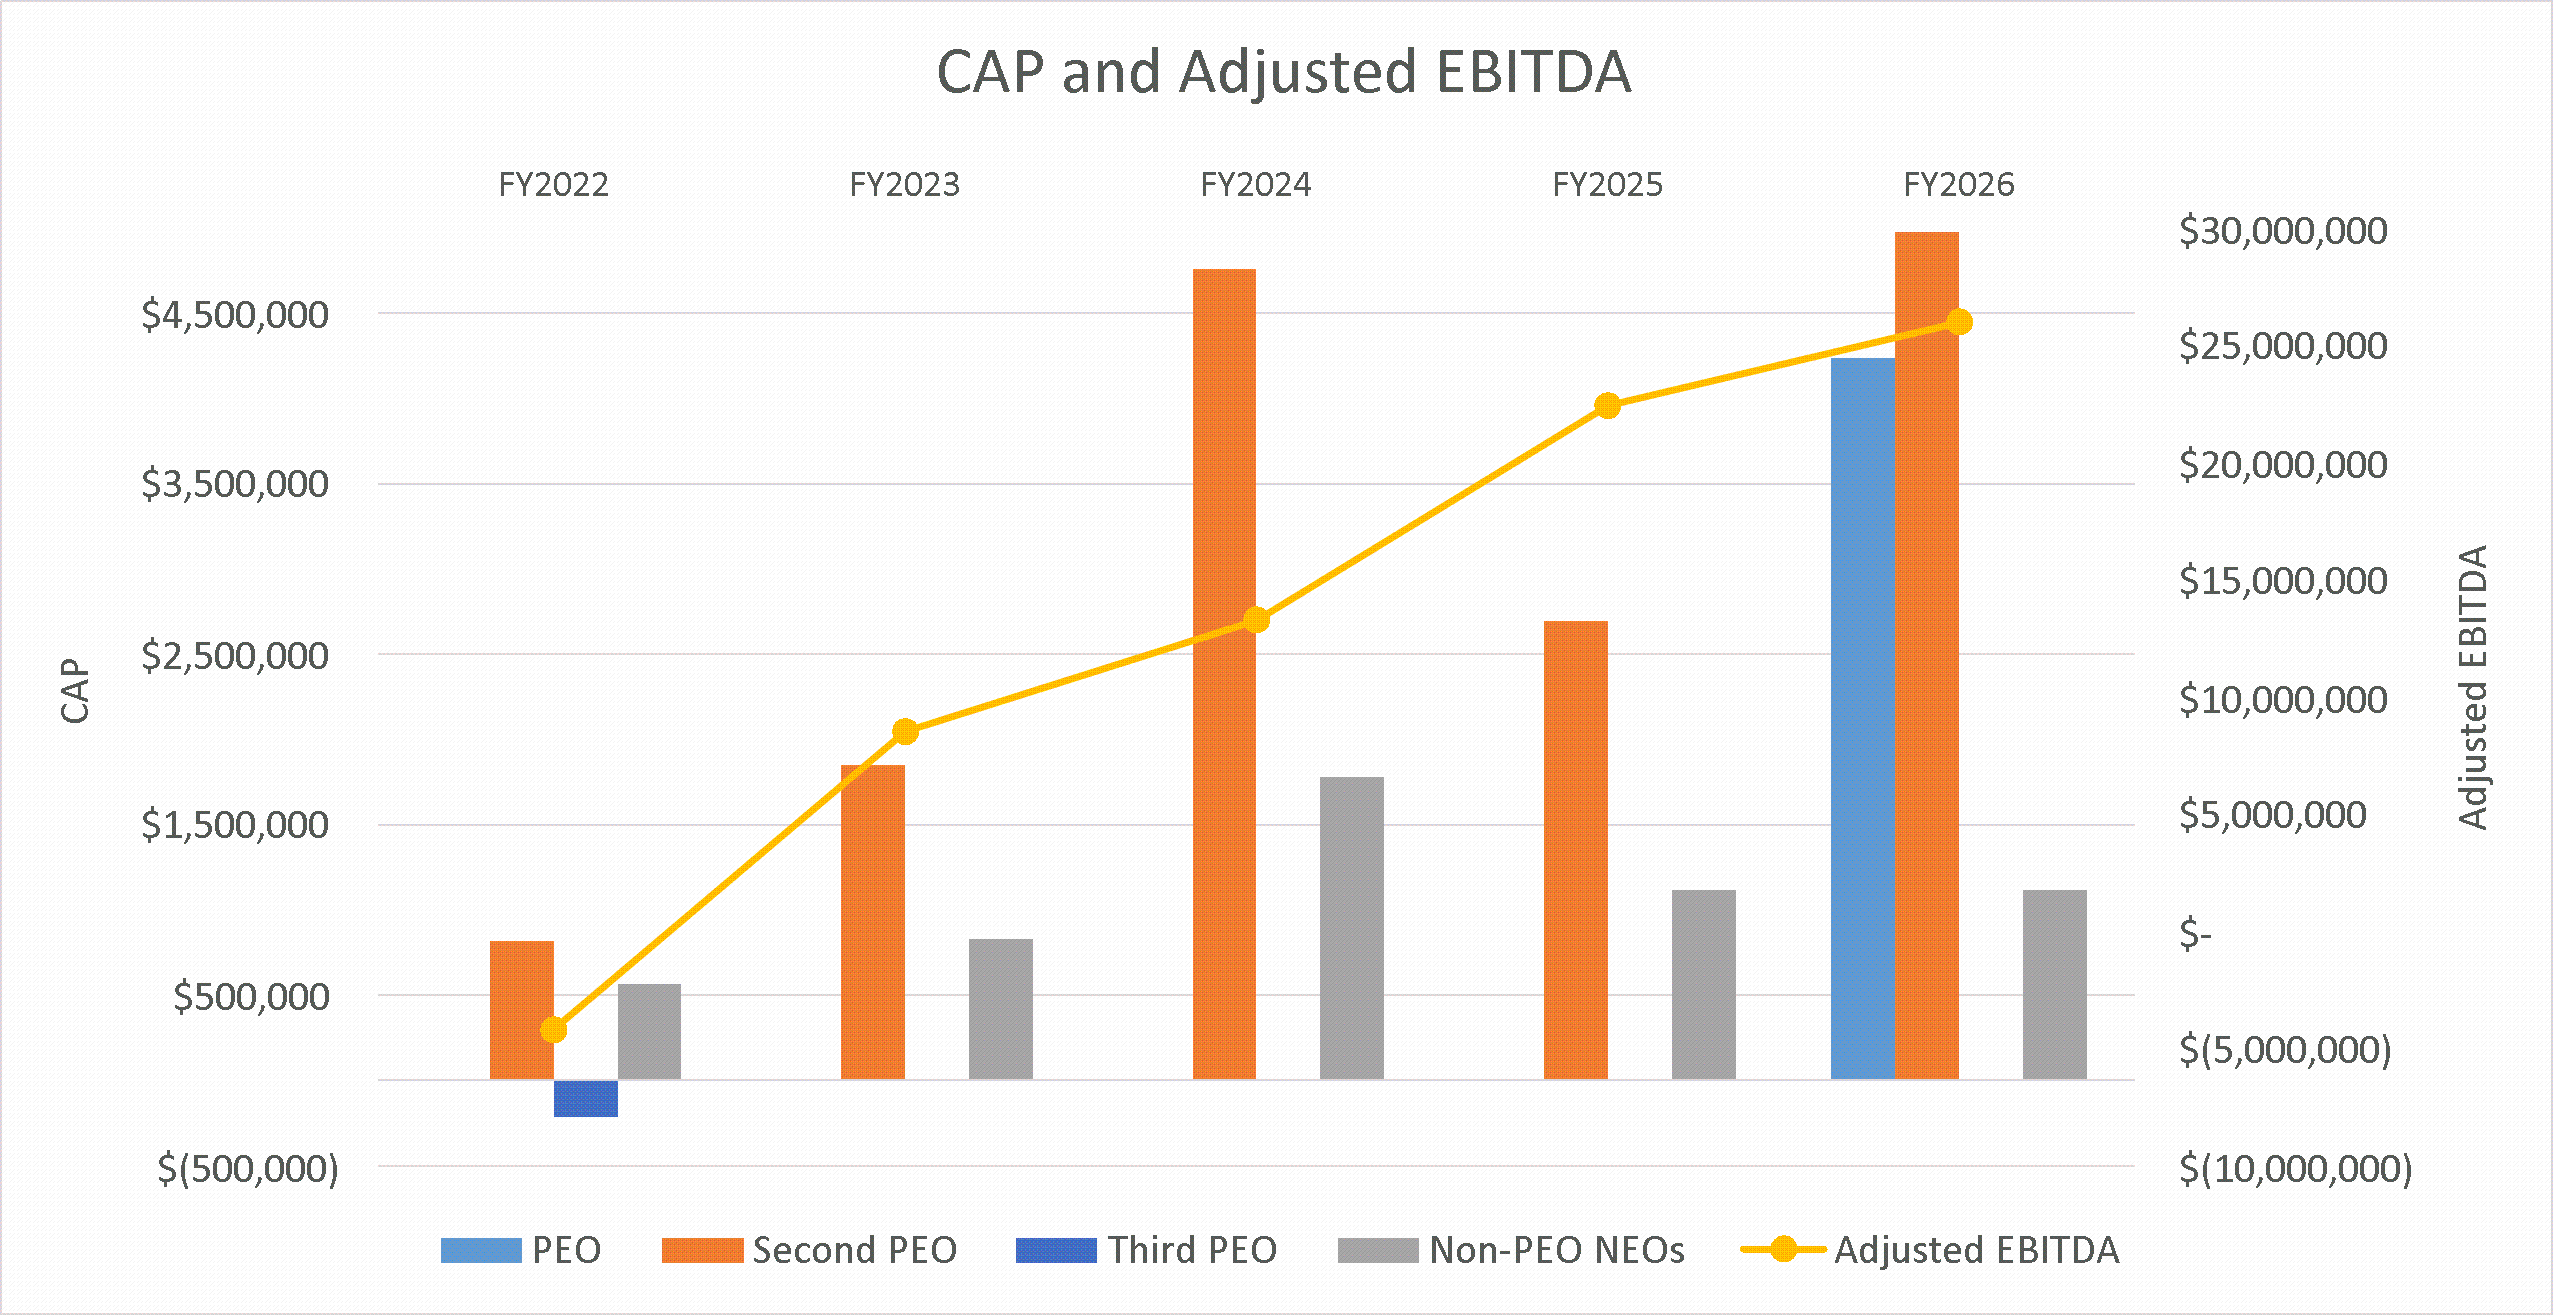
Compensation Actually Paid vs. Company Selected Measure        

img28131548_40.gif

         
Total Shareholder Return Vs Peer Group        

img28131548_38.gif

         
Tabular List, Table        

Tabular List

The following list presents the financial performance measures that the Company considers to have been the most important in linking compensation “actually paid” to our PEOs and Non-PEO NEOs for fiscal year 2026 to Company performance. The measures listed below are not ranked.

Adjusted EBITDA
ROIC
Net sales
Bookings
         
Total Shareholder Return Amount         $ 567.83 207.36 196.28 94.11 55.47  
Peer Group Total Shareholder Return Amount         207.51 130.79 113.56 93.92 99.65  
Net Income (Loss)         $ 12,500,000 $ 12,230,000 $ 4,556,000 $ 367,000 $ (8,773,000)  
Company Selected Measure Amount         25,995 22,429 13,282 8,541 (4,191)  
Measure:: 1                    
Pay vs Performance Disclosure                    
Name         Adjusted EBITDA          
Non-GAAP Measure Description        
(7)
Total Stockholder Return (“TSR”) is cumulative for the measurement periods calculated in accordance with Item 201(e) of Regulation S-K. Cumulative Company TSR is calculated by dividing the difference between the Company’s stock price at the end and the beginning of the measurement period by the Company’s stock price at the beginning of the measurement period. The value assumes $100 invested on March 31, 2021.
         
Measure:: 2                    
Pay vs Performance Disclosure                    
Name         ROIC          
Measure:: 3                    
Pay vs Performance Disclosure                    
Name         Net sales          
Measure:: 4                    
Pay vs Performance Disclosure                    
Name         Bookings          
Matthew J. Malone                    
Pay vs Performance Disclosure                    
PEO Total Compensation Amount       $ 1,809,120   $ 0 $ 0 $ 0 $ 0  
PEO Actually Paid Compensation Amount     $ 0 $ 4,239,571   0 0 0    
PEO Name       Matthew J. Malone            
Daniel J. Thoren                    
Pay vs Performance Disclosure                    
PEO Total Compensation Amount $ 679,842   950,904     1,853,374 2,251,043 1,074,557   $ 679,842
PEO Actually Paid Compensation Amount $ 4,979,430   $ 815,028     2,695,627 4,758,685 1,849,004   $ 4,979,430
PEO Name                   Daniel J. Thoren
James R. Lines                    
Pay vs Performance Disclosure                    
PEO Total Compensation Amount   $ 1,064,678     $ 0 0 0 0    
PEO Actually Paid Compensation Amount   $ (212,834)     (0) $ (0) $ (0) $ (0)    
PEO Name   James R. Lines                
PEO | Matthew J. Malone | Aggregate Change in Present Value of Accumulated Benefit for All Pension Plans Reported in Summary Compensation Table                    
Pay vs Performance Disclosure                    
Adjustment to Compensation, Amount       $ 0            
PEO | Matthew J. Malone | Pension Adjustments Service Cost                    
Pay vs Performance Disclosure                    
Adjustment to Compensation, Amount       0            
PEO | Matthew J. Malone | Pension Adjustments Prior Service Cost                    
Pay vs Performance Disclosure                    
Adjustment to Compensation, Amount       0            
PEO | Matthew J. Malone | Aggregate Grant Date Fair Value of Equity Award Amounts Reported in Summary Compensation Table                    
Pay vs Performance Disclosure                    
Adjustment to Compensation, Amount       (600,004)            
PEO | Matthew J. Malone | Year-end Fair Value of Equity Awards Granted in Covered Year that are Outstanding and Unvested                    
Pay vs Performance Disclosure                    
Adjustment to Compensation, Amount       1,804,585            
PEO | Matthew J. Malone | Year-over-Year Change in Fair Value of Equity Awards Granted in Prior Years That are Outstanding and Unvested                    
Pay vs Performance Disclosure                    
Adjustment to Compensation, Amount       1,350,145            
PEO | Matthew J. Malone | Vesting Date Fair Value of Equity Awards Granted and Vested in Covered Year                    
Pay vs Performance Disclosure                    
Adjustment to Compensation, Amount       0            
PEO | Matthew J. Malone | Change in Fair Value as of Vesting Date of Prior Year Equity Awards Vested in Covered Year                    
Pay vs Performance Disclosure                    
Adjustment to Compensation, Amount       181,880            
PEO | Matthew J. Malone | Prior Year End Fair Value of Equity Awards Granted in Any Prior Year that Fail to Meet Applicable Vesting Conditions During Covered Year                    
Pay vs Performance Disclosure                    
Adjustment to Compensation, Amount       (306,155)            
PEO | Matthew J. Malone | Dividends or Other Earnings Paid on Equity Awards not Otherwise Reflected in Total Compensation for Covered Year                    
Pay vs Performance Disclosure                    
Adjustment to Compensation, Amount       0            
PEO | Matthew J. Malone | Change in Incremental Fair Value of Awards Modified During the Covered Fiscal Year                    
Pay vs Performance Disclosure                    
Adjustment to Compensation, Amount       $ 0            
PEO | Daniel J. Thoren | Aggregate Change in Present Value of Accumulated Benefit for All Pension Plans Reported in Summary Compensation Table                    
Pay vs Performance Disclosure                    
Adjustment to Compensation, Amount                   $ 0
PEO | Daniel J. Thoren | Pension Adjustments Service Cost                    
Pay vs Performance Disclosure                    
Adjustment to Compensation, Amount                   0
PEO | Daniel J. Thoren | Pension Adjustments Prior Service Cost                    
Pay vs Performance Disclosure                    
Adjustment to Compensation, Amount                   0
PEO | Daniel J. Thoren | Aggregate Grant Date Fair Value of Equity Award Amounts Reported in Summary Compensation Table                    
Pay vs Performance Disclosure                    
Adjustment to Compensation, Amount                   (125,008)
PEO | Daniel J. Thoren | Year-end Fair Value of Equity Awards Granted in Covered Year that are Outstanding and Unvested                    
Pay vs Performance Disclosure                    
Adjustment to Compensation, Amount                   375,975
PEO | Daniel J. Thoren | Year-over-Year Change in Fair Value of Equity Awards Granted in Prior Years That are Outstanding and Unvested                    
Pay vs Performance Disclosure                    
Adjustment to Compensation, Amount                   4,356,746
PEO | Daniel J. Thoren | Vesting Date Fair Value of Equity Awards Granted and Vested in Covered Year                    
Pay vs Performance Disclosure                    
Adjustment to Compensation, Amount                   0
PEO | Daniel J. Thoren | Change in Fair Value as of Vesting Date of Prior Year Equity Awards Vested in Covered Year                    
Pay vs Performance Disclosure                    
Adjustment to Compensation, Amount                   508,259
PEO | Daniel J. Thoren | Prior Year End Fair Value of Equity Awards Granted in Any Prior Year that Fail to Meet Applicable Vesting Conditions During Covered Year                    
Pay vs Performance Disclosure                    
Adjustment to Compensation, Amount                   (816,384)
PEO | Daniel J. Thoren | Dividends or Other Earnings Paid on Equity Awards not Otherwise Reflected in Total Compensation for Covered Year                    
Pay vs Performance Disclosure                    
Adjustment to Compensation, Amount                   0
PEO | Daniel J. Thoren | Change in Incremental Fair Value of Awards Modified During the Covered Fiscal Year                    
Pay vs Performance Disclosure                    
Adjustment to Compensation, Amount                   $ 0
Non-PEO NEO | Aggregate Grant Date Fair Value of Equity Award Amounts Reported in Summary Compensation Table                    
Pay vs Performance Disclosure                    
Adjustment to Compensation, Amount         (214,565)          
Non-PEO NEO | Year-end Fair Value of Equity Awards Granted in Covered Year that are Outstanding and Unvested                    
Pay vs Performance Disclosure                    
Adjustment to Compensation, Amount         645,329          
Non-PEO NEO | Year-over-Year Change in Fair Value of Equity Awards Granted in Prior Years That are Outstanding and Unvested                    
Pay vs Performance Disclosure                    
Adjustment to Compensation, Amount         959,048          
Non-PEO NEO | Vesting Date Fair Value of Equity Awards Granted and Vested in Covered Year                    
Pay vs Performance Disclosure                    
Adjustment to Compensation, Amount         0          
Non-PEO NEO | Change in Fair Value as of Vesting Date of Prior Year Equity Awards Vested in Covered Year                    
Pay vs Performance Disclosure                    
Adjustment to Compensation, Amount         174,949          
Non-PEO NEO | Prior Year End Fair Value of Equity Awards Granted in Any Prior Year that Fail to Meet Applicable Vesting Conditions During Covered Year                    
Pay vs Performance Disclosure                    
Adjustment to Compensation, Amount         (200,693)          
Non-PEO NEO | Dividends or Other Earnings Paid on Equity Awards not Otherwise Reflected in Total Compensation for Covered Year                    
Pay vs Performance Disclosure                    
Adjustment to Compensation, Amount         0          
Non-PEO NEO | Change in Incremental Fair Value of Awards Modified During the Covered Fiscal Year                    
Pay vs Performance Disclosure                    
Adjustment to Compensation, Amount         $ 0