Pay vs Performance Disclosure
Mar. 31, 2026
Mar. 31, 2025
Mar. 31, 2024
Mar. 31, 2023
Mar. 31, 2022
| Fiscal Year | Summary Compensation Table Total for CEO 1 ($) | Compensation Actually Paid for CEO 1 ($) | Summary Compensation Table Total for CEO 2 ($) | Compensation Actually Paid for CEO 2 ($) | Summary Compensation Table Total for CEO 3 ($) | Compensation Actually Paid for CEO 3 ($) | ||||||||||||||||||||
| (a) | (b) | (a) | (b) | (a) | (b) | |||||||||||||||||||||
| 2026 | 10,660,029 | 11,144,620 | — | — | — | — | ||||||||||||||||||||
| 2025 | 10,557,008 | 10,999,910 | — | — | — | — | ||||||||||||||||||||
| 2024 | 7,017,746 | 6,901,041 | 1,185,508 | 1,185,508 | 7,792,025 | (2,881,140) | ||||||||||||||||||||
| 2023 | — | — | — | — | 8,553,084 | 6,564,384 | ||||||||||||||||||||
| 2022 | — | — | — | — | 10,497,190 | 4,327,581 | ||||||||||||||||||||
| Average Summary Compensation Table Total for Non-CEO NEOs ($) | Average Compensation Actually Paid for Non-CEO NEOs ($) | Value of Initial Fixed $100 Investment Based On: | Net Income ($) | Company- Selected Measure: Revenue ($) | |||||||||||||||||||||||||
| Fiscal Year | TSR ($) | Peer Group TSR ($) | |||||||||||||||||||||||||||
| (c) | (d) | (e) | (f) | (g) | (h) | ||||||||||||||||||||||||
| 2026 | 3,594,013 | 1,368,301 | 93 | 221 | 711,187,000 | 4,657,000,000 | |||||||||||||||||||||||
| 2025 | 3,136,700 | 731,081 | 85 | 172 | 631,529,000 | 4,610,000,000 | |||||||||||||||||||||||
| 2024 | 4,531,848 | 6,534,991 | 88 | 164 | 612,143,000 | 4,274,000,000 | |||||||||||||||||||||||
| 2023 | 1,845,399 | 1,119,341 | 57 | 113 | 364,575,000 | 4,718,000,000 | |||||||||||||||||||||||
| 2022 | 2,672,034 | 848,535 | 72 | 120 | 644,513,000 | 5,549,000,000 | |||||||||||||||||||||||
•Fiscal years 2026 and 2025: Johanna 'Hanneke' Faber served as the CEO for the entirety of each fiscal year.
•Fiscal year 2024: Johanna 'Hanneke' Faber (“CEO 1”) served as CEO from December 1, 2023 to March 31, 2024; Guy Gecht (“CEO 2”) served as Interim CEO from June 13, 2023 to December 1, 2023; and Bracken Darrell (“CEO 3”) served as CEO from April 1, 2023 to June 13, 2023.
•Fiscal years 2023 and 2022: Bracken Darrell served as the CEO.
Amounts reported are the average of the total compensation reported in the Summary Compensation Table for the applicable fiscal years for the non-CEO NEOs.•For fiscal year 2026 the non-CEO NEOs were: Matteo Anversa, Prakash Arunkundrum, and Samantha Harnett.
•For fiscal year 2025 the non-CEO NEOs were: Matteo Anversa, Prakash Arunkundrum, Samantha Harnett, Charles Boynton, and Meeta Sunderwala.
•For fiscal year 2024 the non-CEO NEOs were: Prakash Arunkundrum, Samantha Harnett, and Charles Boynton.
•For fiscal year 2023 the non-CEO NEOs were: Prakash Arunkundrum, Samantha Harnett, Charles Boynton, and Nate Olmstead.
•For fiscal year 2022 the non-CEO NEOs were: Prakash Arunkundrum, Samantha Harnett, and Nate Olmstead.
| CEO 1 | ||||||||||||||
Fiscal year 2026 | ||||||||||||||
| Summary Compensation Table - Total Compensation | $ | 10,660,029 | ||||||||||||
| - | Grant Date Fair Value of Stock Awards Granted in Fiscal Year | $ | (6,000,064) | |||||||||||
| + | Fair Value at Fiscal Year End of Outstanding and Unvested Stock Awards Granted in Fiscal Year | $ | 6,137,972 | |||||||||||
| + | Change in Fair Value of Outstanding and Unvested Stock Awards Granted in Prior Fiscal Years | $ | 259,232 | |||||||||||
| + | Fair Value at Vesting of Stock Awards Granted in Fiscal Year That Vested During Fiscal Year | $ | — | |||||||||||
| + | Change in Fair Value as of Vesting Date of Stock Awards Granted in Prior Fiscal Years for Which Applicable Vesting Conditions Were Satisfied During Fiscal Year | $ | 87,451 | |||||||||||
| - | Fair Value as of Prior Fiscal Year End of Stock Awards Granted in Prior Fiscal Years That Failed to Meet Applicable Vesting Conditions During Fiscal Year | $ | — | |||||||||||
| = | Compensation Actually Paid | $ | 11,144,620 | |||||||||||
| Non-CEO NEO Average | ||||||||||||||
Fiscal year 2026 | ||||||||||||||
| Summary Compensation Table - Total Compensation | $ | 3,594,013 | ||||||||||||
| - | Grant Date Fair Value of Stock Awards Granted in Fiscal Year | $ | (2,500,057) | |||||||||||
| + | Fair Value at Fiscal Year End of Outstanding and Unvested Stock Awards Granted in Fiscal Year | $ | 1,705,002 | |||||||||||
| + | Change in Fair Value of Outstanding and Unvested Stock Awards Granted in Prior Fiscal Years | $ | 778,203 | |||||||||||
| + | Fair Value at Vesting of Stock Awards Granted in Fiscal Year That Vested During Fiscal Year | $ | — | |||||||||||
| + | Change in Fair Value as of Vesting Date of Stock Awards Granted in Prior Fiscal Years For Which Applicable Vesting Conditions Were Satisfied During Fiscal Year | $ | 34,982 | |||||||||||
| - | Fair Value as of Prior Fiscal Year End of Stock Awards Granted in Prior Fiscal Years That Failed to Meet Applicable Vesting Conditions During Fiscal Year | $ | (2,243,842) | |||||||||||
| = | Compensation Actually Paid | $ | 1,368,301 | |||||||||||
Equity Award Valuations: Equity values are calculated in accordance with FASB ASC Topic 718.
Tabular List of Financial Performance Measures
Below is a list of financial performance measures that we believe are the most important financial performance measures that link Compensation Actually Paid to our NEOs for fiscal year 2026 to our performance.
•Revenue in constant currency
•Non-GAAP operating income
•Relative TSR in comparison to the Russell 3000
•Cash flow from operations
•Inventory turns
In addition to these financial metrics, the Company’s executive compensation program is impacted by our performance with respect to ESG goal under the annual cash bonus program. Our ESG goal is included as an element of our annual cash bonus program because they collectively represent ESG criteria that are priorities for the Company. Please see the CD&A above for further information regarding these financial performance measures as well as the ESG goals used in our annual cash bonus program.
In the below pay versus performance table, we provide information about compensation of our NEOs for each of the last five fiscal years (the “Covered Years”). Additionally, we provide information about the results for specified financial performance measures during the Covered Years. Although the PVP Rules require us to disclose Compensation Actually Paid, these amounts do not necessarily reflect compensation that our NEOs actually earned or were paid in the Covered Years. Instead, Compensation Actually Paid reflects a calculation computed in accordance with the PVP Rules, including adjusted values relating to the fair value of unvested and vested equity awards during the Covered Years based on either year-end or vesting date stock prices, and various accounting valuation assumptions. Compensation Actually Paid generally fluctuates due to stock price achievement and actual achievement of performance goals.
The PVP Rules require that we:
•Show information about our cumulative TSR, the cumulative TSR of a peer group or index ("Peer Group TSR") (we have chosen to use Standard & Poor’s 500 Information & Technology Index), and our U.S. GAAP net income for the Covered Years; and
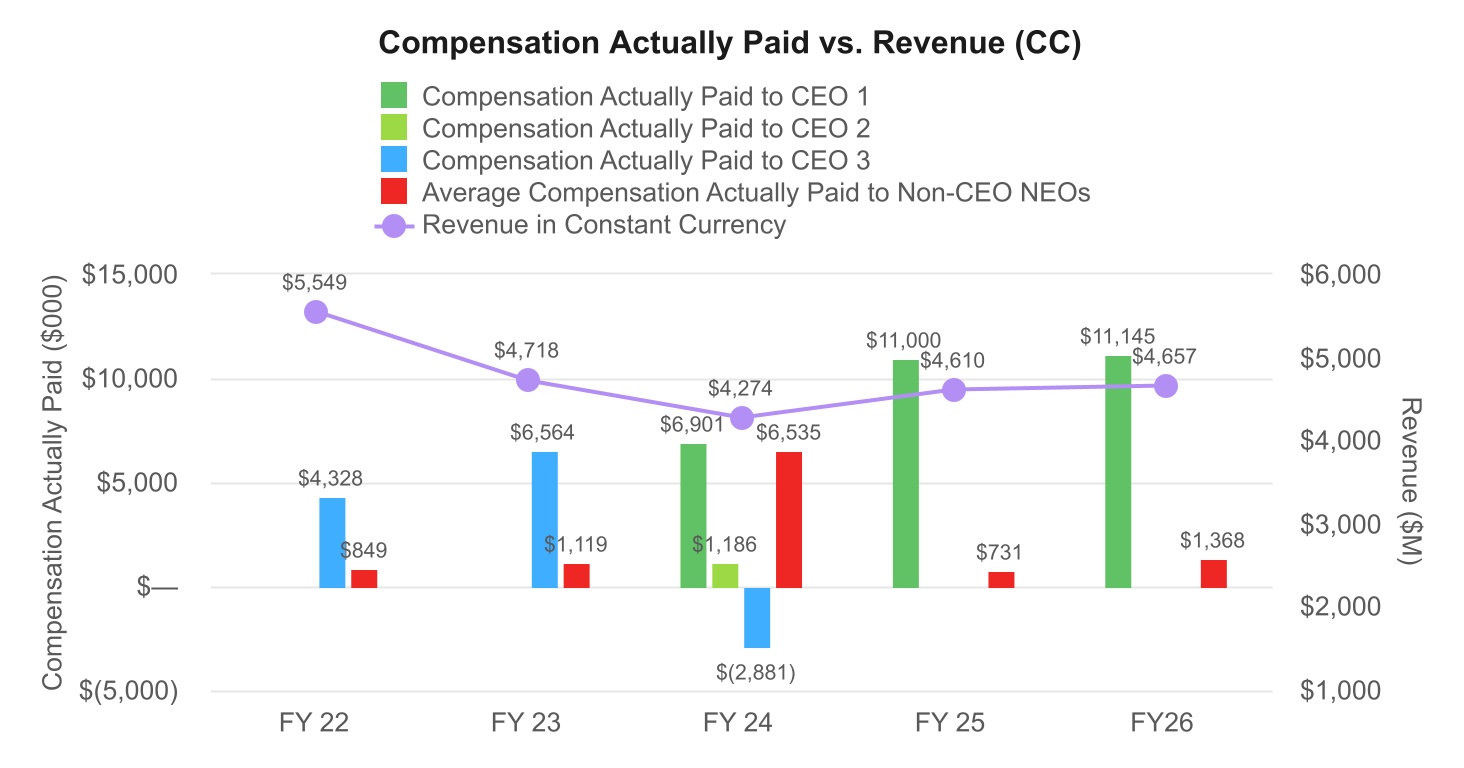
•Designate one “company-selected measure” as the financial performance measure that is most important to link pay to performance in fiscal year 2026 (we have selected revenue in constant currency basis). As discussed in our CD&A, revenue in constant currency continues to be viewed as a core driver of our performance and shareholder value creation and, accordingly, was utilized as a component in both our bonus program and the fiscal year 2026 performance-based equity awards. Please refer to our CD&A above on how we calculate revenue in constant currency.
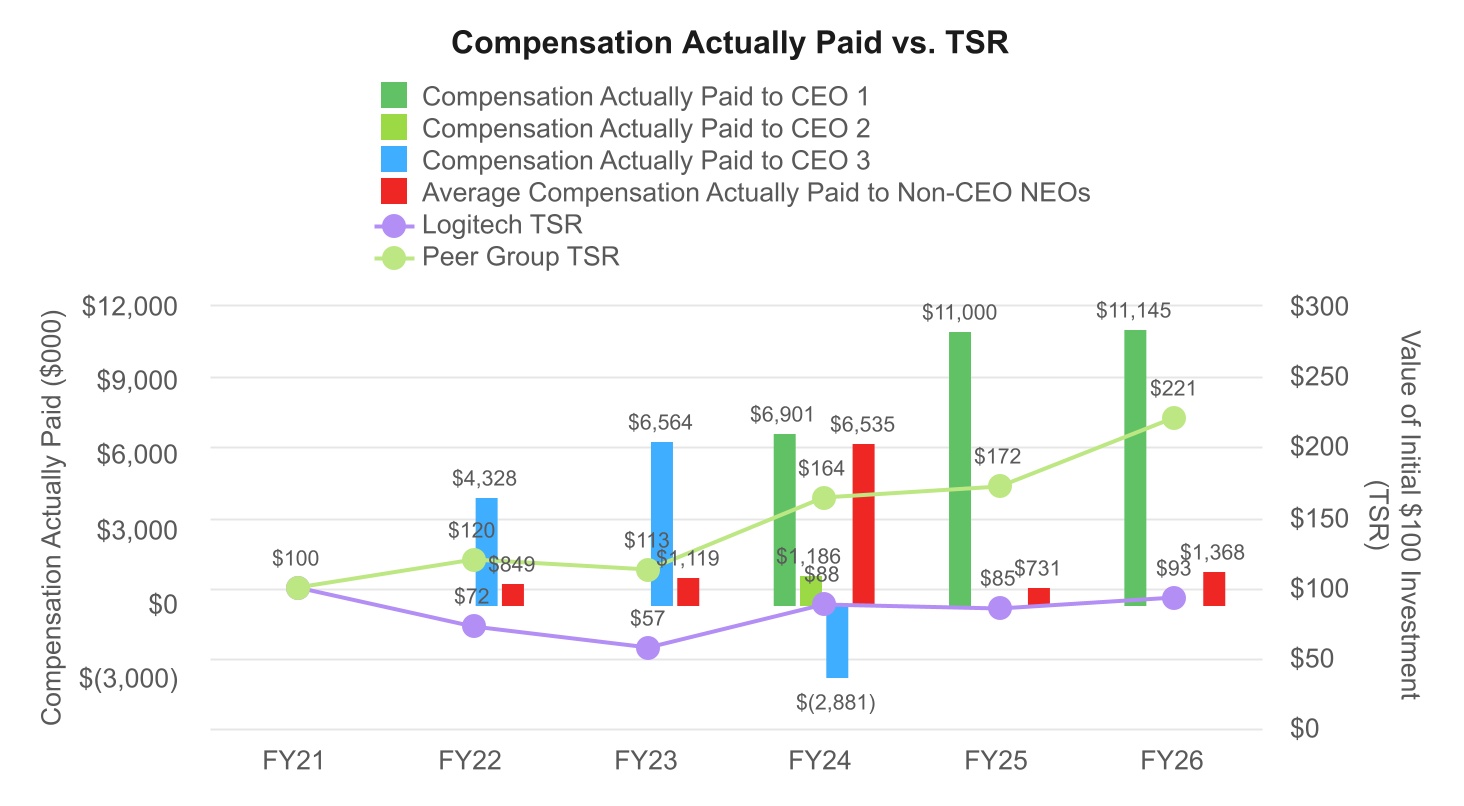
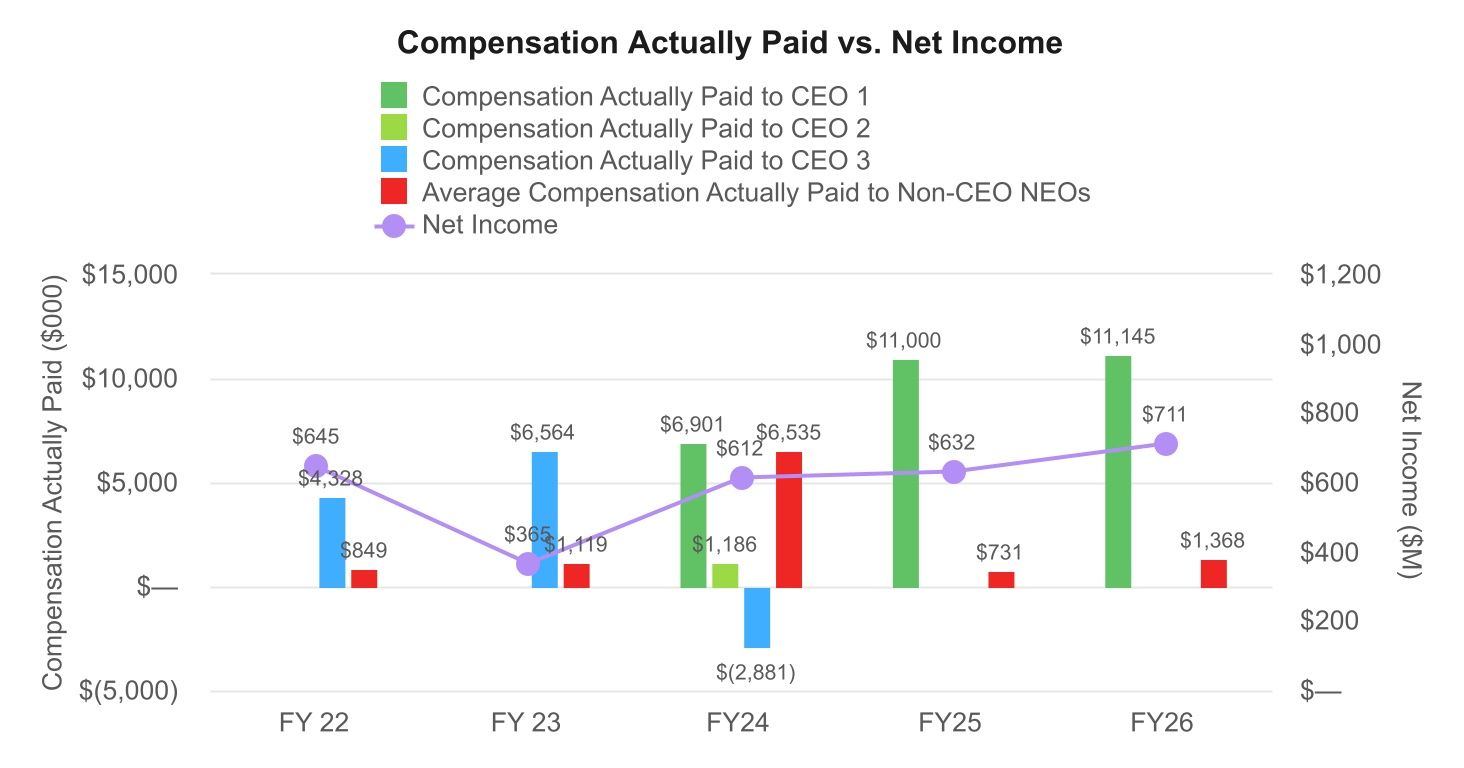
Logitech’s TSR is calculated by assuming that a $100 investment was made in our stock on the day prior to the first fiscal year reported above and that all dividends were reinvested until the last day of each reported Covered Year. The PVP Rules require the disclosure of our U.S. GAAP net income for each year. The dollar amounts reported reflect the amount of net income disclosed in the Company’s audited financial statements for the applicable year.Relationship Between Pay and Performance
In addition to the tabular disclosure above, the PVP Rules require us to describe the relationship between Compensation Actually Paid and the performance measures shown in the pay versus performance table above.
Below are graphs showing the relationship of Compensation Actually Paid to our NEOs in fiscal years 2022 to 2026 to (1) our TSR and the Peer Group TSR, (2) our net income, and (3) our revenue in constant currency.
We believe the Compensation Actually Paid in each of the years reported above are primarily reflective of the annual changes in our stock price performance and the performance of our PSUs. For further information concerning the Company’s pay-for-performance philosophy and how we align executive compensation with our performance, as well as the details on the terms of our short-term incentive program and our performance-vesting equity awards refer to the CD&A above.