
Exhibit 99.1
Diamba Sud Gold Project,
Kédougou Region, Senegal
Technical Report,
Effective Date: June 30, 2026
Prepared for Fortuna Mining Corp.
| Prepared by | Eric Chapman, P. Geo. Senior Vice President of Technical Services - Fortuna Mining Corp.
Paul Weedon, MAIG Senior Vice President of Exploration - Fortuna Mining Corp.
Raul Espinoza, FAusIMM (CP) Director of Technical Services - Fortuna Mining Corp.
Mathieu Veillette, P. Eng. Director, Geotechnical, Tailings and Water - Fortuna Mining Corp.
Ruan Venter, P. Eng. Manager of Process – Lycopodium (Americas) Ltd. |
Suite 820, 1111 Melville Street, Vancouver, BC, V6E 3V6. Tel: (604) 484 4085
 | Diamba Sud Gold Project, Kédougou Region, Senegal Technical Report |
Forward- Looking Statements
This Technical Report contains certain forward-looking information and forward-looking statements within the meaning of applicable securities legislation and may include future-oriented financial information (collectively, “Forward-looking Information”). Forward-looking Information in this Technical Report includes, but is not limited to, statements regarding: the Company’s plans and expectations for the Diamba Sud Project, including the estimation of current and future Mineral Resources and Mineral Reserves at the Project; the Company’s ability to convert Mineral Resources into categories of higher geological confidence or Mineral Reserves; the Government’s plans to transform the airfield in Kédougou to an international airport; the proposed mining methods and production of gold doré, including projected mill throughput, the movement and extraction of mineralized material and waste, projected mining equipment and personnel requirements, processing and recovery methods, proposed infrastructure to support the open pit life-of-mine; the projected initial capital and sustaining capital required; estimated operating costs; the projected economics of the project, including total gold sales, margins, taxes, average annual production, the net present value of the project, the internal rate of return on the project, project payback period, cash costs, all-in sustaining costs (“AISC”), average yearly free cash flow, life of mine unit costs, projected mine life; the project design, including proposed land acquisition and compensation process, the Company’s engagement with artisanal small-scale miners, the tailings storage facility, power sources, water supply and storage, process plant, infrastructure area; and the proposed open pit mine plans; the plans for completing the early works program; the project development timeline to production including certain environmental permits and authorizations required in connection with the operation of the mine, and which are in addition to the Decree for the environmental and social impact assessment (ESIA) which has already been received, the permitting of future phases of the project, obtaining the exploitation permit for the Project and other permitting approvals; the development and construction of a mine and operations at the Project; the establishment of a mine closure plan; the timing of and future prospects for exploration and expansion drill programs; proposed geotechnical work; possible metallurgical testwork; potential studies to optimize and advance the Project.
Often, but not always, these forward-looking statements can be identified by the use of words such as “anticipates”, “believes”, “plans”, “estimates”, “expects”, “forecasts”, “scheduled”, “targets”, “possible”, “strategy”, “potential”, “intends”, “advance”, “goal”, “objective”, “projects”, “budget”, “calculates” or statements that events, “will”, “may”, “shall”, “could”, “should” or “would” occur or be achieved and similar expressions, including negative variations.
The material factors or assumptions regarding Forward-looking Information contained in this Technical Report are discussed in this report, where applicable. Forward-looking Information is subject to known and unknown risks, uncertainties and other factors that may cause actual results and developments to differ materially from those expressed or implied by such Forward-looking Information. Relevant risks and other factors include, without limitation: the estimation and realization of Mineral Resources and Mineral
| June 30, 2026 | Page 2 of 291 |
| | Diamba Sud Gold Project, Kédougou Region, Senegal Technical Report |
Reserves, and any potential upgrades of existing Inferred Mineral Resource and Probable Mineral Resource estimates; gold prices, fluctuations in foreign exchange or interest rates; the estimation of initial and sustaining capital requirements; potential changes to the proposed mine design, mining methods, and infrastructure requirements; the estimation of labor and operating costs and the possibility of material increases in costs and inflation and effects of same on the supply chain which could impact capital and operating costs; extended procurement and delivery times for key mechanical and power generation equipment may lead to delays; the ability to obtain qualified staff; the availability of necessary financing and materials to continue to explore and develop the Company’s properties in the short and long-term, the progress of exploration and development activities, and the amount of expenditures thereon; dependence of operations on construction and maintenance of infrastructure; the Company’s ability to maintain existing or obtain all necessary permits, licenses and regulatory approvals, including an exploitation permit, in a timely manner or at all; changes in laws, regulations and government practices, including environmental, tax, export and import laws and regulations; the evolution of local content laws in Senegal which may affect contracting and recruitment; legal restrictions relating to mining; that the percentage of the taxes, royalties payable to the State and the contributions to the community development fund are consistent with the provisions of Boya’s Mining Convention; the viability, economically and otherwise of constructing a mine at the Diamba Sud Project and producing gold therefrom; economic and political risks associated with operating in foreign countries, including emerging country risks, exchange controls, expropriation, and corruption; political developments in Senegal being inconsistent with Fortuna’s expectations; increased competition in the mining industry; environmental risks including risks related to climate change; risks related to artisanal mining on the Project, including title disputes or claims, and other similar matters; the risk that the State of Senegal may elect to purchase up to an additional 25% contributory interest in the operating entity; uncertainties and hazards associated with gold exploration, development and mining, including but not limited to environmental hazards, accidents, operational stoppages, and other factors as described in the section ‘Risk Factors’ in Fortuna’s current Annual Information Form for the year ended December 31, 2025. Readers are cautioned that the foregoing factors are not exhaustive. Although the Company has attempted to identify important factors that could cause actual actions, events, or results to differ materially from those described in these Forward-looking Statements, there may be other factors that cause actions, events or results to differ from those anticipated, estimated or intended.
Forward-looking Information is designed to help readers understand views as of that time with respect to future events and speaks only as of the date it is made. All the Forward-looking Information in this Technical Report is qualified by these cautionary statements. Except as required by applicable law, Fortuna and the Qualified Persons who authored this Technical Report assume no obligation to update publicly or otherwise revise any Forward-looking Information in this Technical Report, whether because of new information or future events or otherwise.
| June 30, 2026 | Page 3 of 291 |
| | Diamba Sud Gold Project, Kédougou Region, Senegal Technical Report |
Cautionary Note to United States Investors Concerning Estimates of Reserves and Resources
Technical disclosure regarding the Company’s properties included herein has been prepared in accordance with National Instrument 43-101, Standards of Disclosure for Mineral Projects (“NI 43-101") and the Canadian Institute of Mining, Metallurgy, and Petroleum Definition Standards on Mineral Resources and Mineral Reserves. Canadian standards, including NI 43-101, differ from the requirements of the Securities and Exchange Commission, and information included herein may not be comparable to similar information disclosed by U.S. companies.
Cautionary Note Regarding Non-IFRS Measures
This Technical Report includes certain terms or performance measures and ratios commonly used in the mining industry that are not defined under International Financial Reporting Standards (“IFRS”), including: earnings before interest, tax, depreciation and amortization (“EBITDA”), cash costs and AISC per payable ounce of gold sold. Non-IFRS measures do not have any standardized meaning prescribed under IFRS and, therefore, they may not be comparable to similar measures employed by other companies. We believe that, in addition to conventional measures prepared in accordance with IFRS, certain investors use this information to evaluate performance. The data presented is intended to provide additional information and should not be considered in isolation or as a substitute for measures of performance prepared in accordance with IFRS.
| June 30, 2026 | Page 4 of 291 |
| | Diamba Sud Gold Project, Kédougou Region, Senegal Technical Report |
Contents
| 1 | Summary | 20 | ||
| 1.1 | Introduction | 20 | ||
| 1.2 | Property Description, Location and Access | 20 | ||
| 1.3 | Mineral Tenure, Surface Rights and Royalties | 21 | ||
| 1.4 | History | 22 | ||
| 1.5 | Geology and Mineralization | 22 | ||
| 1.6 | Exploration, Drilling and Sampling | 24 | ||
| 1.7 | Data Verification | 27 | ||
| 1.8 | Mineral Processing and Metallurgical Testing | 27 | ||
| 1.9 | Mineral Resources | 28 | ||
| 1.10 | Mineral Reserves | 30 | ||
| 1.11 | Mining Methods | 31 | ||
| 1.12 | Processing and Recovery Methods | 32 | ||
| 1.13 | Project Infrastructure | 33 | ||
| 1.14 | Market Studies and Contracts | 34 | ||
| 1.15 | Environmental Studies and Permitting | 34 | ||
| 1.16 | Capital and Operating Costs | 35 | ||
| 1.17 | Economic Analysis | 36 | ||
| 1.18 | Conclusions | 38 | ||
| 1.19 | Risks and Opportunities | 38 | ||
| 1.19.1 | Exploration | 38 | ||
| 1.19.2 | Mineral Reserve Estimation, Mining and Cost Assumptions | 38 | ||
| 1.19.3 | Metallurgical and Processing | 39 | ||
| 1.19.4 | Geotechnical and hydrogeological | 39 | ||
| 1.19.5 | Environmental, Permitting and Tax Assumptions | 39 | ||
| 1.20 | Recommendations | 40 | ||
| 1.20.1 | Exploration | 40 | ||
| 1.20.2 | Geotechnical | 41 | ||
| 1.20.3 | Water Management | 42 | ||
| 1.20.4 | Metallurgical | 43 | ||
| 1.20.5 | Environmental and Social | 43 | ||
| 1.20.6 | Engineering Studies | 43 | ||
| 2 | Introduction | 45 | ||
| 2.1 | Report Purpose | 45 | ||
| 2.2 | Qualified Persons | 46 | ||
| 2.3 | Scope of Personal Inspection | 46 | ||
| 2.3.1 | Mr. Eric Chapman | 46 | ||
| 2.3.2 | Mr. Paul Weedon | 46 | ||
| 2.3.3 | Mr. Mathieu Veillette | 47 | ||
| June 30, 2026 | Page 5 of 291 |
| | Diamba Sud Gold Project, Kédougou Region, Senegal Technical Report |
| 2.3.4 | Mr. Raul Espinoza | 47 | ||
| 2.3.5 | Mr. Raun Venter | 47 | ||
| 2.4 | Effective Dates | 47 | ||
| 2.5 | Previous Technical Reports | 47 | ||
| 2.6 | Information Sources and References | 47 | ||
| 2.7 | Acronyms | 48 | ||
| 3 | Reliance on Other Experts | 49 | ||
| 4 | Property Description and Location | 50 | ||
| 4.1 | Ownership | 50 | ||
| 4.2 | Mineral Tenure and Surface Rights | 50 | ||
| 4.2.1 | History of the Mining Code | 50 | ||
| 4.2.2 | Permits | 51 | ||
| 4.2.3 | Surface Rights | 54 | ||
| 4.3 | Royalties | 54 | ||
| 4.4 | Permitting | 55 | ||
| 4.5 | Social and Environmental Considerations | 55 | ||
| 4.6 | Comment on Section 4 | 55 | ||
| 5 | Accessibility, Climate, Local Resources, Infrastructure and Physiography | 56 | ||
| 5.1 | Accessibility | 56 | ||
| 5.2 | Climate | 56 | ||
| 5.3 | Topography, Elevation and Vegetation | 56 | ||
| 5.4 | Local Resources and Infrastructure | 57 | ||
| 5.4.1 | Sources of Power and Water | 57 | ||
| 5.4.2 | Consumables | 57 | ||
| 5.4.3 | Labor | 57 | ||
| 5.4.4 | Infrastructure | 57 | ||
| 5.5 | Comment on Section 5 | 58 | ||
| 6 | History | 59 | ||
| 6.1 | Previous Owners and Results | 59 | ||
| 6.1.1 | Anmercosa, 1993–1996 | 59 | ||
| 6.1.2 | Ashanti Goldfields, 1997–1998 | 59 | ||
| 6.1.3 | Iamgold, 1999–2014 | 59 | ||
| 6.1.4 | Boya Gold Pty Ltd 2015–2016 | 59 | ||
| 6.1.5 | Chesser Resources Ltd. 2017–2023 | 60 | ||
| 6.2 | Geophysics | 60 | ||
| 6.3 | Other Work | 61 | ||
| 6.4 | Production History | 61 | ||
| 7 | Geological Setting and Mineralization | 62 | ||
| June 30, 2026 | Page 6 of 291 |
| | Diamba Sud Gold Project, Kédougou Region, Senegal Technical Report |
| 7.1 | Regional Geology | 62 | ||
| 7.2 | Local Geology | 65 | ||
| 7.2.1 | Lithologies | 65 | ||
| 7.2.2 | Tectonic Setting | 66 | ||
| 7.2.3 | Alteration | 67 | ||
| 7.2.4 | Mineralization | 67 | ||
| 7.3 | Deposit Geology | 68 | ||
| 7.3.1 | Area A | 70 | ||
| 7.3.2 | Area D | 71 | ||
| 7.3.3 | Karakara | 72 | ||
| 7.3.4 | Kassassoko | 72 | ||
| 7.3.5 | Western Splay | 73 | ||
| 7.3.6 | Moungoundi | 74 | ||
| 7.3.7 | Southern Arc | 75 | ||
| 7.4 | Comment on Section 7 | 76 | ||
| 8 | Deposit Types | 77 | ||
| 8.1 | Mineral Deposit Type | 77 | ||
| 8.2 | Comment on Section 8 | 77 | ||
| 9 | Exploration | 78 | ||
| 9.1 | Historical Exploration Activities | 78 | ||
| 9.2 | Exploration Activities Conducted by Fortuna | 78 | ||
| 9.3 | Exploration Potential | 79 | ||
| 9.3.1 | Bougouda | 79 | ||
| 9.3.2 | Gamba Gamba North | 79 | ||
| 9.3.3 | Other Prospects | 79 | ||
| 9.4 | Comment on Section 9 | 79 | ||
| 10 | Drilling | 81 | ||
| 10.1 | Drilling Conducted by Chesser | 81 | ||
| 10.1.1 | Auger Drilling | 81 | ||
| 10.1.2 | RC and Core Drilling | 82 | ||
| 10.2 | Drilling Conducted by Fortuna | 84 | ||
| 10.3 | Drilling Used in the Estimation of Mineral Resources | 85 | ||
| 10.4 | Drilling Since the Mineral Resource Database Cut-off Date | 86 | ||
| 10.4.1 | Grade Control Drilling | 92 | ||
| 10.5 | Extent of Drilling | 92 | ||
| 10.6 | Drilling Techniques and Procedures | 93 | ||
| 10.6.1 | Reverse Circulation Drilling | 93 | ||
| 10.6.2 | Core Drilling | 93 | ||
| 10.6.3 | Geological and Geotechnical Logging Procedures | 94 | ||
| 10.6.4 | Photography | 94 | ||
| June 30, 2026 | Page 7 of 291 |
| | Diamba Sud Gold Project, Kédougou Region, Senegal Technical Report |
| 10.6.5 | Core Orientation | 94 | ||
| 10.6.6 | Drill Core Recovery | 94 | ||
| 10.6.7 | Collar Surveying | 94 | ||
| 10.6.8 | Downhole Surveying | 95 | ||
| 10.7 | Sample Length Versus True Thickness | 95 | ||
| 10.8 | Example of Drill Intercepts | 95 | ||
| 10.9 | Comment on Section 10 | 95 | ||
| 11 | Sample Preparation, Analyses, and Security | 96 | ||
| 11.1 | Sample Preparation Prior to Dispatch of Samples | 96 | ||
| 11.2 | Sample Collection | 96 | ||
| 11.3 | Sample Dispatch | 96 | ||
| 11.4 | Sample Preparation | 96 | ||
| 11.5 | Analytical Methods | 97 | ||
| 11.6 | Laboratory Accreditation | 97 | ||
| 11.7 | Sample Security and Chain of Custody | 97 | ||
| 11.8 | Bulk Density Determination | 97 | ||
| 11.9 | Quality Assurance and Quality Control | 97 | ||
| 11.9.1 | Database | 98 | ||
| 11.9.2 | Certified Reference Materials | 98 | ||
| 11.9.3 | Field Duplicates | 98 | ||
| 11.9.4 | Blanks | 98 | ||
| 11.9.5 | Twin holes | 99 | ||
| 11.10 | Comment on Section 11 | 99 | ||
| 12 | Data Verification | 100 | ||
| 12.1 | Introduction | 100 | ||
| 12.1.1 | Chesser | 100 | ||
| 12.1.2 | Fortuna | 100 | ||
| 12.2 | Database | 100 | ||
| 12.3 | Collar and Downhole Surveys | 101 | ||
| 12.4 | Geologic Logs and Assays | 101 | ||
| 12.5 | Sample Type Comparison | 101 | ||
| 12.6 | Mineral Resource Estimation | 102 | ||
| 12.7 | Data Verification by Qualified Persons | 102 | ||
| 12.7.1 | Mr. Eric Chapman | 102 | ||
| 12.7.2 | Mr. Paul Weeden | 103 | ||
| 12.7.3 | Mr. Raul Espinoza | 103 | ||
| 12.7.4 | Mr. Mathieu Veillette | 104 | ||
| 12.7.5 | Mr. Ruan Venter | 104 | ||
| 12.8 | Comment on Section 12 | 104 | ||
| 13 | Mineral Processing and Metallurgical Testing | 105 | ||
| June 30, 2026 | Page 8 of 291 |
| | Diamba Sud Gold Project, Kédougou Region, Senegal Technical Report |
| 13.1 | Introduction | 105 | ||
| 13.2 | Testwork – Area A, Area D and Karakara | 105 | ||
| 13.2.1 | Introduction | 105 | ||
| 13.2.2 | Sample Preparation | 105 | ||
| 13.2.3 | Comminution Testwork | 112 | ||
| 13.2.4 | Leach and Cyanidation Testwork | 114 | ||
| 13.2.5 | Rheology | 126 | ||
| 13.2.6 | Diagnostic Leach | 127 | ||
| 13.3 | Testwork – Kassassoko, Western Splay and Bougouda | 128 | ||
| 13.3.1 | Introduction | 128 | ||
| 13.3.2 | Comminution Testwork | 128 | ||
| 13.3.3 | Gold Leaching Testwork | 129 | ||
| 13.3.4 | Gravity Leach Testing | 129 | ||
| 13.4 | Testwork – Southern Arc and Moungoundi | 130 | ||
| 13.4.1 | Introduction | 130 | ||
| 13.4.2 | Sample Selection | 130 | ||
| 13.4.3 | Comminution Testwork | 132 | ||
| 13.4.4 | Head Assay and BLEG Analysis | 133 | ||
| 13.4.5 | Gravity-Leach and Cyanidation Testwork | 134 | ||
| 13.4.6 | Carbon Testwork | 135 | ||
| 13.4.7 | Rheology | 136 | ||
| 13.5 | Metallurgical Variability | 138 | ||
| 13.6 | Metallurgical Recovery Estimates | 139 | ||
| 13.7 | Deleterious Elements | 141 | ||
| 13.8 | Comments on Section 13 | 141 | ||
| 14 | Mineral Resource Estimates | 144 | ||
| 14.1 | Introduction | 144 | ||
| 14.2 | Supplied Data, Data Transformations and Data Preparation | 144 | ||
| 14.2.1 | Data Transformations | 144 | ||
| 14.2.2 | Software | 144 | ||
| 14.2.3 | Data Preparation | 144 | ||
| 14.3 | Geological Interpretation and Domaining | 144 | ||
| 14.3.1 | Probabilistic Grade Shells | 144 | ||
| 14.3.2 | Statistical Analysis of Composites | 146 | ||
| 14.4 | Exploratory Data Analysis | 146 | ||
| 14.4.1 | Sub-Domaining | 149 | ||
| 14.4.2 | Grade Capping | 149 | ||
| 14.5 | Variogram Analysis | 152 | ||
| 14.5.1 | Continuity Analysis | 152 | ||
| 14.5.2 | Variogram Modeling | 153 | ||
| 14.6 | Modeling and Estimation | 155 | ||
| June 30, 2026 | Page 9 of 291 |
| | Diamba Sud Gold Project, Kédougou Region, Senegal Technical Report |
| 14.6.1 | Block Size Selection | 155 | ||
| 14.6.2 | Block Model Parameters | 155 | ||
| 14.6.3 | Sample Search Parameters | 155 | ||
| 14.6.4 | Grade Interpolation | 156 | ||
| 14.6.5 | Bulk Density | 156 | ||
| 14.7 | Model Validation | 157 | ||
| 14.7.1 | Visual Validation | 158 | ||
| 14.7.2 | Global Estimation Validation | 158 | ||
| 14.7.3 | Local Estimation Validation | 159 | ||
| 14.7.4 | Mineral Resource Depletion | 160 | ||
| 14.8 | Mineral Resource Classification | 160 | ||
| 14.8.1 | Geological Continuity | 160 | ||
| 14.8.2 | Data Density and Orientation | 160 | ||
| 14.8.3 | Data Accuracy and Precision | 161 | ||
| 14.8.4 | Spatial Grade Continuity | 161 | ||
| 14.8.5 | Classification | 161 | ||
| 14.9 | Mineral Resource Reporting | 162 | ||
| 14.9.1 | Reasonable Prospects for Eventual Economic Extraction | 162 | ||
| 14.9.2 | Mineral Resource Statement | 163 | ||
| 14.9.3 | Comparison to Previous Estimate | 165 | ||
| 14.10 | Comment on Section 14 | 165 | ||
| 15 | Mineral Reserve Estimates | 166 | ||
| 15.1 | Introduction | 166 | ||
| 15.2 | Mineral Reserves Estimate | 166 | ||
| 15.3 | Cut-off Grade Determination | 168 | ||
| 15.4 | Comments on Section 15 | 170 | ||
| 16 | Mining Methods | 171 | ||
| 16.1 | Overview | 171 | ||
| 16.2 | Hydrogeology | 171 | ||
| 16.3 | Mine Geotechnical | 173 | ||
| 16.4 | Pit Optimizations | 174 | ||
| 16.4.1 | Block Model | 174 | ||
| 16.4.2 | Optimization Parameters | 174 | ||
| 16.4.3 | Optimization Outcomes | 178 | ||
| 16.5 | Mine Design | 178 | ||
| 16.5.1 | Pit Design | 178 | ||
| 16.5.2 | Pit Design Parameters | 178 | ||
| 16.5.3 | Waste Rock Storage Facilities | 185 | ||
| 16.5.4 | ROM Pad Storage Facilities | 185 | ||
| 16.6 | Mining Operations | 186 | ||
| June 30, 2026 | Page 10 of 291 |
| | Diamba Sud Gold Project, Kédougou Region, Senegal Technical Report |
| 16.6.1 | Drill and Blast, Excavate, Load and Haul | 186 | ||
| 16.6.2 | Ancillary and Support Fleet | 186 | ||
| 16.6.3 | Other Mining Infrastructure | 187 | ||
| 16.6.4 | Equipment Requirements | 187 | ||
| 16.7 | Mining and Production Schedule | 187 | ||
| 16.8 | Comments on Section 16 | 189 | ||
| 17 | Recovery Methods | 191 | ||
| 17.1 | Processing Plant Design | 191 | ||
| 17.2 | Processing Design Philosophy | 192 | ||
| 17.3 | Process Plant Feed | 193 | ||
| 17.4 | Comminution Circuit Design Basis | 194 | ||
| 17.4.1 | Design Criteria | 194 | ||
| 17.4.2 | Comminution Circuit Selection | 194 | ||
| 17.5 | Process Plant Description | 194 | ||
| 17.5.1 | Primary Crushing | 194 | ||
| 17.5.2 | Grinding and Classification Circuit | 196 | ||
| 17.5.3 | Pebble Crushing | 196 | ||
| 17.5.4 | Gravity Recovery | 197 | ||
| 17.5.5 | Trash Screening and Pre-Leach Thickening | 197 | ||
| 17.5.6 | Carbon in Leach Circuit | 198 | ||
| 17.5.7 | Elution, Electrowinning and Smelting | 198 | ||
| 17.5.8 | Tailings Disposal | 199 | ||
| 17.6 | Reagents | 199 | ||
| 17.6.1 | Lime | 199 | ||
| 17.6.2 | Cyanide | 199 | ||
| 17.6.3 | Caustic Soda/Sodium Hydroxide | 200 | ||
| 17.6.4 | Hydrochloric Acid | 200 | ||
| 17.6.5 | Activated Carbon | 200 | ||
| 17.6.6 | Flocculant | 201 | ||
| 17.6.7 | Balls and Liners | 201 | ||
| 17.7 | Control Systems | 201 | ||
| 17.8 | Electrical Reticulation | 202 | ||
| 17.9 | Water Supply | 203 | ||
| 17.10 | Comments on Section 17 | 203 | ||
| 18 | Project Infrastructure | 205 | ||
| 18.1 | Overview | 205 | ||
| 18.2 | Roads | 207 | ||
| 18.2.1 | Site Access Roads and Bypass Road | 207 | ||
| 18.2.2 | Process Plant Onsite Roads | 207 | ||
| 18.2.3 | Site Haul Roads | 208 | ||
| June 30, 2026 | Page 11 of 291 |
| | Diamba Sud Gold Project, Kédougou Region, Senegal Technical Report |
| 18.3 | Tailing Storage Facilities | 208 | ||
| 18.4 | Sediment Management | 210 | ||
| 18.5 | Water Storage Dam and Water Harvesting Dam | 210 | ||
| 18.6 | Surface Water Management | 211 | ||
| 18.7 | Aerodrome | 212 | ||
| 18.8 | Mining Contractor’s Infrastructure | 212 | ||
| 18.9 | Administration and Plant Buildings | 212 | ||
| 18.10 | Accommodation Camp | 214 | ||
| 18.11 | Waste Rock Storage Facilities | 215 | ||
| 18.12 | Stockpiles | 215 | ||
| 18.13 | Power Generation | 215 | ||
| 18.14 | Fuel Supply | 217 | ||
| 18.15 | Communications | 217 | ||
| 18.16 | Plant Security | 217 | ||
| 18.17 | Water Supply | 218 | ||
| 18.18 | Sewage Treatment | 219 | ||
| 18.19 | Comments on Section 18 | 220 | ||
| 19 | Market Studies and Contracts | 221 | ||
| 19.1 | Market Studies | 221 | ||
| 19.2 | Commodity Pricing | 221 | ||
| 19.3 | Contracts | 221 | ||
| 19.4 | Comments on Section 19 | 221 | ||
| 20 | Environmental Studies, Permitting and Social or Community Impact | 223 | ||
| 20.1 | Baseline Studies | 223 | ||
| 20.1.1 | Socio-Economic Environment | 224 | ||
| 20.1.2 | Physical Environment | 227 | ||
| 20.1.3 | Biological Environment | 231 | ||
| 20.2 | Environmental Issues – Climate Change | 234 | ||
| 20.2.1 | Physical Risks | 235 | ||
| 20.3 | Permitting | 236 | ||
| 20.4 | Tailings Storage Facilities | 237 | ||
| 20.5 | Water Management | 237 | ||
| 20.6 | Environmental Management and Monitoring | 237 | ||
| 20.6.1 | Environmental and Social Management System | 238 | ||
| 20.7 | Community Relations | 239 | ||
| 20.7.1 | Stakeholder Engagement | 240 | ||
| 20.7.2 | Social Investment | 241 | ||
| 20.7.3 | Land Acquisition | 241 | ||
| 20.7.4 | Artisanal Small-Scale Mining | 242 | ||
| 20.7.5 | Community Development Fund | 243 | ||
| June 30, 2026 | Page 12 of 291 |
| | Diamba Sud Gold Project, Kédougou Region, Senegal Technical Report |
| 20.8 | Mine Closure Plan | 243 | ||
| 20.8.1 | National Framework | 243 | ||
| 20.8.2 | Conceptual Closure Costs | 244 | ||
| 20.9 | Comments on Section 20 | 244 | ||
| 21 | Capital and Operating Costs | 246 | ||
| 21.1 | Capital Cost Estimates | 246 | ||
| 21.1.1 | Basis of Estimate Assumptions and Clarifications | 246 | ||
| 21.1.2 | Process Plant Capital Cost Estimate | 247 | ||
| 21.1.3 | Owners Capital Cost Estimate | 248 | ||
| 21.1.4 | Estimating Methodology | 249 | ||
| 21.1.5 | Pricing Basis | 250 | ||
| 21.2 | Operating Cost Estimates | 251 | ||
| 21.2.1 | Process Plant Operating Costs | 252 | ||
| 21.2.2 | Mine Operating Costs | 255 | ||
| 21.3 | Sustaining Capital Costs | 255 | ||
| 21.3.1 | TSF Lifts | 256 | ||
| 21.3.2 | Aerodrome | 256 | ||
| 21.3.3 | Roads | 256 | ||
| 21.3.4 | Surface Water Management | 256 | ||
| 21.3.5 | Solar Farm | 256 | ||
| 21.3.6 | Fuel Farm | 257 | ||
| 21.4 | Comment on Section 21 | 257 | ||
| 22 | Economic Analysis | 258 | ||
| 22.1 | Methodology | 258 | ||
| 22.2 | Assumptions | 258 | ||
| 22.3 | Summary | 259 | ||
| 22.4 | Forecast Production and Mill Feed | 260 | ||
| 22.5 | Cost Estimates | 261 | ||
| 22.5.1 | Capital and Operating Costs | 261 | ||
| 22.5.2 | Closure and Salvage Value | 261 | ||
| 22.5.3 | Working Capital | 261 | ||
| 22.5.4 | All-in Sustaining Unit Cost Estimates | 262 | ||
| 22.6 | Taxes and Royalties | 262 | ||
| 22.6.1 | Government Royalty | 262 | ||
| 22.6.2 | Social Fund | 262 | ||
| 22.6.3 | Duties and Levies | 262 | ||
| 22.6.4 | Value Added Tax | 263 | ||
| 22.6.5 | Corporate Income Tax | 263 | ||
| 22.6.6 | Withholding Taxes | 263 | ||
| 22.7 | Government-Carried Interest | 263 | ||
| June 30, 2026 | Page 13 of 291 |
| | Diamba Sud Gold Project, Kédougou Region, Senegal Technical Report |
| 22.8 | Economic Results | 264 | ||
| 22.9 | Sensitivity Analysis | 266 | ||
| 22.10 | Comment on Section 22 | 268 | ||
| 23 | Adjacent Properties | 269 | ||
| 24 | Other Relevant Data and Information | 270 | ||
| 25 | Interpretation and Conclusions | 271 | ||
| 25.1 | Mineral Tenure, Surface Rights, Royalties and Agreements | 271 | ||
| 25.2 | Geology and Mineralization | 272 | ||
| 25.3 | Exploration, Drilling and Analytical Data Collection in Support of Mineral Resource Estimation | 272 | ||
| 25.4 | Data Verification | 272 | ||
| 25.5 | Metallurgical Testwork | 273 | ||
| 25.6 | Mineral Resource Estimation | 273 | ||
| 25.7 | Mine Plan | 274 | ||
| 25.8 | Recovery | 274 | ||
| 25.9 | Infrastructure | 275 | ||
| 25.10 | Markets and Contracts | 275 | ||
| 25.11 | Environmental, Permitting and Social Considerations | 275 | ||
| 25.12 | Capital and Operating Costs | 276 | ||
| 25.13 | Economic Analysis | 277 | ||
| 25.14 | Opportunities and Risks | 277 | ||
| 25.14.1 | Exploration | 277 | ||
| 25.14.2 | Mineral Reserve Estimation, Mining and Cost Assumptions | 277 | ||
| 25.14.3 | Metallurgical and Processing | 278 | ||
| 25.14.4 | Geotechnical and Hydrogeological | 278 | ||
| 25.14.5 | Environmental, Permitting and Tax Assumptions | 279 | ||
| 26 | Recommendations | 280 | ||
| 26.1 | Overview | 280 | ||
| 26.2 | Exploration | 280 | ||
| 26.3 | Geotechnical | 281 | ||
| 26.4 | Water Management | 282 | ||
| 26.5 | Metallurgical | 283 | ||
| 26.6 | Environmental and Social | 283 | ||
| 26.7 | Engineering Studies | 283 | ||
| 27 | References | 285 | ||
| Certificates | 287 | |||
| June 30, 2026 | Page 14 of 291 |
| | Diamba Sud Gold Project, Kédougou Region, Senegal Technical Report |
Tables
| Table 1.1 Mineral Resources for the Diamba Sud Project | 29 | |
| Table 1.2 Mineral Reserves for the Diamba Sud Project | 31 | |
| Table 1.3 Summary of Capital Costs | 35 | |
| Table 1.4 Life of Mine Operating Costs | 36 | |
| Table 1.5 Summary of Sustaining Capital Costs over LOM | 36 | |
| Table 1.6 Key Economic Model Assumptions | 37 | |
| Table 1.7 Economic Analysis Summary | 37 | |
| Table 2.1 Acronyms | 48 | |
| Table 4.1 Diamba Sud Permit Coordinates in Longitude and Latitude | 54 | |
| Table 10.1 Reverse Circulation and Core Drilling Conducted by Chesser | 83 | |
| Table 10.2 Reverse Circulation and Core Drilling Conducted by Fortuna | 84 | |
| Table 10.3 Number of Holes and Meters Used in the Estimation by Deposit | 85 | |
| Table 10.4 Intervals of Interest in Holes Drilled Post Data Cut-off Date | 86 | |
| Table 12.1 Database Checklist Summary | 100 | |
| Table 13.1 Samples taken for metallurgical testing | 106 | |
| Table 13.2 Summary of XRD Analysis for Area D | 110 | |
| Table 13.3 Summary of XRD Analysis for Area A and Karakara | 111 | |
| Table 13.4 Bond Crushing Work Index Results | 112 | |
| Table 13.5 SMC Results | 113 | |
| Table 13.6 Gravity Recovery Results | 115 | |
| Table 13.7 Grind Size Optimization Results | 116 | |
| Table 13.8 CIL vs Leach Only Cyanidation | 119 | |
| Table 13.9 Effect of Cyanide Concentration on Gold Recovery and Reagent Consumption after 24 hours | 120 | |
| Table 13.10 Average Reagent Consumption after 24 hours at 1,000 ppm Cyanide Between Fresh and Oxide Mineralization | 121 | |
| Table 13.11 Bulk Leach Testwork Summary | 123 | |
| Table 13.12 Bulk Leach Testwork Summary - Variability Tests | 124 | |
| Table 13.13 Carbon Concentrations and Loading | 125 | |
| Table 13.14 Carbon Triple Contact Test Results | 125 | |
| Table 13.15 Summary of Vane Yield Stress Test Results | 126 | |
| Table 13.16 Summary of Bohlin Viscometry Testwork | 127 | |
| Table 13.17 Diagnostic Leach Results | 128 | |
| Table 13.18 Summary of Comminution Testwork Results | 129 | |
| Table 13.19 Summary of Samples tested for Southern Arc and Moungoundi | 130 | |
| Table 13.20 SMC Results for Southern Arc and Moungoundi | 132 | |
| Table 13.21 Gravity, Gravity Tail Direct Leach Results for Southern Arc and Moungoundi | 134 |
| June 30, 2026 | Page 15 of 291 |
| | Diamba Sud Gold Project, Kédougou Region, Senegal Technical Report |
| Table 13.22 Carbon Triple Contact Test Results for Southern Arc | 136 | |
| Table 13.23 Gold Recovery Formula | 139 | |
| Table 13.24 Metallurgical Recovery at Incremental Cut-off Grades | 140 | |
| Table 13.25 Average Metallurgical Gold Recovery Forecast By Deposit | 141 | |
| Table 13.26 Proposed Process Design Values Based on Testwork | 143 | |
| Table 13.27 Proposed Comminution Model Inputs | 143 | |
| Table 14.1 Univariate Statistics of Au Composites for Each Deposit | 147 | |
| Table 14.2 Top Cut Thresholds | 150 | |
| Table 14.3 Variogram Model Parameters | 153 | |
| Table 14.4 Block Model Parameters by Deposit | 155 | |
| Table 14.5 Density Measurements by Lithology and Weathering Horizon | 156 | |
| Table 14.6 Open Pit Cut-off Grade Inputs for Mineral Resource Estimation | 162 | |
| Table 14.7 Mineral Resources for the Diamba Sud Project | 164 | |
| Table 15.1 Mineral Reserves for the Diamba Sud Project | 167 | |
| Table 15.2 Open Pit Cut-off Grade Inputs for Mineral Reserve Estimation | 168 | |
| Table 15.3 Estimated Open Pit Cut-Off Grade by Deposit and Material | 169 | |
| Table 16.1 Maximum Predicted Dewatering (annual average) | 172 | |
| Table 16.2 Geotechnical Slope Design Parameters for all Diamba Sud Pits | 173 | |
| Table 16.3 Financial Parameters and Selling Costs Applied Inpit Optimization | 175 | |
| Table 16.4 Mining Parameters Costs Applied Inpit Optimization | 175 | |
| Table 16.5 Waste Load and Haul Costs in $/t | 175 | |
| Table 16.6 Mill Feed Material Load and Haul Costs in $/t | 176 | |
| Table 16.7 ROM Costs Applied in Pit Optimization | 177 | |
| Table 16.8 Optimizations Results | 178 | |
| Table 16.9 Open Pit Mining Physicals | 179 | |
| Table 16.10 WRSF Capacities by Deposit | 185 | |
| Table 16.11 Drill and Blast Assumptions | 186 | |
| Table 16.12 LOM Mining Equipment Requirements | 187 | |
| Table 16.13 Proposed Mining and Production Schedule | 188 | |
| Table 17.1 Proposed LOM Feed Composition | 193 | |
| Table 17.2 Fresh Mill Feed Material Comminution Characteristics | 194 | |
| Table 18.1 Site Access Roads and Bypass Road Design Parameters | 207 | |
| Table 18.2 Site Haul Roads Design Parameters | 208 | |
| Table 18.3 Tailings Storage Facility Design Parameters | 209 | |
| Table 18.4 Water Storage Dam Design Parameters | 210 | |
| Table 18.5 Water Harvesting Dam Design Parameters | 211 | |
| Table 18.6 Surface Water Management Design Parameters | 212 |
| June 30, 2026 | Page 16 of 291 |
| | Diamba Sud Gold Project, Kédougou Region, Senegal Technical Report |
| Table 18.7 Project Power Demand | 215 | |
| Table 18.8 Storage tank volumes | 216 | |
| Table 18.9 Solar Photovoltaic Capacity | 216 | |
| Table 20.1 Key Community Infrastructure | 226 | |
| Table 20.2 Summary of Key Permits and Authorizations Required for the Diamba Sud Project | 236 | |
| Table 20.3 Key Air Quality, Noise and Water Standards and Legal Requirements | 238 | |
| Table 20.4 Summary of Closure Costs | 244 | |
| Table 21.1 Summary of Capital Cost Estimate | 246 | |
| Table 21.2 Summary of Capital Cost Estimate for the Process Plant | 248 | |
| Table 21.3 Summary of Capital Cost Estimate or the Owners | 248 | |
| Table 21.4 Derivation of Quantities | 250 | |
| Table 21.5 Design Growth by Discipline | 250 | |
| Table 21.6 Supply Cost Source | 251 | |
| Table 21.7 Life-of-Mine Operating Cost Estimate | 251 | |
| Table 21.8 Oxide Ore Operating Cost Estimate | 252 | |
| Table 21.9 Fresh Ore Operating Cost Estimate | 252 | |
| Table 21.10 Mining Operating Cost Breakdown | 255 | |
| Table 21.11 Summary of Projected Major Sustaining Capital Costs for the LOM | 256 | |
| Table 22.1 Key Economic Assumptions | 258 | |
| Table 22.2 Forecast Economic Analysis Summary | 259 | |
| Table 22.3 Estimate of Recovered Gold for the Diamba Sud Project | 261 | |
| Table 22.4 Life of Mine All-in Sustaining Cost and All-in Cost | 262 | |
| Table 22.5 Cash Flow Forecast | 265 | |
| Table 22.6 After-Tax NPV Sensitivity to Discount Rate and Gold Price ($M) | 266 | |
| Table 22.7 After-Tax IRR Sensitivity to Gold Price | 266 | |
| Table 22.8 After-Tax NPV5% Sensitivity to Capital Costs and Operating Costs ($M) | 266 | |
| Table 26.1 Summary of Recommended Program Costs by Area | 280 |
| June 30, 2026 | Page 17 of 291 |
| | Diamba Sud Gold Project, Kédougou Region, Senegal Technical Report |
Figures
| Figure 2.1 Map Showing the Location of the Diamba Sud Project | 45 | |
| Figure 4.1 The Diamba Sud Permit Boundary and Location in Eastern Senegal | 53 | |
| Figure 6.1 Second Vertical Derivative, Total Magnetic Intensity (TMI) at the Diamba Sud Project | 60 | |
| Figure 6.2 Magnetic Analytical Signal for the Diamba Sud Project | 61 | |
| Figure 7.1 Regional Geological Map of the Leo–Man Shield and Kedougou–Kenieba Inlier, West Africa Craton | 62 | |
| Figure 7.2 Geological Map of Diamba Sud DS1 Block Showing Deposits and Prospects | 69 | |
| Figure 7.3 Schematic Cross-Section of Area A Looking North | 70 | |
| Figure 7.4 Schematic Cross-Section of Area D Looking North | 71 | |
| Figure 7.5 Schematic Cross-Section of Karakara Looking North | 72 | |
| Figure 7.6 Schematic Cross-Section of Kassassoko Looking North | 73 | |
| Figure 7.7 Schematic Cross-Section of Western Splay Looking North | 74 | |
| Figure 7.8 Schematic Cross-Section of Moungoundi Looking North | 75 | |
| Figure 7.9 Schematic Cross-Section of Southern Arc Looking Northeast | 76 | |
| Figure 9.1 Fortuna Auger Sampling Results Across Portion of Northern Block of Diamba Sud Property | 78 | |
| Figure 10.1 Contoured Auger Sampling Results Across the DS1 and DS2 Blocks of the Diamba Sud Project. | 82 | |
| Figure 10.2 Location Map of RC and Core Drill Holes Completed by Chesser | 83 | |
| Figure 10.3 Map Showing Location of RC and Core Drilling Conducted by Fortuna | 85 | |
| Figure 13.1 Map Showing Location of Metallurgical Samples for Area A and Area D | 107 | |
| Figure 13.2 Metallurgical Sample Location for Area A and Area D – Section C | 108 | |
| Figure 13.3 Map Showing Location of Metallurgical Samples for Karakara | 108 | |
| Figure 13.4 Metallurgical Sample Location for Karakara – Section B | 109 | |
| Figure 13.5 Diamba Sud A*b vs SMC Database | 114 | |
| Figure 13.6 Grind Size Optimization of Area A, Area D and Karakara Deposits | 117 | |
| Figure 13.7 Lead Nitrate vs Au Recovery of DC Fresh-1 | 118 | |
| Figure 13.8 Oxygen vs Air Sparging | 119 | |
| Figure 13.9 Effect of NaCN Concentration on Cyanidation | 120 | |
| Figure 13.10 Effect of Solid Mass Fraction (%) – Oxides | 122 | |
| Figure 13.11 Effect of Solid Mass Fraction (%) – Fresh | 122 | |
| Figure 13.12 Map Showing Location of Metallurgical Samples for Southern Arc | 131 | |
| Figure 13.13 Map Showing Location of Metallurgical Samples for Moungoundi | 132 | |
| Figure 13.14 BLEG Test Gold Extraction of Southern Arc and Moungoundi | 133 |
| June 30, 2026 | Page 18 of 291 |
| | Diamba Sud Gold Project, Kédougou Region, Senegal Technical Report |
| Figure 13.15 Gravity Leach Test and BLEG Test Results for Southern Arc and Moungoundi | 135 | |
| Figure 13.16 Southern Arc Composite 1 Viscosity Test Results Summary | 137 | |
| Figure 13.17 Moungoundi Composite 3 Viscosity Test Results Summary | 137 | |
| Figure 14.1 Cross-Section Showing Mineralized Wireframes for Area A | 146 | |
| Figure 14.2 Cross-Section of Estimated Gold Grade Block Model vs Top Cut Drill Hole Composites in Area D | 158 | |
| Figure 14.3 Swath Plot Analysis for Southern Arc and Comparative Log-Probability Plot | 159 | |
| Figure 14.4 Cross-Section Showing Mineral Resource Classification for Area D | 162 | |
| Figure 16.1 Plan View of Mine Infrastructure | 180 | |
| Figure 16.2 Area A–Area D Pit Design | 181 | |
| Figure 16.3 Southern Arc Pit Design | 182 | |
| Figure 16.4 Karakara Pit Design | 183 | |
| Figure 16.5 Kassassoko, Moungoundi and Western Splay Pit Designs | 184 | |
| Figure 16.6 Mineralization Mined by Deposit | 189 | |
| Figure 17.1 Schematic of Proposed Processing Flowsheet for the Diamba Sud Project | 192 | |
| Figure 18.1 Plan View of Site Infrastructure | 206 | |
| Figure 18.2 Process Plant Layout | 213 | |
| Figure 18.3 Water Balance Modelling Block Model Diagram | 219 | |
| Figure 20.1 Diamba Sud Project Study Area in DS1 Block | 224 | |
| Figure 20.2 Creeks in and Around the Diamba Sud Project | 229 | |
| Figure 22.1 Diamba Sud FS Production Profile | 260 | |
| Figure 22.2 After-Tax NPV5% Sensitivities to Key Input Parameters | 267 | |
| Figure 22.3 After-Tax IRR Sensitivity to Key Input Parameters | 267 |
| June 30, 2026 | Page 19 of 291 |
| | Diamba Sud Gold Project, Kédougou Region, Senegal Technical Report |
| 1 | Summary |
| 1.1 | Introduction |
This Technical Report (the Report) was prepared by Mr. Eric Chapman, P.Geo., Mr. Paul Weedon, MAIG, Mr. Raul Espinoza, FAusIMM (CP), Mr. Mathieu Veillette, P.Eng., and Mr. Ruan Venter, P.Eng., for Fortuna Mining Corp. (Fortuna) on the Diamba Sud Project (the Project) located in the Kédougou Region of Senegal.
The Diamba Sud Project is operated by Boya S.A. (Boya), a 100% indirectly owned Fortuna subsidiary. Upon the grant of an exploitation permit to Boya, the State of Senegal (the State or State of Senegal) will require Boya to designate and incorporate a new entity to hold the exploitation permit and operate the Diamba Sud Project. The State of Senegal is entitled to a 10% free carried ownership interest in the operating entity, and Fortuna will indirectly hold the remaining 90% interest. In addition, the State has the right to acquire up to an additional 25% contributory interest in the operating entity at a “fair price” as determined through an independent valuation. The percentage and timing of any such additional contributory interest is subject to negotiation with the State. There can be no assurance that the State’s interest will remain limited to 10%.
The Report discloses Mineral Resource and Mineral Reserve estimates for the Project and the results of a feasibility study (FS) based on those estimates.
Costs are in US dollars (US$) unless otherwise indicated.
| 1.2 | Property Description, Location and Access |
The Diamba Sud Project is located within the Department of Saraya in the Kédougou Region and within the Arrondissement of Bembou. It is situated approximately 50 km north of the Senegal-Guinea border, and is approximately 7 km to the west of the Falémé River which, in this region, defines the international border between Senegal and Mali. The Project is approximately 665 km southeast of the Senegalese capital Dakar and 83 km northeast from the nearest town, Kédougou.
The Project comprises two blocks: DS1 and DS2 linked by a narrow strip of some 25 m width in order for the two blocks to be classed as contiguous and one permit area. DS1 is centered upon co-ordinates 11° 28’ 23.17” W and 12° 55’ 46.55” N. DS2, the southern block some 20 km to the south is centered upon co-ordinates 11° 26’ 2.68” W and 12° 45’ 13.61” N.
Elevations range between 100 m and 380 m above mean sea level. The region features low to moderate relief, consisting of broad lateritic plateaus, eroded valleys, and gentle slopes.
The landscape primarily comprises forested savanna with patches of grassland and forest. Notable flora include Baobab (Adansonia digitata), Madd (Saba senegalensis), Jujube (Ziziphus mauritania), and the Locust Bean Tree (Parkia biglobosa). Larger trees are often localized along river channels where seasonal rivers flow and the lateritic plateau has eroded, while vegetation in the area is predominantly grasses and small shrubs, characteristic of the climate.
From Dakar the Project site is accessed via the all-weather paved N1 highway southeast to the city of Tambacounda, the regional center of Senegal. From Tambacounda, the N7
| June 30, 2026 | Page 20 of 291 |
| | Diamba Sud Gold Project, Kédougou Region, Senegal Technical Report |
can be taken southeast to Kédougou where it joins the Kédougou–Saraya road which connects Kédougou to the village of Saraya. From Saraya the paved N24 road is frequented by trucks taking goods to and from Mali, passes through the Diamba Sud permit area, and continues through to the Senegal-Mali border. Due to frequent use by trucks carrying heavy loads, road conditions can be locally very poor. However, in almost all cases the main roads remain open to vehicles throughout the year. Access throughout the permit area is taken via a combination of paved and laterite roads and dirt tracks.
Access by air is possible via an asphalt airfield in Kédougou. The Government has announced numerous plans to transform the airport into an international airport with regular scheduled flights, but development of the airport is yet to take place. Thus, the only currently available options for flights are two charter companies that operate from Dakar with flights taking approximately 2–3 hours.
| 1.3 | Mineral Tenure, Surface Rights and Royalties |
In April 2015, Boya entered into a Mining Convention (Mining Agreement) with the State of Senegal. This was followed by the grant of the Diamba Sud permit exploration permit (permis de recherche) in June 2015 under the 2003 Mining Code before the 2016 Mining Code came into effect, and therefore it remains subject to the 2003 Mining Code for its duration and validity. The exploration permit was granted for an initial period of three years, subject to being renewed twice for additional periods of three years. The exploration permit was renewed for a second time on June 9, 2021, being the second and final renewal and which expired on June 9, 2024. However, Boya obtained a special two-year retention period until June 21, 2026, to apply for an exploitation permit, complete the work necessary to file a FS and file the FS, and to conduct the environmental studies that are required in support of an application for an exploitation permit. Boya applied for an exploitation permit from the Ministry of Energy, Petroleum, and Mines on February 4, 2026, received a formal Decree for the environmental permit for the Diamba Sud Project Boya on June 11, 2026, and obtained an extension to the retention period of the exploration permit of 60 days until August 21, 2026 to file the FS with the Ministry of Mines. The State will then make a decision upon the application to grant the exploitation permit
The permit comprises two blocks, the northern block, DS1 is approximately 46.56 km2 in area and the southern block, DS2, is approximately 6.31 km2 in area, for a total permit area of 53.46 km2 (including the corridor of land connecting the two parcels).
Mineral exploration permits, within their boundaries, entitle the holder within the boundaries of its perimeter, on surface and indefinitely in depth, the exclusive rights to explore for the nominated mineral commodities specified (in this case, gold), as well as encumbrance-free disposal of materials extracted during the exploration process. Such permits allow for beneficial ownership to be held by a foreign entity, such as Fortuna, through Boya, its wholly-owned Senegalese subsidiary.
Boya has full and unrestricted surface rights to the land covered by the exploration permit. The perimeter of the exploration permit is free to access and is not subject to any kind of restriction, subject to the applicable mining regulation. The FS assumes the granting of an exploitation permit which will provide Boya, within the boundaries of its perimeter, on surface and indefinitely in depth, with the exclusive rights to explore, extract and dispose of the nominated mineral commodities specified (in this case, gold).
The Diamba Sud Project is not subject to any back-in rights, liens, payments, or encumbrances.
| June 30, 2026 | Page 21 of 291 |
| | Diamba Sud Gold Project, Kédougou Region, Senegal Technical Report |
The FS assumes that the applicable royalties, taxes, and other fiscal terms payable to the State of Senegal, including the contribution to the social development fund, will be in accordance with the provisions of the Mining Convention between Boya S.A. and the State of Senegal dated April 8, 2015. There can be no assurance that such provisions will not be renegotiated by the State as part of the exploitation permit approval process.
Royalties that affect the Mineral Resources and Mineral Reserves and have been considered in the economic analysis are:
| · | A 3% royalty to the State of Senegal on the gross revenue from gold production, with deductions allowed for transportation and refining costs. |
| · | A local contribution royalty of 0.5%, also calculated after deductions allowed, for transportation and refining costs. |
| 1.4 | History |
Prior to 1993 there is no known or recorded systematic mineral exploration carried out on the property, although regionally the area was surveyed by the Bureau de Recherches Géologiques et Minières (BRGM) as part of the Senegal Plan minerale in 1983. The first recorded exploration activities were carried out by Anmercosa Exploration (a subsidiary of Anglo American plc) from 1993 to 1996, as part of a joint venture agreement with Iamgold Corporation (Iamgold). This work was carried out over the larger Bambadji Daorala and Boto Project permit areas, which at that time included the area currently referred to as Diamba Sud. Activities included airborne geophysical surveys along with regional and local geochemistry and early drilling activity. No drilling was conducted on the Diamba Sud area.
Between 1997 to 1998, Ashanti Goldfields completed further exploration activities as part of a similar joint venture with Iamgold. Ashanti Goldfields also worked on the Bambadji, Daorala and Boto areas and continued to focus on geochemical data acquisition and conducted some preliminary trenching and pitting
From 1999 to 2014, Iamgold conducted limited prospecting activity over the Bambadji permit: the majority of the work conducted was on the eastern portion of the permit and not on the Diamba Sud area. The western part of the Bambadji permit was relinquished in 2014 and acquired by Boya in 2015.
| 1.5 | Geology and Mineralization |
The Diamba Sud Project is a part of the West Africa craton (WAC) within the Loulo Mining district.
The geology local to the Diamba Sud Project is dominated by plutons belonging to the Falémé Volcanic Belt as well as roof pendants and xenolith screens of the Bambadji Formation which also uncomformably overly the Kofi series sediments that subcrop to the east.
At the westernmost extent of the Kofi series, north striking altered marbles and strongly abilitized lithologies with identified and unidentified protoliths are prevalent. The Kofi series in the area is dominated by undifferentiated sandstones and siltstones with minor conglomerate and breccia. Several dolerite dykes of various orientations intrude the Kofi series and plutonic rocks of the Falémé Volcanic Belt.
The Falémé Volcanic Belt within and surrounding the permit area is made up of the Highway pluton and a range of smaller plugs and dykes. The Balangouma Pluton and
| June 30, 2026 | Page 22 of 291 |
| | Diamba Sud Gold Project, Kédougou Region, Senegal Technical Report |
heterogeneous granitoids adjacent to it occur to the north of the permit, with the Boboti and Garaboureya plutons outcropping to the south of the permit. The Bambadji Formation is also mapped to subcrop within and surrounding the permit, forming xenolithic screens and roof pendants within the Falémé Volcanic Belt, as well as unconformably overlying the Kofi series to the east.
Iron endo- and exoskarns, some structurally controlled along faults, occur within the Falémé Volcanic Belt, the Bambadji Formation and on western portions of the Kofi series. A genetic link between iron skarn mineralization and gold mineralization has been proposed based on the proximal locations of these deposits, the involvement of high temperature FeCl2-rich brine and from mineral paragenesis at the Sadiola deposit. Additionally, the Karakaéné Ndi iron skarn, north of Afrigold’s Karakaéné mine, has been a target of significant artisanal workings. Named iron skarns inside and within the vicinity of the Project include the Karakaéné Mbah, Karakaéné Ndi and Kouroudiako iron skarns, with other unnamed skarns of various volumes also cropping out in the region.
Sedimentary sequences not confirmed to belong to the Bambadji Formation and possibly belonging to the Kofi series or part of the Diale-Dalema Basin are also present within the permit area. These consist of marls, carbonates, polymictic matrix-supported conglomerates and intensely hydrothermally-altered lithologies, in some of which the protoliths cannot be identified. Granites belonging to the Falémé batholith intrude into these sedimentary units.
Both the Falémé batholith and sedimentary sequences are intruded by late predominantly sub-vertical diorite dykes. A number of iron endo and exoskarns also occur in the area and these form prominent topographic highs inside and outside of the permit area.
Exploration has identified seven gold deposits and several prospects located in the DS1 block. These include the deposits of Area A, Area D, Karakara, Kassassoko, Western Splay, Moungoundi, and Southern Arc, as well as the Gamba Gamba North, Area A North, Area D South, and Kouroudiako prospects. These deposits all form part of a single mineralizing system with local variability influenced mainly by intensity of brecciation, alteration and later supergene processes. The Bougouda prospect is located in the DS2 block.
Mineralization at Diamba Sud is relatively simple, consisting dominantly of pyrite with minor chalcopyrite and magnetite.
The predominant mineralization style is orogenic lode gold with overprinting supergene-enriched saprolite zones in Area D. Mineralization can occur as veins or disseminations in altered (often silicified) host rocks or as pervasive alteration over a broad zone.
There does not appear to be a preferential host lithology, with gold mineralization (>1 g/t Au) hosted in most rock types, except for weakly-altered fine grained sedimentary rocks, although there is a bias towards hydrothermally brecciated carbonate units. Most of the mineralization is hosted in a combination of disseminated pyrite, minor veinlets, and hydrothermal breccia cement.
Hydrothermal breccia zones within Area A host some of the highest grades within the hypogene mineralized zones from Diamba Sud.
Mineralized structures also occur throughout the intrusions in the area, with auriferous pyrite ± carbonate veins exploiting shear zones that cut through the intrusive units.
| June 30, 2026 | Page 23 of 291 |
| | Diamba Sud Gold Project, Kédougou Region, Senegal Technical Report |
| 1.6 | Exploration, Drilling and Sampling |
The Diamba Sud exploration permit was granted in April 2015 to Boya, a subsidiary of Boya Gold Pty Ltd. (Boya Gold). During the period 2015–2016, Boya conducted regional soil geochemistry for gold using a 400 x 400 m grid, later infilled to 200 x 100 m in places, collecting 1,552 soil samples. Outcrop mapping was completed over an area of 37 km2 and 96 grab samples were collected.
Air core and reverse circulation (RC) drilling was conducted by Minerex Drilling Contractors Ltd. A total of 334 air core holes (3,358 m) with depths from 2–56 m were drilled with 1,160 samples, including quality control samples, sent to the SGS laboratory in Bamako (SGS Bamako) for analysis. In addition, 9 RC holes (650 m), with maximum depths ranging from 40–86 m, were drilled over two target areas in the south of DS1 at Dembakholi and Southern Arc with 338 samples, including quality control samples, sent to SGS Bamako for analysis.
Boya Gold was acquired by Chesser Resources Ltd. (Chesser) in 2017. Chesser commenced RC drilling in 2019 using several different drilling contractors during various campaigns through to July 2023. A total of 10 geochemical targets were drilled by RC or RC with a core tail, totaling 493 holes and 58,960 m. In total, 127 diamond drill (DD) holes totaling 19,805 m were drilled between November 2019 and July 2023. All holes were sampled at 1- or 2-m intervals in the oxide material and at 1-m intervals in the fresh rock and all samples were submitted to SGS Bamako or to the ALS laboratory in Burkina Faso.
After acquiring Chesser in 2023, Fortuna began an extensive program of verification and infill drilling across nine of the advanced target areas with the aim of collecting sufficient data to support the estimation of Mineral Resources. A total of 607 RC holes totaling 67,713 m, 533 DD holes totaling 72,054 m and 19 RC with DD tail holes totaling 2,520 m were drilled between October 2023 and January 16, 2026.
RC drilling was conducted using an Atlas Copco T3W rig with a 950CFM compressor and an Atlas Copco Hurricane booster. All holes were cased with PVC to 6 m and then drilled using a 5.5-inch RC hammer bit. Samples were collected at 1-meter intervals from an onboard cyclone then split on site to produce two 1.5 kg samples, the first sample was submitted for analysis, the second stored as a duplicate sample.
Diamond drilling was conducted with Atlas Copco CS14 and CT14 diamond drill rigs, dependent upon the contractor. The majority of this drilling is drilled to HQ (63.5 mm core diameter) and NQ (47.6 mm) sizes. In Area D where the oxide material can be difficult to keep holes from collapsing, holes are drilled at PQ size (85 mm) from surface to fresh rock before stepping down to HQ and NQ as appropriate to conditions and depth.
Proposed surface drill hole collar coordinates, azimuths and inclinations were designed based on the known orientation of mineralization and the planned depth of intersection using geological plan maps and sections as a guide. The location of the collar is defined in the field using differential global positioning system (GPS) instruments. The drill pad is then prepared at this marked location. Upon completion of the drill hole, a survey of the collar is performed using Total Station equipment, with results reported in the collar coordinates using reference Datum WGS84, UTM Zone 29N.
The geologist in charge of drilling is responsible for orienting the azimuth and inclination of the hole at the collar using a compass clinometer. Downhole surveys for RC holes are completed every 10 m by the drilling contractor using a Reflex Gyro Sprint IQ survey
| June 30, 2026 | Page 24 of 291 |
| | Diamba Sud Gold Project, Kédougou Region, Senegal Technical Report |
tool. Downhole surveys of the DD holes were conducted using a variety of survey tools, as there were several rigs operating at the same time in different areas. These included a Reflex EZ Shot TM, the Reflex Gyro Sprint IQ, and an Axis Champ gyro. Readings were collected every 30 m down the hole. Boya and Fortuna assessing the downhole survey measurements as a component of data validation.
Drill holes are typically drilled on sections spaced 25–50 m apart along the strike of the mineralized structures.
The Area A deposit has been drilled over an approximate area of 700 m (north to south) and 500 m (east to west) to depths around 280 m from surface. Exploration drilling has increased in depth to the south and the deposit remains open at depth.
The Area D deposit has been drilled over an approximate area of 600 m (north to south) and 700 m (east to west) to depths around 250 m from surface where it remains open. Exploration drilling has increased in depth to the south.
The Karakara deposit has been drilled over a strike length of approximately 1,000 m (north–northeast to south–southwest) and to depths of 230 m from surface where it narrows but remains open. Exploration drilling has increased in depth in response to the plunge of mineralization to the southwest.
The Kassassoko deposit has been drilled over an approximate area of 700 m (southwest to northeast) and 200 m (southeast to northwest) to depths around 150 m from surface and remains open at depth. Exploration drilling has increased in depth to the south.
The Western Splay deposit has been drilled over an approximate area of 500 m (north to south) and 700 m (east to west) to depths around 280 m from surface and remains open along strike and at depth. Exploration drilling has increased in depth to the south.
The Moungoundi deposit has been drilled over a strike length of approximately 400 m (north to south) and to depths around 150 m from surface.
The Southern Arc deposit has been drilled over a strike length of approximately 800 m (northwest to southeast) and to depths of 200 m from surface where it remains open.
The Bougouda prospect has been drilled over a strike length of approximately 1,800 m (northeast to southwest) and to depths of 150 m from surface.
The Gamba Gamba North prospect drilled by Chesser is split into two main mineralized zones. The eastern zone has been drilled over a strike length of 300 m (north–northeast to south–southwest) to a depth of 150 m from surface; the western zone has been drilled over a strike length of 300 m (north to south) to a depth of 125 m from surface. The drilling follows the plunge of mineralization, generally getting deeper towards the south–southwest where it remains open.
The relationship between the sample intercept lengths and the true width of the mineralization varies in relation to the intersect angle and sometimes can be difficult to determine based on the various orientations of the mineralized structures. Calculated estimated true widths are always reported together with actual sample lengths by taking into account the angle of intersection between drill hole and the mineralized structure.
RC chips were collected and logged at the drill site and stored in standard chip trays for further investigation as appropriate.
Core is logged in detail at the field camp, using LogChief software and transferred electronically to DataShed 5 for database management. As is the norm with exploration drilling, geological logging is undertaken at several different times to ensure that a level
| June 30, 2026 | Page 25 of 291 |
| | Diamba Sud Gold Project, Kédougou Region, Senegal Technical Report |
of consistency is maintained. Lithologies, alteration, mineralization and structures are all logged to industry standards. Geotechnical information collected routinely is at an exploration level, however 14 drill holes (2,100 m) were fully logged to higher geotechnical standards as part of geotechnical studies.
The sampling methodology, preparation, and analyses differ depending on whether it is DD core or RC chip samples.
Sampling of RC holes is conducted at the drilling rig with one split sample collected for routine analysis and the second sample split again for duplicate sample submission.
Sampling of diamond core is conducted after geological logging and marking of the core for sampling. Core is split using a diamond saw. The half core that does not contain the orientation line is then selected for sampling. Intervals are based upon geology with nominal sample lengths of 1 meter, although this may be variable, but standard sampling procedures dictate a minimum sample length of 0.4 m and a maximum of 1.2 m. For duplicate samples only, the remaining half core is cut in half again for submission to the laboratory.
PQ core is sampled as quarter core for routine sample submission and the second quarter is collected for duplicate sample submission.
All samples are combined into batches for submission to the laboratory. Nominally each batch should represent a specific hole, however the preferred batch size at the laboratory is 100 samples, thus longer holes tend to be split into two or three batches. Once sampled and labelled samples are packed into large sacks and sealed ready for transportation.
Sample collection and transportation of drill core and chip samples is the responsibility of Boya exploration and follow strict security and chain of custody requirements established by Fortuna. Samples are retained in accordance with the Fortuna corporate sample retention policy.
The preparation of both RC and DD samples is conducted by ALS Global at their preparation facilities in Kédougou, Senegal or by SGS at their preparation facilities in Bamako, Mali.
Samples from Diamba Sud are assayed for gold at ALS Global’s analytical facility in Ouagadougou, Burkina Faso or the SGS Mineral Services laboratory in Bamako, Mali. The assay method used for all the drill samples is a fire assay fusion with atomic absorption spectroscopy (AAS) finish. Both the ALS Global and SGS Mineral Services laboratories are independent, and certified for the preparation and assaying of gold samples.
Implementation of a quality assurance/quality control (QAQC) program is current industry best practice and involves establishing appropriate procedures and the routine insertion of certified reference material (CRMs), blanks, and duplicates to monitor the sampling, sample preparation, and analytical process. Fortuna implemented a full QAQC program to monitor the sampling, sample preparation, and analytical process for all drilling campaigns in accordance with its companywide procedures. The program involved the routine insertion of CRMs, blanks, and duplicates. Evaluation of the QAQC data indicates that the data are sufficiently accurate and precise to support Mineral Resource and Mineral Reserve estimation.
| June 30, 2026 | Page 26 of 291 |
| | Diamba Sud Gold Project, Kédougou Region, Senegal Technical Report |
| 1.7 | Data Verification |
Site visits were completed. The QPs individually reviewed the information in their areas of expertise, and concluded that the information supported Mineral Resource and Mineral Reserve estimation, and could be used in mine planning and in the economic analysis that supports the FS.
| 1.8 | Mineral Processing and Metallurgical Testing |
Maca Interquip Mintrex (MIQM), previously Mintrex, was engaged by Chesser in May 2022 and subsequently by Fortuna to manage metallurgical testwork for the Diamba Sud Project. The testwork was undertaken by ALS Metallurgy Pty Ltd (ALS) in Perth, Western Australia. A testwork program developed by MIQM aimed to build upon the initial scoping study level testwork competed in 2022. The testwork was conducted on samples selected by MIQM and Fortuna across three initial deposits: Area A, Area D, and Karakara. The purpose of the testwork program was to provide inputs to future studies for a gold processing plant.
Additional testwork was commissioned and managed by Fortuna covering the Western Splay, Kassassoko, Moungoundi and Southern Arc deposits, as well as some supporting testwork identified during review. This additional testwork was completed in phases during 2024, 2025 and 2026.
| · | The testwork program indicates favorable grinding and leaching characteristics for both oxide and fresh mineralization, with the majority of the material classified as free-milling. |
| · | Various comminution tests were undertaken on the composites, including Bond abrasion index (Ai), Bond ball mill work index (BWi), crushing work index (CWi), and semi-autogenous grinding (SAG) mill competency (SMC) breakage parameter (A*b) tests. Comminution modelling confirmed that both single-stage SAG (SSAG) and SAG–ball mill–crusher (SABC) flowsheets are suitable. Oxide samples were generally too friable for full comminution characterization, although field observations and size distribution data indicate soft material behavior. |
| · | Comminution testing results indicate: |
| o | Ai results (average ~0.222 for fresh domain) indicate that the material is not abrasive. |
| o | BWi and SMC results indicate that the material is moderate to hard (average ~17.4 kWh/t), except the oxide composite, which was not compatible with the test. The friability of the composite shows that the oxide is very soft. |
| o | The SMC testwork indicates that the mineralized material is amenable to both SSAG, or alternatively SABC (average A*b of ~30.9 for fresh mineralization) in closed circuit with or without a pebble crusher. |
| · | Gravity testwork has indicated that the mineralized material contains a large proportion of free/gravity-recoverable gold. The proportion of gravity recoverable gold varied from 19–40% for selected oxide samples and 27–81% for selected fresh mineralized material. Broadly, the higher gold grade fresh materials had higher fractions of gravity gold, while the lower-grade samples had |
| June 30, 2026 | Page 27 of 291 |
| | Diamba Sud Gold Project, Kédougou Region, Senegal Technical Report |
| comparatively lower gravity recoveries. Intensive leach results indicate gold recoveries from the gravity concentrate >99%. | ||
| · | Leaching optimization tests on two oxide and seven fresh samples found the leaching parameters that were suitable for these types of mineralized material: |
| o | Optimal grind size selected at 106 µm, |
| o | Only one sample exhibited recovery below 90%, at 74%. The addition of 200 g/t lead nitrate did not improve gold recovery. |
| o | Use of air instead of oxygen for sparging did not impact gold recovery significantly. |
| o | Cyanide concentration initially at 1,000 ppm (maintained at 500 ppm) showed marginal improvement over 500 ppm initial and 250 maintained, and 250 initial and 100 ppm maintained. |
| o | Varying the carbon in leach (CIL) oxide solids concentration between 25–40% did not show major impact with increasing solids density in this range. Varying the fresh solids concentration between 35–45% likewise showed no major impact. |
| o | Based on the majority of tests, longer leach times in excess of 24 hours were not considered to be necessary. |
| o | Gold leaching kinetics on gravity tailings samples after gravity gold recovery are relatively fast and mostly complete within eight hours. |
| o | The samples did not display any preg-robbing characteristics or carbon fouling. |
| · | Bulk leach and variability testwork confirmed that total gold recoveries (including gravity) ranged from approximately 70–99%, with average recoveries of approximately 92–94% (excluding known lower-performing samples). |
| · | Rheology testwork indicates that oxide material may exhibit elevated viscosity at higher solids concentrations due to clay content, while fresh material shows favorable flow characteristics. |
| · | Diagnostic leaching was undertaken on samples that had lower overall recovery (70–74%). These tests indicated that a portion of the gold (24–31%) was locked in sulfides. |
| · | Thickener testwork indicated good thickening behavior for fresh material and poor thickening behavior for oxide material. |
| · | Based on the above testwork, grade–recovery relationships were developed for the various deposits and material types. Estimated overall gold recoveries vary by deposit and lithology, with average recoveries generally ranging between approximately 82% and 95% across the Project. |
| 1.9 | Mineral Resources |
Mineral Resource estimates used diamond and RC drill hole information obtained by Boya and Fortuna since 2019. Mineralized domains identifying potentially economically extractable material were modeled and used to code drill hole samples for geostatistical analysis, block modeling, and grade interpolation. Gold grades were estimated into a geological block model consisting of either 5 x 5 x 5m or 10 x 10 x 5 m selective mining units (SMUs), depending on the level of data density. Grades were estimated by ordinary kriging (OK) and constrained within an ultimate pit shell based on estimated long term
| June 30, 2026 | Page 28 of 291 |
| | Diamba Sud Gold Project, Kédougou Region, Senegal Technical Report |
metal prices, projected operating costs, geotechnical constraints, and metallurgical recoveries. Estimated grades were validated globally, locally, and visually prior to tabulation of the Mineral Resources.
Resource confidence classification considers a number of aspects affecting confidence in the resource estimation including; geological continuity and complexity; data density and orientation; data accuracy and precision; and grade continuity. Mineral Resources are categorized as Indicated or Inferred. The criteria used for classification includes the number of samples, spatial distribution, distance to block centroid, kriging efficiency and slope of regression
The Qualified Person for the Mineral Resource estimate is Mr. Eric Chapman, P. Geo., a Fortuna employee. Mineral Resources for the Diamba Sud Project are reported insitu, using the 2014 CIM Definition Standards, exclusive of Mineral Reserves, and have an effective date as at April 10, 2026. Mineral Resources that are not Mineral Reserves do not have demonstrated economic viability. The estimate is detailed in Table 1.1.
Table 1.1 Mineral Resources for the Diamba Sud Project
| Category | Deposit | Tonnes (000) | Au (g/t) | Au (koz) |
| Indicated | Area A | 288 | 0.50 | 5 |
| Area D | 436 | 0.55 | 8 | |
| Karakara | 221 | 0.61 | 4 | |
| Kassassoko | 206 | 0.49 | 3 | |
| Moungoundi | 279 | 0.75 | 7 | |
| Southern Arc | 1,701 | 1.62 | 89 | |
| Western Splay | 233 | 0.74 | 6 | |
| Total | 3,364 | 1.12 | 121 | |
| Inferred | Area A | 152 | 1.45 | 7 |
| Area D | 264 | 0.95 | 8 | |
| Karakara | 26 | 1.47 | 1 | |
| Kassassoko | 138 | 0.86 | 4 | |
| Moungoundi | 107 | 1.09 | 4 | |
| Southern Arc | 734 | 1.42 | 33 | |
| Western Splay | 211 | 1.64 | 11 | |
| Total | 1,632 | 1.31 | 68 |
Notes to accompany Mineral Resource table:
| · | Mr. Eric Chapman, P.Geo., is the Qualified Person responsible for the Mineral Resource estimate, and is a full-time employee of Fortuna. |
| · | Mineral Resources are reported using the 2014 CIM Definition Standards. |
| · | Mineral Resources are reported insitu, on a 100% basis as at April 10, 2026. The State of Senegal is entitled to a 10% free-carried ownership interest in the operating entity when an exploitation permit is granted, and has the right to acquire up to an additional 25% contributory interest in the operating entity at a “fair price” as determined through an independent valuation. Mineral Resources are reported from a regularized block model derived from the original sub-blocked model to account for mining dilution. |
| · | Mineral Resources are reported exclusive of Mineral Reserves. Mineral Resources that are not Mineral Reserves do not have demonstrated economic viability. |
| · | Mineral Resources for Diamba Sud are reported constrained within a pit shell at selective mining unit block sizes and at incremental gold cut-off grades for open-pit oxide and transitional material of 0.33 g/t Au for Area A, Southern Arc, Moungoundi, and Western Splay; 0.32 g/t Au for Kassassoko; and 0.31 g/t Au for Karakara and Area D. For fresh material, the applied cut-off grades are 0.35 g/t Au for Karakara and Kassassoko; 0.37 g/t Au for Area A; 0.38 g/t Au for Southern Arc; 0.41 g/t Au for Area D; and 0.42 g/t Au for Moungoundi and Western Splay. The cut-off grades were derived in accordance with estimated average mining costs of $5.77/t for Area A, $5.26/t for Area D, $5.28/t for Karakara, |
| June 30, 2026 | Page 29 of 291 |
| | Diamba Sud Gold Project, Kédougou Region, Senegal Technical Report |
| $6.27/t for Western Splay, $6.09/t for Kassassoko, $6.18/t for Moungoundi, and $6.27/t for Southern Arc, average processing and G&A costs of $24.92/t milled, and sales and transportation costs of $5.50/oz of gold. Pit slope angles applied are 32° for weathered material and 46° for fresh rock. The long-term gold price was $3,300/oz. Metallurgical recoveries ranging from 72% to 97% are estimated using grade versus recovery relationship formulae developed for oxide/transition rock (all deposits) and separate formulae for fresh rock in each of the seven deposits A royalty of 3.5% has been considered in the generation of the pit shell and cut-off grade determination. | |
| · | Totals may not add due to rounding. |
Factors that may affect the estimates include metal price and exchange rate assumptions; changes to the assumptions used to generate the cut-off grades; changes in local interpretations of mineralization geometry and continuity of mineralized zones; changes to geological and mineralization shape and geological and grade continuity assumptions; variations in density and domain assignments; geometallurgical assumptions; changes to geotechnical, mining, dilution, and metallurgical recovery assumptions; change to the input and design parameter assumptions that pertain to the conceptual open pit constraining the estimates; extent of artisanal mining; and assumptions as to the continued ability to access the site, retain mineral and surface rights titles, maintain environment and other regulatory permits, and maintain the social license to operate. Boya has applied for an exploitation permit for the Project, which if not granted will have a material impact on the potential development of the Project.
There are no other environmental, legal, title, taxation, socioeconomic, marketing, political or other relevant factors known to the QP that would materially affect the estimation of Mineral Resources that are not discussed in this Report.
| 1.10 | Mineral Reserves |
A structured process was applied to convert Mineral Resources to Mineral Reserves, supported by pit shell optimization, detailed open pit designs, mine scheduling, and economic evaluation. Mineral Resources from seven deposits (Area A, Area D, Karakara, Moungoundi, Western Splay, Kassassoko and Southern Arc) have had modifying factors applied for the estimation of Mineral Reserves.
Metal prices used for Mineral Reserve estimation were determined as at April 2026 by the corporate finance department of Fortuna from market consensus. Metallurgical recoveries are based on metallurgical test work conducted on samples obtained since 2022.
Cut-off grades were determined based on all variable and fixed costs estimated for the Project. These include exploitation and treatment costs, general expenses, and administrative and commercialization costs (including doré transportation).
Mineral Reserves for the Diamba Sud Project reported as at April 10, 2026 are reported in Table 1.2.
| June 30, 2026 | Page 30 of 291 |
| | Diamba Sud Gold Project, Kédougou Region, Senegal Technical Report |
Table 1.2 Mineral Reserves for the Diamba Sud Project
| Category | Deposit | Tonnes (000) | Au (g/t) | Au (koz) |
| Probable | Area A | 4,136 | 1.59 | 211 |
| Area D | 5,103 | 1.70 | 279 | |
| Karakara | 2,859 | 1.87 | 172 | |
| Kassassoko | 1,164 | 0.96 | 36 | |
| Moungoundi | 1,069 | 1.10 | 38 | |
| Southern Arc | 4,464 | 2.31 | 332 | |
| Western Splay | 1,706 | 1.51 | 83 | |
| Total | 20,500 | 1.75 | 1,151 |
Notes to accompany Mineral Reserve table:
| · | Mr. Raul Espinoza, FAusIMM (CP), is the Qualified Person responsible for the Mineral Reserves estimate, and is a full-time employee of Fortuna. |
| · | Mineral Reserves are reported using the 2014 CIM Definition Standards. |
| · | Mineral Reserves are reported at the point of delivery to the process plant on a 100% ownership basis as at April 10, 2026. The State of Senegal is entitled to a 10% free-carried ownership interest in the operating entity when an exploitation permit is granted, and has the right to acquire up to an additional 25% contributory interest in the operating entity at a “fair price” as determined through an independent valuation. |
| · | Mineral Reserves have been estimated using incremental gold cut-off grades for open-pit oxide and transitional material as follows: 0.38 g/t Au for Area A, Moungoundi, and Western Splay; 0.37 g/t Au for Kassassoko and Southern Arc; 0.36 g/t Au for Karakara; and 0.35 g/t Au for Area D. For fresh material, the applied cut-off grades are 0.40 g/t Au for Karakara and Kassassoko, 0.42 g/t Au for Area A, 0.43 g/t Au for Southern Arc, 0.45 g/t Au for Moungoundi, 0.46 g/t Au for Area D, and 0.49 g/t Au for the Western Splay deposit. The cut-off grades were derived using a gold price assumption of $2,900/oz, metallurgical recovery rates ranging from 72% to 97% depending on grade and material type by deposit, and surface mining costs of $5.77/t for Area A, $5.26/t for Area D, $5.28/t for Karakara, $6.27/t for Western Splay, $6.09/t for Kassassoko, $6.18/t for Moungoundi, and $6.27/t for Southern Arc. Average processing and general and administrative (G&A) costs are estimated at $24.92/t milled for oxide and transitional material and $30.23/t for fresh material. Refining and selling costs are estimated at $5.50/oz of gold, with an applicable royalty rate of 3.5%. Pit slope angles of 32° for weathered material and 46° for fresh rock have been applied in the pit optimization. Metallurgical recoveries have been estimated using grade–recovery relationship models developed for oxide and transitional material across all deposits, with deposit-specific recovery models applied to fresh rock across the seven deposits. |
| · | Totals may not add due to rounding. |
Factors that may affect the estimates include metal price and exchange rate assumptions; changes to the assumptions used to generate the cut-off grades; geometallurgical assumptions; changes to geotechnical, hydrogeological, mining recovery, dilution, and metallurgical recovery assumptions; change to the input and design parameter assumptions that pertain to the conceptual open pit constraining the estimates; extent of artisanal mining; and assumptions as to the continued ability to access the site, retain mineral and surface rights titles, obtain and maintain environment and other regulatory permits, obtain Ministerial approval to initiate construction and exploitation, and maintain the social license to operate.
| 1.11 | Mining Methods |
Mining is proposed by conventional open pit mining methods and equipment, using the services of a mining contractor. Inferred Mineral Resources contained within the open pits have been treated as waste.
The proposed mining operations will cover seven deposits (Area A, Area D, Karakara, Kassassoko, Moungoundi, Southern Arc, and Western Splay). Area A and Area D will be
| June 30, 2026 | Page 31 of 291 |
| | Diamba Sud Gold Project, Kédougou Region, Senegal Technical Report |
combined to form a single pit mined in three stages, allowing early extraction of high-value oxide ore, predominantly from Area D. Southern Arc will be mined in three stages forming two separate pits. The Karakara pit will be mined in two stages to enable early access to fresh ore. Kassassoko, Moungoundi and Western Splay will each be mined as single stage pits.
The overall mining and production strategy will be to maintain a mill processing throughput of 2.0–2.5 Mt/a. The processing plant design capacity will be 2.0 Mt/a of fresh ore, with capacity to process up to 2.5 Mt/a where the blend is at least 63% fresh and 37% oxidized ore. The pits were sequenced to maximize the amount of oxide mined early in the schedule to optimize processing rate and cashflow early in the schedule. The mine life is estimated at 9.4 years. The ratio of waste to ore over the LOM is 6.3 to 1.
Drilling and blasting is planned for oxide, transitional and fresh ore and waste, followed by conventional excavator and truck operations within the pits for the movement of ore and waste. Free digging will be conducted in the oxide zones if practical, otherwise blasting has been assumed for all the weathering horizons. Bench heights for extraction of ore and waste material will be 5 m taken in two digging flitches of 2.5 m. Where possible in high waste stripping pit stages, 10 m bench heights will be used at an appropriate standoff distance from known mineralization.
Mining costs and equipment requirements were predominantly based on a request for pricing conducted in 2026. The mining equipment is proposed to be 120 t and 200 t excavators, along with 90 t haul trucks. The annual rate of mining movement will peak at 9 million bank cubic meters. A common pool of equipment will be used and scheduled across all of the active pits so that movement between the pits is minimized.
A tender process will be used to select the mining contractor.
Run of mine (ROM) material will be trucked from the pits to the ROM pad and reclaimed and loaded to the crusher feed bin using front-end loaders that will be operated by the mining contractor.
The QP is of the opinion that:
| · | The mining method proposed for the Diamba Sud Project is appropriate. |
| · | The open pit, stockpile, waste dump designs, and equipment fleet selection are appropriate to reach production targets. |
| · | The mine plan is based on successful mining philosophy and planning, and presents low risk. |
| · | The mobile equipment fleet presented is based on simulations and productivity data from suppliers. |
| · | All mine infrastructure and supporting facilities meet the needs of the proposed mine plan and production rate. |
| 1.12 | Processing and Recovery Methods |
The process plant design is based on a metallurgical flowsheet envisioned for the production of gold doré at optimum recovery while minimizing initial capital expenditure and operating costs. The flowsheet comprises a conventional crushing, milling, gravity recovery, a CIL, carbon elution and gold recovery circuit.
The key project design criteria for the plant are:
| June 30, 2026 | Page 32 of 291 |
| | Diamba Sud Gold Project, Kédougou Region, Senegal Technical Report |
| · | The process plant is designed to process oxide and fresh material from open pit mines. The treatment plant is designed to process 2.0 Mt/a of fresh ore or 2.5 Mt/a based on a blend of at least 63% fresh and 37% oxide ore. This flexibility will be achieved through the upgrading and sizing of key components, such as pipes and pumps, to support higher throughput, minimize potential bottlenecks, and ensure planned throughputs can be met. |
| · | Crushing plant availability of 75%. |
| · | Plant availability of 91.3% for grinding, gravity concentration, leach plant and gold recovery operations. |
The proposed process design consists of the following circuits:
| · | Primary jaw crushing of ROM material. |
| · | A surge bin and dead coarse ore stockpile to provide buffer capacity and operational flexibility between the crushing and grinding circuits. |
| · | Grinding circuit: single-stage SAG mill in closed circuit with cyclones. |
| · | Gravity recovery of cyclone underflow by a semi-batch centrifugal gravity concentrator, followed by intensive cyanidation of the gravity concentrate and electrowinning of the pregnant leach solution in a dedicated cell located in the gold room. |
| · | Trash screening and thickening of cyclone overflow prior to leaching. |
| · | Gold leaching in a CIL circuit. |
| · | Acid washing of loaded carbon and split AARL type elution followed by electrowinning and smelting to produce doré. Carbon regeneration by rotary kiln. |
| · | Disposal of tailings to a tailings storage facility (TSF). |
| 1.13 | Project Infrastructure |
The Project has sufficient surface area to accommodate all infrastructure requirements to support the open pit life-of-mine (LOM) and sufficient studies have been completed to ascertain reasonable locations for all major infrastructure to FS level.
The proposed TSF will be located approximately 5 km to the north of the process plant. The Stage 1 TSF has a design capacity of 2.4 Mt, sufficient to handle tailings for 12 months based on design production levels, expansion of the TSF has been designed annually thereafter. There is sufficient room for expansion of the TSF for the proposed LOM (20.5 Mt), based on the design production rates.
Power for the Project will be supplied through an integrated hybrid power solution comprising heavy fuel oil (HFO), solar photovoltaic, and battery energy storage system components. The HFO power generation component has been agreed with African Power Services, with integration of the solar farm and battery energy storage system targeted during the first year of operations. Senegal does not currently have a feasible grid connection within proximity of the Project.
| June 30, 2026 | Page 33 of 291 |
| | Diamba Sud Gold Project, Kédougou Region, Senegal Technical Report |
Under average conditions, water demand is estimated at 59 L/s. Approximately 80% of the water in the slurry deposited into the TSF can be recovered from the TSF and pumped back to the plant for re-use in the process.
The QP considers that all mine and process infrastructure and supporting facilities have been included in the general layout to ensure that they meet the needs of the mine plan and production rate.
| 1.14 | Market Studies and Contracts |
No market studies have been performed as part of this FS. Diamba Sud will produce gold doré, which is readily marketable on an ‘ex-works’ or delivered basis to several refineries in Europe and Africa. There are no indications of the presence of penalty elements that may impact on the price or render the product unsalable.
The long-term gold price used for estimating Mineral Reserves was $2,900/oz, based on the mean consensus prices from 2027 to 2029 of $4,041/oz weighted at 40% and a five-year historical average of $2,510/oz weighted at 60% and applied and adjustment price reduction of -$200/oz. An elevated gold price of $3,300/oz, using a 15% upside was used for Mineral Resource estimation. The economic analysis conducted in June 2026 used a base case gold price of $3,500/oz.
Contracts for early works are progressing for initial construction, initially for site access roads and new camps, and in evaluation tenders for key infrastructure such as the water storage dam and TSF.
The QP has reviewed the information provided by Fortuna on marketing, contracts, metal price projections and exchange rate forecasts and notes that the information provided support for the assumptions used in this Report and are consistent with the source documents, and that the information is consistent with what is publicly available within industry norms.
| 1.15 | Environmental Studies and Permitting |
The environmental and social baseline has been established for the Project with field studies undertaken by Earth Systems, an environmental and social science and engineering company based out of Australia and registered in Senegal since 2022, with support from Oryx Expertise in 2024, a specialized biodiversity consultancy firm. These studies have included those related to socio-economic conditions; land and water use; surface and groundwater resources; terrestrial and aquatic ecology and biodiversity; air quality, noise and vibration; climate change; traffic and transportation; as well as archaeology and cultural heritage.
Senegalese law requires an Environmental Permit be granted for the Diamba Sud Project before an Exploitation Permit can be obtained. Earth Systems was commissioned to prepare an Environmental and Social Impact Assessment (ESIA) in compliance with Senegalese regulatory requirements, and in accordance with international best practices such as the Equator Principles and International Finance Corporation (IFC) Performance standards.
The ESIA identifies and assesses the potential impacts of the Project and develops environmental and social management plans designed to mitigate impacts and enhance local benefits, such as environmental and social management plan, stakeholder engagement plan, capacity building plan, livelihood restoration program, mine
| June 30, 2026 | Page 34 of 291 |
| | Diamba Sud Gold Project, Kédougou Region, Senegal Technical Report |
rehabilitation and closure plan and a voluntary environmental and social investment program.
Regular consultations with Senegalese government authorities, local communities and other stakeholders have been conducted since the start of the Project to ensure that stakeholders' interests are taken into account in the planning and development of the Project.
The ESIA was submitted to the Direction de la Réglementation Environnementale et du Contrôle (DiREC), a division of the Ministry of the Environment and Ecological Transition of Senegal on October 6, 2025 and on June 11, 2026 Boya received a formal Decree which approved the ESIA for the Diamba Sud Project (Decree n°011251 of 22/05/2026 granting the Environmental and Social Compliance Certificate for the Diamba Sud gold project).
In parallel with this ESIA process, Boya undertook FS works on the Diamba Sud Project as described in this Report. The FS resulted in two material design changes to the initial Project design covered by the ESIA. The following new infrastructures added by the FS to the Project design are:
| · | The airstrip, to be located immediately north of Diamba Sud permit; |
| · | The solar photovoltaic power plant, to be located immediately south of the processing plant. |
These two new components are expected to require additional environmental and social permitting i.e., impact studies or notices. Relevant national authorities including DiREC have been contacted to clarify the permitting pathway, with permitting deemed feasible and planned to start in the second half of 2026.
| 1.16 | Capital and Operating Costs |
The capital cost estimate for the Diamba Sud Project is based on an engineering, procurement, and construction management (EPCM) execution strategy, under which the Owner assumes overall project delivery risk. The estimate is considered to have an accuracy range of ±15%, consistent with a feasibility study level estimate.
The total initial capital cost is estimated at $397.5 million as shown in Table 1.3, comprising $181.7 million for the process plant, prepared by Lycopodium Minerals Canada Ltd. (Lycopodium), and $215.8 million of Owner’s capital (net of sunk capital), developed by Fortuna with support from Knight Piésold and other consultants.
Table 1.3 Summary of Capital Costs
| Capital Cost ($M) | |
| Construction costs | 284.6 |
| Pre-production costs (excluding mining) | 37.7 |
| Mining pre-stripping | 34.4 |
| Contingency (8%) | 33.7 |
| Witholding taxes, duties, levies | 7.0 |
| Total | 397.5 |
Note: numbers may not sum due to rounding
| June 30, 2026 | Page 35 of 291 |
| | Diamba Sud Gold Project, Kédougou Region, Senegal Technical Report |
The capital cost estimate is based primarily on vendor quotations for major equipment and consumables, supplemented by first principles estimating, recent tender pricing, and benchmarking against comparable projects in West Africa and Senegal.
Operating costs, including mining, processing and general and administrative (G&A) costs, are estimated at $59.4/t of ore milled, equivalent to $1,146 per payable ounce of gold sold over the LOM. The LOM operating cost summary is shown in Table 1.4.
Table 1.4 Life of Mine Operating Costs
| Operating Cost | $M | $/t milled | $/payable oz |
| Mining** | 699 | 34.12 | 664 |
| Processing | 330 | 16.09 | 313 |
| G&A | 177 | 8.65 | 168 |
| Total operating costs excluding Royalties and Social Fund | 1,207 | 58.86 | 1,146 |
| Refining | 3 | 0.15 | 3 |
| Royalties* | 111 | 5.39 | 105 |
| Social Fund* | 18 | 0.90 | 18 |
| Total Operating costs including Royalties and Social Fund | 1,339 | 65.30 | 1,272 |
*The FS assumes a 3% royalty payable to the State and 0.5% contribution to a Social Development Fund **Mining $/t milled includes pre-production ore tonnes mined (314,840 tonnes) | |||
All-in sustaining costs (AISC), including sustaining capital, closure, royalties and refining, are estimated at $1,322 per payable ounce of gold sold. Sustaining capital costs are shown in Table 1.5.
Table 1.5 Summary of Sustaining Capital Costs over LOM
| Project ($M) | Y1 | Y2 | Y3 | Y4 | Y5 | Y6 | Y7 | Y8 | Y9 | Y10 | Total |
| TSF lifts | 10.7 | - | 8.1 | - | 8.8 | - | 3.8 | - | - | - | 31.5 |
| Aerodrome | 5.0 | - | - | - | - | - | - | - | - | - | 5.0 |
| Roads | - | 1.7 | 0.5 | - | 0.7 | - | 0.4 | - | - | - | 3.3 |
| Surface water management | - | 0.4 | 0.8 | - | 0.9 | - | - | - | - | - | 2.1 |
| Photovoltaic + battery energy storage system | 16.4 | - | - | - | - | - | - | - | - | - | 16.4 |
| Fuel farm | 0.8 | 0.8 | 0.8 | 0.8 | 0.8 | 0.8 | 0.8 | - | - | - | 5.8 |
| Total ($ M) | 32.9 | 2.9 | 10.2 | 0.8 | 11.2 | 0.8 | 5.1 | - | - | - | 64.0 |
The capital and operating cost estimates are considered appropriate for a feasibility study level and reflect prevailing cost conditions in West Africa.
| 1.17 | Economic Analysis |
The Diamba Sud Project was evaluated on a discounted cash flow (DCF) basis. The economic analysis assumes that Fortuna will provide all development funding via inter-company and shareholder loans to the mine operating entity, which will be repaid with interest from future gold sales.
The pre-tax net present value (NPV) with a 5% discount rate (NPV5%) is $1,379 million and with an internal rate of return (IRR) of 70% using a base gold price of $3,500/oz.
The economic analysis is based on the key assumptions summarized in Table 1.6.
| June 30, 2026 | Page 36 of 291 |
| | Diamba Sud Gold Project, Kédougou Region, Senegal Technical Report |
Table 1.6 Key Economic Model Assumptions
| Parameter | Units | Value |
| Gold Price | $/oz | 3,500 |
| Mill Recovery | % | 91 |
| Power Price | $/kWh | 0.13 |
| Base Case Discount Rate | % | 5 |
| Exchange Rate | ||
| West African Franc to US dollar | x | 0.0018 |
| Royalty | ||
| Government | % | 3.0 |
| Social Fund | % | 0.5 |
| Investment Tax Credit | % | 40 |
The post-tax Project NPV5% is $1,009 million, with an IRR of 60% and a payback period of one year at a gold price of $3,500/oz. The payback period is defined as the time after process plant start-up that is required to recover the initial expenditures incurred developing the Diamba Sud Project.
A summary of the results of the economic analysis are provided in Table 1.7.
Table 1.7 Economic Analysis Summary
| Metrics | Units | Results |
| Gold price | $/oz | 3,500 |
| Life of mine | year | 9.4 |
| Total ore mined1 | Mt | 20.5 |
| Contained gold in ore mined1 | koz | 1,151 |
| Strip ratio | w:o | 6.3:1 |
| Throughput (oxide) | Mt/a | 2.5 |
| Throughput (fresh) | Mt/a | 2.0 |
| Head grade | g/t Au | 1.75 |
| Recovery | % | 91 |
| Gold production | ||
| Total production over LOM | koz | 1,053 |
| Average annual production, LOM | koz | 116 |
| Average annual production, first 4 years | koz | 158 |
| Per unit costs over LOM | ||
| Total mining costs | $/t, mined | 4.8 |
| Processing | $/t, processed | 16.1 |
| G&A | $/t, processed | 8.6 |
| Cash costs 2 | ||
| Average operating cash costs2, LOM | $/oz | 1,146 |
| Average operating cash costs2, first 4 years | $/oz | 856 |
| AISC2 | ||
| Average AISC2, LOM | $/oz | 1,332 |
| Average AISC2, first 4 years | $/oz | 1,056 |
| Capital costs | ||
| Initial capital expenditure | $ M | 398 |
| Sustaining capital, operations + Infrastructure (includes closure costs) | $ M | 79 |
| NPV5%, pre-tax (100% project basis) | $ M | 1,379 |
| Pre-tax IRR | % | 70 |
| NPV5%, after-tax (100% project basis) | $ M | 1,009 |
| After-tax IRR | % | 60 |
| Payback period | years | 1 |
| Annual EBITDA 2 | ||
| Average EBITDA2 over LOM | $ M | 258 |
| Average EBITDA2 over first 4 years | $ M | 398 |
| June 30, 2026 | Page 37 of 291 |
| | Diamba Sud Gold Project, Kédougou Region, Senegal Technical Report |
Notes:
| 1. | The pit optimization shells used for the Mineral Reserves were generated using a gold price of $2,900/oz. |
| 2. | This is a non-IFRS financial measure. The definition and purpose of this non-IFRS financial measure is included under the heading “Cautionary Note on Non-IFRS Measures” in this news release. Non-IFRS financial measures have no standardized meaning under the International Financial Reporting Standards (IFRS) and therefore, may not be comparable to similar measures presented by other issuers. |
| 3. | Average operating cash costs and average AISC represent costs for projected production for the LOM at the time of gold sales. |
| 4. | The FS is presented on a 100% project basis. However, upon the granting of the exploitation permit, the State of Senegal is entitled to a 10% free-carried ownership interest in the operating entity, and has the right to acquire up to an additional 25% contributory interest in the operating entity at a “fair price” as determined through an independent valuation. |
| 5. | The economic analysis was carried out using a discounted cash flow approach on a pre-tax and after-tax basis, based on a gold price of $3,500/oz. |
| 6. | The IRR on total investment that is presented in the economic analysis was calculated assuming a 100% ownership in Diamba Sud. |
| 7. | The NPV was calculated from the after-tax cash flow generated by the Project, based on a discounted rate of 5%. |
| 8. | The FS assumes that the percentage of certain royalties and taxes payable to the State, the percentage of the investment tax credit available to the operating entity. and the percentage payable to the social development fund will be in accordance with the provisions of the Mining Convention between Boya S.A. and the State of Senegal dated April 8, 2015. There can be no assurance that such provisions will not be renegotiated by the State as part of the exploitation permit approval process. The pit optimization shells used for the Mineral Reserves were generated using a gold price of $2,900/oz. |
| 1.18 | Conclusions |
The FS was based on Mineral Reserves that have been estimated using industry-recognized methods, and estimated operational costs, capital costs, and plant performance data. The economic analysis indicates a positive cash flow using the assumptions and parameters detailed in this Report.
| 1.19 | Risks and Opportunities |
A number of opportunities and risks were identified by the QPs.
| 1.19.1 | Exploration |
Opportunities include:
| · | Significant exploration upside at Southern Arc. |
| · | Untested prospective targets across the broader Diamba Sud tenement package. |
| · | Continuation of geological interpretation and modelling to improve understanding of the Diamba Sud deposits and to identify additional drill targets |
| 1.19.2 | Mineral Reserve Estimation, Mining and Cost Assumptions |
Opportunities include:
| · | Optimization of stockpile management and blending strategies to support consistent throughput and recovery performance. |
| · | Optimization of mine design and scheduling to potentially enhance operational efficiency through ongoing engineering and design work. |
| · | Refinement of grade control and short-term mine planning to reduce dilution and improve mill feed management. |
| June 30, 2026 | Page 38 of 291 |
| | Diamba Sud Gold Project, Kédougou Region, Senegal Technical Report |
| · | Optimization of stockpile management and blending strategies to support consistent throughput and recovery performance. |
| · | Optimization of mining contractor execution strategies, fleet selection, and productivity assumptions to reduce mining costs and improve schedule certainty. |
| · | Improvements in logistics, procurement, and construction execution through early works planning and early contractor involvement. |
| · | Refinement of operational readiness planning, including recruitment, training, maintenance systems, inventory management, and commissioning procedures. |
| · | Reduction in capital costs through the selected process plant EPCM contractor, alternative equipment suppliers, and subcontractor procurement strategies will be assessed during the execution phase. |
Risks Include:
| · | Changes to mining dilution, ore loss and grade control assumptions: actual mining performance may vary from mine plan assumptions due to orebody complexity, selective mining constraints, dilution, ore loss, grade control performance, and reconciliation outcomes. Mitigation includes detailed grade control drilling, ore/waste delineation, reconciliation processes, and ongoing mine planning optimization. |
| · | Material cost increases and inflation: global inflation and supply chain pressures could impact capital and operating costs. Mitigation includes proactive cost tracking, early contractor engagement, and appropriate contingencies within cost estimates. Advancing detailed mining studies and investment decision timeline is also expected to help limit exposure to inflationary pressures. |
| · | Long lead times for critical equipment: extended procurement and delivery times for key mechanical and power generation equipment pose schedule risks. Mitigation measures include early identification, prioritization, and ordering of long-lead items during future more detailed studies. |
| 1.19.3 | Metallurgical and Processing |
Opportunities include:
| · | Optimization of the process flowsheet to enhance recoveries and operating efficiencies through ongoing engineering and design work. |
| 1.19.4 | Geotechnical and hydrogeological |
Risks include:
| · | Changes to the geotechnical, hydrogeological and water management assumptions: actual ground and water conditions may differ from design assumptions, particularly in weathered materials, structurally controlled zones, and during the wet season. Mitigation includes continued geotechnical and hydrogeological monitoring, dewatering planning, surface water controls, pit mapping, slope monitoring, and adaptive water balance management. |
| 1.19.5 | Environmental, Permitting and Tax Assumptions |
Opportunities include:
| June 30, 2026 | Page 39 of 291 |
| | Diamba Sud Gold Project, Kédougou Region, Senegal Technical Report |
| · | Enhancement of the positive socio-economic impacts of the Project by developing partnerships with local institutions, such as for local employment. |
Risks include:
| · | On time completion of the environmental and social permitting for the new Project design components (airstrip and solar farm) of the added in the FS. |
| · | Delays in the grant of the Exploitation Permit: Project development remains dependent on the exploitation permit grant. Delays, conditions, or changes arising through the exploitation permit approval process could affect the Project schedule, development scope, fiscal terms, and execution strategy. |
| · | Changes to local content compliance: the evolving implementation of Senegal’s local content regulations may affect contracting and recruitment. Mitigation includes ongoing regular engagement with authorities, maintaining strong relationships with relevant government parties, dedicated local content specialists, and early alignment of procurement and staffing strategies to ensure compliance. |
| · | Changes to tax and royalty assumptions: certain taxes and royalties included in the economic analysis have been based upon the provisions included in the Mining Convention between Boya and the State of Senegal dated April 8, 2015, and in the 2003 Mining Code. The State retains the sovereign prerogative to review or revisit certain fiscal terms, including among others royalties and taxes payable, during the exploitation permit approval process, and as such, the current framework may be subject to amendment. |
| · | Interest of the State of Senegal in the Operating Entity: upon the grant of the exploitation permit, the State of Senegal is entitled to a 10% free-carried interest in the operating entity. In addition, the State has the right to acquire, up to an additional 25% contributory interest in the operating entity at a fair price determined through an independent valuation. The percentage and timing of any such additional contributory interest remain to be confirmed following negotiations with the State. There can be no assurance that the State’s interest will remain limited to 10%. The economic analysis presented in this Report is on a 100% Project basis. |
| 1.20 | Recommendations |
The following recommendations outline the key activities required to advance the Diamba Sud Project. The focus is on resource expansion and infill, technical de-risking, design optimization, and confirmation of environmental, permitting, and social frameworks. The next phase of work is broken into activities relating to exploration, growth and infill, and those optimizing and advancing technical studies to support project development. All recommended programs are independent and may be executed concurrently unless otherwise stated.
| 1.20.1 | Exploration |
An exploration and infill drilling program is recommended to expand the existing deposits that have not been fully defined and potentially support upgrading of Inferred Mineral Resources to higher confidence categories.
Key priorities for the exploration program include:
| June 30, 2026 | Page 40 of 291 |
| | Diamba Sud Gold Project, Kédougou Region, Senegal Technical Report |
| · | Ongoing step-out and expansion drilling at the Southern Arc and Moungoundi deposits. |
| · | Continued infill drilling at the Moungoundi, Southern Arc, Area A, Area D and Karakara deposits to potentially support upgrades in Mineral Resource classification and improve geological confidence. |
| · | Continuing regional auger, geochemical, and geophysical surveys across the Diamba Sud permit to generate new drill targets. |
| · | Detailed structural mapping and surface sampling of untested high-priority targets to refine the geological model and guide future drill programs. |
The budget to execute the exploration and infill program is estimated at approximately $10.1 million based on current contracted drill rates (average $215 per meter for diamond drilling and $65 per meter for reverse circulation drilling) and in-country expenses. The program for 2026 includes, but is not limited to:
| · | 11,300 m of infill and resource extension drilling (RC and core) across the Project area, guided by the objective of growing Mineral Resources and provision for advancing emerging prospects. |
| · | 24,000 m of target generation RC and core drilling at Gamba Gamba, Moungoundi North, and other emerging targets generated from 2025 auger and geophysical campaigns, as well as deep stratigraphic diamond core drilling to validate certain geological concepts and to examine likely geological targets for underground mining potential. |
| 1.20.2 | Geotechnical |
The geotechnical recommendations focus on supporting project execution planning and operational readiness for the proposed open pits. The emphasis should be on verifying the current slope design assumptions, improving confidence in structural and hydrogeological controls, and establishing the operational practices required to safely maintain pit wall performance during mining.
Recommended activities include:
| · | Update the site-wide structural and geotechnical models progressively as additional information becomes available from ongoing drilling programs and geotechnical logging. Model updates should be reviewed at least annually during active drilling and mining activities, or more frequently where material new structural, geotechnical, or hydrogeological information is identified. The updated models should incorporate major faults and relevant structural domains and be used to support periodic geotechnical stability reviews, confirming that pit slope performance is not adversely affected by the interaction of these structures with the existing rock mass fabric. |
| · | Continue full geotechnical logging in selected exploration and infill drill holes across the proposed open pits and any potential future deposits, including point load index testing and installation of piezometers where appropriate. |
| · | Maintain rig-based geotechnical logging practices where practical to preserve core integrity and improve the quality of structural and rock mass data collected from selected holes. |
| June 30, 2026 | Page 41 of 291 |
| | Diamba Sud Gold Project, Kédougou Region, Senegal Technical Report |
| · | Collect targeted laboratory samples, where additional data are required, to confirm intact rock, joint, and saprolite strength parameters for slope design verification and future optimization. |
| · | Continue to improve the understanding of groundwater conditions within the pit walls and surrounding areas through piezometer monitoring and integration with pit dewatering planning. |
| · | Ensure that surface water management controls are incorporated into pit development planning, particularly to limit ponding and degradation of duricrust and saprolite units during the wet season. |
| · | Provide for controlled blasting, scaling, crest cleaning, and periodic berm maintenance in the pit operating plans, particularly where narrow berm designs are used in bedrock. |
| · | Include provision in the capital and operating budgets for specialized scaling equipment, trained operators, and appropriate geotechnical supervision during mining. |
| · | Once pit benches are exposed, conduct routine geotechnical mapping to collect structural data, including structure type, orientation, continuity, infill, thickness, roughness, and condition. This information should be used for design reconciliation, slope performance monitoring, and assessment of future slope optimization opportunities. |
These activities are intended to validate the geotechnical assumptions used in the FS, support detailed pit engineering and execution planning, and establish the monitoring and operational controls required for safe mining. The ongoing collection of geotechnical, structural, and hydrogeological data will provide the basis for slope design verification, pit wall performance assessment, and future optimization as mining advances. Provision has been included in the operating cost estimate for dedicated geotechnical support during mining, comprising a senior geotechnical engineer, a geotechnical engineer and five geotechnical technicians. This work is expected to be completed internally using the aforementioned personnel and is not expected to result in additional expenditures beyond normal projected staffing costs of $0.8 million per annum.
| 1.20.3 | Water Management |
The Gamba Gamba Creek, also referred to as the Karakara watercourse, has been confirmed as the primary raw water source for the Project. Continuous monitoring of surface water flows should continue, with regular water balance and hydrological model updates to improve the dataset, validate catchment performance, and increase confidence in long-term water availability.
Additional hydrogeological drilling should continue near the proposed water storage dam to identify and confirm local aquifers that may provide backup and make-up water supplies for the Project. The program is expected to include approximately 10 priority targets, with 10 to 20 holes planned depending on whether suitable aquifers are intersected during drilling. Further drilling, pump testing, and technical assessment should also be completed for the Western Splay, Kassassoko, Southern Arc, and Moungoundi pits to improve confidence in groundwater conditions and refine pit dewatering requirements. The estimated cost for this hydrogeological drilling, pump testing and assessment is estimated to be approximately $1.0 million.
| June 30, 2026 | Page 42 of 291 |
| | Diamba Sud Gold Project, Kédougou Region, Senegal Technical Report |
Updated hydrological and hydrogeological data should be incorporated into the site water balance, pit dewatering plans, and surface water management designs as the Project advances. These activities are intended to improve confidence in the long-term raw water supply, refine pit dewatering assumptions, and reduce water supply and water management risks during project execution. This work is expected to be completed using in-house resources and part of normal operating costs for Fortuna’s West Africa regional office.
| 1.20.4 | Metallurgical |
Additional metallurgical testwork has been completed on the Southern Arc and Moungoundi deposits under conditions aligned with the process design criteria, including bottle roll leaching, BLEG, and supporting variability testwork. The results indicate that the mineralization is amenable to conventional cyanidation and consistent with the established processing route.
While the current metallurgical testwork is considered sufficient to support the FS level process design and recovery assumptions, it is recommended that further metallurgical testwork be completed on Southern Arc, Moungoundi, Western Splay and Kassassoko during FEED and detailed design. This additional work should increase confidence in recovery estimates, confirm variability across ore types, and further validate the proposed processing assumptions for these deposits.
The future testwork should focus on variability under plant-representative conditions, including grind size, leaching kinetics, and carbon adsorption behavior, to further validate process performance and support ongoing optimization. The estimated cost for this metallurgical testwork is estimated to be approximately $0.2 million.
| 1.20.5 | Environmental and Social |
During the evolution of project design from PEA to FS level, two new material changes have been made: the inclusion of an airstrip and photovoltaic solar plant. As the existing ESIA is based on the PEA design, these two new components should be permitted in environmental and social terms i.e., through impact assessments or impacts notices. Relevant national authorities including DiREC have been contacted to clarify the permitting pathway, with permitting deemed feasible and planned to start in the second half of 2026.
It is also recommended to use the next Project stage to continue optimizing the Project by reducing its environmental footprint and potential impacts while enhancing opportunities for local communities where possible. This work is expected to be completed using in-house resources and part of normal operating costs for Fortuna’s West Africa regional office.
| 1.20.6 | Engineering Studies |
It is recommended that the following engineering and project execution activities continue to be advanced to support the transition from the FS into project execution:
| · | Process plant FEED and detailed design. An early works allowance of approximately $2.0 million is recommended and has been advanced in parallel with completion of this FS to progress FEED and detailed design for the process plant while the Project awaits a final investment decision to commit to the full capital amount of approximately $397.5 million indicated in this Report. This scope is intended to advance engineering definition sufficiently to support the placement of orders for long-lead equipment and materials, maintain project momentum, and reduce schedule risk ahead of full project approval. |
| June 30, 2026 | Page 43 of 291 |
| | Diamba Sud Gold Project, Kédougou Region, Senegal Technical Report |
| · | Long-lead procurement support. The early works scope should include vendor engagement, technical evaluation of long-lead items, preparation of procurement packages, and support for the timely placement of purchase orders where appropriate. This work is intended to preserve the project schedule and reduce exposure to extended equipment delivery periods. This work is expected to be completed using in-house resources and part of normal operating costs for Fortuna’s West Africa regional office. |
| · | Issued-for-construction documentation, site infrastructure design, and execution readiness. FEED and detailed design should continue to progress toward issued-for-construction documentation where applicable, including engineering development, project controls, procurement support, construction planning, commissioning readiness, Owner’s engineering, and technical supervision. In parallel, detailed design and issued-for-construction drawings and documentation for key site infrastructure should continue to be advanced, including the water storage dam, tailings storage facility, site roads, surface water management infrastructure, and associated construction supervision and engineering support. The estimated cost for this infrastructure engineering and construction support scope is approximately $2.5 million. |
| · | Owner’s engineering and project controls. Owner’s engineering support should be maintained to provide technical oversight, interface management, cost and schedule control, quality assurance, and coordination between the process plant, site infrastructure, procurement, and construction workstreams. This work is expected to be completed using in-house resources and part of normal operating costs for Fortuna’s West Africa regional office. |
| · | Operational readiness planning and implementation. A detailed operational readiness plan and implementation program should be developed and progressively implemented during FEED studies and project execution. This program should define the systems, personnel, procedures, training, maintenance strategies, spares and warehouse requirements, commissioning support, HSEC readiness, and handover requirements needed to support a safe and efficient transition from construction into operations. An allowance of approximately $3.0 million is recommended for this operational readiness program. |
| · | Project execution, permitting, procurement, and cost control. The Project execution plan, permitting register, procurement strategy, construction schedule, cost control framework, and risk and opportunity register should continue to be updated through FEED and project execution. This work should include confirmation of remaining permits and approvals, local content compliance requirements, long-lead procurement status, contractor readiness, capital cost updates, contingency, escalation assumptions, and execution schedule risks prior to final investment decision. This work is expected to be completed using in-house resources and part of normal operating costs for Fortuna’s West Africa regional office. |
| June 30, 2026 | Page 44 of 291 |
| | Diamba Sud Gold Project, Kédougou Region, Senegal Technical Report |
| 2 | Introduction |
| 2.1 | Report Purpose |
This Technical Report (the Report) was prepared by Mr. Eric Chapman, P.Geo., Mr. Paul Weedon, MAIG, Mr. Raul Espinoza, FAusIMM (CP), Mr. Mathieu Veillette, P.Eng., and Mr. Ruan Venter, P.Eng., for Fortuna Mining Corp. (Fortuna) on the Diamba Sud Project (the Project).
The Project is located in the east of Senegal, close to the border of Mali (Figure 2.1).
Figure 2.1 Map Showing the Location of the Diamba Sud Project
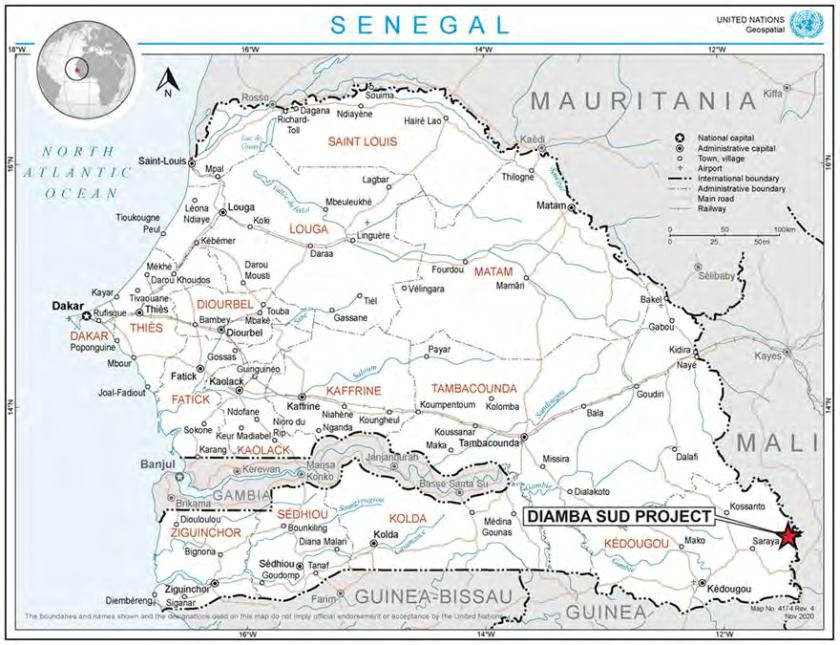
Figure prepared by Fortuna, 2024, sourced from Senegal - Geospatial, location data for a better world
The Diamba Sud Project is operated by Boya S.A. (Boya), a company incorporated, registered, and operating in accordance with the laws of Senegal, which is a 100% indirectly wholly-owned subsidiary of Fortuna. Upon the grant of an exploitation permit to Boya, the State of Senegal will require Boya to designate and incorporate a new entity
| June 30, 2026 | Page 45 of 291 |
| | Diamba Sud Gold Project, Kédougou Region, Senegal Technical Report |
to hold the exploitation permit and operate the Diamba Sud Project. The State of Senegal is entitled to a 10% free carried ownership interest in the operating entity, and Fortuna will indirectly hold the remaining 90% interest. In addition, the State has the right to acquire up to an additional 25% contributory interest in the operating entity at a “fair price” as determined through an independent valuation. The percentage and timing of any such additional contributory interest is subject to negotiation with the State. There can be no assurance that the State’s interest will remain limited to 10%.
The Report discloses the results of a feasibility study (FS) based on Mineral Reserve estimates for the Diamba Sud Project.
Mineral Resources and Mineral Reserves are reported using the 2014 Canadian Institute of Mining, Metallurgy and Petroleum (CIM) Definition Standards - for Mineral Resources and Mineral Reserves (the 2014 CIM Definition Standards). The estimates were prepared with reference to the 2019 CIM Estimation of Mineral Resources and Mineral Reserves Best Practice Guidelines (CIM 2019 Guidelines).
Costs are in US dollars (US$) unless otherwise indicated.
| 2.2 | Qualified Persons |
The following Qualified Persons are responsible for the preparation of this Report:
| · | Mr. Eric Chapman, P.Geo., Senior Vice President of Technical Services – Fortuna Mining Corp. |
| · | Mr. Paul Weedon, MAIG, Senior Vice President of Exploration – Fortuna Mining Corp. |
| · | Mr. Raul Espinoza, FAusIMM (CP), Director of Technical Services – Fortuna Mining Corp. |
| · | Mr. Mathieu Veillette, P.Eng., Director, Geotechnical, Tailings and Water – Fortuna Mining Corp. |
| · | Mr. Ruan Venter, P.Eng., Manager of Process - Lycopodium (Americas) Ltd. |
| 2.3 | Scope of Personal Inspection |
| 2.3.1 | Mr. Eric Chapman |
Mr. Eric Chapman most recently visited the Project from March 23–25, 2026. During his site visit Mr. Chapman reviewed data collection, drill core, storage facilities, database integrity, procedures, and geological model construction. Discussions on geology and mineralization were held with Boya personnel, and field site inspections were performed including inspection drill core and operating surface drill machines. He worked with site geological personnel reviewing aspects of data storage (database) and analytical quality control.
| 2.3.2 | Mr. Paul Weedon |
Mr. Paul Weedon visited the Project on multiple occasions since 2023, most recently from June 18–24, 2026. During these visits, Mr. Weedon reviewed drilling performance, sample and data collection, site quality assurance and quality control (QA/QC) records and geological model development for the Diamba Sud mineralization.
| June 30, 2026 | Page 46 of 291 |
| | Diamba Sud Gold Project, Kédougou Region, Senegal Technical Report |
| 2.3.3 | Mr. Mathieu Veillette |
Mr. Mathieu Veillette most recently visited the property from March 23–25, 2026 when he performed a field visit to the open pits, the proposed location of the tailings storage facility (TSF), waste rock storage facilities (WRSFs), open pits, and water management facilities. He also reviewed geotechnical and hydrogeological data collections and discussed with Boya site personnel, as well as design aspects of the TSFs, WRSFs, open pits, and water management.
| 2.3.4 | Mr. Raul Espinoza |
Mr. Raul Espinoza most recently visited the property from March 23–25, 2026. During his site visit, Mr. Espinoza reviewed the location of the planned open pits and confirmed the applicability of the proposed mining methods, current site access and planned layout of site infrastructure. In addition, the Mineral Reserve estimation methodology was reviewed with Boya mining engineers and project consultants. Operating costs assumptions and capital expenditure requirements were also discussed and reviewed with the project team.
| 2.3.5 | Mr. Ruan Venter |
Mr. Ruan Venter most recently visited the property from March 23–25, 2026 when he performed a field visit to the open pits, the proposed TSF, WRSFs, open pits and water management facilities locations. He also reviewed core samples and metallurgical sample drilling location for Southern Arc and Moungoundi pits. He discussed the proposed process plant design and layout with Boya personnel.
| 2.4 | Effective Dates |
The Report has a number of effective dates, as follows:
| · | January 16, 2026: date of database cut-off for assays used in the Mineral Resource estimate for the Diamba Sud Project. |
| · | April 10, 2026: date of the Mineral Resource and Mineral Reserve estimate. |
| · | June 29, 2026: date of the economic analysis in the FS. |
| · | June 30, 2026: date to which drilling has been reported. |
The overall effective date of the Report is the date of the most recent supply of information on the ongoing drilling program, and the date of the FS, which is June 30, 2026.
| 2.5 | Previous Technical Reports |
Fortuna has previously filed a technical report on the Diamba Sud Project, as follows:
| · | Chapman, E.N., Weedon, P., Espinoza R., Veillette, M., & Lorenzen, L., 2025. Technical Report on the Diamba Sud Gold Project, Kédougou Region, Senegal, prepared for Fortuna Mining Corp., effective date October 15, 2025. |
| 2.6 | Information Sources and References |
Reports and documents listed in Section 27 of this Report were used to support preparation of the Report. Additional information was provided to the QPs by Boya and other consultants in their areas of expertise.
| June 30, 2026 | Page 47 of 291 |
| | Diamba Sud Gold Project, Kédougou Region, Senegal Technical Report |
| 2.7 | Acronyms |
The more commonly-used acronyms used in the Report are detailed in Table 2.1.
Table 2.1 Acronyms
| Acronym | Description |
| Au | gold |
| cm | centimeters |
| COG | cut-off grade |
| g | grams |
| g/t | grams per tonne |
| ha | hectares |
| kg | kilograms |
| km | kilometers |
| kV | kilovolts |
| kW | kilowatts |
| L | liter |
| LOM | life-of-mine |
| m | meters |
| Ma | millions of years |
| masl | meters above sea level |
| Moz | million troy ounces |
| Mn | manganese |
| Mt | million metric tonnes |
| MVA | megavolt ampere |
| MW | megawatt |
| n/a | not applicable |
| NI | national instrument |
| nr | not recorded |
| NSR | net smelter return |
| OK | ordinary kriging |
| oz | troy ounce |
| ppm | parts per million |
| psi | pounds per square inch |
| QAQC | quality assurance/quality control |
| RMR | rock mass rating |
| RQD | rock-quality designation |
| s | second |
| t | metric tonne |
| t/m3 | metric tonnes per cubic meter |
| tpd | metric tonnes per day |
| tph | metric tonnes per hour |
| yd | yard |
| yr | year |
| US$/t | United States dollars per tonne |
| US$/g | US dollars per gram |
| US$/% | US dollars per percent |
| June 30, 2026 | Page 48 of 291 |
| | Diamba Sud Gold Project, Kédougou Region, Senegal Technical Report |
| 3 | Reliance on Other Experts |
The QPs have not independently reviewed ownership of the Diamba Sud Project or any underlying agreements, mineral tenure, or surface rights. The QPs have fully relied upon, and disclaim responsibility for, information derived from Fortuna and legal experts retained by Fortuna for this information through the following documents:
| · | Fall Maname., 2026. Legal Opinion prepared by Societe de Conseils Juridiques et Fiscaux for Fortuna dated January 7, 2026, 11 p. |
The information is used in Sections 4.1 and 4.2. The information is also used in support of the Mineral Resource estimate in Section 14 and the Mineral Reserve estimate in Section 15.
| June 30, 2026 | Page 49 of 291 |
| | Diamba Sud Gold Project, Kédougou Region, Senegal Technical Report |
| 4 | Property Description and Location |
The Diamba Sud Project is located within the Department of Saraya in the Kédougou Region and within the Arrondissement of Bembou.
The Project is situated approximately 50 km north of the Senegal-Guinea border and approximately 7 km to the west of the Falémé River which, in this region, defines the international border between Senegal and Mali. The Project is approximately 665 km southeast of the Senegalese capital Dakar and 83 km northeast of the nearest town, Kédougou.
The Diamba Sud exploration camp is located within the permit area and centered upon co-ordinates 11° 27’ 58.73” W and 12° 55’ 5.04” N. All field activities are managed from that camp.
| 4.1 | Ownership |
The Project is owned 100% by Fortuna. Fortuna acquired the Project pursuant to its acquisition of Chesser Resources Ltd. (Chesser) in September 2023. The Project is operated by Boya S.A. (Boya), a 100% indirectly owned subsidiary of Fortuna.
Upon the grant of an exploitation permit to Boya, the State of Senegal will require Boya to designate and incorporate a new entity to hold the exploitation permit and operate the Diamba Sud Project. The State of Senegal will assume a 10% free carried ownership interest in the operating entity, and Fortuna will indirectly hold the remaining 90% interest. In addition, the State has the right to acquire up to an additional 25% contributory interest in the operating entity at a “fair price” as determined through an independent valuation. The percentage and timing of any such additional contributory interest is subject to negotiation with the State. There can be no assurance that the State’s interest will remain limited to 10%.
| 4.2 | Mineral Tenure and Surface Rights |
| 4.2.1 | History of the Mining Code |
Senegalese mining law provides that all mineral resources are administered by the Senegalese Ministry of Mines. A new mining code “Law No. 2016-32” (the “2016 Mining Code”) was passed by the Senegal Parliament on November 8, 2016, and published in the Official Journal on November 24, 2016. It was implemented by Decree No. 2017-458 which came into effect on March 20, 2017. The 2016 Mining Code applies to new applications for mining permits, while the previous mining law (Law No. 2003-36) effective as of November 24, 2003 (the “2003 Mining Code”) remains applicable to existing mining permits until their expiry as provided under Article 141 of the 2016 Mining Code as follows:
“Mining titles granted before the date of entry into force of this code remain subject, for the duration and for the substances for which they were issued, to the law and regulations applicable to them on the date of entry into force of this code. (…) Holders of mining conventions linked to a mining title signed prior to the date of entry into force of the present code remain subject to the stipulations contained in the said conventions for the entire duration of their validity.”
| June 30, 2026 | Page 50 of 291 |
| | Diamba Sud Gold Project, Kédougou Region, Senegal Technical Report |
The 2016 Mining Code reformed the mining sector in Senegal in line with other countries in West Africa to include an increase in transparency and monitoring over mining activities by the State, increased taxes, reduced scope of exemption and advantages for investors.
| 4.2.2 | Permits |
Background
The 2016 Mining Code provides that no one can undertake or conduct a mining activity in Senegal without holding a mining title according to the terms of the Code.
There are two levels of permitting required to undertake mineral exploration and development and mining in Senegal. First, an exploration permit (permis de recherche) allows for exploration to be undertaken, including resource estimates and feasibility studies. Secondly, a small-scale mining permit (limited to an area of 500 ha with a term of five years, renewable for five years each time, or, a mining permit or exploitation permit (permis d’exploitation) to be agreed with the state and depending to the applicable mining code, and are renewable as many times as is necessary until the resource is exhausted.
In all cases, the mining title must be held by a Senegal registered company. The holder of a mining title must also enter into a “Mining Convention” or “Mining Agreement” with the State.
Under the 2003 Mining Code, a Mining Convention regulates the relationship between the parties for the entire duration of mining operations. A Mining Convention entered into under the 2003 Mining Code covers the exploration and exploitation phases of a project (article 87 of the 2003 Mining Code) and specifies the rights and obligations of the parties, which gives the title holder a stable legal and fiscal framework within which to operate.
Diamba Sud Exploration Permit
The Diamba Sud permit is an exploration permit (permis de recherche) which was granted to Boya in June 2015 under the 2003 Mining Code, before the 2016 Mining Code came into effect, and therefore it remains subject to the 2003 Mining Code for its duration and validity, except for procedural documents (related to renewals, authorizations and permit applications) which are under 2016 Mining Code. The exploration permit was granted for an initial period of three years, subject to being renewed twice for additional periods of three years. The exploration permit was renewed for a second time on June 9, 2021, for a period of three years, being the second and final renewal which expired on June 9, 2024. However, Boya obtained a special two-year retention period until June 21, 2026 to apply for an exploitation permit, complete the works necessary to file a FS and file the FS, and to conduct the environmental studies that are required in support of an application for an exploitation permit. Boya applied for an exploitation permit from the Ministry of Energy, Petroleum, and Mines on February 4, 2026, received a formal Decree for the environmental permit for the Diamba Sud Project Boya on June 11, 2026, and obtained an extension to the retention period of the exploration permit of 60 days until August 21,
| June 30, 2026 | Page 51 of 291 |
| | Diamba Sud Gold Project, Kédougou Region, Senegal Technical Report |
2026 to file the FS with the Ministry of Mines. The State will then make a decision upon the application to grant the exploitation permit.
Boya entered into a Mining Convention with the State of Senegal dated April 8, 2015. Under the 2003 Mining Code, the Mining Convention between the State and the titleholder regulates the relationship between the parties during the exploration and exploitation periods. It should be noted, however, that the State retains the sovereign prerogative to review or revisit certain fiscal terms during the exploitation permit approval process, and as such, the current framework may be subject to amendment.
The permit comprises two blocks, referred to as the DS1 and DS2 blocks, which are linked by a narrow strip of some 25 m width. This allows the two blocks to be classed as contiguous and form one permit area (Figure 4.1). Corner point (apex) co-ordinates for the concession in degrees, minutes and seconds are detailed in Table 4.1.
| June 30, 2026 | Page 52 of 291 |
| | Diamba Sud Gold Project, Kédougou Region, Senegal Technical Report |
Figure 4.1 The Diamba Sud Permit Boundary and Location in Eastern Senegal
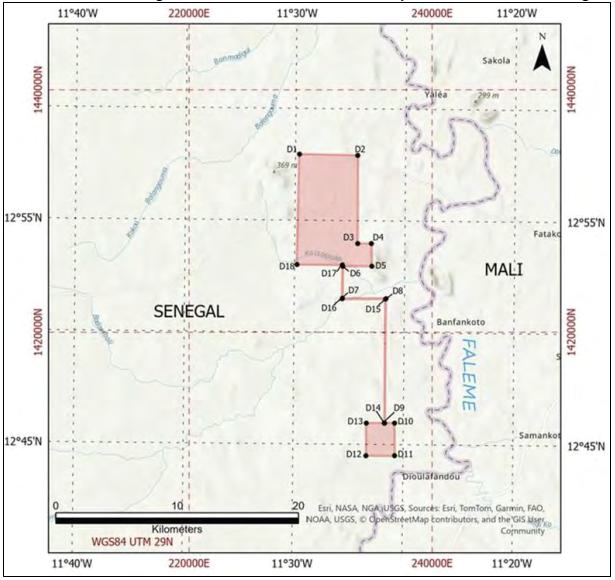
Figure prepared by Fortuna, 2024
| June 30, 2026 | Page 53 of 291 |
| | Diamba Sud Gold Project, Kédougou Region, Senegal Technical Report |
Table 4.1 Diamba Sud Permit Coordinates in Longitude and Latitude
| Apex ID | Longitude
(degrees, minutes, and seconds) |
Latitude
(degrees, minutes, and seconds) |
| D1 | 11° 29' 50.0388'' W | 12° 57' 57.4632'' N |
| D2 | 11° 27' 11.3796'' W | 12° 57' 55.3140'' N |
| D3 | 11° 27' 09.7416'' W | 12° 53' 59.6508'' N |
| D4 | 11° 26' 31.6536'' W | 12° 53' 59.1360'' N |
| D5 | 11° 26' 30.6564'' W | 12° 52' 58.3500'' N |
| D6 | 11° 27' 49.8456'' W | 12° 52' 58.1088'' N |
| D7 | 11° 27' 49.8276'' W | 12° 51' 31.7232'' N |
| D8 | 11° 25' 51.5064'' W | 12° 51' 31.7448'' N |
| D9 | 11° 25' 51.2364'' W | 12° 45' 58.3128'' N |
| D10 | 11° 25' 24.4632'' W | 12° 45' 58.5180'' N |
| D11 | 11° 25' 23.3976'' W | 12° 44' 30.3936'' N |
| D12 | 11° 26' 41.5932'' W | 12° 44' 30.3072'' N |
| D13 | 11° 26' 41.7408'' W | 12° 45' 57.3372'' N |
| D14 | 11° 25' 52.0680'' W | 12° 45' 58.2912'' N |
| D15 | 11° 25' 52.3452'' W | 12° 51' 30.8988'' N |
| D16 | 11° 27' 50.7204'' W | 12° 51' 30.8808'' N |
| D17 | 11° 27' 50.7168'' W | 12° 53' 00.8988'' N |
| D18 | 11° 29' 54.1680'' W | 12° 53' 01.5216'' N |
The northern block, DS1, is approximately 46.56 km2 in area. The southern block, DS2, is approximately 6.31 km2 in area. The total area of the permit is 53.46 km2 (including the corridor of land that connects the two blocks). The DS1 block is centered upon co-ordinates 11° 28’ 23.17” W and 12° 55’ 46.55” N. The DS2 block, which is some 20 km to the south, is centered upon co-ordinates 11° 26’ 2.68” W and 12° 45’ 13.61” N.
| 4.2.3 | Surface Rights |
Mineral exploration permits, within their boundaries, entitle the holder on surface and indefinitely at depth, the exclusive rights to explore for the nominated mineral commodities specified (in this case, gold). Such permits allow for beneficial ownership to be held by a foreign entity, such as Fortuna, through Boya, its wholly owned Senegalese subsidiary.
Fortuna has full and unrestricted surface rights to the land covered by the exploration permit. The perimeter of the exploration permit is free to access and is not subject to any kind of restriction, subject to the applicable mining regulation.
The FS assumes the granting of an exploitation permit which will provide the new company to be designated by Boya as the operating entity for the Diamba Sud Project, within the boundaries of its perimeter, on surface and indefinitely in depth, with the exclusive rights to explore, extract and dispose of the nominated mineral commodities specified (in this case, gold).
| 4.3 | Royalties |
Under the Diamba Sud Mining Convention, and based on the 2003 Mining Code, the State of Senegal is entitled to a 3% royalty on the “carreau-mine value” of gold produced. The carreau-mine value of a mineral substance is calculated as the difference between its sale price and the total costs incurred between the mine site and the point of delivery.
| June 30, 2026 | Page 54 of 291 |
| | Diamba Sud Gold Project, Kédougou Region, Senegal Technical Report |
It should be noted, however, that the State retains the sovereign prerogative to review or revisit certain fiscal terms, including among others, royalties and taxes payable, during the exploitation permit approval process, and as such, the current framework may be subject to amendment.
Additionally, under the 2016 Mining Code, holders of exploitation permits are required to contribute 0.5% of their annual turnover (excluding taxes) to a local development fund dedicated to promoting the economic and social development of local communities.
An annual surface fee is payable by holders of exploration permits as follows:
| · | First period of validity – 5,000 West African CFA francs per km2 per year. |
| · | First renewal period – 6,500 West African CFA francs per km2 per year. |
| · | Second renewal period – 8,000 West African CFA francs per km2 per year. |
Boya is currently paying a surface fee of 8,000 West African CFA francs per km2 per year related to the Diamba Sud exploration permit.
| 4.4 | Permitting |
Permitting is discussed in Section 20 of this Report.
| 4.5 | Social and Environmental Considerations |
Environmental and social considerations are discussed in Section 20 of this Report.
| 4.6 | Comment on Section 4 |
In the opinion of the QPs:
| · | The QPs were provided with a legal opinion that supported that the mining tenure held by Boya for the Diamba Sud Project is valid and that Boya has a legal right to exploration. |
| · | The QPs were provided with a legal opinion that supported that Boya has unrestricted surface rights to the land covered by the exploration permits held by Boya. Surface rights are sufficient in area for mining operation infrastructure and tailings facilities if the Project advances to a more advanced stage. |
| · | Fortuna is not aware of any environmental issues that may impact exploration or potential future operational activities at the Diamba Sud Project. |
Fortuna advised the QPs that to the extent known, there are no other significant factors and risks that may affect access, title or right or ability to perform work at the Project.
| June 30, 2026 | Page 55 of 291 |
| | Diamba Sud Gold Project, Kédougou Region, Senegal Technical Report |
| 5 | Accessibility, Climate, Local Resources, Infrastructure and Physiography |
| 5.1 | Accessibility |
From Senegal’s capital city Dakar, the Project site is accessed via the all-weather paved N1 highway east–southeast 489 km to the regional center of Tambacounda. From Tambacounda, the paved N7 highway can be taken southeast 234 km to Kédougou where it joins the Kédougou–Saraya Road that connects Kédougou to the municipality of Saraya. From Saraya the paved N24 road, frequented by trucks taking goods to and from neighboring Mali, passes through the Diamba Sud permit area and continues through to the Senegal–Mali border. Due to frequent use by trucks carrying heavy loads, road conditions can be locally very poor. However, in almost all cases the main roads remain open to vehicles throughout the year. Access throughout the permit area is via a combination of paved and laterite roads, and dirt tracks.
Access by air is possible via an asphalt airfield in Kédougou. The Senegalese government has announced numerous plans to transform the airfield into an international airport with regular scheduled flights, but development of the airport is yet to take place. Thus, the only currently available options for flights are two charter companies that operate from Dakar with flights taking between 1.5 and 3 hours, depending on aircraft type.
| 5.2 | Climate |
Senegal lies within the semi-arid Sahel region of Africa, with the Project situated in the tropical savanna climate zone of southern Senegal, classified as Tropical Savanna (Aw) under Köppen-Geiger’s climate classification (Peel et al., 2007). This region experiences two distinct seasons: a dry winter from November to May and a wet summer from June to October, driven by the movement of the intertropical convergence zone. The wet season typically extends from June to September, peaking in August with high annual rainfall variability. Average annual precipitation is approximately 1,200 mm, with very little to no rainfall during the dry season. Evaporation rates are higher, averaging around 1,900 mm annually.
The dry season is dominated by the warm, dust-laden east–northeast harmattan winds from the Sahara. Temperatures are hottest from February to June, averaging 24–41°C, and milder from July to January, ranging between 16–34°C. Daylight hours are relatively stable, varying from 11.4 hours in December to 12.9 hours in June.
The climate supports year-round mining and processing; however, the wet season can complicate surface exploration activities due to excessive vegetation growth, surface water, electrical storms, and abundant insects. Consequently, field exploration typically reduces between July and September.
| 5.3 | Topography, Elevation and Vegetation |
The Project is located in the Kédougou region in the southeast corner of Senegal, with an elevation ranging between 100–380 meters above sea level (masl). The highest point is Kouroudiako, a prominent ironstone hill in the southeast of the DS1 area, reaching 380 m masl. The region features low to moderate relief, consisting of broad lateritic plateaus, eroded valleys, and gentle slopes.
| June 30, 2026 | Page 56 of 291 |
| | Diamba Sud Gold Project, Kédougou Region, Senegal Technical Report |
The Project lies approximately 7 km from the western bank of the Falémé River, with drainage into three major streams that flow into the Falémé River, which drains into the Senegal River and ultimately the north Atlantic Ocean at St. Louis, approximately 180 km northeast of Dakar at the Senegal-Mauritania border.
The landscape primarily comprises forested savanna with patches of grassland and forest. Notable flora include baobab (Adansonia digitata), madd (Saba senegalensis), jujube (Ziziphus mauritania), and the locust bean tree (Parkia biglobosa). Larger trees are often localized along river channels where seasonal rivers flow and the lateritic plateau has eroded, while vegetation in the area is predominantly grass and small shrubs, characteristic of the climate.
| 5.4 | Local Resources and Infrastructure |
Gamba Gamba (population c. 640) is the closest village to the Project and the only village located within the permit area. The settlement of Karakaéné (population c. 3,253) is located 2.4 km west of the DS1 block boundary and is the largest local village. It largely consists of informal lodgings for artisanal miners in the area. Five very small rural settlements occur within 2 km of the tenement boundaries and these chiefly consist of wood and thatch huts connected by laterite roads and dirt paths.
There is a permanent Gendarme base camp (police post) approximately 2.4 km from Fortuna’s Gamba Gamba field camp. Barrick Gold also operates an exploration camp, Bambadji, adjacent to the Gendarme base camp.
| 5.4.1 | Sources of Power and Water |
There is no electricity from the national grid to this area of the country. Electricity is supplied to the exploration camp via diesel generators. Fresh water is pumped from underground aquifers and is treated at an in-house water treatment facility for use at the exploration camp.
| 5.4.2 | Consumables |
Apart from some fresh produce and supplies that can be sourced locally from Karakaéné and Gamba Gamba, most consumables and supplies are transported by road to the Project site either from Kédougou or Dakar (depending on availability).
| 5.4.3 | Labor |
Of all the nearby settlements, the town of Saraya and the village of Gamba Gamba are the two main sources of laborers. Skilled and professional workers can be sourced from other areas of Senegal.
| 5.4.4 | Infrastructure |
Infrastructure at the Project is limited to Boya’s Gamba Gamba field camp. This consists of a series of semi-permanent block accommodations and office buildings, a kitchen and mess hall, laundry, and ablution facilities. Temporary containerized accommodation and ablution units supplement the semi-permanent buildings during periods of increased exploration activities. Partially-enclosed drill core and sample preparation facilities and a basic workshop are also located within the camp boundary.
An Orange mobile network cellular tower is located at Karakaéné, and a booster tower has been installed outside of Barrick’s Bambadji camp, some 2.4 km to the northwest of the Boya exploration camp. Cellular signal is generally unavailable across the Project area,
| June 30, 2026 | Page 57 of 291 |
| | Diamba Sud Gold Project, Kédougou Region, Senegal Technical Report |
although 4G is available occasionally and in certain more favorable locations. A Starlink kit has been installed at the field camp, significantly improving internet connectivity.
Section 15 discusses the infrastructure assumptions for the FS.
| 5.5 | Comment on Section 5 |
In the opinion of the QP, there is sufficient surface area within the granted permit for the open pits, WRSFs, plant, TSFs, associated infrastructure, and other operational requirements for the planned life-of-mine (LOM) and mine plan discussed in this Report.
| June 30, 2026 | Page 58 of 291 |
| | Diamba Sud Gold Project, Kédougou Region, Senegal Technical Report |
| 6 | History |
Prior to 1993 there is no known or recorded systematic mineral exploration carried out on the property, although regionally the area was surveyed by the Bureau de Recherches Géologiques et Minières (BRGM) as part of the Senegal Plan Mineral in 1983.
The first recorded exploration activities were carried out by Anmercosa Exploration (Anmercosa, a subsidiary of Anglo American plc) from 1993–1996, as part of a joint venture agreement with Iamgold Corporation (Iamgold). This work was carried out over the larger Bambadji permit which at that time included the area currently referred to as Diamba Sud.
From 1997–1998, Ashanti Goldfields Corporation (Ashanti Goldfields) completed further exploration activities as part of a similar joint venture with Iamgold.
From 1999–2014, Iamgold conducted exploration activities at the Diamba Sud Project, either individually or as part of a joint venture. The area was relinquished as part of a renewal process for Bambadji and acquired by Boya in 2015.
| 6.1 | Previous Owners and Results |
| 6.1.1 | Anmercosa, 1993–1996 |
From 1993–1996, Anmercosa conducted regional exploration activities over the Bambadji, Daorala and Boto Project areas. These activities included airborne geophysical surveys along with regional and local geochemistry and early drilling activity. No drilling was conducted on the Diamba Sud area.
| 6.1.2 | Ashanti Goldfields, 1997–1998 |
Ashanti Goldfields also worked on the Bambadji, Daorala and Boto Project areas and continued to focus on the acquisition of geochemical data and, in addition, conducted some preliminary trenching and pitting in 1997 and 1998.
| 6.1.3 | Iamgold, 1999–2014 |
From 1999–2014, Iamgold conducted limited prospecting activity over the Bambadji permit. The majority of the work conducted was in the eastern portion of the permit and not on the Diamba Sud area. The western part of the Bambadji permit was relinquished in 2014.
| 6.1.4 | Boya Gold Pty Ltd 2015–2016 |
The Diamba Sud permit was granted in June 2015 to Boya, a subsidiary of Boya Gold Pty Ltd. (Boya Gold). From 2015 to 2016, Boya conducted regional soil geochemistry for gold using a 400 x 400 m grid, later infilled to 200 x 100 m in places, collecting 1,552 soil samples. Outcrop mapping was completed over a 37 km2 area, and 96 grab samples were collected.
Aircore and reverse circulation (RC) drilling was conducted by Minerex Drilling Contractors Ltd (Minerex). A total of 334 aircore holes with depths between 2–56 m were drilled for a total meterage of 3,358 m with 1,160 samples, including quality control samples, sent to the SGS laboratory in Bamako (SGS Bamako) in Mali for analysis. In addition, 9 RC holes, with maximum depths between 40 and 86 m, were drilled over two prospect areas in the south of the DS1 block at Dembakholi and Southern Arc for a total meterage of 650 m with 338 samples, including quality control samples. These samples were sent to SGS Bamako for analysis.
| June 30, 2026 | Page 59 of 291 |
| | Diamba Sud Gold Project, Kédougou Region, Senegal Technical Report |
| 6.1.5 | Chesser Resources Ltd. 2017–2023 |
On July 12, 2017, Chesser completed the 100% acquisition of the issued capital of Boya Gold. As a result, Boya became an indirectly wholly-owned subsidiary of Chesser. During the period from 2017–2023, Chesser completed the drilling of 3,848 auger holes, totaling 34,174 m, targeting areas of potential gold mineralization.
Chesser commenced RC drilling in 2019. A total of 10 geochemical targets were RC and RC with core tail drilled, totaling 493 holes and 60,212 m. The first core drilling at Diamba Sud was conducted in November 2019 over Areas A and D. In total, 116 core holes totaling 18,263 m were drilled between November 2019 and July 2023.
| 6.2 | Geophysics |
Chesser’s in-house geophysics team collected resistivity, conductivity and chargeability data over a large part of the DS1 block. In addition to induced polarization (IP), Chesser acquired high resolution magnetic data for the DS1 and DS2 blocks (Figure 6.1 and Figure 6.2). Whilst these datasets provided numerous additional prospects, Chesser had only drilled the surface geochemical prospects prior to the Project acquisition by Fortuna.
Figure 6.1 Second Vertical Derivative, Total Magnetic Intensity (TMI) at the Diamba Sud Project
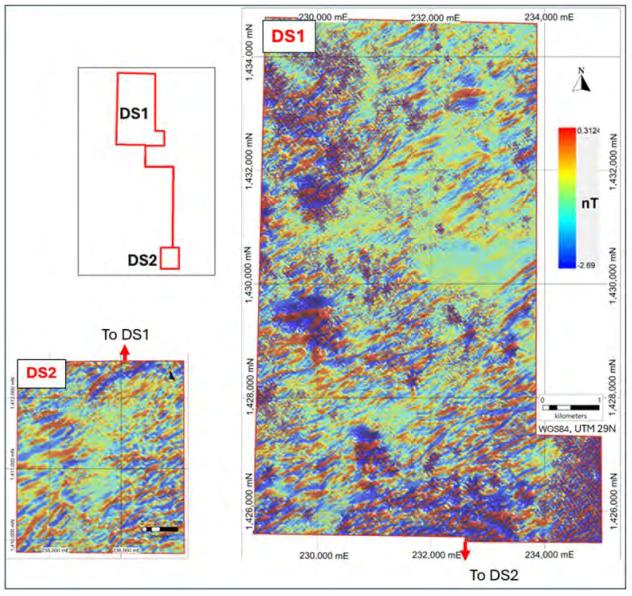
Figure prepared by Fortuna, 2025
| June 30, 2026 | Page 60 of 291 |
| | Diamba Sud Gold Project, Kédougou Region, Senegal Technical Report |
Figure 6.2 Magnetic Analytical Signal for the Diamba Sud Project
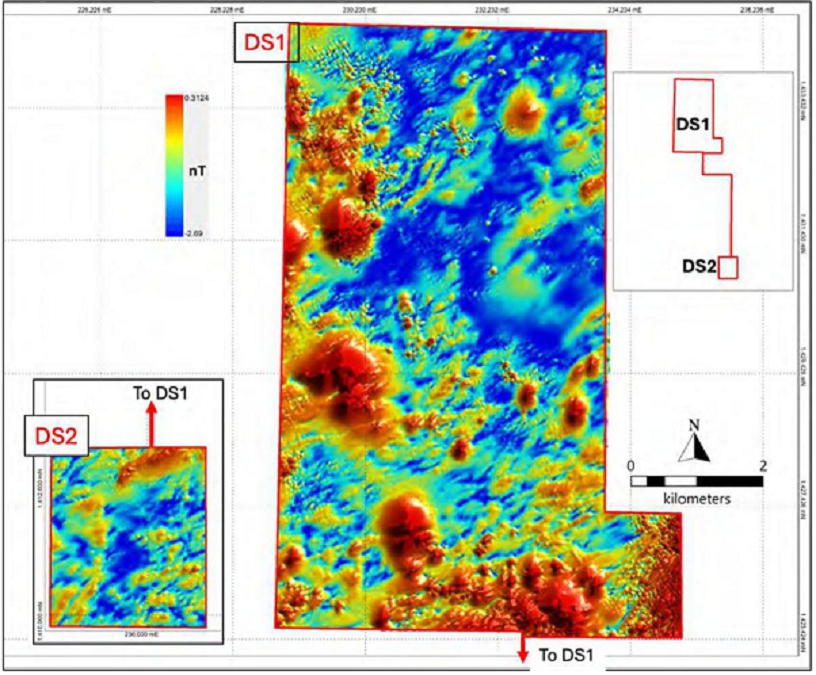
Figure prepared by Fortuna, 2025
| 6.3 | Other Work |
Given the geological complexities encountered in the RC and core drilling campaigns Chesser commissioned petrographic studies of selected samples to be conducted by Dr. James Lambert-Smith at Cardiff University, UK.
A structural study of selected cores was also conducted by TECT Consulting, Cape Town. Both studies assisted with the understanding of the mineralization models and target selection during various drilling campaigns.
A mineral resource estimate was prepared in 2021. Chesser also began extensive environmental studies as well as community and stakeholder engagement programs.
| 6.4 | Production History |
There has been no commercial production at the Diamba Sud Project as at the effective date of this Report.
| June 30, 2026 | Page 61 of 291 |
| | Diamba Sud Gold Project, Kédougou Region, Senegal Technical Report |
| 7 | Geological Setting and Mineralization |
| 7.1 | Regional Geology |
The Diamba Sud Project is located within the West African Craton (WAC). The WAC consists of three domains:
| · | The Northern African Reguibat Shield. |
| · | The Leo–Man Shield of sub-Saharan West Africa. |
| · | The Kedougou–Kenieba Inlier (KKI) northwest of the Leo–Man Shield in the Sahel region, which hosts the Diamba Sud deposits. |
The regional geology is shown in Figure 7.1.
Figure 7.1 Regional Geological Map of the Leo–Man Shield and Kedougou–Kenieba Inlier, West Africa Craton
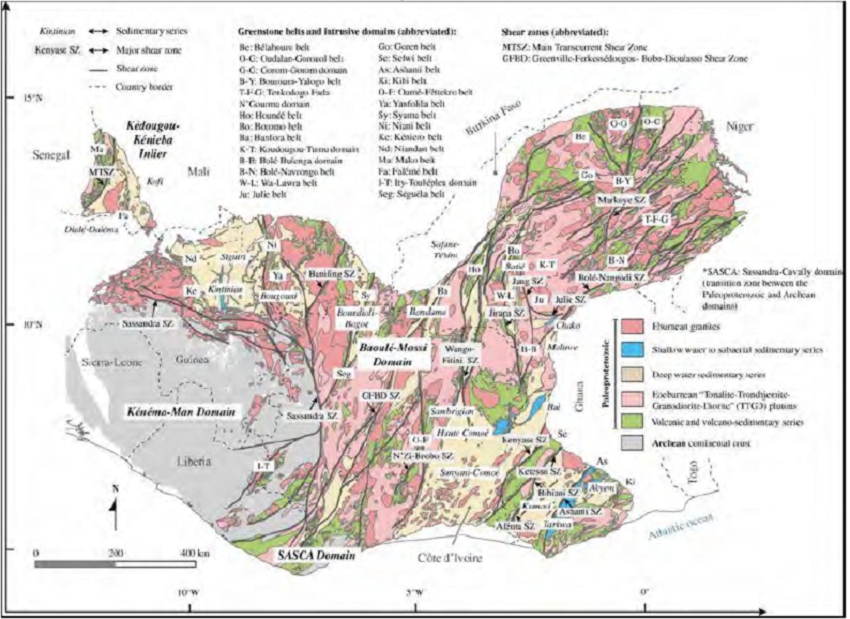
Figure sourced from Masurel et al. (2022).
| June 30, 2026 | Page 62 of 291 |
| | Diamba Sud Gold Project, Kédougou Region, Senegal Technical Report |
The WAC had a number of deformation events and a complicated metamorphic history with evidence of two main Paleoproterozoic orogenic cycles. The first phase of deformation (D1) between ca. 2,140–2,135 Ma was the Eoeburnean cycle, which caused region-wide contractional deformation and metamorphism. This was followed by the Eburnean cycle (D2), which commenced with basin formation between ca. 2,135 and 2,105 Ma. Basin formation continued into contractional deformation, basin inversion and predominantly greenschist metamorphism from ca. 2,105–2,100 Ma. Most of the gold mineralization in the region is associated with the Eburnean deformational event (Lambert-Smith et al., 2020). The Eburnean cycle ended at ca. 2,100–2,095 Ma with wrench-style deformation (Masurel, Quentin et al. (2022)). Docking of the Archean Kenema-Man Domain with the Paleoproterozoic rocks also occurred ca. 2,095 Ma. Reverse, normal and strike-slip faulting occurred throughout the western and southern parts of the WAC, both during and after high potassium-magmatism, between ca. 2,095–2,060 Ma (Masurel, Quentin et al. (2022)).
The Birimian of West Africa consists of shear-bounded, linear, and arcuate trending volcanic belts/arcs that have north to north–northeast trends separated by wide metasedimentary basins. Large granitic batholiths intrude the volcanic and sedimentary rocks, which were accreted, deformed, and underwent greenschist metamorphism during the Eburnean Orogeny at about ~2.1 Ga (Masurel, Quentin et al. (2022)).
The Diamba Sud Project is located northwest of the Leo–Man Shield in the Kedougou–Kenieba Inlier (KKI). The KKI, an area of around 15,000 km2 is separated from the Leo–Man Shield by the overlying Neoproterozoic Taoudeni sandstones. These sediments unconformably overly all of the margins of the inlier apart from the western margin that is bounded by the Pan-African Mauritanides Belt (Lambert-Smith et al., 2016).
Evidence for the two main Paleoproterozoic orogenic cycles was observed in the KKI, with the first orogeny (D1) associated with reverse faulting and recumbent and overturned folding, and the second orogeny (D2) associated with a period of transcurrent deformation which involved upright folding and sinistral displacement along north-striking shear zones (Allibone et al., 2020). A third phase of transtensional deformation (D3) was identified to the east of the Falémé River, the timing of which coincides with gold mineralization at Barrick Gold’s Loulo deposit (Lawrence et al., 2013).
In the KKI, two major crustal shear zones were identified in the region, with both having proximal relationships to gold deposits. Additionally, other smaller, less continuous structures were identified or speculated upon in the inlier (Allibone et al., 2020; Diallo et al., 2020).
The northeast-striking Main Transcurrent Zone (MTZ) forms a tectonic contact between the Dialé-Daléma Basin to the east and the Mako Volcanic Belt to the west. A number of gold deposits are associated with the MTZ, including Tomboronkoto, Massawa and Makabingui, with the Petowal and Sabodala deposits occurring further to the west but still within the structural vicinity of the MTZ.
The north-striking Senegal-Mali Shear Zone (SMSZ) initiated as a sinistral transpressional brittle–ductile shear zone during the phase of D2 deformation (Lawrence et al., 2013; Lambert-Smith et al., 2016). It is a 1–10 km wide corridor of varying deformation styles that bounds the western contact of the Kofi Series. It was a major conduit for hydrothermal fluids in the region with several gold deposits recognized on either side of the shear zone including the Gounkoto, Fékola and Boto deposits within the Kofi series to the east, and the Karakaéné deposit within the Falémé Volcanic Belt to the west. Although the presence of the SMSZ has been questioned recently (Allibone et al., 2020
| June 30, 2026 | Page 63 of 291 |
| | Diamba Sud Gold Project, Kédougou Region, Senegal Technical Report |
and Lambert-Smith et al., 2020), the possibility of the Falémé Batholith intruding and stitching a pre-existing regional structure where the SMSZ was delineated has also been postulated as a possible reason why this regional-scale lineament is not observed today (Allibone et al., 2020). Additionally, discontinuous structures currently observed along where the SMSZ is interpreted to strike, may be the result of tectonic sealing of this regional-scale feature.
From east to west, the stratigraphy of the KKI consists of the following:
| · | The Kofi series: sedimentary rocks made up of a monotonous package of argillites, siltstones, and sandstones with subordinate volcaniclastic rocks, marbles, polymictic conglomerates and immature sandstones (Allibone et al., 2020; Lambert-Smith et al., 2016). The series is carbonate-rich, predominantly consisting of dolomitic marls, to the west of the series in close proximity to the Falémé Volcanic Belt (Lambert-Smith et al., 2016). The age of the Kofi series was constrained using detrital zircons to between ca. 2,153 and 2,113 ± 7 Ma with a maximum depositional age of 2120 Ma (Allibone et al., 2020). Dips of units within the Kofi series vary from 40˚ to >50˚ and the units strike from north–northwest to north–northeast within the Loulo mining district. The series is intruded by dolerite to monzodiorite dykes and small stocks of quartz–feldspar porphyry as well as smaller dykes belonging to the Falémé Volcanic Belt (Lambert-Smith et al., 2016). The larger Gamaye (2,045 ± 27 Ma) and Yatea monzogranite plutons also intrude into the Kofi series (Lambert-Smith et al., 2016). |
| · | The Falémé Volcanic Belt: subdivided into the plutonic and volcanic Falémé batholith and volcaniclastic and sedimentary Bambadji Formation (Allibone et al., 2020; Lambert-Smith et al., 2020). It is a ~16 km wide, north–northeast-trending belt that is bounded by the Kofi series to the east and the Dialé-Daléma Series to the west (Lambert-Smith et al., 2016). The eastern margin of the belt is composed of porphyritic monzonite, quartz monzonite, and minor granite of Highway pluton with dated ages of 2,076 ± 25 and 2,080 ± 11 Ma and the >100 km2 quartz monzodiorite and granodiorite Balangouma pluton with ages of 2,118 ± 16 Ma (Allibone et al., 2020). To the center–south of the belt, the >100 km2 Boboti pluton with an age of 2,080 ± 0.9 Ma outcrops alongside the South Falémé pluton composed of albitized diorites and magmatic breccias (2082 ± 1.1 Ma) and the Garaboureya pluton (Lambert-Smith et al., 2016). Volcanic and subvolcanic rhyolites with ages ranging from 2,064 ± 30 Ma to 2,099 ± 4 Ma also occur within the belt (Lambert-Smith et al., 2016). The western margin is composed of dioritic, granodioritic, granitic and leucogranitic rocks (Allibone et al., 2020). Other smaller plugs, stocks, and dykes also occur throughout (Lambert-Smith et al., 2016; Allibone et al., 2020). Within the belt, the Bambadji Formation is composed of sandstones, siltstones, carbonates, volcaniclastic, conglomeratic, and fine-grained massive rocks which make up xenolith screens and roof pendants within the Falémé batholith (Allibone et al., 2020; Lambert-Smith et al., 2016). These rocks have dips <35˚ and unconformably overlie the Kofi series (Allibone et al., 2020). The Bambadji Formation rocks were deposited between ca. 2,085–2,071 Ma (Allibone et al., 2020). The Falémé Volcanic belt hosts hypogene magnetite and supergene-enriched iron skarn deposits (Lambert-Smith, 2014). |
| · | The Dialé-Daléma series: predominantly volcaniclastic, siliciclastic, and subordinate carbonate rocks that are isoclinally folded (Lambert-Smith et al., |
| June 30, 2026 | Page 64 of 291 |
| | Diamba Sud Gold Project, Kédougou Region, Senegal Technical Report |
2016). It is bounded by the Falémé Volcanic Belt to the east. The Main Transcurrent Zone forms a tectonic contact in the west with the Mako Volcanic Belt. Zircon dating of basalts from the series return an age of 2,165 ± 0.9 Ma (Lambert-Smith et al., 2016). The peraluminous two-mica S-type Saraya Batholith intrudes into the southern–central part of the KKI and into the Dialé-Daléma series. The batholith covers an area of ~2,000 km2 and is made up of several plutonic bodies of granodiorite to granite composition, which were emplaced between 2,079 ± 2 Ma and 2,061 ± 15 Ma (Lambert-Smith et al., 2016).
| · | The Mako Volcanic belt: The 20–40 km wide north–northeast-trending Mako Volcanic Belt is composed of bimodal volcanic rocks and forms the westernmost outcrop of Paleoproterozoic rocks in the KKI (Lambert-Smith et al., 2016). It is bounded by the Mauritanides belt to the west and shares a tectonic contact (MTZ) with the Dialé-Daléma series to the east. The belt is composed of pillowed tholeiitic basalts, dolerites, and gabbros, intercalated with pyroclastics, rhyolites, felsic tuffs and subordinate ultramafic rocks, and clastic and carbonaceous rocks (Dioh et al., 2006). The 120 km long and 20 km wide Kakadian plutonic complex intrudes the Mako Volcanic Belt on the western edge of the belt (Dioh et al., 2016). It consists of four main units; (1) the tonalitic to dioritic Sandikounda amphibolite–gneiss complex (SAG) with an age of 2,205 ± 15 Ma; (2) the hornblende-gabbro, diorite, migmatite and hornblendite Sandikounda layered plutonic complex (SLPC) with a crystallization age of 2,171 ± 9 to 2,158 ± 8 Ma; (3) the tonalite and granodiorite Laminia dated at 2,138 ± 12 to 2,105 ± 8 Ma and monzogranite Kaourou (2,079 ± 6 Ma) plutonic complex (LKPC); and (4) the biotite-granodiorite Badon pluton to the south of the Kakadian complex with an age of 2,198 ± 2 Ma (Lambert-Smith et al., 2016). |
| 7.2 | Local Geology |
| 7.2.1 | Lithologies |
The Project is located within the Loulo Mining district within the Kofi series. Numerous gold deposits held by third parties occur within the vicinity of the Diamba Sud permit, including the Karakaéné, Gounkoto, Yalea, and Gara deposits alongside several other satellite deposits.
Lateritic weathering and duricrust formation is still active in the region. Apart from hills and resilient lithologies, much of the terrain is covered by lateritic material resulting in limited exposure of sub-cropping geology.
Oxidation depth in the region is highly variable, but is generally several tens of meters, occasionally down as far as 70–80 m. In some areas near major drainages, thick colluvial material cover large tracts of land and close to the Falémé River, small lenses of lateritized alluvial deposits can be observed. Additionally, colluvium is also observed on the slopes of the Falémé iron skarn hills.
The SMSZ runs adjacent to the contact between the Falémé Volcanic Belt and the Kofi series to the east of the permit. Faults in the local area are generally north- to northeast-striking, with predominantly north-striking bedding and foliation (Allibone et al., 2020).
The geology local to the Diamba Sud Project is dominated by plutons belonging to the Falémé Volcanic Belt as well as roof pendants and xenolith screens of the Bambadji Formation. This formation also uncomformably overlies the Kofi series sediments that subcrop to the east (Allibone et al., 2020).
| June 30, 2026 | Page 65 of 291 |
| | Diamba Sud Gold Project, Kédougou Region, Senegal Technical Report |
At the westernmost extent of the Kofi series, north-striking altered marbles and strongly albilitized lithologies with identified and unidentified protoliths are prevalent (Allibone et al., 2020). The Kofi series in the area is dominated by undifferentiated sandstones and siltstones with minor conglomerate and breccia (Lambert-Smith et al., 2020). Several dolerite dykes of various orientations intrude the Kofi series and plutonic rocks of the Falémé Volcanic Belt.
The Falémé Volcanic Belt within and surrounding the Project area is made up of the Highway pluton and a range of smaller plugs and dykes. The Balangouma pluton and heterogeneous granitoids adjacent to it occur to the north of the Project area, with the Boboti and Garaboureya plutons outcropping to the south of the Project area. The Bambadji Formation is also mapped to subcrop within and surrounding the Project, forming xenolithic screens and roof pendants within the Falémé Volcanic Belt, as well as unconformably overlying the Kofi series to the east (Allibone et al., 2020).
Iron endo- and exoskarns, some structurally controlled along faults, occur within the Falémé Volcanic Belt, the Bambadji Formation and on western portions of the Kofi series (Lambert-Smith et al., 2020). A genetic link between iron skarn mineralization and gold mineralization has been proposed based on the proximal locations of these deposits, the involvement of high temperature FeCl2-rich brine, and from mineral paragenesis at the Sadiola deposit (Allibone et al., 2020). Additionally, the Karakaéné Ndi iron skarn, north of Afrigold’s Karakaéné mine, has been a target of significant artisanal workings. Named iron skarns inside and within the vicinity of the Project include the Karakaéné Mbah, Karakaéné Ndi, and Kouroudiako iron skarns, with other unnamed skarns of various volumes also cropping out in the region (Lambert-Smith et al., 2020).
Sedimentary sequences not confirmed to belong to the Bambadji Formation and possibly belonging to the Kofi series or part of the Diale-Dalema basin are also present within the Project area. These consist of marls, carbonates, polymictic matrix-supported breccias and intensely hydrothermally altered lithologies; some of the protoliths for these lithologies cannot be identified. Granites belonging to the Falémé batholith intrude into these sedimentary units.
Both the Falémé batholith and sedimentary sequences are intruded by late, predominantly sub-vertical, diorite dykes. A number of iron endo- and exoskarns also occur in the area and these form prominent topographic highs, inside and outside of the Project area.
| 7.2.2 | Tectonic Setting |
The Birimian rocks of the Kédougou-Kéniéba inlier have been affected by a polycyclic deformation and metamorphic history related to the Eburnean Orogeny Three major deformation phases were identified: a collisional phase (D1) associated with the initial accretion of the Birimian, and two transcurrent phases (D2–D3) associated with the formation regional-scale north–south-trending shear zones. At the scale of the Kédougou-Kéniéba inlier, the D2–D3 deformation is clearly related to the two regional transcurrent ductile structures i.e.: the northeast-trending MTZ, and the SMZ
The tectonic history of the region can be summarized as follows:
| · | Early Proterozoic: deposits of clastic, pelitic, greywacke, carbonate, and volcano-sedimentary units. |
| · | Eburnean Orogeny: metamorphism (greenschist facies) of sediments to form quartzites, schists, and marbles, (Birimian D1, D2, D3). |
| · | Late Proterozoic: uplift, erosion, and peneplanation of Birimian rocks. |
| June 30, 2026 | Page 66 of 291 |
| | Diamba Sud Gold Project, Kédougou Region, Senegal Technical Report |
| · | Late Proterozoic to Carboniferous: deposition of clastic sediments (mostly sandstones) of the Taoudeni Basin. |
| 7.2.3 | Alteration |
Alteration at Diamba Sud is dominated by at least two successive phases of albite ± carbonate ± hematite alteration, with localized potassium (K)-feldspar alteration in mineralized and intensely altered samples. Several lithologies also display albitization, tourmalinization, and sericite–chlorite alteration.
Albitization has affected the host rocks at Diamba Sud. This early phase of albitization is generally relatively iron poor, producing more muted pale orange or beige colors than later albite–hematite–carbonate alteration. Similarly, an early phase of tourmalinization is also seen.
In general, moderate to intense albite–hematite–carbonate ± quartz–chlorite–tourmaline–pyrite alteration has affected most lithologies to varying degrees.
Almost all lithologies exhibit (relatively) late carbonate alteration in the form of carbonate (mostly dolomite) porphyroblasts that overprint the host lithologies. The precise paragenesis of these porphyroblasts is unclear but they are likely related to the later stage of carbonate ± quartz–chlorite–tourmaline–pyrite veining and breccia cement that affects a significant number of mineralized zones
Sericitization of feldspars is also widespread and is likely to post-date the main phase of alteration.
| 7.2.4 | Mineralization |
Mineralogy related to mineralization at Diamba Sud is relatively simple, consisting dominantly of pyrite with minor pyrrhotite, chalcopyrite and magnetite. Primary gold is generally associated with pyrite or as free millimeter scale grains.
There does not appear to be a preferential host lithology, with gold mineralization (>1 g/t Au) hosted in most rock types, except for weakly-altered fine grained sedimentary rocks, although there is a bias towards hydrothermally brecciated carbonate units. Most of the mineralization is hosted in a combination of disseminated pyrite, minor veinlets and hydrothermal breccia cement.
The predominant mineralization style is orogenic lode gold with supergene enriched saprolitic zones specifically in Area D. This style of mineralization can occur as veins or disseminations in altered (often silicified) host rocks or as pervasive alteration over a broad zone.
Much of the mineralization at Diamba Sud is hosted within sedimentary and volcano-sedimentary units, where structures, represented by variably brecciated units, acted as fluid conduits allowing fluid flow and mineralization. Hydrothermal breccia zones within Area A and Southern Arc host some of the highest grades within the hypogene mineralized zones from Diamba Sud. A precursor phase of albitization and hematization prepared the breccias for a later phase of auriferous pyrite-hematite-albite-carbonate-quartz mineralization.
Mineralized structures also occur throughout the intrusions in the area, with auriferous pyrite ± carbonate veins exploiting shear zones that cut through the granitoids.
In Area D, mineralization which occurs within carbonate lithologies exploits styolites that were opened and acted as fluid conduits for auriferous pyrite-bearing fluids. Altered marls, sandstones and tectonic breccias also host mineralization. However, supergene
| June 30, 2026 | Page 67 of 291 |
| | Diamba Sud Gold Project, Kédougou Region, Senegal Technical Report |
enrichment appears to occur predominantly over the altered and bleached marls. Mineralization within the oxide is associated with goethite, hematite and kaolinite alteration assemblages.
| 7.3 | Deposit Geology |
Exploration has identified seven gold deposits and several prospects located in the DS1 block. These include the Area A, Area D, Karakara, Kassassoko, Western Splay, Moungoundi, and Southern Arc deposits, as well as the Gamba Gamba North, Area A North, Area D South, and Kouroudiako prospects. These deposits all form part of a single mineralizing system with local variability influenced mainly by intensity of brecciation, alteration and later supergene processes. The Bougouda prospect is located in the DS2 block. The deposits and prospects within the DS1 block are shown in Figure 7.2. The location of the Bougouda prospect is provided in Figure 10.1.
The relationship between the different structural regimes present remains unclear with work continuing to resolve the relationship and timing with the broader SMSZ and intrusion related history. Strong metasomatism and phases of hydrothermal and tectonic brecciation have complicated determining key associations.
The paragenetic sequence has been divided into two main stages based on consistently overprinting relationships. During stage I early fluids cause hematite carbonate silica ± albite ± tourmaline alteration and is associated with fine fractures, brecciation and disseminated pyrite. Tectonic breccias were also active at this time as evidence by fragments of hematite altered dolomite.
The early fluids are interpreted as being oxidizing (hematization) and slightly alkaline (albitization). If the early fluid was not CO2 rich to start with, it would have become so after equilibration with the carbonate rich sedimentary sequence.
Stage II carbonate ± quartz veins and hydrothermal breccia always overprint Stage I parts of the paragenesis (including tectonic breccias). These breccias formed during interpreted explosive decompression which resulted in significant dilation and intense carbonate alteration/replacement. The carbonate alteration can be locally intense and texturally destructive to the point where it can be difficult to identify the protolith.
The bulk of the gold was deposited during Stage II with gold mineralization associated with late carbonate ± quartz veining and hydrothermal breccia overprinting dolomite, monzonite intrusive and tectonic breccia. Gold mineralization is closely associated with finely-disseminated pyrite.
It is also recognized that, in contrast to much of the typical Birimian-style mineralization, mineralization is preferentially hosted in breccia bodies and does not generally follow simple planar structures. Determining the path of these breccia bodies (fluid pathways) is a focus for further exploration. Much of what presents as broad-scale fault and fracture zones is generally post mineralization.
| June 30, 2026 | Page 68 of 291 |
| | Diamba Sud Gold Project, Kédougou Region, Senegal Technical Report |
Figure 7.2 Geological Map of Diamba Sud DS1 Block Showing Deposits and Prospects
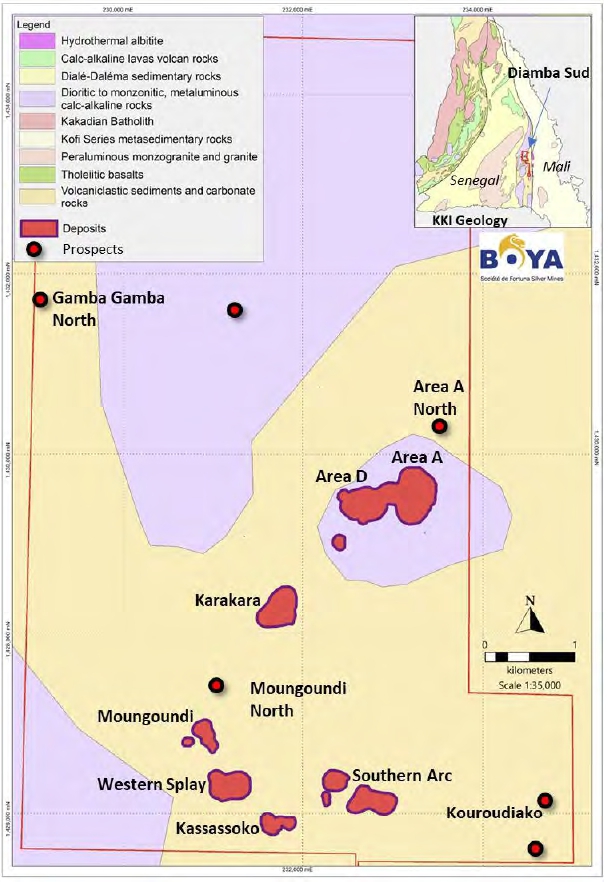
Figure prepared by Fortuna, 2025
| June 30, 2026 | Page 69 of 291 |
| | Diamba Sud Gold Project, Kédougou Region, Senegal Technical Report |
| 7.3.1 | Area A |
Area A comprises volcano-sedimentary, sedimentary rocks and hydrothermal breccias that appear to be tightly folded into an antiformal structure sandwiched between granodioritic intrusions (Figure 7.3).
Figure 7.3 Schematic Cross-Section of Area A Looking North
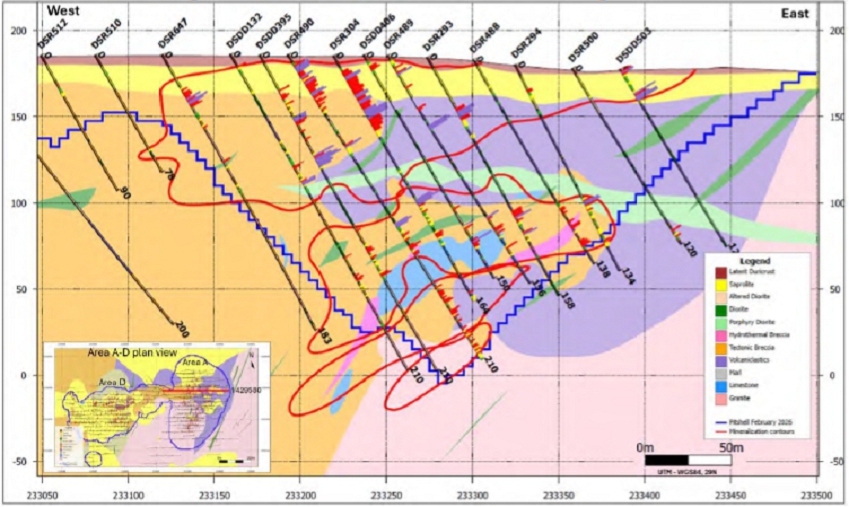
Figure prepared by Fortuna, 2026
Gold mineralization coincides with the breccia–carbonate and breccia–-intrusive contact zones, with brecciation providing conduits for mineralizing fluids, and further enhanced by alteration and degradation of some of the carbonate units, likely associated with emplacement of acidic mineralizing fluids. The mineralization trends north–south and at depth is moderately dipping (40–50º) to the west. Near surface, there is evidence to suggest that the antiform is refolded towards the east and the mineralized zones are more shallow dipping towards the west. Mineralization has been drill-defined along an approximate 500 m strike with a cumulative width of up to 200 m across strike. Mineralization continuity tends to reflect the underlying distribution of brecciated carbonate units with individual zones able to be traced over several tens to hundreds of meters, and remains open at depth and will be subject to future drilling.
Mineralization is largely represented by pods and agglomerations of pyrite–gold with occasional chalcopyrite–galena, hosted in strongly albite–hematite ± potassic feldspar–quartz-altered hydrothermal breccias. Higher-grade zones appear to be related to fluids damming up against less permeable rocks at the top of the structure. Although there is a strong geochemical anomaly above Area A, most of the mineralization is seen at depth in fresh rock and there is very little oxide mineralization.
| June 30, 2026 | Page 70 of 291 |
| | Diamba Sud Gold Project, Kédougou Region, Senegal Technical Report |
Structurally Area A is located on the south side of a northeast–southwest-trending splay of the SMSZ.
| 7.3.2 | Area D |
The Area D deposit is dominated by carbonates (marls, limestone), sandstones, greywackes, tectonic and hydrothermal breccias (Figure 7.4) with granodioritic intrusions to the immediate southeast.
Figure 7.4 Schematic Cross-Section of Area D Looking North
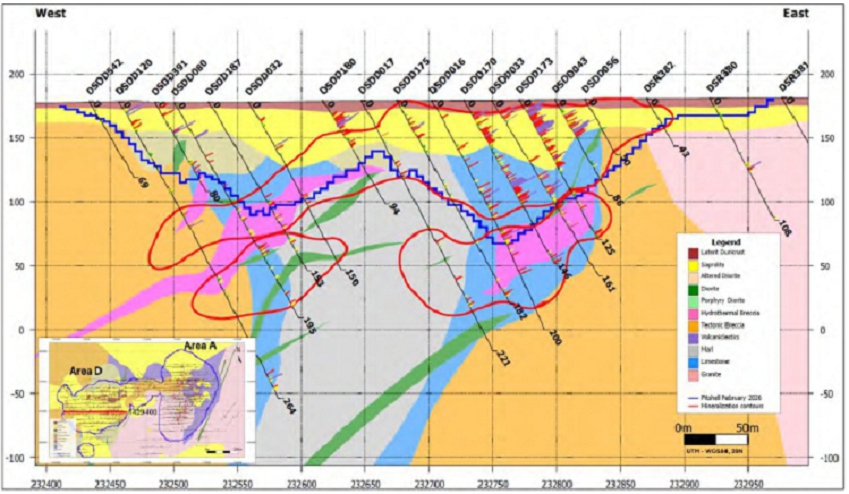
Figure prepared by Fortuna, 2026
These rocks dip gently (30–45º) to the northwest, but some localized folding is noted. Granodiorite lithologies are seen at depth to the east of the zone where it merges with the western extension of Area A. Structurally Area D is on the northern side of the SMSZ splay, and locally the rocks appear less fractured and deformed than at Area A; however, Area D is notable for the depth of weathering which reaches 70 m in places.
Similar to Area A, gold mineralization coincides with the hydrothermal and tectonic breccia-carbonate zones, with brecciation providing conduits for mineralizing fluids, and further enhanced by alteration of some of the carbonate units. Mineralization is largely represented by pods and agglomerations of pyrite–gold, hosted in strongly albite–hematite ± potassic feldspar–silica-altered hydrothermal breccias, although the extensive oxidation and supergene enhancement to a depth of up to 70 m makes identification of the host lithology and original sulfide species difficult.
Mineralization is continuous as a series of lenticular zones across several drill sections, for 50–150 m and has been drill defined along a 500- m strike with a cumulative cross-strike width of 500 m. Mineralization occurs at depth within the fresh rock, but it is more sporadic and lower grade.
| June 30, 2026 | Page 71 of 291 |
| | Diamba Sud Gold Project, Kédougou Region, Senegal Technical Report |
| 7.3.3 | Karakara |
The Karakara deposit is 1.2 km southwest of Area D coincident with the interpreted northeast–southwest-trending structure associated with Area A and Area D.
The geology of Karakara is structurally complex but at its simplest it is a series of intercalated carbonate sediments, sandstones and volcaniclastic rocks with a variable dip to the east, and sandwiched to the east and west by granitic intrusions. Folding of the sediments is observed and this may be a control on the mineralization (Figure 7.5). Unlike Area D, the weathering profile is shallow at generally <5 m.
Figure 7.5 Schematic Cross-Section of Karakara Looking North
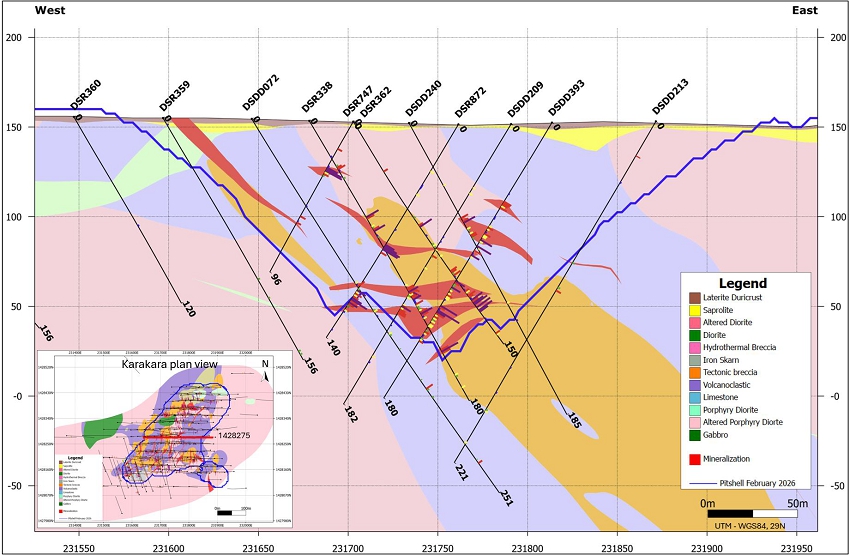
Figure prepared by Fortuna, 2026
Gold mineralization is predominantly associated with quartz–carbonate–hematite–albite–pyrite alteration within hydrothermally-altered and brecciated sedimentary rocks near intrusive contacts, with these interpreted as favorable sites for increased deformation and brecciation and hydrothermal fluid flow. Some mineralization in the granites has also been observed as small scale shear zones. Pyrite is the dominant sulfide species with minor associated pyrrhotite.
Mineralization at Karakara has been drill defined along a 400 m by 50 m zone and remains partially open at depth.
| 7.3.4 | Kassassoko |
The Kassassoko deposit is 2.5 km south of Karakara and has been mined by artisanal miners since 2022. Mineralization at Kassassoko was discovered via several altered granite rock chips recovered from artisanal pits returning elevated gold grades. Weathering is shallow at <5 m below surface.
| June 30, 2026 | Page 72 of 291 |
| | Diamba Sud Gold Project, Kédougou Region, Senegal Technical Report |
The geology at Kassassoko is characterized by a series of late-stage northeast–southwest-oriented aphanitic diorite dykes, clearly delineated within the high-resolution magnetic images. These dykes intrude near-vertically into the granite host. There is also an amorphous porphyritic diorite that appears to have intruded sub-horizontally from the southeast of the area and an extensive carbonate sequence is noted to the west (Figure 7.6).
Figure 7.6 Schematic Cross-Section of Kassassoko Looking North
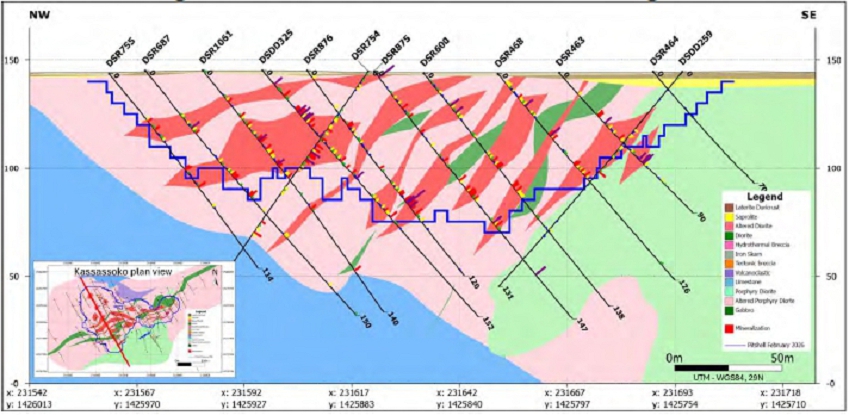
Figure prepared by Fortuna, 2026
Mineralization is hosted within the granite, which has undergone alteration to varying degrees of intensity by albite–hematite–pyrite–silica alteration minerals. Mineralization is typically observed adjacent to the diorite dykes within granite, indicative of a relationship between these intrusive contacts and the distribution of gold within the deposit.
Mineralization has been drill defined along a 600 m strike and 150 m across strike and remains open at depth. Further drilling is planned to test the depth extensions.
Geological mapping in the area has delineated the weathered granite host at surface adjacent to aphanitic diorite dykes. Northeast- to southwest-trending features evident in high-resolution magnetic images support the extension of this zone along a strike of approximately 700 m to the northeast, towards the Southern Arc prospect and to the southeast of Kassassoko, towards the DS1 permit boundary.
| 7.3.5 | Western Splay |
The Western Splay deposit is located approximately 5 km to the southwest of Area A. This deposit was first recognized by grab sample anomalies in 2016 and has been subject to some artisanal mining since discovery.
Geology is dominated by granite and diorite/gabbro rocks intruding a suite of volcanoclastic tectonic breccias and sedimentary rocks including carbonates, resulting in the rocks being locally brecciated and highly altered. A late phase porphyritic diorite intrusion crosscuts all earlier lithologies. Gold mineralization is associated with the
| June 30, 2026 | Page 73 of 291 |
| | Diamba Sud Gold Project, Kédougou Region, Senegal Technical Report |
granite/metasediment contact and also hosted in silica–hematite–albite–carbonate-altered limestones and hydrothermal breccias (Figure 7.7).
Figure 7.7 Schematic Cross-Section of Western Splay Looking North
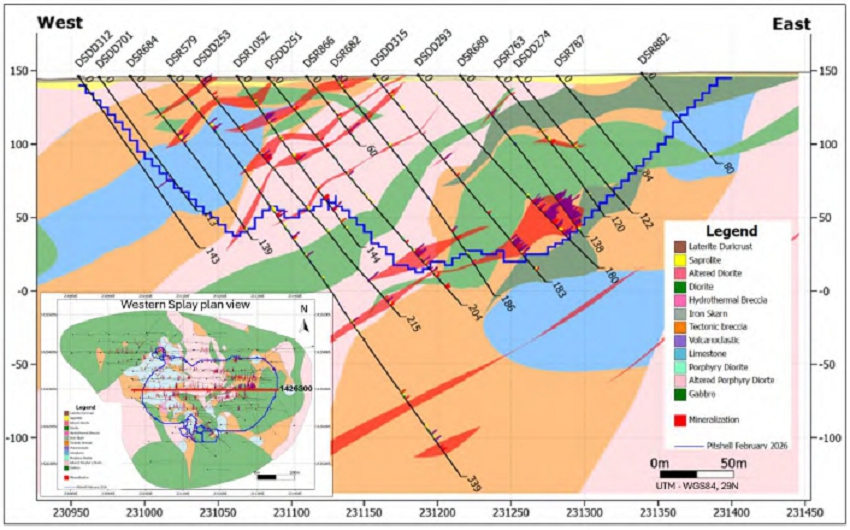
Figure prepared by Fortuna, 2026
Mineralization is largely represented by pods and agglomerations of pyrite–gold hosted in strongly albite–hematite ± potassic feldspar–quartz-altered hydrothermal breccias. Drill defined continuity has been shown along strike for 350 m, extending across strike for an aggregate of up to 250 m. Several sections remain open at depth beyond the deepest drilling to 150 m, with further deeper drilling planned.
| 7.3.6 | Moungoundi |
The Moungoundi deposit is approximately 1.7 km southwest of Karakara. It was discovered by soil geochemistry and was subject to artisanal mining activities from 2018 to 2022.
The main lithologies encountered are carbonates, often associated with magnetized ferrous skarn, tectonic breccias, sandstones and hydrothermal breccia, and granite. These assemblages are crosscut by later sub-horizontal diorite dykes.
Gold mineralization is interpreted to strike northeast and dip to the northwest, becoming subvertical in the east. Mineralization is associated with strong silica–carbonate–-hematite–albite alteration, accompanied by pyrite, and is mostly hosted by tectonic breccias, carbonates and hydrothermal breccias along the contact zones of the intrusive bodies (Figure 7.8).
| June 30, 2026 | Page 74 of 291 |
| | Diamba Sud Gold Project, Kédougou Region, Senegal Technical Report |
Figure 7.8 Schematic Cross-Section of Moungoundi Looking North
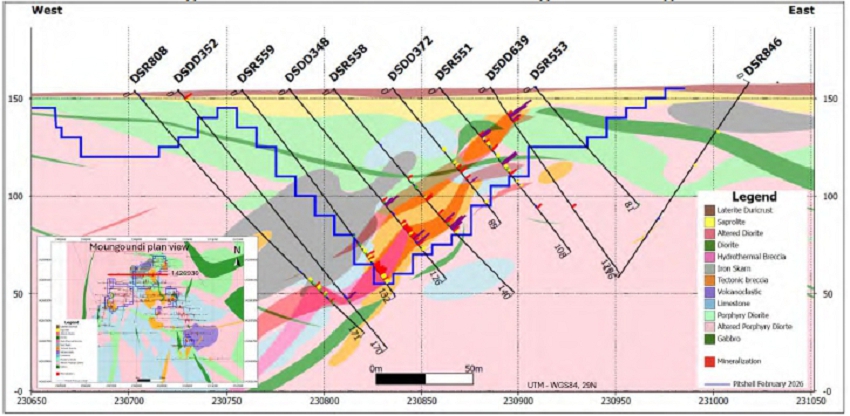
Figure prepared by Fortuna, 2026
| 7.3.7 | Southern Arc |
Located approximately 4 km south of Area A, Southern Arc was one of the earliest identified targets at Diamba Sud, located by soil and grab sampling in 2015. It was subject to some artisanal mining from 2015 to 2023.
The main lithologies comprise an intercalated sequence of variably porphyritic diorite, volcaniclastic and carbonate/limestone units with extensive tectonic and hydrothermal breccia development, and extensive metasomatism and hematitic alteration making identification of the protolith complicated at times. The carbonate sequences are generally preferentially mineralized, especially where brecciated, hosting extensive pyrite (plus gold) development (Figure 7.9). Weathering is shallow to generally <5 m depth.
Gold mineralization is interpreted to strike northeast and dip 30–50º to the northwest, in the east. Mineralization is associated with strong silica–carbonate–-hematite–albite alteration, accompanied by pyrite, and is mostly hosted by tectonic breccias, carbonates and hydrothermal breccias.
Mineralization has been drill defined over an area of 750 x 300 m to a depth of approximately 150 m where it remains open at depth and along strike indicating potential for further extension. Additional drilling is planned to better define the full extent of Southern Arc mineralization, both along strike and at depth.
| June 30, 2026 | Page 75 of 291 |
| | Diamba Sud Gold Project, Kédougou Region, Senegal Technical Report |
Figure 7.9 Schematic Cross-Section of Southern Arc Looking Northeast
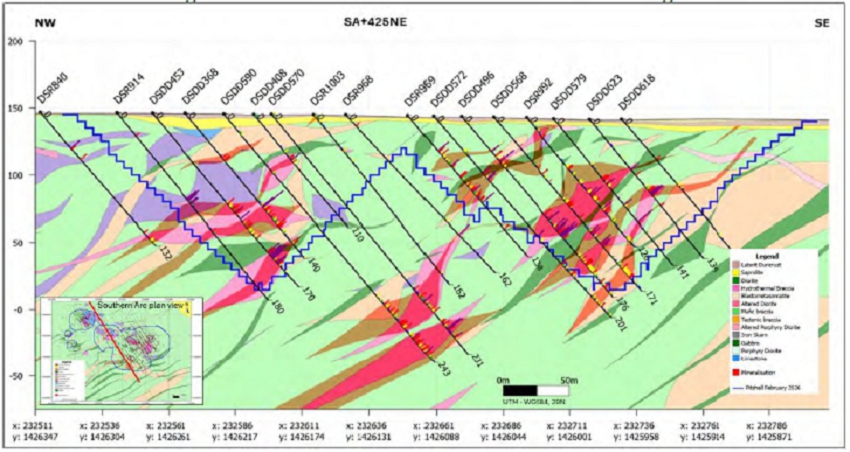
Figure prepared by Fortuna, 2026
| 7.4 | Comment on Section 7 |
In the opinion of the QP, knowledge of the settings, lithologies, and structural and alteration controls on mineralization at the Area A, Area D, Karakara, Kassassoko, Western Splay, Moungoundi and Southern Arc deposits is sufficient to support Mineral Resource and Mineral Reserve estimation.
| June 30, 2026 | Page 76 of 291 |
| | Diamba Sud Gold Project, Kédougou Region, Senegal Technical Report |
| 8 | Deposit Types |
| 8.1 | Mineral Deposit Type |
In keeping with the majority of the gold deposits found in the KKI, gold mineralization at Diamba Sud is considered to be of the orogenic type.
The KKI is associated with Paleoproterozoic-aged epigenetic gold deposits which occur in 2.25 Ga to 1.90 Ga granite-greenstone belts of the Birimian which were deformed and metamorphosed during the Paleoproterozoic Eburnean orogeny. Despite the abundance of known deposits, much of the region remains poorly explored.
The orogenic gold deposits in the Birimian Province have been classified into three groups: (pre-, syn-, and post-orogenic). The characteristics of the mineralization seen at Diamba Sud are most similar to those of the post-orogenic class.
Orogenic gold deposits exhibit a range of styles depending on metamorphic grade, setting, fluid type, and fluid/confining pressure. They often include spatially associated quartz shear veins, extension vein arrays, shear zone and disseminated sulfide styles. Vein dominated styles contain quartz–carbonate ± albite ± K-feldspar with up to 10% sulfides (pyrite with minor base metals) and associated Fe-carbonate albite, chlorite, scheelite, fuchsite and tourmaline as associated vein and hydrothermal alteration assemblages. Vein systems and shear zones are often semi-brittle in style, including both brittle veining styles (extension veins and fault hosted brecciated shear veins), which alternate with periods of ductile deformation, producing sequences of early folded and younger less strained vein systems during latter periods of regional deformation at peak to immediate post-peak metamorphic timing. Sigmoidal extension vein arrays are often present and are typical of the deposit style. This deposit type often also has great vertical extent providing potential for discovery of significant down dip and down plunge continuations of mineralized zones. Globally orogenic deposits are typically localized adjacent to major faults (shear zones) in second and third order shear zones within volcano-sedimentary (greenstone and sedimentary) belts between granitic domains. Fluid sources for these systems are often controversial: they generally involve a dominant metamorphic fluid component, consistent with their setting and relative timing, however in many districts, there is evidence for a contributing magmatic fluid inducing early oxide-rich alteration assemblages.
| 8.2 | Comment on Section 8 |
The gold deposits in Diamba Sud are classified as Birimian-style mesothermal orogenic gold deposits. Although not formally classified as such, the gold deposits of Diamba Sud show similarities to the post-collisional, atypical orogenic Loulo/Falémé-style deposits (Thebaud et al., 2020). This tentative classification is based on the correlation between the mineral assemblages, geochemistry, and the structural and lithological controls on mineralization with that of adjacent deposits classed as the same type which sit in close proximity to the SMSZ.
In the QP’s opinion an exploration model that uses an orogenic deposit model is reasonable as a regional targeting tool.
| June 30, 2026 | Page 77 of 291 |
| | Diamba Sud Gold Project, Kédougou Region, Senegal Technical Report |
| 9 | Exploration |
| 9.1 | Historical Exploration Activities |
Exploration activities conducted by owners of Diamba Sud prior to Fortuna are detailed in Section 6 of this Report.
| 9.2 | Exploration Activities Conducted by Fortuna |
Since Fortuna’s acquisition of Chesser in September 2023, exploration work has focused primarily on resource definition and extension drilling at the nine advanced prospect areas within the Project area as detailed in Section 10 of this Report.
Auger geochemistry is ongoing, with a small program of infill auger conducted in early 2025 between Karakara and the southern boundary of the DS1 block. A total of 645 holes were completed for 4,169 m. Auger collars are recorded with a hand-held differential global positioning system (DGPS) instrument, samples are logged into a portable device and samples analyzed by Olympus Vanta portable X-ray fluorescence (XRF) analyzer, using Portable ppb’s proprietary DetectORE process. A total of 22 samples returned results >100 ppb Au. One sample located ~300 m northwest of Western Splay returned 510 ppb Au. Sample locations with their assays are shown on Figure 9.1.
Figure 9.1 Fortuna Auger Sampling Results Across Portion of Northern Block of Diamba Sud Property
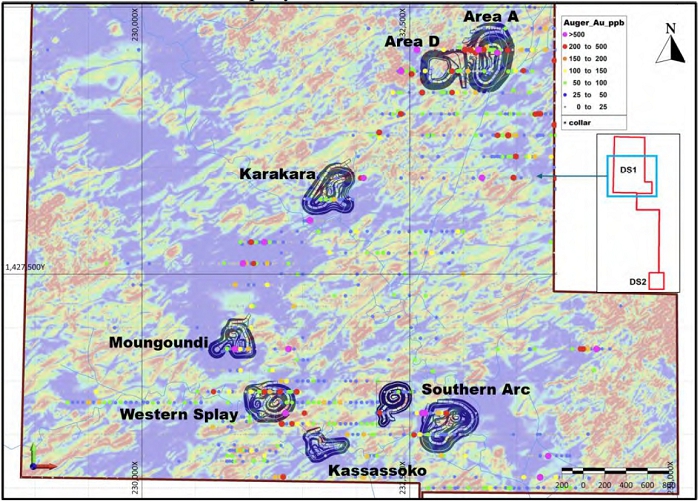
Figure prepared by Fortuna, 2026
| June 30, 2026 | Page 78 of 291 |
| | Diamba Sud Gold Project, Kédougou Region, Senegal Technical Report |
| 9.3 | Exploration Potential |
Section 7.3 outlines those deposits that still remain open and warrant additional drill testing.
| 9.3.1 | Bougouda |
The Bougouda prospect is in the DS2 block, approximately 20 km south of Areas A and D.
The main lithology at Bougouda is an altered dioritic intrusive crosscut by multiple northeast-trending shear zones. Gold mineralization is hosted by steeply-dipping quartz–hematite–pyrite carbonate veins within the shear zones.
As of the effective date of this Report, four such quartz veins with a total length of 1,800 m have been discovered at Bougouda, but artisanal mining activities on several other quartz veins indicate further potential.
| 9.3.2 | Gamba Gamba North |
The Gamba Gamba North prospect is in the far west of the DS1 block and abuts the boundary with the adjacent Afrigold mining license.
The prospect is divided into two areas, west and east, with the west area being the most interesting, and is dominated by granite and volcaniclastic rocks. The prospect area is approximately 250 m long and 150 m wide. In the western part of the prospect the geology comprises volcaniclastic lenses within a granitic intrusion with late north–south-trending diorite dykes. Gold mineralization is sporadic and hosted along the north–south-striking and steeply west dipping volcanoclastic/granite contact. The eastern zone is dominated by carbonates and volcaniclastic units and is yet to be evaluated.
| 9.3.3 | Other Prospects |
The other prospects identified to date including Area A North, Area D South and Kouroudiako have been identified as extensions of existing mineralized trends and, as of the effective date of this Report have received limited or no additional exploration work.
Potential for further mineralization is good within the Diamba Sub permit, with several surface geochemical anomalies still untested by drilling. Several other anomalies have been drilled with encouraging results but not sufficiently evaluated to support mineral resource estimation, and a wide variety of geophysical targets generated by Chesser are yet to be drill tested.
The structurally complex nature of the Project area suggests that potential mineralization is likely to be of a similar nature and size as the deposits already drilled. Thus far the majority of the drilling conducted has been on near-surface geochemical anomalies. There is some evidence to support mineralization at depth and the possibility of blind mineralization that does not reach surface also exists.
| 9.4 | Comment on Section 9 |
In the opinion of the QP:
| · | The mineralization style and setting of the Diamba Sud Project is sufficiently well understood to support the Mineral Resource and Mineral Reserve estimation. |
| June 30, 2026 | Page 79 of 291 |
| | Diamba Sud Gold Project, Kédougou Region, Senegal Technical Report |
| · | Exploration methods are consistent with industry practices and are adequate to support continuing exploration and Mineral Resource and Mineral Reserve estimation. |
| · | Exploration results support Fortuna’s interpretation of the geological setting and mineralization. |
| · | Continuing exploration may identify additional mineralization that may warrant drill testing. |
| June 30, 2026 | Page 80 of 291 |
| | Diamba Sud Gold Project, Kédougou Region, Senegal Technical Report |
| 10 | Drilling |
| 10.1 | Drilling Conducted by Chesser |
| 10.1.1 | Auger Drilling |
Within the Diamba Sud permit, a first pass auger drill program on a 400 x 100 m grid was completed. Follow up auger infill programs on a 200 x 25 m grid, and later 25 x 25 m grids were completed, targeting zones that produced anomalous gold from the first pass auger drill program. During both the first pass and infill programs, auger drilling was routinely halted at 3 m into the weathered bedrock/saprolite. Typically, each auger hole was drilled through three layers:
| · | Ferricrete. |
| · | The mottled zone between ferricrete and saprolite. |
| · | Saprolite. |
A representative sample of each of these layers was collected, with samples from the saprolite and mottled zone sent to SGS Bamako for analysis.
In total 3,848 auger holes were drilled, totaling 34,174 m. All samples were assayed for gold at SGS Bamako, and the majority were also analyzed with a Niton XL5 portable XRF instrument for a number of other elements.
The resulting gold anomalism map is shown in Figure 10.1. A total of 10 drill targets were defined and drilled between 2019 and 2023.
Chesser drilled Area A and discovered near-surface mineralization in highly-altered hydrothermal breccias. Drilling then moved to Area D where mineralization was also discovered in the near-surface oxide material.
| June 30, 2026 | Page 81 of 291 |
| | Diamba Sud Gold Project, Kédougou Region, Senegal Technical Report |
Figure 10.1 Contoured Auger Sampling Results Across the DS1 and DS2 Blocks of the Diamba Sud Project.
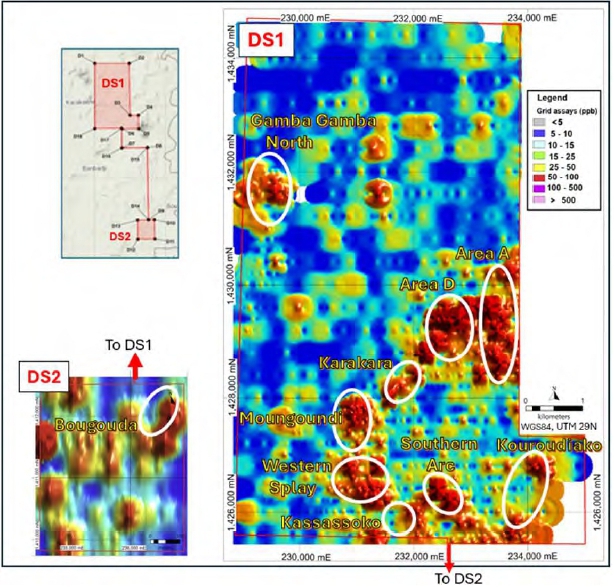
Figure prepared by Fortuna, 2025
| 10.1.2 | RC and Core Drilling |
Chesser commenced RC drilling in 2019. Drill contractors included Minerex, International Drilling Company (IDC) and Forage Technique Eau Drilling (FTE) during various campaigns through to July 2023. A total of 10 geochemical targets were RC or RC with core tail (RC-DDT) drilled, totaling 493 holes and 60,212 m. All holes were sampled at 1- or 2-m intervals in the oxide material and at 1-m intervals in the fresh rock. All samples were submitted to SGS Bamako or the ALS laboratory in Burkina Faso (ALS Burkina Faso).
The first core drilling at Diamba Sud was conducted in November 2019 over Areas A and D. In total, 116 core holes totaling 18,263 m were drilled between November 2019 and July 2023.
Figure 10.2 shows the collar locations for the Chesser drilling. Table 10.1 details the number of holes and meters drilled by prospect.
| June 30, 2026 | Page 82 of 291 |
| | Diamba Sud Gold Project, Kédougou Region, Senegal Technical Report |
Figure 10.2 Location Map of RC and Core Drill Holes Completed by Chesser
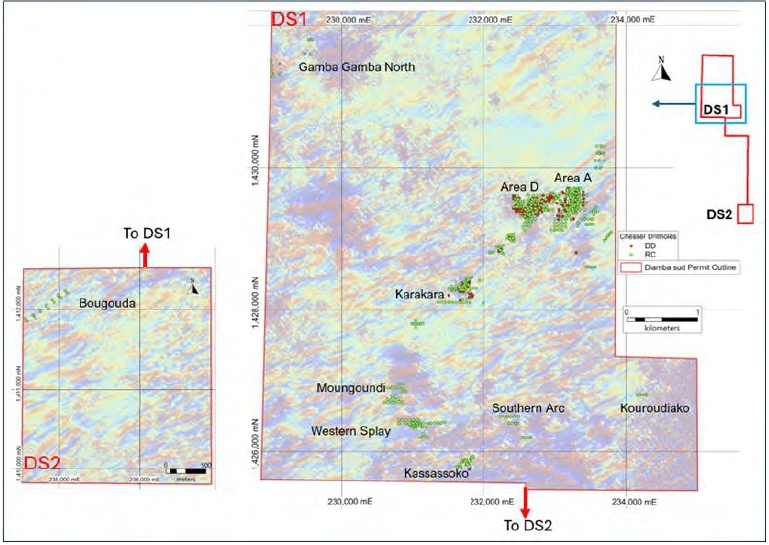
Figure prepared by Fortuna, 2025
Table 10.1 Reverse Circulation and Core Drilling Conducted by Chesser
| Area | Core | RC | RC-DDT | Total | |||||
| No. Holes |
Meters | No. Holes |
Meters | No. Holes |
Meters RC |
Meters Core |
No. Holes |
Meters | |
| Area A | 22 | 4,835 | 174 | 21,716 | 23 | 3,898 | 1,028 | 219 | 31,477 |
| Area D | 70 | 8,602 | 106 | 12,299 | 3 | 122 | 225 | 179 | 21,248 |
| Karakara | 22 | 4,508 | 52 | 6,973 | - | - | - | 74 | 11,481 |
| Western Splay | - | - | 43 | 4,617 | - | - | - | 43 | 4,617 |
| Kassassoko | 2 | 318 | 13 | 1,274 | - | - | - | 13 | 1,274 |
| Bougouda | - | - | 12 | 1,214 | - | - | - | 12 | 1,214 |
| Southern Arc | - | - | 22 | 2,356 | - | - | - | 24 | 2,674 |
| Gamba Gamba North | - | - | 14 | 1,310 | - | - | - | 14 | 1,310 |
| Moungoundi | - | - | 31 | 3,181 | - | - | - | 31 | 3,181 |
| Total | 127 | 19,805 | 467 | 54,940 | 26 | 4,020 | 1,253 | 609 | 78,475 |
| June 30, 2026 | Page 83 of 291 |
| | Diamba Sud Gold Project, Kédougou Region, Senegal Technical Report |
| 10.2 | Drilling Conducted by Fortuna |
After acquiring Chesser in 2023, Fortuna began an extensive program of verification and infill drilling across nine of the advanced prospect areas with the aim of collecting sufficient data to support the estimation of Mineral Resources for those deposits (Table 10.2). A total of 1,159 drill holes totaling 143,9620 m were drilled between October 2023 and January 16, 2026.
Table 10.2 Reverse Circulation and Core Drilling Conducted by Fortuna
| Area | Core | RC | RC-DDT | Total | |||||
| No. Holes |
Meters | No. Holes |
Meters | No. Holes |
Meters RC |
Meters Core |
No. Holes |
Meters | |
| Area A | 28 | 5,057.50 | 36 | 4,706.00 | 12 | 878.00 | 1,529.00 | 76 | 12,170.50 |
| Area D | 102 | 10,418.44 | 51 | 2,859.00 | - | - | - | 153 | 13,277.44 |
| Karakara | 79 | 11,069.00 | 63 | 8,179.00 | - | - | - | 142 | 19,248.00 |
| Western Splay | 50 | 7,551.00 | 66 | 7,259.00 | 6 | 689.00 | 908.00 | 122 | 16,407.00 |
| Kassassoko | 19 | 2,331.50 | 57 | 6,301.00 | - | - | - | 76 | 8,632.50 |
| Bougouda | 23 | 2,891.80 | 54 | 5,495.00 | - | - | - | 77 | 8,386.80 |
| Southern Arc | 183 | 27,723.80 | 123 | 15,972.00 | 1 | 108.00 | 83.00 | 307 | 43,886.80 |
| Moungoundi | 43 | 4,385.00 | 102 | 10,999.00 | - | - | - | 145 | 15,384.00 |
| Moungoundi North | 6 | 626.00 | 23 | 2,442.00 | - | - | - | 29 | 3,068.00 |
| Geophysical targets | - | - | 25 | 2,745.00 | - | - | - | 25 | 2,745.00 |
| Geochemical targets | - | - | 7 | 756.00 | - | - | - | 7 | 756.00 |
| Total | 533 | 72,054.04 | 607 | 67,713.00 | 19 | 1,675.00 | 2,520.00 | 1,159 | 143,962.04 |
The location of the holes by drilling methodology is shown in Figure 10.3.
| June 30, 2026 | Page 84 of 291 |
| | Diamba Sud Gold Project, Kédougou Region, Senegal Technical Report |
Figure 10.3 Map Showing Location of RC and Core Drilling Conducted by Fortuna
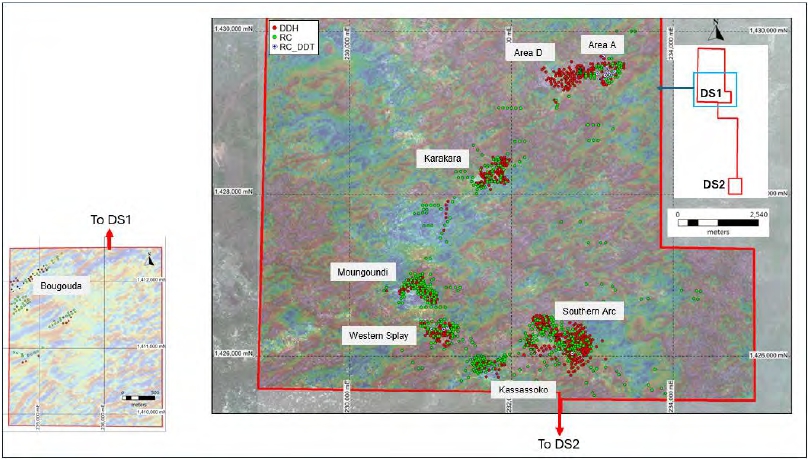
Figure prepared by Fortuna, 2026
| 10.3 | Drilling Used in the Estimation of Mineral Resources |
The number of DD, RC, and RC_DDT used in the geologic interpretation of deposits with estimated Mineral Resources are summarized in Table 10.3. The drilling comprises a mix of that conducted by Chesser and Fortuna with a data cut-off date of January 16, 2026, and excludes twin holes, holes abandoned prior to any samples being taken and one hole where concerns were raised regarding potential downhole contamination.
Table 10.3 Number of Holes and Meters Used in the Estimation by Deposit
| Deposit | Core | RC | RC-DDT | Total | ||||
| No. Holes | Meters | No. Holes | Meters | No. Holes | Meters | No. Holes | Meters | |
| Area A | 39 | 8,055 | 156 | 20,483 | 32 | 6,788 | 227 | 35,326 |
| Area D | 169 | 18,795 | 135 | 12,488 | 3 | 347 | 307 | 31,630 |
| Karakara | 96 | 15,123 | 115 | 15,152 | 0 | 0 | 211 | 30,275 |
| Western Splay | 50 | 7,551 | 109 | 11,876 | 6 | 1,597 | 165 | 21,024 |
| Kassassoko | 21 | 2,650 | 66 | 7,340 | 0 | 0 | 87 | 9,990 |
| Southern Arc | 187 | 28,335 | 137 | 17,282 | 1 | 191 | 325 | 45,808 |
| Moungoundi | 44 | 4,475 | 123 | 13,391 | 1 | 95 | 168 | 17,961 |
| Total | 606 | 84,984 | 841 | 98,012 | 43 | 9,018 | 1,490 | 192,014 |
| June 30, 2026 | Page 85 of 291 |
| | Diamba Sud Gold Project, Kédougou Region, Senegal Technical Report |
| 10.4 | Drilling Since the Mineral Resource Database Cut-off Date |
As at the effective date of this Report, an additional 181 drill holes totaling 28,566 m were completed after January 16, 2026, the database cut-off date. All drilling was conducted from surface. Assay results for intercepts of interest (>0.7 g/t Au) are summarized in Table 10.4
Table 10.4 Intervals of Interest in Holes Drilled Post Data Cut-off Date
| Hole ID | Easting | Northing | Elevation | EOH Depth |
Azimuth (°)* |
Dip (°)* |
From (m) |
To (m) |
Drilled Interval (m) |
ETW** (m) |
Au (g/t) |
Hole Type |
Deposit |
| DSR1065 | 231531 | 1425934 | 145 | 114 | 150 | -50 | 39 | 40 | 1 | 0.8 | 5.34 | RC | Kassassoko |
| DSR1066 | 231518 | 1425911 | 145 | 108 | 150 | -50 | NSI | RC | Kassassoko | ||||
| DSR1067 | 231600 | 1425810 | 144 | 117 | 150 | -50 | 13 | 20 | 7 | 5.6 | 3.3 | RC | Kassassoko |
| Including | 14 | 15 | 1 | 0.8 | 13.55 | RC | Kassassoko | ||||||
| DSR1069 | 231529 | 1425834 | 144 | 100 | 150 | -55 | 45 | 56 | 11 | 8.8 | 0.63 | RC | Kassassoko |
| 71 | 74 | 3 | 2.4 | 4.5 | RC | Kassassoko | |||||||
| Including | 73 | 74 | 1 | 0.8 | 12.2 | RC | Kassassoko | ||||||
| DSR1070 | 231544 | 1425812 | 144 | 88 | 150 | -55 | NSI | RC | Kassassoko | ||||
| DSR1072 | 231643 | 1425968 | 143 | 108 | 150 | -55 | NSI | RC | Kassassoko | ||||
| DSR1073 | 231629 | 1425998 | 143 | 120 | 150 | -55 | NSI | RC | Kassassoko | ||||
| DSR1074 | 231660 | 1425993 | 143.11 | 162 | 150 | -55 | NSI | RC | Kassassoko | ||||
| DSR1075 | 231577 | 1426003 | 144 | 90 | 150 | -55 | NSI | RC | Kassassoko | ||||
| DSR1076 | 232692 | 1425941 | 140 | 148 | 150 | -50 | 101 | 121 | 20 | 16 | 2.51 | RC | Southern Arc |
| Including | 102 | 103 | 1 | 0.8 | 15.45 | RC | Southern Arc | ||||||
| DSR1077 | 232714 | 1425941 | 141 | 154 | 150 | -50 | 55 | 64 | 9 | 7.2 | 0.81 | RC | Southern Arc |
| 89 | 115 | 26 | 20.8 | 1.97 | RC | Southern Arc | |||||||
| 131 | 141 | 10 | 8 | 1.85 | RC | Southern Arc | |||||||
| DSR1078 | 233003 | 1425811 | 142 | 108 | 150 | -50 | 2 | 17 | 15 | 12 | 0.99 | RC | Southern Arc |
| DSR1079 | 232978 | 1425861 | 142 | 162 | 150 | -50 | NSI | RC | Southern Arc | ||||
| DSR1080 | 233054 | 1425847 | 142 | 132 | 150 | -50 | 117 | 127 | 10 | 8 | 0.68 | RC | Southern Arc |
| DSR1081 | 233162 | 1425859 | 140 | 120 | 150 | -50 | NSI | RC | Southern Arc | ||||
| DSR1082 | 233398 | 1425652 | 140 | 120 | 150 | -50 | NSI | RC | Southern Arc | ||||
| DSR1083 | 233328 | 1425773 | 141 | 126 | 150 | -50 | NSI | RC | Southern Arc | ||||
| DSR1084 | 233301 | 1425818 | 141 | 144 | 150 | -50 | NSI | RC | Southern Arc | ||||
| DSR1085 | 233020 | 1425504 | 144 | 122 | 150 | -50 | NSI | RC | Southern Arc | ||||
| DSR1086 | 232994 | 1425549 | 143 | 120 | 150 | -50 | NSI | RC | Southern Arc | ||||
| DSR1087 | 232925 | 1425672 | 140.059 | 156 | 150 | -50 | NSI | RC | Southern Arc | ||||
| DSR1088 | 232587 | 1425907 | 142 | 150 | 150 | -50 | NSI | RC | Southern Arc | ||||
| DSR1089 | 232560 | 1425950 | 142.42 | 160 | 150 | -50 | NSI | RC | Southern Arc | ||||
| DSR1090 | 232541 | 1425889 | 142.42 | 120 | 150 | -50 | NSI | RC | Southern Arc | ||||
| DSR1091 | 232434 | 1425883 | 142.08 | 171 | 150 | -50 | NSI | RC | Southern Arc | ||||
| DSR1092 | 232405 | 1425926 | 141.75 | 126 | 150 | -50 | NSI | RC | Southern Arc | ||||
| June 30, 2026 | Page 86 of 291 |
| | Diamba Sud Gold Project, Kédougou Region, Senegal Technical Report |
| Hole ID | Easting | Northing | Elevation | EOH Depth |
Azimuth (°)* |
Dip (°)* |
From (m) |
To (m) |
Drilled Interval (m) |
ETW** (m) |
Au (g/t) |
Hole Type |
Deposit |
| DSR1093 | 232346 | 1425826 | 143.02 | 144 | 150 | -50 | NSI | RC | Southern Arc | ||||
| DSR1094 | 232305 | 1425699 | 146.82 | 144 | 150 | -50 | NSI | RC | Southern Arc | ||||
| DSR1095 | 232245 | 1425609 | 149.76 | 150 | 150 | -50 | NSI | RC | Southern Arc | ||||
| DSR1096 | 232225 | 1425657 | 148.33 | 144 | 150 | -50 | NSI | RC | Southern Arc | ||||
| DSR1097 | 232109 | 1425636 | 146 | 132 | 150 | -50 | NSI | RC | Southern Arc | ||||
| DSR1098 | 231995 | 1425634 | 149 | 138 | 150 | -50 | NSI | RC | Southern Arc | ||||
| DSR1099 | 231971 | 1425679 | 147 | 132 | 150 | -50 | NSI | RC | Southern Arc | ||||
| DSR1100 | 232034 | 1425769 | 144 | 174 | 150 | -50 | NSI | RC | Southern Arc | ||||
| DSR1101 | 232201 | 1425867 | 142 | 156 | 150 | -50 | NSI | RC | Southern Arc | ||||
| DSR1102 | 232104 | 1425833 | 142 | 126 | 150 | -50 | NSI | RC | Southern Arc | ||||
| DSR1103 | 232898 | 1426472 | 142 | 150 | 150 | -50 | NSI | RC | Southern Arc | ||||
| DSR1104 | 233125 | 1426945 | 142 | 66 | 150 | -50 | NSI | RC | Southern Arc | ||||
| DSR1105 | 233097 | 1426541 | 142 | 180 | 150 | -50 | NSI | RC | Southern Arc | ||||
| DSR1106 | 233077 | 1426577 | 144 | 132 | 150 | -50 | NSI | RC | Southern Arc | ||||
| DSR1107 | 233134 | 1426673 | 145 | 174 | 150 | -50 | NSI | RC | Southern Arc | ||||
| DSR1108 | 233214 | 1426543 | 143 | 132 | 150 | -50 | NSI | RC | Southern Arc | ||||
| DSR1109 | 233282 | 1426816 | 145 | 120 | 150 | -50 | NSI | RC | Southern Arc | ||||
| DSR1110 | 233248 | 1426861 | 147 | 126 | 150 | -50 | NSI | RC | Southern Arc | ||||
| DSR1111 | 233734 | 1425582 | 143 | 156 | 150 | -60 | NSI | RC | Kouroudiako | ||||
| DSR1112 | 233692 | 1425646 | 142 | 174 | 150 | -60 | NSI | RC | Kouroudiako | ||||
| DSR1113 | 233901 | 1425531 | 147 | 144 | 150 | -60 | NSI | RC | Kouroudiako | ||||
| DSR1114 | 233851 | 1425607 | 147 | 174 | 150 | -60 | 56 | 63 | 7 | 5.6 | 0.91 | RC | Kouroudiako |
| DSR1115 | 233773 | 1425835 | 147 | 138 | 150 | -60 | 57 | 59 | 2 | 1.6 | 4.74 | RC | Kouroudiako |
| DSR1116 | 231549 | 1426126 | 147 | 168 | 150 | -50 | 113 | 114 | 1 | 0.8 | 6.27 | RC | Kassassoko |
| 134 | 157 | 23 | 18.4 | 1.85 | RC | Kassassoko | |||||||
| DSR1117 | 231518 | 1426168 | 148 | 200 | 150 | -50 | 88 | 90 | 2 | 1.6 | 3.88 | RC | Kassassoko |
| 111 | 121 | 10 | 8 | 1.38 | RC | Kassassoko | |||||||
| DSR1118 | 231424 | 1426137 | 145 | 168 | 150 | -50 | 58 | 59 | 1 | 0.8 | 6.2 | RC | Kassassoko |
| 76 | 77 | 1 | 0.8 | 5.93 | RC | Kassassoko | |||||||
| 93 | 106 | 13 | 10.4 | 1.49 | RC | Kassassoko | |||||||
| 110 | 111 | 1 | 0.8 | 28.2 | RC | Kassassoko | |||||||
| 162 | 167 | 5 | 4 | 3.54 | RC | Kassassoko | |||||||
| Including | 164 | 165 | 1 | 0.8 | 13.95 | RC | Kassassoko | ||||||
| DSR1119 | 231406 | 1426176 | 142 | 186 | 150 | -50 | 88 | 95 | 7 | 5.6 | 4.97 | RC | Kassassoko |
| 88 | 89 | 1 | 0.8 | 19.1 | RC | Kassassoko | |||||||
| 131 | 138 | 7 | 5.6 | 2.92 | RC | Kassassoko | |||||||
| Including | 137 | 138 | 1 | 0.8 | 17.2 | RC | Kassassoko | ||||||
| 146 | 153 | 7 | 5.6 | 8.12 | RC | Kassassoko | |||||||
| June 30, 2026 | Page 87 of 291 |
| | Diamba Sud Gold Project, Kédougou Region, Senegal Technical Report |
| Hole ID | Easting | Northing | Elevation | EOH Depth |
Azimuth (°)* |
Dip (°)* |
From (m) |
To (m) |
Drilled Interval (m) |
ETW** (m) |
Au (g/t) |
Hole Type |
Deposit |
| Including | 146 | 148 | 2 | 1.6 | 21.88 | RC | Kassassoko | ||||||
| DSR1120 | 231818 | 1426064 | 145 | 132 | 150 | -50 | 63 | 68 | 5 | 4 | 1.58 | RC | Kassassoko |
| DSR1121 | 231788 | 1426107 | 146 | 198 | 150 | -50 | 8 | 16 | 8 | 6.4 | 1.39 | RC | Kassassoko |
| 142 | 149 | 7 | 5.6 | 1.05 | RC | Kassassoko | |||||||
| DSR1122 | 231769 | 1426152 | 145 | 180 | 150 | -50 | 49 | 63 | 14 | 11.2 | 3.50 | RC | Kassassoko |
| Including | 54 | 55 | 1 | 0.8 | 19.75 | RC | Kassassoko | ||||||
| DSR1123 | 231740 | 1426196 | 148 | 150 | 150 | -50 | NSI | RC | Kassassoko | ||||
| DSR1124 | 231714 | 1426235 | 149 | 186 | 150 | -50 | 78 | 85 | 7 | 5.6 | 1.05 | RC | Kassassoko |
| DSR1125 | 231690 | 1426277 | 150 | 168 | 150 | -50 | NSI | RC | Kassassoko | ||||
| DSR1126 | 231666 | 1426325 | 151 | 168 | 150 | -50 | NSI | RC | Kassassoko | ||||
| DSR1127 | 231642 | 1426374 | 150 | 162 | 150 | -50 | 135 | 141 | 6 | 4.8 | 1.97 | RC | Kassassoko |
| DSDD668 | 232210 | 1426169 | 145 | 168 | 150 | -50 | 78 | 84 | 6 | 4.8 | 2.65 | DD | Southern Arc |
| Including | 83 | 84 | 1 | 0.8 | 13.55 | DD | Southern Arc | ||||||
| DSDD669 | 232662 | 1426136 | 144 | 159 | 150 | -50 | 107 | 108 | 1 | 0.8 | 5.82 | DD | Southern Arc |
| DSDD670 | 231065 | 1426675 | 153 | 132 | 270 | -55 | 93 | 103 | 10 | 8 | 1.81 | DD | Moungoundi |
| 115 | 122.54 | 7.54 | 6.032 | 2.12 | DD | Moungoundi | |||||||
| DSDD671 | 232698 | 1426119 | 145 | 231 | 150 | -50 | 148 | 150 | 2 | 1.6 | 2.87 | DD | Southern Arc |
| 197 | 204 | 7 | 5.6 | 1.03 | DD | Southern Arc | |||||||
| DSDD672 | 232239 | 1426074 | 145 | 84 | 150 | -50 | NSI | DD | Southern Arc | ||||
| DSDD673 | 231065 | 1426650 | 152 | 215 | 270 | -55 | 114 | 119 | 5 | 4 | 1.07 | DD | Moungoundi |
| DSDD674 | 232314 | 1426105 | 143 | 176 | 150 | -50 | 43 | 49 | 6 | 4.8 | 2.71 | DD | Southern Arc |
| DSDD675 | 230793 | 1426847 | 153 | 119 | 90 | -55 | 41 | 45 | 4 | 3.2 | 2.38 | DD | Moungoundi |
| DSDD676 | 232910 | 1426021 | 143 | 138 | 150 | -50 | 39 | 46 | 7 | 5.6 | 0.75 | DD | Southern Arc |
| DSDD677 | 232298 | 1426137 | 143 | 210 | 150 | -50 | 40 | 42 | 2 | 1.6 | 4.83 | DD | Southern Arc |
| 63 | 74 | 11 | 8.8 | 1.01 | DD | Southern Arc | |||||||
| 97 | 101 | 4 | 3.2 | 1.95 | DD | Southern Arc | |||||||
| 208 | 210 | 2 | 1.6 | 3.72 | DD | Southern Arc | |||||||
| DSDD678 | 232882 | 1426046 | 143 | 171 | 150 | -50 | 28 | 33 | 5 | 4 | 6.93 | DD | Southern Arc |
| DSDD679 | 230765 | 1426844 | 152 | 149 | 90 | -55 | 13 | 14 | 1 | 0.8 | 6.42 | DD | Moungoundi |
| 104 | 119 | 15 | 12 | 1.01 | DD | Moungoundi | |||||||
| DSDD680 | 232864 | 1426338 | 143 | 297 | 150 | -50 | 83 | 87 | 4 | 3.2 | 4.3 | DD | Southern Arc |
| 93 | 99 | 6 | 4.8 | 12.94 | DD | Southern Arc | |||||||
| Including | 93 | 94 | 1 | 0.8 | 31.1 | DD | Southern Arc | ||||||
| And | 97 | 99 | 2 | 1.6 | 22.8 | DD | Southern Arc | ||||||
| DSDD681 | 232267 | 1426457 | 148 | 225 | 150 | -50 | NSI | DD | Southern Arc | ||||
| DSDD682 | 230957 | 1426720 | 152 | 104 | 90 | -55 | NSI | DD | Moungoundi | ||||
| DSDD683 | 232818 | 1426343 | 143 | 264 | 150 | -50 | 109 | 119 | 10 | 8 | 2.14 | DD | Southern Arc |
| DSDD684 | 230890 | 1426730 | 152 | 162 | 90 | -55 | NSI | DD | Moungoundi | ||||
| June 30, 2026 | Page 88 of 291 |
| | Diamba Sud Gold Project, Kédougou Region, Senegal Technical Report |
| Hole ID | Easting | Northing | Elevation | EOH Depth |
Azimuth (°)* |
Dip (°)* |
From (m) |
To (m) |
Drilled Interval (m) |
ETW** (m) |
Au (g/t) |
Hole Type |
Deposit |
| DSDD685 | 232913 | 1426341 | 143 | 263 | 150 | -50 | NSI | DD | Southern Arc | ||||
| DSDD686 | 232867 | 1425933 | 143 | 266 | 150 | -50 | NSI | DD | Southern Arc | ||||
| DSDD687 | 230925 | 1426394 | 147 | 128 | 90 | -60 | NSI | DD | Western Splay | ||||
| DSDD688 | 230935 | 1426350 | 146 | 180 | 90 | -55 | 156 | 165 | 9 | 7.2 | 2.28 | DD | Western Splay |
| DSDD689 | 232887 | 1426336 | 143 | 291 | 150 | -50 | 203 | 206 | 3 | 2.4 | 36.86 | DD | Southern Arc |
| 178 | 180 | 2 | 1.6 | 4.53 | DD | Southern Arc | |||||||
| 229 | 231 | 2 | 1.6 | 3.02 | DD | Southern Arc | |||||||
| DSDD691 | 232842 | 1425923 | 143 | 215 | 150 | -50 | 127 | 145 | 18 | 14.4 | 0.58 | DD | Southern Arc |
| DSDD692 | 232850 | 1426294 | 143 | 290 | 150 | -48 | 126 | 134 | 8 | 6.4 | 2.91 | DD | Southern Arc |
| 222 | 232 | 10 | 8 | 0.75 | DD | Southern Arc | |||||||
| DSDD693 | 230989 | 1426323 | 146 | 95 | 90 | -50 | NSI | DD | Western Splay | ||||
| DSDD694 | 232910 | 1426297 | 143 | 231 | 150 | -50 | 121 | 124 | 3 | 2.4 | 3.16 | DD | Southern Arc |
| DSDD695 | 232881 | 1425946 | 143 | 215 | 150 | -50 | 137 | 141 | 4 | 3.2 | 1.6 | DD | Southern Arc |
| 164 | 175 | 11 | 8.8 | 1.1 | DD | Southern Arc | |||||||
| 192 | 203 | 11 | 1.29 | DD | Southern Arc | ||||||||
| DSDD696 | 232789 | 1426398 | 143.49 | 288 | 150 | -50 | NSI | DD | Southern Arc | ||||
| DSDD697 | 232861 | 1426383 | 143 | 291 | 150 | -50 | NSI | DD | Southern Arc | ||||
| DSDD698 | 232943 | 1425938 | 143 | 200 | 150 | -50 | NSI | DD | Southern Arc | ||||
| DSDD699 | 232761 | 1426377 | 143.8 | 330 | 150 | -50 | 304 | 308 | 4 | 3.2 | 1.3 | DD | Southern Arc |
| 96 | 111 | 15 | 12 | 6.82 | DD | Southern Arc | |||||||
| Including | 98 | 101 | 3 | 2.4 | 18.87 | DD | Southern Arc | ||||||
| And | 103 | 104 | 1 | 0.8 | 22.6 | DD | Southern Arc | ||||||
| DSDD700 | 232831 | 1426378 | 143 | 273 | 150 | -50 | 189 | 197 | 8 | 6.4 | 1.51 | DD | Southern Arc |
| DSDD701 | 230969 | 1426293 | 143 | 113 | 90 | -55 | NSI | DD | Western Splay | ||||
| DSDD702 | 232973 | 1425978 | 143 | 187 | 150 | -50 | NSI | DD | Southern Arc | ||||
| DSDD703 | 233162 | 1425965 | 141 | 183 | 150 | -50 | NSI | DD | Southern Arc | ||||
| DSDD704 | 232723 | 1426413 | 144.55 | 393 | 150 | -50 | NSI | DD | Southern Arc | ||||
| DSDD705 | 233047 | 1426115 | 141.46 | 198.33 | 150 | -50 | NSI | DD | Southern Arc | ||||
| DSDD706 | 231238 | 1426275 | 145 | 122 | 90 | -50 | NSI | DD | Western Splay | ||||
| DSDD707 | 232783 | 1425818 | 140.71 | 180 | 150 | -50 | NSI | DD | Southern Arc | ||||
| DSDD708 | 233121 | 1426186 | 145 | 249 | 150 | -50 | NSI | DD | Southern Arc | ||||
| DSDD709 | 232760 | 1425810 | 140.33 | 215 | 150 | -50 | NSI | DD | Southern Arc | ||||
| DSDD710 | 232395 | 1426062 | 141.623 | 219 | 150 | -50 | NSI | DD | Southern Arc | ||||
| DSDD711 | 232888 | 1425895 | 143 | 264 | 150 | -50 | 20 | 25 | 5 | 4 | 1.08 | DD | Southern Arc |
| 107 | 124 | 17 | 13.6 | 0.87 | DD | Southern Arc | |||||||
| 128 | 145 | 17 | 13.6 | 0.71 | DD | Southern Arc | |||||||
| 209 | 215 | 6 | 4.8 | 1.08 | DD | Southern Arc | |||||||
| DSDD712 | 232429 | 1426086 | 141 | 243 | 150 | -50 | NSI | DD | Southern Arc | ||||
| June 30, 2026 | Page 89 of 291 |
| | Diamba Sud Gold Project, Kédougou Region, Senegal Technical Report |
| Hole ID | Easting | Northing | Elevation | EOH Depth |
Azimuth (°)* |
Dip (°)* |
From (m) |
To (m) |
Drilled Interval (m) |
ETW** (m) |
Au (g/t) |
Hole Type |
Deposit |
| DSDD713 | 232731 | 1425763 | 141 | 212 | 150 | -50 | NSI | DD | Southern Arc | ||||
| DSDD714 | 231287 | 1426347 | 148 | 92 | 90 | -50 | NSI | DD | Western Splay | ||||
| DSDD715 | 232355 | 1426010 | 142 | 207 | 150 | -50 | 92 | 96 | 4 | 3.2 | 2.20 | DD | Southern Arc |
| 100 | 126 | 26 | 20.8 | 2.91 | DD | Southern Arc | |||||||
| Including | 124 | 125 | 1 | 0.8 | 11.45 | DD | Southern Arc | ||||||
| 155 | 159 | 4 | 3.2 | 4.00 | DD | Southern Arc | |||||||
| 164 | 172 | 8 | 6.4 | 4.52 | DD | Southern Arc | |||||||
| Including | 169 | 170 | 1 | 0.8 | 24.60 | DD | Southern Arc | ||||||
| 176 | 181 | 5 | 4 | 3.71 | DD | Southern Arc | |||||||
| Including | 180 | 181 | 1 | 0.8 | 12.1 | DD | Southern Arc | ||||||
| DSDD716 | 232705 | 1425808 | 141 | 227 | 150 | -50 | 152 | 158 | 6 | 4.8 | 0.93 | DD | Southern Arc |
| DSDD717 | 232873 | 1425886 | 142 | 222 | 150 | -50 | 111 | 116 | 5 | 4 | 1.48 | DD | Southern Arc |
| 156 | 167 | 11 | 8.8 | 0.65 | DD | Southern Arc | |||||||
| DSDD718 | 232333 | 1426070 | 143 | 264 | 150 | -50 | 116 | 134 | 18 | 14.4 | 2.66 | DD | Southern Arc |
| DSDD719 | 232908 | 1425905 | 143 | 264 | 150 | -50 | 44 | 53 | 9 | 7.2 | 0.84 | DD | Southern Arc |
| 164 | 172 | 8 | 6.4 | 1.04 | DD | Southern Arc | |||||||
| 237 | 256 | 19 | 15.2 | 1.09 | DD | Southern Arc | |||||||
| DSDD720 | 232737 | 1425854 | 145 | 260 | 150 | -50 | NSI | DD | Southern Arc | ||||
| DSDD721 | 231243 | 1426255 | 144 | 110 | 90 | -50 | NSI | DD | Western Splay | ||||
| DSDD722 | 232370 | 1426101 | 145 | 204 | 150 | -50 | NSI | DD | Southern Arc | ||||
| DSDD723 | 232749 | 1425928 | 142 | 264 | 150 | -50 | 70 | 82 | 12 | 9.6 | 1.28 | DD | Southern Arc |
| Including | 86 | 87 | 1 | 0.8 | 23.5 | DD | Southern Arc | ||||||
| DSDD724 | 231229 | 1426400 | 149 | 107 | 90 | -60 | NSI | DD | Western Splay | ||||
| DSDD725 | 232405 | 1426126 | 141 | 225 | 150 | -50 | 49 | 58 | 9 | 7.2 | 1.157 | DD | Southern Arc |
| DSDD726 | 231544 | 1425966 | 144 | 94 | 150 | -55 | 78 | 87 | 9 | 7.2 | 1.53 | DD | Kassassoko |
| DSDD727 | 232761 | 1425866 | 141 | 151.4 | 150 | -50 | NSI | DD | Southern Arc | ||||
| DSDD728 | 232812 | 1425922 | 143 | 144 | 150 | -50 | NSI | DD | Southern Arc | ||||
| DSDD729 | 231589 | 1425904 | 145 | 112 | 150 | -55 | 40 | 66 | 26 | 20.8 | 0.68 | DD | Kassassoko |
| LOSS | 41 | 42 | 1 | DD | Kassassoko | ||||||||
| DSDD730 | 232463 | 1426123 | 142 | 186 | 150 | -50 | 43 | 52 | 9 | 7.2 | 0.82 | DD | Southern Arc |
| DSDD731 | 232740 | 1425900 | 141 | 183 | 150 | -50 | 61 | 72 | 11 | 8.8 | 0.70 | DD | Southern Arc |
| DSDD732 | 232289 | 1426047 | 143 | 141 | 150 | -50 | 33 | 37 | 4 | 3.2 | 1.33 | DD | Southern Arc |
| DSDD733 | 232822 | 1425853 | 142 | 182 | 150 | -50 | NSI | DD | Southern Arc | ||||
| DSDD734 | 231566 | 1425922 | 145 | 101 | 150 | -55 | 16 | 23 | 7 | 5.6 | 1.36 | DD | Kassassoko |
| DSDD735 | 232654 | 1425897 | 141 | 171 | 150 | -50 | 128 | 155 | 27 | 21.6 | 1.90 | DD | Southern Arc |
| DSDD736 | 232267 | 1426084 | 141 | 192 | 150 | -50 | NSI | DD | Southern Arc | ||||
| DSDD737 | 231793 | 1425932 | 144 | 80 | 150 | -55 | NSI | DD | Kassassoko | ||||
| DSDD738 | 232543 | 1425979 | 142 | 102 | 150 | -50 | NSI | DD | Southern Arc | ||||
| June 30, 2026 | Page 90 of 291 |
| | Diamba Sud Gold Project, Kédougou Region, Senegal Technical Report |
| Hole ID | Easting | Northing | Elevation | EOH Depth |
Azimuth (°)* |
Dip (°)* |
From (m) |
To (m) |
Drilled Interval (m) |
ETW** (m) |
Au (g/t) |
Hole Type |
Deposit |
| DSDD739 | 232258 | 1426133 | 144 | 153 | 150 | -50 | NSI | DD | Southern Arc | ||||
| DSDD740 | 232496 | 1425964 | 142 | 81 | 150 | -50 | 6 | 12 | 6 | 4.8 | 1.12 | DD | Southern Arc |
| DSDD741 | 232151 | 1426016 | 144 | 144 | 150 | -50 | DD | Southern Arc | |||||
| DSDD742 | 232240 | 1426128 | 144 | 168 | 150 | -50 | 20 | 23 | 3 | 2.4 | 5.18 | DD | Southern Arc |
| DSDD743 | 232340 | 1425998 | 147 | 210 | 150 | -50 | NSI | DD | Southern Arc | ||||
| DSDD744 | 233075 | 1425803 | 141 | 122.75 | 150 | -50 | NSI | DD | Southern Arc | ||||
| DSDD745 | 232287 | 1426094 | 144 | 165 | 150 | -50 | NSI | DD | Southern Arc | ||||
| DSDD746 | 232382 | 1425975 | 141 | 186 | 150 | -50 | NSI | DD | Southern Arc | ||||
| DSDD747 | 232665 | 1425928 | 140 | 182 | 150 | -50 | 106 | 113 | 7 | 5.6 | 1.24 | DD | Southern Arc |
| 140 | 156 | 16 | 12.8 | 0.86 | DD | Southern Arc | |||||||
| DSDD748 | 232713 | 1425897 | 140 | 154 | 150 | -50 | 108 | 111 | 3 | 2.4 | 2.13 | DD | Southern Arc |
| 117 | 120 | 3 | 2.4 | 5.26 | DD | Southern Arc | |||||||
| DSDD749 | 232330 | 1426127 | 142 | 150 | 150 | -50 | 18 | 20 | 2 | 1.6 | 4.00 | DD | Southern Arc |
| DSDD750 | 232399 | 1426003 | 142 | 147 | 150 | -50 | NSI | DD | Southern Arc | ||||
| DSDD751 | 232628 | 1425937 | 141 | 179 | 150 | -50 | 153 | 159 | 6 | 4.8 | 4.62 | DD | Southern Arc |
| Including | 153 | 154 | 1 | 0.8 | 14.6 | DD | Southern Arc | ||||||
| DSDD752 | 232678 | 1425899 | 140 | 188 | 150 | -50 | 117 | 129 | 12 | 9.6 | 1.16 | DD | Southern Arc |
| DSDD753 | 232316 | 1426150 | 142 | 159 | 150 | -50 | NSI | DD | Southern Arc | ||||
| DSDD754 | 232385 | 1426027 | 142 | 153 | 150 | -50 | NSI | DD | Southern Arc | ||||
| DSDD755 | 232603 | 1425982 | 141 | 150 | 150 | -50 | NSI | DD | Southern Arc | ||||
| DSDD756 | 232364 | 1426145 | 142 | 168 | 150 | -50 | NSI | DD | Southern Arc | ||||
| DSDD757 | 232434 | 1426029 | 141 | 150 | 150 | -50 | 49 | 50 | 1 | 0.8 | 7.77 | DD | Southern Arc |
| DSDD758 | 232667 | 1425983 | 141 | 224 | 150 | -50 | 138 | 140 | 2 | 1.6 | 3.39 | DD | Southern Arc |
| 160 | 193 | 33 | 26.4 | 1.96 | DD | Southern Arc | |||||||
| DSDD759 | 232689 | 1425885 | 140 | 227 | 150 | -50 | NSI | DD | Southern Arc | ||||
| DSDD760 | 232348 | 1426172 | 142 | 210 | 150 | -50 | NSI | DD | Southern Arc | ||||
| DSDD761 | 232350 | 1425980 | 142 | 237 | 150 | -50 | 212 | 220 | 8 | 6.4 | 0.63 | DD | Southern Arc |
| DSDD762 | 232644 | 1425974 | 141 | 215 | 150 | -50 | 145 | 154 | 9 | 7.2 | 1.12 | DD | Southern Arc |
| DSDD762 | 232644 | 1425974 | 141 | 215 | 150 | -50 | 145 | 154 | 9 | 7.2 | 1.12 | DD | Moungoundi |
| 170 | 177 | 7 | 5.6 | 1.32 | DD | Moungoundi | |||||||
| 181 | 197 | 16 | 12.8 | 2.12 | DD | Moungoundi | |||||||
| DSDD763 | 232954 | 1425816 | 142 | 257 | 150 | -50 | NSI | DD | Southern Arc | ||||
| DSDD764 | 231012 | 1426621 | 151 | 152 | 270 | -55 | NSI | DD | Moungoundi | ||||
| DSDD765 | 232582 | 1426027 | 141 | 224 | 150 | -50 | 196 | 207 | 11 | 8.8 | 3.65 | DD | Southern Arc |
| Including | 202 | 203 | 1 | 0.8 | 16.1 | DD | Southern Arc | ||||||
| DSDD766 | 232442 | 1426164 | 142 | 168 | 150 | -50 | NSI | DD | Southern Arc | ||||
| DSDD767 | 231086 | 1426651 | 152 | 224 | 270 | -55 | 81 | 95 | 14 | 11.2 | 1.86 | DD | Moungoundi |
| DSDD768 | 232307 | 1425953 | 143 | 228 | 150 | -50 | NSI | DD | Southern Arc | ||||
| June 30, 2026 | Page 91 of 291 |
| | Diamba Sud Gold Project, Kédougou Region, Senegal Technical Report |
| Hole ID | Easting | Northing | Elevation | EOH Depth |
Azimuth (°)* |
Dip (°)* |
From (m) |
To (m) |
Drilled Interval (m) |
ETW** (m) |
Au (g/t) |
Hole Type |
Deposit |
| DSDD770 | 231535 | 1426150 | 147 | 204 | 270 | -50 | 110 | 117 | 7 | 5.6 | 2.08 | DD | Kassassoko |
| DSDD771 | 233026 | 1425893 | 143 | 233 | 150 | -50 | NSI | DD | Southern Arc | ||||
| DSDD772 | 231089 | 1426674 | 152 | 197 | 270 | -55 | 63 | 69 | 6 | 4.8 | 4.08 | DD | Moungoundi |
| 95 | 113 | 18 | 14.4 | 0.89 | DD | Moungoundi | |||||||
| 121 | 127 | 6 | 4.8 | 0.90 | DD | Moungoundi | |||||||
| *Azimuth and dip values taken at collar location **ETW = Estimated True Width NSI = No Significant Interval | |||||||||||||
The QP has reviewed the results against the block models and has determined that the new drilling would not materially change the Mineral Resources of Area A, Area D, Karakara, and Moungoundi, detailed in this Report. Drilling at Southern Arc (84 of the 117 holes) has identified extended mineralization to the south, east and at depth to the currently defined Mineral Resources as detailed in this Report. An updated estimate of the Southern Arc deposit is planned for the end of 2026 to assess the potential of this additional mineralization.
| 10.4.1 | Grade Control Drilling |
In parallel with the 2026 exploration drilling program, Fortuna is drilling grade control programs on the Area D, Southern Arc and Karakara deposits to validate the continuity of mineralization and assess grade variability. As at the effective date of this Report, a total of 34 RC holes have been completed at Area D, 63 RC holes at Southern Arc, and 47 RC holes at Karakara. The grade control drilling is being conducted on a 10 x 10 m grids, with each hole reaching a depth of 50 m.
The grade control drilling is scheduled to be completed during the second quarter of 2026. Results, as at the effective date of this Report, indicate no significant deviations in mineralization compared to the Mineral Resource block model.
| 10.5 | Extent of Drilling |
The extent of drilling varies for each of the deposits and prospects. Those that have been drilled sufficiently to support Mineral Resources are based on a grid of exploration holes approximately 25–50 m apart.
The Area A deposit has been drilled over an approximate area of 700 m (north to south) and 500 m (east to west) to depths around 280 m from surface. Exploration drilling has increased in depth to the south.
The Area D deposit has been drilled over an approximate area of 650 m (north to south) and 700 m (east to west) to depths around 250 m from surface. Exploration drilling has increased in depth to the south.
The Karakara deposit has been drilled over a strike length of approximately 700 m (north–northeast to south–southwest) and depths of 230 m from surface. Exploration drilling has increased in depth in response to the plunge of mineralization to the southwest.
The Kassassoko deposit has been drilled over an approximate area of 700 m (southwest to northeast) and 250 m (southeast to northwest) to depths around 150 m from surface. Exploration drilling has increased in depth to the south.
| June 30, 2026 | Page 92 of 291 |
| | Diamba Sud Gold Project, Kédougou Region, Senegal Technical Report |
The Western Splay deposit has been drilled over an approximate area of 500 m (north to south) and 700 m (east to west) to depths around 280 m from surface. Exploration drilling has increased in depth to the south.
The Moungoundi deposit has been delineated by drilling over an approximate strike extent of 400 m (north–south), across a lateral width of approximately 500 m (east–west), to depths reaching approximately 150 m below surface
The Southern Arc deposit and its extensions have been delineated by drilling over an approximate strike length of 1,700 m (northeast–southwest) and a width of 1,100 m (northwest–southeast), to depths of up to 250 m below surface.
Mineralization is subdivided into two domains: Southern Arc Central and Southern Arc North. Southern Arc Central has been drilled over an approximate strike extent of 1,250 m and a width of 700 m (northwest–southeast), with drilling depths reaching up to 250 m below surface. Southern Arc North, representing the northeastern extension of the Kassassoko deposit, extends over approximately 550 m along strike and 350 m in width, with drilling completed to depths of up to 185 m below surface.
The Area D South prospect has been drilled over a strike length of approximately 600 m (northeast to southwest) to depths around 120 m from surface. Follow-up drilling is required to verify the continuity of mineralization to the southwest.
The Gamba Gamba North prospect drilled by Chesser is split into two main mineralized zones (refer to Figure 10.2). The eastern zone has been drilled over a strike length of 300 m (north–northeast to south–southwest) to a depth of 150 m from surface; the western zone has been drilled over a strike length of 300 m (north to south) to a depth of 125 m from surface. The drilling follows the plunge of mineralization, generally getting deeper towards the south–southwest.
The Bougouda prospect has been drilled over a strike length of approximately 1,800 m (northeast to southwest) and to depths of 150 m from surface (refer to Figure 10.3).
| 10.6 | Drilling Techniques and Procedures |
Drilling techniques and procedures have remained the same under the management of Boya for the Chesser and Fortuna drill programs.
| 10.6.1 | Reverse Circulation Drilling |
RC drilling was conducted using an Atlas Copco T3W rig with a 950CFM compressor and an Atlas Copco Hurricane booster. All holes were cased with PVC to 6 m and then drilled using a 5.5-inch RC hammer bit. Samples were collected at 1-m intervals from an onboard cyclone then split on site to produce two 1.5 kg samples. The first sample was submitted for analysis, the second stored as a duplicate sample.
| 10.6.2 | Core Drilling |
Core drilling was conducted with Atlas Copco CS14 and CT14 core drill rigs, depending on the contractor. The majority of holes are drilled to HQ (63.5 mm core diameter) and NQ (47.6 mm) sizes. In Area D where the oxide material can be difficult to keep drill holes from collapsing, holes are drilled PQ (85 mm) from surface to fresh rock before stepping down to HQ and NQ as appropriate to conditions and depth.
| June 30, 2026 | Page 93 of 291 |
| | Diamba Sud Gold Project, Kédougou Region, Senegal Technical Report |
Chesser completed nine twin holes over Area A, Area D and Karakara for targeting mineralized intervals for metallurgical sampling in 2022. The assay results supported the interpretations.
| 10.6.3 | Geological and Geotechnical Logging Procedures |
RC chips were collected and logged at the drill site and stored in standard chip trays for further investigation as appropriate.
Core is logged in detail at the field camp, using LogChief software and transferred electronically to DataShed for database management. Lithologies, alteration, mineralization and structures are all logged to industry standards.
Geotechnical information collected routinely is at an exploration level of detail, and includes total recovery, rock quality designation (RQD) measurements and occasional fracture frequency information. However, 14 holes (2,100 m) were fully logged to higher geotechnical standards as part of geotechnical studies on Area A, Area D, Karakara and Bougouda deposits to support rock mass classification of the various units. These specific geotechnical drill holes were logged in detail including recovery, RQD, fracture frequency, infill type, discontinuity types, roughness, thickness, and strike and dip of major structures. Intact geotechnical samples were also collected to conduct laboratory testing for deriving intact rock strength properties. The detailed geotechnical site investigation also included the usage of an acoustic televiewer (ATV) to obtain geophysical readings of the discontinuities.
| 10.6.4 | Photography |
All RC chip trays were photographed wet using standard digital single-lens reflex (SLR) equipment.
All drill core was photographed using the same digital SLR equipment with core boxes loaded into a frame apparatus to allow for consistent photography. All core was photographed both wet and dry prior to being cut for sampling.
| 10.6.5 | Core Orientation |
Drill core orientation was recorded using an “Axis Champ Ori” Orientation tool.
Immediately after drilling, core was transferred from the core barrel and pieced together on a V-rail rack. The orientation line determined by the orientation tool during drilling was then drawn along the entire length of the assembled core.
| 10.6.6 | Drill Core Recovery |
Drill core recoveries were measured at the drill rig prior to boxing for transportation.
From recovery logs, recorded weighted average recoveries were measured as 70% in the ferricrete, 88% in the saprolite, 86% in the transition zone (saprock) and 96% in fresh rock.
Occasional issues with recovery of core were encountered where the water table is close to surface within the weathered zones. Additionally, recovery can be poor in interpreted karst environments and fault zones.
| 10.6.7 | Collar Surveying |
All drill holes are located prior to drilling by handheld GPS instrument and set up by the responsible geologist. All collars are later surveyed using a DGPS by an external service provider.
| June 30, 2026 | Page 94 of 291 |
| | Diamba Sud Gold Project, Kédougou Region, Senegal Technical Report |
| 10.6.8 | Downhole Surveying |
Downhole surveys of RC holes were conducted using a Reflex Gyro Sprint IQ survey tool. After drilling was completed, the survey tool was used to take readings every 10 m down the hole and a second set of readings were taken on the way out. The average readings were calculated and used to display the drill hole trace.
Downhole surveys of the core holes were conducted using a variety of survey tools, as there were several rigs operating at the same time in different areas. These included Reflex EZ Shot, Reflex Gyro Sprint IQ and Axis Champ gyroscopic tools. Readings were collected every 30 m down the hole.
| 10.7 | Sample Length Versus True Thickness |
The relationship between the sample intercept lengths and the true width of mineralization varies in relation to the intersection angle between the mineralized structures (that vary in both strike and dip direction) and the inclined nature of the core holes. Drilling is conducted as close to perpendicular to the mineralized structures as possible, once the orientation of mineralization has been established. Calculated estimated true widths (ETWs) are always reported together with actual sample lengths by considering the angle of intersection between drill hole and the mineralized structure. Exaggeration of the true width of mineralization does not occur during modeling as the actual contacts are modeled in three-dimensional space to create mineralized wireframes.
| 10.8 | Example of Drill Intercepts |
The orientation of the drilling to the mineralization was illustrated by the cross-sections provided with the deposit descriptions in Section 7.3 (Figure 7.3, Figure 7.4, Figure 7.5, Figure 7.6, Figure 7.7, Figure 7.8, Figure 7.9).
| 10.9 | Comment on Section 10 |
The QP has the following observations and conclusions regarding drilling conducted at the Diamba Sud project since September 2023.
| · | Data was collected using industry standard practices. |
| · | Drill orientations are appropriate to the orientation of mineralization. |
| · | Core logging meets industry standards for exploration of orogenic style deposits. |
| · | Geotechnical logging is sufficient to support Mineral Resource and Mineral Reserve estimation. |
| · | Collar surveys have been conducted using industry-standard instrumentation. |
| · | Downhole surveys performed during the drill programs have used industry-standard instrumentation. |
| · | Drilling information is sufficient to support Mineral Resource and Mineral Reserve estimates. |
There are no drilling, sampling or recovery factors that could materially impact the accuracy and reliability of the results known to the QPs that have not been discussed in the Report.
| June 30, 2026 | Page 95 of 291 |
| | Diamba Sud Gold Project, Kédougou Region, Senegal Technical Report |
| 11 | Sample Preparation, Analyses, and Security |
| 11.1 | Sample Preparation Prior to Dispatch of Samples |
Other than drying splitting and bagging, no sample preparation is conducted at the Diamba Sud field camp. Samples are combined into batches; normally each hole is a batch unless they are particularly long or short. Optimal batch sizes for the analytical laboratories are in the order of 100 samples. Quality control (QC) samples are also inserted in accordance with the company’s standard batch control sheet and the samples then sealed in large sacks for dispatch.
| 11.2 | Sample Collection |
Sampling of RC holes is conducted at the drilling rig with one split sample collected every meter for routine analysis and the second sample split again for duplicate sample submission.
Sampling of drill core is conducted after geological logging and marking of the core for sampling. Core is split using a diamond saw. The half core that does not contain the orientation line is selected for sampling. Intervals are based upon geology with nominal sample lengths of 1 m, although this may be variable. Standard sampling procedures dictate a minimum sample length of 0.4 m and a maximum of 1.2 m. For duplicate samples only, the remaining half core is quartered (cut in half again) for submission to the laboratory.
PQ core is sampled as quarter core for routine sample submission and the second quarter is collected for duplicate sample submission.
All samples are combined into batches for submission to the laboratory. Nominally each batch should represent a specific drill hole; however, the preferred batch size at the laboratory is 100 samples, thus longer drill holes tend to be split into two or three batches. Once sampled and labelled, samples are packed into large sacks and sealed ready for transportation.
| 11.3 | Sample Dispatch |
Drill samples are delivered to either ALS Global’s sample preparation facility in Kédougou, Senegal (ALS Kédougou) or SGS Bamako, by Boya personnel, normally twice a week during the drilling season.
| 11.4 | Sample Preparation |
The preparation of both RC and core samples is conducted by external laboratories, either by ALS in Kédougou or by SGS in Bamako.
ALS Global’s preparation code for both RC and core samples is Prep-31H. This involves crushing to 75% passing 2 mm, splitting to 500 g, and pulverizing to 85% passing 75 µm. Once complete the samples are submitted to ALS Global’s analytical laboratory in Ouagadougou, Burkina Faso (ALS Ouagadougou). Transportation of the samples from ALS Kédougou to ALS Ouagadougou is managed by ALS Global.
SGS Mineral Services’ equivalent preparation code is PRP 87 and also involves crushing to 75% passing 2 mm, splitting to 500 g, and pulverizing to 85% passing 75 µm. Once complete, the samples are assayed at the same laboratory in Bamako.
| June 30, 2026 | Page 96 of 291 |
| | Diamba Sud Gold Project, Kédougou Region, Senegal Technical Report |
| 11.5 | Analytical Methods |
Samples from Diamba Sud are assayed for gold only. The assay method used for all the drill samples is a fire assay fusion with an atomic absorption spectroscopy (AAS) finish. Assaying is performed at ALS Ouagadougou or Bamako. The ALS Global and SGS Mineral Services codes for this method are Au-AA24 and FA505 respectively.
ALS Ouagadougou’s lower detection limit for this method is 0.005 g/t, and the upper detection limit is 10 g/t Au, whilst SGS Bamako’s lower, and upper detection limits are 0.01 g/t and 100 g/t Au respectively.
Samples returning values >10 g/t Au are re-submitted for fire assay fusion with a gravimetric finish (ALS Global code Au-GRA22 – reporting limit 0.05–10,000 g/t Au, SGS Mineral Services code G_FAG50V – reporting limit 0.5 –3,000 g/t Au).
| 11.6 | Laboratory Accreditation |
ALS Global and SGS are independent, privately-owned analytical laboratory groups. The preparation laboratories in Kédougou and Bamako and the analytical laboratories in Ouagadougou and Bamako are supported by a Quality Management System (framework which is designed to highlight data inconsistencies sufficiently early in the process to enable corrective action to be taken in time to meet reporting deadlines. The analytical laboratories are ISO/IEC 17025:2017 accredited for chemical and physical testing for the determination of gold content using the fire assay method with an atomic absorption finish.
| 11.7 | Sample Security and Chain of Custody |
All samples remain under strict control between drilling and delivery to the laboratory for sample preparation. RC samples are transported to the core shed within the field camp after each shift. Core is transported to the core storage facility daily. The core storage facility is located within the fenced field camp and under strict control. All RC and DD samples were transported by company vehicles or commercial courier to ALS Kédougou, or SGS Bamako. Prepared sample pulps from ALS Kédougou were then transported via commercial courier to ALS Ouagadougou.
| 11.8 | Bulk Density Determination |
Bulk density values were determined for each individual lithology via the collection of density measurements using the Archimedes method (water immersion measurements) based on drill core sampled across each of the deposits. For un-weathered core a sample 10–15 cm long is selected, weighed in air, and weighed in water, with the density then recorded in the database for the corresponding interval and lithology type. For fully or partially weathered samples, samples are dried, weighed, wrapped in clingfilm then weighed in water. Company personnel on site were responsible for the collection of this data according to standardized density data collection procedures.
| 11.9 | Quality Assurance and Quality Control |
Fortuna operates company-wide standard operational procedures for quality control of sampling and assaying. In addition, Chesser operated their own QA/QC procedure as described in Section 12 of this Report. These procedures are in keeping with global industry standards for analytical QA/QC. Fortuna has a corporate procedure for monitoring laboratory performance across West Africa with regular reports on QC results
| June 30, 2026 | Page 97 of 291 |
| | Diamba Sud Gold Project, Kédougou Region, Senegal Technical Report |
submitted monthly. Strict rules are applied to processing the results from the laboratory, resulting in occasional resubmission of batches or part batches for reanalysis due to QC failures. Additional details are provided in Section 12 on these procedures.
| 11.9.1 | Database |
The database for the Diamba Sud Project is currently maintained in Maxwell’s DataShed system, managed by a database administrator from the Boya exploration office. Data collected in the field (geological logging, collar information, drill hole metadata) are collected digitally and validated daily at the end of shift by the supervising geologist, and then directly synchronized into the database to prevent transcription errors. Tough-books and MS surface tablets are used to capture data in the field using Maxwell LogChief.
Additional validation checks are completed regularly by the administrator for relational consistency within the data collected (from-to sample interval overlaps, data exceeding recorded holes depths, missing data intervals etc.).
| 11.9.2 | Certified Reference Materials |
Certified reference materials (CRMs) are used to assess analytical accuracy.
Analytical values for a given CRM that lie outside a tolerance of ±2 standard deviations from the reference value are considered warnings. Should two or more CRMs within a batch trigger warnings, the batch is considered to have failed with respect to accuracy. The batch is re-assayed, and an investigation is undertaken into the causes of the spurious results. If a CRM returns a value outside ±3 standard deviations from the reference value, it is deemed to have failed and the batch, or partial batch, is re-assayed, and an investigation undertaken.
A variety of CRMs are submitted as part of the sampling process in accordance with company standards. At Diamba Sud the CRMs used are produced by Ore Research & Exploration Pty Ltd (OREAS) in Victoria, Australia. CRMs submitted during Chesser and Fortuna drill programs are at a rate of 4 per 100 samples (4% insertion rate). Generally, the QA/QC results returned from the analysis of all CRMs from the Chesser and Fortuna programs are deemed acceptable, and the gold analyses are suitable for use in the estimation of Mineral Resources. No specific concerns are apparent from the data and control chart plots for all CRM analyses.
| 11.9.3 | Field Duplicates |
Duplicates are obtained from the second core drill split or second RC split. Both original and duplicate samples are prepared and analyzed in the same batch.
Field duplicate samples submitted during Chesser and Fortuna drilling programs are to test the precision levels from each batch at a rate of 5 per 100 samples (5%).
In both the case of duplicate core and chips, although precision levels monitored via half absolute relative difference methods indicate high variability, the data show reasonable correlation coefficients and linear regressions. Duplicate results for both core and chips are deemed acceptable and indicate no concerns with sample quality at the Project.
| 11.9.4 | Blanks |
Blanks submitted during the Chesser and Fortuna drill programs are at a rate of 3 per 100 samples (3%). The blank material is a barren basalt material from the Tambacounda Formation.
| June 30, 2026 | Page 98 of 291 |
| | Diamba Sud Gold Project, Kédougou Region, Senegal Technical Report |
Blank results returned from the Chesser and Fortuna programs do not indicate issues with sample contamination or switching and are deemed acceptable.
| 11.9.5 | Twin holes |
Chesser Resources completed 9 twin holes over Area A, Area D and Karakara for targeting mineralized intervals for metallurgical sampling in 2022. The assay results supported the geologic interpretations.
| 11.10 | Comment on Section 11 |
It is the opinion of the QP that the sample collection and preparation, analytical techniques, security and QA/QC protocols implemented by Chesser and Fortuna for the Diamba Sud Project are consistent with standard industry practices and are suitable for the reporting of exploration results and for use in Mineral Resource and Mineral Reserve estimation.
The sampling procedures are adequate for and consistent with the style of gold mineralization under consideration.
Analytical results and density determinations are considered to pose minimal risk to the overall confidence level of the Mineral Resource and Mineral Reserve estimates.
| June 30, 2026 | Page 99 of 291 |
| | Diamba Sud Gold Project, Kédougou Region, Senegal Technical Report |
| 12 | Data Verification |
| 12.1 | Introduction |
| 12.1.1 | Chesser |
Chesser results were verified by Fortuna re-logging of historical core. Quality control results were assessed including assays for standards, blanks, duplicates and results of twin hole drilling. Additional infill drilling was conducted at all deposits to support and confirm historical drilling and geological interpretation developed by Chesser.
| 12.1.2 | Fortuna |
Since taking ownership in 2023, Fortuna staff have adhered to a stringent set of procedures for data storage and validation, performing verification of its data on a monthly basis for all data relating to drilling. The Project employs a Database Administrator who is responsible for oversight of data entry, verification and database maintenance.
Fortuna re-logged historical drill core across Area A, Area D and Karakara to validate the historic geological models and mineralized intervals with the re-logging showing good correlation with the pre-existing interpretations. In addition, Fortuna carried out infill drilling and a trial grade-control program of 34 holes on close spaced centers of 10 x 10 m (mimicking the expected grade control drilling pattern spacing) on Area D to validate the block model interpretation. Results from these programs have confirmed geologic interpretations and provide support for resource modeling.
| 12.2 | Database |
An audit of the database is conducted quarterly by the Regional Resource Geologist. A report is filed listing any discrepancies and Boya staff are required to make the necessary corrections.
The database was reviewed and validated by Fortuna staff in July 2025. The data verification procedure includes specific checks to verify the data used in the Mineral Resource estimation as set out in Table 12.1.
Table 12.1 Database Checklist Summary
| Collar Checks | Survey Checks | Geology Checks | Assay Checks | Density Checks |
| Missing assays | Missing assays | Missing collars | Missing collars | Missing collars |
| Missing downhole survey | Missing downhole assays | Missing downhole surveys | Missing downhole surveys | Missing downhole surveys |
| Missing geology | Missing geology | Missing geology | Missing geology | Depth > total collar depth |
| Missing density | Azimuth corrected for magnetic declination | Overlapping from to records | Overlapping from to records | |
| Duplicate holes | Magnetic declination checked and correctly applied | Gaps between from to records | Gaps between from to records | |
| Duplicate collar positions | Survey record at collar | Depth > total collar depth | Depth > total collar depth | |
| X-Y collar locations within boundary | Down plunging holes have negative dip | Geocodes consistent and match set legend | Modelling assay fields identified | |
| Total hole length | Up plunging holes have positive dip | Missing/unspecified intervals | Units and detection limits identified | |
| Total hole length < any entries in other tables | Duplicate survey records | Analytical data conversion, storage and conversion factors | ||
| Initial survey direction in collar table | Depth > total collar depth | Modelling grade ranges and assay methodology |
| June 30, 2026 | Page 100 of 291 |
| | Diamba Sud Gold Project, Kédougou Region, Senegal Technical Report |
| Collar Checks | Survey Checks | Geology Checks | Assay Checks | Density Checks |
| Collars checked against surface DTM and underground solids | Traces of new holes checked in plan and section | Highest grades are within stoichiometric limits | ||
| Cross section check completed | Anomalies checked and removed from traces | Zero grades do not exist | ||
| Planned collar locations excluded | Inconsistencies in alphanumeric fields | Sum of oxides =< 100% | ||
| Spaces in data entry for collar coordinates | Missing or unspecified intervals | |||
| Inconsistencies in Alphanumeric fields | Intervals awaiting assay results identified | |||
| No spaces in data entry |
No significant inconsistencies were discovered. Minor inconsistencies identified relating to spelling or coding errors were reported to the Database Administrator for correction in the database.
| 12.3 | Collar and Downhole Surveys |
Downhole surveys were historically taken using a REFLEX EZ shot tool and more recently with the REFLEX GYRO tool. Downhole surveys are validated during the drilling campaign by exploration geologists in three dimensions using Leapfrog Geo. If significant deviation is observed the drilling contractor (IDC or FTE) will be requested to conduct a second survey to confirm. If there are issues, then the equipment will be calibrated and the hole surveyed multiple times to ensure a consistent result. A magnetic declination correction, by year, is applied to any REFLEX EZ Shot readings manually prior to importation to DataShed using values from NCEI Geomagnetic Calculators (NOAA).
| 12.4 | Geologic Logs and Assays |
The use of Maxwell LogChief software supports the electronic collection of geological and geotechnical information in the field using a standardized system of drop-down menus to promote consistency. In addition, all information is electronically transferred to the database thereby removing the risk of transcription errors.
Assays received by Boya are reported in both Portable Document Format (pdf) and Microsoft Excel format. Both documents are compared and only imported into the database if they are in agreement. Importation is performed electronically without requiring transcription.
Assay data are verified using a comprehensive QAQC program including the insertion of CRMs, blanks and duplicates for assays reported by ALS and SGS laboratories, as described in Section 11.9.
| 12.5 | Sample Type Comparison |
Reverse circulation, diamond and reverse circulation with diamond tail holes are drilled at Diamba Sud. A comparison between the different drill hole types was conducted using log probability plots for each deposit. Both separately and globally, the drill hole types are considered comparable and do not require separation or omission from the database prior to estimation. All drill hole types were included within this Mineral Resource estimate.
| June 30, 2026 | Page 101 of 291 |
| | Diamba Sud Gold Project, Kédougou Region, Senegal Technical Report |
| 12.6 | Mineral Resource Estimation |
The Mineral Resource estimation methodology followed by Fortuna, as described in Section 14 of this Report, is based on the 2019 CIM Guidelines.
Each step of the process is documented, and a checklist developed that is signed off by Fortuna staff and the corporate reviewer in this case, the QP, when completed.
An extensive database audit was conducted on July 7, 2025, by the Mineral Resource geologists in the Technical Services team prior to Mineral Resource estimation. The findings indicated that only minor coding errors were present that required correction.
Validation checks were also performed upon importation into Leapfrog Geo and Datamine mining software and included searches for overlaps or gaps in sample and geology intervals, inconsistent drill hole identifiers, collar comparisons to topographic surface, and missing data. No significant discrepancies were identified.
| 12.7 | Data Verification by Qualified Persons |
| 12.7.1 | Mr. Eric Chapman |
Mr. Chapman performed a site visit as outlined in Section 2.3.1.
Mr. Chapman reviewed the database audit results and verified the database and is of the opinion that it is suitable for the estimation of Mineral Resources.
Mr. Chapman checked randomly selected collar and downhole survey information for each campaign against source documentation. In addition, Mr. Chapman completed a comparison of the surface collar coordinates against the surveyed topographic surface. The wireframes showed a good correlation with collar locations recorded in the database.
A validation of the downhole readings was performed by Mr. Chapman by randomly selecting readings taken from individual holes and assessing the level of deviation between successive data points. If significant discrepancies (e.g. >15%) existed between data points, the information was flagged and follow-up checks performed. Mr. Chapman is of the opinion that collar and downhole survey data has been determined using appropriate techniques and is suitable for usage in Mineral Resource estimation. To further verify the assay data, Mr. Chapman randomly selected assay data from the database and compared the assay results stored to those of the original assay certificates. Mr. Chapman is of the opinion that the geological and assay data stored in the database is representative of that reported from the laboratories and is suitable for usage in Mineral Resource estimation.
No material sample biases were identified from the QA/QC programs. Analytical data that were considered marginal were accounted for in the resource classifications.
Mr. Chapman reviewed the steps used in the Mineral Resource estimate and the outcome and considers the resulting estimate can be used as the basis for the FS as summarized in this Report. The data validation included reviews of:
| · | Site visit to review core, geological interpretation and discuss estimation methodology. |
| · | The database (as described above). |
| · | Wireframe modelling to define geological, weathering and mineralization domains. |
| June 30, 2026 | Page 102 of 291 |
| | Diamba Sud Gold Project, Kédougou Region, Senegal Technical Report |
| · | Statistical evaluation to confirm domaining is appropriate and adheres to the geological interpretation. |
| · | Variographical analysis to confirm modelled variograms correspond to experimental variography. |
| · | Cross validation results. |
| · | Statistical checks on each field contained in the resource block model to confirm minimum/maximum values are not exceeded. |
| · | Mineral Resource classification. |
| · | Depletion of mined out and remnant/isolated blocks from the model. |
| · | Verification of pit shell parameters used to constrain Mineral Resources and costs for the determination of cut-off grades. |
| · | Reported Mineral Resources correspond with block models. |
| 12.7.2 | Mr. Paul Weeden |
Mr. Weedon performed site visits as set out in Section 2.3.2.
During site visits Mr. Weedon conducted the following activities:
| · | Review of the geological interpretation and drill core with Boya exploration personnel. |
| · | Review of exploration plans and program objectives to ensure any changes to interpretations based on results were appropriately addressed. |
| · | Review of results and interpretations, and discussed changes to interpretation and understanding of the mineralization and geological controls to ensure a consistent approach to exploration. |
| · | Review of external specialist consultants reports with the site geologists, and provided feedback and direction for further investigations. |
Mr. Weedon is of the opinion that the geological and sample data collected adequately reflect deposit dimensions, true widths of mineralization, and the style of the deposits. The geological models are appropriate and reasonable and reflect the current understanding of the various Diamba Sud deposits.
| 12.7.3 | Mr. Raul Espinoza |
Mr. Espinoza completed a site visit as outlined in Section 2.3.4.
Mr. Espinoza has conducted a comprehensive review of the Project by engaging in detailed discussions with Boya mining engineers and project consultants. These interactions covered review of the inputs used for cut-off grade determination, geotechnical observations assumptions, open pit optimization strategy, mine design and proposed mine and plant infrastructure, equipment selection, LOM and scheduling plans. Additionally, Mr. Espinoza consulted with Boya personnel with specialized knowledge regarding local environmental and social aspects of the project to address requirements related to environmental, social, and permitting aspects, and their related impact on operating and capital expenditure.
| June 30, 2026 | Page 103 of 291 |
| | Diamba Sud Gold Project, Kédougou Region, Senegal Technical Report |
| 12.7.4 | Mr. Mathieu Veillette |
Mr. Veillette performed a site visit as outlined in Section 2.3.3.
Geotechnical and hydrogeological data indicate that the proposed open pit mining method, and WRSF are suitable, based on rock stability. Hydrology data indicate that any future plant will have sufficient access to water to meet its requirements. Mr. Veillette reviewed Piteau’s open pit design work with respect to wall design and stability analyses. Mr. Veillette also reviewed all work performed by Knight Piésold with respect to the TSF and water management related work. He also provided input on WRSF slope designs and open pit offset requirements for slope stability.
Mr. Veillette is of the opinion that the geotechnical and hydrogeological data is appropriate for infrastructure design purposes to a FS level and is sufficient for usage in pit designs used for the estimation of Mineral Resources and Mineral Reserves.
| 12.7.5 | Mr. Ruan Venter |
Mr. Venter performed a site visit as outlined in Section 2.3.4.
Mr. Ruan Venter reviewed the metallurgical testwork database, sample selection basis, testwork procedures, and results used to support the process design criteria, recovery assumptions, and metallurgical conclusions presented in this Report. The initial metallurgical sample selection was completed during previous study phases. Additional metallurgical testwork completed during the FS phase to address identified data gaps was selected by the FS team. Mr. Venter reviewed the resulting testwork dataset and considers it adequate to support the process design and recovery assumptions used in the FS.
| 12.8 | Comment on Section 12 |
The QPs are of the opinion that the data verification programs performed on the data collected from the Project are adequate to support the geological interpretations, the analytical and database quality, geotechnical and hydrogeological considerations, metallurgical recoveries, Mineral Resource and Mineral Reserve estimation and the FS at the Diamba Sud Project and that, to the knowledge of the QPs, there are no limitations on or failure to conduct such verification that would materially impact the results.
| June 30, 2026 | Page 104 of 291 |
| | Diamba Sud Gold Project, Kédougou Region, Senegal Technical Report |
| 13 | Mineral Processing and Metallurgical Testing |
| 13.1 | Introduction |
Metallurgical testwork for the Diamba Sud Project was completed through a staged program managed by Maca Interquip Mintrex (MIQM) and Lycopodium, with laboratory testing undertaken by ALS Metallurgy Pty Ltd (ALS) in Perth, Western Australia.
The metallurgical program included comminution, gravity recovery, cyanidation, rheology, mineralogical and variability testwork to support process plant design and evaluation of the various ore domains within the Project.
Initial testwork was completed on samples from Area A, Area D and Karakara deposits. Additional metallurgical investigations were subsequently completed on samples from the Kassassoko, Western Splay, Bougouda, Southern Arc and Moungoundi deposits to expand the metallurgical dataset and assess variability across ore sources included in the mine plan.
The testwork program included:
| · | Comminution testing, including Bond crushing work index (CWi), Bond ball mill work index (BWi), Bond abrasion index (Ai) and semi-autogenous grind (SAG) mill competency (SMC) breakage and hardness parameter (A*b) testing. |
| · | Gravity concentration and intensive cyanidation testing. |
| · | Cyanide leach optimization and leach kinetics investigations. |
| · | Carbon adsorption testing. |
| · | Rheology investigations. |
| · | Bulk mineralogical investigations and diagnostic testing. |
This Report section summarizes the metallurgical testwork completed and the key outcomes relevant to process plant design and projected metallurgical performance.
| 13.2 | Testwork – Area A, Area D and Karakara |
| 13.2.1 | Introduction |
Testwork was conducted on samples obtained from Area A, Area D and Karakara deposits. Additional bottle roll recovery tests were also completed on samples from several supplementary exploration targets to support the overall metallurgical assessment of the mineralized material.
| 13.2.2 | Sample Preparation |
Sample Selection and Identification
A total of 25 samples were composited from fresh and oxide mineralization from Area A, Area D, and Karakara. Composite selection was performed by Mintrex and Fortuna. Sample selection criteria included wide geographical coverage, a range of depths, lithologies, gold grades and proximity of drill holes. Table 13.1 shows the sample ID, drill hole ID, sample mass, assay head grade, and lithology of the selected samples. Figure 13.1 shows the plan view of the metallurgical sample locations for Area A and Area D. Figure 13.2 (cross-section C as shown on Figure 13.1) is a section through the mineralization at
| June 30, 2026 | Page 105 of 291 |
| | Diamba Sud Gold Project, Kédougou Region, Senegal Technical Report |
Area A and Area D. Figure 13.3 is a plan view of the samples taken in the Karakara area, with Figure 13.4 a cross-section through the deposit at section line B shown on Figure 13.3.
Table 13.1 Samples taken for metallurgical testing
| Sample ID | Drill Hole ID | Total Sample Mass (kg) |
Head Grade (g/t Au) |
| DA Oxide-1 | DSDD051, DSDD052 | 77 | 3.81 |
| DA Oxide-2 | DSDD042 | 96 | 2.06 |
| DA Oxide-3 | DSDD034, DSDD016 | 44.5 | 0.63 |
| DA Fresh-1 | DSDD052, DSDD032 | 47 | 1.38 |
| DA Fresh-2 | DSDD042, DSDD033 | 57.5 | 1.60 |
| DA Fresh-3 | DSDD007, DSDD016 | 49 | 2.60 |
| DB Oxide-1 | DSDD040 | 109 | 6.22 |
| DB Oxide-2 | DSDD035, DSDD029 | 41 | 5.81 |
| DB Fresh-1 | DSDD014 | 67 | 1.68 |
| DB Fresh-2 | DSDD035, DSDD029 | 42 | 1.63 |
| DC Oxide-1 | DSDD036, DSDD030 | 28.5 | 3.14 |
| DC Fresh-1 | DSDD019, DSDD030 | 49 | 1.01 |
| AA Fresh-1 | DSDD020, DSDD064 | 72.5 | 3.72 |
| AB Fresh-1 | DSDD024, DSDD059 | 72.5 | 1.28 |
| AB Fresh-2 | DSDD058, DSDD003 | 50.5 | 1.15 |
| AB Fresh-3 | DSDD011 | 24.9 | NA |
| AB Fresh-4 (Previously AB Oxide-1) | DSDD011, DSDD059 | 61 | 0.27 |
| AC Fresh-1 | DSDD013, DSDD008 | 87 | 1.48 |
| AC Fresh-2 | DSDD060, DSDD068 | 63.5 | 2.26 |
| AC Fresh-3 | DSDD002 | 27 | 2.00 |
| KARA Fresh-1 | DSDD069, DSDD077 | 54 | 4.62 |
| KARB Fresh-1 | DSDD075, DSDD076 | 75 | 2.63 |
| KARB Fresh-2 | DSDD076 | 61 | 0.03 |
| KARB Fresh-3 | DSDD073 | 79 | 3.07 |
| KARC Fresh-1 | DSDD074 | 78.5 | 2.77 |
| KARC Fresh-2 | DSDD071 | 56 | 3.11 |
| DAOxideVAR1 | DSDD044, DSDD047 | 63.5 | 0.88 |
| DBOxideVAR1 | DSDD015, DSDD035, DSDD038, DSDD041 | 82 | 2.09 |
| DCOxideVAR1 | DSDD036 DSDD057 | 32 | 0.58 |
| DCOxideVAR2 | DSDDM098 | 53 | 3.47 |
| DCOxideVAR3 | DSDDM097 | 56 | 8.95 |
| DCOxideVAR4 | DSDDM100 | 50 | 1.67 |
| DAFreshVAR1 | DSDD044 | 45 | 6.88 |
| DBFreshVAR1 | DSDD015, DSDD018, DSDD055 | 77.4 | 1.46 |
| DCFreshVAR1 | DSDD030, DSDD054, DSDD057 | 39 | 0.9 |
| AAFreshVAR1 | DSDDM094 | 162 | 2.01 |
| AAFreshVAR2 | DSDD064 | 66.5 | 0.45 |
| ABFreshVAR1 | DSDD066, DSDD067 | 60.5 | 3.75 |
| ABFreshVAR2 | DSDD066 | 59 | 1.62 |
| ACFreshVAR1 | DSDD004, DSDD008 | 89.5 | 1.23 |
| ACFreshVAR2 | DSDD060 | 22 | 0.53 |
| KARAFreshVAR1 | DSDDM106 | 97 | 5.07 |
| KARBFreshVAR1 | DSDDM103 | 71 | 5.81 |
| KARBFreshVAR2 | DSDDM103 | 105 | 4.76 |
| KARCFreshVAR1 | DSDD070 | 86 | 1.07 |
| June 30, 2026 | Page 106 of 291 |
| | Diamba Sud Gold Project, Kédougou Region, Senegal Technical Report |
Note: Sample IDs are named to reference the resource pit area, section, weathering and sequential sample number. For example, “DA Oxide-1” refers to pit Area “D” and section “A”, the sample is categorized as mostly “Oxide” and is the first in that area and section. Variability samples are prefixed by “Var”.
Figure 13.1 Map Showing Location of Metallurgical Samples for Area A and Area D
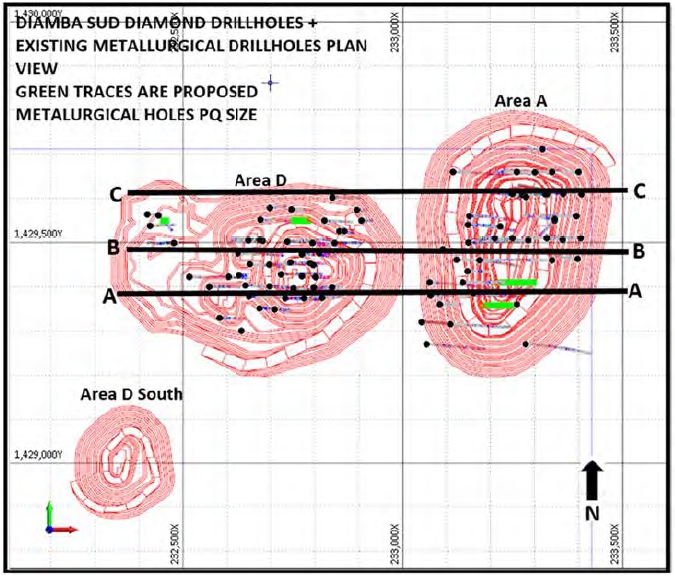
Figure prepared by Fortuna, 2024
| June 30, 2026 | Page 107 of 291 |
| | Diamba Sud Gold Project, Kédougou Region, Senegal Technical Report |
Figure 13.2 Metallurgical Sample Location for Area A and Area D – Section C
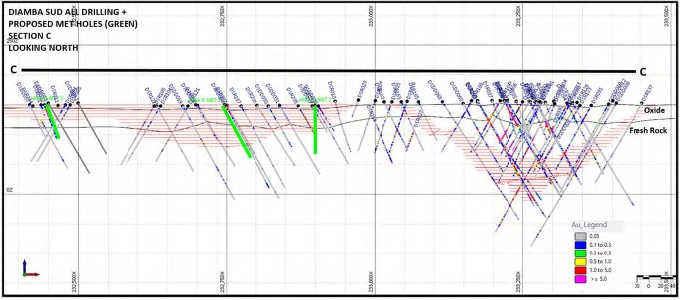
Figure prepared by Fortuna, 2024
Figure 13.3 Map Showing Location of Metallurgical Samples for Karakara
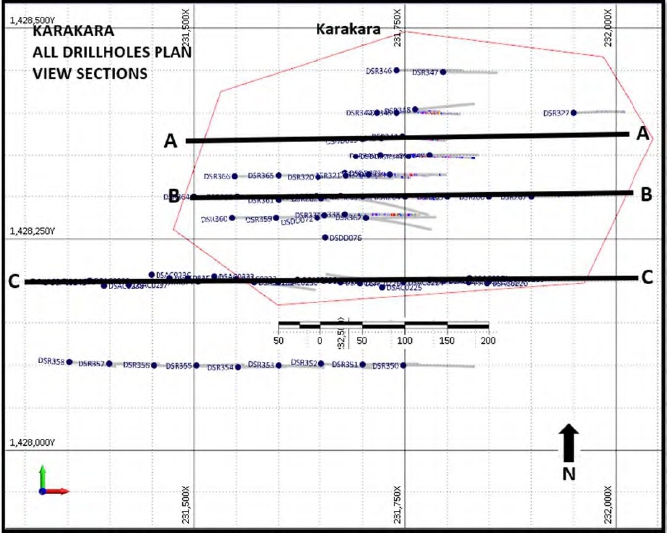
Figure prepared by Fortuna, 2024
| June 30, 2026 | Page 108 of 291 |
| | Diamba Sud Gold Project, Kédougou Region, Senegal Technical Report |
Figure 13.4 Metallurgical Sample Location for Karakara – Section B
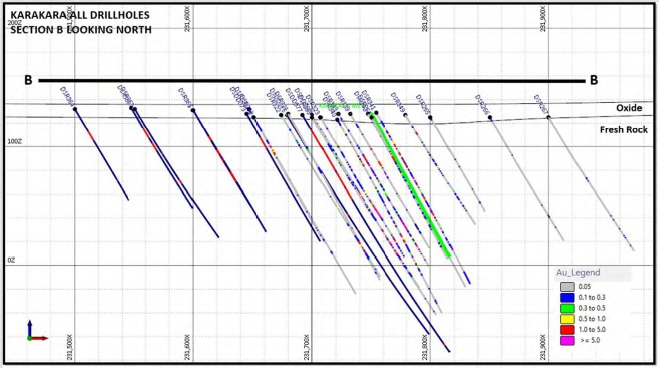
Figure prepared by Fortuna, 2024
There were significantly more fresh than oxide mineralization samples available from the core drilling. All fresh samples were half core but due to the friability of the oxide mineralization, the samples available were too small for reliable SMC and CWi tests. These tests were therefore not conducted on oxide mineralization.
Head assays conducted show a wide range of head grades from 0.8–5.5 g/t Au. The KARB Fresh-2 sample gold grade was very low and therefore the sample was not used in further leach testwork.
Quantification of Minerals
A total of 26 samples were provided to ALS for semi-quantitative X-ray diffraction (XRD) analysis. XRD was used to analyze the samples whilst a combination of matrix flushing and reference intensity ration (RIR) derived constants were used to identify and quantify sample mineralogy. The XRD test results are shown for Area D in Table 13.2 and for Area A and Karakara in Table 13.3. Minerals identified were common for gold deposits. No major cyanide consumers or deleterious minerals were identified.
| June 30, 2026 | Page 109 of 291 |
| | Diamba Sud Gold Project, Kédougou Region, Senegal Technical Report |
Table 13.2 Summary of XRD Analysis for Area D
| Mineral or Mineral Group | DA_Oxide_1 | DA_Oxide_2 | DA_Oxide_3 | DA_Fresh_1 | DA_Fresh_2 | DA_Fresh_3 | DB_Oxide_1 | DB_Oxide_2 | DB_Fresh_1 | DB_Fresh_2 | DC_Oxide_1 | DC_Fresh_1 |
| Clay mineral | 10 | 0 | 0 | 0 | < 1 | 0 | 26 | 11 | 0 | 0 | 0 | 0 |
| Kaolinite | 54 | 46 | 40 | 0 | 0 | 0 | 37 | 43 | 0 | 0 | 69 | 0 |
| Chlorite | 0 | 0 | 0 | 0 | 1 | 0 | 0 | 0 | 0 | 0 | 0 | 1 |
| Annite - biotite - phlogopite | 0 | 1 | 1 | 0 | 0 | 0 | 0 | 0 | 0 | 0 | 0 | 1 |
| Muscovite | 1 | 7 | 5 | 0 | 1 | 0 | 3 | 1 | 0 | 1 | 1 | 0 |
| Talc | 0 | 0 | 0 | 0 | 0 | 0 | 0 | 0 | 0 | 0 | 0 | 0 |
| Calcic amphibole | 0 | 0 | 0 | 0 | 0 | 0 | 0 | 0 | 0 | 0 | 0 | 0 |
| Plagioclase | 5 | 0 | 0 | 43 | 19 | 31 | 8 | 11 | 34 | 31 | 0 | 49 |
| K-feldspar | 2 | 3 | 4 | 2 | 1 | 2 | 2 | 2 | 0 | 0 | 0 | 0 |
| K-feldspar and/or rutile | 0 | 0 | 0 | 0 | 0 | 0 | 0 | 0 | 0 | < 1 | 0 | 1 |
| Quartz | 16 | 24 | 37 | 24 | 12 | 8 | 13 | 13 | 3 | 3 | 16 | 9 |
| Rutile | 2 | 2 | 0 | 0 | 0 | 0 | 2 | 0 | 0 | 0 | 2 | 0 |
| Anatase | 0 | 0 | 0 | 0 | 0 | 0 | 0 | 0 | 0 | 0 | 0 | 1 |
| Calcite | 0 | 0 | 0 | 0 | 0 | 0 | 0 | 0 | 0 | < 1 | 0 | 0 |
| Dolomite - ankerite | 0 | 0 | 0 | 27 | 60 | 55 | 5 | 4 | 62 | 64 | 0 | 37 |
| Siderite type carbonate | 0 | 0 | 0 | 0 | 4 | 0 | 0 | 0 | 0 | 0 | 0 | 0 |
| Goethite | 10 | 14 | 11 | 0 | 0 | 0 | 5 | 15 | 0 | 0 | 13 | 0 |
| Hematite | 0 | 2 | 2 | 0 | 0 | 1 | 0 | 0 | 0 | 0 | 0 | 0 |
| Magnetite | 0 | 0 | 0 | 0 | 0 | 0 | 0 | 0 | 0 | 0 | 0 | 0 |
| Pyrite | 0 | 0 | 0 | 4 | 2 | 4 | 0 | 0 | 1 | 1 | 0 | 2 |
| Pyrite and/or hematite | 0 | 0 | 0 | 0 | 0 | 0 | 0 | 0 | 0 | 0 | 0 | 0 |
| June 30, 2026 | Page 110 of 291 |
| | Diamba Sud Gold Project, Kédougou Region, Senegal Technical Report |
Table 13.3 Summary of XRD Analysis for Area A and Karakara
| Mineral
or Mineral Group |
AA_Fresh_1 | AB_Fresh_1 | AB_Fresh_2 | AB_Fresh_4 | AC_Fresh_1 | AC_Fresh_2 | AC_Fresh_3 | KARA_Fresh_1 | KARB_Fresh_1 | KARB_Fresh_2 | KARB_Fresh_3 | KARB_Fresh_4 | KARC_Fresh_1 | KARC_Fresh_2 |
| Clay mineral | 0 | 0 | 0 | 2 | 0 | 0 | 0 | 0 | 0 | 0 | 2 | 2 | 2 | 0 |
| Kaolinite | 0 | 0 | 0 | 0 | 0 | 0 | 0 | 0 | 0 | 0 | 0 | 0 | 0 | 0 |
| Chlorite | 0 | 1 | < 1 | 1 | 0 | 0 | 0 | 0 | 1 | < 1 | 2 | 0 | 1 | 1 |
| Annite - biotite - phlogopite | 0 | < 1 | 1 | 8 | 1 | 1 | 0 | 0 | 0 | < 1 | 1 | 1 | 1 | < 1 |
| Muscovite | < 1 | 0 | 0 | 0 | 0 | 0 | 0 | < 1 | 1 | 0 | 0 | 0 | 0 | 0 |
| Talc | 0 | 0 | 0 | 1 | 0 | 0 | 0 | 0 | < 1 | 0 | < 1 | 2 | 0 | 0 |
| Calcic amphibole | 0 | 0 | 0 | 3 | 0 | 0 | 0 | 0 | 0 | 0 | 4 | 0 | 0 | 0 |
| Plagioclase | 63 | 61 | 54 | 68 | 51 | 63 | 71 | 68 | 19 | 68 | 30 | 23 | 42 | 56 |
| K-feldspar | 5 | 2 | 3 | 0 | 6 | 3 | 2 | 0 | 1 | 2 | 1 | 0 | 3 | 2 |
| K-feldspar and/or rutile | 0 | 0 | 0 | 1 | 0 | 0 | 0 | 1 | 0 | 0 | 0 | 1 | 0 | 0 |
| Quartz | 6 | 7 | 14 | 9 | 9 | 15 | 9 | 8 | 14 | 10 | 7 | 16 | 16 | 16 |
| Rutile | 0 | 0 | 0 | 0 | 0 | 0 | 0 | 0 | 0 | 0 | 0 | 0 | 0 | 0 |
| Anatase | 1 | 1 | 1 | 1 | < 1 | 1 | 1 | 1 | 0 | 1 | 0 | 0 | < 1 | 0 |
| Calcite | 0 | 0 | 0 | 2 | 0 | 0 | 0 | 1 | 0 | 0 | 12 | 0 | 0 | 0 |
| Dolomite - ankerite | 24 | 27 | 24 | 1 | 32 | 14 | 16 | 21 | 61 | 19 | 39 | 48 | 34 | 22 |
| Siderite type carbonate | 0 | 0 | 0 | 0 | 0 | 0 | 0 | 0 | 0 | 0 | 0 | 0 | 0 | 0 |
| Goethite | 0 | 0 | 0 | 0 | 0 | 0 | 0 | 0 | 0 | 0 | 0 | 0 | 0 | 0 |
| Hematite | 0 | < 1 | 0 | 0 | 0 | 0 | 0 | 0 | 0 | 0 | 0 | 0 | 0 | 0 |
| Magnetite | 0 | 0 | 0 | 0 | 0 | 0 | 0 | 0 | 0 | 0 | 0 | 5 | 0 | 0 |
| Pyrite | 1 | 1 | 3 | 2 | 1 | 3 | 1 | 1 | 2 | 0 | 2 | 2 | 2 | 2 |
| Pyrite and/or hematite | 0 | 0 | 0 | 0 | 0 | 0 | 0 | 0 | 0 | < 1 | 0 | 0 | 0 | 0 |
| June 30, 2026 | Page 111 of 291 |
| | Diamba Sud Gold Project, Kédougou Region, Senegal Technical Report |
| 13.2.3 | Comminution Testwork |
The first stage of testwork consisted of comminution tests to help determine hardness, abrasion and breakage properties to provide input for comminution modelling. The comminution modelling will be used to provide further information on the comminution circuit selection. The testwork program included Ai, BWi, CWi, and SMC tests.
Abrasion Index
Ai values ranged from 0.0416–0.3333, and averaged 0.1829 in the fresh samples. These Ai values are normal for non-abrasive gold-bearing mineralized material, with three samples from Area D with slightly less abrasiveness than average. The most abrasive sample, also from Area D, was not more abrasive than normal gold-bearing mineralization. The mineralized material (irrespective of domain) is unlikely to pose any significant problems with abrasiveness.
Crushing Index
Table 13.4 shows the CWi results for each composite.
Table 13.4 Bond Crushing Work Index Results
| Sample ID | Average CWi (kWh/t) |
Category |
| AA FRESH-1 | 15.1 | Hard |
| AB FRESH-1 | 4.5 | Very soft |
| AB FRESH-2 | 6.3 | Very soft |
| AB FRESH-4 | 5.7 | Very soft |
| AC FRESH-1 | 4.4 | Very soft |
| AC FRESH-2 | 5.3 | Very soft |
| AC FRESH-3 | 5.9 | Very soft |
| DA FRESH-1 | 6.8 | Very soft |
| DA FRESH-2 | 5.6 | Very soft |
| DA FRESH-3 | 4.0 | Very soft |
| DB FRESH-1 | 4.4 | Very soft |
| DB FRESH-2 | 7.6 | Soft |
| DC FRESH-1 | 6.6 | Very soft |
| KARA FRESH-1 | 6.1 | Very soft |
| KARB FRESH-1 | 6.3 | Very soft |
| KARB FRESH-2 | 7.3 | Soft |
| KARB FRESH-3 | 4.2 | Very soft |
| KARC FRESH-1 | 6.4 | Very soft |
| KARC FRESH-2 | 6.0 | Very soft |
CWi values below 7 kWh/t are very soft, between 7–9 kWh/t are soft while 9–14 kWh/t are considered medium, and 14–20 kWh/t hard.
Most testwork CWi values at Diamba Sud are between 4–8 kWh/t which indicates the majority of the mineralized material is either very soft or soft. The CWi for one Area A sample (15.1 kWh/t) indicates hard mineralization. This isolated sample is an outlier and either indicates variability or a spurious result in Area A.
Ball Mill Work Index
BWi values between 14–20 kWh/t indicate mineralization that is moderate to hard. BWi values above 20 kWh/t indicate mineralization that is very hard. The results of the
| June 30, 2026 | Page 112 of 291 |
| | Diamba Sud Gold Project, Kédougou Region, Senegal Technical Report |
testwork shows a range of BWi values from 10.4–22.1 kWh/t for fresh mineralized material to reach a P80 of ~60 µm. Therefore, mineralization is primarily moderate to hard. Compared to typical gold ores this material is moderate. Only one sample, from Karakara, showed a BWi value >20 kWh/t, while six samples, five from Area D and one from Karakara, showed BWi values <14 kWh/t.
Oxide samples were too friable to be tested, which is typical for weathered composites. Generally, blending weathered mineralization with fresh mineralization is recommended during operation to decrease the impact of variability. Area D contains significant mineralized oxide material without easily available fresh mineralization for blending and therefore a comminution circuit capable of processing only soft oxide mineralization for periods of time will be crucial.
SMC Testwork
The oxide mineralized samples were too friable for SMC testwork and were thus excluded. This is not considered material at this stage of the Project evaluation. Table 13.5 shows the results of the SMC testwork
Table 13.5 SMC Results
| Sample Info | SMC | |||||||||
| A | b | A x b | DWi (kWh/m3) |
DWi (%) |
ta | Mia (kWh/t) |
Mic (kWh/t) |
Mih (kWh/t) |
SCSE (kWh/t) | |
| AA FRESH-1 | 86.7 | 0.34 | 29.5 | 9.4 | 82 | 0.28 | 24.9 | 10.2 | 19.7 | 11.60 |
| AA FRESH VAR-1 | 73.3 | 0.46 | 33.7 | 8.1 | 68 | 0.33 | 22.7 | 17.4 | 9.0 | 10.65 |
| AB FRESH-1 | 91.4 | 0.34 | 31.1 | 8.6 | 74 | 0.30 | 23.7 | 9.5 | 18.4 | 11.16 |
| AB FRESH-2 | 92.9 | 0.33 | 30.7 | 9.0 | 78 | 0.29 | 24.4 | 9.9 | 19.2 | 11.26 |
| AB FRESH-4 | 65.5 | 0.61 | 40.0 | 6.6 | 50 | 0.39 | 19.7 | 7.5 | 14.5 | 9.78 |
| AB FRESH VAR-1 | 63.8 | 0.68 | 43.4 | 6.2 | 44 | 0.42 | 18.3 | 13.4 | 6.9 | 9.51 |
| AC FRESH-1 | 89.4 | 0.37 | 33.1 | 7.9 | 66 | 0.33 | 23.0 | 9.1 | 17.6 | 10.62 |
| AC FRESH-2 | 91.5 | 0.33 | 30.2 | 9.0 | 79 | 0.29 | 24.7 | 10.0 | 19.4 | 11.29 |
| AC FRESH-3 | 93.1 | 0.32 | 29.8 | 9.1 | 80 | 0.29 | 24.9 | 10.1 | 19.6 | 11.37 |
| AC FRESH VAR-1 | 59.3 | 0.89 | 52.8 | 5.1 | 30 | 0.50 | 15.6 | 11.0 | 5.7 | 8.76 |
| DA FRESH-1 | 81.8 | 0.40 | 32.7 | 8.4 | 72 | 0.30 | 22.7 | 9.1 | 17.6 | 11.06 |
| DA FRESH-2 | 75.0 | 0.58 | 43.5 | 6.6 | 49 | 0.39 | 18.0 | 6.9 | 13.3 | 9.85 |
| DA FRESH-3 | 80.2 | 0.50 | 40.1 | 7.1 | 56 | 0.36 | 19.4 | 7.5 | 14.5 | 10.19 |
| DB FRESH-1 | 69.0 | 0.64 | 44.2 | 6.8 | 52 | 0.38 | 17.8 | 6.8 | 13.2 | 10.02 |
| DB FRESH-2 | 93.7 | 0.36 | 33.7 | 8.2 | 69 | 0.32 | 22.3 | 8.9 | 17.2 | 10.82 |
| DB FRESH VAR-1 | 61.7 | 0.82 | 50.6 | 5.6 | 36 | 0.5 | 16.0 | 11.4 | 5.9 | 9.11 |
| DC FRESH-1 | 100.0 | 0.27 | 27.0 | 10.5 | 90 | 0.25 | 26.8 | 11.2 | 21.7 | 12.26 |
| KARA FRESH-1 | 71.7 | 0.61 | 43.7 | 6.1 | 42 | 0.42 | 18.2 | 6.8 | 13.2 | 9.45 |
| KARB FRESH-1 | 76.6 | 0.45 | 34.5 | 8.1 | 68 | 0.32 | 21.7 | 8.6 | 16.7 | 10.86 |
| KARB FRESH-2 | 85.8 | 0.35 | 30.0 | 8.8 | 77 | 0.29 | 24.4 | 9.9 | 19.1 | 11.27 |
| KARB FRESH-3 | 73.1 | 0.45 | 32.9 | 8.8 | 77 | 0.30 | 22.8 | 9.20 | 17.80 | 11.32 |
| KARC FRESH-1 | 75.7 | 0.51 | 38.6 | 6.9 | 53 | 0.37 | 20.0 | 7.70 | 14.90 | 10.00 |
| KARC FRESH-2 | 83.3 | 0.41 | 34.2 | 8.0 | 67 | 0.33 | 22.3 | 8.80 | 17.10 | 10.63 |
Attributes reported included as follows:
| · | A is the resistance of breaking larger particles. |
| June 30, 2026 | Page 113 of 291 |
| | Diamba Sud Gold Project, Kédougou Region, Senegal Technical Report |
| · | b is breakage of smaller particles. |
| · | A*b allows comparison of different mineralization types – the smaller the value the greater the resistance to comminution. |
| · | ta is a measure of resistance to abrasion grinding. |
The A*b values, ranging from 27–53 from this testwork indicate mostly hard composites with few outliers. The SAG circuit specific energy (SCSE) value is derived from simulations of a “standard” circuit of a single-stage SAG mill in closed circuit. The SCSE results for these composites indicate that the mineralized material could be suitable for single-stage crushing followed by SAG mill or a SAG–ball mill–crusher comminution (SABC) circuit in agreement with the BWi data. The results for ta compared well with the Ai values indicating that the material will be hard to very hard regards to abrasion (0.-0.42), which is higher than the Ai indicated.
Figure 13.5 is an extract from the SMC report which compares the A*b of the Diamba Sud tested composites to the SMC database of over 1,300 different deposits which confirms the mineralized material is average to harder than average. Material competency will influence the comminution design towards more energy efficiency circuits.
Figure 13.5 Diamba Sud A*b vs SMC Database
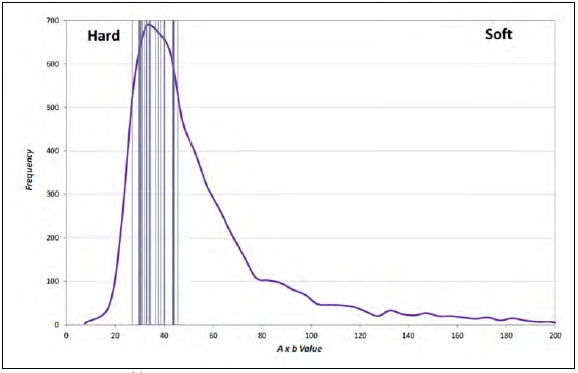
Figure prepared by JKTech, 2024
| 13.2.4 | Leach and Cyanidation Testwork |
The second stage of testwork was focused on optimizing the conditions for leaching the gold from the mineralized material by cyanidation including some gravity separation testwork. The first step for this testwork was to determine how much gold was recoverable by gravity before the leach. This was done on all 24 composites. Next, nine composites were selected to determine the optimum leaching conditions. Two oxides from Area D and seven fresh samples from Area A, Area D and Karakara were selected. The effect of various conditions and parameters on gold recovery during cyanide leaching were then examined using the selected samples, namely:
| June 30, 2026 | Page 114 of 291 |
| | Diamba Sud Gold Project, Kédougou Region, Senegal Technical Report |
| · | Grind size. | |
| · | Use of air or oxygen. | |
| · | Addition of lead nitrate. | |
| · | Inclusion of carbon in the leach. | |
| · | Cyanide concentration. | |
| · | Mass fraction of solids. |
Finally, nine composites were selected for bulk gravity, leaching at optimized conditions, and carbon testwork.
Gravity Concentration
The composite samples were initially subjected to gravity concentration testwork to determine the gravity gold component that can be expected from the various domains. Gravity concentration was tested using a laboratory-scale Knelson concentrator, followed by intensive leach. This preliminary gravity testwork comprised 24 3-kg samples. Optimization testwork involved a selection of nine samples each weighing 14 kg. An additional 12 samples were tested during the bulk leach phase. Table 13.6 shows the results of the initial gravity recovery tests, gravity testwork for optimization and gravity concentration for the bulk leach testwork.
Table 13.6 Gravity Recovery Results
| Sample ID | Gravity Screening | Optimization Testwork | Gravity Concentration for Bulk Leach | |||
| Calculated Gold Grade (g/t) |
Gold Gravity Recovery (%) |
Calculated Gold Grade (g/t) |
Gold Gravity Recovery (%) |
Calculated Gold Grade (g/t) |
Gold Gravity Recovery (%) | |
| DA OXIDE-1 | 3.13 | 14.1 | 2.9 | 8.7 | 2.87 | 27.5 |
| DA OXIDE-2 | 1.84 | 40.7 | ||||
| DA OXIDE-3 | 0.82 | 31.8 | ||||
| DB OXIDE-1 | 5.70 | 40.7 | 5.8 | 39.0 | 5.82 | 44.2 |
| DB OXIDE-2 | 6.25 | 37.4 | ||||
| DB FRESH-1 | 1.28 | 51.6 | 1.17 | 48.2 | ||
| DB FRESH-2 | 1.84 | 59.1 | 1.71 | 63.4 | ||
| DC OXIDE-1 | 3.43 | 31.1 | ||||
| DC FRESH-1 | 1.07 | 42.0 | 1.2 | 31.6 | 1.18 | 32.1 |
| AA FRESH-1 | 2.96 | 72.6 | 3.3 | 69.1 | 3.27 | 70.1 |
| AB FRESH-1 | 1.13 | 65.3 | 1.4 | 68.8 | ||
| AC FRESH-1 | 2.09 | 68.4 | 1.5 | 67.6 | ||
| KARA FRESH-1 | 2.84 | 80.0 | 3.5 | 74.3 | 3.71 | 81.1 |
| KARB FRESH-1 | 1.77 | 72.9 | ||||
| KARB FRESH-3 | 3.10 | 77.4 | 3.3 | 60.1 | 3.30 | 67.0 |
| KARC FRESH-1 | 2.78 | 58.6 | ||||
| KARC FRESH-2 | 3.81 | 63.7 | 4.6 | 58.2 | 4.05 | 67.2 |
| DA FRESH-1 | 0.79 | 34.0 | 0.83 | 34.0 | ||
| DA FRESH-2 | 1.77 | 57.0 | 1.94 | 53.9 | ||
| DA FRESH-3 | 2.46 | 55.8 | 2.49 | 56.7 | ||
| AB FRESH-2 | 0.96 | 60.5 | ||||
| AC FRESH-2 | 1.25 | 64.7 | ||||
| AC FRESH-3 | 2.30 | 55.1 | ||||
| KARB FRESH-4 | 2.44 | 58.6 | ||||
| June 30, 2026 | Page 115 of 291 |
| | Diamba Sud Gold Project, Kédougou Region, Senegal Technical Report |
Gravity testwork indicated that the mineralized material contains a large proportion of free/gravity-recoverable gold. The proportion of gravity-recoverable gold varied from 19–40% for selected oxide samples and 27–81% for selected fresh samples. Broadly, the higher gold grade fresh samples had higher fractions of gravity gold, while the lower-grade samples had comparatively lower gravity recoveries. Intensive leach results indicate gold recoveries from the gravity concentrate as being >99%.
Similar results were indicated with the optimization and gravity concentration for bulk leach testwork with marginally lesser gravity-recoverable gold mostly attributed to the lower proportion of mass pull. The available gravity-recoverable gold remains high, and this provides further support for inclusion of a gravity circuit.
Grind Size Optimization
Tails from the bulk gravity testwork were ground to particle sizes of P80 180 µm, 150 µm, 106 µm and 75 µm to investigate the optimum grind size. Oxide samples were not tested at 180 µm due to initial particle size reporting mostly finer than 180 µm with screen sizing. Samples were leached under standard cyanidation conditions with solution samples extracted at 1, 2, 4, 8, 12, 24, and 48 hour intervals at 40% w/w with oxygen sparging. A summary of results of the tests is shown in Table 13.7. Note that the total recovery column includes gravity recovery.
Table 13.7 Grind Size Optimization Results
| Sample ID | Grind Size P80 (µm) |
Total Recovery After 12h (%) |
Total Recovery After 24h (%) |
Total Recovery After 48h (%) |
| DA OXIDE-1 | 150 | 93.2 | 94.9 | 97.4 |
| DA OXIDE-1 | 106 | 93.0 | 93.0 | 97.1 |
| DA OXIDE-1 | 75 | 92.2 | 93.1 | 96.6 |
| DB OXIDE-1 | 150 | 95.5 | 96.7 | 98.2 |
| DB OXIDE-1 | 106 | 96.7 | 96.7 | 98.3 |
| DB OXIDE-1 | 75 | 90.4 | 97.7 | 99.1 |
| DC FRESH-1 | 180 | 65.9 | 66.5 | 67.1 |
| DC FRESH-1 | 150 | 71.8 | 71.8 | 71.8 |
| DC FRESH-1 | 106 | 73.6 | 74.2 | 74.2 |
| DC FRESH-1 | 75 | 79.1 | 79.1 | 79.1 |
| AA FRESH-1 | 180 | 94.9 | 95.7 | 96.7 |
| AA FRESH-1 | 150 | 95.5 | 96.3 | 97.4 |
| AA FRESH-1 | 106 | 95.9 | 97.1 | 97.7 |
| AA FRESH-1 | 75 | 96.2 | 97.0 | 98.0 |
| AB FRESH-1 | 180 | 93.5 | 94.4 | 95.3 |
| AB FRESH-1 | 150 | 94.3 | 94.8 | 94.8 |
| AB FRESH-1 | 106 | 95.5 | 96.0 | 96.0 |
| AB FRESH-1 | 75 | 95.2 | 95.2 | 96.1 |
| AC FRESH-1 | 180 | 95.7 | 97.0 | 97.0 |
| AC FRESH-1 | 150 | 95.8 | 96.2 | 97.0 |
| AC FRESH-1 | 106 | 96.9 | 98.2 | 98.2 |
| AC FRESH-1 | 75 | 97.8 | 98.2 | 98.2 |
| June 30, 2026 | Page 116 of 291 |
| | Diamba Sud Gold Project, Kédougou Region, Senegal Technical Report |
| Sample ID | Grind Size P80 (µm) |
Total Recovery After 12h (%) |
Total Recovery After 24h (%) |
Total Recovery After 48h (%) |
| KARA FRESH-1 | 180 | 97.4 | 97.5 | 97.7 |
| KARA FRESH-1 | 150 | 96.6 | 96.5 | 96.7 |
| KARA FRESH-1 | 106 | 98.0 | 98.1 | 98.1 |
| KARA FRESH-1 | 75 | 98.4 | 98.4 | 98.6 |
| KARB FRESH-3 | 180 | 93.9 | 94.1 | 94.4 |
| KARB FRESH-3 | 150 | 94.8 | 95.5 | 95.9 |
| KARB FRESH-3 | 106 | 95.7 | 96.5 | 96.5 |
| KARB FRESH-3 | 75 | 97.5 | 97.5 | 97.5 |
| KARC FRESH-2 | 180 | 95.7 | 96.3 | 96.6 |
| KARC FRESH-2 | 150 | 97.1 | 97.1 | 97.7 |
| KARC FRESH-2 | 106 | 97.3 | 97.3 | 97.8 |
| KARC FRESH-2 | 75 | 98.3 | 98.3 | 98.3 |
Figure 13.6 shows that the highest gold recoveries at 24 hours were experienced at a P80 of 75 µm.
Figure 13.6 Grind Size Optimization of Area A, Area D and Karakara Deposits
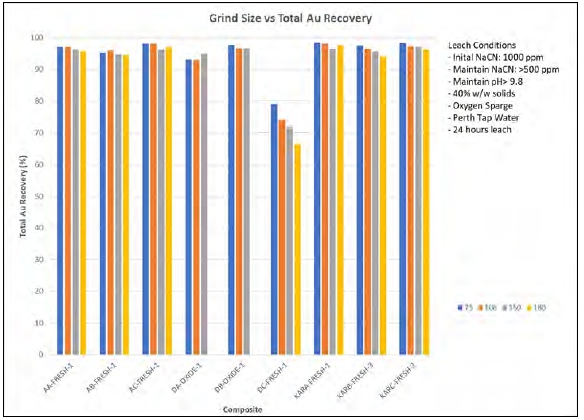
Figure prepared by MIQM, 2024
There is generally an inverse relationship between grind size and gold leach recovery; this is to be expected, as finer grind size increases the surface area of the sample, and thus the leaching kinetics and total available gold. This is consistent across all samples with some degree of measurement variability. A preliminary economic evaluation was conducted to determine the preferred grind size. A finer grind size shows a higher gold recovery at the
| June 30, 2026 | Page 117 of 291 |
| | Diamba Sud Gold Project, Kédougou Region, Senegal Technical Report |
cost of additional grinding power. The evaluation based on estimated grinding power indicated an optimal grind size of 106 µm for the fresh and oxide samples. Optimum gold recovery is achieved at 24 hours for fresh samples at 106 µm and at 12 hours for oxide samples, also at 106 µm.
The DC Fresh-1 sample, from Area D, showed a significant lower gold recovery compared to other samples with only 74% gold recovery (106 µm) at 24 and 48 hours. This indicates additional residence time would not increase recovery of DC Fresh-1. Diagnostic leaching of DC Fresh-1 residue showed 96% of the gold in the leach tails can be recovered by aqua regia digest. This indicates the remaining gold was predominately associated with gold locked in non-silicate, quartz, and sulfide minerals. Thus, DC Fresh-1 can be classified as semi-refractory, and ultrafine grinding would be needed to extract the remaining gold after initial cyanidation.
Effect of Lead Nitrate on Cyanidation
The DC Fresh-1 was the only sample that would have potential benefits from addition of lead nitrate. Figure 13.7 compares the kinetics of the gold extraction from mineralization when 200 g/t of lead nitrate is added against no lead nitrate.
Figure 13.7 Lead Nitrate vs Au Recovery of DC Fresh-1
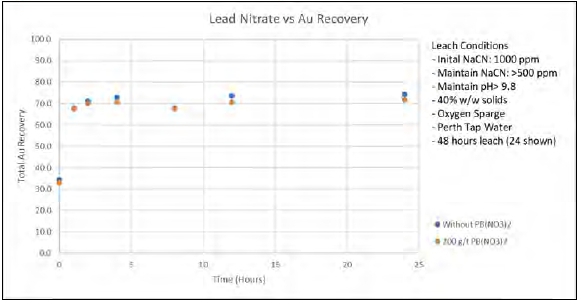
Figure prepared by MIQM, 2024
The leach kinetics show minimal impact of lead nitrate with recovery converging at 24 hours. Lead nitrate is therefore not recommended for further testwork. Fresh mineralization in Area D accounts for 17.3% of the total estimated Mineral Resource.
Effect of Air on Cyanidation
Figure 13.8 shows the average kinetics of the extraction of gold from mineralization across eight samples with oxygen and with air sparging. The gold recovery (%) represented in this figure is presented as total gold recovery and therefore includes gravity gold recovery.
| June 30, 2026 | Page 118 of 291 |
| | Diamba Sud Gold Project, Kédougou Region, Senegal Technical Report |
Figure 13.8 Oxygen vs Air Sparging
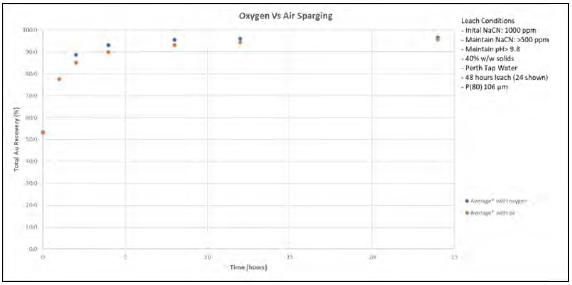
Figure prepared by MIQM 2024. Note: *Average is across 8 samples (Optimization samples exclude anomalous DC Fresh-1 result).
The overall recovery of gold is not significantly impacted by the use of oxygen instead of air for leaching after 24 hours as the total recovery of gold (including gravity) was around 95–98% in all cases (excluding DC Fresh-1) and averaged 97.2%. The results also demonstrate that gold leaching kinetics during the initial stages of leaching increased marginally when using oxygen compared to air. This is expected as the additional oxygen sparging provides excess oxygen reagent for gold liberation but does not increase final recovery. While the mineralized material does not appear to be a large oxygen consumer, it was decided that oxygen should be recommended for further testwork and bulk tests for optimal results.
Carbon in Leach
The effect on total gold recovery when carbon was added during leaching was also investigated. This will inform the decision as to whether to proceed with a carbon in leach (CIL) or carbon in pulp (CIP) circuit or a hybrid for the potential flowsheet. Table 13.8 shows the gold extraction with leach only (no carbon) and with 20 g/L of carbon (CIL column) after 48 hours.
Table 13.8 CIL vs Leach Only Cyanidation
| Sample ID | Au Recovery: Direct Leach (no Carbon) 48 hours |
Au Recovery: CIL (Carbon in Leach) 48 hours |
| DA OXIDE-1 | 97.1 | 98.9 |
| DB OXIDE-1 | 98.3 | 98.0 |
| DC FRESH-1 | 74.2 | 65.4 |
| AA FRESH-1 | 97.7 | 97.9 |
| AB FRESH-1 | 96.0 | 94.7 |
| AC FRESH-1 | 98.2 | 97.6 |
| KARA FRESH-1 | 98.1 | 97.8 |
| KARB FRESH-3 | 96.5 | 96.9 |
| KARC FRESH-2 | 97.8 | 97.6 |
| DA OXIDE-1 | 97.1 | 98.9 |
| Average* | 97.5 | 97.4 |
Note* Average is across 8 samples (excluding anomalous DC-Fresh-1 result).
| June 30, 2026 | Page 119 of 291 |
| | Diamba Sud Gold Project, Kédougou Region, Senegal Technical Report |
Leach conditions were held at 40% w/w, 106 µm, oxygen sparge, 1,000 ppm CN initial and 500 ppm CN maintained. CIL recovery includes carbon assay and solution assay as almost all extracted gold in solution will be adsorbed to carbon during staged CIL. Gold leaching circuits for free-milling mineralized material of this type typically have 24 hours or less residence time. CIL testwork recovery shows virtually identical leach recoveries with or without carbon. This supports the use of activated carbon for the adsorption of gold in solution and a CIL circuit.
Effect of Cyanide Concentration on Cyanidation
The average cyanide consumption at 1,000 ppm initial and 500 ppm maintained was roughly 0.37 kg/t across the eight samples (excluding DC Fresh-1 at a gold grade of 0.29 g/t); this is within the expected range, and average for this type of plant. Figure 13.9 shows the effect of different cyanide concentrations at 250 ppm, 500 ppm and 1,000 ppm initially and maintained at 100 ppm, 250 ppm and 500 ppm, respectively.
Figure 13.9 Effect of NaCN Concentration on Cyanidation
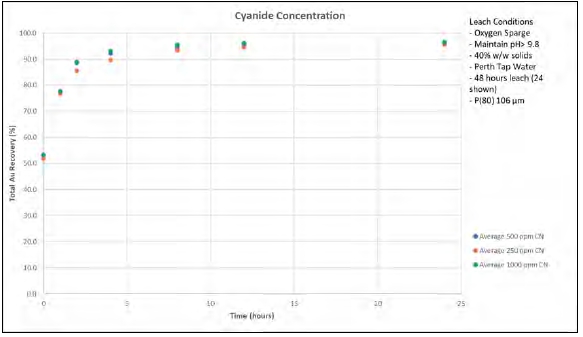
Figure prepared by MIQM, 2024.
The results generally show that increasing cyanide concentration marginally increases leaching kinetics during the first eight hours of leaching. Total recoveries from all composites mostly converge after 24 hours of leaching with highest recovery at 1,000 ppm CN. Increasing cyanide concentration also increases overall consumption.
Table 13.9 shows how average cyanide consumption changes with cyanide concentration across the eight samples (excluding DC Fresh-1).
Table 13.9 Effect of Cyanide Concentration on Gold Recovery and Reagent Consumption after 24 hours
| Initial Cyanide Concentration (ppm) |
Gold Recovery at 24 Hours (%) |
Cyanide Consumption at 24hrs (kg/t) |
Lime Consumption at 24hrs (kg/t) |
| 1,000 | 96.6 | 0.37 | 1.3 |
| 500 | 96.3 | 0.21 | 1.1 |
| 250 | 95.7 | 0.11 | 0.8 |
| June 30, 2026 | Page 120 of 291 |
| | Diamba Sud Gold Project, Kédougou Region, Senegal Technical Report |
Overall cyanide consumption is as expected for free-milling mineralized material. Broadly, cyanide consumption reduces significantly when reducing concentrations from 1,000 ppm to 500 ppm, then slightly more when decreasing from 500 ppm to 250 ppm. As summarized in Table 13.10, oxide mineralization consumes more cyanide than fresh mineralization. Lime is generally used to maintain pH above 9.8. Fresh mineralization lime consumption is between 0.2–0.4 kg/t, as expected. Oxide mineralization lime consumption has a wider variation, between 1.5–4.8 kg/t, as expected.
Table 13.10 Average Reagent Consumption after 24 hours at 1,000 ppm Cyanide Between Fresh and Oxide Mineralization
| Lithology |
Cyanide Consumption at 24hrs (kg/t) |
Lime Consumption at 24hrs (kg/t) |
| Fresh (45% w/w) | 0.31 | 0.34 |
| Oxide (35% w/w) | 0.45 | 4.2 |
In summary, reducing cyanide concentration did have a marginal effect on total gold recovery at 24 hours. Using the cost for supplied cyanide applicable as of the effective date of this Report, a comparison between cost of additional consumed cyanide was compared to the average increase in recovery and it was determined that an initial 1,000 ppm CN concentration was the optimum leach condition for bulk leaching tests. Leaching kinetics also improves slightly with increased concentration. Therefore, in the event of reduced residence time, higher cyanidation would be beneficial.
Effect of Solid Concentration on Cyanidation
The recovery of gold from the mineralized material was tested at solids mass fractions varying from 25–40% at 5% intervals for oxide mineralization and 35–45% at 5% intervals for fresh mineralization. Oxide composites were very viscous due to some clay pockets at concentrations above 40%. Figure 13.10 and Figure 13.11 show the average impact of solids mass fraction on the oxide and fresh samples (excluding DC Fresh-1) gold recoveries, respectively.
| June 30, 2026 | Page 121 of 291 |
| | Diamba Sud Gold Project, Kédougou Region, Senegal Technical Report |
Figure 13.10 Effect of Solid Mass Fraction (%) – Oxides
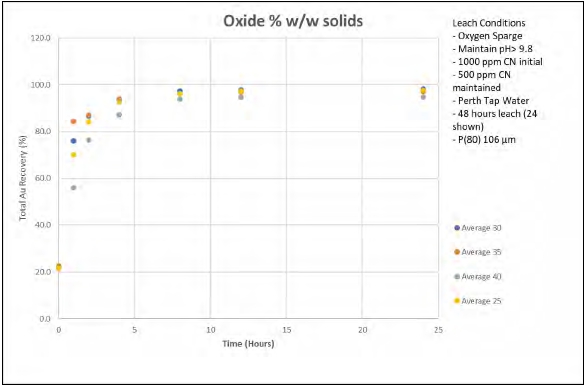
Figure prepared by MIQM, 2024.
Figure 13.11 Effect of Solid Mass Fraction (%) – Fresh
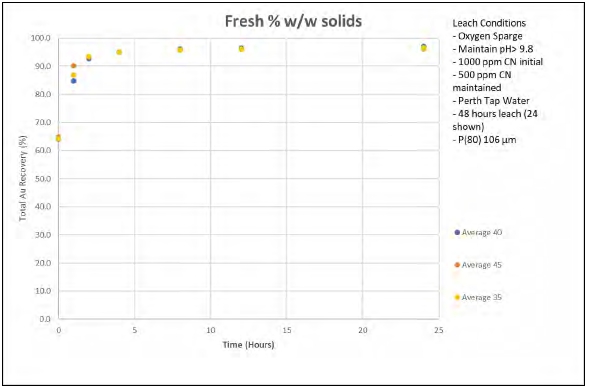
Figure prepared by MIQM, 2024. Note: *Average is across 8 samples (excluding anomalous DC Fresh-1 result).
| June 30, 2026 | Page 122 of 291 |
| | Diamba Sud Gold Project, Kédougou Region, Senegal Technical Report |
The results of the tests show that there is no major impact on total gold recovery when increasing solids mass fraction. Figure 13.10 broadly shows faster kinetics in the lower concentration samples initially, with all samples having nearly the same gold recovery by 24 hours. Maximum recovery is placed between 25–35%, with 35% selected for the remaining bulk leach testwork. Figure 13.11 shows very similar recovery by 24 hours across all samples (excluding DC-Fresh-1). Again, a very high recovery is achieved at 24 hours (~97%). The results don’t clearly indicate any benefit in gold recovery at the various solids concentrations at 24 hours.
The solids mass concentration for the bulk leach tests to be conducted was thus chosen on the basis of a possible process flowsheet. While higher solids mass fraction is attractive for minimizing the water requirement for the plant and reducing the total tank volume required, it is difficult to achieve high solids concentrations from oxide mineralization based on previous testwork. A pre-leach thickener is recommended and included in the process design to achieve 45% solids for fresh mineralization.
Bulk Leach Testwork
After the optimum leaching conditions were determined, the next stage of testing applied these optimal conditions to 12 samples of which five from Area D were not used during the optimization tests. Additionally, the equilibrium carbon loading was tested, and sequential CIP/CIL tests were conducted. Intensive leaching tests of the gravity concentrate were also conducted.
The original 12 selected samples and 19 variability samples were ground to 106 µm, then separated by gravity concentration into a concentrate and tails. The tails were subjected to cyanidation at 1,000 ppm NaCN initially and maintained at 500 ppm NaCN, with oxygen sparging, no lead nitrate addition, and a solids concentration of 35% for oxide and 45% for fresh samples. Lime was used to maintain the pH above 9.8. Table 13.11 shows the leach recovery (of gravity tails) and total recovery (gravity and leach) at 24 hours.
Table 13.11 Bulk Leach Testwork Summary
| Sample ID | % Solids (w/w) |
Calculated Assay Head (g/t) | Leach Recovery after 24hrs (% of gravity tails) |
Total Au Recovery (% of head feed) |
NaCN Cons’n (kg/t) | Lime Cons’n (kg/t) |
| DA OXIDE-1 | 35 | 2.87 | 94.7 | 96.2 | 1.05 | 1.61 |
| DB OXIDE-1 | 35 | 5.82 | 93.1 | 96.1 | 1.02 | 2.38 |
| DA FRESH-1 | 45 | 0.83 | 60.0 | 73.6 | 0.61 | 0.93 |
| DA FRESH-2 | 45 | 1.94 | 76.5 | 89.2 | 0.75 | 1.14 |
| DA FRESH-3 | 45 | 2.49 | 82.3 | 92.4 | 0.49 | 0.45 |
| DB FRESH-1 | 45 | 1.17 | 71.2 | 85.1 | 0.55 | 0.32 |
| DB FRESH-2 | 45 | 1.71 | 66.4 | 87.7 | 0.30 | 0.32 |
| DC FRESH-1 | 45 | 1.18 | 55.7 | 69.9 | 0.39 | 0.39 |
| AA FRESH-1 | 45 | 3.27 | 93.9 | 98.2 | 0.36 | 0.37 |
| KARA FRESH-1 | 45 | 3.71 | 90.0 | 98.1 | 0.33 | 0.66 |
| KARB FRESH-3 | 45 | 3.30 | 89.9 | 96.7 | 0.39 | 0.82 |
| KARC FRESH-2 | 45 | 4.05 | 91.7 | 97.3 | 0.24 | 0.72 |
| June 30, 2026 | Page 123 of 291 |
| | Diamba Sud Gold Project, Kédougou Region, Senegal Technical Report |
The bulk leach test results correlate well with the optimization results. The overall recovery ranged between 70–98% with an average of 92% (excluding DC Fresh-1), and had an average residue grade of 0.15 g/t Au. The consumption of cyanide varied from 0.44 kg/t for fresh mineralization and 1.04 kg/t for oxide mineralization. Lime consumption varied from 0.61 kg/t for fresh and 2.0 kg/t for oxide samples.
The bulk leach variability test results are presented in Table 13.12.
Table 13.12 Bulk Leach Testwork Summary - Variability Tests
| Sample ID | % Solids (w/w) |
Calculated Assay Head (g/t) |
Gravity Recovery (%) |
Leach Recovery after 24hrs (% of gravity tails) |
Total Au Recovery (% of head feed) |
NaCN Cons’n (kg/t) |
Lime Cons’n (kg/t) |
| DA OXIDE VAR 1 | 35 | 1.20 | 20.6 | 78.1 | 85.0 | 1.06 | 2.54 |
| DB OXIDE VAR 1 | 35 | 2.21 | 25.7 | 86.5 | 89.6 | 0.69 | 1.70 |
| DC OXIDE VAR 1 | 45 | 0.60 | 18.5 | 83.1 | 88.2 | 0.69 | 1.51 |
| DC OXIDE VAR 2 | 35 | 3.45 | 19.6 | 89.1 | 97.1 | 1.11 | 0.75 |
| DC OXIDE VAR 3 | 35 | 7.68 | 37.6 | 96.0 | 99.0 | 0.50 | 1.24 |
| DC OXIDE VAR 4 | 45 | 1.17 | 27.5 | 85.4 | 94.0 | 0.51 | 0.46 |
| DA FRESH VAR 1 | 45 | 5.39 | 53.1 | 78.2 | 90.9 | 0.43 | 0.57 |
| DB FRESH VAR 1 | 45 | 1.27 | 35.3 | 81.9 | 89.8 | 0.49 | 0.45 |
| DC FRESH VAR 1 | 45 | 0.67 | 58.3 | 87.1 | 95.5 | 0.45 | 0.19 |
| AA FRESH VAR 1 | 45 | 2.40 | 64.9 | 89.3 | 97.5 | 0.33 | 0.25 |
| AA FRESH VAR 2 | 45 | 0.37 | 52.7 | 83.0 | 92.0 | 0.33 | 0.45 |
| AB FRESH VAR 1 | 45 | 2.27 | 59.5 | 91.5 | 97.4 | 0.37 | 0.22 |
| AB FRESH VAR 2 | 45 | 0.59 | 55.8 | 86.2 | 94.9 | 0.39 | 0.17 |
| AC FRESH VAR 1 | 45 | 1.43 | 66.3 | 80.0 | 93.7 | 0.37 | 0.16 |
| AC FRESH VAR 2 | 45 | 0.51 | 27.6 | 75.5 | 83.5 | 0.43 | 0.14 |
| KARA FRESH VAR 1 | 45 | 3.68 | 68.3 | 93.1 | 98.6 | 0.45 | 0.20 |
| KARB FRESH VAR 1 | 45 | 7.83 | 74.1 | 82.0 | 95.7 | 0.39 | 0.20 |
| KARB FRESH VAR 2 | 45 | 3.70 | 71.3 | 86.3 | 97.7 | 0.43 | 0.20 |
| KARC FRESH VAR 1 | 45 | 1.03 | 71.6 | 83.5 | 97.1 | 0.61 | 0.21 |
The variability bulk leach tests correlate relatively well with the previous bulk leach results. The overall recovery ranged from 84–99% with an average of 93.5% and an average residue grade of 0.12 g/t Au. The cyanide consumption varied between 0.33–0.61 kg/t for fresh and 0.5–1.1 kg/t for oxide. Lime consumption varied between 0.14–0.57 kg/t for fresh and 0.46–2.54 kg/t for oxide.
Carbon Testwork
Carbon equilibrium and triple contact tests were undertaken on the leach slurry produced as part of the bulk tests to determine what carbon loading (grams of gold per tonne of carbon) can be expected in the plant. In the equilibrium tests, five different masses of carbon were added to samples of the slurry to determine the equilibrium carbon loading at various masses. This test was conducted on two oxide and five fresh samples. Test data were fitted to the Freundlich’s isotherm equation to provide a straight-line plot of log (gold on carbon) against log (gold in solution). From this loading curve, equilibrium gold loading on carbon can be estimated based on nominated gold loading in solution. These
| June 30, 2026 | Page 124 of 291 |
| | Diamba Sud Gold Project, Kédougou Region, Senegal Technical Report |
results are used to inform the number of CIL/CIP stages that will be required for the plant and are shown on Table 13.13.
Table 13.13 Carbon Concentrations and Loading
| Sample ID | Feed Solution | Equilibrium Loading (g/t) at Solution Concentration | ||
| [Au, mg/L] | 1.0 (mg/L) | 0.50 (mg/L) | 0.10 (mg/L) | |
| DA OXIDE-1 | 1.06 | 3,884 | 3,011 | 1,667 |
| DB OXIDE-1 | 1.63 | 3,567 | 2,738 | 1,482 |
| DA FRESH-1 | 0.27 | 1,779 | 1,420 | 841 |
| DA FRESH-2 | 0.56 | 6,780 | 5,005 | 2,473 |
| DA FRESH-3 | 0.75 | 9,280 | 7,269 | 4,122 |
| AA FRESH-1 | 0.75 | 3,345 | 2,510 | 1,288 |
| KARA FRESH-1 | 0.52 | 2,542 | 2,030 | 1,205 |
| KARB FRESH-3 | 0.80 | 6,153 | 4,538 | 2,237 |
| KARC FRESH-2 | 1.00 | 5,293 | 3,938 | 1,982 |
| DA OXIDE VAR-1 | 0.42 | 1,662 | 1,250 | 645 |
| DA FRESH VAR-1 | 1.67 | 5,079 | 3,936 | 2,177 |
| DB OXIDE VAR-1 | 0.76 | 1,623 | 1,268 | 714 |
| DB FRESH VAR-1 | 0.57 | 2,714 | 2,196 | 1,343 |
| DC FRESH VAR-1 | 0.21 | 1,143 | 959 | 639 |
| DC OXIDE VAR-1 | 0.34 | 1,507 | 1,125 | 572 |
| DC OXIDE VAR-2 | 1.44 | 7,375 | 5,587 | 2,933 |
| DC OXIDE VAR-3 | 2.54 | 9,210 | 6,805 | 3,370 |
| DC OXIDE VAR-4 | 0.64 | 2,570 | 2,036 | 1,186 |
| AA FRESH VAR-1 | 0.64 | 4,658 | 3,524 | 1,843 |
| AB FRESH VAR-1 | 0.71 | 4,845 | 3,772 | 2,109 |
Carbon triple contact tests were also undertaken on the leach slurries. The carbon was contacted with a sample of slurry for two hours, then extracted and transferred to a fresh batch of slurry for two hours, then transferred to a final batch for an additional 20 hours for a total of 24 hours. The cumulative gold loading on the carbon is calculated and provided in Table 13.14.
Table 13.14 Carbon Triple Contact Test Results
| Sample | Feed Au Concentration (mg/L) | Calculated Carbon Loading (g/t) |
Fleming Constants | |
| k (hr-1) | n | |||
| DA OXIDE-1 | 1.08 | 1,903 | 122.1 | 1.04 |
| DB OXIDE-1 | 1.68 | 1,414 | 98.9 | 0.60 |
| DA FRESH-1 | 0.28 | 814 | 79.0 | 0.97 |
| DA FRESH-2 | 0.57 | 1,188 | 208.3 | 0.65 |
| DA FRESH-3 | 0.75 | 2,116 | 287.0 | 0.72 |
| AA FRESH-1 | 0.76 | 1,509 | 162.9 | 0.70 |
| KARA FRESH-1 | 0.56 | 1,098 | 96.3 | 0.96 |
| KARB FRESH-3 | 0.84 | 1,595 | 107.7 | 0.97 |
| June 30, 2026 | Page 125 of 291 |
| | Diamba Sud Gold Project, Kédougou Region, Senegal Technical Report |
| Sample | Feed Au Concentration (mg/L) | Calculated Carbon Loading (g/t) |
Fleming Constants | |
| k (hr-1) | n | |||
| KARC FRESH-2 | 1.04 | 1,652 | 137.4 | 0.86 |
| DA OXIDE VAR-1 | 0.41 | 693 | 132.4 | 0.66 |
| DA FRESH VAR-1 | 1.70 | 2,529 | 179.8 | 0.70 |
| DB OXIDE VAR-1 | 0.75 | 831 | 72.9 | 0.67 |
| DB FRESH VAR-1 | 0.57 | 1,039 | 120.6 | 0.45 |
| DC FRESH VAR-1 | 0.21 | 434 | 87.8 | 0.62 |
| DC OXIDE VAR-1 | 0.35 | 443 | 44.6 | 0.84 |
| DC OXIDE VAR-2 | 1.36 | 1,857 | 177.0 | 0.64 |
| DC OXIDE VAR-3 | 2.55 | 2,211 | 122.5 | 0.68 |
| DC OXIDE VAR-4 | 0.64 | 923 | 42.7 | 1.12 |
| AA FRESH VAR-1 | 0.63 | 1,381 | 144.3 | 0.86 |
| AB FRESH VAR-1 | 0.70 | 1,542 | 176.2 | 0.80 |
The main measures for the CIP tests are the Fleming ‘k’ and ‘n’ constants.
The ‘k’ constant indicates the empirical rate constant for carbon adsorption—when applied to virgin carbon in a laboratory situation, it can be used as a measure of whether the mineralized material is fouling the carbon. Values of >240 hr-1 are considered excellent. The results broadly show that there is no significant fouling of the carbon by the slurry.
The ‘n’ constant indicates the carbon loading capacity, with values between 0.5–1.0 considered reasonable. The expected carbon loading at a gold solution concentration of 1.0 mg/L, based on the equilibrium test, showed successful gold loading above 2,500 g/t Au for all samples except DA FRESH-1. The low loading for DA FRESH-1 is attributed to the low gold grade of 0.28 mg/L. This is also shown in the triple contact gold testwork where the lower tenor in DA FRESH-1 produces the lowest calculated carbon loading as expected. Fleming constants from CIP testwork range from acceptable to excellent across all samples. These results indicate that gold recovery by carbon loading from solution is suitable for the style of mineralization, based on selected samples.
| 13.2.5 | Rheology |
Rheology testwork conducted in 2021 indicated slurry handling issues could be expected due to the large clay content of Area D oxide samples. Vane instrument and Bohlin viscometry rheology tests were conducted to investigate the flow properties of the Area D oxide samples. Spatially representative samples were tested to determine vane stress at 35% w/w solids and 40% w/w solids at 106 µm. The vane test was also repeated at an adjusted slurry pH of 10.5 using lime. Results are summarized in Table 13.15. Bohlin Visco 88 instrument tests were also conducted on these samples at 30%, 40%, and 50% w/w solids. Viscosity, shear rate, and shear stress were investigated with the results summarized in Table 13.16.
Table 13.15 Summary of Vane Yield Stress Test Results
| Sample ID | %Solids (% w/w) |
pH | Vane Yield Stress (Pa) |
| DA OXIDE-1 | 35 | 7.5 | 2.2 |
| DA OXIDE-1 | 40 | 7.5 | 2.6 |
| DB OXIDE-1 | 35 | 7.5 | 0.8 |
| June 30, 2026 | Page 126 of 291 |
| | Diamba Sud Gold Project, Kédougou Region, Senegal Technical Report |
| Sample ID | %Solids (% w/w) |
pH | Vane Yield Stress (Pa) |
| DB OXIDE-1 | 40 | 7.5 | 1.7 |
| DC OXIDE-1 | 35 | 7.5 | 0.6 |
| DC OXIDE-1 | 40 | 7.5 | 1.1 |
| DA OXIDE-1 | 35 | 10.5 | 2.2 |
| DA OXIDE-1 | 40 | 10.5 | 2.6 |
| DB OXIDE-1 | 35 | 10.5 | 0.8 |
| DB OXIDE-1 | 40 | 10.5 | 1.7 |
| DC OXIDE-1 | 35 | 10.5 | 0.6 |
| DC OXIDE-1 | 40 | 10.5 | 1.1 |
Table 13.16 Summary of Bohlin Viscometry Testwork
| Sample ID | %Solids (% w/w) | Viscosity at Shear Rate | Shear Stress at Shear Rate | ||
|
4.2 (cps) |
119.2 (cps) |
4.2 (Pa) |
119.2 (Pa) | ||
| DA OXIDE-1 | 50 | 17,217 | 852 | 72 | 102 |
| 40 | 3,481 | 195 | 15 | 23 | |
| 30 | 936 | 86 | 4 | 10 | |
| DB OXIDE-1 | 50 | 6,213 | 363 | 26 | 43 |
| 40 | 1,048 | 94 | 4 | 11 | |
| 30 | 299 | 51 | 1 | 6 | |
| DC OXIDE-1 | 50 | 2,321 | 156 | 10 | 19 |
| 40 | 861 | 78 | 4 | 9 | |
| 30 | 487 | 51 | 2 | 6 | |
| DA OXIDE VAR-1 | 45 | 9,170 | 443 | 39 | 53 |
| 40 | 3,443 | 179 | 14 | 21 | |
| 35 | 1,385 | 116 | 6 | 14 | |
| DB OXIDE VAR-1 | 50 | 7,897 | 413 | 33 | 49 |
| 45 | 3,705 | 210 | 16 | 25 | |
| 35 | 898 | 98 | 4 | 12 | |
| DA FRESH VAR-1 | 55 | 0 | 65 | 0 | 8 |
| 45 | 0 | 49 | 0 | 6 | |
| 35 | 0 | 34 | 0 | 4 | |
The results indicate that the oxide material may experience pumping difficulties at higher solids densities. Blending or other treatment would be required to pump oxides at higher densities. No issues are expected with the fresh material.
| 13.2.6 | Diagnostic Leach |
Two samples from Area D (DA FRESH-1 and DC FRESH-2) that exhibited particularly low overall recoveries were investigated further with a sequential series of diagnostic leach tests to identify where gold is not recoverable by gravity or cyanidation may be deported. The process consists of the following stages:
| · | Gravity concentration and amalgamation. |
| June 30, 2026 | Page 127 of 291 |
| | Diamba Sud Gold Project, Kédougou Region, Senegal Technical Report |
| · | Standard direct cyanidation. |
| · | Dilute hydrochloric acid digest. |
| · | Dilute nitric acid digest. |
| · | Aqua regia digest. |
| · | Fire assay smelt. |
The results of the diagnostic leach tests are shown in Table 13.17.
Table 13.17 Diagnostic Leach Results
| Sample | Gold Distribution (%) | |||||
| Stage 1 | Stage 2 | Stage 3 | Stage 4 | Stage 5 | Stage 6 | |
| DA FRESH-1 | 22.8 | 46.1 | 0.0 | 26.9 | 4.1 | 0.0 |
| DC FRESH-1 | 25.5 | 42.8 | 6.1 | 23.5 | 1.1 | 1.0 |
The majority of the gold not recovered by the gravity/cyanidation flowsheet is recovered by dilute nitric acid digest, suggesting the gold is associated with mostly reactive sulfides.
| 13.3 | Testwork – Kassassoko, Western Splay and Bougouda |
| 13.3.1 | Introduction |
High-level metallurgical testwork was conducted on samples from the Kassassoko, Western Splay deposits, as well as the Bougouda prospect. Two samples were selected from shallower and deeper intervals within the prospect. These samples were all from fresh rock domains and no oxide or transitional litho-oxidation domains were identified. A summary of the various testwork results is summarized in the following sub-sections.
| 13.3.2 | Comminution Testwork |
The SMC test derived A*b data indicates the mineralization in the prospects can be categorized as hard and fall inside the common A*b ranges for fresh rock types. The A*b data for prospects are not excessively resistant to breakage and fall well within the rock types that are readily amenable to SAG milling. The prospect A*b data are all higher than the proposed circuit design basis, indicating that the presently designed comminution circuit will crush and grind the new prospect fresh mineralization types.
Kassassoko and Western Splay BWi test results indicate that these materials are medium energy intensity when grinding and will readily be milled by the circuit proposed for Diamba Sud at throughput rates at or above design. Target grind size of P80 106 µm will be easily achieved should these mineralization types be milled individually or as a blend with the current deposit mineralized material types.
Two Ai test results are higher than the circuit design basis, and the Kassassoko sample is very high and indicative of an extremely abrasive material.
Test results are summarized in Table 13.18.
| June 30, 2026 | Page 128 of 291 |
| | Diamba Sud Gold Project, Kédougou Region, Senegal Technical Report |
Table 13.18 Summary of Comminution Testwork Results
| Sample | Comminution Testwork | |||||
| CWi | Axb | BWi (Closing µm) | BWi kWh/t | Ai g | Ore SG | |
| Kassa Sec B (Kassa A) | - | 32.2 | 150 | 12.4 | 0.675 | 2.65 |
| Kassa Section B | - | - | - | - | - | - |
| Comp Kassa – 1 | - | - | - | - | - | - |
| Comp Kassa – 2 | - | 34.9 | 150 | 14.5 | - | 2.66 |
| Comp WSP -1 | - | 41.7 | 150 | 11.4 | - | 2.72 |
| Comp WSP -2 | - | 34.0 | 150 | 14.5 | 0.30 | 2.67 |
| Comp Boug – 1 | - | 44.2 | 150 | 16.1 | - | 2.74 |
| Comp Boug -2 | - | - | 150 | 17.3 | - | |
| 13.3.3 | Gold Leaching Testwork |
Comprehensive head assays show that elements that can be deleterious to alkaline cyanide gold leaching methods are non-existent. Similarly, no organic carbon was detected in any of the composites removing the major risk causing preg-robbing. Sulfide sulfur levels for all but composite Boug-1 from the Bougouda prospect are low, suggesting gold is unlikely to be associated with sulfide minerals and gold will be free milling at a relatively coarse grind size. However, composite Boug-1 has about 4% sulfide sulfur, and there is a likelihood that some of the gold may not be readily extractable due to the presence of very fine gold particles. There may be potential for sulfide mineral dissociation and the consequent problems caused when sulfide minerals dissolve in alkaline cyanide mixtures (elevated cyanide consumptions, low dissolved oxygen, and possible sulfide passivation of the gold surface, which can slow the rate of gold dissolution in cyanide solutions).
Concentrations of transitional metals such as copper, nickel and zinc are low in all samples and thus these would not elevate cyanide consumption due to their high amounts of metals competing with gold dissolution.
| 13.3.4 | Gravity Leach Testing |
All samples except composite Boug-1 demonstrated high gravity gold recoveries indicating there are large components of coarse free gold present in the tested samples. Gravity gold recoveries ranged from 61–80%. Gravity gold recovery for Boug-1 was still significant at 16%. The gravity gold recovery results achieved in testwork will be higher than achieved at plant scale due to testing recovering a gravity gold concentrate about 100 times larger than that at plant scale and using highly efficient amalgamation to separate the gold from the gravity concentrate. Gravity gold recovery is likely to be between 30–50% at plant scale when processing mineralized materials similar to those tested.
Overall gravity-leach gold extractions were mostly in the high 90th percentiles and the lower test results were only lower because the calculated head grades were low at 0.60 and 0.42 g/t Au. High gold extraction results were achieved for samples with calculated head grades of 0.92–3.89 g/t Au. The exception was Boug-1 where total extraction was 92% from a calculated head grade of 3.31 g/t Au.
Testing demonstrated rapid gold extraction with little if any benefit achieved from extending the leach duration beyond 24 hours.
Sodium cyanide consumptions are reported at 48 hours leaching and are all low, with only Boug-1 exceeding 0.50 kg/t at 0.55 kg/t. Other sample consumptions were between
| June 30, 2026 | Page 129 of 291 |
| | Diamba Sud Gold Project, Kédougou Region, Senegal Technical Report |
0.34–0.45 kg/t. This is likely to be lower when targeting lower residual sodium cyanide concentrations in the leach residues and the low consumptions are indicative of the samples not containing cyanide consumers like reactive iron sulfides.
Target leaching pH was between 10–10.5 and all samples ground in a stainless-steel mill remained alkaline after grinding in Perth tap water. Lime consumptions were low, which is indicative of very low, or no reactive sulfides are clays being present in the samples.
Gravity-leach testing results on all composites were mostly exceptional, and these target samples did not demonstrate any areas of concern should the same flowsheet be used as that for mineralized material sourced from the deposits with Mineral Resources.
| 13.4 | Testwork – Southern Arc and Moungoundi |
| 13.4.1 | Introduction |
Additional metallurgical testwork was completed on samples from the Southern Arc and Moungoundi prospects to provide further metallurgical characterization of mineralized material included within the mine plan.
The testwork program included comminution testing, head assay analysis, bulk leach extractable gold (BLEG) analysis, gravity-leach testing, rheology testing, and sequential CIP testing, where applicable. Additional SMC testing was also completed on two composite samples identified as C_COMPOSITE and M_COMPOSITE.
| 13.4.2 | Sample Selection |
Drill core intervals were selected by Fortuna geologists and are considered representative of the mineralization expected within each prospect. A summary of the samples selected for this testwork program is presented in Table 13.19.
Table 13.19 Summary of Samples tested for Southern Arc and Moungoundi
| Sample ID | Drill Hole ID |
From (m) |
To (m) |
Total Sample Mass (kg) | Head Grade (g/t Au) |
| C_Composite _Southern Arc | DSDD465, DSDD469 | 36.9 | 1.47 | ||
| M_Composite – Moungoundi | DSDD347 | 24.9 | 1.03 | ||
| Composite 1 – Southern Arc Upper Zone | DSDD487, DSDD440, DSDD480, DSDD461, DSDD487, DSDD443, DSDD368, DSDD453, DSDD404, DSDD424, DSDD400 | 29.3 | 2.41 | ||
| Composite 2 – Southern Arc Lower Zone | DSDD485, DSDD453, DSDD483 | 19.7 | 0.92 | ||
| Composite 3 – Moungoundi | DSDD347, DSDD348, DSDD372 | 24.4 | 1.25 | ||
| Var 1_SA – Southern Arc Section A Upper Horizon | DSDD487 | 36 | 42 | 3.54 | |
| Var 2_SA – Southern Arc Section A Upper Horizon | DSDD487 | 52 | 57 | 9.22 | |
| Var 3_SA – Southern Arc Section B Upper Horizon | DSDD453 | 90 | 99 | 1.57 | |
| Var 4_SA – Southern Arc Section B Lower Horizon | DSDD453 | 112 | 117 | 0.63 | |
| Var 5_SA – Southern Arc Section C Upper Horizon | DSDD400 | 33 | 36 | 1.72 |
| June 30, 2026 | Page 130 of 291 |
| | Diamba Sud Gold Project, Kédougou Region, Senegal Technical Report |
| Sample ID | Drill Hole ID |
From (m) |
To (m) |
Total Sample Mass (kg) | Head Grade (g/t Au) |
| Var 1_Moung – Moungoundi Section C | DSDD348 | 73 | 81 | 2.07 | |
| Var 2_Moung – Moungoundi Section C | DSDD348 | 88 | 96 | 1.22 | |
| Var 3_Moung – Moungoundi Section C | DSDD372 | 60 | 64 | 0.69 |
Note: Sample IDs are named to reference the resource pit. Variability samples are prefixed by “Var”.
Maps showing the location of metallurgical test samples taken For Southern Arc and Moungoundi are shown in Figure 13.12 and Figure 13.13, respectively.
Figure 13.12 Map Showing Location of Metallurgical Samples for Southern Arc
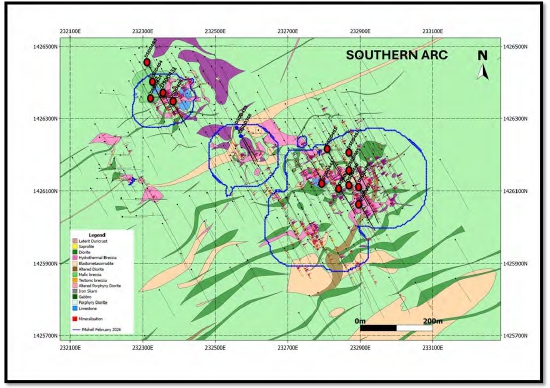
Figure prepared by Fortuna, 2026
| June 30, 2026 | Page 131 of 291 |
| | Diamba Sud Gold Project, Kédougou Region, Senegal Technical Report |
Figure 13.13 Map Showing Location of Metallurgical Samples for Moungoundi
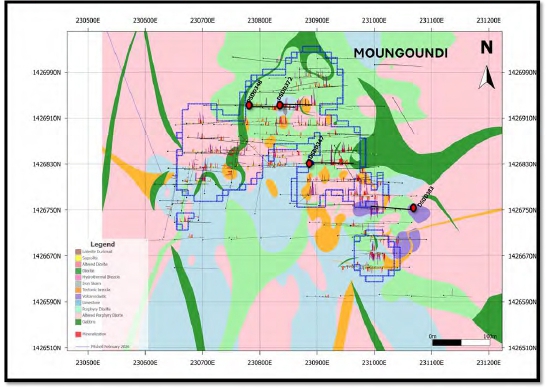
Figure prepared by Fortuna, 2026
| 13.4.3 | Comminution Testwork |
Comminution testwork was completed on selected fresh mineralization samples from the Southern Arc and Moungoundi prospects to further characterize the hardness, breakage and abrasion properties of the material. The program included SMC, BWi and Ai testing. For Southern Arc, SMC and BWi testwork were completed on one composite sample, with additional BWi testing completed on four samples and Ai testing completed on one sample. For Moungoundi, SMC testwork was completed on one composite sample, BWi testing on two samples and Ai testing on one sample.
Table 13.20 presents the SMC testwork results for the Southern Arc and Moungoundi composite samples.
Table 13.20 SMC Results for Southern Arc and Moungoundi
| Sample Info | SMC | |||||||||
| A | b | A x b | DWi (kWh/m3) | DWi (%) | ta | Mia (kWh/t) | Mic (kWh/t) | Mih (kWh/t) | SCSE (kWh/t) | |
| C_Composite | 66.8 | 0.73 | 48.8 | 5.68 | 37 | 0.46 | 16.6 | 6.2 | 11.9 | 9.15 |
| M_Composite | 65.7 | 0.74 | 48.6 | 5.65 | 37 | 0.46 | 16.7 | 6.2 | 11.9 | 9.11 |
The SMC testwork results for the Southern Arc and Moungoundi composite samples returned A*b values of 48.8 and 48.6 respectively, indicating both materials are comparatively less competent and fall within the softer range of fresh mineralization tested across the Project.
| June 30, 2026 | Page 132 of 291 |
| | Diamba Sud Gold Project, Kédougou Region, Senegal Technical Report |
The SCSE values of 9.15 kWh/t and 9.11 kWh/t respectively indicate the material is amenable to conventional SAG-based comminution circuits.
The Southern Arc BWi result was noted to fall near the median range of the overall project fresh ore dataset, while the Moungoundi samples exhibited comparatively harder grinding characteristics, with BWi values trending toward the upper range of the Project data distribution. Despite this, both deposits remain within the broader range of variability established for the Project mineralization.
The Ai results indicated that the Southern Arc material may be comparatively abrasive relative to other areas (0.410g), while Moungoundi returned lower abrasiveness characteristics (0.102g).
Overall, the comminution characteristics for both prospects are considered compatible with the proposed comminution circuit design basis for the Project.
| 13.4.4 | Head Assay and BLEG Analysis |
Head assay and BLEG testwork was completed on selected samples from the Southern Arc and Moungoundi prospects to further assess the gold deportment characteristics and cyanide amenability of the mineralized material. The testwork program included composite samples as well as selected individual drill core intervals representative of the various mineralized domains.
The head assay results indicated a broad range of gold grades across the tested samples, reflecting the natural variability of the mineralization within the Southern Arc and Moungoundi prospects. Gold grades for the individual samples ranged from approximately 0.7–10.4 g/t Au, while the composite samples returned grades ranging from approximately 0.4–2.9 g/t Au.
BLEG extraction testwork was conducted at grind sizes of P80 106 µm and, for composite samples, at P80 75 µm. The testwork results demonstrated generally high gold extraction characteristics, with recoveries ranging from approximately 79% to >99% Au. Several Southern Arc samples returned gold recoveries in excess of 93% Au at a grind size of P80 106 µm, with one sample achieving approximately 99% Au extraction. Moungoundi samples generally returned lower, but still acceptable recoveries, ranging from approximately 79–90% Au (Figure 13.14).
Figure 13.14 BLEG Test Gold Extraction of Southern Arc and Moungoundi
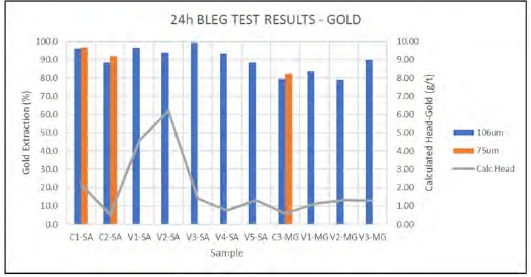
Figure prepared by Plant and Infrastructure Engineering (PIE), 2026
| June 30, 2026 | Page 133 of 291 |
| | Diamba Sud Gold Project, Kédougou Region, Senegal Technical Report |
For the composite samples, a finer grind size of P80 75 µm generally resulted in a modest improvement in gold extraction relative to P80 106 µm, indicating some sensitivity of gold recovery to grind size, albeit the incremental gold extraction won’t be economically advantageous when considering the additional grinding power and equipment necessary to target a finder grind size. Variability between BLEG test calculated head grade and assay head grade was higher than expected and this is likely due to a presence of coarse gold in the samples and there being poor gold homogeneity in the sample.
The residue grades generated during the BLEG testwork were generally low, supporting the overall good leachability of the mineralization. The testwork results suggest that the mineralization from both Southern Arc and Moungoundi is amenable to conventional cyanide leaching, with Southern Arc generally demonstrating stronger leach performance compared to Moungoundi.
Overall, the results are considered consistent with the broader project metallurgical testwork database and support the inclusion of the Southern Arc and Moungoundi mineralization within the proposed processing flowsheet.
| 13.4.5 | Gravity-Leach and Cyanidation Testwork |
Gravity-leach and cyanidation testwork was completed on all three composites and variability samples from the Southern Arc and Moungoundi prospects to further assess gold recovery characteristics and cyanide leach performance of the mineralized material. The testwork program included gravity recovery and cyanide bottle roll leach testing on the samples with an additional direct bulk leach using Southern Arc composite 1 to generate sample for carbon loading testwork. Results of the testwork are summarized in Table 13.21 and Figure 13.15.
Table 13.21 Gravity, Gravity Tail Direct Leach Results for Southern Arc and Moungoundi
| Sample ID |
Calculated Gold Head Grade (g/t) |
Gravity Gold Recovery (%) |
Cum. Gold Recovery at 24h (%) |
Leach Gold Residue 24h (g/t) |
Cyanide Consumption 24h (kg/t) |
Lime Consumption 24h (kg/t) |
| Composite 1 - SA (Bulk Direct Leach) | 2.91 | 89.8 | 0.30 | 0.32 | 0.30 | |
| Composite 1 - SA | 2.88 | 65.5 | 95.0 | 0.15 | 0.36 | 0.26 |
| Composite 2 - SA | 0.66 | 44.8 | 88.5 | 0.08 | 0.33 | 0.46 |
| Var 1 - SA | 4.52 | 54 | 96 | 0.20 | 0.40 | 0.29 |
| Var 2 - SA | 8.78 | 55 | 95 | 0.48 | 0.28 | 0.25 |
| Var 3 - SA | 1.66 | 88 | 99 | 0.02 | 0.35 | 0.32 |
| Var 4 - SA | 0.72 | 51 | 91 | 0.07 | 0.41 | 0.30 |
| Var 5 - SA | 1.40 | 55 | 91 | 0.13 | 0.43 | 0.38 |
| Composite 1 - MG | 0.89 | 48.5 | 85.3 | 0.13 | 0.39 | 0.49 |
| Var 1 - MG | 1.69 | 73 | 95 | 0.09 | 0.41 | 0.31 |
| Var 2 - MG | 1.54 | 53 | 87 | 0.20 | 0.35 | 0.29 |
| Var 3 - MG | 1.52 | 49 | 86 | 0.20 | 0.35 | 0.26 |
| June 30, 2026 | Page 134 of 291 |
| | Diamba Sud Gold Project, Kédougou Region, Senegal Technical Report |
Figure 13.15 Gravity Leach Test and BLEG Test Results for Southern Arc and Moungoundi
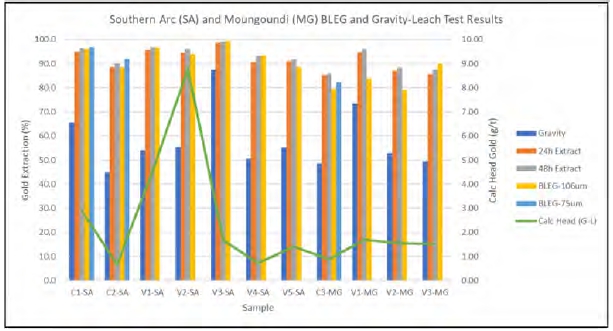
Figure prepared by PIE, 2026
The testwork results demonstrated that mineralization from both Southern Arc and Moungoundi is generally amenable to conventional gravity recovery and cyanide leaching processes. Gravity recovery results indicated high gravity recovery potential with plant scale recoveries expected to be a fraction of lab-tested recoveries as the recovered mass fraction would be substantially less, but still likely >35%.
Bottle roll cyanidation testwork was conducted at a grind size of P80 106 µm under standard cyanidation conditions. The Southern Arc samples generally returned strong leach performance, with total gold recoveries typically exceeding 90% Au and several samples achieving recoveries >95% Au. Moungoundi samples generally returned slightly lower, but still acceptable recoveries, typically ranging between approximately 85–95% Au.
Leach kinetics were generally favorable, with a significant proportion of gold extraction achieved during the early stages of cyanidation. Residue grades following cyanidation were generally low and consistent with the overall recovery trends observed during the broader project metallurgical testwork program.
Cyanide and lime consumptions were within the expected range for free milling gold mineralization and were broadly consistent with previous testwork completed on the project deposits. Overall, the gravity-leach and cyanidation testwork results support the suitability of conventional gravity recovery followed by cyanide leaching for processing mineralization from the Southern Arc and Moungoundi prospects.
| 13.4.6 | Carbon Testwork |
Triple contact carbon testwork was completed on bulk leached Southern Arc composite 1 sample to further assess the adsorption characteristics of dissolved gold onto activated carbon and to evaluate the suitability of conventional CIP processing for the mineralized material. Results of the testwork are summarized in Table 13.22.
| June 30, 2026 | Page 135 of 291 |
| | Diamba Sud Gold Project, Kédougou Region, Senegal Technical Report |
Table 13.22 Carbon Triple Contact Test Results for Southern Arc
| Sample | Feed Au Concentration (mg/L) | Calculated Carbon Loading (g/t) |
Fleming Constants | |
| k (hr-1) | n | |||
| Composite 1 - SA | 2.46 | 1,753 | 205.7 | 0.60 |
The triple contact testwork demonstrated that gold extracted during cyanidation was effectively adsorbed onto activated carbon, with the composite samples showing favorable adsorption characteristics and progressive reduction in solution gold tenor across the sequential adsorption stages. The testwork results indicated that the mineralization does not exhibit significant preg-robbing behavior or adverse carbon fouling characteristics.
Carbon loading performance and adsorption behavior observed during the testwork were consistent with conventional free milling gold mineralization and aligned with the results obtained from previous Project testwork programs. The majority of gold adsorption occurred during the initial adsorption stages, indicating favorable adsorption kinetics and effective gold recovery onto activated carbon.
Overall, the triple contact testwork results support the suitability of a conventional CIP or CIL recovery circuit for treatment of mineralization from the Southern Arc and Moungoundi prospects and are consistent with the broader metallurgical performance trends established for the Project deposits.
| 13.4.7 | Rheology |
Rheology testwork was completed on selected composite samples from the Southern Arc and Moungoundi prospects to assess the slurry flow characteristics of the mineralized material and evaluate its suitability for conventional pumping, thickening, and agitation processes within the proposed processing plant. Results of the testwork for Southern Arc and Moungoundi are summarized in Figure 13.16 and Figure 13.17, respectively.
| June 30, 2026 | Page 136 of 291 |
| | Diamba Sud Gold Project, Kédougou Region, Senegal Technical Report |
Figure 13.16 Southern Arc Composite 1 Viscosity Test Results Summary
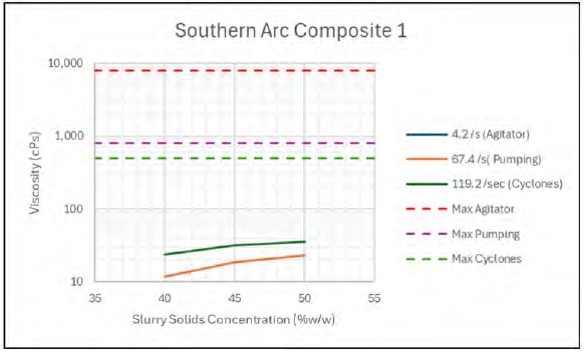
Figure prepared by PIE, 2026
Figure 13.17 Moungoundi Composite 3 Viscosity Test Results Summary
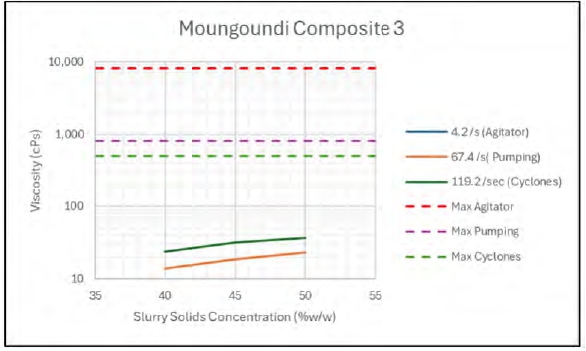
Figure prepared by PIE, 2026
The rheology testwork included slurry viscosity and yield stress measurements at varying solids concentrations representative of anticipated process operating conditions. Testing was completed on Composite 1 (Southern Arc Upper Zone) and Composite 3
| June 30, 2026 | Page 137 of 291 |
| | Diamba Sud Gold Project, Kédougou Region, Senegal Technical Report |
(Moungoundi) at a grind size of P80 106 µm and solids concentrations ranging from 40–50% w/w.
The testwork results indicated that both composite samples exhibited manageable slurry rheological characteristics across the tested solids density ranges. Composite 3 from Moungoundi returned yield stress values ranging from approximately 0.9 Pa at 40% solids to approximately 1.6 Pa at 50% solids, with corresponding shear stress values increasing from approximately 7.9–11.2 Pa as solids concentration increased. Viscosity and yield stress behavior increased progressively with increasing solids concentration, as expected for finely ground mineralized material.
The tested samples demonstrated non-Newtonian slurry behavior typical of finely ground gold mineralization; however, no significant rheological limitations were identified that would materially impact conventional slurry handling, pumping or leaching operations. The rheological characteristics observed during the testwork are considered suitable for conventional mineral processing operations and are consistent with the broader project rheology dataset.
Overall, the rheology testwork results support the suitability of conventional slurry transport, thickening and leaching circuits for treatment of mineralization from the Southern Arc and Moungoundi prospects.
| 13.5 | Metallurgical Variability |
The metallurgical testwork completed for the Diamba Sud Project is considered representative of the various mineralization types and deposits included within the mine plan. The selected samples provided broad coverage across the project area and incorporated variability in geographical location, depth, lithology, weathering profile, gold grade and metallurgical response. Metallurgical variability testing was completed on samples from Area A, Area D, Karakara, Kassassoko, Western Splay, Bougouda, Southern Arc and Moungoundi to assess the response of the different mineralization domains to the proposed processing flowsheet.
The testwork programs included comminution, gravity recovery, cyanidation, carbon adsorption, rheology, and diagnostic leach testing, where applicable. The results demonstrated that the majority of the tested mineralization is amenable to conventional gravity recovery and cyanide leaching, with generally high gold recoveries achieved across both composite and variability samples. Variability in metallurgical response between deposits and domains was observed; however, these differences are considered manageable within the proposed processing design criteria and have been incorporated into the recovery assumptions for the Project.
The majority of fresh mineralization samples demonstrated strong gravity gold recoveries and overall gold extractions typically exceeding 90% Au under optimized leach conditions. Oxide mineralization also generally demonstrated favorable leach performance, although with comparatively higher reagent consumptions and increased rheological sensitivity associated with clay-rich material. A limited number of samples, particularly selected fresh samples from Area D, exhibited lower recoveries and indications of partial refractory behavior associated with sulfide-hosted or locked gold mineralization. These responses were further investigated through diagnostic leach testwork and considered during development of the metallurgical recovery models.
Overall, the metallurgical testwork completed to date is considered sufficient to support the current Mineral Resource reporting and process design basis for the Project.
| June 30, 2026 | Page 138 of 291 |
| | Diamba Sud Gold Project, Kédougou Region, Senegal Technical Report |
| 13.6 | Metallurgical Recovery Estimates |
Results, as of the effective date of this Report, indicate very high recovery for oxide material and mostly high recovery for fresh mineralization with a simple free milling processing plant design.
Application of the optimized leach conditions to bulk composite samples demonstrated that leach recovery of gold (i.e., recovery of gold reporting to leach feed) varied from approximately 56–95%. Overall, the composites tested demonstrated high to very high total gold recoveries (including gravity recovery) ranging from 70–98% after 24 hours of leaching.
The grade–recovery regression model has been applied as the recovery estimation method, indicating an average gold recovery of approximately 90% across the Project under standardized test conditions (P80 = 106 µm grind size, 24-hour leach time).
Gold recovery equations were developed for the various deposits and weathering profiles based on the available metallurgical testwork and are presented in Table 13.23.
Table 13.23 Gold Recovery Formula
| Deposit | Material Type | Gold Grade Range | Metallurgical Recovery Formula |
|
Area D Basis: G-L Bottle Rolls |
Oxide | <0.15 g/t | 0% |
|
>=0.15 g/t <=7.50 g/t |
Au Recovery % = (100% – 1%) × (88.387 × AuHead^0.0454 – 100 × 0.015/AuHead) | ||
| >7.50 g/t | 95.7% | ||
| Fresh | <0.25 g/t | 0% | |
|
>=0.25 g/t <=5.50 g/t |
Au Recovery % = (100% – 1%) × (7.0997 × LN(AuHead) + 81.782 – 100 × 0.012/AuHead) | ||
| >5.50 g/t | 92.7% | ||
|
Area A Basis: G-L Bottle Rolls |
Oxide | <0.15 g/t | 0% |
| >=0.15 g/t | Same as Area D Oxide | ||
| Fresh | <0.15 g/t | 0% | |
|
>=0.15 g/t <=3.50 g/t |
Au Recovery % = (100% – 1%) × (2.8853 × AuHead + 88.752 – 100 × 0.012/AuHead) | ||
| >3.50 g/t | 97.5% | ||
|
KaraKara Basis: G-L Bottle Rolls |
Oxide | <0.15 g/t | 0% |
| >=0.15 g/t | Same as Area D Oxide | ||
| Fresh | <0.15 g/t | 0% | |
>=0.15 g/t <=3.50 g/t |
Au Recovery % = (100% – 1%) × ((100 × (AuHead – (0.0347 × e^(0.2938 × AuHead))) / AuHead – 100 × 0.012/AuHead) | ||
| >3.5g/t | 95.9% | ||
|
Kassassoko Basis: Geo Assay Pulp Leachwells |
Oxide | <0.15 g/t | 0% |
| >=0.15 g/t | Same as Area D Oxide | ||
| Fresh | <0.15 g/t | 0% | |
|
>=0.15 g/t <=5.0 g/t |
Au Recovery % = (100% – 2%) × (100 × (AuHead – 0.0759 × (AuHead^1.0017)) / AuHead – 100 × 0.012/AuHead) | ||
| >5.0 g/t | 91.2% | ||
|
Western Splay Basis: Geo Assay Pulp Leachwells |
Oxide | <0.15 g/t | 0% |
| >=0.15 g/t | Same as Area D Oxide | ||
| Fresh | <0.15 g/t | 0% | |
|
>=0.15 g/t <=4.0 g/t |
Au Recovery % = (100% – 2%) × (4.6764 × AuHead + 76.291 – 100 × 0.012/AuHead) | ||
|
>=4.0 g/t <=15.0 g/t |
Au Recovery % = (100% – 2%) × (0.3082 × AuHead + 93.389 – 100 × 0.012/AuHead) | ||
| >15.0 g/t | 97.0% |
| June 30, 2026 | Page 139 of 291 |
| | Diamba Sud Gold Project, Kédougou Region, Senegal Technical Report |
| Deposit | Material Type | Gold Grade Range | Metallurgical Recovery Formula |
|
Moungoundi Basis: G-L Bottle Rolls |
Oxide | <0.15 g/t | 0% |
| >0.15 g/t | Same as Area D Oxide | ||
| Fresh | <0.15 g/t | 0% | |
| >=0.15 g/t | Au Recovery% = (100%-1%) x ((100 x (AuHead – 0.145 x AuHead^0.8458)) / AuHead – 100 x 0.012 / AuHead)[ | ||
|
Southern Arc Basis: G-L Bottle Rolls |
Oxide | <0.15 g/t | 0% |
| >=0.15 g/t | Same as Area D Oxide | ||
| Fresh | <0.15 g/t | 0% | |
|
>=0.15 g/t <=3.20 g/t |
Au Recovery % = (100% – 1%) × ((100 x (Au Head - 0.0503 x e^( Au Head x 0.2645))) / Au Head - 100 x 0.012 / Au Head) | ||
| >3.20 g/t | 95% |
Based on the gold recovery formulas set out in Table 13.23 the incremental cut off grades were estimated for each deposit and weathering type (refer to Section 15.3 for details on these calculations). The metallurgical recovery estimate at each incremental cut-off grade is shown in Table 13.24.
Table 13.24 Metallurgical Recovery at Incremental Cut-off Grades
| Deposit | Incremental Cut-off Grade (ICOG) Au g/t | Metallurgical Recovery at ICOG (%) | ||
| Oxide/Transition | Fresh | Oxide/Transition | Fresh | |
| Area A | 0.38 | 0.42 | 79.2 | 86.0 |
| Area D | 0.35 | 0.46 | 79.2 | 72.7 |
| Karakara | 0.36 | 0.40 | 79.2 | 86.4 |
| Kassassoko | 0.37 | 0.40 | 79.2 | 87.6 |
| Moungoundi | 0.38 | 0.45 | 79.2 | 79.5 |
| Southern Arc | 0.37 | 0.43 | 79.2 | 82.2 |
| Western Splay | 0.38 | 0.49 | 79.2 | 73.7 |
Based on the formulae set out in Table 13.23, the metallurgical recoveries have been estimated for each ore block and aggregated in the mining/stockpiling plant feed blending process to produce estimated metallurgical recovery by month. The resulting LOM overall average metallurgical recovery for each deposit and globally is shown in Table 13.25.
| June 30, 2026 | Page 140 of 291 |
| | Diamba Sud Gold Project, Kédougou Region, Senegal Technical Report |
Table 13.25 Average Metallurgical Gold Recovery Forecast By Deposit
| Deposit | Overall Average Metallurgical Gold Recovery Forecast (%) |
| Area A | 92.9 |
| Area D | 88.8 |
| Karakara | 94.7 |
| Kassassoko | 89.1 |
| Moungoundi | 84.6 |
| Southern Arc | 93.9 |
| Western Splay | 84.5 |
| All Deposits | 91.5 |
| 13.7 | Deleterious Elements |
Testwork and mineralogical analysis completed to date indicate that no deleterious elements were identified in concentrations that could be expected to materially impact metallurgical recovery, process performance or plant throughput. Minor quantities of reactive sulfides were identified in selected samples; however, these were not present at levels considered significant enough to adversely influence the metallurgical testwork results reported for the current study stage.
| 13.8 | Comments on Section 13 |
The metallurgical testwork completed for the Diamba Sud Project indicates favorable comminution, gravity recovery and cyanidation characteristics for the majority of the mineralization types evaluated during the study. The testwork programs completed across the various deposits and prospects support the suitability of a conventional gravity recovery and cyanide leaching flowsheet for treatment of the mineralized material.
Comminution testwork, including Ai, CWi, BWi and SMC testing, demonstrated that the fresh mineralization ranges from moderate to hard, while oxide mineralization is generally soft and friable. Abrasion index values ranged from approximately 0.042–0.333, with an overall average of approximately 0.18, indicating the mineralized material is generally non-abrasive to moderately abrasive. BWi values for fresh mineralization ranged from approximately 10.4–22.1 kWh/t, while SMC A*b values ranged between approximately 27–53, confirming that the mineralized material is amenable to conventional SAG-based comminution circuits, including either a single-stage SAG milling or SAG, ball and crusher (SABC) configuration. Variability in hardness characteristics was observed across the deposits; however, the tested material remained within ranges considered manageable for the proposed comminution circuit design basis.
Gravity recovery testwork demonstrated the presence of a significant free gold component within mineralization. Gravity recoverable gold ranged from approximately 19–40% for oxide samples and approximately 27–81% for fresh mineralization. Higher gold grade fresh samples generally demonstrated increased gravity recoveries. Intensive cyanidation testwork conducted on gravity concentrates achieved gold recoveries exceeding 99%, supporting the inclusion of a gravity recovery circuit within the proposed process flowsheet.
| June 30, 2026 | Page 141 of 291 |
| | Diamba Sud Gold Project, Kédougou Region, Senegal Technical Report |
Leach optimization and bulk cyanidation testwork demonstrated generally high gold recoveries across the majority of oxide and fresh mineralization samples. The selected grind size of P80 106 µm provided an appropriate balance between gold recovery and grinding energy requirements. Cyanidation testwork indicated favorable leach kinetics, with the majority of gold extraction achieved within approximately 24 hours of leaching. Overall gold recoveries from the bulk leach testwork ranged between approximately 70–98%, with average recoveries of approximately 93% for oxide mineralization and 92% for fresh mineralization. The use of oxygen sparging improved early-stage leach kinetics; however, final recoveries after 24 hours were generally similar to those achieved using air sparging.
Cyanide and lime consumptions were within ranges considered typical for free milling gold mineralization, although oxide mineralization generally exhibited higher reagent consumptions relative to fresh material. Fresh mineralization cyanide consumption generally ranged between approximately 0.3–0.6 kg/t, with lime consumption between approximately 0.1–0.6 kg/t. Oxide mineralization cyanide consumption ranged between approximately 0.5–1.1 kg/t, while lime consumption ranged between approximately 0.5–2.5 kg/t.
The majority of tested samples demonstrated high overall gold recoveries under the selected process conditions. A limited number of fresh mineralization samples from Area D exhibited comparatively lower recoveries associated with partially locked or sulfide-associated gold. The DC Fresh-1 sample returned recoveries of approximately 70–75% Au and diagnostic leach investigations confirmed that portions of the unrecovered gold were associated with reactive sulfides and non-silicate mineral phases, indicating partial refractory characteristics within selected localized domains.
Carbon adsorption testwork demonstrated favorable gold adsorption behavior with no significant preg-robbing or carbon fouling characteristics identified within the tested samples. Equilibrium carbon loadings at a solution concentration of 1.0 mg/L generally exceeded 2,500 g/t Au for the majority of samples tested, while Fleming ‘k’ constants ranged from acceptable to excellent, supporting the suitability of conventional carbon adsorption processes for recovery of dissolved gold from the project mineralization.
Rheology testwork indicated that fresh mineralization generally exhibits favorable slurry handling characteristics. Selected oxide samples, particularly clay-rich material from Area D, demonstrated elevated slurry viscosities and yield stress values at higher solids concentrations. Vane yield stress values for oxide samples ranged between approximately 0.6 Pa and 2.6 Pa, while viscosity measurements increased significantly at solids concentrations above 40% w/w. These characteristics may require blending strategies or operational controls to maintain favorable slurry transport and thickening performance during processing of oxide mineralization.
Additional metallurgical testwork completed on samples from Kassassoko, Western Splay, Bougouda, Southern Arc and Moungoundi demonstrated metallurgical responses broadly consistent with the main Diamba Sud deposits. Testwork completed on these deposits and prospects included comminution, gravity recovery, cyanidation, adsorption, rheology and supporting analytical investigations. The results confirmed that these mineralization types are generally amenable to conventional gravity and cyanide leaching
| June 30, 2026 | Page 142 of 291 |
| | Diamba Sud Gold Project, Kédougou Region, Senegal Technical Report |
processes, with metallurgical variability remaining within the expected range for the Project.
Overall, the metallurgical testwork completed to date is considered sufficient to support the process design basis and metallurgical recovery assumptions adopted for the current study stage as summarized in Table 13.26 and Table 13.27.
Table 13.26 Proposed Process Design Values Based on Testwork
| Proposed PDC inputs | Value |
| P80 | 106 µm |
| Leaching Time | ~24 hours |
| Au Recovery by Gravity of Total Gold | 15–60% |
| Au Recovery by Leaching of Total Gold | 35–80% |
| Total Au Recovery | 90–92% |
| CN Consumption, Oxide | 0.76kg/t |
| Lime Consumption, Oxide | 1.37 kg/t |
| CN Consumption, Fresh | 0.42 kg/t |
| Lime Consumption, Fresh | 0.27 kg/t |
| O2 Consumption | Minimal |
| % Solid w/w | 34% Oxide and 45% Fresh |
Table 13.27 Proposed Comminution Model Inputs
| Model Parameter | Value - Oxide | Value - Fresh |
| Ai | 0.034 | 0.222 |
| CWi | 7.3kWh/t | 7.3 -15.1 kWh/t |
| BWi | 8.1kWh/t | 17.4kWh/t |
| SG | 2.40 | 2.74 |
| A*b | 227 | 30.5 |
| Throughput | 2.5 Mt/a | 2.0 Mt/a |
Based on the metallurgical testwork conducted, metallurgical grade–recovery relationships were developed for oxide and transitional material across all deposits, and separate recovery models were developed for fresh material in each deposit.
| June 30, 2026 | Page 143 of 291 |
| | Diamba Sud Gold Project, Kédougou Region, Senegal Technical Report |
| 14 | Mineral Resource Estimates |
| 14.1 | Introduction |
The Mineral Resource estimates were completed by Fortuna or Entech Mining personnel and peer reviewed by Eric Chapman P. Geo, a Fortuna employee.
| 14.2 | Supplied Data, Data Transformations and Data Preparation |
Information used in the 2026 estimation is sourced from the Maxwell DataShed industry standard database system.
Boya supplied all available data as at January 16, 2026.
| 14.2.1 | Data Transformations |
Lower detection limit assay values received from the analytical laboratories were corrected to numeric values, for example “<0.005” was converted to “0.0001”. This ensured that the values were correctly recognized by the software and mitigated interpolation issues later in the estimation process.
Magnetic declination was applied to the azimuth readings from the Reflex EZ-Shot instrument using a correction factor applied by year prior to import to DataShed, values were sourced from NCEI Geomagnetic Calculators.
| 14.2.2 | Software |
Mineral Resource estimates were completed using several software packages for modeling, statistical, geostatistical and grade interpolation activities. Wireframe modeling of the mineralized envelopes was performed in Leapfrog Geo. Data preparation, block modeling and grade interpolations were performed in Datamine Studio RM. Statistical and variographical analysis was performed in Supervisor.
| 14.2.3 | Data Preparation |
Collar, survey, lithology, and assay data were imported into Leapfrog Geo and used to build three-dimensional representations of the drill holes.
Assay values at or below the detection limit were corrected to a numeric value (removal of “<”) lower than the original limit number, half or less.
For each deposit the database was assessed for the requirement to omit any twinned, contaminated RC, or abandoned holes from the final de-surveyed drill hole file used for estimation. The ID of each hole omitted, and the justification for the omission, was recorded during the process.
| 14.3 | Geological Interpretation and Domaining |
Wireframes representing the major geological and weathering units were generated based on cross-sectional interpretations for all deposits. In addition, a wireframe defining gold mineralization (>0.1 g/t Au) in each deposit was generated based on structural and geological data. The low-grade domains were used to constrain probabilistic grade shells that were used to define higher-grade mineralized zones.
| 14.3.1 | Probabilistic Grade Shells |
Categorical indicator kriging (CIK) was used to estimate the location of moderate and high gold grade regions of the deposits. CIK was designed to define potentially economic
| June 30, 2026 | Page 144 of 291 |
| | Diamba Sud Gold Project, Kédougou Region, Senegal Technical Report |
envelopes around mineralized zones digitally that are difficult to outline and delineate using more traditional and labor-intensive methods such as wireframing. Probabilistic envelopes were generated using indicators to define the limits of potentially economic mineralization. The envelopes were used in estimation to confine the higher-grade assays from smearing into lower-grade zones and restrict lower-grade assays from diluting the higher-grade zones.
CIK models were constructed internal to the defined low-grade domains as follows:
| · | An indicator threshold was selected for samples with grades above the threshold set to one and below to zero. Thresholds varied between deposits, based on the grade distributions, but were generally 0.2–0.3 g/t Au, except for Southern Arc where a threshold of 0.8 g/t Au was applied to better reflect the grade distribution. |
| · | Variograms were modeled to represent the spatial variability of the indicators. |
| · | Indicator values were estimated by ordinary kriging (OK) into a 2.5 x 2.5 x 2.5 m block model using the modeled variograms and associated search neighborhoods. |
| · | Upon completion of the estimate, all blocks with a probability value ≥0.5 were assigned a code of one and blocks with a probability <0.5 were assigned a code of zero. |
| · | Wireframes were generated identifying the location of the block codes equal to one for the threshold (gold grade domains ≥0.2 to 0.3 g/t Au across most deposits and ≥0.8 g/t Au for Southern Arc). |
An example of a representative cross-section of mineralized wireframes is shown in Figure 14.1.
| June 30, 2026 | Page 145 of 291 |
| | Diamba Sud Gold Project, Kédougou Region, Senegal Technical Report |
Figure 14.1 Cross-Section Showing Mineralized Wireframes for Area A
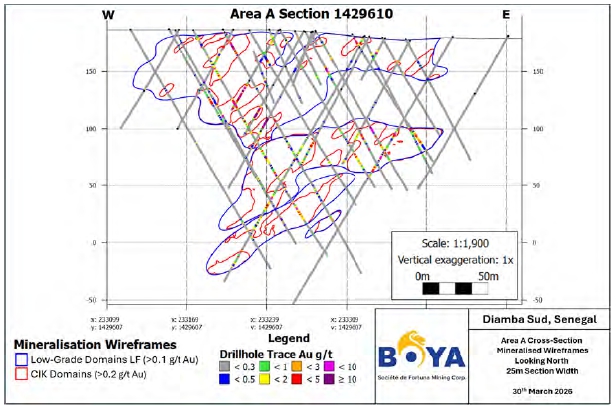
| 14.3.2 | Statistical Analysis of Composites |
Compositing of sample lengths was undertaken so that the samples used in statistical analyses and estimations have similar support (i.e. length). Drill hole samples were selected at predominantly 1 m intervals (85% of drill hole samples are 1 m in length for RC/core), although varying interval lengths are sometimes selected depending on the length of intersected geological features and visual mineralization indicators. Occasionally barren waste zones had sample lengths >2 m; however, they represented <0.5% of the mineralized samples and are not regarded as material to the estimates. Sample lengths were examined for each deposit, and the dominant sample length of 1 m was selected as the composite length for all deposits.
The Datamine COMPDH downhole compositing process was used to composite the samples within the estimation domains (i.e. composites do not cross over the mineralized domain boundaries). The COMPDH parameter MODE was set to a value of one to allow adjusting of the composite length while keeping it as close as possible to the composite interval; this is done to minimize sample loss.
| 14.4 | Exploratory Data Analysis |
Exploratory data analysis was performed on both raw selected samples within mineralized wireframes and on composites identified in each geological domain. Statistical and graphical analysis (including histograms, log probability plots, scatter plots) were investigated for each domain to assess if additional sub-domaining was required to achieve stationarity.
| June 30, 2026 | Page 146 of 291 |
| | Diamba Sud Gold Project, Kédougou Region, Senegal Technical Report |
The composited data statistics for all deposits and mineralized domains are shown in Table 14.1.
Table 14.1 Univariate Statistics of Au Composites for Each Deposit
| Deposit | Domain ID | Domain Grade Zone |
Count | Min. (g/t) |
Max. (g/t) |
Mean (g/t) |
Variance | Std. Dev. | C.V. |
| Area A | 101 | Low | 685 | 0.00 | 4.46 | 0.15 | 0.20 | 0.45 | 3.03 |
| 201 | High | 422 | 0.00 | 28.60 | 1.41 | 6.90 | 2.63 | 1.87 | |
| 102 | Low | 104 | 0.00 | 2.31 | 0.17 | 0.09 | 0.30 | 1.75 | |
| 202 | High | 72 | 0.00 | 5.92 | 0.99 | 1.33 | 1.15 | 1.17 | |
| 103 | Low | 4,258 | 0.00 | 20.70 | 0.13 | 0.30 | 0.55 | 4.10 | |
| 203 | High | 2,091 | 0.00 | 54.60 | 2.51 | 19.47 | 4.41 | 1.76 | |
| 104 | Low | 3,002 | 0.00 | 5.65 | 0.10 | 0.08 | 0.29 | 2.83 | |
| 204 | High | 1,128 | 0.00 | 63.10 | 2.44 | 21.19 | 4.60 | 1.89 | |
| 105 | Low | 90 | 0.00 | 4.27 | 0.17 | 0.26 | 0.51 | 2.99 | |
| 205 | High | 96 | 0.03 | 9.45 | 1.07 | 2.21 | 1.49 | 1.39 | |
| 106 | Low | 253 | 0.00 | 2.83 | 0.14 | 0.08 | 0.28 | 1.94 | |
| 206 | High | 33 | 0.00 | 5.93 | 0.62 | 1.17 | 1.08 | 1.76 | |
| 999 | Waste | 1,558 | 0.00 | 6.64 | 0.05 | 0.09 | 0.30 | 5.43 | |
| Area D | 101 | Low | 1,142 | 0.00 | 19.30 | 0.22 | 0.93 | 0.96 | 4.31 |
| 101.1 | High | 334 | 0.01 | 25.33 | 1.12 | 4.96 | 2.23 | 1.98 | |
| 102 | Low | 4,590 | 0.00 | 11.01 | 0.16 | 0.27 | 0.52 | 3.35 | |
| 102.1 | High | 3,758 | 0.00 | 149.00 | 2.48 | 39.21 | 6.26 | 2.52 | |
| 103 | Low | 394 | 0.00 | 22.60 | 0.47 | 3.64 | 1.91 | 4.02 | |
| 103.1 | High | 343 | 0.00 | 70.70 | 1.92 | 33.47 | 5.79 | 3.02 | |
| 104 | Low | 411 | 0.00 | 47.50 | 0.28 | 5.60 | 2.37 | 8.39 | |
| 104.1 | High | 242 | 0.00 | 23.78 | 1.54 | 8.80 | 2.97 | 1.93 | |
| 105 | Low | 195 | 0.00 | 14.55 | 0.52 | 2.03 | 1.42 | 2.75 | |
| 106 | Low | 2,180 | 0.00 | 64.27 | 0.28 | 3.54 | 1.88 | 6.78 | |
| 106.1 | High | 443 | 0.00 | 38.30 | 1.76 | 14.44 | 3.80 | 2.16 | |
| 107 | Low | 97 | 0.00 | 33.50 | 1.46 | 17.18 | 4.14 | 2.83 | |
| 108 | Low | 110 | 0.00 | 398.00 | 4.82 | 1427.67 | 37.78 | 7.84 | |
| 109 | Low | 281 | 0.00 | 3.04 | 0.29 | 0.17 | 0.41 | 1.40 | |
| 110 | Low | 186 | 0.00 | 12.00 | 0.34 | 1.33 | 1.15 | 3.39 | |
| 110.1 | High | 54 | 0.07 | 12.00 | 1.32 | 3.40 | 1.84 | 1.40 | |
| 111 | Low | 110 | 0.00 | 0.94 | 0.16 | 0.03 | 0.18 | 1.15 | |
| 112 | Low | 22 | 0.30 | 125.50 | 6.53 | 674.44 | 25.97 | 3.98 | |
| Karakara | 1001 | Low | 2,950 | 0.00 | 15.60 | 0.13 | 0.38 | 0.62 | 4.87 |
| 1001.1 | Medium | 462 | 0.00 | 27.50 | 0.63 | 4.94 | 2.22 | 3.55 | |
| 1001.2 | High | 1,205 | 0.00 | 58.50 | 2.97 | 40.98 | 6.40 | 2.16 | |
| 1002 | Low | 1,249 | 0.01 | 31.30 | 0.17 | 1.47 | 1.21 | 7.26 | |
| 1002.1 | Medium | 271 | 0.01 | 11.20 | 0.38 | 0.98 | 0.99 | 2.59 | |
| 1002.2 | High | 313 | 0.00 | 52.00 | 1.78 | 20.28 | 4.50 | 2.53 | |
| 1003 | Low | 3,725 | 0.00 | 21.10 | 0.12 | 0.45 | 0.67 | 5.66 | |
| 1003.1 | Medium | 735 | 0.01 | 30.10 | 0.47 | 2.56 | 1.60 | 3.38 | |
| 1003.2 | High | 1,099 | 0.00 | 280.00 | 2.73 | 106.35 | 10.31 | 3.78 | |
| 1004 | High | 34 | 0.00 | 10.35 | 1.01 | 3.94 | 1.99 | 1.96 | |
| 1005 | High | 74 | 0.00 | 23.90 | 0.96 | 8.52 | 2.92 | 3.05 | |
| Kassassoko | 1001 | Low | 883 | 0.00 | 3.97 | 0.17 | 0.14 | 0.37 | 2.26 |
| 1001.2 | Medium | 331 | 0.00 | 23.40 | 0.63 | 2.15 | 1.47 | 2.32 | |
| 1001.5 | High | 186 | 0.02 | 7.66 | 1.58 | 2.46 | 1.57 | 1.00 | |
| 1002 | Low | 469 | 0.00 | 2.80 | 0.15 | 0.08 | 0.28 | 1.89 | |
| 1002.2 | Medium | 134 | 0.02 | 9.72 | 0.59 | 1.06 | 1.03 | 1.75 | |
| 1002.5 | High | 69 | 0.08 | 28.70 | 1.59 | 12.16 | 3.49 | 2.19 | |
| 1003 | Low | 1,900 | 0.00 | 4.71 | 0.13 | 0.10 | 0.31 | 2.34 |
| June 30, 2026 | Page 147 of 291 |
| | Diamba Sud Gold Project, Kédougou Region, Senegal Technical Report |
| Deposit | Domain ID | Domain Grade Zone |
Count | Min. (g/t) |
Max. (g/t) |
Mean (g/t) |
Variance | Std. Dev. | C.V. |
| 1003.2 | Medium | 379 | 0.01 | 5.86 | 0.53 | 0.58 | 0.76 | 1.43 | |
| 1003.5 | High | 222 | 0.00 | 20.80 | 1.74 | 5.63 | 2.37 | 1.37 | |
| 1004 | Low | 404 | 0.00 | 10.85 | 0.21 | 0.74 | 0.86 | 4.05 | |
| 1004.2 | Medium | 78 | 0.02 | 6.35 | 0.49 | 0.54 | 0.74 | 1.49 | |
| 1004.5 | High | 30 | 0.05 | 20.90 | 1.70 | 13.28 | 3.64 | 2.14 | |
| 1005 | Low | 6 | 0.01 | 0.28 | 0.10 | 0.01 | 0.10 | 1.04 | |
| 1006 | Low | 136 | 0.00 | 1.48 | 0.11 | 0.03 | 0.19 | 1.64 | |
| 1006.2 | Medium | 53 | 0.02 | 5.73 | 0.79 | 1.10 | 1.05 | 1.33 | |
| 1006.5 | High | 38 | 0.07 | 5.66 | 1.29 | 1.62 | 1.27 | 0.98 | |
| 1007 | Low | 97 | 0.00 | 4.63 | 0.21 | 0.37 | 0.61 | 2.91 | |
| 1007.2 | Medium | 47 | 0.01 | 6.83 | 0.86 | 2.46 | 1.57 | 1.83 | |
| 1007.5 | High | 20 | 0.15 | 3.45 | 1.33 | 0.83 | 0.91 | 0.69 | |
| 1009 | Low | 274 | 0.00 | 10.25 | 0.15 | 0.49 | 0.70 | 4.57 | |
| 1009.2 | Medium | 9 | 0.06 | 0.82 | 0.39 | 0.07 | 0.26 | 0.67 | |
| Western Splay | 101 | Low | 89 | 0.00 | 3.89 | 0.16 | 0.21 | 0.46 | 2.93 |
| 102 | Low | 139 | 0.00 | 2.76 | 0.10 | 0.12 | 0.34 | 3.52 | |
| 103 | Low | 1,099 | 0.00 | 13.20 | 0.21 | 0.77 | 0.88 | 4.13 | |
| 104 | Low | 139 | 0.00 | 25.20 | 0.46 | 5.45 | 2.33 | 5.12 | |
| 105 | Low | 37 | 0.01 | 3.63 | 0.37 | 0.57 | 0.75 | 2.02 | |
| 106 | Low | 1,521 | 0.00 | 21.11 | 0.17 | 0.78 | 0.88 | 5.13 | |
| 107 | Low | 547 | 0.00 | 42.50 | 0.25 | 3.63 | 1.90 | 7.69 | |
| 108 | Low | 947 | 0.00 | 12.10 | 0.15 | 0.42 | 0.65 | 4.25 | |
| 109 | Low | 37 | 0.01 | 19.80 | 0.80 | 10.21 | 3.20 | 4.02 | |
| 201 | High | 26 | 0.07 | 7.57 | 1.85 | 4.66 | 2.16 | 1.17 | |
| 202 | High | 32 | 0.01 | 5.64 | 0.95 | 1.73 | 1.31 | 1.38 | |
| 203 | High | 260 | 0.01 | 71.60 | 3.31 | 44.61 | 6.68 | 2.02 | |
| 204 | High | 32 | 0.03 | 8.44 | 1.51 | 3.26 | 1.81 | 1.19 | |
| 205 | High | 33 | 0.01 | 34.70 | 4.33 | 48.48 | 6.96 | 1.61 | |
| 206 | High | 577 | 0.00 | 39.50 | 1.68 | 9.85 | 3.14 | 1.86 | |
| 207 | High | 198 | 0.00 | 14.90 | 1.37 | 4.73 | 2.18 | 1.58 | |
| 208 | High | 163 | 0.01 | 25.60 | 1.79 | 7.95 | 2.82 | 1.58 | |
| 209 | High | 5 | 0.06 | 19.80 | 4.31 | 60.05 | 7.75 | 1.80 | |
| 999 | Waste | 7,971 | 0.00 | 56.10 | 0.11 | 1.35 | 1.16 | 10.38 | |
| Moungoundi | 1001 | Low | 1,709 | 0.00 | 17.70 | 0.21 | 0.99 | 0.99 | 4.79 |
| 1002 | Low | 1,896 | 0.00 | 16.30 | 0.15 | 0.44 | 0.66 | 4.56 | |
| 1003 | Low | 534 | 0.00 | 4.99 | 0.11 | 0.16 | 0.40 | 3.58 | |
| 1004 | Low | 970 | 0.00 | 16.45 | 0.12 | 0.44 | 0.67 | 5.76 | |
| 1005 | Low | 123 | 0.00 | 4.94 | 0.28 | 0.29 | 0.54 | 1.90 | |
| 2001 | High | 387 | 0.00 | 66.60 | 1.92 | 24.80 | 4.98 | 2.59 | |
| 2002 | High | 289 | 0.01 | 22.15 | 1.31 | 6.80 | 2.61 | 1.99 | |
| 2003 | High | 188 | 0.01 | 18.60 | 1.39 | 6.15 | 2.48 | 1.78 | |
| 2004 | High | 189 | 0.01 | 200.00 | 3.83 | 420.75 | 20.51 | 5.36 | |
| 7999 | Waste (dyke) | 1,191 | 0.00 | 11.15 | 0.12 | 0.40 | 0.63 | 5.38 | |
| 8999 | Waste | 1,247 | 0.00 | 4.80 | 0.03 | 0.04 | 0.19 | 5.50 | |
| 9999 | Waste | 8,354 | 0.00 | 2.91 | 0.02 | 0.01 | 0.07 | 3.54 | |
| Southern Arc | 1001 | Low | 2,475 | 0.00 | 20.00 | 0.27 | 0.98 | 0.99 | 3.67 |
| 1001.8 | High | 608 | 0.01 | 503.00 | 5.37 | 440.35 | 20.98 | 3.91 | |
| 1002 | Low | 1,373 | 0.00 | 36.10 | 0.27 | 1.39 | 1.18 | 4.33 | |
| 1002.8 | High | 496 | 0.03 | 55.80 | 5.26 | 40.15 | 6.34 | 1.20 | |
| 1003 | Low | 662 | 0.00 | 7.74 | 0.21 | 0.37 | 0.61 | 2.85 | |
| 1003.8 | High | 96 | 0.05 | 19.70 | 2.86 | 12.74 | 3.57 | 1.25 | |
| 1004 | Low | 890 | 0.00 | 15.65 | 0.28 | 0.94 | 0.97 | 3.41 | |
| 1004.8 | High | 118 | 0.13 | 62.71 | 5.19 | 78.68 | 8.87 | 1.71 |
| June 30, 2026 | Page 148 of 291 |
| | Diamba Sud Gold Project, Kédougou Region, Senegal Technical Report |
| Deposit | Domain ID | Domain Grade Zone |
Count | Min. (g/t) |
Max. (g/t) |
Mean (g/t) |
Variance | Std. Dev. | C.V. |
| 1005 | Low | 740 | 0.00 | 13.05 | 0.24 | 0.73 | 0.86 | 3.62 | |
| 1005.8 | High | 94 | 0.07 | 30.50 | 3.55 | 19.18 | 4.38 | 1.23 | |
| 1006 | Low | 230 | 0.00 | 7.15 | 0.29 | 0.66 | 0.81 | 2.79 | |
| 1006.8 | High | 6 | 1.18 | 11.00 | 3.78 | 10.81 | 3.29 | 0.87 | |
| 1007 | Low | 386 | 0.00 | 3.94 | 0.17 | 0.14 | 0.37 | 2.17 | |
| 1007.8 | High | 10 | 0.13 | 8.80 | 2.63 | 6.68 | 2.59 | 0.98 | |
| 1008 | Low | 2,237 | 0.00 | 33.40 | 0.29 | 1.69 | 1.30 | 4.47 | |
| 1008.8 | High | 394 | 0.01 | 78.10 | 3.03 | 25.30 | 5.03 | 1.66 | |
| 1009 | Low | 67 | 0.00 | 5.00 | 0.36 | 0.65 | 0.81 | 2.25 | |
| 1010 | Low | 875 | 0.00 | 40.47 | 0.40 | 3.36 | 1.83 | 4.58 | |
| 1010.8 | High | 277 | 0.01 | 68.90 | 5.28 | 66.58 | 8.16 | 1.55 | |
| 1011 | Low | 203 | 0.00 | 4.20 | 0.20 | 0.23 | 0.48 | 2.42 | |
| 1011.8 | High | 24 | 0.06 | 17.27 | 2.88 | 12.28 | 3.50 | 1.22 | |
| 1012 | Low | 529 | 0.00 | 21.20 | 0.24 | 1.68 | 1.30 | 5.31 | |
| 1012.8 | High | 16 | 0.01 | 8.73 | 2.07 | 4.00 | 2.00 | 0.96 | |
| 1013 | Low | 209 | 0.00 | 81.90 | 0.64 | 32.21 | 5.68 | 8.90 | |
| 1014 | Low | 414 | 0.00 | 15.00 | 0.29 | 1.11 | 1.05 | 3.60 | |
| 1014.8 | High | 44 | 0.01 | 45.70 | 3.22 | 45.67 | 6.76 | 2.10 | |
| 1015 | Low | 837 | 0.00 | 19.95 | 0.25 | 0.74 | 0.86 | 3.43 | |
| 1015.8 | High | 25 | 0.39 | 55.30 | 3.96 | 112.76 | 10.62 | 2.68 | |
| 1016 | Low | 368 | 0.00 | 15.45 | 0.34 | 1.70 | 1.30 | 3.81 | |
| 1016.8 | High | 35 | 0.03 | 18.30 | 2.98 | 13.50 | 3.67 | 1.23 | |
| 1017 | Low | 38 | 0.01 | 1.38 | 0.20 | 0.07 | 0.26 | 1.33 | |
| 1017.8 | High | 1 | 1.97 | 1.97 | 1.97 | - | - | - | |
| 1018 | Low | 95 | 0.00 | 6.47 | 0.34 | 0.68 | 0.82 | 2.43 | |
| 1018.8 | High | 18 | 0.03 | 13.70 | 3.08 | 9.78 | 3.13 | 1.02 |
| 14.4.1 | Sub-Domaining |
Diorites were treated as secondary domains during estimation. They were considered waste for reporting purposes. Where present, they depleted or overwrote intersected mineralized domains in the model by either resetting the grades to 0 g/t Au or estimating the low-grade within the volume.
Lithological wireframes were used to assess potential favorable domains for unique sample populations. Comparisons of raw geological data, wireframes, and sample data showed no clear distinct populations within these domains, as indicated by log probability plots, frequency distribution histograms, and contact plot analyses.
Weathering profiles can influence search ellipses for estimation and were considered during variographical analysis. Area D contained a significant oxide blanket hosting most of the gold mineralization. Detailed review through contact plot analyses revealed distinct sample populations between oxide/transition and fresh material, which required separation for further spatial analysis.
| 14.4.2 | Grade Capping |
Gold grades were reviewed to identify extreme values through sample histograms, log histograms, log-probability plots, and spatial analysis. Top cut thresholds were determined based on these statistical plots and their effect on mean, variance, and coefficient of variation (CV). Top cut comparisons for each domain are shown in Table 14.2. If insufficient data were available to determine top cut values for a domain, the values from all domains were reviewed as a single population and applied if appropriate
| June 30, 2026 | Page 149 of 291 |
| | Diamba Sud Gold Project, Kédougou Region, Senegal Technical Report |
for outlier samples. On average the top cutting reduced the CV values by approximately 20% while having a limited impact on reducing overall metal content, with the exception of domains where limited samples were available.
Table 14.2 Top Cut Thresholds
| Deposit | Domain | Count | Top Cut (g/t Au) |
Capped Mean (g/t Au) |
Number of Samples Cut |
| Area A | 101 | 685 | 3.00 | 0.15 | 6 |
| 201 | 422 | 13.00 | 1.35 | 4 | |
| 102 | 104 | 1.20 | 0.16 | 2 | |
| 202 | 72 | 3.50 | 0.92 | 3 | |
| 103 | 4,232 | 5.00 | 0.14 | 3 | |
| 203 | 2,059 | 40.00 | 2.49 | 6 | |
| 104 | 2,944 | 3.00 | 0.12 | 6 | |
| 204 | 1,107 | 28.00 | 2.40 | 2 | |
| 105 | 90 | 1.50 | 0.14 | 1 | |
| 205 | 96 | 5.00 | 0.98 | 2 | |
| 106 | 250 | 1.50 | 0.14 | 3 | |
| 206 | 33 | 1.20 | 0.41 | 4 | |
| 999 | 1,633 | 1.50 | 0.19 | 28 | |
| Area D | 101 | 1,142 | 5.00 | 0.19 | 4 |
| 101.1 | 334 | 10.00 | 1.04 | 4 | |
| 102 | 4,590 | 6.00 | 0.15 | 8 | |
| 102.1 | 3,758 | 60.00 | 2.42 | 7 | |
| 103 | 394 | 5.00 | 0.35 | 5 | |
| 103.1 | 343 | 12.00 | 1.52 | 6 | |
| 104 | 411 | 2.00 | 0.16 | 2 | |
| 104.1 | 242 | 10.00 | 1.37 | 5 | |
| 105 | 195 | 5.00 | 0.44 | 3 | |
| 106 | 2,180 | 11.00 | 0.23 | 7 | |
| 106.1 | 443 | 18.00 | 1.65 | 5 | |
| 107 | 97 | 8.00 | 1.08 | 3 | |
| 108 | 110 | 17.00 | 1.27 | 2 | |
| 109 | 281 | 2.00 | 0.28 | 4 | |
| 110 | 186 | 3.00 | 0.25 | 5 | |
| 110.1 | 54 | 5.00 | 1.17 | 3 | |
| 111 | 110 | - | 0.16 | 0 | |
| 112 | 22 | 3.00 | 0.94 | 2 | |
| Karakara | 1001 | 2,950 | - | 0.13 | 0 |
| 1001.1 | 462 | 17 | 0.60 | 3 | |
| 1001.2 | 1,205 | 32 | 2.82 | 14 | |
| 1002 | 1,249 | - | 0.17 | 0 | |
| 1002.1 | 271 | 6 | 0.36 | 1 | |
| 1002.2 | 313 | 25 | 1.63 | 2 | |
| 1003 | 3,725 | - | 0.12 | 0 | |
| 1003.1 | 735 | 15 | 0.45 | 2 | |
| 1003.2 | 1,099 | 80 | 2.55 | 1 | |
| 1004 | 34 | - | 1.01 | 0 | |
| 1005 | 74 | - | 0.96 | 0 | |
| Kassassoko | 1001 | 883 | 3.00 | 0.14 | 5 |
| 1001.2 | 331 | 4.00 | 0.54 | 3 | |
| 1001.5 | 186 | 6.00 | 1.58 | 3 | |
| 1002 | 469 | 1.30 | 0.14 | 7 | |
| 1002.2 | 134 | 1.30 | 0.59 | 18 | |
| 1002.5 | 69 | 10.00 | 1.22 | 1 |
| June 30, 2026 | Page 150 of 291 |
| | Diamba Sud Gold Project, Kédougou Region, Senegal Technical Report |
| Deposit | Domain | Count | Top Cut (g/t Au) |
Capped Mean (g/t Au) |
Number of Samples Cut |
| 1003 | 1,900 | 1.75 | 0.12 | 22 | |
| 1003.2 | 379 | 1.75 | 0.44 | 36 | |
| 1003.5 | 222 | 10.00 | 1.65 | 3 | |
| 1004 | 404 | 2.00 | 0.13 | 6 | |
| 1004.2 | 78 | 5.00 | 0.48 | 1 | |
| 1004.5 | 30 | 10.00 | 1.34 | 1 | |
| 1005 | 6 | - | 0.10 | - | |
| 1006 | 136 | 1.00 | 0.11 | 5 | |
| 1006.2 | 53 | 5.00 | 0.78 | 1 | |
| 1006.5 | 38 | 5.00 | 1.29 | 2 | |
| 1007 | 97 | 1.00 | 0.13 | 3 | |
| 1007.2 | 47 | 1.00 | 0.86 | 7 | |
| 1007.5 | 20 | 1.00 | 1.33 | 11 | |
| 1009 | 274 | 1.00 | 0.10 | 3 | |
| 1009.2 | 9 | - | 0.39 | - | |
| Western Splay | 101 | 89 | 1.00 | 0.12 | 2 |
| 102 | 139 | 0.50 | 0.06 | 5 | |
| 103 | 1,099 | 2.00 | 0.14 | 32 | |
| 104 | 139 | 2.50 | 0.23 | 2 | |
| 105 | 37 | 0.75 | 0.20 | 7 | |
| 106 | 1,521 | 6.50 | 0.16 | 6 | |
| 107 | 547 | 1.00 | 0.11 | 15 | |
| 108 | 947 | 2.00 | 0.12 | 13 | |
| 109 | 37 | 1.00 | 0.24 | 4 | |
| 201 | 26 | 4.00 | 1.50 | 5 | |
| 202 | 32 | 3.00 | 0.82 | 4 | |
| 203 | 260 | 21.00 | 2.91 | 5 | |
| 204 | 32 | 5.00 | 1.41 | 1 | |
| 205 | 33 | 20.00 | 3.87 | 2 | |
| 206 | 577 | 15.00 | 1.55 | 6 | |
| 207 | 198 | 11.00 | 1.34 | 3 | |
| 208 | 163 | 9.00 | 1.65 | 2 | |
| 209 | 5 | 5.00 | 1.35 | 1 | |
| 999 | 7,971 | 8.00 | 0.09 | 19 | |
| Moungoundi | 1001 | 1,709 | 4.00 | 0.17 | 10 |
| 1002 | 1,896 | 5.00 | 0.13 | 6 | |
| 1003 | 534 | 2.00 | 0.10 | 5 | |
| 1004 | 970 | 4.00 | 0.10 | 4 | |
| 1005 | 123 | 1.50 | 0.25 | 1 | |
| 2001 | 387 | 24.00 | 1.80 | 24 | |
| 2002 | 289 | 10.00 | 1.19 | 4 | |
| 2003 | 188 | 8.00 | 1.28 | 4 | |
| 2004 | 189 | 16.00 | 1.76 | 3 | |
| 7999 | 1,191 | 4.00 | 0.10 | 8 | |
| 8999 | 1,247 | 0.80 | 0.03 | 5 | |
| 9999 | 8,354 | 1.00 | 0.02 | 7 | |
| Southern Arc | 1001 | 2,475 | 6.0 | 0.24 | 2.67 |
| 1001.8 | 608 | 30.0 | 4.55 | 1.21 | |
| 1002 | 1,373 | 5.0 | 0.24 | 2.50 | |
| 1002.8 | 496 | 25 | 5.12 | 1.10 | |
| 1003 | 662 | 3.5 | 0.20 | 2.37 | |
| 1003.8 | 96 | 11 | 2.59 | 0.97 | |
| 1004 | 890 | 5 | 0.25 | 2.56 |
| June 30, 2026 | Page 151 of 291 |
| | Diamba Sud Gold Project, Kédougou Region, Senegal Technical Report |
| Deposit | Domain | Count | Top Cut (g/t Au) |
Capped Mean (g/t Au) |
Number of Samples Cut |
| 1004.8 | 118 | 50 | 5.06 | 1.60 | |
| 1005 | 740 | 4 | 0.20 | 2.63 | |
| 1005.8 | 94 | 20 | 3.44 | 1.10 | |
| 1006 | 230 | 2.5 | 0.24 | 1.98 | |
| 1006.8 | 6 | 10 | 3.61 | 0.81 | |
| 1007 | 386 | 2 | 0.16 | 1.89 | |
| 1007.8 | 10 | - | 2.63 | 0.98 | |
| 1008 | 2,237 | 5 | 0.24 | 2.40 | |
| 1008.8 | 394 | 20 | 2.88 | 1.18 | |
| 1009 | 67 | 2 | 0.29 | 1.72 | |
| 1010 | 875 | - | 0.34 | 2.98 | |
| 1010.8 | 277 | 8 | 5.10 | 1.39 | |
| 1011 | 203 | 40 | 0.17 | 1.89 | |
| 1011.8 | 24 | 2 | 2.57 | 0.92 | |
| 1012 | 529 | 15 | 0.17 | 3.07 | |
| 1012.8 | 16 | 4 | 2.03 | 0.91 | |
| 1013 | 209 | 8 | 0.29 | 3.26 | |
| 1014 | 414 | 10 | 0.25 | 2.30 | |
| 1014.8 | 44 | - | 2.64 | 1.24 | |
| 1015 | 837 | 5 | 0.23 | 2.40 | |
| 1015.8 | 25 | 20 | 2.14 | 1.09 | |
| 1016 | 368 | 6 | 0.27 | 2.63 | |
| 1016.8 | 35 | 10 | 2.68 | 0.99 | |
| 1017 | 38 | 5 | 0.17 | 1.05 | |
| 1017.8 | 1 | 10 | 1.97 | - | |
| 1018 | 95 | 0.7 | 0.31 | 2.08 | |
| 1018.8 | 18 | - | 3.08 | 1.02 | |
| 1019 | 6 | 4 | 0.52 | 0.71 | |
| 1020 | 8 | - | 0.11 | 0.88 | |
| 1021 | 24 | - | 0.16 | 1.66 | |
| 1022 | 12 | - | 0.13 | 1.25 | |
| 1023 | 92 | - | 0.25 | 2.07 | |
| 1023.8 | 16 | - | 3.40 | 0.50 | |
| 1024 | 292 | - | 0.19 | 2.83 | |
| 1024.8 | 15 | - | 4.77 | 0.99 | |
| 1025 | 60 | - | 0.03 | 2.34 | |
| 1026 | 52 | - | 0.08 | 2.04 | |
| 1027 | 18 | 3 | 0.14 | 1.04 | |
| 1027.8 | 5 | 5 | 0.96 | 0.63 | |
| 1028 | 77 | 5 | 0.24 | 1.66 | |
| 1028.8 | 16 | 15 | 1.55 | 0.80 | |
| 1029 | 19 | - | 0.21 | 0.98 |
| 14.5 | Variogram Analysis |
| 14.5.1 | Continuity Analysis |
The grade distribution has a log-normal distribution therefore traditional experimental variograms tended to be poor in quality. To counteract this, data was transformed into a normal score distribution for continuity analysis.
Horizontal, across strike, and down dip continuity maps were examined (and their underlying variograms) for gold composites to determine the directions of greatest and
| June 30, 2026 | Page 152 of 291 |
| | Diamba Sud Gold Project, Kédougou Region, Senegal Technical Report |
least continuity. As each mineralized domain has a distinct strike and dip direction analysis was focused on ascertaining if a plunge direction was present.
| 14.5.2 | Variogram Modeling |
Variograms were modelled along the major, semi-major, and minor axes of the mineralization continuity.
The nugget effect was examined from downhole variograms, calculated with lags equal to the composite length.
Directional variograms were modelled in the three principal directions and informed by continuity analysis using variogram fans. It was not always possible to produce variograms for some domains that contained a limited amount of sample data. Variogram models were reported only for domains with sufficient sample pairs to support robust spatial analysis. For domains that did not have sufficient sample numbers to allow the generation of variogram models, a model was selected from a domain of that deposit that had similar mineralization characteristics and the directions modified to match the strike and dip orientation of the domain, if necessary. Modeled variograms were back-transformed from normal scores, as grade estimation was performed without data manipulation. Variogram parameters are detailed in Table 14.3.
Table 14.3 Variogram Model Parameters
| Deposit | Domain | Major, Semi Major and Minor Axes Rotations ZXZ (o) |
C0§ | C1§ |
Ranges (m)† |
C2§ |
Ranges (m)† |
C3§ |
Ranges (m)† |
| Area A | 101 to 106 | 295, 20, 20 | 0.47 | 0.46 | 33, 11, 5 | 0.08 | 48, 41, 14 | - | - |
| 201 to 206 | 285, 15, 5 | 0.31 | 0.54 | 11, 8, 3 | 0.16 | 64, 35, 24 | - | - | |
| 999 | 175, 10, 20 | 0.41 | 0.52 | 58, 31, 12 | 0.07 | 108, 107, 33 | |||
| Area D | 101 & 101.1 | 300, 30, 780 | 0.29 | 0.58 | 26, 46, 3 | 0.12 | 148, 48, 15 | - | - |
| 106 & 106.1 | 280, 10, 350 | 0.34 | 0.59 | 26, 18, 21 | 0.08 | 80, 49, 23 | - | - | |
| 102 to 105 & 107 to 112 | 270, 10, 10 | 0.34 | 0.57 | 14, 5, 2 | 0.08 | 33, 15, 6 | 0.03 | 80, 42, 16 | |
| Karakara | 1001 | -65, 30, 10 | 0.33 | 0.53 | 10, 5, 3 | 0.07 | 30, 15, 10 | 0.06 | 70, 40, 20 |
| 1002 | 125, 65, 160 | 0.39 | 0.43 | 30, 10, 5 | 0.12 | 45, 20, 10 | 0.05 | 105, 40, 20 | |
| 1003 | 120, 55, 155 | 0.42 | 0.42 | 15, 10, 2 | 0.12 | 35, 30, 10 | 0.05 | 90, 65, 20 | |
| 1004 to 1005 | -65, 30, 10 | 0.33 | 0.53 | 10, 5, 3 | 0.07 | 30, 15, 10 | 0.06 | 70, 40, 20 | |
| Kassassoko | 1001 | 0, 10, 10 | 0.20 | 0.30 | 25, 15, 1 | 0.23 | 50, 25, 5 | 0.267 | 120, 70, 30 |
| 1002 | 0, 40, 10 | 0.22 | 0.32 | 25, 10, 1 | 0.23 | 60, 15, 4 | 0.229 | 130, 50, 13 | |
| 1003 | -20, 40, 10 | 0.23 | 0.31 | 20, 15, 1 | 0.24 | 20, 15, 1 | 0.22 | 150, 100, 18 | |
| 1004 | -40, 40, 10 | 0.27 | 0.35 | 25, 10, 1 | 0.21 | 60, 25, 3 | 0.164 | 155, 50, 8 | |
| 1005 | 0, 10, 10 | 0.20 | 0.30 | 25, 15, 1 | 0.23 | 50, 25, 5 | 0.267 | 120, 70, 30 | |
| 1006 | -20, 30, 50 | 0.14 | 0.25 | 16, 5, 1 | 0.25 | 35, 10, 4 | 0.367 | 65, 35, 23 | |
| 1007 | 170, 60, 5 | 0.19 | 0.42 | 5, 3, 1 | 0.14 | 10, 7, 6 | 0.253 | 18, 15, 10 | |
| 1009 | -30, 30, 5 | 0.36 | 0.41 | 25, 15, 1 | 0.15 | 80, 45, 2 | 0.0795 | 120, 70, 9 | |
| Western Splay | 101 to 109 | 270, 15, 90 | 0.26 | 0.58 | 11, 14, 4 | 0.17 | 63, 53, 28 | - | - |
| 201 to 209 | 280, 15, 100 | 0.26 | 0.43 | 32, 16, 5 | 0.31 | 64, 45, 22 | - | - | |
| 999 | 305, 20, 70 | 0.39 | 0.59 | 46, 30, 17 | 0.03 | 131, 126, 76 | - | - | |
| Moungoundi | 1001 | 305, 25, 15 | 0.50 | 0.37 | 30, 20, 7 | 0.14 | 140, 82, 40 | - | - |
| June 30, 2026 | Page 153 of 291 |
| | Diamba Sud Gold Project, Kédougou Region, Senegal Technical Report |
| Deposit | Domain | Major, Semi Major and Minor Axes Rotations ZXZ (o) |
C0§ | C1§ |
Ranges (m)† |
C2§ |
Ranges (m)† |
C3§ |
Ranges (m)† |
| 1002 | 290, 15, 0 | 0.55 | 0.37 | 12, 12, 5 | 0.08 | 56, 56, 25 | - | - | |
| 1003 | 90, 75, 180 | 0.35 | 0.45 | 10, 8, 8 | 0.20 | 65, 30, 30 | - | - | |
| 1004 | 285, 60, 165 | 0.46 | 0.43 | 15, 12, 6 | 0.12 | 70, 30, 30 | - | - | |
| 1005 | 280, 75, 0 | 0.37 | 0.34 | 5, 5, 5 | 0.30 | 40, 40, 40 | - | - | |
| 2001 | 305, 25, 15 | 0.52 | 0.32 | 18, 12, 5 | 0.16 | 50, 50, 20 | - | - | |
| 2002 | 290, 15, 0 | 0.50 | 0.41 | 6, 6, 6 | 0.09 | 45, 45, 45 | - | - | |
| 2003 | 90, 75, 180 | 0.49 | 0.40 | 7.5, 7.5, 7.5 | 0.12 | 55, 55, 55 | - | - | |
| 2004 | 285, 60, 165 | 0.54 | 0.31 | 14, 14, 6 | 0.15 | 50, 50, 30 | - | - | |
| 7999 | 0, 0, 0 | 0.35 | 0.59 | 28, 28, 28 | 0.06 | 80, 80, 80 | - | - | |
| 8999 | 0, 0, 0 | 0.50 | 0.35 | 18, 18, 18 | 0.15 | 150, 150, 150 | - | - | |
| 9999 (Waste) | 0, 0, 0 | 0.41 | 0.51 | 15, 15, 15 | 0.08 | 60, 60, 60 | - | - | |
| Southern Arc | 1001 | 0, 40, -165 | 0.19 | 0.34 | 16, 5, 1 | 0.25 | 35, 10, 4 | 0.21 | 68, 50, 15 |
| 1001.8 | 0, 40, -165 | 0.13 | 0.42 | 20, 10, 1 | 0.16 | 40, 30, 2 | 0.29 | 70, 50, 4 | |
| 1002 | 0, 40, -165 | 0.19 | 0.39 | 25, 20, 1 | 0.18 | 60, 42, 3 | 0.24 | 80, 78, 15 | |
| 1002.8 | 0, 40, -165 | 0.31 | 0.26 | 30, 20, 1 | 0.15 | 50, 42, 2 | 0.46 | 80, 78, 4 | |
| 1003 & 1017 & 1018 | -40, 40, -165 | 0.19 | 0.39 | 30, 15, 1 | 0.31 | 60, 45, 6 | 0.11 | 140, 81, 20 | |
| 1003.8 & 1017.8 & 1018.8 | -40, 40, -165 | 0.19 | 0.39 | 30, 15, 1 | 0.31 | 60, 45, 6 | 0.11 | 140, 81, 20 | |
| 1004 | 0, 40, -165 | 0.19 | 0.49 | 30, 10, 3 | 0.18 | 60, 30, 10 | 0.14 | 75, 60, 30 | |
| 1004.8 | 0, 40, -165 | 0.19 | 0.49 | 30, 10, 3 | 0.18 | 60, 30, 10 | 0.14 | 75, 60, 30 | |
| 1005 to 1007, 1009, 1012 to 1014 & 1020 & 1026 | -50, 20, -160 | 0.18 | 0.29 | 50, 25, 1 | 0.27 | 100, 50, 4 | 0.25 | 265, 110, 29 | |
| 1005.8 to 1007.8 | -50, 20, -160 | 0.18 | 0.29 | 50, 25, 1 | 0.27 | 100, 50, 4 | 0.25 | 265, 110, 29 | |
| 1008 | 0, 40, -165 | 0.19 | 0.40 | 20, 13, 2 | 0.25 | 60, 40, 7 | 0.16 | 120, 80, 20 | |
| 1008.8 | 0, 40, -165 | 0.15 | 0.33 | 15, 13, 1 | 0.27 | 50, 40, 3 | 0.25 | 85, 80, 10 | |
| 1010 & 1011 & 1021 & 1027 & 1028 | -30, 80, -155 | 0.15 | 0.53 | 20, 15, 2 | 0.18 | 50, 40, 11 | 0.14 | 80, 75, 26 | |
| 1010.8 & 1011.8 & 1027.8 & 1028.8 | -30, 80, -155 | 0.10 | 0.42 | 15, 10, 1 | 0.22 | 40, 30, 1.5 | 0.27 | 80, 70, 4 | |
| 1015 & 1023 & 1029 | -50, 40, -170 | 0.33 | 0.41 | 25, 20, 2 | 0.21 | 62, 50, 20 | 0.05 | 100, 80, 30 | |
| 1015.8 & 1023.8 | -50, 40, -170 | 0.33 | 0.41 | 25, 20, 2 | 0.21 | 62, 50, 20 | 0.05 | 100, 80, 30 | |
| Note: Structures are modelled with a spherical model and all parameters are reported from a back transformed model. † ranges for major, semi-major, and minor axes, respectively. Domains with whole numbers include sub-domains unless otherwise stated. | |||||||||
| June 30, 2026 | Page 154 of 291 |
| | Diamba Sud Gold Project, Kédougou Region, Senegal Technical Report |
| 14.6 | Modeling and Estimation |
| 14.6.1 | Block Size Selection |
Block size (see Section 14.6.2) was selected principally based on drill hole spacing, number of samples, mineralized domain geometry, and the proposed mining method. Kriging neighborhood analysis (KNA) was also used to assess the optimum block size based on kriging efficiency (KE) and slope of regression (ZZ) in the domains where variogram models had been established.
In conjunction with the KNA process, the proposed mining method of open pit, and the geometry of the mineralized wireframes are considered for selection of the optimal parent cell size.
| 14.6.2 | Block Model Parameters |
The mineralized domains at Diamba Sud vary in dimensions significantly. Filling wireframes with blocks was completed in the XY plane for all deposits. Block model parameters used for each deposit are detailed in Table 14.4. Each deposit included three sets of wireframes to fill with blocks, including: lithological, weathering and mineralization. The wireframes were sequentially filled with blocks of the parent size with sub-celling down to a minimum of 0.5 m blocks for narrow domains such as diorite intrusions and high-grade mineralized domains. Wireframe volumes were compared to block model volumes for the mineralized domains to validate the block size and fill direction as appropriate. The deposits of Area A and Area D share the same block model parameters as they are adjacent to one another with the deposits combined into a singular model for pit optimization.
Table 14.4 Block Model Parameters by Deposit
| Deposit | Direction | Minimum | Maximum | Parent Size |
| Area A & D | X | 232200 | 233580 | 5 |
| Y | 1428840 | 1429850 | 5 | |
| Z | -100 | 200 | 5 | |
| Karakara | X | 231250 | 232150 | 5 |
| Y | 1427920 | 1428580 | 5 | |
| Z | -80 | 185 | 5 | |
| Western Splay | X | 230700 | 231560 | 5 |
| Y | 1425980 | 1426600 | 5 | |
| Z | -140 | 175 | 5 | |
| Kassassoko | X | 231315 | 232075 | 5 |
| Y | 1425595 | 1426125 | 5 | |
| Z | -50 | 210 | 5 | |
| Southern Arc | X | 232000 | 233200 | 5 |
| Y | 1425750 | 1426600 | 5 | |
| Z | -100 | 200 | 5 | |
| Moungoundi | X | 230495 | 231275 | 10 |
| Y | 1426495 | 1427125 | 10 | |
| Z | -45 | 165 | 5 |
| 14.6.3 | Sample Search Parameters |
KNA was undertaken on each deposit to determine the optimal search parameters for the Mineral Resource estimates. The best estimation results in terms of slope of
| June 30, 2026 | Page 155 of 291 |
| | Diamba Sud Gold Project, Kédougou Region, Senegal Technical Report |
regression, kriging efficiency, and kriging variance. The optimal estimation and search parameters varied between domains but in general were as follows:
| · | A first pass search range of approximately 20–40 m along strike and down dip and 5–10 m across the strike, equivalent to the mineralized domain thickness. |
| · | A minimum of 2–6 composites per block. |
| · | A maximum of 16–20 composites per estimate. |
| · | A maximum of two or three samples from a single drill hole. |
The search ellipsoid used to define the extents of the search neighborhood honored the directions of continuity observed in the variograms. If the estimate failed to inform all blocks in the domain, a second pass was performed with an ellipsoid twice the size of the first. In rare circumstances where blocks remained unestimated after the second pass, a third pass was run, being three times the size of the first.
| 14.6.4 | Grade Interpolation |
OK was selected as the preferred grade interpolation method with nearest neighbor (NN) and inverse distance weighting cubed (IDW) interpolation completed for validation comparison purposes.
Estimation parameters were based on the block size selection, search neighborhood optimization, and variogram modeling. Sample data were composited and, where necessary, top cut prior to estimation.
Composites and the blocks were categorized into mineralized domains for the estimation. Each block was discretized (an array of points to ensure grade variability is represented within the block) and grade interpolated into parent cells (Datamine ESTIMA parameter PARENT=1).
Dynamic anisotropy was used in the estimation of Area D and Karakara. This method was applied only to domains with geometry that would benefit from varied dynamic search ellipses. All other estimated domains employed a singular ellipse approach due to the significant sub-domaining of high/mid/low-grade hard boundaries generating relatively small volumes.
| 14.6.5 | Bulk Density |
There was a total of 31,052 density measurements taken by Boya and used in the estimation of Mineral Resources (Table 14.5).
Table 14.5 Density Measurements by Lithology and Weathering Horizon
| Unit | Average Bulk Density (g/cm3) | ||||||||
| Weathering | Lithology | Global | Area A | Area D | Karaka | Kassa | MNG | S. Arc | WS |
| Oxide | Altered Diorite | 1.55 | - | - | 1.80 | - | - | 1.99 | 1.67 |
| Blastometasomatite | 2.08 | - | - | - | - | - | 1.99 | - | |
| Diorite | 2.01 | 1.87 | 2.19 | 1.83 | 1.83 | 1.83 | 1.99 | 1.93 | |
| Granite | 2.00 | 2.11 | 2.19 | 1.93 | 1.96 | 1.96 | 1.98 | ||
| Hydrothermal Breccia | 1.28 | 1.66 | 1.94 | - | - | 1.66 | 1.99 | - | |
| Laterite | 2.14 | 2.2 | 2.19 | 2.08 | 1.84 | 2.1 | 1.99 | 2.19 | |
| Carbonates | 1.37 | 1.37 | 1.87 | 1.84 | 1.84 | 1.84 | 1.84 | 1.46 | |
| Mafic breccia | 1.90 | 1.91 | 1.94 | 1.89 | - | 1.89 | 2.02 | - | |
| Marl | 1.85 | 2.12 | 1.94 | - | - | - | 1.84 | - | |
| Porphyry Diorite | 2.19 | - | 1.94 | - | - | 1.95 | 2.23 | - | |
| June 30, 2026 | Page 156 of 291 |
| | Diamba Sud Gold Project, Kédougou Region, Senegal Technical Report |
| Unit | Average Bulk Density (g/cm3) | ||||||||
| Weathering | Lithology | Global | Area A | Area D | Karaka | Kassa | MNG | S. Arc | WS |
| Saprolite | 1.50 | 1.47 | 1.47 | 1.43 | 1.43 | 1.43 | 1.96 | 1.43 | |
| Tectonic breccia | 1.96 | 1.68 | 1.87 | 1.70 | - | 1.70 | - | 1.70 | |
| Transitional | Altered Diorite | 2.19 | - | - | 2.20 | - | - | 2.60 | 2.21 |
| Blastometasomatite | 2.55 | - | - | - | - | - | 2.65 | - | |
| Diorite | 2.35 | 2.13 | 2.34 | 2.23 | 2.57 | 2.01 | 2.55 | 2.57 | |
| Granite | 2.45 | 2.35 | 2.34 | 2.46 | 2.5 | 2.49 | - | 2.52 | |
| Hydrothermal Breccia | 2.62 | 2.42 | 2.80 | - | - | 2.42 | 2.49 | - | |
| Laterite | 2.95 | - | - | - | - | 2.96 | 2.48 | - | |
| Carbonates | 2.71 | 2.47 | 2.19 | 2.35 | 2.50 | 2.5 | 2.67 | 2.66 | |
| Mafic breccia | 2.42 | 2.50 | 2.73 | 2.45 | - | 2.42 | 2.47 | - | |
| Marl | 2.12 | 2.12 | 2.08 | - | - | - | - | - | |
| Porphyry Diorite | 2.55 | - | 2.27 | - | - | 2.48 | 2.55 | - | |
| Saprolite | 2.01 | - | 1.59 | 2.03 | 1.50 | 1.5 | 2.23 | 1.50 | |
| Tectonic breccia | 2.06 | 2.20 | - | 2.24 | - | 2.50 | - | 2.50 | |
| Fresh | Altered Diorite | 2.69 | - | - | 2.69 | - | - | 2.66 | 2.67 |
| Blastometasomatite | 2.69 | - | - | - | - | - | 2.69 | - | |
| Diorite | 2.72 | 2.72 | 2.71 | 2.71 | 2.68 | 2.73 | 2.73 | 2.70 | |
| Granite | 2.65 | 2.65 | 2.67 | 2.66 | 2.65 | 2.67 | - | 2.66 | |
| Hydrothermal Breccia | 2.76 | 2.80 | 2.80 | - | - | 2.8 | 2.71 | - | |
| Carbonates | 2.79 | 2.79 | 2.78 | 2.78 | 2.86 | 2.71 | 2.72 | 2.77 | |
| Mafic breccia | 2.70 | 2.71 | 2.73 | 2.69 | - | 2.69 | 2.7 | - | |
| Marl | 2.76 | 2.77 | 2.77 | - | - | - | - | - | |
| Porphyry Diorite | 2.69 | - | 2.67 | - | - | 2.69 | 2.69 | - | |
| Tectonic breccia | 2.69 | 2.69 | 2.70 | 2.68 | - | 2.72 | - | 2.70 | |
All samples were taken from diamond drill core, typically HQ or NQ diameter, with some PQ diameter for metallurgical holes. Statistical analysis of density measurements was performed both globally (all deposits combined) and separately by deposit. The analysis was conducted using both lithological and weathering logging data. This provides (in most cases) three mean density values: one for oxide, one for transition and one for fresh for each lithology.
The density analysis confirms a consistent relationship between density and weathering, with a clear progression from oxide through transitional to fresh material. Weathering is the primary control on density, with lithology exerting a secondary influence, particularly in transitional and fresh domains. Density values are generally consistent across lithologies and deposit areas, with increased variability observed in the oxide domain, as expected.
Average density values for the main lithological units show consistent trends across the deposits, Minor variation between deposits largely reflects differences in alteration intensity, mineral assemblages, and host lithologies associated with mineralization. Lower densities are observed in weathered units such as saprolite, reflecting the effects of weathering, clay development, and increased porosity. Conversely, carbonate and intrusive units (e.g. carbonates, diorites, porphyritic diorites, and granites) display more consistent densities, reflecting their relatively competent primary mineralogy.
| 14.7 | Model Validation |
The techniques for validation of the estimated tonnes and grades include visual inspection of the model and samples (plan-view, section-view, and in three-dimensions); cross-
| June 30, 2026 | Page 157 of 291 |
| | Diamba Sud Gold Project, Kédougou Region, Senegal Technical Report |
validation; global estimate validation through the comparison of declustered sample statistics (except Area D where the even distribution of composites meant declustering to obtain representative mean grades was not required) with the average estimated grade per domain; and local estimate validation through the generation of slice validation plots.
| 14.7.1 | Visual Validation |
Visual validation was performed on all estimated models, comparing estimated grades from all three estimation methods with the input composite data in cross-section through the entire deposit. Generally, the interpolated grades within the models reflect the input data on which they were based. An example is shown in Figure 14.2 from Area D.
Figure 14.2 Cross-Section of Estimated Gold Grade Block Model vs Top Cut Drill Hole Composites in Area D
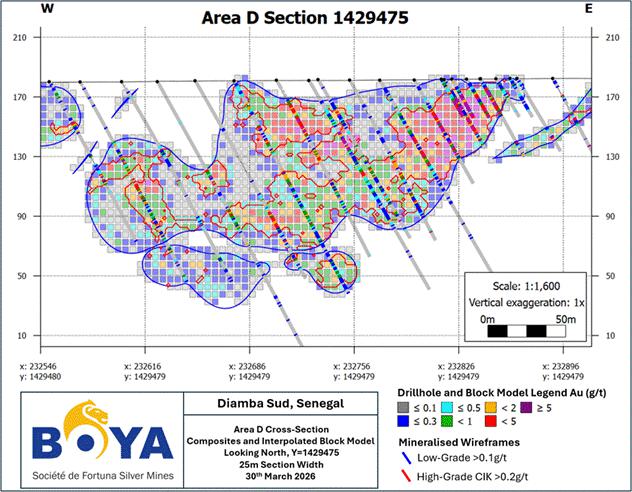
| 14.7.2 | Global Estimation Validation |
The comparison was conducted by deposit and then by domain. Generally, there was no significant variation for the selected interpolation method. In general, the differences observed were<5% in grades for all deposits and domains, with some of the more significant variations related to low-grade domains where absolute differences were minor
| June 30, 2026 | Page 158 of 291 |
| | Diamba Sud Gold Project, Kédougou Region, Senegal Technical Report |
and a result of restricting the spatial impact of higher grades. These variations were not considered as material.
| 14.7.3 | Local Estimation Validation |
Slice validation plots of estimated block grades and input sample grades were generated for each of the mineralized domains by easting, northing, and elevation to validate the estimates on a local scale. Validation of the local estimates assessed each model to ensure over-smoothing or conditional bias was not being introduced by the estimation process and an acceptable level of grade variation was present. An example slice (or swath) plot for Southern Arc is displayed in Figure 14.3. Swath plots were generated for global comparisons mixing all mineralized domains and also separately by domain.
Figure 14.3 Swath Plot Analysis for Southern Arc and Comparative Log-Probability Plot
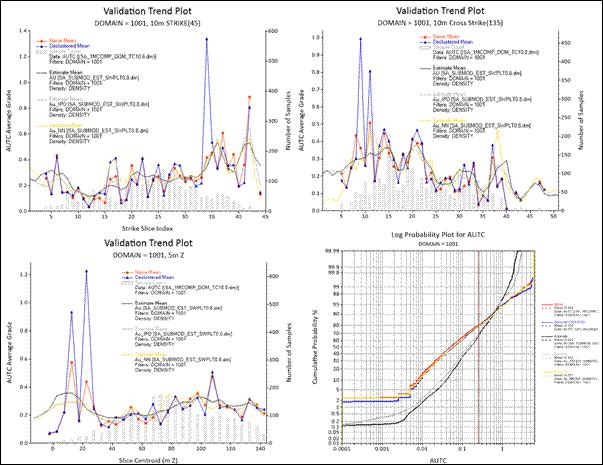
Figure prepared by Fortuna, 2026.
The slice plots generally display a good correlation. Areas that do not are typically related to where sample numbers are limited, for example at the periphery of the deposit or at depth where the estimates are unclassified or classified as an Inferred Mineral Resource. Based on the swath plot results it was concluded that OK was a suitable interpolation method for all deposits, providing reasonable global and local estimates of gold.
| June 30, 2026 | Page 159 of 291 |
| | Diamba Sud Gold Project, Kédougou Region, Senegal Technical Report |
| 14.7.4 | Mineral Resource Depletion |
As at the effective date of this Report, Fortuna has not conducted mining activities at the Diamba Sud Project. However, local artisanal mining is common in the area with hand-dug open pits and vertical shafts. Area A and Area D have not been impacted by artisanal mining activities as of the effective date of this Report. The Karakara, Western Splay, Kassassoko, Southern Arc and Moungoundi deposits have all been subject to artisanal mining activities. Recent artisanal mining has been restricted to the southern area of Western Splay only, with security services monitoring and requesting cessation when encountered. This artisanal activity at Western Splay was stopped in June 2024, and as at the effective date of this Report, there is no active artisanal activity at Diamba Sud for any deposits with Mineral Resource estimates.
To account for the historical depletion, photogrammetric drone surveys were conducted during the dry season (when pits were not filled with water). In addition, selected areas were surveyed with handheld GPS instruments, and the extents noted on maps if any new workings outside of the surveyed areas were detected during the rainy season (when drone surveys do not provide adequate coverage due to ground water incursion). Wireframes were created based on the surveys with an offset at depth introduced to account for unknown depth of vertical shaft mining and deeper workings that may have collapsed prior to surveying.
A unique identifier is coded into the models by selecting block centroids above the artisanal pit wireframes, with a “MINED” field assigned where blocks assigned a value of “0”, if material remains in situ, and “1” if extracted. This is accounted for in reporting by excluding these blocks.
| 14.8 | Mineral Resource Classification |
| 14.8.1 | Geological Continuity |
There is sufficient geological information to support a reasonable understanding of the geological continuity at the Diamba Sud Project. The geology and structural controls for the deposits are complex and multiple studies involving re-logging of core and re-interpretation of sections and three-dimensional models have been undertaken to support the current weathering, geological and mineralized wireframe interpretations.
| 14.8.2 | Data Density and Orientation |
The estimates are based on RC and core drill holes drilled on a 25 m grid pattern to ensure consistent sample support, except for at the periphery of the deposits where spacing can increase up to 50 m.
Drilling perpendicular to dip of mineralized structures at Diamba Sud is the primary accepted methodology for orienting planned holes. In areas where the orientation was not initially understood, drilling was conducted in a scissor pattern until geological continuity was established. The majority of the drill holes in the database intersect mineralization at a reasonable angle as close to orthogonal as is practicable with drilling techniques and interpretation.
Geological confidence and estimation quality are closely related to data density, and this is reflected in the resource classifications.
| June 30, 2026 | Page 160 of 291 |
| | Diamba Sud Gold Project, Kédougou Region, Senegal Technical Report |
| 14.8.3 | Data Accuracy and Precision |
Analysis of CRMs and blanks used by Boya indicate acceptable levels of accuracy for gold grades from both laboratories used. Duplicate sample analyses indicate significant heterogeneity due to the nuggety gold effect at Diamba Sud. However, the variable results do not indicate bias and therefore are not regarded to represent a significant risk to the estimates.
| 14.8.4 | Spatial Grade Continuity |
For the Diamba Sud deposits, the variogram nugget variance for gold is between 10–60% of the population variance, averaging 35%, demonstrating the variable nature of the mineralization. Ranges, representing the distance over which assays are related, generally vary from 20–60 m, being typical of this style of mineralization.
Confidence in the estimates has been exercised by controlling classification based on search ellipse size, with Mineral Resources only being estimated when the search size used in the block estimates is less than the variogram ranges.
| 14.8.5 | Classification |
The Mineral Resource confidence classification of the Diamba Sud block models incorporated confidence in the drill hole data, the geological interpretation, geological continuity, data density and orientation, spatial grade continuity, and estimation quality. The resource models were coded as Inferred and Indicated in accordance with the 2014 CIM Definition Standards. Classification was based on the following steps:
| · | Blocks estimated using the first pass search neighborhoods were considered for the Indicated Resource category. |
| · | Blocks estimated using second and third pass search neighborhoods were considered for Inferred or were unclassified respectively. |
| · | Kriging efficiency and slope of regression values were used where OK was the method of estimation. |
| · | Minimum sample distances, of approximately 25 m for Indicated and 50 m for Inferred, for each estimated block were taken into account. |
| · | The number of samples that influenced each block during estimation (typically 9 or 10 minimum sourced from multiple drill holes) was also considered when assigning classification. |
The criteria were collectively considered with numeric parameters such as minimum distance from a sample, search volumes, and the minimum number of samples filtered in the resulting model. They were used as a guide for wireframe generation to ensure a gradational effect in classification. These were coded into the final model. An example is shown in Figure 14.4 for Area D.
| June 30, 2026 | Page 161 of 291 |
| | Diamba Sud Gold Project, Kédougou Region, Senegal Technical Report |
Figure 14.4 Cross-Section Showing Mineral Resource Classification for Area D
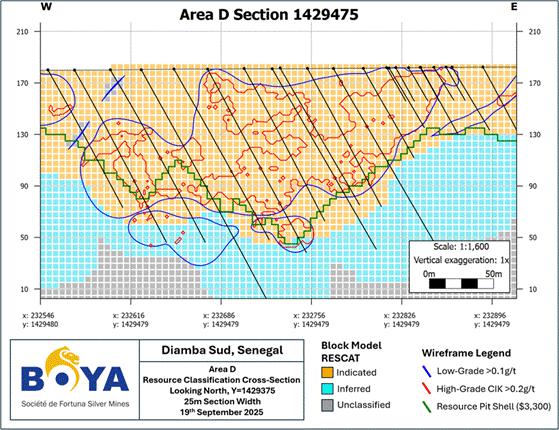
| 14.9 | Mineral Resource Reporting |
| 14.9.1 | Reasonable Prospects for Eventual Economic Extraction |
Mineral Resources are reported based on an assumption open pit mining and constrained within a conceptual pit shell. Details of the inputs used to generate the pit shells for Mineral Resource reporting are detailed in Table 14.6.
Table 14.6 Open Pit Cut-off Grade Inputs for Mineral Resource Estimation
| Factor | Unit | Assumption | |
| Gold Price | $/ oz | 3,300 | |
| Royalty and community tax | % | 3.5 | |
| Refining and Selling Cost | $/ oz | 5.50 | |
| Metallurgical Recovery at ICOG | Oxide / Transition | Fresh | |
| Area A | % | 79.2 | 86.0 |
| Area D | % | 79.2 | 72.7 |
| Karakara | % | 79.2 | 86.4 |
| Kassassoko | % | 79.2 | 87.6 |
| Moungoundi | % | 79.2 | 79.5 |
| Southern Arc | % | 79.2 | 82.2 |
| Western Splay | % | 79.2 | 73.7 |
| June 30, 2026 | Page 162 of 291 |
| | Diamba Sud Gold Project, Kédougou Region, Senegal Technical Report |
| Factor | Unit | Assumption | |
| Weathering Rock Type | Oxide / Transition | Fresh | |
| Processing Cost | $/ t ore | 16.37 | 19.76 |
| G&A Cost | $/ t ore | 5.36 | 6.70 |
| ROM Loader Cost | $/ t ore | 0.35 | 0.44 |
| Grade Control Cost | $/ t ore | 0.57 | 0.71 |
| Mining Owner Team | $/ t ore | 2.27 | 2.62 |
| Ore Differential by Deposit: | |||
| Area A | $/ t ore | 1.90 | |
| Area D | $/ t ore | 0.02 | |
| Karakara | $/ t ore | 0.46 | |
| Kassassoko | $/ t ore | 1.27 | |
| Moungoundi | $/ t ore | 1.87 | |
| Southern Arc | $/ t ore | 1.65 | |
| Western Splay | $/ t ore | 1.96 | |
The cut-off grade for estimating Mineral Resources for each deposit was calculated by applying the following formula:

Pit slope angles of 32º for weathered material and 46º for fresh have been applied, based on geotechnical testwork as detailed in Section 16.3.
| 14.9.2 | Mineral Resource Statement |
Eric Chapman P. Geo. is the QP responsible for the Diamba Sud Project Mineral Resource estimate.
Mineral Resources are reported insitu and have an effective date as at April 10, 2026.
Mineral Resources exclusive of Mineral Reserves are summarized in Table 14.7. Mineral Resources are reported within an optimized pit shell using a gold price of $3,300/oz. Mineral Resources that are not Mineral Reserves do not have demonstrated economic viability.
| June 30, 2026 | Page 163 of 291 |
| | Diamba Sud Gold Project, Kédougou Region, Senegal Technical Report |
Table 14.7 Mineral Resources for the Diamba Sud Project
| Category | Deposit | Material Type | Cut-off Grade (g/t Au) | Tonnes (kt) |
Au (g/t) |
Au (koz) |
| Indicated | Area A | Oxide/Transitional | 0.33 | 26 | 0.35 | 1 |
| Fresh | 0.37 | 263 | 0.52 | 4 | ||
| Sub-total | 288 | 0.50 | 5 | |||
| Area D | Oxide/Transitional | 0.31 | 197 | 0.38 | 2 | |
| Fresh | 0.41 | 239 | 0.69 | 5 | ||
| Sub-total | 436 | 0.55 | 8 | |||
| Karakara | Oxide/Transitional | 0.31 | 8 | 0.34 | 0 | |
| Fresh | 0.35 | 213 | 0.62 | 4 | ||
| Sub-total | 221 | 0.61 | 4 | |||
| Western Splay | Oxide/Transitional | 0.33 | 14 | 0.36 | 0 | |
| Fresh | 0.42 | 219 | 0.76 | 5 | ||
| Sub-total | 233 | 0.74 | 6 | |||
| Kassassoko | Oxide/Transitional | 0.32 | 22 | 0.34 | 0 | |
| Fresh | 0.35 | 184 | 0.51 | 3 | ||
| Sub-total | 206 | 0.49 | 3 | |||
| Southern Arc | Oxide/Transitional | 0.33 | 130 | 0.93 | 4 | |
| Fresh | 0.38 | 1,571 | 1.68 | 85 | ||
| Sub-total | 1,701 | 1.62 | 89 | |||
| Moungoundi | Oxide/Transitional | 0.33 | 279 | 0.75 | 7 | |
| Fresh | 0.42 | 0 | - | 0 | ||
| Sub-total | 279 | 0.75 | 7 | |||
| Total | Oxide/Transitional | 677 | 0.63 | 14 | ||
| Fresh | 2,688 | 1.24 | 107 | |||
| Total | 3,364 | 1.12 | 121 | |||
| Inferred | Area A | Oxide/Transitional | 0.33 | 45 | 1.14 | 2 |
| Fresh | 0.37 | 108 | 1.58 | 5 | ||
| Sub-total | 152 | 1.45 | 7 | |||
| Area D | Oxide/Transitional | 0.31 | 156 | 0.74 | 4 | |
| Fresh | 0.41 | 108 | 1.24 | 4 | ||
| Sub-total | 264 | 0.95 | 8 | |||
| Karakara | Oxide/Transitional | 0.31 | 4 | 1.07 | 0 | |
| Fresh | 0.35 | 22 | 1.54 | 1 | ||
| Sub-total | 26 | 1.47 | 1 | |||
| Western Splay | Oxide/Transitional | 0.33 | 32 | 0.92 | 1 | |
| Fresh | 0.42 | 180 | 1.76 | 10 | ||
| Sub-total | 211 | 1.64 | 11 | |||
| Kassassoko | Oxide/Transitional | 0.32 | 21 | 1.11 | 1 | |
| Fresh | 0.35 | 117 | 0.81 | 3 | ||
| Sub-total | 138 | 0.86 | 4 | |||
| Southern Arc | Oxide/Transitional | 0.33 | 27 | 0.72 | 1 | |
| Fresh | 0.38 | 707 | 1.44 | 33 | ||
| Sub-total | 734 | 1.42 | 33 | |||
| Moungoundi | Oxide/Transitional | 0.33 | 7 | 0.49 | 0 | |
| Fresh | 0.42 | 99 | 1.13 | 4 | ||
| Sub-total | 107 | 1.09 | 4 | |||
| Total | Oxide/Transitional | 292 | 0.85 | 8 | ||
| Fresh | 1,341 | 1.40 | 61 | |||
| Total | 1,632 | 1.30 | 68 | |||
Notes to accompany Mineral Resource table:
| June 30, 2026 | Page 164 of 291 |
| | Diamba Sud Gold Project, Kédougou Region, Senegal Technical Report |
| · | Mr. Eric Chapman, P.Geo., is the Qualified Person responsible for the Mineral Resource estimate, and is a full-time employee of Fortuna. |
| · | Mineral Resources are reported using the 2014 CIM Definition Standards. |
| · | Mineral Resources are reported insitu, on a 100% basis as at April 10, 2026. The State of Senegal is entitled to will assume a 10% free-carried ownership interest in the operating entity when an exploitation permit is granted, and has the right to acquire up to an additional 25% contributory interest in the operating entity at a “fair price” as determined through an independent valuation. |
| · | Mineral Resources are reported from a regularized block model derived from the original sub-blocked model to account for mining dilution. |
| · | Mineral Resources are reported exclusive of Mineral Reserves. Mineral Resources that are not Mineral Reserves do not have demonstrated economic viability. |
| · | Mineral Resources for Diamba Sud are reported constrained within a pit shell at selective mining unit block sizes and at incremental gold cut-off grades for open-pit oxide and transitional material of 0.33 g/t Au for Area A, Southern Arc, Moungoundi, and Western Splay; 0.32 g/t Au for Kassassoko; and 0.31 g/t Au for Karakara and Area D. For fresh material, the applied cut-off grades are 0.35 g/t Au for Karakara and Kassassoko; 0.37 g/t Au for Area A; 0.38 g/t Au for Southern Arc; 0.41 g/t Au for Area D; and 0.42 g/t Au for Moungoundi and Western Splay. The cut-off grades were derived in accordance with estimated average mining costs of $5.77/t for Area A, $5.26/t for Area D, $5.28/t for Karakara, $6.27/t for Western Splay, $6.09/t for Kassassoko, $6.18/t for Moungoundi, and $6.27/t for Southern Arc, average processing and G&A costs of $24.92/t milled, and sales and transportation costs of $5.50/oz of gold. Pit slope angles applied are 32° for weathered material and 46° for fresh rock. The long-term gold price was $3,300/oz. Metallurgical recoveries ranging from 72% to 97% are estimated using grade versus recovery relationship formulae developed for oxide/transition rock (all deposits) and separate formulae for fresh rock in each of the seven deposits A royalty of 3.5% has been considered in the generation of the pit shell and cut-off grade determination. |
| · | Totals may not add due to rounding. |
Factors that may affect the estimates include metal price and exchange rate assumptions; changes to the assumptions used to generate the cut-off grades; changes in local interpretations of mineralization geometry and continuity of mineralized zones; changes to geological and mineralization shape and geological and grade continuity assumptions; variations in density and domain assignments; geometallurgical assumptions; changes to geotechnical, mining, dilution, and metallurgical recovery assumptions; change to the input and design parameter assumptions that pertain to the conceptual open pit constraining the estimates; extent of artisanal mining; and assumptions as to the continued ability to access the site, retain mineral and surface rights titles, obtain and maintain environment and other regulatory permits, obtain Ministerial approval to initiate construction and exploitation, and maintain the social license to operate.
There are no other environmental, legal, title, taxation, socioeconomic, marketing, political or other relevant factors known to the QP that would materially affect the estimation of Mineral Resources that are not discussed in this Report.
| 14.9.3 | Comparison to Previous Estimate |
The primary reasons for the changes in Mineral Resources compared to the previous estimate are due to:
| · | Exclusion of Mineral Reserves. |
| · | Updating of projected operating costs and long term gold price in the calculation of the cut-off grades. |
| 14.10 | Comment on Section 14 |
The QP is of the opinion that the Mineral Resources for the Diamba Sud Project, which have been estimated using RC and core drilling data, have been performed to industry best practices, and are reported using the 2014 CIM Definition Standards.
| June 30, 2026 | Page 165 of 291 |
| | Diamba Sud Gold Project, Kédougou Region, Senegal Technical Report |
| 15 | Mineral Reserve Estimates |
| 15.1 | Introduction |
A structured process was applied to convert Mineral Resources to Mineral Reserves, supported by pit shell optimization, detailed open pit designs, mine scheduling, and economic evaluation. Mineral Resources from seven deposits (Area A, Area D, Karakara, Moungoundi, Western Splay, Kassassoko and Southern Arc) have had modifying factors applied for the estimation of Mineral Reserves.
| 15.2 | Mineral Reserves Estimate |
Mineral Reserves are reported at the point of delivery to the process plant using the 2014 CIM Definition Standards, on a 100% basis. Upon the grant of an exploitation permit to Boya, the State of Senegal will require Boya to designate and incorporate a new entity to hold the exploitation permit and operate the Diamba Sud Project. The State of Senegal is entitled to a 10% free carried ownership interest in the operating entity, and Fortuna will indirectly hold the remaining 90% interest. In addition, the State has the right to acquire up to an additional 25% contributory interest in the operating entity at a “fair price” as determined through an independent valuation. The percentage and timing of any such additional contributory interest is subject to negotiation with the State.
The Qualified Person for the estimate is Mr. Raul Espinoza, FAusIMM (CP), a Fortuna employee.
The Mineral Reserves are all classified as Probable Mineral Reserves, there are no Proven Mineral Reserves. Mineral Reserves have an effective date as at April 10, 2026, and are summarized in Table 15.1.
| June 30, 2026 | Page 166 of 291 |
| | Diamba Sud Gold Project, Kédougou Region, Senegal Technical Report |
Table 15.1 Mineral Reserves for the Diamba Sud Project
| Classification | Deposit | Material Type | Tonnes (kt) | Au (g/t) | Au (koz) |
| Probable | Area A | Oxide / Transitional | 433 | 1.60 | 22 |
| Fresh | 3,703 | 1.59 | 189 | ||
| Sub-total | 4,136 | 1.59 | 211 | ||
| Area D | Oxide / Transitional | 3,107 | 1.96 | 196 | |
| Fresh | 1,996 | 1.29 | 83 | ||
| Sub-total | 5,103 | 1.70 | 279 | ||
| Karakara | Oxide / Transitional | 74 | 1.81 | 4 | |
| Fresh | 2,784 | 1.87 | 168 | ||
| Sub-total | 2,859 | 1.87 | 172 | ||
| Kassassoko | Oxide / Transitional | 98 | 0.77 | 2 | |
| Fresh | 1,067 | 0.97 | 33 | ||
| Sub-total | 1,164 | 0.96 | 36 | ||
| Moungoundi | Oxide / Transitional | 147 | 0.97 | 5 | |
| Fresh | 922 | 1.13 | 33 | ||
| Sub-total | 1,069 | 1.10 | 38 | ||
| Southern Arc | Oxide / Transitional | 192 | 1.35 | 8 | |
| Fresh | 4,272 | 2.36 | 324 | ||
| Sub-total | 4,464 | 2.31 | 332 | ||
| Western Splay | Oxide / Transitional | 128 | 1.08 | 4 | |
| Fresh | 1,577 | 1.55 | 78 | ||
| Sub-total | 1,706 | 1.51 | 83 | ||
| Total | Oxide / Transitional | 4,179 | 1.81 | 243 | |
| Fresh | 16,321 | 1.73 | 909 | ||
| Total | 20,500 | 1.75 | 1,151 |
Notes to accompany Mineral Reserve table:
| · | Mr. Raul Espinoza, FAusIMM (CP), is the Qualified Person responsible for the Mineral Reserves estimate, and is a full-time employee of Fortuna. | |
| · | Mineral Reserves are reported using the 2014 CIM Definition Standards. | |
| · | Mineral Reserves are reported at the point of delivery to the process plant on a 100% ownership basis as at April 10, 2026. The State of Senegal is entitled to a 10% free-carried ownership interest in the operating entity when an exploitation permit is granted, and has the right to acquire up to an additional 25% contributory interest in the operating entity at a “fair price” as determined through an independent valuation. | |
| · | Mineral Reserves have been estimated using incremental gold cut-off grades for open-pit oxide and transitional material as follows: 0.38 g/t Au for Area A, Moungoundi, and Western Splay; 0.37 g/t Au for Kassassoko and Southern Arc; 0.36 g/t Au for Karakara; and 0.35 g/t Au for Area D. For fresh material, the applied cut-off grades are 0.40 g/t Au for Karakara and Kassassoko, 0.42 g/t Au for Area A, 0.43 g/t Au for Southern Arc, 0.45 g/t Au for Moungoundi, 0.46 g/t Au for Area D, and 0.49 g/t Au for the Western Splay deposit. The cut-off grades were derived using a gold price assumption of $2,900/oz, metallurgical recovery rates ranging from 72% to 97% depending on grade and material type by deposit, and surface mining costs of $5.77/t for Area A, $5.26/t for Area D, $5.28/t for Karakara, $6.27/t for Western Splay, $6.09/t for Kassassoko, $6.18/t for Moungoundi, and $6.27/t for Southern Arc. Average processing and general and administrative (G&A) costs are estimated at $24.92/t milled for oxide and transitional material and $30.23/t for fresh material. Refining and selling costs are estimated at $5.50/oz of gold, with an applicable royalty rate of 3.5%. Pit slope angles of 32° for weathered material and 46° for fresh rock have been applied in the pit optimization. Metallurgical recoveries have been estimated using grade–recovery relationship models developed for oxide and |
| June 30, 2026 | Page 167 of 291 |
| | Diamba Sud Gold Project, Kédougou Region, Senegal Technical Report |
| transitional material across all deposits, with deposit-specific recovery models applied to fresh rock across the seven deposits. | ||
| · | Totals may not add due to rounding. |
Factors that may affect the estimates include metal price and exchange rate assumptions; changes to the assumptions used to generate the cut-off grades; geometallurgical assumptions; changes to geotechnical, hydrogeological, mining recovery, dilution, and metallurgical recovery assumptions; change to the input and design parameter assumptions that pertain to the conceptual open pit constraining the estimates; extent of artisanal mining; and assumptions as to the continued ability to access the site, retain mineral and surface rights titles, obtain and maintain environment and other regulatory permits, obtain Ministerial approval to initiate construction and exploitation, and maintain the social license to operate.
| 15.3 | Cut-off Grade Determination |
Breakeven cut-off grades and incremental cut-off grades have been determined. The breakeven cut-off grade was the grade at which all of the costs were equal to the revenue. It incorporated mining, processing, refining, selling, general and administrative costs, sustaining capital costs, as well as metallurgical recovery. The incremental cut-off grades were estimated exclusive of mining costs. This cut-off incorporated processing, refining, selling, general and administrative costs, sustaining capital costs, as well as metallurgical recovery.
The incremental cut off grades were used to determine if mined material was considered waste that will be trucked to the waste rock storage facility or ore that will be trucked to the run-of-mine (ROM) pad for processing.
The variation in cut-off grade values across the seven deposits was driven by differences in process gold recovery curves and ore/waste cost differentials, which included the additional haul distance to the ROM pad and differences in drill–blast costs.
Processing recoveries were applied using formulae reflecting grade–recovery relationships derived from testwork for fresh rock and oxidized rock for all deposits. A single grade– recovery relationship was used for oxide and partially-weathered transition rock across all seven deposits. For fresh rock, separate grade–recovery relationships were used in each deposit based on each individual deposit’s testwork results. These recovery formulae and values are detailed in Section 13 of this Report. Parameters used for the determination of the incremental cut-off grade are shown in Table 15.2. The economic and technical parameters applied in the cut-off grade determination are also incorporated as input parameters in the pit optimization process. Pit optimization is conducted to establish the final pit shell and identify those blocks that will be mined as ore or waste throughout the life-of-mine plan. Further details regarding the pit optimization methodology are presented in Section 16.4.
Table 15.2 Open Pit Cut-off Grade Inputs for Mineral Reserve Estimation
| Factor | Unit | Assumption |
| Gold Price | $/ oz | 2,900 |
| Royalty and community tax | % | 3.5 |
| Refining and Selling Cost | $/ oz | 5.50 |
| Mining Dilution | % | 0* |
| Mining Recovery | % | 100* |
| June 30, 2026 | Page 168 of 291 |
| | Diamba Sud Gold Project, Kédougou Region, Senegal Technical Report |
| Factor | Unit | Assumption | |
| Metallurgical Recovery at ICOG | Oxide / Transition | Fresh | |
| Area A | % | 79.2 | 86.0 |
| Area D | % | 79.2 | 72.7 |
| Karakara | % | 79.2 | 86.4 |
| Kassassoko | % | 79.2 | 87.6 |
| Moungoundi | % | 79.2 | 79.5 |
| Southern Arc | % | 79.2 | 82.2 |
| Western Splay | % | 79.2 | 73.7 |
| Weathering Rock Type | Oxide / Transition | Fresh | |
| Processing Cost | $/ t ore | 16.37 | 19.76 |
| G&A Cost | $/ t ore | 5.36 | 6.70 |
| ROM Loader Cost | $/ t ore | 0.35 | 0.44 |
| Grade Control Cost | $/ t ore | 0.57 | 0.71 |
| Mining Owner Team | $/ t ore | 2.27 | 2.62 |
| Ore Differential by Deposit: | |||
| Area A | $/ t ore | 1.90 | |
| Area D | $/ t ore | 0.02 | |
| Karakara | $/ t ore | 0.46 | |
| Kassassoko | $/ t ore | 1.27 | |
| Moungoundi | $/ t ore | 1.87 | |
| Southern Arc | $/ t ore | 1.65 | |
| Western Splay | $/ t ore | 1.96 | |
* The Mineral Reserves are reported inclusive of mining dilution and mining recovery represented by regularizing the block models to an appropriate SMU size.
The cut-off grade for each deposit was calculated by applying the following formula:

The resultant open pit break-even (BECOG) and incremental cut-off grade (ICOG) estimated for each deposit is shown in Table 15.3.
Table 15.3 Estimated Open Pit Cut-Off Grade by Deposit and Material
| Pit | Type | BECOG (g/t) | ICOG (g/t) |
| Area A | Oxide / Trans. | 0.89 | 0.38 |
| Fresh | 0.91 | 0.42 | |
| Area D | Oxide / Trans. | 0.62 | 0.35 |
| Fresh | 0.75 | 0.46 | |
| Karakara | Oxide / Trans. | 0.81 | 0.36 |
| Fresh | 0.81 | 0.40 |
| June 30, 2026 | Page 169 of 291 |
| | Diamba Sud Gold Project, Kédougou Region, Senegal Technical Report |
| Pit | Type | BECOG (g/t) | ICOG (g/t) |
| Kassassoko | Oxide / Trans. | 0.63 | 0.37 |
| Fresh | 0.67 | 0.40 | |
| Moungoundi | Oxide / Trans. | 0.80 | 0.38 |
| Fresh | 0.89 | 0.45 | |
| Southern Arc | Oxide / Trans. | 0.90 | 0.37 |
| Fresh | 0.90 | 0.43 | |
| Western Splay | Oxide / Trans. | 0.91 | 0.38 |
| Fresh | 1.06 | 0.49 |
| 15.4 | Comments on Section 15 |
Mineral Reserves are reported using the 2014 CIM Definition Standards.
Mineral Reserves assume open pit mining methods for all deposits. In the opinion of the QP, Mineral Reserves have been appropriately reported, incorporating reasonable mining recovery and dilution factors, as well as a cut-off grade derived from contractor mining costs proposals, projected processing and smelting costs, government royalty, metallurgical recoveries estimated, and long-term metal price forecasts based on market consensus.
There are no other environmental, legal, title, taxation, socioeconomic, marketing, political or other relevant factors known to the QP that would materially affect the estimation of Mineral Reserves that are not discussed in this Report.
| June 30, 2026 | Page 170 of 291 |
| | Diamba Sud Gold Project, Kédougou Region, Senegal Technical Report |
| 16 | Mining Methods |
| 16.1 | Overview |
Mining is proposed for Mineral Reserves defined inside an ultimate pit shell based on a long-term gold price of $2,900/oz, by conventional open pit mining methods and equipment, using the services of a mining contractor. Inferred Mineral Resources contained within the open pits were treated as waste.
The proposed mining operations will cover seven deposits (Area A, Area D, Karakara, Kassassoko, Moungoundi, Southern Arc, and Western Splay). Area A and Area D are combined to form a single pit which will be mined in three stages allowing early extraction of high-value oxide ore, predominantly in Area D. Southern Arc will be mined in three stages forming two separate pits. Karakara pit will be mined in two stages to enable early access to fresh ore. Kassassoko, Moungoundi and Western Splay will be mined as single-stage pits.
The overall mining and production strategy is to maintain a mill processing throughput of 2.0–2.5 Mt/a. The processing plant design feed capacity is 2.0 Mt/a of fresh rock or 2.5 Mt/a of oxidized rock. When processing a blend of fresh and oxidized rock the plant feed has been constrained to maximize throughput while ensuring the SAG mill power requirement does not exceed available power.
The pits were sequenced to maximize cashflow generation early in the Project life by prioritizing high-value pit stages and the amount of oxide plant feed early in the LOM. The mine life, based on the Mineral Reserves, is 9.4 years.
Drilling and blasting are planned for oxide, transitional and fresh mill feed material and waste, followed by conventional excavator and truck operations within the pits for the movement of mill feed material and waste. Free digging will be conducted in the oxide zones if practical, otherwise blasting has been assumed for all the weathering horizons. Bench heights for extraction of ore and waste will be 5 m taken in two digging flitches of 2.5 m. Where possible in high-waste stripping pit stages, 10 m bench heights will be used at an appropriate stand-off distance from the ore.
Mining costs and equipment requirements are predominantly based on a request for pricing conducted in 2026. The production mining equipment is proposed to be 200 t excavators, along with 90 t haul trucks. The annual rate of mining movement will peak at 8.5 million bank cubic meters. A common pool of equipment will be used and scheduled across all of the active pits so that movement between the pits is minimized.
A tender process will be used to select the mining contractor.
ROM material will be trucked from the pits to the ROM pad (or ROM stockpile) and tipped onto the ROM pad to be reclaimed and loaded to the crusher feed bin using front-end loaders that will be operated by the mining contractor.
| 16.2 | Hydrogeology |
An updated hydrogeology study was performed by Knight Piésold Consulting (2026) to evaluate and advance the hydrogeological understanding of the Diamba Sud Project area.
Five groundwater exploration boreholes were drilled in 2022, of which two were converted into production boreholes and one into a monitoring borehole (Stage 1). An additional 23 groundwater exploration boreholes were drilled in 2024–2025, with two
| June 30, 2026 | Page 171 of 291 |
| | Diamba Sud Gold Project, Kédougou Region, Senegal Technical Report |
used to supply the camp water. Five of the remaining 21 boreholes were converted into production boreholes and 13 were converted into groundwater monitoring boreholes to complete Stage 2. The remaining three boreholes encountered drilling issues and were not completed. In 2026, 26 exploration boreholes were drilled. Six of those were converted to production wells. Aquifer tests were performed on multiple exploration boreholes.
Based on the drilling results, the successful boreholes all intersect deeper faults/fracture zones associated with the interpreted geological structures. Very little to no groundwater was intercepted in the saprolite and shallower weathered formations. The relatively large yields intercepted in the fractured bedrock indicate that some of the geological structures in the vicinity of the deposits are open and saturated at depth and could potentially be a source of significant volumes of groundwater for operational make-up water into the planned pits.
A numerical model was updated to estimate pit dewatering requirements for the proposed pits such as Areas A and D, including Karakara. New open pits were also incorporated into the model such as Moungoundi, Western Splay, Kassassoko and Southern Arc to assess potential dewatering impacts and to assess groundwater levels after closure. The model was calibrated in steady-state and transient modes. The maximum predicted dewatering for all simulated pits is 65 L/s (5,600 m2/day), which could be expected in the first quarter of Year 2 when pits Area A, Area D, Karakara, and Southern Arc are active at the same time.
A summary of maximum predicted dewatering for the Area A, Area D, Karakara, Kassassoko, Western Splay, Moungoundi and Southern Arc deposits is presented in Table 16.1. For the purposes of the model, mining is projected to commence at the Southern Arc, Area A and Area D deposits in the fourth quarter of 2027, with mining finishing at Moungoundi in 2037.
Table 16.1 Maximum Predicted Dewatering (annual average)
| Pit | P50 Base Case Rate | Year | |
| m3 / day | liter / second | ||
| Areas A and D | 1,750 | 20 | 2034 |
| Western Splay | 1,910 | 22 | 2035 |
| Kassassoko | 445 | 5 | 2036 |
| Karakara | 1,412 | 16 | 2031 |
| Moungoundi | 1,339 | 15 | 2037 |
| Southern Arc 2 | 1,075 | 12 | 2029 |
| Southern Arc 1 | 2,249 | 26 | 2030 |
| Total | 3,500 | 40 | 2030 |
Due to the low permeability of the hydrostratigraphical units in the immediate planned mining areas, sump pumping is the preferred dewatering option for the planned pits on these deposits. Additionally, ex-pit bores may be used and pumped to manage pit inflows, assist with pit wall depressurization, and provide supplementary water supply (these contingency costs have not been included).
Results indicate that the maximum total annual average dewatering at Diamba Sud would be in 2030 (year 3) at 3,500 m3/day or 40 L/s. Results also indicate that the highest instantaneous dewatering at Diamba Sud would peak at 5,600 m3/day or 65 L/s in Year 3 when dewatering from pits Areas A and D, Karakara and Southern Arc are active. The
| June 30, 2026 | Page 172 of 291 |
| | Diamba Sud Gold Project, Kédougou Region, Senegal Technical Report |
overall total predicted dewatering rates vary from P10 (low case rate) of 3,150 m3/day (36 L/s) to P90 (high case rate) of 3,900 m3/day (45 L/s).
The maximum predicted dewatering rate from an individual pit is expected at Western Splay towards the end of mining when this pit reaches its final levels. Predicted pit dewatering rates do not account for any potential surface-water inflows or runoff from surfaces outside the pit shells. Local surface diversion ditches are expected to be constructed for surface water management and accounted into the site-wide water balance. Direct rainfall into the pit, along with surface water runoff from the pit walls are accounted for the model. Data analyses completed for the Project indicate removing groundwater inflows from active pits is likely to be a relatively minor fraction of the overall dewatering, given high rainfall during the rainy season and low aquifer storage across the site.
Groundwater elevations are generally shallow or approximately 5 m below ground surface. All proposed open pits will require a dewatering plan, and the pumped water will be sent to a water storage dam for additional plant make-up water. The strategy is to operate the process plant and mine as a closed circuit.
Following the cessation of mining and dewatering, in-pit water levels are predicted to rebound slowly. Modelled results suggest that the open pits will act as groundwater sinks, inducing groundwater flow towards the pits from about a 2 km radius around the pits, as groundwater levels recover towards pre-mining levels.
| 16.3 | Mine Geotechnical |
Geotechnical parameters are based on a report from Piteau Associates (2026). The host rock for the open pits consists primarily of sedimentary, granitic and volcaniclastic rocks with a small proportion of diorites. Weathering, as interpreted from borehole logs and review of core photographs, varies throughout the Project area. In Area D, the depth of weathering varies from 15–85 m, in Area A the depth of weathering varies from 5–65 m, and in the other planned pits the depth of weathering varies from 5–25 m.
An aggressive bench design is proposed based on the short LOM, size and depth of the pits and use of double benches replaced by single benches to help limit risk, reduce operational complexity and costs, making more manageable any possible bench-scale instability (when compared against a 20 m bench height for double benches).
A fixed set of slope design parameters were used for each of the weathered rock (comprising laterite duricrust, saprolite and partially weathered transition) and fresh rock domains for all pits for all wall orientations (Table 16.2). The slope reliability was then estimated for the designed slopes based on the influence of the structures and the kinematically possible failure mechanisms.
Table 16.2 Geotechnical Slope Design Parameters for all Diamba Sud Pits
| Domain |
Batter Angle (0) |
Berm Width (m) |
Berm Interval (m) |
Inter Ramp Angle (0) |
Overall Slope Angle (0) |
| Weathered | 60 | 3.5 | 5.0 | 38.0 | 33.2 |
| Fresh | 70 | 3.5 | 10.0 | 54.5 | 46.1 |
| An additional 5.0 m berm width to be added at base of weathering and at 50 m depth of weathering (if weathered zone > 50 m depth). | |||||
The proposed bench design was validated for the proposed Area A, Area D, Karakara, Kassassoko, Moungoundi, Southern Arc and Western Splay pits by conducting two-
| June 30, 2026 | Page 173 of 291 |
| | Diamba Sud Gold Project, Kédougou Region, Senegal Technical Report |
dimensional anisotropic limit equilibrium analyses of the most critical slope sections. Previous pit designs were used as a reference to define pit floor elevations, and the slopes were re-drawn based on the proposed bench parameters. The results of the inter-ramp and overall stability analyses support implementing the updated design parameters within the current geological model and structural fabric framework, excluding major faults. Stability analyses will need to be updated once data on major faults become available for these pits.
Surface water management (diversion ditches) will be key to avoiding water ponding above the duricrust and saprolite slopes during the wet season.
The inter-ramp and overall stability analysis considered a phreatic surface located approximately 5 m below ground surface with no depressurization behind the wall (fully saturated slope) as a conservative scenario to verify slope stability. Additional dewatering efforts might be required once mining starts and if failures occur due to the presence of more groundwater than anticipated.
| 16.4 | Pit Optimizations |
| 16.4.1 | Block Model |
Block models were provided in Datamine format as regularized block models. Area A, Area D, Karakara, Kassassoko, Southern Arc and Western Splay were regularized to 5 x 5 x 5 m block dimensions. The block model for Moungoundi was regularized to 10 x 10 x 5 m. The block model regularization was used to represent mining dilution and mining recovery inherent within the block model tonnes and grade.
Prior to conducting pit optimization, the block models had the following modifications:
| · | The gold grade in blocks classified as Inferred Mineral Resources was set to 0 g/t Au. |
| · | All operating costs including mining, processing, selling, and general and administrative costs were estimated for each block within the block model. |
| · | Potential revenue was estimated for each mineralized block within the block model based on the estimated metallurgical recoveries and the forecast long-term gold price. |
| · | Geotechnical domains were applied based on the weathering domain (oxide/transition, fresh) as per the geotechnical recommendations. |
| 16.4.2 | Optimization Parameters |
Financial Inputs and Selling Costs
Table 16.3 shows the financial parameters and selling costs applied in the pit optimization.
| June 30, 2026 | Page 174 of 291 |
| | Diamba Sud Gold Project, Kédougou Region, Senegal Technical Report |
Table 16.3 Financial Parameters and Selling Costs Applied Inpit Optimization
| Input | Unit | Value |
| Currency | $ Currency | US dollars |
| Discount Rate | % | 5.0 |
| Gold price | $/oz | 2,900 |
| Royalty | % Revenue | 3.5 |
| Refining and selling costs | $/oz | 5.50 |
The pit optimization shells used for the ore in the LOM plan and economic analysis were generated using a gold price of $2,900/oz whereas a gold price of $3,300/oz, assuming a 15% upside, was used to estimate Mineral Resources.
Mining Costs
Table 16.4 summarizes the mining costs and parameters applied within the pit optimizations. Table 16.5 and Table 16.6 show the variable load and haul costs by bench for waste and ore respectively. Mining dilution and recovery is represented in the selective mining unit (SMU) within the block model regularization.
Table 16.4 Mining Parameters Costs Applied Inpit Optimization
| Input | Unit | Value |
| Mining dilution | % | Included in SMU |
| Mining recovery | % | Included in SMU |
| Mill feed material load and haul costs | $/t | Variable by pit and bench |
| Waste load and haul costs | $/t | Variable by pit and bench |
| Drilling cost – waste | $/t | 0.23 |
| Drilling cost – mill feed material | $/t | 1.00 |
| Blasting cost – Area A mill feed material | $/t | 0.53 |
| Blasting cost – Area A waste | $/t | 0.42 |
| Blasting cost – Area D mill feed material | $/t | 0.40 |
| Blasting cost – Area D waste | $/t | 0.36 |
| Blasting cost – Karakara mill feed material | $/t | 0.55 |
| Blasting cost – Karakara waste | $/t | 0.50 |
| Blasting cost – Kassassoko mill feed material | $/t | 0.53 |
| Blasting cost – Kassassoko waste | $/t | 0.45 |
| Blasting cost – Moungoundi mill feed material | $/t | 0.52 |
| Blasting cost – Moungoundi waste | $/t | 0.41 |
| Blasting cost – Southern Arc mill feed material | $/t | 0.54 |
| Blasting cost – Southern Arc waste | $/t | 0.48 |
| Blasting cost – Western Splay mill feed material | $/t | 0.53 |
| Blasting cost – Western Splay waste | $/t | 0.49 |
| Mining overheads | $/t | 0.43 |
| Diesel cost | $/t | 1.02 |
| Mobilization, mine development, demobilization | $/t | 0.15 |
Table 16.5 Waste Load and Haul Costs in $/t
| Elevation | Area A | Area D | Karakara | Kassassoko | Western Splay |
Moungoundi | Southern Arc |
| 190 | 1.51 | ||||||
| 185 | 1.52 | 1.84 | |||||
| 180 | 1.53 | 1.86 | — | — | — | — | — |
| 175 | 1.54 | 1.87 | — | — | — | — | — |
| 170 | 1.55 | 1.89 | — | — | — | — | — |
| June 30, 2026 | Page 175 of 291 |
| | Diamba Sud Gold Project, Kédougou Region, Senegal Technical Report |
| Elevation | Area A | Area D | Karakara | Kassassoko | Western Splay |
Moungoundi | Southern Arc |
| 165 | 1.57 | 1.90 | — | — | — | — | — |
| 160 | 1.58 | 1.92 | — | — | — | — | — |
| 155 | 1.59 | 1.93 | 1.45 | — | — | 1.75 | — |
| 150 | 1.60 | 1.95 | 1.46 | — | 1.71 | 1.78 | — |
| 145 | 1.61 | 1.96 | 1.47 | — | 1.73 | 1.80 | 1.91 |
| 140 | 1.62 | 1.98 | 1.49 | 1.92 | 1.75 | 1.83 | 1.92 |
| 135 | 1.63 | 1.99 | 1.50 | 1.96 | 1.77 | 1.85 | 1.94 |
| 130 | 1.64 | 2.01 | 1.51 | 1.99 | 1.79 | 1.88 | 1.95 |
| 125 | 1.65 | 2.02 | 1.52 | 2.03 | 1.81 | 1.90 | 1.97 |
| 120 | 1.66 | 2.04 | 1.53 | 2.07 | 1.82 | 1.93 | 1.98 |
| 115 | 1.68 | 2.05 | 1.55 | 2.11 | 1.84 | 1.95 | 1.99 |
| 110 | 1.69 | 2.07 | 1.56 | 2.14 | 1.86 | 1.98 | 2.01 |
| 105 | 1.70 | 2.08 | 1.57 | 2.18 | 1.88 | 2.00 | 2.02 |
| 100 | 1.71 | 2.10 | 1.58 | 2.22 | 1.90 | 2.03 | 2.04 |
| 95 | 1.72 | 2.11 | 1.59 | 2.25 | 1.92 | 2.05 | 2.05 |
| 90 | 1.73 | 2.13 | 1.61 | 2.29 | 1.94 | 2.08 | 2.06 |
| 85 | 1.74 | 2.14 | 1.62 | 2.33 | 1.96 | 2.10 | 2.08 |
| 80 | 1.75 | 2.16 | 1.63 | 2.36 | 1.98 | 2.13 | 2.09 |
| 75 | 1.76 | 2.17 | 1.64 | 2.40 | 2.00 | 2.15 | 2.11 |
| 70 | 1.77 | 2.19 | 1.65 | 2.44 | 2.01 | 2.18 | 2.12 |
| 65 | 1.79 | 2.20 | 1.67 | 2.48 | 2.03 | 2.20 | 2.13 |
| 60 | 1.80 | 2.22 | 1.68 | 2.51 | 2.05 | 2.23 | 2.15 |
| 55 | 1.81 | 2.23 | 1.69 | 2.55 | 2.07 | 2.25 | 2.16 |
| 50 | 1.82 | 2.25 | 1.70 | 2.59 | 2.09 | 2.28 | 2.18 |
| 45 | 1.83 | 2.26 | 1.71 | 2.62 | 2.11 | 2.30 | 2.19 |
| 40 | 1.84 | 2.28 | 1.73 | 2.66 | 2.13 | 2.33 | 2.20 |
| 35 | 1.85 | 2.29 | 1.74 | 2.70 | 2.15 | 2.35 | 2.22 |
| 30 | 1.86 | 2.31 | 1.75 | 2.73 | 2.17 | 2.38 | 2.23 |
| 25 | 1.87 | 2.32 | 1.76 | 2.77 | 2.19 | 2.40 | 2.25 |
| 20 | 1.88 | 2.34 | 1.77 | 2.81 | 2.20 | 2.43 | 2.26 |
Table 16.6 Mill Feed Material Load and Haul Costs in $/t
| Elevation | Area A | Area D | Karakara | Western Splay |
Kassassoko | Moungoundi | Southern Arc |
| 190 | 2.19 | ||||||
| 185 | 2.23 | 1.81 | |||||
| 180 | 2.28 | 1.83 | |||||
| 175 | 2.32 | 1.85 | |||||
| 170 | 2.36 | 1.88 | |||||
| 165 | 2.41 | 1.90 | |||||
| 160 | 2.45 | 1.92 | |||||
| 155 | 2.49 | 1.94 | 1.68 | 2.61 | |||
| 150 | 2.53 | 1.96 | 1.69 | 2.69 | 2.65 | ||
| 145 | 2.58 | 1.99 | 1.70 | 2.71 | 2.70 | 2.68 | |
| 140 | 2.62 | 2.01 | 1.72 | 2.73 | 2.51 | 2.74 | 2.70 |
| 135 | 2.66 | 2.03 | 1.73 | 2.75 | 2.57 | 2.79 | 2.72 |
| 130 | 2.71 | 2.05 | 1.74 | 2.77 | 2.62 | 2.83 | 2.75 |
| 125 | 2.75 | 2.07 | 1.75 | 2.79 | 2.68 | 2.87 | 2.77 |
| 120 | 2.79 | 2.10 | 1.76 | 2.80 | 2.73 | 2.92 | 2.79 |
| 115 | 2.84 | 2.12 | 1.78 | 2.82 | 2.79 | 2.96 | 2.81 |
| 110 | 2.88 | 2.14 | 1.79 | 2.84 | 2.85 | 3.01 | 2.83 |
| 105 | 2.92 | 2.16 | 1.80 | 2.86 | 2.90 | 3.05 | 2.86 |
| June 30, 2026 | Page 176 of 291 |
| | Diamba Sud Gold Project, Kédougou Region, Senegal Technical Report |
| Elevation | Area A | Area D | Karakara | Western Splay |
Kassassoko | Moungoundi | Southern Arc |
| 100 | 2.96 | 2.18 | 1.81 | 2.88 | 2.96 | 3.09 | 2.88 |
| 95 | 3.01 | 2.21 | 1.82 | 2.90 | 3.01 | 3.14 | 2.90 |
| 90 | 3.05 | 2.23 | 1.84 | 2.92 | 3.07 | 3.18 | 2.92 |
| 85 | 3.09 | 2.25 | 1.85 | 2.94 | 3.13 | 3.23 | 2.94 |
| 80 | 3.14 | 2.27 | 1.86 | 2.96 | 3.18 | 3.27 | 2.97 |
| 75 | 3.18 | 2.29 | 1.87 | 2.98 | 3.24 | 3.31 | 2.99 |
| 70 | 3.22 | 2.32 | 1.88 | 2.99 | 3.29 | 3.36 | 3.01 |
| 65 | 3.27 | 2.34 | 1.90 | 3.01 | 3.35 | 3.40 | 3.03 |
| 60 | 3.31 | 2.36 | 1.91 | 3.03 | 3.41 | 3.45 | 3.05 |
| 55 | 3.35 | 2.38 | 1.92 | 3.05 | 3.46 | 3.49 | 3.08 |
| 50 | 3.39 | 2.40 | 1.93 | 3.07 | 3.52 | 3.53 | 3.10 |
| 45 | 3.44 | 2.43 | 1.94 | 3.09 | 3.57 | 3.58 | 3.12 |
| 40 | 3.48 | 2.45 | 1.96 | 3.11 | 3.63 | 3.62 | 3.14 |
| 35 | 3.52 | 2.47 | 1.97 | 3.13 | 3.69 | 3.67 | 3.16 |
| 30 | 3.57 | 2.49 | 1.98 | 3.15 | 3.74 | 3.71 | 3.19 |
| 25 | 3.61 | 2.51 | 1.99 | 3.17 | 3.80 | 3.75 | 3.21 |
| 20 | 3.65 | 2.54 | 2.00 | 3.18 | 3.85 | 3.80 | 3.23 |
Processing, General and Administrative Costs
Table 16.7 summarizes the ROM costs applied to the ore, including forecast sustaining capital costs and general and administrative costs, as well as grade control and crusher feed costs.
Table 16.7 ROM Costs Applied in Pit Optimization
| Input | Unit | Value |
| Mining Owner Costs | ||
| Oxide | $/t mill feed material | 2.27 |
| Fresh | $/t mill feed material | 2.62 |
| Grade Control | ||
| Oxide | $/t mill feed material | 0.57 |
| Fresh | $/t mill feed material | 0.71 |
| Processing | ||
| Oxide | $/t mill feed material | 16.37 |
| Fresh | $/t mill feed material | 19.76 |
| Crusher Feed | ||
| Oxide | $/t mill feed material | 0.35 |
| Fresh | $/t mill feed material | 0.44 |
| General & Administration | ||
| Oxide | $/t mill feed material | 5.36 |
| Fresh | $/t mill feed material | 6.70 |
Processing Recovery
Processing recovery was applied using formulae reflecting grade–recovery relationships for fresh rock and oxidized rock for all deposits. A single grade–recovery relationship was used for oxide and partially-weathered transition rock across all seven deposits. For fresh rock, separate grade recovery relationships were used in each deposit based on testwork related to that deposit. These recovery formulae and values are detailed in Section 13 of this Report.
| June 30, 2026 | Page 177 of 291 |
| | Diamba Sud Gold Project, Kédougou Region, Senegal Technical Report |
Overall Slope Angles
The overall slope angles applied in the pit optimizations were 32º for weathered material and 46º for fresh material, based on the following:
| · | Geotechnical batter and berm parameters for each weathering domain, as outlined in Section 16.3 of this Report. |
| · | Vertical depth of geotechnical domain. |
| · | Ramp width and number of ramp passes within each geotechnical domain. |
| 16.4.3 | Optimization Outcomes |
A set of nested pit shells were produced by the Deswik pseudoflow function. The nested shells were used to determine trends in mineralization and higher-grade areas that would offer opportunities to stage pits to increase discounted cashflow.
Table 16.8 shows the selected pit shells used to guide the ultimate pit designs for each deposit.
Table 16.8 Optimizations Results
| Deposit | Revenue Factor |
Total Mined (Mt) |
Waste Mined (Mt) |
Strip Ratio (Waste:Ore) |
ROM Feed (Mt) |
Grade (g/t Au) |
Metal Content (koz Au) |
| Area A | 1.00 | 30.35 | 26.35 | 6.6 | 3.99 | 1.61 | 207.2 |
| Area D | 1.00 | 18.14 | 13.22 | 2.7 | 4.93 | 1.74 | 276.1 |
| Karakara | 1.00 | 20.53 | 17.74 | 6.4 | 2.79 | 1.90 | 170.9 |
| Kassassoko | 1.00 | 3.59 | 2.49 | 2.3 | 1.10 | 0.98 | 34.6 |
| Western Splay | 1.00 | 11.78 | 10.14 | 6.2 | 1.64 | 1.53 | 80.9 |
| Moungoundi | 1.00 | 5.72 | 4.69 | 4.6 | 1.03 | 1.17 | 38.7 |
| Southern Arc | 1.00 | 31.93 | 27.58 | 6.3 | 4.35 | 2.37 | 331.1 |
Revenue factor 1 pit shells were chosen for the ultimate pit extents due to the relatively short mine life of each individual pit. Each set of nested pit shells informed pit stage designs. Trends in stripping ratio and cash costs were used to prioritize and sequence lowest stripping ratio and lowest cash cost ore, while maintaining an appropriate level of working benches.
| 16.5 | Mine Design |
| 16.5.1 | Pit Design |
Detailed pit stage designs were prepared based on the results of the pit optimizations and incorporating appropriate wall angles, geotechnical berms, minimum mining widths, and access ramps with sufficient width for the proposed mining equipment.
| 16.5.2 | Pit Design Parameters |
The geotechnical parameters applied to the pit designs include batter face angles, berm widths, and overall slope angles.
Pit ramps were designed with the following characteristics:
| · | Dual-lane ramps are a total of 24.8 m wide, including 19.5 m road surface width (corresponding to three haul truck widths) for safe passing of two of the selected CAT 777E haul truck, a 4.8 m wide bund, and a 0.5 m drain width. Dual lane ramps are designed whenever the bench plan area is greater than 20,000 m2. |
| June 30, 2026 | Page 178 of 291 |
| | Diamba Sud Gold Project, Kédougou Region, Senegal Technical Report |
| · | Single-lane ramps are a total of 15.0 m wide, including 9.7 m road surface width for sufficient room for a single CAT 777E haul truck, a 4.8 m wide bund, and a 0.5 m drain width. Single lane ramps are designed when the bench plan area is below 20,000 m2. This occurs in the final 10–60 vertical meters of each ultimate pit. |
| · | Gradient of 1:10 for all dual-lane ramps. |
| · | Gradient of 1:8 for single-lane ramps if bench plan area is <15,000 m2. If bench area is in the range of 15,000–20,000 m2, the ramp gradient is 1:10. |
| · | Single-lane ramps have an overtaking lane every 20 vertical meters. |
| · | Ramps exit the pit in the direction of the WRSFs. |
| · | All pits include a goodbye-cut at a maximum depth of 5 m. |
Pits were designed to have a minimum mining width of 20 m and a minimum cutback width of 25 m. The open pit mining physicals by pit and stage are shown in Table 16.9.
Table 16.9 Open Pit Mining Physicals
| Pit / Stage | Total Movement | Waste | Strip Ratio |
Plant Feed | Process Recovery | ||||||
| Mbcm | Mt | Mbcm | Mt | Mbcm | Mt | Au (g/t) | Au (koz) | % | Au (koz) | ||
| Area A-D St 1 | 3.8 | 7.2 | 2.5 | 5.0 | 2.3 | 1.3 | 2.2 | 2.33 | 164 | 91.6 | 150 |
| Area A-D St 2 | 8.7 | 18.8 | 7.2 | 15.5 | 4.6 | 1.5 | 3.4 | 1.29 | 140 | 86.1 | 121 |
| Area A-D St 3 | 13.7 | 33.6 | 12.3 | 29.9 | 8.2 | 1.4 | 3.7 | 1.58 | 186 | 93.3 | 174 |
| Subtotal Area A-D | 26.2 | 59.7 | 22.0 | 50.4 | 5.4 | 4.2 | 9.2 | 1.65 | 490 | 90.7 | 444 |
| Karakara St1 | 3.1 | 7.8 | 2.8 | 7.1 | 10.3 | 0.3 | 0.7 | 2.12 | 47 | 94.7 | 45 |
| Karakara St 2 | 5.9 | 15.6 | 5.1 | 13.4 | 6.2 | 0.8 | 2.2 | 1.79 | 125 | 94.7 | 118 |
| Subtotal Karakara | 9.0 | 23.4 | 8.0 | 20.5 | 7.2 | 1.1 | 2.9 | 1.87 | 172 | 94.7 | 163 |
| Kassassoko | 2.0 | 5.1 | 1.6 | 4.0 | 3.4 | 0.4 | 1.2 | 0.95 | 36 | 89.1 | 32 |
| Moungoundi | 3.3 | 8.0 | 2.9 | 6.9 | 6.4 | 0.4 | 1.1 | 1.10 | 38 | 84.6 | 32 |
| Southern Arc St 1 | 2.4 | 6.2 | 2.1 | 5.3 | 5.6 | 0.4 | 0.9 | 1.94 | 59 | 93.4 | 55 |
| Southern Arc St 2 | 3.5 | 9.0 | 3.1 | 8.2 | 9.8 | 0.3 | 0.8 | 2.27 | 61 | 93.7 | 57 |
| Southern Arc St 3 | 8.9 | 23.4 | 7.9 | 20.7 | 7.7 | 1.0 | 2.7 | 2.46 | 212 | 94.1 | 200 |
| Subtotal Sth.Arc | 14.8 | 38.6 | 13.1 | 34.2 | 7.7 | 1.7 | 4.5 | 2.32 | 332 | 93.8 | 312 |
| Western Splay | 6.1 | 15.5 | 5.5 | 13.8 | 8.1 | 0.6 | 1.7 | 1.51 | 83 | 84.5 | 70 |
| Total | 61.4 | 150.1 | 53.0 | 129.6 | 6.3 | 8.4 | 20.5 | 1.75 | 1,151 | 91.5 | 1,053 |
The location of the proposed pits is displayed in Figure 16.1.
| June 30, 2026 | Page 179 of 291 |
| | Diamba Sud Gold Project, Kédougou Region, Senegal Technical Report |
Figure 16.1 Plan View of Mine Infrastructure
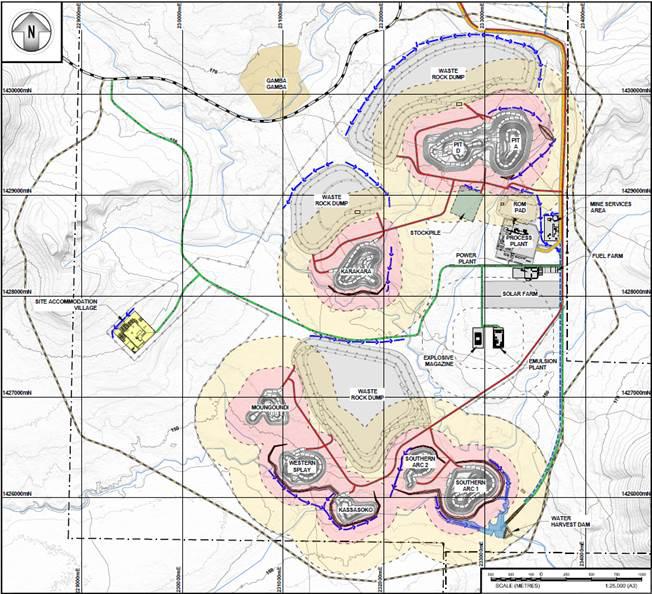
Figure prepared by Knight Piésold, 2026
| June 30, 2026 | Page 180 of 291 |
| | Diamba Sud Gold Project, Kédougou Region, Senegal Technical Report |
Area A–Area D
Area A–Area D will commence during the pre-strip-mining phase because it hosts near-surface oxide ore (mostly in Area D). Area A–Area D will be mined in three pit stages, prioritizing the highest grade, lowest waste stripping ore. Stage 1 will be 60 m deep and will have a strip ratio of 2.3 (waste:ore). Stage 2 will be 120 m deep and will have a strip ratio of 4.6. Stage 3 will target the Area A ore, will have a large waste strip prior to producing significant quantities of plant feed, will be 190 m deep and will have a strip ratio of 8.2. Mining of stage 2 is planned to commence in month 35 and be completed in month 59. Mining of stage 3 is planned to commence in month 48 and be completed in month 84.
The Area A–Area D pit will be located within 1 km of the proposed processing plant and ROM pad. Ore will be hauled to the ROM pad and waste rock will be hauled to the Area A–Area D WRSF that will be located to the northwest of the Area A–Area D pit. Area A–Area D waste rock will be used for future TSF lifts , and to form a buttress for the tailings at the end of the mine life if required. The Area A–Area D proposed pit design is displayed in Figure 16.2.
Figure 16.2 Area A–Area D Pit Design
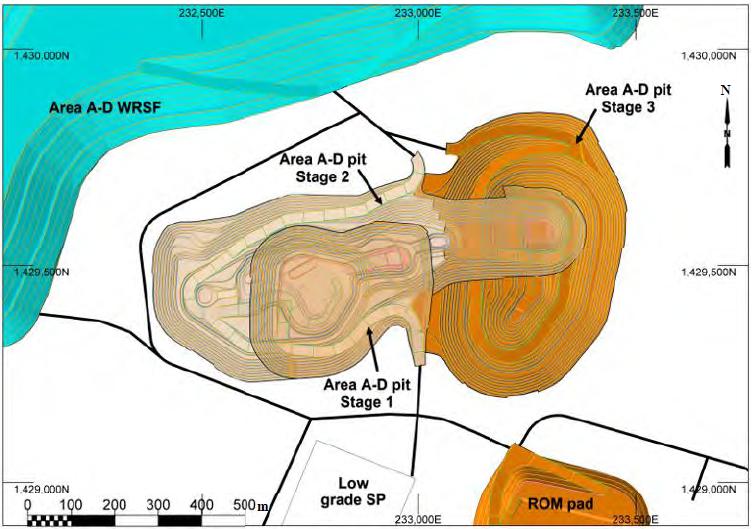
Figure prepared by Kenmore Mine Consulting, 2026. SP = stockpile
| June 30, 2026 | Page 181 of 291 |
| | Diamba Sud Gold Project, Kédougou Region, Senegal Technical Report |
Southern Arc
The Southern Arc open pit will commence during the pre-strip mining phase to provide high-grade fresh ore to optimize processing. It will be mined in three pit stages (forming two separate pits), prioritizing the highest grade, lowest waste stripping ore located in the southern end of the planned stage 1 pit. Stage 1 will be 55 m deep and will have a strip ratio of 5.6. Stage 2 will be 120 m deep and will have a strip ratio of 9.7. Stage 3 will be 150 m deep and will have a strip ratio of 7.7. Ore will be hauled to the ROM pad (haul distances of 4.6–6.2 km) and waste rock will be hauled to the WRSF adjacent to the Southern Arc pit. The pit design is displayed in Figure 16.3.
Figure 16.3 Southern Arc Pit Design
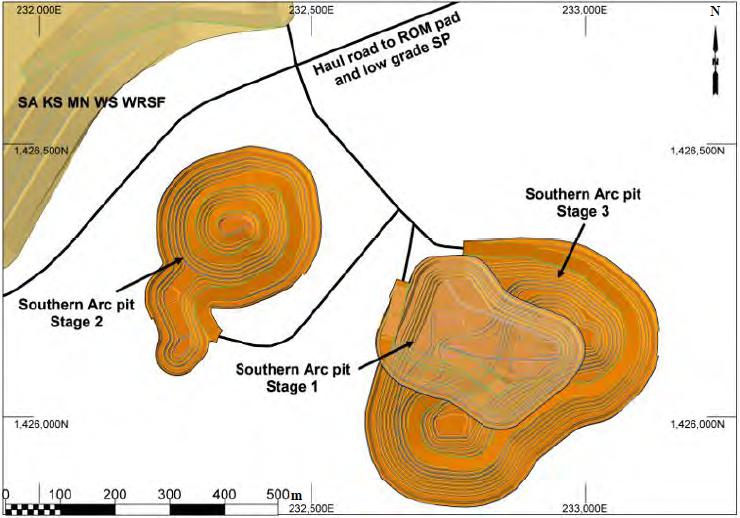
Figure prepared by Kenmore Mine Consulting, 2026. SP = stockpile. SA = Southern Arc; KS = Kassassoko; MN = Moungoundi; WS = Western Splay.
Karakara
The Karakara open pit will be mined in two stages to enable quicker access to the first ore. Stage 1 will be 55 m deep and has a strip ratio of 10.1. Stage 2 will be 140 m deep and have a strip ratio of 6.2. Mining of the Karakara deposit is planned to commence in month 23 and be completed in month 49. Ore will be hauled to the ROM pad (haul distances of 1.9–3.6 km) and waste rock will be hauled to the WRSF adjacent to the Karakara pit. The Karakara pit design is displayed in Figure 16.4.
| June 30, 2026 | Page 182 of 291 |
| | Diamba Sud Gold Project, Kédougou Region, Senegal Technical Report |
Figure 16.4 Karakara Pit Design
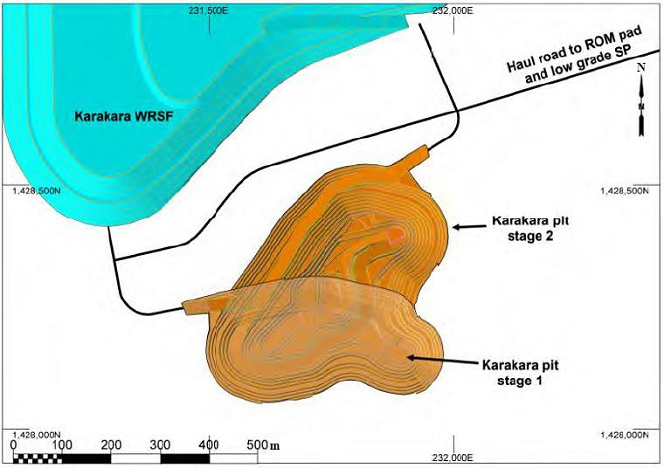
Figure prepared by Kenmore Mine Consulting, 2026. SP = stockpile.
Western Splay
The Western Splay pit is at the southern end of the mining area, will be 130 m deep and has a strip ratio of 8.1. Mining will commence in month 70 and will be completed in month 96. Ore will be hauled to the ROM pad (haul distances of 5.7–7.2 km) and waste rock will be hauled to the WRSF adjacent to the Western Splay pit. The Western Splay pit design is displayed in Figure 16.5.
| June 30, 2026 | Page 183 of 291 |
| | Diamba Sud Gold Project, Kédougou Region, Senegal Technical Report |
Figure 16.5 Kassassoko, Moungoundi and Western Splay Pit Designs
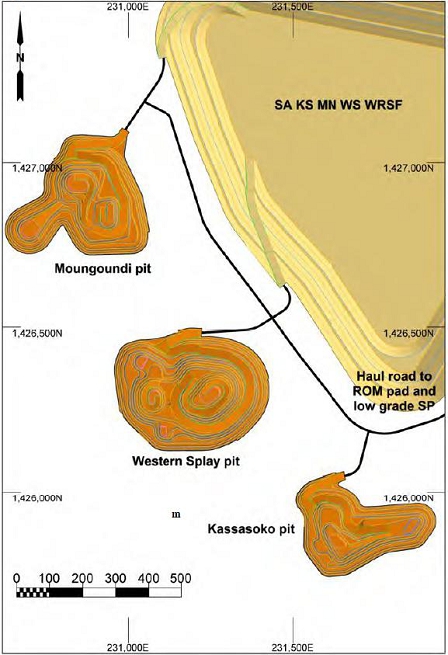
Figure prepared by Kenmore Mine Consulting, 2026. SP = stockpile. SA = Southern Arc; KS = Kassassoko; MN = Moungoundi; WS = Western Splay.
Kassassoko
Kassassoko will be the smallest of the pits (45 m deep), will be low grade (~1.0 g/t), will have a strip ratio of 3.4, and is located at the southern end of the mining area. Due to its
| June 30, 2026 | Page 184 of 291 |
| | Diamba Sud Gold Project, Kédougou Region, Senegal Technical Report |
low-grade, mining will be delayed till late in the LOM. It will be campaign mined when equipment is not being used in other higher-value pits. Mining will commence in month 70 and be completed in month 108. Ore will be hauled to the ROM pad (haul distances of 5.1–6.1 km) and waste rock will be hauled to the WRSF adjacent to the Kassassoko pit. The Kassassoko pit design was included in Figure 16.5.
Moungoundi
Moungoundi will be at the southern end of the mining area, will be 90 m deep, is low grade (~1.0 g/t), has a strip ratio of 6.5 d and is located at the southern end of the mining area. Due to its low-grade mining will be delayed till late in the LOM plan. Mining will commence in month 94 and will be completed in month 109. Ore will be hauled to the ROM pad (haul distances of 6.5–7.4 km) and waste rock will be hauled to the Moungoundi WRSF adjacent to the pit. The Moungoundi pit design was shown in Figure 16.5.
| 16.5.3 | Waste Rock Storage Facilities |
WRSFs were designed for each deposit, with the intention of minimizing haulage distance for the movement of waste material from the open pit to the adjacent surface WRSF. Designs included consideration of surface water drainage, and existing and planned infrastructure locations. The facilities were designed using an 18º batter slope, with a 7 m berm every 20 vertical meters to achieve a footprint consistent with the requirements of rehabilitated WRSFs at closure. Figure 16.1 shows the location of each of the proposed WRSF designs within the mining area layout.
Table 16.10 shows the WRSF capacities for each of the WRSF designs.
Table 16.10 WRSF Capacities by Deposit
| Deposit | Capacity (million m3) |
| Area A / Area D | 31.5 |
| Karakara | 11.4 |
| Western Splay / Kassassoko / Southern Arc / Moungoundi | 36.8 |
There is sufficient capacity within the WRSF designs to cater for the waste produced by all of the designed pits. Total waste volume will be 53.0 million bank cubic meters and given a 25% swell factor and 5% compaction factor, the total WRSF capacity required for the LOM is 63.0 million bank cubic meters.
The mine design and schedule does not include any pit backfilling using waste rock.
There is no known potentially acid forming waste rock as at the effective date of this Report.
| 16.5.4 | ROM Pad Storage Facilities |
ROM pad facilities have been designed to accommodate both direct truck tipping to the crusher feed bin and stockpile reclaim by front-end loader. The ROM pad incorporates dedicated access ramps at 10% gradient, elevated tipping areas, batter slope angles of 25 degrees and drainage controls to facilitate safe and efficient material handling while minimizing equipment interactions. The facility has a stockpiling capacity of approximately 340,000 tonnes and will be constructed primarily using waste material generated during the pre-strip period. The ROM pad will support ore stockpiling and reclaim activities throughout the mine life in accordance with the production schedule.
| June 30, 2026 | Page 185 of 291 |
| | Diamba Sud Gold Project, Kédougou Region, Senegal Technical Report |
| 16.6 | Mining Operations |
Conventional drill and blast, load and haul open pit mining is proposed to extract mineralized material from the pits. ROM material will be defined by grade control procedures in the pit and delivered by truck to the ROM pad, which is planned to be located adjacent to the processing facility. Waste rock will be hauled to the closest WRSF associated with the pit being mined.
A mining contractor will be used for the nine years of operations. If additional mineralization is outlined, there is potential that any future mining operations could transition to an owner‐operation model, or the contractor could be retained as the operator.
A common pool of equipment will be used and scheduled across all active pits, so that movement of equipment between the pits is minimized, and consumables and spare parts are shared within the fleet.
Mining activities are planned to operate 24 hours per day, seven days a week with work occurring over three eight-hour shifts.
| 16.6.1 | Drill and Blast, Excavate, Load and Haul |
The Project will mine ore feed material and waste. Drill and blasting are planned for oxide, transitional and fresh ore and waste. Some free digging of oxide material is planned for weathered zones when feasible. Table 16.11 summarizes the drill and blast parameters used.
Table 16.11 Drill and Blast Assumptions
| Material Type | Bench Height (m) |
Diameter (mm) |
Powder Factor |
Product | Burden (m) |
Spacing (m) |
Subdrill (m) |
| Oxide -laterite | 5–10 | 127 | 0.3 | ANFO | 4.8 | 4.2 | 0.5 |
| Transitional | 5–10 | 127 | 0.5 | Emulsion | 4.7 | 4.1 | 0.5 |
| Fresh | 5–10 | 127 | 0.7 | Emulsion | 4.0 | 3.4 | 0.5 |
To minimize dilution and ore loss, all ore will be drilled and blasted with 5 m bench heights and mined at 2.5 m flitch heights. To minimize costs and increase productivity, in high-waste stripping pit stages, waste not directly adjacent to ore will be drilled and blasted with 10 m bench heights where possible. All mining equipment will be supplied by the contractor, and all equipment costs are fully considered in the contractor’s schedule of rates.
The mining fleet is proposed to be 200 t and 120 t excavators, paired with 90 t trucks. The truck fleet will be used to haul waste material to the WRSF adjacent to each pit and ore to the ROM pad or low-grade stockpile. The furthest haulage routes for the ore are from Western Splay and Moungoundi (both in the southern mining area), a distance of up to 7.4 km.
| 16.6.2 | Ancillary and Support Fleet |
The ancillary and support mining fleet will include dozers, graders, water trucks and service trucks.
The ancillary fleet will be required to construct roads, strip and clear vegetation and topsoil, complete rehabilitation works, maintain WRSFs and, carry out general clean-up operations around mining faces, and provide support to the primary excavation equipment.
| June 30, 2026 | Page 186 of 291 |
| | Diamba Sud Gold Project, Kédougou Region, Senegal Technical Report |
Front-end loaders will be used on the ROM pad to feed the crusher with a blend from ROM stockpiles, removal of oversized boulders, road construction, and rehabilitation work.
| 16.6.3 | Other Mining Infrastructure |
A workshop that maintains the mine fleet will be constructed by the mining contractor, along with the required offices and storage facilities for the contractor to conduct their operations.
| 16.6.4 | Equipment Requirements |
The estimate of equipment requirements over the mine life is detailed in Table 16.12, which will be shared across the various deposits.
Table 16.12 LOM Mining Equipment Requirements
| Equipment | Year 0 | Year 1 | Year 2 | Year 3 | Year 4 | Year 5 | Year 6 | Year 7 | Year 8 | Year9 | Year 10 |
| Mining Fleet Load and Haul | |||||||||||
| Excavator - 200t | 2 | 2 | 2 | 2 | 2 | 2 | 2 | 2 | 1 | 1 | 1 |
| Excavator - 120t | 1 | 1 | 1 | 1 | 1 | 1 | 1 | 1 | 1 | 1 | 1 |
| Trucks – 90 t | 12 | 15 | 15 | 15 | 15 | 15 | 15 | 15 | 10 | 10 | 10 |
| Ancillary | |||||||||||
| Dozer | 2 | 4 | 4 | 4 | 4 | 4 | 4 | 4 | 2 | 2 | 2 |
| Grader | 2 | 2 | 2 | 2 | 2 | 2 | 2 | 2 | 1 | 1 | 1 |
| Watercart | 2 | 2 | 2 | 2 | 2 | 2 | 2 | 2 | 1 | 1 | 1 |
| ROM Loader | 2 | 2 | 2 | 2 | 2 | 2 | 2 | 2 | 2 | 2 | 2 |
| Rock Breaker | 1 | 1 | 2 | 2 | 2 | 2 | 2 | 2 | 2 | 2 | 2 |
| Compactor | 1 | 1 | 1 | 1 | 1 | 1 | 1 | 1 | 1 | 1 | 1 |
| Service Truck | 1 | 2 | 2 | 2 | 2 | 2 | 2 | 2 | 1 | 1 | 1 |
| Low Bed Truck | 1 | 1 | 1 | 1 | 1 | 1 | 1 | 1 | 1 | 1 | 1 |
| Drill and Blast | |||||||||||
| Blast hole Drill Rig | 4 | 6 | 6 | 6 | 6 | 6 | 6 | 6 | 3 | 3 | 2 |
| Grade Control Rig | 2 | 2 | 2 | 2 | 2 | 2 | 2 | 2 | 2 | 2 | |
| Bulk Explosive Truck | 1 | 1 | 2 | 2 | 2 | 2 | 2 | 2 | 1 | 1 | 1 |
| 16.7 | Mining and Production Schedule |
A mining and production schedule was prepared for the nine-year LOM based on the following scheduling parameters:
| · | Monthly scheduling periods. Mining operations will be carried out by a contractor. Ore is defined using pre-defined incremental cut-off grades and hauled to the ROM pad located adjacent to the processing facility. | |
| · | The overall mining and production strategy is to maintain a mill processing throughput of 2.0–2.5 Mt/a. The processing plant design feed capacity is 2.0 Mt/a of fresh rock or 2.5 Mt/a of a blend between fresh and oxidized rock. When processing a blend of fresh and oxidized ore, the plant feed has been constrained to maximize throughput while ensuring the SAG mill power requirement does not exceed available power. The processing throughput will ramp up over four months at commissioning. | |
| · | Mined tonnage as required to ensure sufficient mill feed stocks are available at the grades required to meet gold production forecasts. | |
| · | Pit stage sequencing is determined by several criteria. Whenever feasible, the schedule prioritizes higher-grade and lower strip ratio pit stages early on in the |
| June 30, 2026 | Page 187 of 291 |
| | Diamba Sud Gold Project, Kédougou Region, Senegal Technical Report |
| LOM to facilitate higher gold production and delay the costs associated with waste mining. | ||
| · | Mining productivity rates are derived from industry benchmark data and assumes selective mining using the proposed equipment fleet (200 t excavator and 90 t trucks). | |
| · | Lower mining rates were applied in the deeper and smaller benches where single-lane ramps, grade control, drill and blast, pit dewatering, and small work areas will reduce mining productivity. | |
| · | Lower mining rates were applied for ore mining in the southern mining area (Kassassoko, Moungoundi, Southern Arc and Western Splay) due to the longer haul distances to the ROM pad (4.6–7.4 km) and difficulty balancing the truck fleet with the shorter waste haul distances (0.8–3.5 km). | |
| · | Maximum vertical rate of advance of 120 m/year (highest rate in schedule is 90 m/year). | |
| · | Ore delivered to the ROM pad will be stockpiled throughout the various mining periods and processed in accordance with the proposed production schedule. By the end of the LOM, all material stockpiled on the ROM pad is scheduled to be processed. |
Table 16.13 summarizes the proposed mining and production schedule.
Table 16.13 Proposed Mining and Production Schedule
| Parameter | Units | Year 0 |
Year 1 |
Year 2 |
Year 3 |
Year 4 |
Year 5 |
Year 6 |
Year 7 |
Year 8 |
Year 9 |
Year 10 |
LOM |
| Plant days | 365 | 365 | 365 | 365 | 365 | 365 | 365 | 365 | 365 | 30 | |||
| Mine days | 120 | 365 | 365 | 365 | 365 | 365 | 365 | 365 | 365 | 365 | 30 | ||
| Mining total movement | Mt | 4.0 | 18.6 | 18.2 | 18.7 | 19.0 | 19.0 | 19.0 | 15.6 | 9.2 | 8.6 | 0.1 | 150.1 |
| Waste to WRSF | Mt | 3.6 | 15.4 | 16.6 | 16.3 | 16.0 | 16.6 | 17.4 | 12.7 | 8.1 | 6.8 | 0.1 | 129.6 |
| Strip ratio | w/o | 11.6 | 4.9 | 10.2 | 6.8 | 5.3 | 6.8 | 10.9 | 4.3 | 7.3 | 3.7 | 1.1 | 6.3 |
| Mill Feed material to ROM / Stockpile | Mt | 0.3 | 3.2 | 1.6 | 2.4 | 3.0 | 2.4 | 1.6 | 2.9 | 1.1 | 1.8 | 0.1 | 20.5 |
| Gold grade | g/t | 1.5 | 2.2 | 2.4 | 2.4 | 1.6 | 1.3 | 1.9 | 1.3 | 1.6 | 1.0 | 1.5 | 1.7 |
| Gold contained | koz | 15 | 225 | 129 | 183 | 155 | 105 | 97 | 123 | 56 | 62 | 2 | 1,151 |
| Stockpile – opening stock | Mt | 0.3 | 1.3 | 0.6 | 0.7 | 1.4 | 1.4 | 0.7 | 1.4 | 0.3 | 0.1 | ||
| Gold grade | g/t | 1.5 | 1.0 | 0.6 | 0.6 | 0.6 | 0.6 | 0.6 | 0.6 | 0.6 | 0.6 | ||
| Gold contained | koz | 15 | 42 | 11 | 13 | 28 | 26 | 14 | 27 | 6 | 2 | ||
| ROM to crusher | Mt | 2.2 | 2.4 | 2.3 | 2.4 | 2.4 | 2.3 | 2.3 | 2.2 | 2.0 | 0.2 | 20.5 | |
| Gold grade | g/t | 2.9 | 2.1 | 2.5 | 1.8 | 1.4 | 1.5 | 1.5 | 1.1 | 1.0 | 0.9 | 1.7 | |
| Gold contained | koz | 199 | 160 | 180 | 141 | 107 | 109 | 109 | 77 | 66 | 4 | 1,151 | |
| Process recovery | % | 92.5 | 93.2 | 94.1 | 93.3 | 86.6 | 93.0 | 90.0 | 86.5 | 86.7 | 85.7 | 91.5 | |
| Recovered gold ounces | koz | 184 | 149 | 169 | 131 | 93 | 101 | 98 | 67 | 57 | 4 | 1,053 |
Figure 16.6 shows the forecast ore mined by deposit.
| June 30, 2026 | Page 188 of 291 |
| | Diamba Sud Gold Project, Kédougou Region, Senegal Technical Report |
Figure 16.6 Mineralization Mined by Deposit
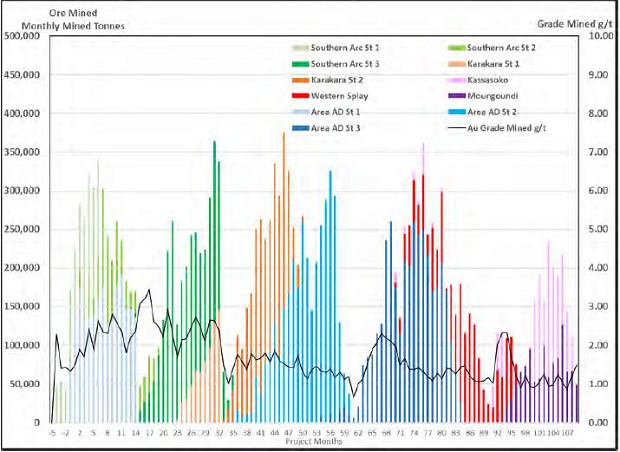
Figure prepared by Fortuna, 2026. St = stage
The mining and production schedule demonstrates a technically achievable operation for the LOM. The key risk to achieving the mine plan is being ahead in mine development, waste stripping, and grade control activities to access deposits and increased confidence in the ore to be able to mine in sequence. The schedule is generally de-risked by the ability to substitute pit stages with similar waste stripping ratios, as well as maintaining sufficient ROM stockpiles.
| 16.8 | Comments on Section 16 |
The QP is of the opinion that:
| · | The mining methods being used are appropriate for the deposit being mined. The open pit mine design, WRSF, TSF design, and equipment fleet selection are appropriate to reach production targets. |
| · | The mine life is estimated as 9.4 years. |
| · | The mine plan is based on an adequate mining philosophy and presents low risk. |
| · | Projected mining equipment and personnel requirements are regarded as reasonable in Fortuna’s experience to meet the proposed production rate average of 7,000 t/d. |
| June 30, 2026 | Page 189 of 291 |
| | Diamba Sud Gold Project, Kédougou Region, Senegal Technical Report |
| · | Planned mine infrastructure and supporting facilities are regarded as suitable to meet the needs of the mine plan and production rate. |
| June 30, 2026 | Page 190 of 291 |
| | Diamba Sud Gold Project, Kédougou Region, Senegal Technical Report |
| 17 | Recovery Methods |
| 17.1 | Processing Plant Design |
The process plant is designed to process oxide and fresh ore from open pit mines. The treatment plant is designed to process 2.0 Mt/a of fresh ore (or 2.5 Mt/a based on a blend of at least 63% fresh and 37% oxide ores) at average head grades of 2.62 g/t Au (oxide) and 1.48 g/t Au (fresh) over the LOM.
The metallurgical testwork program (see discussion in Section 13) indicated that the mineralization is free-milling with a very low proportion of fine gold locked in sulfides, and is amenable to typical gold cyanidation treatment.
The process flow diagrams were developed from the process design criteria prepared from the metallurgical testwork. The plant design proposed is simple, but robust, and broadly comprises the following:
| · | Primary crushing. |
| · | Crushed mill feed surge bin with overflow stockpile. |
| · | Grinding and classification. |
| · | Gravity recovery. |
| · | Leaching and adsorption. |
| · | Elution. |
| · | Electrowinning. |
| · | Smelting. |
The comminution circuit modelling was undertaken by Orway Minerals Consultants (OMC). After consultation and LOM ore properties were taken into consideration, a single-stage crush and SAG milling circuit with pebble crushing (SS-SAC) was adopted for the comminution circuit. Allowance will be made in the layout design for the future addition of a ball mill, to allow for future SABC operation.
The proposed flowsheet is provided in Figure 17.1.
| June 30, 2026 | Page 191 of 291 |
| | Diamba Sud Gold Project, Kédougou Region, Senegal Technical Report |
Figure 17.1 Schematic of Proposed Processing Flowsheet for the Diamba Sud Project
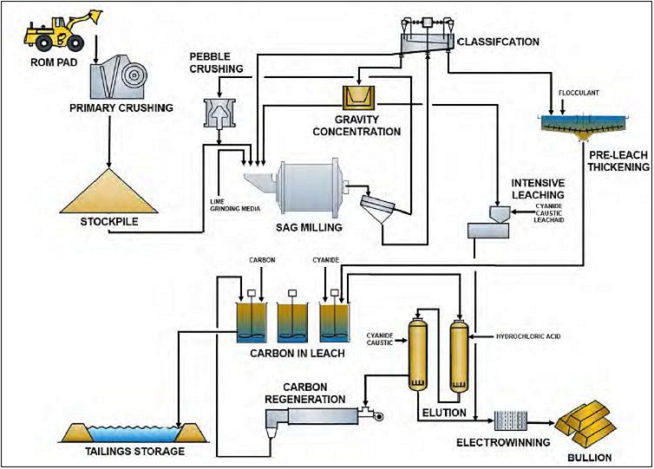
Figure prepared by Fortuna, 2026.
| 17.2 | Processing Design Philosophy |
The plant was designed to achieve the required throughput, as stated in the process design criteria. The crushing circuit will be designed for a throughput of approximately 381 dry t/h for oxide and 304 dry t/h for fresh ore, based on an overall dry plant utilization of 75% on a 24-hour per day operation.
Crushed product will report to a surge bin with overflow to a dead stockpile. The surge bin will have a live capacity of approximately 103 m³, equivalent to approximately 139 t for oxide and 162 t for fresh ore, based on bulk densities of 1.35 t/m³ and 1.57 t/m³, respectively.
The stockpile has been sized with a capacity of approximately 24 hours, equivalent to approximately 5,556 t of oxide and 4,777 t of fresh ore.
Primary feed to the milling circuit will be via an apron feeder located directly beneath the surge bin, discharging onto the SAG mill feed conveyor. Reclaim from the stockpile will be undertaken using a front-end loader (FEL), which will feed a reclaim hopper fitted with an apron feeder. This feeder will discharge onto a conveyor that discharges onto the tail end of the SAG mill feed conveyor to supplement mill feed as required.
| June 30, 2026 | Page 192 of 291 |
| | Diamba Sud Gold Project, Kédougou Region, Senegal Technical Report |
The milling circuit was designed for a nominal throughput of 250 dry t/h for fresh and 313 dry t/h for oxide ore, based on an overall wet plant utilization of 91.3%. It will achieve a design grind product size of 80% passing (P80) 106 µm for both fresh and oxide ores, in accordance with the comminution modelling results.
The gravity circuit will take a portion of the cyclone underflow and will consist of a single centrifugal concentrator and an intensive leach reactor for treatment of the gravity concentrate. The gravity circuit is expected to treat approximately 24–32% of the cyclone underflow.
The CIL circuit will consist of a leach feed thickener followed by one pre-leach tank and six leaching tanks, treating the cyclone overflow. The pre-leach tank will provide approximately 4 hours of residence time, with a total leaching residence time of approximately 24 hours across the leach tanks. The CIL circuit was designed for average gold leach feed grades of approximately 2.62 g/t Au for oxide and 1.72 g/t Au for fresh ore.
The metal recovery and refining circuit will consist of a 6 t split AARL elution system, electrowinning cells and smelting to produce doré.
Water, which will be required for a wide range of services, will be sourced primarily from surface water stored in a raw water pond and supplemented by groundwater.
Groundwater will be abstracted from boreholes and pumped to a bore water collection tank, from where it will be transferred to the raw water tank to supplement supply as required.
The raw water tank will supply water to a wide range of services. The lower portion of the tank will be dedicated to the fire water system, while the remaining volume will supply water to the process plant, potable water treatment plant, soft water system, and mining infrastructure.
Based on current modelling results, sufficient water is available from the raw water pond and supplementary groundwater supply to meet all operational water requirements (see discussion in Section 18).
| 17.3 | Process Plant Feed |
The feed sources will be from fresh and oxide ore. The LOM schedule has greatly influenced the process design, especially the comminution circuit.
The mining schedule (Table 17.1) indicates that the design basis will be suitable. Oxides will be the main feed material for the first year and is blended for the rest of the LOM at >37% Oxides, equating to a Fresh feed operating envelope.
Table 17.1 Proposed LOM Feed Composition
| Parameter | Year 1 | Year 2 | Year 3 | Year 4 | Year 5 | Year 6 | Year 7 | Year 8 | Year 9 | Year 10 |
| Tonnes Milled | ||||||||||
| Oxide (Mt) | 1.41 | 0.56 | 0.25 | 0.53 | 0.62 | 0.25 | 0.25 | 0.23 | 0.09 | 0.09 |
| Fresh (Mt) | 0.76 | 1.81 | 2.00 | 1.85 | 1.80 | 2.00 | 2.00 | 2.00 | 1.94 | 0.16 |
| Total (Mt) | 2.17 | 2.37 | 2.25 | 2.38 | 2.42 | 2.25 | 2.25 | 2.23 | 2.03 | 0.16 |
| Percent Milled | ||||||||||
| Oxide (%) | 65 | 24 | 11 | 22 | 25 | 11 | 11 | 10 | 4 | 0 |
| Fresh (%) | 35 | 76 | 89 | 78 | 75 | 89 | 89 | 90 | 96 | 100 |
| June 30, 2026 | Page 193 of 291 |
| | Diamba Sud Gold Project, Kédougou Region, Senegal Technical Report |
| 17.4 | Comminution Circuit Design Basis |
| 17.4.1 | Design Criteria |
Based on the analyses of the comminution testwork the following characteristics were selected for the fresh ore design (Table 17.2).
Table 17.2 Fresh Mill Feed Material Comminution Characteristics
| Parameter | Comminution Characteristics |
| Ai (g) | 0.222 |
| CWi (kWh/t) | 7.3 |
| BWi (kWh/t) | 17.4 |
| A*b | 30.5 |
| Mineralization SG | 2.74 |
| 17.4.2 | Comminution Circuit Selection |
During the PEA phase, a trade-off was conducted between single-stage SAG and SAB configurations for treatment of predominantly oxide material. During the FS phase, this assessment was refined to compare a single-stage SAG milling circuit with pebble crushing against a SABC configuration.
Given the life-of-mine ore characteristics and the requirement for operational flexibility, a single-stage SAG mill with pebble crushing was selected as the base case. Provision has been made in the plant layout for the future addition of a ball mill, allowing for conversion to a SABC circuit if required.
During the initial years of operation (Year 1), when processing will primarily consist of oxide ore, the pebble crusher is not expected to be required due to the friable nature of the ore. The SAG mill will therefore be operated at a reduced speed of approximately 50% of critical speed (Nc) with a reduced ball charge of approximately 8.4% to suit oxide treatment conditions.
As the operation transitions to predominantly fresh ore, the SAG mill will be operated at a higher speed of approximately 75% of critical speed (Nc), with an increased ball charge of approximately 10.1% to achieve the required grinding performance.
| 17.5 | Process Plant Description |
The plant layouts were developed, and general arrangement drawings were produced for each area together with the overall plant site layout including positioning of the crushing plant, mill feed stockpile, feed conveyers, SAG mill, leach tanks, gold room, reagents storage and preparation areas, and infrastructure buildings.
Equipment selections were completed for all major process plant mechanical equipment based on the project design criteria.
| 17.5.1 | Primary Crushing |
Ore will be fed to the process plant via the ROM pad. The ROM pad will be located adjacent to the primary crushing building for efficiency of mill feed to the crushing plant. Haul trucks operating directly from the open pit will deliver ore to the ROM pad. The ore will be stored on the ROM pad in separate stockpiles of varying mineralization types and grades to facilitate blending of the feed into the crushing plant. The estimated maximum particle size of material on the ROM pad will be 800 mm in any dimension. Any oversized rock will be placed to one side and reduced to minus 800 mm on the ROM pad.
| June 30, 2026 | Page 194 of 291 |
| | Diamba Sud Gold Project, Kédougou Region, Senegal Technical Report |
The primary crushing plant will provide single-stage crushing to feed the SAG mill. The primary crushing plant will include a 130 m3 capacity ROM bin, an apron feeder, a primary jaw crusher, a stockpile feed conveyor, a rock breaker and associated electrical equipment, steelwork, and plate work.
The primary crusher will be installed on a concrete foundation with the ROM bin, apron feeder, and rock breaker, and will be located adjacent to a concrete retaining wall against the ROM pad. Walkways and stairs will provide full operational and maintenance access throughout the primary crusher building.
The ROM bin will be fed blended ore from the ROM stockpiles using a FEL (CAT992 or equivalent). The ROM bin will be sized to accommodate direct tipping from 100 t sized haul trucks (CAT 777 or equivalent). However, that is not expected that this will be the usual method of feeding the plant. The ROM bin will be lined with replaceable steel wear resistant liners. Feeding of the ROM bin will be controlled by a ‘dump–no dump’ traffic signal mounted adjacent to the ROM bin. The traffic signal will be controlled by a radar level sensor mounted above the ROM bin.
The ROM bin discharge will be controlled by an apron feeder, which will feed directly into the primary jaw crusher. The primary jaw crusher will be a single toggle jaw crusher (C130 or equivalent) rated at 185 kW, fitted with an 800 x 800 mm static grizzly, that will accept nominal minus 800 mm rocks. The rock breaker mounted adjacent to the jaw crusher will break any oversized rocks that lodge in the crusher and would otherwise not be passed.
The crushed product from the primary jaw crusher will discharge onto the ~1,500 mm-wide stockpile feed conveyor. A weightometer installed on the stockpile feed conveyor will provide information on the tonnage of crushed mineralization passing through the circuit and into the surge bin, which can pass excess material onto the dead stockpile. Dust control will be achieved using the dust suppression system with high pressure water sprays, installed within the ROM bin, to form a mist to contain fugitive dust particles.
Primary crushed mill feed material will discharge to a surge bin, which will provide short-term buffering capacity ahead of the milling circuit. The surge bin will have a live volume of approximately 103 m³, providing approximately 30 minutes of residence time at the design throughput. The surge bin will allow for direct linking of the crushing plant to the milling circuit during normal operation. Excess material from the surge bin will overflow to a dead stockpile via a conveyor.
The stockpile was sized with a live capacity of approximately 7,500 dry tonnes, providing approximately 24 hours of residence time at the design throughput. The stockpile will provide operational flexibility by allowing continued milling operations during periods of crusher downtime.
Primary feed to the milling circuit will be via an apron feeder located directly beneath the surge bin, discharging onto the SAG mill feed conveyor. Reclaim from the stockpile will be undertaken using a FEL, sized for a CAT 992 or equivalent, feeding a reclaim hopper fitted with an apron feeder. This feeder will discharge onto the tail end of the SAG mill feed conveyor to supplement mill feed as required.
Both apron feeders (surge bin and reclaim hopper) will be controlled via a weightometer installed on the SAG mill feed conveyor, allowing controlled feed rate to the milling circuit.
| June 30, 2026 | Page 195 of 291 |
| | Diamba Sud Gold Project, Kédougou Region, Senegal Technical Report |
Ball loading to the SAG mill will be undertaken via the reclaim hopper, with a grinding media bunker located in close proximity to facilitate efficient loading operations.
Lime will be added directly onto the mill feed conveyer from the lime handling system, which will be positioned after the SAG mill feed conveyor weightometer. The lime system will consist of a 41 t capacity silo and will include a pneumatic bin activator, discharge isolation slide gate, rotary valve feeder, level instrumentation, dust collector, free standing structure and access platforms, and stairs. Bulk bags of powdered lime will be split and emptied into the silo.
| 17.5.2 | Grinding and Classification Circuit |
Primary crushed ore will be fed via mill feed conveyor to the SAG mill. An 8.53 m diameter by 5.93 m long effective grinding length SAG mill is proposed for the primary grinding duty. The SAG mill will operate with a duty ball charge of 8–15% with an expected pinion power draw of 2.3-5.7 MW and an installed power of 7.2 MW. A variable speed drive will be installed on the mill to vary the mill speed so that it can be adjusted as needed for changes in ore characteristics.
Mill slurry will discharge to the mill discharge vibrating screen installed to separate pebbles from the discharge, control the particle size of the slurry reporting to the classification circuit and adequately rinse the oversize material, prior to it reporting to the pebble crushing circuit. The undersize slurry from the discharge screen will fall into the mill discharge hopper.
Cyclone feed pumps will be installed in a duty/standby arrangement, each having separate suction lines from the mill discharge hopper. Pneumatically-actuated suction inlet knife gate valves, pneumatically-actuated knife gate dump valves on the pump suction pipework, and pneumatically-actuated knife gate valves on the discharge pipework will facilitate pump operations and maintenance of the off-duty pump when the system is operating the duty pump.
The slurry in the mill discharge hopper will be pumped to a 20-pack classifying cyclone cluster. The cluster will have 13 operating cyclones and seven standby cyclones, with three operating cyclones’ underflow directed to the gravity circuit and the remainder directed back to the mill. The cyclones will classify the slurry feed into an overflow product with a P80 of 106 µm, which will be directed to the leaching circuit and coarse cyclone underflow product. New feed from the mill feed conveyor will be added to the recirculating loads in the mill feed chute. The recirculating load was designed to be a nominal 265% for oxide and 450% for fresh material operation, with a 30–35% solids overflow. Proportional controllers will provide the mill operator with density control in the circuit by varying water addition to either the mill feed chute or discharge hopper in fixed proportion to the SAG mill feed rate and cyclone feed density.
A davit crane in the cyclone tower will be used for cyclone pack maintenance activities. Major maintenance activities around the SAG mill and discharge pumps will be undertaken with a mobile hydraulic crane. Platforms and stairs will provide full operational and maintenance access throughout the grinding and classification building.
| 17.5.3 | Pebble Crushing |
Oversized material from the mill discharge screen will be directed either to the SAG mill drive in sump or to the pebble crusher circuit. The pebble crusher feed conveyor will
| June 30, 2026 | Page 196 of 291 |
| | Diamba Sud Gold Project, Kédougou Region, Senegal Technical Report |
deliver pebbles to a 132 kW HP200 or equivalent pebble crusher, at a design rate of 144 dry t/h.
The crusher will operate at a closed side setting of 12 mm, and the product from the pebble crusher will be returned via the pebble transfer conveyor to the SAG mill feed conveyor.
The pebble crusher feed conveyor will be fitted with a belt magnet and metal detector to safeguard the crusher from tramp metal. The belt magnet will remove ferrous material, and in the event that metal is not removed, the metal detector will activate a flop gate located at the inlet of the pebble crusher feed bin to bypass the material back to the SAG mill.
Both crushed material and bypassed material will be discharged onto the SAG mill feed conveyor downstream of the SAG mill feed conveyor weightometer. The total feed to the mill will therefore be the sum of the material measured on the pebble transfer conveyor and the SAG mill feed conveyor.
| 17.5.4 | Gravity Recovery |
The primary cyclone underflow will be split, with a portion of the underflow (from three cyclones) reporting to the gravity circuit. This stream will flow by gravity to a gravity scalping screen with a nominal aperture of 2 mm. Oversize from the gravity screen will be returned by gravity to the SAG mill feed, together with the remaining cyclone underflow.
The undersize from the gravity screen will be fed to a single centrifugal gravity concentrator, selected as a Knelson KC-QS40 or equivalent, operating at a nominal feed rate of approximately 225 t/h, with a maximum capacity of up to 250 t/h. The concentrator was designed for a top feed size of 2 mm and will operate on a batch cycle of approximately 30–40 minutes, producing a concentrate mass pull of approximately 50–65 kg per cycle, with an estimated concentrate specific gravity of approximately 4 t/m³.
The gravity concentrate will be directed to an intensive leach reactor (ILR), selected as a Gekko ILR1000BA or equivalent, capable of treating up to approximately 3,000 kg/day of concentrate. Tailings from both the centrifugal concentrator and the ILR unit will report to the mill discharge hopper for retreatment through the milling circuit.
| 17.5.5 | Trash Screening and Pre-Leach Thickening |
The classified slurry from the cyclone overflow will be directed to a single trash screen located on top of the leaching structure. Oversize material from the trash screen will discharge to a trash bin at ground level.
The arrangement will allow for operational flexibility, whereby slurry can either be directed to the leach feed thickener for dewatering or bypass the thickener and report directly to the leaching circuit. Bypass operation will typically be applied during oxide treatment, while the thickener will be used during fresh ore operations to achieve the required solids concentration.
When operating through the thickener, trash screen underflow will be fed into the leach feed thickener to remove excess water. Thickener overflow will be directed to the process water tank for reuse. The leach feed thickener underflow will be pumped by the leach feed pumps in a duty/standby arrangement to a distribution box, allowing slurry to be directed to either the first or second CIL tank. Slurry will only be directed to the second tank in the event that the first tank is offline for maintenance.
| June 30, 2026 | Page 197 of 291 |
| | Diamba Sud Gold Project, Kédougou Region, Senegal Technical Report |
| 17.5.6 | Carbon in Leach Circuit |
The CIL train will consist of seven tanks of nominal 1,920 m3, providing a slurry residence time in the leach circuit of 24 hours at a slurry density of 45% solids by weight (for fresh ore).
Each CIL tank will be fitted with pumped inter-stage tank screens. Carbon will be held in all tanks except the first tank where the inter-stage screen will act as a safety screen to prevent oversize material entering downstream tanks in the event of cyclone roping and a trash screen overflow or failure.
All tanks will be equipped with hollow shaft agitators to facilitate air injection through the shafts to satisfy oxygen requirements. All CIL tanks will be equipped with recessed impeller type carbon transfer pumps, and these will be used to advance the carbon between tanks and to remove carbon from the circuit.
The recessed impeller pump in tank 2 will be used to pump slurry to the carbon recovery screen for the loaded carbon to be removed from the circuit. The recessed impeller pump in tank 3 will normally provide for carbon transfer between tank 3 and tank 2; however, in the event that tank 2 is offline for maintenance, it will be used to recover loaded carbon to the carbon recovery screen. The loaded carbon will undergo an acid wash before proceeding to the elution circuit.
A vibrating carbon safety screen will be located adjacent to tank 6. This screen will collect any carbon that escapes from tank 7 (or tank 6 in the event that tank 7 is off-line) in a disposal drum for reintroduction to the circuit manually. The undersize product from the carbon safety screen will be gravity fed to a tailings hopper. The undersize product will then be pumped to the TSF by the tailings discharge pumps in a duty/standby arrangement.
A gantry crane will facilitate removal of the inter-stage screens for maintenance and cleaning. The tanks will be constructed on concrete ring beams within a concrete bunded containment structure. The CIL bund will be fitted with a sump pump which will collect any spillage within the bund and direct it back to the circuit. The bunded area will contain minor spillages, and in the highly unlikely event that large spills should occur, they will be contained within the confined drainage system of the plant and contaminated water will collect in an environmental pond adjacent to the plant.
| 17.5.7 | Elution, Electrowinning and Smelting |
The acid wash and rinse cycles will be performed in an acid wash column located beneath the loaded carbon recovery screen. Following the rinse cycle, the carbon will be transferred to the elution column. The elution circuit has been designed as a split AARL system with a strip capacity of 6 t per cycle and comprises two columns (acid wash column and elution column).
The strip solution will be prepared with sodium hydroxide and sodium cyanide and preheated by an in-line elution heater to approximately 95 °C, before being further heated to an operating temperature range of 125–140 °C. The hot strip solution will then be introduced to the bottom of the elution column.
The elution sequence will consist of approximately one bed volume (BV) of strip solution, followed by four bed volumes of hot elution solution, two BVs of rinse water, and two BVs of cooldown water. The total acid wash time will be approximately three hours, and elution cycle time will be approximately nine hours for a total of 12 hours.
| June 30, 2026 | Page 198 of 291 |
| | Diamba Sud Gold Project, Kédougou Region, Senegal Technical Report |
The elution circuit will include a lean eluate tank (5 BV capacity), a strip solution tank (5 BV capacity), and two pregnant solution tanks (each with a capacity of 5 BV). Pregnant solution will be circulated through the electrowinning cells for approximately 8–12 hours prior to barren solution being returned to the leaching circuit.
At the completion of the elution cycle, barren carbon will be transferred to a carbon dewatering screen prior to being fed to the regeneration kiln. The kiln will operate at a nominal feed rate of approximately 300 kg/h over a 20-hour period per day. Regenerated carbon will discharge to a quench tank before being returned to the CIL circuit.
The gold sludge from both the gravity and elution circuit electrowinning cells will be washed in a cathode wash box as a manual process. The resultant sludge will then be transferred via a sludge trolley to a calcine oven. The dried and calcined product will be smelted using fluxes in a diesel-fired furnace to produce doré bars. The doré bars will be weighed and stored in the gold room safe.
Gold sludge from the gravity circuit will be refined separately from that of the elution circuit to allow for accurate metallurgical accounting of the gravity and CIL circuits.
| 17.5.8 | Tailings Disposal |
The tailings pipeline to the TSF will be installed above ground, except for locations where road crossings necessitate these sections to be buried. Leaks in the tailings line will be detected by comparison between two flow meters; one located at the plant and the other located at the TSF. The tailings and decant return pipelines will be laid in a fully bunded and lined trench between the process plant and the TSF to help protect the environment if an unplanned minor release happens from the pipelines.
| 17.6 | Reagents |
| 17.6.1 | Lime |
Quicklime will be delivered in bulk bags and loaded into a 41 t lime silo. Lime will be added to the mill feed conveyor to raise the pH of the process slurry to suit the cyanidation leaching reaction.
The lime silo will provide several days of storage capacity to allow for delivery interruptions. The expected annual consumption of quicklime is approximately 3.3 kt for oxide mineralization and 0.5 kt for fresh mineralization.
Allowance has been made for secure on-site bulk storage of all reagents for a minimum of 42 days to ensure continuous plant operation and reagent availability.
| 17.6.2 | Cyanide |
Cyanide will be delivered to site in 20 t shipping containers in 1 t bulk bags. Cyanide will be mixed with filtered water to create a 20%w/v solution in the cyanide mixing system, which will comprise the following items:
| · | A hoist which will lift the bags directly onto the bag splitter. | |
| · | A bag splitter. | |
| · | A mixing tank. | |
| · | A mixing agitator, which will mix the cyanide and the water to create a homogenous solution. |
The mixed solution will be transferred by a cyanide transfer pump to a separate cyanide storage tank, where duty/standby cyanide recirculating pumps will circulate the cyanide
| June 30, 2026 | Page 199 of 291 |
| | Diamba Sud Gold Project, Kédougou Region, Senegal Technical Report |
solution through the plant ring main with a constant pressure bypass return to the tank. In addition, a dedicated cyanide dosing pump will deliver cyanide from the storage tank to the elution circuit in a controlled manner. The cyanide mixing and storage tanks will be contained within a concrete bund with a collection sump to recover spillage. The sump pump will recover any minor spillage and deliver it to the CIL feed distribution box.
Allowance has been made for secure on-site bulk storage of all reagents for a minimum of 42 days to ensure continuous plant operation and reagent availability.
| 17.6.3 | Caustic Soda/Sodium Hydroxide |
Caustic soda will be delivered in 1 t bulk bags to site. It will be mixed with filter water in a combined mixing and dosing tank to create a solution with 2%w/v concentration. The mixing system will consist of the following items:
| · | A bag splitter. | |
| · | A 5 m³ mixing and dosing tank. | |
| · | An agitator, which will mix the caustic soda and the water to create a homogenous solution. |
The mixing system will be in the same containment bund as the cyanide mixing and storage tanks. A caustic dosing pump will draw the solution from the mixing tank and deliver it to the elution circuit, ILR, and cyanide mixing.
The sodium hydroxide facility will be arranged such that the mixing and storage is contained in one tank. As the sodium hydroxide use is intermittent, mixing will be undertaken in those periods where there is no demand, and the mixed reagent allowed to homogenize prior to use. A volume equivalent to 2.3 days use will be mixed and stored per batch.
The various mixing/storage/dosing facilities will provide a short-term buffer for operating such that there is at least one day’s storage available under most conditions. This allows reagent management to be undertaken on day shift only.
Allowance has been made for secure on-site bulk storage of all reagents for a minimum of 42 days to ensure continuous plant operation and reagent availability.
| 17.6.4 | Hydrochloric Acid |
Concentrated liquid hydrochloric acid (32%w/w) will be supplied in 1,000 L intermediate bulk containers (IBC) and delivered to site in shipping containers of 23.7 t capacity. The acid will be transferred from the IBCs by an acid dosing pump to the acid wash hopper for a carbon acid wash cycle, by injection into a water stream pumped from the water tank to create a diluted 3% w/w hydrochloric acid solution.
The concrete containment bund that will surround the acid preparation area will comply with the dangerous goods statutory requirements and be protected with a coating to prevent acid damage to the concrete.
Allowance has been made for secure on-site bulk storage of all reagents for a minimum of 42 days to ensure continuous plant operation and reagent availability.
| 17.6.5 | Activated Carbon |
Activated carbon in 500 kg bulk bags will be transported to the site by road in 22 t sea containers. The carbon will be stored in these containers or under tarpaulins to protect it
| June 30, 2026 | Page 200 of 291 |
| | Diamba Sud Gold Project, Kédougou Region, Senegal Technical Report |
from the weather. When required, it will be added via the quench hopper or alternatively the carbon will be hoisted up to the top of CIL tank 7 and broken directly into the tank.
Allowance has been made for secure on-site bulk storage of all reagents for a minimum of 42 days to ensure continuous plant operation and reagent availability.
| 17.6.6 | Flocculant |
Flocculant will be delivered to site in 25 kg bags. Bags will be manually emptied into the feed hopper. Flocculant will be mixed to a 0.25%w/v concentration and transferred to a storage tank. From the storage tank, flocculant dosing pumps will dose liquid flocculant to the leach feed thickener via a static mixer to further dilute the flocculant concentration to the required dosage strength of 0.025%w/v.
Allowance has been made for secure on-site bulk storage of all reagents for a minimum of 42 days to ensure continuous plant operation and reagent availability.
| 17.6.7 | Balls and Liners |
Modelling of the comminution circuit by OMC provided estimates of liner and grinding media consumption rates for the mineralized material tested. These rates and quantities have been incorporated into the operating cost and critical spares list.
Grinding media and liners will be procured as standard consumable items for the SAG mill. Grinding media will be added continuously during operation and stored in dedicated storage bunkers, with different ball sizes stored separately. Media will be loaded via a FEL into the reload hopper for feeding to the mill.
Mill and crusher liners will also be maintained as critical spares. Replacement liners will be ordered in advance to align with planned shutdowns.
| 17.7 | Control Systems |
The plant control systems will be a network of process logic controllers sitting beneath a supervisory control and data acquisition (SCADA) network layer. The process logic controllers will perform the necessary controls and interlocking whilst the SCADA terminals will monitor the process logic controllers and provide an interface for operator interaction.
The process logic controllers and SCADA terminals will communicate via a plant-wide ethernet network, the backbone of which will be dedicated, single mode, fiber-optic cables. For short distances, Cat 6 ethernet cables will be installed.
Field instrumentation and drive status signals will interface to the plant control system by means of hard-wired signals. Vendor packages may be connected to the SCADA network via a communications link, where appropriate.
The plant control system equipment to be installed within each area will function autonomously, such that a failure of the plant control system in one plant area will not affect the other areas.
The control philosophy of the plant will provide an appropriate level of automatic start up and shut down of various plant areas which will aid the plant operator in performing his tasks. Automatic interlocking, sequence control, and analogue control will be implemented by the plant control system equipment, where required. Safety interlocks will be hard-wired.
| June 30, 2026 | Page 201 of 291 |
| | Diamba Sud Gold Project, Kédougou Region, Senegal Technical Report |
Proportional integral derivative loop controllers will be programmed into the plant control system and be accessible via the SCADA terminals in the control rooms.
The PCS will provide detailed information including:
| · | Plant status monitoring. |
| · | Fault annunciation and logging. |
| · | Drive and systems diagnostics. |
| · | Trending for all analogue process parameters. |
The plant control systems will be powered by uninterrupted power supply equipment, providing fully synchronized power for thirty minutes after total power failure.
Process logic controllers will be installed in the main plant motor control center.
Vendor panels may contain process logic controllers depending on the complexity of control provided. Where possible, vendors will be asked to comply with the site standard PLCs, to minimize on spare holdings.
Password protected, user accounts will be set up in the SCADA to limit access to certain control functions. All functions required for day-to-day running of the plant will be made available at the operator level. Changing of set-points and proportional integral derivative parameters will be allowed at the Supervisor level (e.g. Plant Manager/Metallurgist/Plant Shift Supervisor). Complete control and development access will be allowed at the Administrator level (e.g. Electrical Supervisor).
Two SCADA terminals will be installed in the main control room and provide redundancy so that should one terminal fail then the wet plant can still be operated from the other terminal.
The SCADA terminal in the Electrical Supervisor’s office will contain the necessary licensing for future on-site development of the SCADA application. Application updates of all other SCADA terminals will be possible from the supervisor’s terminal.
| 17.8 | Electrical Reticulation |
Power for the process plant is planned to be generated from the a site-based heavy fuel oil (HFO) power plant. Power will be accepted at the terminals of the plant high voltage feeder housed in the plant main substation. This will house the main 11 kv distribution board. Power distribution within the plant area and vicinity will be at 11 kV and 415 v. Power consumption for each general plant area will be metered as indicated on the plant single line diagram. Power metering will generally take place at the 11 kV switchboard and at motor control center incomers.
The 11 kV power distribution cables will generally be underground within the plant area, while all other plant cabling will be in above-ground cable ladder attached to buildings and structural steelwork. Overhead power lines will not be installed in the immediate plant area to avoid interference with the movement of mobile equipment (e.g., mobile cranes and haul trucks).
Substation buildings will be of the demountable/transportable type and be fully air-conditioned to maintain the internal air temperature at 25°C maximum. Equipment in substations will be designed for continuous operation at rated output in a substation ambient temperature of 40°C maximum, 5°C minimum. Substation buildings will house the motor control centers, distribution boards and variable speed drives for that area and
| June 30, 2026 | Page 202 of 291 |
| | Diamba Sud Gold Project, Kédougou Region, Senegal Technical Report |
have sufficient space to allow the extension of switchboards as appropriate. Each substation building will incorporate a personnel access door and a two-leaf equipment door. The doors will be fitted with a panic release device. All substation building doors will open outwards.
In addition to the electrical and instrumentation equipment, each substation will be equipped with an internal light and small power system, emergency lighting, safety notices, fire detection system, and fire extinguishers. Fire detection systems will be limited to smoke detectors and a Vesda system wired to a fire panel within each building. Local annunciators will be installed on the outside of the building. Fire suppression systems have not been allowed for nor has the painting of cables with fire retardant paint.
The substation buildings will be designed to be mounted on supports 1.5 m high, to facilitate cable entry into the motor control centers from the bottom. Transformers associated with plant substations will be located in outdoor compounds located adjacent to substation buildings.
All transformers on the plant site will be pad-mounted and installed complete with compound fencing and underground earthing. They will include cables boxes on the high voltage and low voltage terminations. High voltage switchgear will be supplied for the SAG mill so that isolations of the drive can be performed under the control of the site maintenance personnel without relying on the power station operator or requiring access to the power station switchboard.
The switchgear will be indoor, metal clad switchgear with a vacuum or SF6 circuit breaker on a withdrawable truck, enclosed to IP41. A Multilin 469 electronic protection relay was allowed for protection of the SAG mill motor.
Motor current indication will be provided where specified, either as a panel mounted ammeter on the motor starter door, or as a current input to the plant control systems. Motors requiring control system current indication will require a current transducer to be incorporated into the motor starter, the current transducer having a 4-20mA direct current output.
All variable speed drives will be capable of having their speed regulated by the plant control systems. However, when the associated drive control is selected to “local” mode, it will be possible for local speed setting to take place at the variable speed drive.
| 17.9 | Water Supply |
The majority of the process plant make-up water supply (70–92%) will be made up of recycled water from the supernatant pond from the TSF. Additional process make-up water will be provided by a water storage pond that will be supplied by a water harvesting facility, groundwater, and open pit dewatering. Potable treatment plant water supply will be from either raw water or the bore water collection tank.
Details on water management are provided in Section 18.5 with respect to the Project water balance and infrastructure.
| 17.10 | Comments on Section 17 |
The QP observed that the process flowsheet is a conventional and well-established free-milling gold processing route, incorporating crushing, SAG milling with provision for pebble crushing, gravity recovery, CIL processing, and gold recovery via elution,
| June 30, 2026 | Page 203 of 291 |
| | Diamba Sud Gold Project, Kédougou Region, Senegal Technical Report |
electrowinning, and smelting. The selected flowsheet is appropriate for the mineralization characteristics described in Section 13 and reflects current industry practice.
The incorporation of a single-stage SAG milling circuit with pebble crushing, together with provision for future conversion to a SABC configuration, provides operational flexibility to accommodate variations in ore competency over the LOM. The inclusion of a gravity recovery circuit, pre-leach thickening (for fresh ore), and flexible CIL operation further supports robust plant performance across both oxide and fresh material types.
No significant technical risks are identified with the selected process design based on the metallurgical testwork results completed to date. The testwork indicates that the mineralization is free-milling and amenable to conventional cyanidation with high overall recoveries. While metallurgical testwork coverage for certain deposits, including Southern Arc and Moungoundi, is comparatively limited, the available results are considered sufficient to support the selected flowsheet and recovery assumptions applied in this study.
The process water supply strategy, based primarily on surface water stored in the raw water pond and supplemented by groundwater, is considered appropriate for the Project. Based on current modelling, sufficient water is available to meet operational requirements, and no material water supply risks have been identified.
The next stage of the project should focus on optimization of the process flowsheet, including refinement of operating parameters, reagent consumption, and water balance, as well as further validation of metallurgical performance across all ore domains.
| June 30, 2026 | Page 204 of 291 |
| | Diamba Sud Gold Project, Kédougou Region, Senegal Technical Report |
| 18 | Project Infrastructure |
| 18.1 | Overview |
The FS envisages the following key site infrastructure:
| · | Seven open pits. |
| · | Site access roads. |
| · | Site haul roads. |
| · | Site bypass road. |
| · | TSF. |
| · | Sediment management system. |
| · | Surface water management system. |
| · | Water storage dam. |
| · | Water harvesting dam. |
| · | Aerodrome. |
| · | Mining contractor infrastructure. |
| · | Administration and plant buildings. |
| · | Process plant, including plant site, warehouses and ROM pad foundation. |
| · | Accommodation camp. |
| · | Three WRSFs. |
| · | Stockpiles. |
| · | Power generation. |
| · | Fuel supply. |
| · | Communications. |
| · | Plant security. |
| · | Water supply. |
The proposed site infrastructure is shown in Figure 18.1
| June 30, 2026 | Page 205 of 291 |
| | Diamba Sud Gold Project, Kédougou Region, Senegal Technical Report |
Figure 18.1 Plan View of Site Infrastructure
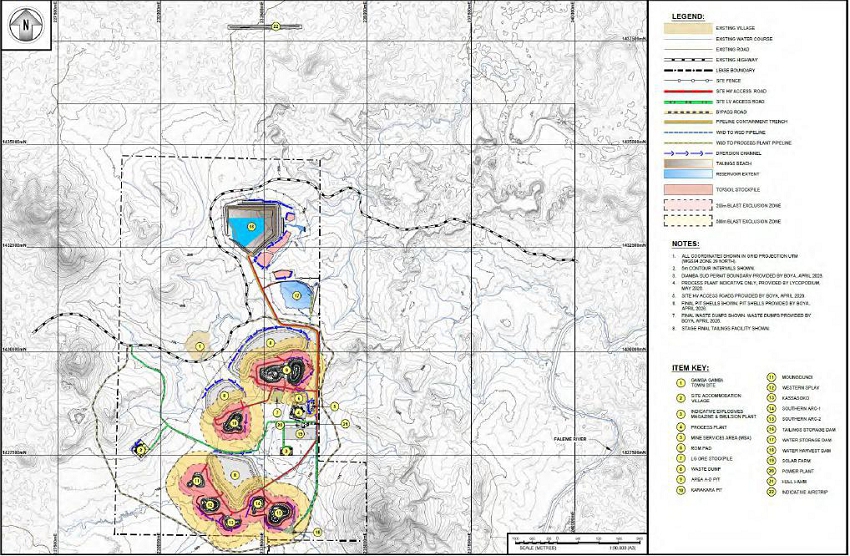
Figure prepared by Knight Piésold, 2026
| June 30, 2026 | Page 206 of 291 |
| | Diamba Sud Gold Project, Kédougou Region, Senegal Technical Report |
| 18.2 | Roads |
The proposed roads to support the planned mining operations are shown in Figure 18.1. The main mine access road will tie in with the N24 national road, approximately 1.5 km west of Gamba Gamba. Private mine roads will interconnect the facilities and provide an opportunity for expansion into the DS2 block. The access roads will be unpaved.
| 18.2.1 | Site Access Roads and Bypass Road |
The design objectives for the site access roads were as follows:
| · | Provide suitable access to the Project area from the existing paved highway, including allowance for design speeds. |
| · | Provide suitable access to connect the accommodation village, process plant, emulsion plant, explosive magazine, and water harvesting dam. The total length of site access roads is approximately 10 km. |
| · | Optimize access road operability with consideration of reducing the earthworks volumes. |
The design objectives for the bypass road were as follows:
| · | Provide suitable access around the Project area to the existing paved highway to the communities surrounding the Project area, for those communities that were cut off from the highway. |
The design parameters adopted for the site access roads and bypass road are summarized in Table 18.1.
Table 18.1 Site Access Roads and Bypass Road Design Parameters
| Structure | Design Criteria |
| Road Cross Section |
Formation Width – 9.0 m Road Width – 2 x 3.0 m with 1.5 m shoulder each side of road Safety Berms – Where required. Crossfall – 2% |
| Culvert Design Criteria | 5-year Average Recurrence Interval (ARI) |
| Floodway Design Criteria | 100-year Average Recurrence Interval (ARI) |
| Pavement | 150 mm laterite gravel wearing course (temporary) Rock sheeting (once available from the mining operations) |
| 18.2.2 | Process Plant Onsite Roads |
The scope of roads inside the administration compound and process plant included roads constructed for access by site personnel vehicles and any heavy equipment used during construction and operation. The design objective for these roads was to provide suitable access between the ROM pad, administration compound and all process facilities.
The total length of roads inside the administration compound and process plant will be approximately 1,150 m. This does not include the length of roadworks constructed for the process plant parking area. The road widths will be approximately 7 m in straight sections while bends in roads will have a width of up to 15 m to allow for maneuvering and cornering of lengthy personnel vehicles and site equipment.
| June 30, 2026 | Page 207 of 291 |
| | Diamba Sud Gold Project, Kédougou Region, Senegal Technical Report |
The process plant parking facility will have an area of approximately 600 m2.
| 18.2.3 | Site Haul Roads |
The design objectives for the site haul roads was as follows:
| · | Provide suitable access between the WRSFs, open pit, ROM pad, TSF embankments, water harvesting dam and mine services area, including allowance for design speeds. The total length of site haul roads will be approximately 17.5 km. |
| · | Optimize haul road operability with consideration of reducing the earthworks volumes and limiting ground disturbance. |
The design parameters adopted for the site haul roads are summarized in Table 18.2.
Table 18.2 Site Haul Roads Design Parameters
| Structure | Design Criteria |
| Road Cross Section |
Formation Width – 30.0 m Road Width – 2 x 12.0 m Safety Berms – 1.5 m height both sides of road Crossfall – 2% |
| Culvert Design Criteria | 5-year Average Recurrence Interval (ARI) |
| Floodway Design Criteria | 100-year Average Recurrence Interval (ARI) |
| Pavement | 200 mm laterite gravel wearing course (temporary) Rock sheeting (once available from the mining operations) |
| 18.3 | Tailing Storage Facilities |
The TSF will be located in the north of the DS1 block, approximately 5 km north of the proposed process plant. The TSF will be a cross-valley deposition facility, using the natural topography on the west to provide storage.
The TSF was designed based on the FS mine schedule with a peak plant treatment capacity of 2.5 Mt/a in the initial three years and 2.0 Mt/a on average for the remaining LOM. The Stage 1 TSF was designed to store 12 months of tailings (~2.4 Mt) with a tailings embankment elevation of 190.5 masl. The final design will have an embankment elevation of 207.8 masl and will provide sufficient storage capacity for the remaining LOM (20.5 Mt), based on the production rates assumed in the FS.
The TSF was designed to be a robust downstream constructed facility with a low permeability core (zone A) with downstream filter compatible transition (zone B) and compacted waste rock (zone C1). The dam will be primarily lined with a 1.5 mm high density polyethylene (HDPE) liner and the downstream zones A, B and C1 will provide additional potential seepage protection if there is a leak in the primary liner. The TSF impoundment will be composite lined with a 200 mm compacted soil liner overlain by a 1.5 mm HDPE liner.
The TSF will be equipped with a leakage collection and recovery system below the composite basin liner system. Furthermore, a downstream seepage collection system will be installed within and downstream of the TSF embankment to allow monitoring and collection of seepage (if any) from the TSF.
| June 30, 2026 | Page 208 of 291 |
| | Diamba Sud Gold Project, Kédougou Region, Senegal Technical Report |
About 80% of the supernatant water from the TSF will be recovered and pumped back to the plant as a closed-circuit system.
At each design stage, the TSF will be able to safely hold and have sufficient freeboard to contain the 1:100 year, 72 hour storm. Additionally, each stage will be incorporated with an emergency spillway capable of passing the peak flow from the probable maximum precipitation to ensure the TSF integrity remains intact.
Finally, as per the Global Industry Standard on Tailings Management (GISTM), the TSF will be designed for closure and be designed as if the consequence classification is Extreme; however, the preliminary consequence classification is currently designated as High to Very High.
The design parameters adopted for the TSF are summarized in Table 18.3
Table 18.3 Tailings Storage Facility Design Parameters
| Parameter | Design Criteria |
| Production Rates | 2.5 Mt/a
for oxide and transitional production 2.25 Mt/a average LOM production |
Slurry Characteristics: - Target % Solids - Beach Slope (assumed) - Density |
33 - 41% solids by weight 100H:1V 0.63 t/m3 - 1.31 t/m3 |
Embankment design: - Crest Width - Upstream Slope - Downstream Slope (interim)*1 - Downstream Slope (final, overall)*1 |
8 m 2H:1V 3H:1V with varied benches 3H:1V with varied benches |
Construction Description: - Cut-off Trench - Embankment
- Embankment Raises - Decant System |
Upstream toe cut-off trench through residual / transported material Multi-zoned earthfill embankment, with upstream low permeability zone. Embankment contains internal drains. Upstream face lined with textured HDPE geomembrane liner. Downstream raise construction methods for all raises. Decant tower system at startup, and turret system thereafter. |
| Basin Liner | Composite basin liner: - 200 mm compacted soil liner. - 1.5 mm smooth HDPE geomembrane liner overlying compacted soil liner in the TSF basin. |
| Final Embankment Slopes*1 | 3H:1V, with varied benches. |
| Cover Profile | Generally shaped to achieve dry closure with no pond (water shedding). |
| Capping | Closure cover: - 800 mm mine waste fill layer. - 200 mm topsoil growth medium layer and re-vegetated. |
*1 Bench design widths vary based on stage to suit stability requirements.
| June 30, 2026 | Page 209 of 291 |
| | Diamba Sud Gold Project, Kédougou Region, Senegal Technical Report |
| 18.4 | Sediment Management |
Sediment control structures are sediment dams that will be constructed in the downstream reaches of catchments impacted by site infrastructure. Sediment control structures reduce flow velocities facilitating sediment settling. They will be located downstream of all site infrastructure, and the discharge from the sediment control structures will be to the environment downstream of the project infrastructure sites. For minor events and depending on storage within the structure prior to a rainfall event, they may completely contain runoff.
| 18.5 | Water Storage Dam and Water Harvesting Dam |
The design objectives for the water storage dam are as follows:
| · | Secure clean water supply for the process plant, and make-up process water during dry conditions, with a view to optimizing discharge to downstream environments after the storage requirements are met. |
| · | Storage of water from the water harvesting dam. |
| · | Storage of water from pit dewatering. |
| · | The water storage dam will provide storage for water sourced from the water harvesting dam. Modelling and the Project water balance indicate that sufficient water should be available from the water harvesting dam without pit dewatering. |
| · | The water storage dam will consist of a multi-zoned earth fill embankment, with upstream low permeability core. The embankment will contain internal drains and have the upstream batter lined with textured 1.5 mm HDPE geomembrane liner. Additionally, the basin will comprise a composite basin liner comprising a 200 mm compacted soil liner and a smooth HDPE geomembrane liner overlaid. |
| · | The water storage dam will be constructed with an overflow spillway capable of passing the peak flow from the probable maximum precipitation to ensure the water storage dam integrity remains intact. |
| · | The water harvesting dam proves to be a feasible water source and will consist of a multi-zoned earth fill embankment, with central low permeability zone surrounded by multiple zones of transitional material and erosion protection. The water harvesting dam will have a capacity of approximately 150,000 m3 and an operation spillway capable of passing a 1:100 year storm event, occurring when the pond is at spillway inlet level. |
Water storage dam and water harvesting dam design criteria are shown in Table 18.4 and Table 18.5, respectively.
Table 18.4 Water Storage Dam Design Parameters
| Parameter | Design Criteria |
| Storage Capacity | 2,330,000 m3 |
| Effective Abstraction Rate | 476 m3/h (133 L/s) |
| Fluid Management *1 | Abstraction from the WSD (to the process plant) via abstraction tower pump system. |
|
Embankment Design: - Crest Width - Upstream Slope |
8 m 2.5H:1V |
| June 30, 2026 | Page 210 of 291 |
| | Diamba Sud Gold Project, Kédougou Region, Senegal Technical Report |
| Parameter | Design Criteria |
|
- Downstream Slope |
3.0H:1V with 30 m bench 15.5 m below crest elevation. |
|
Construction Description - Cut-off Trench - Embankment
- Abstraction System |
Upstream toe cut-off trench through residual / transported material Multi-zoned earthfill embankment, with upstream low permeability zone. Embankment contains internal drains. Upstream face lined with textured HDPE geomembrane liner. Abstraction tower system |
| Basin Liner |
Composite basin liner: - 200 mm Compacted soil liner. - 1.5 mm smooth HDPE geomembrane liner overlying compacted soil liner in the TSF basin. |
| Rehabilitation | Breach and remove WSD, replace topsoil, rip along contour and re-vegetate. |
*1 Pump and pipeline design by others.
Table 18.5 Water Harvesting Dam Design Parameters
| Parameter | Design Criteria |
| Storage Capacity | 37,600 m3 |
| Effective Abstraction Rate | 504 m3/h (140 L/s) |
| Fluid Management *1 | Abstraction from the WHD (to the WSD) via abstraction tower pump system. |
|
Embankment Design: - Crest Width - Upstream Slope - Downstream Slope |
10 m 3H:1V 20H:1V |
|
Construction Description - Cut-off Trench - Embankment
- Abstraction System |
Central toe cut-off trench through residual / transported material Multi-zoned earthfill embankment, with central low permeability zone. Central core is surrounded by crushed rock erosion protection. Continuous concrete sill wall installed in the crest. Abstraction tower system |
|
Rehabilitation |
Breach and remove WHD, replace topsoil, rip along contour and re-vegetate. |
| 18.6 | .Surface Water Management |
The design objectives for the site surface water management are as follows:
| · | Containment of sediment-laden runoff from site development areas, within sediment basins for controlled discharge from site. |
| · | Divert clean runoff water around sediment dams to discharge downstream of site and direct runoff from disturbed catchments into sediment dams prior to discharge, thus reducing the catchment area reporting to sediment dams. |
| · | Collect and divert sediment-laden runoff emanating from site infrastructure (earthworks) into sediment dams. |
| · | Divert existing natural drainage courses around site infrastructure. |
| June 30, 2026 | Page 211 of 291 |
| | Diamba Sud Gold Project, Kédougou Region, Senegal Technical Report |
| · | Operate as a “closed-circuit” to maximize recycled water, minimize make-up water requirements and prevent spilling/discharging any supernatant or sediment laden water. |
Surface water management design criteria are shown in Table 18.6
Table 18.6 Surface Water Management Design Parameters
| Parameter | Design Criteria |
|
Flow capacity - Diversion Channels |
100-year ARI / critical duration |
| Base width (minimum) | 1 m |
|
Side slopes - Channel |
1H:1V to 3H:1V |
| Water freeboard | 0.5 m (minimum). |
| Design Maximum Water Depth | 3.0 m |
| Construction Description | Homogeneous low permeability (Zone A) material earth fill embankment with erosion protection on the upstream and downstream batters. |
|
Spillway - Configuration - Capacity |
Overflow via gravity discharge system (open channel). 100-year ARI storm event, occurring when pond is at spillway inlet level. |
| Rehabilitation | Breach and remove sediment control structures (SCS), replace topsoil, rip along contour and re-vegetate. |
| 18.7 | Aerodrome |
A high-level desktop siting study was completed as part of the FS to identify potential locations and develop a cost provision for a site aerodrome. The final aerodrome location has not yet been determined and will be confirmed during subsequent project engineering, land access, environmental and permitting work. For FS costing purposes, the adopted design aircraft is the Beechcraft 1900D, requiring a minimum runway length of 1,680 m and width of 23 m, with an associated airstrip strip of approximately 1,800 m by 80 m. An unsealed gravel pavement has been adopted for the FS cost provision.
| 18.8 | Mining Contractor’s Infrastructure |
An area adjacent to the processing plant is demarcated as the mining services area. The mining contractor will provide its own workshop, store facilities, offices, washdown area and waste oil management facility, which will be located within the mining contractor’s area. The washdown slab will incorporate a silt and oil trap, and an oil separator will remove any contaminant oil from the wastewater before it is recycled into the wash bay facility, with excess water used for dust suppression. The mining contractor will manage the safe removal of waste oil by using approved suppliers of waste oils as required by law. The explosive materials will be stored in a magazine located in a remote area and well away from people. The magazine will be secured within a fenced compound and surrounded by embankments. The magazine will be manned with security at all times.
| 18.9 | Administration and Plant Buildings |
The buildings onsite consist of administrative and operational facilities for personnel involved in day-to-day site activities such as mining, construction and process plant operation as shown in Figure 18.2.
| June 30, 2026 | Page 212 of 291 |
| | Diamba Sud Gold Project, Kédougou Region, Senegal Technical Report |
Figure 18.2 Process Plant Layout
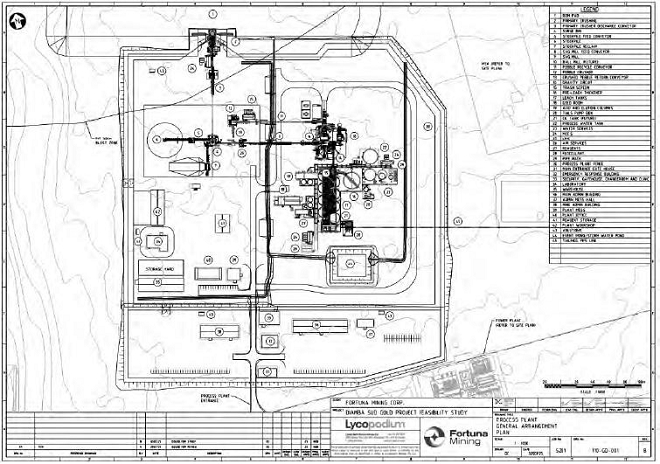
Most buildings taken into consideration for this FS are to be prefabricated, modular style buildings built with semi-permanent building materials such as cladding and corrugated steel roofing.
The compound just after the entrance gate will be dedicated for administrative and operational facilities and will be located south of the process plant. The compound will also give entrance to a storage yard that will be located to the southeast of the process plant and will include the site warehouse. Key buildings included in this compound will be:
| · | Main entrance gate house. |
| · | Emergency response building. |
| · | Security, gatehouse, change room and clinic (immediate to the process plant entrance). |
| · | Site laboratory. |
| · | Main administration building. |
| · | Mine admin building. |
| June 30, 2026 | Page 213 of 291 |
| | Diamba Sud Gold Project, Kédougou Region, Senegal Technical Report |
| · | Project office |
Inside the process plant fenced area the following buildings will be included:
| · | Plant mess. |
| · | Plant office. |
| · | Plant workshop. |
| · | Reagent storage. |
There will be three ablutions facilities for both male and female ablutions. One will be located in the administration compound, one will be situated alongside the plant office and one will be located to the northwest of the process plant close to the primary crushing facility.
The gold room will be situated immediately west of the process leach tank area. This will be a steel-clad building. The building will house the leach reactor, calcine oven, electrowinning cells, smelting furnace, and associated equipment. A supervisor workstation will be installed in the gold room; this workstation will be equipped with a telephone and data connection. A secure area with inner and outer doors will ensure that the gold room remains sealed during bullion transfer to the transport vehicle. All operations within the gold room will be subject to full-time closed-circuit television (CCTV) surveillance with security alarms provided to the security coordinator.
| 18.10 | Accommodation Camp |
The accommodation camp will house the senior level construction workforce prior to mobilization of the operations personnel late in the construction period. The remaining personnel will be accommodated in the nearby towns of Gamba Gamba, Karakena, Saraya and Kédougou (houses, house rentals, hotels, etc.). This will minimize the cost of the camp facilities while providing sufficient accommodation during the overlapping period between construction and operations.
The accommodation camp and facilities are designed for 329 staff not residing in the general area. It is expected to be located west of the process plant and will consist of the following major components:
| · | Accommodation facilities suitable for 329 personnel. |
| · | Kitchen, dining, and wet mess facility. |
| · | Water treatment plant. |
| · | Sewage treatment plant. |
| · | Laundry facilities. |
| · | Administration office. |
| · | General ablution block. |
| · | Recreation facilities. |
| · | Security fencing/gates and security office. |
| June 30, 2026 | Page 214 of 291 |
| | Diamba Sud Gold Project, Kédougou Region, Senegal Technical Report |
| 18.11 | Waste Rock Storage Facilities |
Waste rock storage facilities will be located adjacent to each open pit (see Section 16.5.3).
| 18.12 | Stockpiles |
ROM ore will be temporarily stockpiled on the ROM pad by the mining contractor. It will be reclaimed and loaded to the crusher feed bin using FELs operated by the mining contractor. Lower-grade ore will be stockpiled on the west side of the ROM pad. That ore will be reclaimed and loaded to the crusher feed bin using a FEL and trucks operated by the mining contractor. Additional design details and capacity were included in Section 16.5.4.
| 18.13 | Power Generation |
The grid connection point will be located at Kédougou, Senegal, approximately 110 km from the Diamba Sud site. As a result, power for the Project will be supplied via an on-site HFO power plant rather than through the national grid. Following the commissioning of the thermal power plant and the process plant, a photovoltaic solar farm with a battery energy storage system will be installed in Year 1 of operations as a hybrid power solution to reduce operating costs and environmental impact.
The estimated Project power demand used as the basis for the FS power generation design is summarized in Table 18.7.
Table 18.7 Project Power Demand
| Description | Maximum Demand (MW) |
Average Demand (MW) |
Annual
Energy Consumption (GWh/y) |
| Process Plant | 11.90 | 10.10 | 79.80 |
| Non-process infrastructure (mine services, admin buildings, explosives magazine) | 0.69 | 0.55 | 4.80 |
| Camp | 0.70 | 0.36 | 3.20 |
| Total | 13.30 | 11.00 | 87.80 |
The generating plant most suited for HFO fuel is one with a modular layout and medium-speed reciprocating engine technology. HFO is an energy source that is widely used in West Africa, and throughout Senegal, for transportation and electricity production due to its lower cost compared to diesel. The availability of reciprocating engines for this application is more limited in terms of the number of manufacturers than for diesel engines; however, the cost advantage is the lower fuel costs.
The redundancy configuration of units would be ‘N+1’ HFO units, with the equivalent capacity of a single HFO unit as high-speed diesel fuel oil (DFO) units, having ‘N’ running HFO machines and one machine as a standby unit. Alternative arrangements with N+2 redundancy were also considered. The HFO units will be installed within an engine hall.
The power station will consist of the following:
| · | 5 x Wartsila 6L32 11kV generating sets. |
| · | 4 x Cummins KTA50 G3 11kV generating sets (containerized units). |
| · | Associated balance of plant equipment, including: |
| June 30, 2026 | Page 215 of 291 |
| | Diamba Sud Gold Project, Kédougou Region, Senegal Technical Report |
| o | Mechanical and electrical ancillary equipment. |
| o | Fuel oil system. |
| o | Lube oil system. |
| o | Cooling water system. |
| o | Compressed air system. |
| o | Exhaust gas system. |
| o | Thermal oil system. |
| o | Intake air system. |
| o | Oily water system. |
| o | Electrical switchgear and transformers. |
| o | Instrumentation and control system. |
| · | Spare parts and specialized tooling |
| · | Buildings including engine hall and workshop. |
| · | Storage tanks (volumes summarized in Table 18.8. HFO storage will be sufficient for up to 30 days of on-site storage. |
Table 18.8 Storage tank volumes
| Storage Tank Type | Tank Volume |
| HFO (Bulk Storage) | 2 x 1,000 m3 |
| HFO (Settling Tank) | 72 m3 |
| HFO (Day Tanks) | 2 x 72 m3 |
| LFO (Day Tank) | 1 x 100 m3 |
| New Lube Oil | 7 m3 |
| Used Lube Oil | 10 m3 |
| Thermal Oil | 30 m3 |
| Sludge Tank | 30 m3 |
| Fire water tank | 500 m3 |
| Treated Water (Power Station) | 15 m3 |
| Maintenance Water | 5 m3 |
| Fuel Unloading Units | two unloading bays for HFO, including weighbridge |
Based on the hybrid modelling, the optimal solar photovoltaic capacity is 13 MW (Table 18.9).
Table 18.9 Solar Photovoltaic Capacity
| Parameter | Value |
| Solar PV Capacity (MWp) | 13 MWp |
| Solar PV Capacity (MWac) | 10.4 MW |
| Battery Capacity (MWh) | 3.5 |
| Battery Capacity (MW) | 3.5 |
| Solar Energy Production | 23.8 GWh / year |
| Renewable Percentage | 24.5 % |
| June 30, 2026 | Page 216 of 291 |
| | Diamba Sud Gold Project, Kédougou Region, Senegal Technical Report |
| 18.14 | Fuel Supply |
Bulk fuel storage for the process plant operation, accommodation cam, mining services area and mining fleet is assumed to be owned and managed by the fuel supplier.
| 18.15 | Communications |
There is currently limited telecommunication infrastructure in the proposed immediate mine site area. Mobile coverage and optic fiber internet are available; however, these services can be intermittent at times. Telecommunications will be expanded and improved to include voice, email and internet traffic for the process plant, camp, and main offices to ensure a reliable connection during construction and operations.
| 18.16 | Plant Security |
From a security perspective the Project footprint will be configured to be as small as possible. Security provision will consist of:
| · | Access control to the mine lease at several locations (including mine, plant and camp). |
| · | Read in/read out access control. |
| · | Two-stage gates for vehicle access. |
| · | Electronic surveillance including CCTV within the plant area and at several key locations around the property. |
| · | Physical and visual barriers. |
| · | Fencing (double, single and cattle). |
| · | Lighting. |
| · | Patrols. |
Double security fencing will enclose the process plant. This is demarcated as a high security area. A single security fence will enclose the mining contractor’s area, main administration building area, laboratory, camp, magazine, and tailings storage facility. The security fence will consist of a 1.8 m high fence with razor wire at the top of the support posts. A cattle fence will also be installed around the water storage and harvesting facilities.
Electronic security will be provided by a reputable security system provider and audited by an independent security consultant experienced in security installations in Africa. It will be monitored by the security contractor. The security system is expected to be configured as follows:
Installation of and integrated security solution consisting of a combination of various access control points, coupled with intruder detection devices, supported by CCTV cameras located across the site; and Some of the remote cameras and access control locations will be interlinked via the installation of a line-of-sight wireless network connection with a common receiver located appropriately to operate within “line of site” protocols.
| June 30, 2026 | Page 217 of 291 |
| | Diamba Sud Gold Project, Kédougou Region, Senegal Technical Report |
| 18.17 | Water Supply |
Water supply make-up water for the proposed operations will be provided through a combination of harvesting rainfall runoff, and pit dewatering sent to the water storage dam. The Gamba Gamba Creek (Karakara watercourse), which runs north to south, through the DS1 block will be harvested for water supply make-up and the resulting harvested water will be sent to the water storage dam. The site water balance indicates that an effective abstraction rate of 140 L/s (576 m3/hr), would be sufficient to steadily fill the water storage dam to capacity for the dry season. Under average conditions, a constant water supply of 59 L/s will be required for operations.
A water harvest dam will be constructed to provide an additional raw water source. This dam will be located to the southeast of the planned Southern Arc 1 pit within Gamba Gamba creek. Design work, which included the development of an Australian Water Balance Model (AWBM) using the precipitation and flow data collected on site, indicates that abstraction from the water harvest dam to the water storage dam will provide sufficient water for operations.
It is estimated that approximately 75–85% (average of 80%) of the water in the slurry deposited into the TSF can be recovered from the TSF and pumped back to the plant for reuse in the process. Potable water will be supplied through the process plant water treatment system, which will service the process plant and mining services area via a dedicated pipeline from the plant. Outside of these areas, water will be supplied by fractured bedrock wells similar to those used by the village of Gamba Gamba and the current exploration camp. A water treatment plant will be incorporated to improve overall water quality. A water balance block model is shown in Figure 18.3.
| June 30, 2026 | Page 218 of 291 |
| | Diamba Sud Gold Project, Kédougou Region, Senegal Technical Report |
Figure 18.3 Water Balance Modelling Block Model Diagram
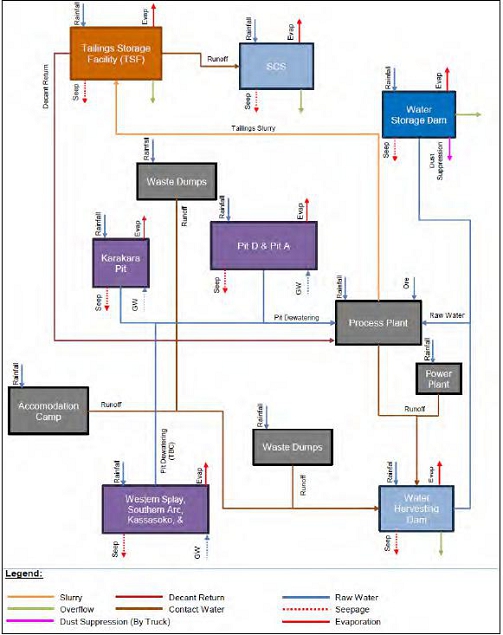
Figure prepared by Fortuna, 2026.
| 18.18 | Sewage Treatment |
The process plant site be serviced by a sewage treatment plant. This will include an aeration chamber, membrane bioreactor) system and an ultraviolet sterilizer unit. Sewage feed to the plant will be drawn from the various washing and sanitary units across the site area via two transfer pump stations.
| June 30, 2026 | Page 219 of 291 |
| | Diamba Sud Gold Project, Kédougou Region, Senegal Technical Report |
The 329 people capacity camp accommodation site will be serviced by a separate camp sewage treatment plant. This plant will receive sewage feed from three camp sewage forwarding stations.
| 18.19 | Comments on Section 18 |
The QPs are of the opinion that the Project has sufficient surface area to accommodate all infrastructure requirements to support the LOM, and that sufficient work was completed to ascertain reasonable locations for all major infrastructure to support a FS.
| June 30, 2026 | Page 220 of 291 |
| | Diamba Sud Gold Project, Kédougou Region, Senegal Technical Report |
| 19 | Market Studies and Contracts |
| 19.1 | Market Studies |
No market studies have been performed as part of this FS; however Fortuna has sold gold doré from West Africa since 2020 and is familiar with selling this product.
The Project will produce gold doré, which is readily marketable on an ‘ex-works’ or delivered basis to several refineries in Europe and Africa. There are no indications of the presence of penalty elements that may impact on the price or render the product unsalable.
| 19.2 | Commodity Pricing |
Fortuna’s financial department provided gold prices using a combination of five-year historical average and consensus commodity price projections. Fortuna established the pricing using a consensus approach based on long-term analyst and bank forecasts prepared in April 2026.
The long-term gold price used for estimating Mineral Reserves in the LOM plan was $2,900/oz, based on the mean consensus prices from 2027–2029 of $4,041/oz weighted at 40% and a five-year historical average of $2,510/oz weighted at 60% and applied and adjustment price reduction of -$200/oz.
An elevated gold price of $3,300/oz, using a 15% upside was used for the Mineral Resource estimate.
The economic analysis conducted in June 2026 used a base case gold price of $3,500/oz.
| 19.3 | Contracts |
As part of Fortuna’s socio-economic commitment to the region and other local stakeholders, Fortuna will preferentially award contracts to local businesses to participate in the Project, thereby establishing a role as an active member of the community and a participant in the region’s sustainable development.
No sales or material contracts have been executed in relation to the development, construction, or operation of the Project, as of the effective date of this Report, including mining, power plant operations and maintenance, smelting, refining, transportation, handling, sales, hedging, or forward sales agreements.
Contracts for early works are progressing for initial construction, such as CMEF Senegal SAS for site access roads, and Kekendo Africa Engineering S.U.A.R.L for the new camps. There are still evaluation tenders for key infrastructure packages, including the water storage dam and TSF. Front-end engineering and design (FEED) and other detailed design studies are also well advanced in support of Project execution planning. At this moment, a letter of intent for the power plant HFO and light fuel oil generators have been secured with the final contract currently under negotiation.
| 19.4 | Comments on Section 19 |
The QP has reviewed the information provided by Fortuna on metal price projections and exchange rate forecasts and notes that the information provided is consistent with what is publicly available for industry norms.
| June 30, 2026 | Page 221 of 291 |
| | Diamba Sud Gold Project, Kédougou Region, Senegal Technical Report |
Long-term metal price assumptions used in this Report are based on a consensus of price forecasts for those metals estimated by numerous analysts and major banks as of April 2026.
The QP has reviewed the marketing assumptions and proposed major contract areas and considers the information acceptable for use in estimating Mineral Reserves and in the economic analysis that supports the FS.
| June 30, 2026 | Page 222 of 291 |
| | Diamba Sud Gold Project, Kédougou Region, Senegal Technical Report |
| 20 | Environmental Studies, Permitting and Social or Community Impact |
| 20.1 | Baseline Studies |
The development of the Diamba Sud Project, including construction and operations, requires an Environmental Permit in accordance with Senegalese legislation for Boya to be able to obtain an Exploitation Permit.
Earth Systems, an environmental and social science and engineering company from Australia, and registered in Senegal, was commissioned to prepare an Environmental and Social Impact Assessment (ESIA) in compliance with Senegalese regulatory requirements, and in accordance with international best practices such as the Equator Principles and International Finance Corporation (IFC) Performance standards. As required by Ministerial Order No. 9470 MJEHP-DEEC (2001), Earth Systems holds a current ESIA accreditation from the Government of Senegal. The submission of the ESIA is a pre-requisite for obtaining an Environmental Permit.
Field studies have been undertaken by the ESIA consultants since 2021, and with the support of Oryx Expertise in 2024, a specialized biodiversity consultancy firm. These studies in the DS1 block included socio-economic conditions, land and water use, surface and groundwater resources, biodiversity, air quality, noise and vibration, climate change, as well as archaeology and cultural heritage. The study areas are shown in Figure 20.1.
The ESIA was submitted to the Direction de la Réglementation Environnementale et du Contrôle (DiREC), a division of the Ministry of the Environment and Ecological Transition of Senegal on October 6, 2025, and on June 11, 2026 Boya received a formal Decree which approved the Environmental and Social Impact Assessment for the Project (Decree n°011251 of 22/05/2026 granting the Environmental and Social Compliance Certificate for the Diamba Sud gold project).
The FS resulted in two material design changes to the initial project design covered by the ESIA. The following new infrastructures added by the FS to the project design are:
| · | The airstrip, to be located immediately north of Diamba Sud permit; |
| · | The solar photovoltaic power plant, to be located immediately south of the process plant. |
Although the ESIA still applies to the initial project design, these two new components are expected to require additional environmental and social permitting i.e., impact studies or notices. Relevant national authorities including DiREC have been contacted to clarify the permitting pathway, with permitting deemed feasible and planned to start in the second half of 2026.
| June 30, 2026 | Page 223 of 291 |
| | Diamba Sud Gold Project, Kédougou Region, Senegal Technical Report |
Figure 20.1 Diamba Sud Project Study Area in DS1 Block
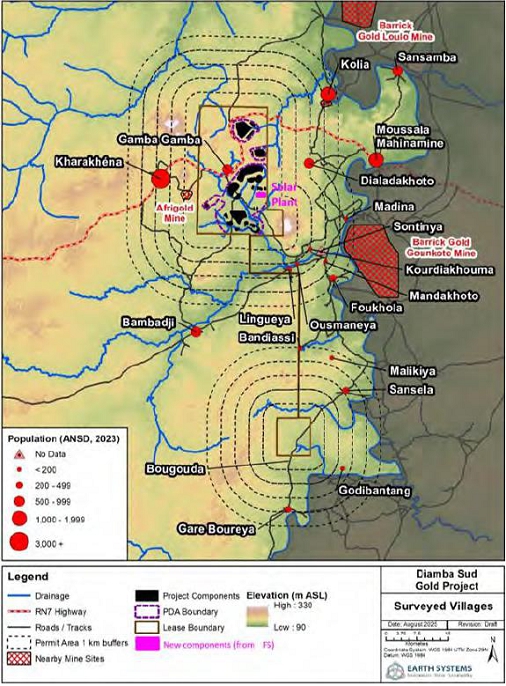
| 20.1.1 | Socio-Economic Environment |
Administration and Governance
The Diamba Sud Project is situated in the rural commune of Bembou within the department of Sayara, and region of Kédougou in the South-East of the Republic of Senegal. The Project is located approximately 7 km to the west of the Falémé River which marks the border with Mali, and 665 km southeast of Dakar the capital of Senegal. The
| June 30, 2026 | Page 224 of 291 |
| | Diamba Sud Gold Project, Kédougou Region, Senegal Technical Report |
Kédougou-Saraya highway (National Road 7), which leads to the border town of Moussala, cuts across the DS1 block. The Commune of Bembou covers an area of 26,068 km2 and is made up of 30 villages.
Population and Demographics
According to the fifth General Population and Housing Census conducted in Senegal in 2023 (ANSD, 2023), a total of 4,732 people reside across 959 households within the DS1 study area settlements. In 2023, Gamba Gamba had a total population of 640. Karakaéné is considerably the largest settlement in the study area with a population of 3,253.
The number of males in the settlement of the Project area is significantly higher than the number of females. This trend is likely associated with artisanal small-scale mining activities in the study area and wider region.
Livelihoods and Income
The primary livelihood activities of surveyed households are agriculture and artisanal mining. Surveys conducted in 2024 among village authorities revealed artisanal mining as being the main source of income in the settlements of Gamba Gamba and Lingueya, followed by agriculture. The hamlet of Khourdiakhouma is an exception, with agriculture remaining the main livelihood activity and artisanal mining in second place.
Artisanal and small-scale mining is a key livelihood activity for household members in the study area. This sector is a significant economic and demographic driver in the study area and the wider Kédougou region. In the study area, the village heads of all four settlements ranked ASM activities and gold panning as the biggest income generator for their village. In Gamba Gamba specifically, 44% of the working age workforce listed ASM as their main occupation during the household census.
Most agricultural activities are entirely rain-fed, and as such production yields are seasonal and dependent on climatic conditions: length of season, distribution, and abundance of rainfall. The main commercial crops grown in the vicinity of the Project include cotton, cashew nuts, peanuts, and watermelon. Key subsistence crops include corn, rice, groundnuts, beans, millet, and legumes.
Livestock is an important subsistence activity, with approximately 21% of households surveyed citing livestock as a key livelihood activity. In Gamba Gamba, approximately 27% of surveyed households reported livestock as a key subsistence activity, compared to approximately 20% in Karakaéné and 13% in Kourdiakhouma.
The Kédougou region has experienced significant growth in retail and service activities, largely attributed to the opening of the RN7 highway and the region’s integration into the global economy. Within the study area, retail activity is concentrated in markets and small trading shops, which serve as the primary source of household food and goods for local communities. The Karakaéné market is the largest commercial hub in the study area, with more than 100 small traders and shops offering a wide variety of goods and services. Surveys conducted with 44 market stall and shop owners at Karakaéné market revealed a strong dependency on trading opportunities created by artisanal mining activities and RN7 traffic. However, many shop owners reported declines in demand and footfall over the last 3–5 years, primarily due to reduced artisanal mining activity. Despite this, the market remains a critical source of income, with most stalls operating seven days a week, experiencing peak sales on Mondays and Fridays when the artisanal mining sites close.
Collection of non-timber forest products is a traditional activity that involves the collection of various plant products for food or medicinal purposes. The most collected
| June 30, 2026 | Page 225 of 291 |
| | Diamba Sud Gold Project, Kédougou Region, Senegal Technical Report |
are the Saba senegalensis (Kaba), Vitellaria paradoxa (Shea tree), Borassus aethiopoum (Sibo), bamboo cherry, and dougouto. They are mainly for local consumption and not sold. Grass species including Andropogon gayanus and Andropogon pseudapricus are collected for use as fodder or to thatch hut roofs.
Community Assets and Infrastructure
Table 20.1 summarizes key community infrastructure in the study area.
Table 20.1 Key Community Infrastructure
| Settlement | Health | Education | Water |
| Gamba Gamba | 1 Health hut (currently not operational) | 1 primary school | 1 Borehole Connected to a water tower which can store 10,000 litres of water. 1 Borehole connected to a pump 20 Traditional Wells |
| Karakaéné | 1 Health Post | 1 primary school | 3 Boreholes connected to a pump >100 Traditional Wells |
| Lingueya | None | 1 primary school | 2 Boreholes with pumps |
| Kourdiakhouma | None | None | 1 Traditional Well |
| Dialadakhoto | None | 1 primary school | 1 water house 7 traditional wells |
Health and Nutrition
The main causes of mortality in Senegal include neonatal diseases, lower respiratory infections, heart disease, diarrheal diseases, and stroke.
For the Bembou Commune, the proximity of the Falémé River and important water points means there is a high incidence of diseases relating to water and hygiene (diarrhea, malaria, bronchopneumonia, and bilharzia).
The Gamba Gamba Health Hut Community Health Officer reported in 2023 that several cases of HIV/AIDS have been diagnosed in the village of Karakaéné. No cases of HIV/AIDS were identified in households surveyed in the study area. The lack of knowledge and social stigma of HIV in rural areas are constraints to patients being diagnosed.
Artisanal mining is often practiced by the youth and is associated with acute and chronic health risks including physical injury from poorly-maintained machinery; toxin poisoning such as mercury; and silica dust exposure leading to acute respiratory problems.
It was identified that 31% of households reported that they always had enough food and 67% reported that they very occasionally had to skip a meal or reduce portion size (this was highest in Lingueya (78%)). Four households (1.5% of the study area) reported that they did not have enough food and found it a constant struggle to access foodstuffs, two each were located in Gamba Gamba and Karakaéné.
Traffic and Transport
The RN7 crosses the area covered by the DS1 block, with 9.8 km of road running along the block boundary.
Other roads and access tracks in the DS1 block area consist of minor unpaved tracks connecting villages, agricultural and grazing areas, and artisanal gold mining sites.
| June 30, 2026 | Page 226 of 291 |
| | Diamba Sud Gold Project, Kédougou Region, Senegal Technical Report |
Motorcycles are the most common mode of transport and are widely used for public transport and the transport of goods to artisanal gold mining sites.
Most of the tracks in the permit area are 3–4 m wide. The tracks are in poor condition, heavily degraded, and inaccessible during the rainy season. During the rainy season, some crossing points along the Daléma River (a tributary of the Falémé River) become impassable on foot.
Archaeology and Cultural Heritage
The Project is lies within an important historical and archaeological corridor that has been inhabited since pre-historic times.
The initial survey conducted in 2022 identified 12 unique archaeological sites, while the 2024 survey identified an additional 21 sites, for a total of 33 sites. The 2022 mission report indicated a low to medium density of sites in the Diamba Sud permit, possibly due to the proximity of the Falémé River, where important archaeological sites are concentrated along the left bank, from Doundé to Alinguel. This suggests that settlements were historically favored along major valleys, rather than in secondary valleys such as Diamba Sud, which may explain the abandonment of Neolithic sites and their subsequent reoccupation in historical times. Archaeological surveys conducted in 2022 identified 10 sites located within the boundaries of the proposed fenced area. These include three settlement sites, two metallurgical sites, and five sites containing only material remains. Surveys in 2024 identified four additional archaeological sites within the proposed fenced area. These include a Neolithic site notable for its size, the diversity of its material culture, its milling tools, and its thick pottery; a metallurgical site that is highly conducive to iron reduction; and sites which contain ceramic pieces dating from the Neolithic period.
A total of 40 tangible cultural sites were identified during surveys conducted in 2022 and 2024 in the study area but none in the operations footprint that was proposed in the FS. Gamba Gamba is the only settlement located within the DS1 block area, but outside the planned fenced area.
It includes three tangible cultural sites, including a mosque, a cemetery, and a sacred site. Almost all of residents of Gamba Gamba are Muslim and are of Malinké ethnicity. The sacred site of Sého is located on the banks of the village's stream. Sacrifices are made to a tree there, in the form of white chickens, eggs, and rice-based fritters. The sacrifices are led by the village chief but require the contribution of the entire village population.
In terms of intangible cultural heritage, many traditions are still practiced. This can be seen in the strict observance of days of rest, traditional music, and rituals of offerings and libations. It is clear that the rise of gold panning and a cash economy is bringing about changes in local communities. Among the popular traditional celebrations, the people of the village of Gamba Gamba use songs and dances to preserve and practice their cultural traditions.
| 20.1.2 | Physical Environment |
Climate and Meteorology
This is discussed Section 5.2 of this Report.
Geomorphology and Topography
This is discussed in Section 5.3 of this Report.
| June 30, 2026 | Page 227 of 291 |
| | Diamba Sud Gold Project, Kédougou Region, Senegal Technical Report |
Hydrogeology and Groundwater
The availability of groundwater resources in sub-Saharan Africa depends critically on the geology, the history of weathering, faulting, and recharge to groundwater. The hydrogeology of the Project area is characterized by a crystalline basement environment (see discussion in Section 7.1).
Basement aquifers include the geological sequence comprising the weathered residual overburden (the regolith), the transition zone between the bedrock and the regolith and the fractured bedrock. Unweathered and non-fractured basement rocks are generally considered to contain negligible quantities of groundwater. The basal section of regolith and the deeply weathered bedrock are generally considered to be those parts of the sequence with the highest yield. The degree and depth of weathering vary depending on physical characteristics and chemical composition of the rock.
Hydrology and Surface Water
Hydrology in the Project area is governed by annual rainfall patterns, and the distinct dry and wet seasons that are influenced by the annual movement of the Intertropical Convergence Zone. This rainfall patterns govern surface water flow regimes in the region.
Runoff from the Project area ultimately drains into the Falémé River to the east of the Project, which is located approximately 7 km from the Project area at its closest point. The Falémé River originates in Northern Guinea, where it flows towards the Malian border and then crosses into Senegal. It is a tributary of the Senegal River and forms an important watershed for this river system. In recent years, the hydrology and water quality of the Falémé River have been significantly impacted by the intensification of ASM activities along the river, resulting in significant degradation of water quality.
The hydrology of the Project Area includes a network of ephemeral watercourses as shown in Figure 20.2.
| June 30, 2026 | Page 228 of 291 |
| | Diamba Sud Gold Project, Kédougou Region, Senegal Technical Report |
Figure 20.2 Creeks in and Around the Diamba Sud Project
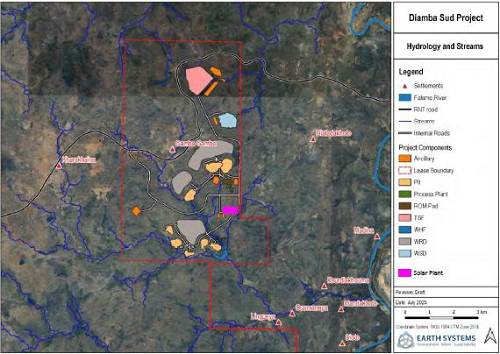
Note: Infrastructure shown for the Project is proposed.
Water Quality
Physio-chemical analysis of surface water indicates that, in general, it has a pH close to neutral and low to moderate electrical conductivity, indicating relatively stable water quality conditions. Concentrations of dissolved metals such as aluminum and iron are generally low, with occasional peaks above drinking water standards observed during the wet season, particularly in the Gamba Gamba Creek. No cyanide was detected in any samples.
Groundwater quality was assessed based on monitoring data collected from sites representing community boreholes, exploration boreholes, and boreholes in the vicinity of the exploration camp. Groundwater quality was generally acceptable, with a pH close to neutral and moderate mineral content. Most chemical parameters, including major ions such as calcium, magnesium, and sodium, were at low levels, consistent with drinking water standards. Metals such as arsenic, selenium, barium, iron, and manganese sometimes exceeded health recommendations, suggesting potential contamination from agricultural runoff, wastewater discharge, or natural geogenic sources amplified by human activities.
Soils
The main soil types in the study area are:
| · | Regosols: defined by their absent properties rather than their present ones. They are poorly developed mineral soils in unconsolidated materials that are neither superficial, sandy, nor fluvial. Regosols correspond to soil taxa characterized by incipient formation, such as skeletal soils (FAO Global Reference Base for Soil Resources). |
| June 30, 2026 | Page 229 of 291 |
| | Diamba Sud Gold Project, Kédougou Region, Senegal Technical Report |
| · | Gleysols: form in waterlogged conditions due to rising groundwater. They are characterized by chemical and visual signs of iron reduction. In warm climates, these soils are often found on periodically flooded landforms and are defined by a shallow or non-existent surface horizon and alluvial parent material. |
Geochemistry
Waste rock geochemical studies completed by Knight Piésold in 2022 indicate that the geochemical risk from weathering and sulfide oxidation is low. Of the 57 waste rock samples analyzed, 55% were classified as non-acid forming (NAF) and 45% were classified as acid consuming. No potentially acid forming (PAF) material was observed, with all samples containing very low sulfur contents. Fifty additional tests were completed by Earth System in 2025 which confirm the overall low potential for acid rock drainage, with only 1% of the sampling classified as potentially acidogenic.
Air Quality
Air quality monitoring was conducted during dry season and wet season around the Diamba Sud Project area to establish baseline conditions for particulate matter (PM10, PM2.5), sulfur dioxide (SO2), ozone (O3), nitrogen dioxide (NO2) and carbon monoxide (CO).
Monitoring followed IFC Guidelines (2007) and included multiple sites representing upwind and downwind conditions near sensitive receptors.
Key existing air emission sources include:
| · | Seasonal Harmattan dust transport during the dry season. |
| · | Vehicular traffic on nearby roads including exhaust emissions and fugitive dust. |
| · | Agricultural activities such as slash and burn producing dust and gas emissions. |
| · | Local biomass burning for fuel and refuse, releasing particulates and various gases. |
Baseline particulate concentrations (PM10) frequently exceed the World Health Organization (WHO) (2021) guidelines during the dry season, with lower but still notable exceedances in the wet season. Pollutant gases generally remain below WHO guideline levels, although SO2 and NO2 showed higher levels in the dry season, likely due to lightning and woodsmoke.
Noise and Vibration
The main sources of existing noise emissions in the vicinity of the Project area include:
| · | Vehicle and motorcycle use. |
| · | Generators used for electricity generation. |
| · | Water pumps and motorized machines. |
| · | Domestic animals, birds, wildlife, and insect activity. |
Baseline noise monitoring recorded average daytime noise levels generally below WHO guidelines. Night-time noise levels were consistently above WHO guidelines. Some sites near villages and artisanal mining activities recorded the highest noise levels. Sources include human activities in villages, vehicles, motorcycles, livestock, road construction, and artisanal mining generators.
| June 30, 2026 | Page 230 of 291 |
| | Diamba Sud Gold Project, Kédougou Region, Senegal Technical Report |
Baseline vibration monitoring detected standard background levels of surface and near surface seismic waves, including micro-seism’s (low-frequency waves <1 Hz). Sources of these waves include human activity related to transportation or industrial activity, winds, rivers, ocean waves, and other natural atmospheric phenomena.
| 20.1.3 | Biological Environment |
Terrestrial Biodiversity
There are no intact, pristine habitat types in the study area. During the dry season of 2022, field surveys revealed the presence of traditional artisanal gold mining activities in virtually all habitats in the study area. Cultivated, cleared, and livestock grazing areas, as well as bush fires and heavy pruning of certain species (e.g., Acacia sieberiana) for fodder, have also impacted floristic diversity and regeneration.
The area covered by the Diamba Sud exploration permit is mainly composed of the following dominant habitat types: shrub savannah (1,650.1 ha, or 37% of the permit area), shrub savannah and bowal mosaic (1,018.3 ha, or 22.0% of the permit area), and tree savannah (433.0 ha, or 9.4% of the permit area). Some habitat areas have been totally degraded, mainly due to artisanal gold mining, farming settlements, and roads, with higher levels of disturbance from human activities located near Gamba Gamba and riparian areas.
Flora surveys conducted during the dry and rainy seasons of 2022 identified the presence of 288 species divided into 198 genera and 61 families in the permit area. Five species were present in almost all sites in the study area, namely: Anogeissus leiocarpa, Terminalia macroptera, Diospyros mespiliformis, Pterocarpus erinaceus, and Sarcocephalus latifolius.
According to the Senegalese Forest Code, 13 partially or totally protected species are present in the study area, which means that it is prohibited to fell or remove foliage from these species without authorization from the Senegalese water and forestry services. Of these, two are fully protected (Vitellaria paradoxa and Diospyros mespiliformis) and the other 11 are partially protected (Adansonia digitata, Afzelia africana, Borassus aethiopum, Ceiba pentandra, Cordyla pinnata, Grewia bicolor, Khaya senegalensis, Prosopis africana, Pterocarpus erinaceus, Tamarindus indica and Ziziphus mauritiana).
Four globally threatened species were recorded in the area. They are classified as “endangered” (Pterocarpus erinaceus) and “vulnerable” (Afzelia africana, Khaya senegalensis, and Vitellaria paradoxa) on the International Union for Conservation of Nature (IUCN) Red List of Threatened Species. All four species were found to be locally common in the study area, in savannah and forest habitats. The endangered species Pterocarpus erinaceus was found to be particularly common. Although classified as threatened, all four species are widespread in West Africa and occur in several countries other than Senegal. None of these species is restricted to the study area, nor does any significant part of their range occur within this area.
A total of 40 mammal species were recorded directly or indirectly. One species classified as critically endangered and benefiting from critical habitat, the western chimpanzee, was recorded in the area covered by the DS1 block. In addition, signs of the presence of hippopotamuses, a vulnerable species, have been found along the banks of the Falémé River, and indirect signs (footprints) of leopards, also vulnerable, have been found east of the area covered by the DS1 block. In addition, signs of the presence of the Guinea baboon, colobus monkey, and African buffalo, near-threatened species, were recorded in the Diamba Sud exploration permit area. The other mammal species recorded are classified as “of concern” on the IUCN Red List of Threatened Species.
| June 30, 2026 | Page 231 of 291 |
| | Diamba Sud Gold Project, Kédougou Region, Senegal Technical Report |
Four species recorded during the baseline survey period are fully protected under the Senegalese Hunting Code, namely the western chimpanzee, hippopotamus, leopard, and aardvark. Twenty-two partially protected species were also recorded in the study area.
A total of 169 bird species belonging to 62 families were identified during the 2024 survey period. All species are classified as “least concern” on the IUCN Red List of Threatened Species, with the exception of six: the hooded vulture (Necrosyrtes monachus) (critically endangered; observed near the exploration camp), the bateleur (Terathopius ecaudatus) (endangered, was common and frequently observed flying over the landscape), Beaudouin's snake eagle (Circaetus beaudouini), the European turtle dove (Streptopelia turtur) (a single European turtle dove was also observed near a gallery forest south of the Project area), the northern ground hornbill (Bucorvus abyssinicus) (known to be in decline due to habitat loss and hunting, was captured on camera traps and frequently observed by villagers), and the tawny eagle (Aquila rapax) (vulnerable, observed once). In surveys conducted earlier in 2022, out of a total of 78 species observed, 62 species (76%) were strictly resident, seven species (9%) were both resident and African migratory, four species were intra-African migratory, three species were African migratory and resident, and two species were Palearctic migratory.
There are 27 bird species that are fully protected by the Senegalese Hunting Code. In addition, most birds of prey (e.g., vultures, eagles, kites, falcons, and buzzards) as well as owls, hornbills, and terns are fully protected. Thirteen other bird species are partially protected. The study area is likely to provide suitable habitat for a number of fully or partially protected bird species.
A total of 23 species of terrestrial reptiles were recorded in the study area during baseline biodiversity surveys conducted in 2022 and 2024. All species are classified as “least concern” on the IUCN Red List of Threatened Species, with the exception of one species, Echis jogeri, which is classified as “data deficient”. Echis jogeri is considered endemic, with a range limited to southeastern Senegal and southwestern Mali.
One fully-protected turtle species was recorded in the study area during the biodiversity surveys: Bell's hinge-back tortoise (Kinixys belliana nogueyi).
There are four species of partially protected terrestrial reptiles in Senegal. Two partially protected monitor lizard species classified as “near threatened” on the IUCN Red List were recorded in the study are, being the Nile monitor (Varanus niloticus) and the savannah monitor (Varanus exanthematicus).
Aquatic Biodiversity
The Project is located in the Senegal and Gambia Freshwater Ecoregion, dominated by tropical and subtropical floodplains and wetland complexes. The Falémé River is adjacent to the Project, and waters from the permit area drain towards the Falémé River. Two main tributaries flow into the Falémé River from the Diamba Sud exploration permit area, with the larger tributary flowing at the southern boundary of the permit area and the other flowing north from the permit area to join the Falémé River further downstream. Streams and drainage lines in the Project area are primarily ephemeral and often bordered by gallery forest.
There are no international or national aquatic protected areas in or near the Diamba Sud Project area.
Fish species diversity in the study area is low: studies identified 24 species (2022) and 13 species (2024), spanning 19 genera and 10 families. The most frequently caught species were Schilbe intermedius, Alestes dentex, Brycinus nurse, and Petrocephalus bovei. Schilbe
| June 30, 2026 | Page 232 of 291 |
| | Diamba Sud Gold Project, Kédougou Region, Senegal Technical Report |
intermedius was present at all sites. All inventoried species are classified as “least concern” by the IUCN; none are protected or endemic in Senegal. Lates niloticus is the only species of notable commercial value. No invasive fish species were identified during the survey period.
For the herpetofauna, the West African crocodile (Crocodylus suchus) was observed in 2022 and 2024. Indirect evidence of the African dwarf crocodile (Osteolaemus tetraspis, vulnerable) was found in 2024. The African helmeted turtle (Pelomedusa olivacea) was recorded and is fully protected in Senegal. Nineteen semi-aquatic amphibian species were identified, all “least concern.” The Senegal softshell turtle (Cyclanorbis senegalensis, vulnerable) and suitable habitat for the African softshell turtle are present.
Macroinvertebrate surveys in 2022 identified 88 macroinvertebrate species (61 in the dry season, 66 in the rainy season); the 2024 surveys recorded 47 genera and 32 families. Arthropoda, especially insects, dominated. Mollusks were found at six sites. In 2024, insects made up 96% of total abundance. No macroinvertebrates are protected, endemic, or invasive.
The main threats include artisanal gold mining, agriculture, housing, and pastoralism. Artisanal mining causes pollution, erosion, and biodiversity loss. Water quality has declined, reducing fish stocks and impacting local fishermen. Unsustainable fishing practices further decrease stocks. Invasive alien species are a regional concern, but none were recorded in the study area.
Ecosystem Services
The study area features woodlands, savannahs, gallery forests, and grasslands. Timber is abundant, especially near watercourses and mountains, but overexploited near villages and mining sites. Timber is essential for fuel, construction, and furniture. Most households use wood for cooking; charcoal and gas are less common. Key timber species include Pterocarpus erinaceus (Senegalese rosewood), Oxynanthera abyssinica, and Anogeissus leiocarpa, used for construction, furniture, and tools. Timber is also used at mining sites.
Local ecosystems provide food, medicine, spices, oils, resins, and materials such as bamboo and rattan. About 42% of households collect non-timber forest products, with variation between villages.
Small ruminant farming is common, mainly for self-consumption and occasional sale. Goats and sheep are most common, with some cattle. Water sources include rivers and boreholes, but availability drops at the end of the dry season.
Groundwater from boreholes and wells is the main source of drinking water. Quality declines in winter due to artisanal mining runoff. River water is used for laundry and gardening, but not for drinking due to contamination from mining chemicals. Most households rely on boreholes or wells, with irregular availability. Communities worry that the Project may further impact water resources.
Traditional huts use clay, straw, wood, and bamboo from the environment. Modern huts with concrete and tin roofs are more common in mining villages. About 90% of households have traditional huts, showing reliance on natural materials.
Fishing is a minor but practiced activity. Main species caught include Synodontis sp., Petrocephalus bovei, Citharinus citharus, Hydrocynus brevis, and Sarotherodon galilaeus. Water quality and fish stocks have declined due to mining and unsustainable practices. Most fish are consumed locally; some are sold. Fishing is mainly seasonal, with methods including gillnets, beach seines, lines, and rods.
| June 30, 2026 | Page 233 of 291 |
| | Diamba Sud Gold Project, Kédougou Region, Senegal Technical Report |
Critical Habit Assessment
Using the IFC Performance Standards, a Critical Habitat Assessment was undertaken through consultation and review of existing literature and data, field work, and analysis of critical habitat according to the following five potential critical habitat triggers as defined in IFC Performance 6 (IFCPS6):
| i. | Presence of critically endangered or endangered species, as listed on the IUCN Red List of Threatened Species. |
| ii. | Presence of endemic or species with limited distribution. |
| iii. | Presence of concentrations of migratory or gregarious species of global importance. |
| iv. | Highly threatened and/or unique ecosystems. |
| v. | Areas associated with key evolutionary processes. |
Based on the data collected at this stage, the analysis of critical habitats shows that criterion (i) is applicable according to IFC PS6 for the West African chimpanzee. In the Diamba South Project study area, this therefore applies to:
| · | Gallery forests. |
| · | Relief areas of more than 200 m elevation (Kharakhene and Kourdiakhouma hills). |
| · | The interface zone between gallery forests and open forests (a buffer of 100 m is considered around gallery forests adjoining open forests). |
According to IFC PS6, a Biodiversity Action Plan for the Diamba Sud Project will be required as part of further project development. A conceptual Biodiversity Action Plan was developed and would require an estimated budget of $2.4 million over the LOM.
Protected Areas
The nearest conservation protected area is the Bafing-Falémé Ramsar Wetland located about 50 km south of the Project, near the confluence of the Bafing and Senegal Rivers in Guinea. It spans 5,173 km2 and includes gallery forests, shrubby and wooded savannahs, and floodplains. It is home to unique hydrophytic grasses, aquatic herbs, and endangered species such as chimpanzees, lions, and vultures.
Niokolo-Koba National Park is the closest international protected area to the Project, located approximately 95 km to the west. It covers 9,130 km² and is a World Heritage Site, a UNESCO-MAB Biosphere Reserve, and an Important Bird Area. The park contains diverse habitats, including gallery forests, savannah floodplains, ponds, and dry forests. It is home to key species such as chimpanzees, lions, elephants, Western Derby eland, and African wild dogs.
The Diamba Sud Project falls within the Falémé Hunting Area, a designated hunting zone by decree in 1972 (Decree n° 72-1170) covering approximately 8,400 km². The hunting activity is compatible with mining activities as per Decree n° 78-506.
| 20.2 | Environmental Issues – Climate Change |
Climate change is expected to lead to dryer and hotter conditions in Senegal with potentially larger rain events during the wet season. It is not currently anticipated that climate change will have a significant effect on operations during the time frame of the
| June 30, 2026 | Page 234 of 291 |
| | Diamba Sud Gold Project, Kédougou Region, Senegal Technical Report |
Project. However, factors such as water supply and structure design will need to incorporate climate change considerations into the engineering of the Project to minimize risks and ensure long term resilience of the infrastructures.
| 20.2.1 | Physical Risks |
Temperature
Climate projections from the World Bank Group's Climate Knowledge Portal indicate that daily means, maximum and minimum temperatures in the Project area (Kédougou region) could increase. The Project area is expected to experience an increase in mean surface air temperature of between 1.16°C (SSP1–2.6) and 2.01°C (SPP5–8.5) by 2060, compared with the reference period 1950–2014, according to the lowest and highest emissions scenarios respectively. The greatest increases in mean, maximum, and daily temperatures could occur between November and March, during the dry season. Overall, the temperature rise forecast for the region over the next 50 years is likely to be slightly higher than the global average (Think Hazard, 2020).
In addition, the number of hot days with a maximum temperature above 35°C and tropical nights with a minimum temperature above 29°C is set to increase in both the high and low emissions scenarios. In the medium and high emissions scenario, 31 more hot days per year are expected in 2030 than in 2000, 47 more in 2050 and 82 more in 2080 (German Federal Ministry for Economic Cooperation and Development, 2022).
Precipitation
The rainy season is governed by the movement of the Intertropical Convergence Zone, resulting in great variability from year to year and decade to decade, which can make it difficult to identify long-term trends. However, the consensus is that precipitation in the Kédougou region is trending downwards, particularly from June to August, and that higher greenhouse gas emissions point to an overall drier future (German Federal Ministry for Economic Cooperation and Development, 2022).
Heavy precipitation events are expected to intensify, and the proportion of total annual precipitation falling during severe events tends to increase in the overall projections. Seasonally, this ranges from a downward trend from January to March and April to June, to an upward trend from July to September and October to December (USAID, 2021).
A study carried out on the Senegal River Basin, which includes the Falémé basin (sub-basin 4) in the Kédougou region, indicates changes in rainfall intensity in the basin (Diakhate et al., 2022). The results indicate that after 2050, there is a risk of a decrease in rainfall intensity (by around 20%) during the first phase of the monsoon season (May–August) in the RCP8.5 scenario and by less than 10% in the RCP4.5 scenario. The study points out that the peak of the monsoon season is likely to shift from August to September by 2100 (Diakhate et al. 2022).
Evapotranspiration
The IPCC RE6 report indicates that it is highly likely that evapotranspiration rates will increase under all emission scenarios. In Sahelian climatic zones, evapotranspiration rates could reach 266 mm by 2065 in the RCP4.5 scenario, and up to 277 mm in the RCP8.5 scenario (Ndiaye et al. 2021).
Bush Fires
Modelled climate projections indicate a likely increase in the frequency of fire-prone weather conditions in this region, including higher temperatures and greater variability in
| June 30, 2026 | Page 235 of 291 |
| | Diamba Sud Gold Project, Kédougou Region, Senegal Technical Report |
rainfall. In areas already affected by fire risk, the fire season is likely to lengthen, with a greater number of days conducive to fire spread due to longer rain-free periods during fire seasons. Climate projections also indicate an increase in fire severity. Areas at very low or low risk could see their risk level increase, as climate projections indicate an expansion of the forest fire risk zone (Think hazard, 2020).
Scenario Analysis
While climate parameters are likely to change in the future, according to the climate change scenario analysis based on SSP2–4.5 medium emissions and SSP5–8.5 high emissions executed by S&P Global in 2023, the Project appears to have a low physical risk exposure (below 10% of the asset value) with a relative risk in 2030 estimated at 0.4%.
| 20.3 | Permitting |
The development of the Diamba Sud Project requires a number of permits and authorizations in line with Senegalese legislation. A list of permits and authorizations are summarized in Table 20.2. All necessary permits and authorizations must be obtained for the Project to meet Senegalese regulatory requirements and must be integrated into the Project's operations and management systems.
Table 20.2 Summary of Key Permits and Authorizations Required for the Diamba Sud Project
| Permit/Authorizations | Ministry/Department | Relevant Legislation |
Work
Activity to Support Legal Requirement |
Schedule
For Legal Authority |
| Environmental and Social Attestation of Compliance | Directorate of Environmental Regulation and Control (Direction de la Réglementation Environnementale et du Contrôle following an examination by the Technical Committee) (DIREC) | Environment Code, 2023 | ESIA | Complete |
| Certificate of Environmental and Social Conformity | Ministry for the Environment and Ecological Transition (Ministère de l’Environnement et de la Transition écologique) (METE) | Environment Code, 2023 | ESIA | Ongoing, pending processing of Environmental and Social Attestation of Compliance |
| Airstrip Impact Assessment or Notice (with associated Environmental and Social Attestation and Certificate of Compliance) | Directorate of Environmental Regulation and Control (Direction de la Réglementation Environnementale et du Contrôle following an examination by the Technical Committee) (DIREC) | Environment Code, 2023 | ESIA or Impact Notice | Feasibility study |
| Solar plant Impact Assessment or Notice (with associated Environmental and Social Attestation and Certificate of Compliance) | Directorate of Environmental Regulation and Control (Direction de la Réglementation Environnementale et du Contrôle following an examination by the Technical Committee) (DIREC) | Environment Code, 2023 | ESIA or Impact Notice | Feasibility study |
| Authorization to pump from Falémé River | Organisation pour la mise en valeur du fleuve Gambie (OMVG) and |
Water Code | ESIA/Application for operational permit | Feasibility study (Following validation of ESIA) |
| June 30, 2026 | Page 236 of 291 |
| | Diamba Sud Gold Project, Kédougou Region, Senegal Technical Report |
| Permit/Authorizations | Ministry/Department | Relevant Legislation |
Work
Activity to Support Legal Requirement |
Schedule
For Legal Authority |
| Department of Management and Planning of Water Resources (DGPRE) | ||||
| Blasting Certificate/Authorization/Permit | Autorité Sénégalaise de Radioprotection et de Sûreté Nucléaire (ARSN) | Radiation law (2004) | ESIA/Application for operational permit | Feasibility study (Following validation of ESIA) |
| Permit for discharge of water | Ministry of Sanitation / DGPRE. | Environment Code, 2023 | ESIA/Application for operational permit | Feasibility study (Following validation of ESIA) |
| Permit for construction works located outside the Mine Concession boundary i.e. site access road | Minister of Mines and the Minister of Lands | Mining Code, 2016 | Application for auxiliary construction works (It may be possible for these to be conditioned as part of the ESIA) | Feasibility study (Following validation of ESIA) |
| Mine Concession | Ministry of Mine | Mining Code, 2016 | Application for Mine Concession | Feasibility study (Following receipt of Certificate of Environmental Conformity) |
| Authorization for an ICPE, including authority for the importation, transport, storage and use of hazardous materials | DIREC / Governor | Environment Code, 2023 | Application for ICPE, including public enquiry, an Internal Operations Plan (POI)) and an emergency plan (Plan Particulier d'Intervention (PPI)) | Pre-mobilization (Following receipt of Mine Concession) |
| Land clearance | Ministry for the Environment and Ecological Transition | Forestry Code, 1998 Environment Code, 2023 | Forestry inventory (post ESIA) | Pre-mobilization (Following receipt of Mine Concession) |
| Permit for construction of WSD | Ministry of Hydraulic | Environment Code, 2023 Water code, 1981 |
ESIA/Application for operational permit | Pre-mobilization (Following receipt of Mine Concession) |
| Permit for importation, transportation, storage and handling of hazardous materials (cyanide, explosives) | Ministries of Mines and Interior (DEEC) and Department of Mines and Geology (DMG) | Mining and Environment Code, Ministry of interior Notice | ESIA/Application for operational permit | Pre-mobilization (Following receipt of Mine Concession) |
| Permit for exploitation of borrow areas where these may be located outside the Mine Concession boundary | Ministries of Mines and Environment | Mining Code, 2016 | Application for exploitation permit (It may be possible for these to be conditioned as part of the ESIA) | Pre-mobilization (Following receipt of Mine Concession |
| 20.4 | Tailings Storage Facilities |
The TSF is discussed in Section 18.3 of this Report.
| 20.5 | Water Management |
Water management is discussed in Section 18.5 of this Report.
| 20.6 | Environmental Management and Monitoring |
The Project will need to comply with discharge and emissions guidelines for potential off-site releases of water, waste and airborne contaminants, as well as ambient guidelines for the protection of environmental values (e.g. protection of aquatic fauna and fisheries, drinking water, etc.). A list of relevant Senegalese standards is presented in Table 20.3 together with the date these requirements were enacted.
| June 30, 2026 | Page 237 of 291 |
| | Diamba Sud Gold Project, Kédougou Region, Senegal Technical Report |
Table 20.3 Key Air Quality, Noise and Water Standards and Legal Requirements
| Source | Title | Year |
| Water Discharge and Monitoring | ||
| Senegal | Interministerial Order no 1555 Discharge Water Guidelines | 2002 |
| Wastewater Discharge Standard, NS 05-061 | 2001 | |
| Law no. 81-13 of 4 March 1981 on the Water Code (Articles 49 and 56) | 1981 | |
| Decree no. 98-556 of 25 June 1998 on water policing (Article 13) | 1998 | |
| Water Treatment Code, Law 2009-24 of 8th July 2009 | 2009 | |
| Decree 2001-245 of 17th February 2011 | 2011 | |
| Air Quality | ||
| Senegal | Interministerial Order no. 7358 Application of Air Pollution Standard | 2003 |
| Atmospheric Pollution Standard, NS 05-062 | 2018 | |
| Environment Code (Title 5 ; Chapter II) | 2023 | |
| Law no. 83-71 of 5 July 1983 on the Hygiene Code (Article L31) | 1983 | |
| Noise and vibration | ||
| Senegal | Environment Code (noise, Title 4, Chapter 8) | 2001 |
| Decree No 2001-282 implementing the Environment Code (Article R84) | 2001 | |
| Law No. 97-17 of 1 December 1997 on the Labor Code | 1997 | |
| Decree No. 200601252 of 15 November 2006 on environmental factors | 2006 | |
| 20.6.1 | Environmental and Social Management System |
The ESIA was submitted to the Direction de la Réglementation Environnementale et du Contrôle (DiREC), a division of the Ministry of the Environment and Ecological Transition of Senegal, on October 6, 2025, and Boya received the Decree which provides approval for the ESIA on June 11 2026 (Decree n°011251 of 22/05/2026 granting the Environmental and Social Compliance Certificate for the Diamba Sud gold project). The ESIA includes a full Environmental and Social Management and Monitoring Plan (ESMMP), which forms a key component of the Project’s Environmental and Social Management System and sets out the mitigation, monitoring, reporting and management measures to be implemented during construction, operations and closure.
The key objectives of the management and monitoring program developed for the Project will be follows:
| · | comply with the environmental, social, and health commitments and measures described in the ESIA; |
| · | avoid or mitigate potentially negative environmental or social impacts that could result from the development and operation of the Project; |
| · | maximize beneficial impacts and minimize unavoidable residual impacts; and |
| · | comply with applicable regulatory requirements, legislation, and international environmental and social standards. |
The ESMMP describes Fortuna's legal obligations and other environmental and social management requirements and commitments due to the development of the Project. In particular, the Environmental and Social Management and Monitoring Plan describes the
| June 30, 2026 | Page 238 of 291 |
| | Diamba Sud Gold Project, Kédougou Region, Senegal Technical Report |
set of management measures and monitoring programs that will be implemented during the construction, operation, and closure phases of the Project. The Environmental and Social Management and Monitoring Plan also ensures the link between policy and Project implementation as a planning document summarizing legal requirements and obligations, international standards and guidelines, and the environmental and social commitments described in the ESIA and presenting the management measures and monitoring programs to be implemented to achieve them.
The ESMMP will be used in conjunction with the following stand-alone management plans, which are considered part of the ESMMP and are also provided in the ESIA:
| · | Stakeholder Engagement Plan. |
| · | Conceptual Rehabilitation and Mine Closure Plan. |
| · | Livelihood Restoration Plan. |
The Plans will be supported by procedures, forms, registers, and a full Environmental and Social Management System, which will be developed and implemented as needed.
A Hazard Study has also been prepared for the Project and presented in the ESIA. The Project's risk assessment will be reviewed annually to identify potential emerging issues. It will serve as the basis for the development of emergency response plans for the Project. These plans will match Senegalese legislative requirements and will be prepared prior to the construction of the Project.
Fortuna will establish inspection, audit, and review processes for the Project. Regular audits of the Project's Environmental and Social Management and Monitoring Plan and associated management systems will be conducted internally and externally. The audits will assess:
| · | The adequacy of the Environmental and Social Management and Monitoring Plan and related plans in relation to the scale and nature of the anticipated impacts and the current stage of development of the Project. |
| · | Staff awareness, competence, and matching with the Environmental and Social Management System and related plans and procedures. |
| · | The performance of managers and operators in implementing, maintaining, and enforcing the Environmental and Social Management System and related plans. |
| · | The adequacy of resources, equipment, and budget allocated to the implementation of the Environmental and Social Management System. |
All recommendations arising from the audits will be discussed, corrective actions will be documented, and progress will be reported. Independent external audits will be conducted as well. Environmental and social monitoring will be coordinated with national regulators in collaboration with relevant national and regional technical services as well as local authorities and local government.
| 20.7 | Community Relations |
Fortuna recognizes stakeholder engagement as a prerequisite for acquiring and maintaining the sustainable Social License to Operate and as a core element for good social risk management.
| June 30, 2026 | Page 239 of 291 |
| | Diamba Sud Gold Project, Kédougou Region, Senegal Technical Report |
A detailed Stakeholder Engagement Plan will be developed as part of the ESIA that will identify among other requirements: stakeholder consultation, participation, and disclosure activities.
In addition, a Grievance Management Mechanism was developed at an early stage of the Project to take into account complaints that may relate to unmet expectations, build-up of nuisances, compensation for damages, eligibility criteria for compensation by the Project, perceptions, and attitudes of the parties toward the mining sector, or the quality of services and assistance provided to the parties by mining activities.
A voluntary social investment or corporate social responsibility program is already in place, aiming to support local socio-economic development.
| 20.7.1 | Stakeholder Engagement |
To the Report effective date, official stakeholder engagement and public participation activities with affected communities included:
| · | Active community engagement with key stakeholders since the start of exploration activities in 2015, including host villages and communities affected by the Project, vulnerable groups, particularly women and youth, health service providers, local administrative authorities, technical agencies, and government regulatory bodies. |
| · | Stakeholder participation and consultation as part of the environmental and social studies and preliminary economic assessment, including environmental and social baseline studies, in April-May 2022, March 2023, and April 2024. |
| · | Stakeholder consultations and engagement as part of the ESIA in June and July 2025. |
The main stakeholder groups are comprised of the following: Project affected communities; the Government of Senegal (at all levels) and local traditional authorities (e.g.: village chiefs); public and commercial interests; Project-related committees; non-governmental organizations/civil society organizations; and youth, women, elderly, and other vulnerable groups.
The stakeholder consultations completed at the Report effective date highlighted several expected Project benefits and the main community concerns. The expected Project benefits identified by the communities consulted include developing the local economy, creating jobs and skills, developing agriculture and livestock farming, and improving community health infrastructure, water infrastructure, and basic services.
The villages identified employment opportunities, training programs, local entrepreneurship, and service providers, particularly for young people, as a key expected benefit, which is a municipality expectation of rural communities located in the immediate vicinity of major development projects. The creation of agricultural development opportunities was identified as a potential benefit, particularly by women (e.g. equipment, water infrastructure, market gardening, and other income-generating activities). Women's additional development needs mainly are concerned with the establishment of cooperatives.
The communities also highlighted several development needs, such as providing water supply infrastructure; rehabilitating or building educational and health facilities; completing agriculture (tools, seeds, training); and improving electrification and road access during the rainy season. Specific comments at the community level from villages,
| June 30, 2026 | Page 240 of 291 |
| | Diamba Sud Gold Project, Kédougou Region, Senegal Technical Report |
including Gamba Gamba, highlighted the good collaboration with Fortuna/Boya. However, concerns were also expressed about the Project's impact on artisanal mining and the loss of livelihoods.
| 20.7.2 | Social Investment |
Fortuna implemented a social investment program to support socio-economic development initiatives of the communities in the Project area. Following consultation of these communities to identify to their needs, more than 20 local development activities were conducted from 2021–2025.
An estimated budget of $ 2.1 million over the LOM has been allocated to implement socio-economic initiatives near the mine and in the region.
| 20.7.3 | Land Acquisition |
The Project will require the acquisition of the land corresponding to the operations footprint and the fenced-in area. To manage this activity, a process based on Senegalese regulation and the IFC principles for involuntary resettlement will be developed and implemented. This process will include a Livelihood Restoration Program to compensate for eligible economic impacts due to land acquisition. It is important to note that no permanent infrastructure has been identified within the Project development area. The Project is, therefore, not expected to have a physical impact on any dwellings, community structures or infrastructure associated with the village of Gamba Gamba, located approximately 0.5 km from the nearest fence line, or any other village within the study area. Based on the current Project design, it is currently estimated that 1,700 ha of land will be required to implement the fenced-in perimeter for the proposed Diamba Sud mine and <50 ha of crops.
In Senegal, a land acquisition and compensation process must be undertaken in accordance with national legislation (law no. 64-46 of June 17, 1964 relating to the national domain; law no. 76-67 of July 2, 1976 relating to expropriation of land for public utility and other land operations of public interest; and decree no. 77-563 of July 3, 1977) to ensure that all landowners are identified and compensated for the loss of their land and livelihoods. In terms of best practices, the IFC Performance Standards, particularly Performance Standard 5 (IFP PS5), have become the international benchmark for land acquisition issues on extractive industry projects.
Based on Senegalese regulation and IFC best practices, the land acquisition process will comply with Senegalese regulations and the IFC PS5 framework. Where national requirements are superseded by IFP PS5, or where IFP PS5 requirements are more favorable to Project-affected people, Fortuna will comply with IFC PS5.
Within the Project area, most land is held under customary forms of land titling. The land use baseline study showed dominant land types in the Project footprint: mainly empty plateau areas, followed by few farmland and grazing areas. Residential areas are outside the Project development area.
No physical resettlement is expected for the development of the Diamba Sud Project. Land impacts due to the Project will primarily be associated with acquisition of land for the Project footprint (open pits, WRSFs, TSF), construction of haul roads, process plant, and other infrastructure. Land loss will be minimized through Project design, reducing impacts to the communities in this area.
The village of Gamba Gamba is located within the DS1 block area boundary, with a small amount of land belonging to Gamba Gamba residents within the footprint of Project
| June 30, 2026 | Page 241 of 291 |
| | Diamba Sud Gold Project, Kédougou Region, Senegal Technical Report |
components. Some loss of cultivated land located within the footprint is expected for Gamba Gamba village lands.
A full Inventory of Loss will be undertaken to formally identify the owners of land and any structures within the Project development area that will be lost as a direct result of the Project. The Inventory of Loss will guide appropriate compensation for losses associated with construction and operation of the Project.
A final Livelihood Restoration Plan will be prepared based on the Inventory of Loss and agreed with local stakeholders and people affected by the Project.
| 20.7.4 | Artisanal Small-Scale Mining |
Artisanal mining is a key livelihood activity for households in the Diamba Sud study area, particularly in the villages of Karakaéné, Gamba Gamba, and Lingueya. In several villages, ASM is ranked as the main subsistence activity, with nearly half of the working population in Gamba Gamba engaged in artisanal mining as their primary occupation. In the Kédougou region, the sector is a significant economic and demographic driver, estimated to produce 4.2 t of gold annually and provide direct employment to over 32,000 people locally. In the Project area, the artisanal mining activities have decreased over the past years due to the current legal exploration activities ongoing, with no artisanal mining activities and settlement in the Project development or fenced in area at the Report effective date.
From an environmental perspective, artisanal mining is identified as the main threat to biodiversity in the study area. Artisanal mining activities have complex impacts, including the creation of deep excavation pits and the potential release of harmful contaminants such as mercury and cyanide into waterways and surrounding soils. These pollutants contribute to declining water quality, putting downstream areas at risk of biodiversity loss. Local authorities have responded by implementing conservation measures to protect affected ecosystems and species.
Aquatic ecosystems are also severely affected by artisanal mining. The Falémé River, in particular, has experienced significant degradation due to intensified ASM activities, which have led to land clearing, bank erosion, and soil loss. The release of mercury and cyanide into the aquatic environment has resulted in water pollution, a decline in fish stocks, and reduced ecosystem functioning, with direct economic impacts on local fishermen. Unsustainable fishing practices, combined with artisanal mining, have further contributed to the decline in aquatic biodiversity.
Artisanal mining is illegal within the permit area, and access to artisanal mining sites has been restricted as part of exploration activities. While numerous active artisanal mining sites exist nearby, none have currently been reported in areas of the Project where Mineral Reserves or Mineral Resources are located. Artisanal mining remains an important livelihood for neighboring communities, especially Gamba Gamba. The Project will restrict access to artisanal mining sites within the permit, but other sites remain accessible in the vicinity. Economic impacts on artisanal mining will be mitigated indirectly by job creation within the proposed operations, including opportunities for service contractors. These jobs will aim to provide alternative sources of income and promote more secure, stable, and sustainable livelihoods. Targeted community development initiatives, such as local employability programs, vocational training, and small business development, are planned to support this transition.
Stakeholder consultations have highlighted concerns about the proposed operation’s impact on artisanal mining and the potential loss of livelihoods. Fortuna’s engagement
| June 30, 2026 | Page 242 of 291 |
| | Diamba Sud Gold Project, Kédougou Region, Senegal Technical Report |
with local communities includes addressing artisanal mining-related concerns and supporting alternative livelihoods.
Fortuna aims to engage with artisanal mining, as needed, within s Senegalese regulations and international guidelines but without compromising the sustainability of its activities. Consequently, the main strategy to appropriately manage artisanal miners’ relationships and achieve business and development goals is, where possible, to minimize broad-ranging indirect negative impacts to communities with social development initiatives and to create a secure environment for company operations within the national framework. Fortuna is committed to:
| · | Periodically following the evolution of the artisanal mining regulation and activities in the mining area. |
| · | Engaging with local artisanal miners, local communities, national and local authorities in a transparent and constructive dialogue. |
| · | Ensuring that the large-scale mining activities will not put the artisanal miners’ safety at risk and vice versa. |
| · | Proactively supporting community investment projects focusing on economic development and other improvements in local communities. |
| · | Providing local communities with fair and reasonable opportunities to participate in the company's workforce and the supply of goods and services, including its subcontractors. |
| 20.7.5 | Community Development Fund |
In accordance with the Senegal’s Mining Code (2016) Article 115, a Community Development Fund will be established and contributed to annually during production. The purpose of the fund is to promote the economic and social development of local communities residing around the mining areas. Under the 2016 Mining Code, mining companies must contribute 0.5% of annual after-tax sales revenue to the Community Development Fund. The actions to be undertaken must be defined in a Local Development Plan in consultation with local communities and administrative authorities.
| 20.8 | Mine Closure Plan |
In accordance with Senegalese regulations and industry best practices, a mine closure plan must be developed for the Project. At this FS stage, the mine closure plan takes the form of a Conceptual Mine Rehabilitation and Closure Plan which presents a general framework and initial implementation plan for the rehabilitation and closure of the proposed Diamba Sud mine.
| 20.8.1 | National Framework |
The 2016 Mining Code is the main legislation governing the mining industry in Senegal. The sections of the code relevant to Mine Closure are as follows:
| · | Article 100 - Commencement and termination of work: Any decision to commence or terminate work for the exploration and exploitation of mineral substances must be declared in advance to the Ministry in charge of mines. |
| · | Article 103 - Rehabilitation of mining sites: Any holder of a mining title is required to rehabilitate the sites covered by that title. |
| June 30, 2026 | Page 243 of 291 |
| | Diamba Sud Gold Project, Kédougou Region, Senegal Technical Report |
| · | Article 104 - Mining rehabilitation guarantee: Notwithstanding the obligations arising from article 103 of this Code, any holder of an exploration permit, an authorization to open and operate a permanent quarry, an authorization to operate a small mine, a mining license or a production sharing contract is required to open and maintain a trust account with a specialized public institution designated by the State. This account is intended to constitute a fund to cover the costs of implementing the environmental management plan. The procedures for operating and replenishing this fund shall be laid down by decree. |
| · | Article 111: As part of the exercise of control over mining operations, the mining administration has the right to have the accounts, installations, infrastructures, systems, and processes of any holder of mining titles audited, including by an independent body. Such audits shall be carried out in accordance with internationally recognized standards and procedures and without hindering the smooth running of mining operations. |
In accordance with the Mining Code, Decree no. 2009-1335: a Mine Rehabilitation and Closure Fund will be created to provide the mechanisms and operational framework for a mine rehabilitation fund.
| 20.8.2 | Conceptual Closure Costs |
The cost estimate for the conceptual closure plan (Table 20.4) is based on benchmarked closure activities costs from equivalent projects in similar legal and natural environments crossed with the mining infrastructure characteristics and current closure assumptions. Costs will be adjusted according to periodic re-evaluation and the real costs recorded during implementation.
Table 20.4 Summary of Closure Costs
| Area | Estimated Cost ($M) |
| Pits | 0.21 |
| Waste dumps | 5.66 |
| ROM and stockpiles | 0.16 |
| Tailings storage facility | 4.86 |
| Processing plant | 2.00 |
| Explosives magazine | 0.16 |
| Social closure | 0.50 |
| Environmental management | 1.00 |
| Total | 14.54 |
Note: Totals may not sum due to rounding
Based on the defined Project and these characteristics, the rehabilitation and closure costs are estimated at $14.5 million.
| 20.9 | Comments on Section 20 |
It is the opinion of the QP that appropriate environmental and social studies have been conducted to date for the Diamba Sud Project to assess the risks and opportunities related to the project as presented.
With careful implementation of the environmental and social management measures such as the Environmental and Social Management and Monitoring Plan, the livelihood restoration program, and the biodiversity action plan, the Project is expected to be
| June 30, 2026 | Page 244 of 291 |
| | Diamba Sud Gold Project, Kédougou Region, Senegal Technical Report |
developed in a way which provides compliance to local regulation, alignment with international industry standards and a net socio-economic benefit to local communities and to Senegal without compromising the integrity of the broader environment.
The design of the Project as envisaged in the PEA was used for the Project environmental and social permitting including the preparation of the ESIA. The formal ESIA process began with the Senegal Government with the submission and approval of the Term of Reference of the ESIA in the first quarter of 2025, followed by the submission of the ESIA for review and approval on October 6, 2025. Attestation of Environmental Conformity no. 535/METE/DIREC/CA/DEE/nfn was issued by DiREC on February 13, 2026, attesting that the Diamba Sud project is compliant with national Environmental Code requirements for impact studies. Formal decree approval of the ESIA was subsequently received from the Senegalese government on June 11 2026 (Decree n°011251 of 22/05/2026 granting the Environmental and Social Compliance Certificate for the Diamba Sud gold project).
The two new components of the project design added in the FS (i.e. the airstrip and the solar power plant) are expected to require additional Environmental and Social permitting i.e., impact studies or impact notices. Relevant national authorities including DiREC have been contacted to clarify the permitting pathway, with permitting deemed feasible and planned to start in the second half of 2026.
| June 30, 2026 | Page 245 of 291 |
| | Diamba Sud Gold Project, Kédougou Region, Senegal Technical Report |
| 21 | Capital and Operating Costs |
| 21.1 | Capital Cost Estimates |
The total initial capital cost for the Diamba Sud Project was estimated at $397.5 million, with an expected accuracy range of -15% to +15%, consistent with an AACE Class 3 estimate.
The estimate was based on an engineering, procurement, and construction management (EPCM) execution strategy, under which the Owner assumes overall Project delivery risk. Accordingly, the estimate excludes a builder’s margin.
The capital cost estimate consisted of the following principal components:
| · | Process plant and associated infrastructure, prepared by Lycopodium Minerals Canada Ltd. (Lycopodium), including mechanical, structural, and general plant infrastructure, with electrical and instrumentation components prepared by ECG Engineering. |
| · | Owner’s capital, which included mining pre-production, major infrastructure, and supporting project costs. These estimates were developed by Fortuna based on experience from its operating assets and recent project developments, including pricing from early works tenders for the Diamba Sud Project. Key infrastructure estimates were supported by Knight Piésold, based on engineered quantities and, where applicable, recently tendered 2026 rates. |
| · | Withholding taxes, duties, and levies applicable to the Project. |
| · | Contingency, representing approximately 8% of the total project capital cost and considered appropriate for a feasibility study-level estimate. |
A summary of the capital cost estimate by area is presented in Table 21.1.
Table 21.1 Summary of Capital Cost Estimate
| Area | Capital Cost ($M) |
| Construction costs | 284.6 |
| Pre-production costs (excluding mining) | 37.7 |
| Mining pre-stripping | 34.4 |
| Contingency (8%) | 33.7 |
| Withholding taxes, duties, levies | 7.0 |
| Total | 397.5 |
Note: numbers may not sum due to rounding
| 21.1.1 | Basis of Estimate Assumptions and Clarifications |
The estimate is based on an EPCM execution strategy, under which the Owner manages the engineering, procurement, and construction activities and assumes overall project delivery risk.
The base date for the estimate is Q2 2026, with all costs expressed in United States dollars unless otherwise stated. No allowance has been made for escalation beyond this date.
The estimate is based on a combination of:
| June 30, 2026 | Page 246 of 291 |
| | Diamba Sud Gold Project, Kédougou Region, Senegal Technical Report |
| · | Vendor quotations for major mechanical and electrical equipment. |
| · | Budget pricing and historical cost data from Lycopodium and other project participants for similar projects in West Africa. |
| · | Recently tendered contractor rates, including pricing obtained through Diamba Sud early works programs. |
| · | First principles estimating and quantity take-offs derived from engineering deliverables, layouts, and design development. |
| · | Fortuna operating experience in West Africa, including cost data from its producing operations and recent project developments, where applicable. |
| · | In-country procurement and project teams, which have obtained supplier quotations for selected equipment and services (including mobile equipment), where applicable. |
Pricing reflects prevailing market conditions in West Africa and is considered representative of costs at the time of estimate preparation.
An appropriate contingency has been applied to the capital cost estimate, commensurate with the level of definition and accuracy of the feasibility study. Contingency is intended to account for uncertainties within the defined project scope and excludes escalation and changes in scope.
The estimate excludes:
| · | Escalation beyond the base date. |
| · | Financing costs and interest during construction; |
| · | Exchange rate fluctuations. |
| · | Taxes and duties, except where explicitly included. |
| · | Owner’s sunk costs incurred prior to project approval. |
The following sub-sections present the assumptions and clarifications that apply to the capital cost estimates:
| 21.1.2 | Process Plant Capital Cost Estimate |
The process plant capital cost estimate was prepared by Lycopodium based on the process design and engineering developed for the FS. The estimate included the process plant and associated infrastructure, including mechanical, structural, piping, and bulk materials, with electrical and instrumentation components prepared by ECG Engineering.
The estimate was based on detailed engineering deliverables, including equipment lists, general arrangement drawings, and a 3D plant layout, which were used to support the development of quantities and installation requirements. Material take-offs and first principles estimating were applied where appropriate, supplemented by Lycopodium’s database of historical project costs for similar gold processing facilities in West Africa.
Pricing for major mechanical equipment was obtained through vendor budget quotations, with supplementary pricing derived from historical data and budget pricing where vendor quotes were not available. Installation costs were developed based on estimated installation hours and regional labor rates, consistent with similar projects.
| June 30, 2026 | Page 247 of 291 |
| | Diamba Sud Gold Project, Kédougou Region, Senegal Technical Report |
The process plant capital cost estimate was initially completed in October 2025. As part of the FS, the estimate was subsequently benchmarked and validated against vendor quotations and pricing developed during a parallel FEED study completed in the second quarter of 2026. This comparison confirmed that the updated vendor pricing was broadly consistent with the original feasibility study estimate and did not require material escalation.
The process plant capital cost estimates are included within the overall project capital as summary presented in Table 21.1, with a more detailed breakdown presented in Table 21.2.
Table 21.2 Summary of Capital Cost Estimate for the Process Plant
| Area | Supply Cost ($M) |
Freight Cost ($M) |
Installation Cost ($M) |
Contingency ($M) |
Total ($M) |
| Construction Distributable | 25.5 | - | - | 4.1 | 29.6 |
| Treatment Plant Cost | 43.5 | 6.0 | 8.6 | 8.4 | 66.4 |
| Critical Spares | 2.0 | - | - | - | 2.0 |
| Insurance Spares | 2.0 | - | - | - | 2.0 |
| Reagents & Plant Services | 17.0 | 1.6 | 3.7 | 2.8 | 25.1 |
| First Fills | 0.7 | - | - | 0.1 | 0.8 |
| Opening Stock (consumables) | 1.6 | - | - | 0.2 | 1.8 |
| Infrastructure | 11.0 | 1.6 | 3.0 | 1.9 | 17.5 |
| Management Costs | 34.9 | 0.0 | 0.1 | 0.2 | 35.2 |
| Project Escalation | 1.3 | 1.3 | |||
| Sub Total | 139.4 | 9.1 | 15.4 | 17.7 | 181.7 |
Note: numbers may not sum due to rounding
| 21.1.3 | Owners Capital Cost Estimate |
The Owner’s capital cost estimate consisted of mining pre-production, major project infrastructure, and supporting costs required for Project execution and operational readiness. These estimates were developed by Fortuna, supported by Knight Piésold for key infrastructure components including the, water storage dam, site roads, and surface water management systems.
The thermal power plant estimate was provided by African Power Services, with technical input and oversight from ECG Engineering. Other Owner’s capital costs were developed by Fortuna based on internal estimates, operational experience, and recent project data. The accommodation camp forms part of the early works program and construction has commenced.
The Owner’s capital cost components are included within the overall project capital as summary presented in Table 21.1, with a more detailed breakdown summarized in Table 21.3.
Table 21.3 Summary of Capital Cost Estimate or the Owners
| Area | Capital Cost ($M) |
Contingency | Sunk Capital ($M) |
Total ($M) |
| Owners Costs | ||||
| Tailings Storage Facility | 29.3 | 15% | - | 33.7 |
| Power Plant | 38.9 | 5% | 5.1 | 35.5 |
| Power Plant BEW | 2.0 | 5% | - | 2.1 |
| Mining Pre-Production | 34.4 | 5% | - | 36.1 |
| June 30, 2026 | Page 248 of 291 |
| | Diamba Sud Gold Project, Kédougou Region, Senegal Technical Report |
| Area | Capital Cost ($M) |
Contingency | Sunk Capital ($M) |
Total ($M) |
| Water Storage Dam | 11.1 | 15% | 1.9 | 10.6 |
| Water Harvesting Dam | 1.5 | 15% | - | 1.8 |
| Camp | 18.3 | 5% | 5.6 | 13.3 |
| Land Compensation | 2.0 | 5% | - | 2.1 |
| Site Roads | 10.4 | 15% | 0.8 | 10.9 |
| Surface Water Management | 1.6 | 15% | - | 1.8 |
| Perimeter Fence | 1.3 | 5% | 0.7 | 0.6 |
| Security / Communications | 3.5 | 15% | - | 4.1 |
| Communications | 0.6 | 15% | - | 0.7 |
| Infrastructure EPCM | 3.2 | 15% | - | 3.6 |
| Operational Readiness | 3.2 | 5% | - | 3.4 |
| Pre-Production Labor | 12.1 | 5% | 0.7 | 12.0 |
| Pre-Production G&A | 13.3 | 5% | 0.7 | 13.2 |
| Owner’s Project Management | 16.8 | 5% | 3.0 | 14.5 |
| Groundwater Pipes & Pumps | 1.0 | 0% | - | 1.0 |
| Fuel Farm | 1.8 | 15% | - | 2.1 |
| Customs, Duties & Taxes | 7.0 | 0% | - | 7.0 |
| Owner Vehicles & Equipment | 6.7 | 13% | 1.7 | 5.6 |
| Sub-Total Owners Costs | 219.9 | 7% | 20.1 | 215.8 |
| Total Project Costs | 397.5 |
| 21.1.4 | Estimating Methodology |
The capital cost estimate was developed using a combination of detailed engineering quantities, benchmarked data, and first principles estimating.
Engineering deliverables, including general arrangement drawings, equipment lists, and 3D layout models, were used to support the development of quantities for major disciplines including earthworks, concrete, structural steel, mechanical equipment, piping, and electrical systems. These quantities were derived through a combination of material take-offs, estimating based on similar projects, and factored allowances where detailed design information was not available.
Quantity development was classified according to the level of definition, including:
| · | Material take-offs (MTOs): quantities derived directly from detailed drawings and models. |
| · | Estimated: quantities derived from preliminary layouts, sketches, or benchmarking against similar projects. |
| · | Factored: quantities derived using standard factors or ratios based on experience from comparable operations. |
| · | Allowance: lump sum provisions for scope areas that are defined but not yet quantified in detail. |
A summary of the derivation of quantities by discipline is provided in Table 21.4, with associated design allowance factors presented in Table 21.5.
| June 30, 2026 | Page 249 of 291 |
| | Diamba Sud Gold Project, Kédougou Region, Senegal Technical Report |
Table 21.4 Derivation of Quantities
| Classification | MTO Prepared | Factored |
| Earthwork | 100% | - |
| Concrete | 100% | - |
| Structural Steel | 100% | - |
| Platework | 100% | - |
| Mechanical Equipment | 100% | - |
| Process Piping | - | 100% |
| Overland Piping | 100% | - |
| Electrical Bulks | 100% | - |
| Electrical Equipment | 100% | - |
| Instrumentation and Control | - | 100% |
| Buildings | 100% | - |
Table 21.5 Design Growth by Discipline
| Discipline | Design Growth |
| Earthworks | 15% |
| Concrete | 10% |
| Steel | 10% |
| Platework | 10% |
| Mechanical | N/A |
| Overland Piping | - |
| Cables | 5% |
| Cable Tray | 5% |
| Instrumentation | - |
| Buildings | N/A |
Quantities and cost estimates were benchmarked against similar gold processing and infrastructure projects in West Africa, and adjusted where required to reflect the specific scope, location, and execution strategy for the Diamba Sud Project.
| 21.1.5 | Pricing Basis |
The capital cost estimate is subject to the following key assumptions:
| · | The Project will be executed under an EPCM delivery model, with the Owner managing engineering, procurement, and construction activities. |
| · | Mining operations will be undertaken by an experienced mining contractor, with pre-production activities including bulk earthworks incorporated within mining capital. |
| · | Geotechnical conditions for major infrastructure and plant foundations are based on site investigations completed to feasibility study level and are considered representative for design and costing. |
| · | Labor availability in Senegal and the surrounding region is assumed to be sufficient to support the Project construction schedule, with labor rates and productivity based on historical project data in West Africa. |
| June 30, 2026 | Page 250 of 291 |
| | Diamba Sud Gold Project, Kédougou Region, Senegal Technical Report |
| · | Construction will be supported by existing and planned site infrastructure, including accommodation camp facilities, which are assumed to be available to meet workforce requirements. |
| · | Certain equipment and facilities previously procured by Fortuna are excluded from the capital cost estimate where applicable. |
| · | The estimate assumes that suitable construction materials, including earthworks materials, are available locally within reasonable haulage distances. |
| · | Process plant design and associated infrastructure are based on feasibility study level engineering, supported by testwork, historical project data, and engineering judgement. |
A summary of the sources of supply pricing by discipline, including the proportion of actual, budgetary, and estimated costs, is provided in Table 21.6, demonstrating a high proportion of pricing based on recent contracts and vendor quotations.
Table 21.6 Supply Cost Source
| Classification | Total Supply Cost $ |
Allowance/Factored | Estimated/Database Pricing |
Budgetary Quote |
Actuals |
| Earthworks | 3,330,298 | - | 4% | - | 96% |
| Concrete | 13,813,789 | - | - | - | 100% |
| Steelwork | 3,027,856 | 1% | - | - | 99% |
| Platework | 8,775,646 | 11% | 1% | - | 88% |
| Mechanical | 32,722,878 | 3% | 42% | 37% | 18% |
| Piping | 10,638,945 | 30% | 35% | - | 35% |
| Electrical | 12,974,643 | - | 19% | 81% | - |
| Instrumentation & Control | 1,164,676 | - | - | 100% | - |
| Buildings & Architectural | 6,386,099 | 21% | 79% | - | 96% |
| 21.2 | Operating Cost Estimates |
The mining operating costs were developed based on requests for quotations (RFQs) obtained from reputable mining contractors with experience in West Africa, including current operating experience in Senegal. Processing operating costs were developed based on metallurgical test work, first-principles estimates, and other factors derived from historical operating cost data from previous Fortuna operations in Burkina Faso and the currently operating Séguéla Mine in Côte d’Ivoire.
The LOM operating costs are presented in Table 21.7, with subsequent sub-sections providing detailed breakdowns of the cost estimates.
Table 21.7 Life-of-Mine Operating Cost Estimate
| Operating Cost | $M | $/t milled | $/payable oz |
| Mining** | 699 | 34.12 | 664 |
| Processing | 330 | 16.09 | 313 |
| G&A | 177 | 865 | 168 |
| Total operating costs excluding Royalties and Social Fund | 1,207 | 58.86 | 1,146 |
| Refining | 3 | 0.15 | 3 |
| Royalties* | 111 | 5.39 | 105 |
| Social Fund* | 18 | 0.90 | 18 |
| Total Operating costs including Royalties and Social Fund | 1,339 | 65.30 | 1,272 |
| *The FS assumes a 3% royalty payable to the State and 0.5% contribution to a Social Development Fund **Mining $/t milled includes pre-production ore tonnes mined (314,840 tonnes) | |||
| June 30, 2026 | Page 251 of 291 |
| | Diamba Sud Gold Project, Kédougou Region, Senegal Technical Report |
| 21.2.1 | Process Plant Operating Costs |
The processing operating costs were developed from testwork, first principles. and from Lycopodium’s database using typical industry standards applicable to gold processing plants in West Africa. General and administration costs were factored from historical operating cost data from the development and operation of Fortuna’s previously-owned Yaramoko Mine in Burkina Faso, Fortuna’s currently-owned Séguéla Mine in Côte d’Ivoire, as well as quoted services in Senegal and was supplied as an input into the processing plant operating cost. Operating costs were estimated with an accuracy range of ±15, and were current at Q1, 2026.
The calculated operating cost for the processing plant at a design oxide throughput of 2.5 Mt/a was $16.37/t processed excluding G&A costs.
The calculated operating cost for the process plant at a design fresh throughput of 2.0 Mt/a was $19.76/t processed excluding G&A costs. Projected operating costs for the Project are detailed in Table 21.8 (oxide) and Table 21.9(fresh).
Table 21.8 Oxide Ore Operating Cost Estimate
| Area | Cost ($/t Processed) | Annual Cost ($M) |
| Operating Consumables | 6.12 | 15.29 |
| Plant Maintenance | 0.48 | 1.20 |
| Laboratory | 0.40 | 1.00 |
| Power | 4.98 | 12.45 |
| Labor (Plant) | 4.39 | 10.98 |
| Subtotal - Plant | 16.37 | 40.93 |
| Labor (Admin) | 2.27 | 19.09 |
| G&A - Expenses | 5.36 | 13.41 |
| Subtotal – G&A | 7.64 | 19.09 |
| Total | 24.01 | 60.02 |
Table 21.9 Fresh Ore Operating Cost Estimate
| Area | Cost ($/t Processed) | Annual Cost ($M) |
| Operating Consumables | 7.23 | 14.51 |
| Plant Maintenance | 0.78 | 1.56 |
| Laboratory | 0.50 | 1.00 |
| Power | 6.66 | 13.31 |
| Labor (Plant) | 4.49 | 9.19 |
| Subtotal - Plant | 19.76 | 39.52 |
| Labor (Admin) | 2.62 | 5.24 |
| G&A - Expenses | 6.70 | 13.41 |
| Subtotal – G&A | 9.33 | 18.65 |
| Total | 29.09 | 58.17 |
Consumables
Reagent consumptions were based on metallurgical testwork, whilst grinding media consumption was advised by OMC based on modelling and mineralization properties from testwork.
Reagent and grinding media costs were based on supplier quotes.
| June 30, 2026 | Page 252 of 291 |
| | Diamba Sud Gold Project, Kédougou Region, Senegal Technical Report |
Crusher wear parts and mill liner consumption rates were advised by OMC and updated based on Lycopodium’s reference projects with similar properties, and costs were obtained from the Lycopodium database.
Other consumables like screen panels and cyclone wear rates were referenced from similar gold plant operations, and cost was taken from the Lycopodium database.
Diesel consumption was estimated based on vendor inputs and mobile equipment data.
Maintenance
Maintenance costs for the plant were estimated from the installed plant and infrastructure capital costs using industry standard ratios. Due to the inclusion of liners, panels, and cyclone spares in the consumables, the ratios were slightly adjusted to avoid overestimating maintenance costs.
The maintenance cost for oxide operation was based on the equipment required during oxide treatment and therefore excluded the pebble crusher and thickener from the capital cost used. The full plant capital cost was applied for the fresh operation maintenance cost calculation.
Contract maintenance costs were derived based on the expected number of mill liner change-outs per year. This was estimated using consumption rates provided by OMC, which are based on the ore properties.
Mobile Equipment
The mobile equipment and light vehicle fleet for process, maintenance, mining, and administration were estimated by Fortuna from previous operational experience. The estimate assumes that all vehicles will be owned by Fortuna. The cost of fuel was included in the estimate from the annual usage and fuel rate for each vehicle type. Fuel consumption was estimated by Fortuna based on vehicle performance specifications, and usage hours were assumed.
Power
Installed power summaries were developed based on equipment selection and installed powers, as detailed in the mechanical equipment list and load list provided by ECG Engineering. Operating and load factors were applied to determine the actual power requirements. The cost of power ($0.133/kWh) was taken from the Diamba Sud Power optimization study completed by ECG Engineering, and based on a hybrid system of solar and HFO generator-powered powerhouse.
Water Supply
The operating costs of the water supply and distribution within the plant were included within the power, maintenance, and consumables sections.
Labor
Labor was considered in two phases, oxide, and fresh. This was done to account for the higher use of expatriate labor in the initial years, with a transition to increased local labor thereafter and removal of the expatriates. All labor numbers and costs were provided by Fortuna. The salaries were based on current market knowledge and experience from similar projects.
| June 30, 2026 | Page 253 of 291 |
| | Diamba Sud Gold Project, Kédougou Region, Senegal Technical Report |
General & Administration costs
General and administrative costs covered the fixed operational overhead for the planned operation. This included:
| · | Country office and site office: computers, stationery, maintenance, utilities, postage, and software. |
| · | Insurance. |
| · | Financial costs: banking charges, legal fees, auditing fees, and accounting consultants. |
| · | Mining lease and rental fees. |
| · | Human resources activities. |
| · | Personnel requirements: visas, medicals, accommodation and travel, training. |
| · | Contracts and procurement. |
| · | Health, safety, environment, and community. |
| · | Community social responsibility. |
| · | Environmental. |
| · | General costs security and camp power. |
| · | Local content. |
All general and administrative costs were provided by Fortuna, based on the company’s previously-owned Yaramoko operation in Burkina Faso and the currently-operating Seguela mine in Côte d’Ivoire, as well as on ongoing refinement of Project details.
Laboratory costs
A laboratory services fee was estimated from the Lycopodium database based on comparable gold projects. The estimate was increased by 5% to account for potential cost variations and additional allowances.
Process plant operating cost exclusions
The processing cost estimate is exclusive of:
| · | All sunk costs (for example, studies, testwork and drilling costs). |
| · | ROM Stockpile rehandling costs. |
| · | Government monitoring/compliance costs. |
| · | Gold refining costs. |
| · | Bullion transport costs including security staff for the transport of bullion. |
| · | Bullion marketing costs. |
| · | Bullion insurance in transit costs. |
| · | External government required monitoring and compliance costs. |
| · | Rehabilitation or closure costs. |
| June 30, 2026 | Page 254 of 291 |
| | Diamba Sud Gold Project, Kédougou Region, Senegal Technical Report |
| · | First fill/opening stocks are captured in capital cost estimate. |
| · | Taxes. |
| · | Any impact of foreign exchange rate fluctuations. |
| · | Escalation from the date of estimate. |
| · | Contingency allowance. |
| · | Mining costs. |
| 21.2.2 | Mine Operating Costs |
Mining operating costs were derived from prices submitted in a request for quotation (RFQ) process to West African contractors. The average of all five RFQ submissions was used to generate the FS mining costs, resulting in an overall mining operating cost estimate of $4.79/t mined. This operating mining cost estimate excluded capital items such as mobilization, site establishment, pre-stripping, and other one-time development activities. The breakdown of mining costs into capital and operating by cost center is shown in Table 21.10.
Table 21.10 Mining Operating Cost Breakdown
| Cost | Total Mining Activity Costs |
Mining Capital Costs |
Mining Operating Costs | ||
| $M | $/t | $M | $M | $/t | |
| Mobilization and Establishment | 15.0 | 0.10 | 15.0 | 0.00 | |
| Mine Development | 7.5 | 0.05 | 1.1 | 6.4 | 0.04 |
| Load and Haul - Waste | 237.1 | 1.58 | 7.1 | 230.1 | 1.57 |
| Load and Haul - Ore | 52.0 | 0.35 | 0.8 | 51.2 | 0.35 |
| Drilling Blast Holes | 50.3 | 0.34 | 1.2 | 49.2 | 0.34 |
| Blasting | 68.2 | 0.45 | 1.8 | 66.3 | 0.45 |
| Grade Control | 14.0 | 0.09 | 0.2 | 13.8 | 0.09 |
| Waste Overhaul to ROM const. | 0.8 | 0.01 | 0.8 | ||
| Fuel Consumption | 169.0 | 1.13 | 4.1 | 164.9 | 1.13 |
| Contractor Fixed Cost | 64.6 | 0.43 | 1.7 | 62.8 | 0.43 |
| Mining Owner Cost | 52.2 | 0.35 | 0.8 | 51.5 | 0.35 |
| Rehandle Low Grade to ROM | 2.8 | 0.02 | 2.8 | 0.02 | |
| Mining Costs | 733.4 | 4.89 | 34.5 | 698.9 | 4.79 |
| Total Movement tonnes (Ore + Waste) |
150.1 Mt | 4.0 Mt | 146.1 Mt | ||
| 21.3 | Sustaining Capital Costs |
Projected sustaining capital costs for the proposed LOM are summarized in Table 21.11, and total $64 million. Sustaining capital costs included all investments in mine development, equipment and infrastructure necessary to maintain the mine facilities and sustain operational continuity. Sustaining capital costs were split into two main areas; equipment and infrastructure; and mine closure and site rehabilitation.
| June 30, 2026 | Page 255 of 291 |
| | Diamba Sud Gold Project, Kédougou Region, Senegal Technical Report |
Table 21.11 Summary of Projected Major Sustaining Capital Costs for the LOM
| Projects | Y1 | Y2 | Y3 | Y4 | Y5 | Y6 | Y7 | Y8 | Y9 | Y10 | Total |
| TSF lifts ($M) | 10.7 | - | 8.1 | - | 8.8 | - | 3.8 | - | - | - | 31.5 |
| Aerodrome ($M) | 5.0 | - | - | - | - | - | - | - | - | - | 5.0 |
| Roads ($M) | - | 1.7 | 0.5 | - | 0.7 | - | 0.4 | - | - | - | 3.3 |
| Surface water management ($M) | - | 0.4 | 0.8 | - | 0.9 | - | - | - | - | - | 2.1 |
| PV + BESS ($M) | 16.4 | - | - | - | - | - | - | - | - | - | 16.4 |
| Fuel farm ($M) | 0.8 | 0.8 | 0.8 | 0.8 | 0.8 | 0.8 | 0.8 | - | - | - | 5.8 |
| Total ($M) | 32.9 | 2.9 | 10.2 | 0.8 | 11.2 | 0.8 | 5.1 | - | - | - | 64.0 |
| 21.3.1 | TSF Lifts |
The TSF sustaining capital estimate was based on staged expansion designs prepared by Knight Piésold to support the planned LOM tailings deposition requirements. Stage 1 was designed with capacity for the first 12 months of operations, with Stage 2 commencing in Year 1 of operations and subsequent raises scheduled thereafter to support ongoing tailings storage requirements. The estimate incorporated engineered quantities for embankment raises, containment works, and associated tailings infrastructure, with unit rates derived from recent tender pricing received for the Project.
| 21.3.2 | Aerodrome |
The aerodrome sustaining capital estimate allowed for construction commencing in Year 1 of operations and included both the aerodrome and the associated access roads. The aerodrome scope and location were based on the FS siting study and option analysis completed to support selection of the preferred site and configuration. Quantities and cost estimates were developed by Knight Piésold based on the adopted design basis, with unit rates derived from recent2026 tenders.
| 21.3.3 | Roads |
The roads sustaining capital estimate included the light vehicle and haul roads required in later years of the Project as additional pits are incorporated into the mine plan, including Karakara, Moungoundi, Western Splay, and Kassassoko. The scope covered the progressive construction of access and haulage infrastructure needed to connect these mining areas to the broader site road network and support ongoing operations. Quantities and cost estimates were developed by Knight Piésold based on the planned road layouts and design assumptions, with unit rates derived from recent 2026 tenders.
| 21.3.4 | Surface Water Management |
The surface water management sustaining capital estimate provided for the progressive implementation of drainage, diversion, and sediment control infrastructure required to support ongoing mine development and operations over the LOM, including the construction of channels, bunds, culverts, and associated water management structures to manage runoff and protect site infrastructure. Quantities and cost estimates were developed by Knight Piésold based on the adopted design basis and planned layouts, with unit rates derived from recent 2026 tenders.
| 21.3.5 | Solar Farm |
The solar photovoltaic and battery energy storage system sustaining capital estimate assumes construction and commissioning in Year 1 of operations, as early in the life of
| June 30, 2026 | Page 256 of 291 |
| | Diamba Sud Gold Project, Kédougou Region, Senegal Technical Report |
mine as practicable to maximize operational and cost benefits. The estimate was provided by ECG Engineering based on the adopted design basis for the solar and storage systems.
| 21.3.6 | Fuel Farm |
The fuel farm is planned to be commissioned prior to the power plant to ensure fuel supply is available to support initial site operations. It was assumed to be delivered under a financing arrangement, with capital costs repaid over a seven-year period. The costs and payment structure were benchmarked against Fortuna’s Séguéla operations.
| 21.4 | Comment on Section 21 |
The capital and operating cost provisions for the LOM plan that supports the FS were reviewed. The basis for the estimates is appropriate for the known mineralization, proposed mining and production schedules, marketing plans, and equipment replacement and maintenance requirements.
The QP considers the capital and operating costs estimated for the Diamba Sud Project as reasonable based on industry-standard practices and estimated costs in 2026.
Expatriate workers were selected at senior level and above. There may be an opportunity to lower expatriate personnel numbers throughout the LOM to reduce operating costs and align with government expectations, should the required experienced personal be found within Senegal.
| June 30, 2026 | Page 257 of 291 |
| | Diamba Sud Gold Project, Kédougou Region, Senegal Technical Report |
| 22 | Economic Analysis |
| 22.1 | Methodology |
The Project was valued using a discounted cash flow (DCF) approach with a 5% discount rate, consistent with gold industry practice and peer-company valuation benchmarks. This required projecting monthly cash inflows, or revenues, and subtracting yearly outflows such as operating costs, capital costs, royalties, federal taxes, etc. The resulting net cash flows were discounted back to the date of valuation (start of construction) to determine net present values (NPVs) at the selected discount rates. The internal rate of return (IRR) was calculated as the discount rate that yields a zero NPV.
The results of the economic analysis represent forward-looking information that are subject to a number of known and unknown risks, uncertainties and other factors that may cause actual results to differ materially from those presented here (see forward-looking information discussion at the front of this Report).
| 22.2 | Assumptions |
Table 22.1 shows the key assumptions used in the economic analysis.
Table 22.1 Key Economic Assumptions
| Parameter | Units | Value |
| Gold Price | $/oz | 3,500 |
| Mill Recovery | % | 91 |
| Power Price | $/kWh | 0.13 |
| Base Case Discount Rate | % | 5 |
| Exchange Rate | ||
| West African Franc to US dollar | x | 0.0018 |
| Royalty | ||
| Government | % | 3.0 |
| Social Fund | % | 0.5 |
| Investment Tax Credit | % | 40 |
Upon the grant of the exploitation permit, the State of Senegal is entitled to a 10% free-carried interest in the operating entity. In addition, the State has the right to acquire up to an additional 25% contributory interest in the operating entity at a fair price as determined through an independent valuation.; however, the economic analysis is presented on a 100% project basis.
The FS assumes the amount of royalties and taxes payable to the State, including that the royalty payable on production to the State is 3% and that the investment tax credit is 40%, in accordance with the provisions of the Mining Convention between Boya and the State of Senegal dated April 8, 2015, and the 2003 Mining Code. The State retains the sovereign prerogative to review or revisit certain fiscal terms, including among others, royalties and taxes payable, during the exploitation permit approval process, and as such, the current framework may be subject to amendment.
| June 30, 2026 | Page 258 of 291 |
| | Diamba Sud Gold Project, Kédougou Region, Senegal Technical Report |
| 22.3 | Summary |
The results of the forecast economic analysis are shown in Table 22.2.
Table 22.2 Forecast Economic Analysis Summary
| Metrics | Units | Results |
| Gold Price | $/oz | 3,500 |
| Life of mine | years | 9.4 |
| Processing duration | years | 9.1 |
| Total mineralized material mined | kt | 20.5 |
| Contained gold in mineralized material mined | koz | 1,151 |
| Strip ratio | Waste: Ore | 6.3 |
| Throughput - Oxide | Mt/a | 2.5 |
| Throughput - Fresh | Mt/a | 2.0 |
| LOM grade | g/t | 1.75 |
| Recoveries | % | 91 |
| Gold production | ||
| Total production over LOM | koz | 1,053 |
| Average annual production over LOM | koz | 116 |
| Average annual production over first 4 years | koz | 158 |
| Per Unit Costs LOM | ||
| Mining | $/t, mined | 4.78 |
| Processing | $/t, processed | 16.1 |
| G&A | $/t, processed | 8.6 |
| Cash costs 1 | ||
| Average operating cash costs over LOM | $/oz | 1,146 |
| Average operating cash costs over first 4 years | $/oz | 856 |
| AISC 1 | ||
| Average AISC over LOM | $/oz | 1,332 |
| Average AISC over first 4 years | $/oz | 1,056 |
| Capital costs | ||
| Initial capital expenditure | $M | 398 |
| Sustaining capital expenditure + infrastructure (includes closure costs) | $M | 79 |
| Returns | ||
| NPV5%, pre-tax (100% Project basis) | $M | 1,379 |
| Pre-tax IRR | % | 70 |
| NPV5%, after-tax (100% Project basis) | $M | 1,009 |
| After-tax IRR | % | 60 |
| After Tax Payback Period | years | 1.0 |
| Annual EBITDA 1 | ||
| Average EBITDA over LOM | $M | 258 |
| Average EBITDA over first 4 years | $M | 398 |
Notes:
| 1. | The pit optimization shells used for the Mineral Reserves were generated using a gold price of $2,900/oz. | |
| 2. | This is a non-IFRS financial measure. The definition and purpose of this non-IFRS financial measure is included under the heading “Cautionary Note on Non-IFRS Measures” in this news release. Non-IFRS financial measures have no standardized meaning under the International Financial Reporting Standards (IFRS) and therefore, may not be comparable to similar measures presented by other issuers. |
| June 30, 2026 | Page 259 of 291 |
| | Diamba Sud Gold Project, Kédougou Region, Senegal Technical Report |
| 3. | Average operating cash costs and average AISC represent costs for projected production for the LOM at the time of gold sales. |
| 4. | The FS is presented on a 100% project basis. However, upon the granting of the exploitation permit, the State of Senegal is entitled to a 10% free-carried interest in the operating entity, and has the right to acquire up to an additional 25% contributory interest in the operating entity at a “fair price” as determined through an independent valuation. |
| 5. | The economic analysis was carried out using a discounted cash flow approach on a pre-tax and after-tax basis, based on a gold price of $3,500/oz. |
| 6. | The IRR on total investment that is presented in the economic analysis was calculated assuming a 100% ownership in Diamba Sud. |
| 7. | The NPV was calculated from the after-tax cash flow generated by the Project, based on a discounted rate of 5%. |
| 8. | The FS assumes that the percentage of certain royalties and taxes payable to the State, the percentage of the investment tax credit available to the operating entity. and the percentage payable to the social development fund will be in accordance with the provisions of the Mining Convention between Boya S.A. and the State of Senegal dated April 8, 2015. There can be no assurance that such provisions will not be renegotiated by the State as part of the exploitation permit approval process. |
| 9. | Processing duration represents the period over which mineralized material is processed through the plant and excludes pre-production mining and stockpile build-up periods. |
The pre-tax net present value with a 5% discount rate (NPV5%) is $1,379 million and with an IRR of 70% using a base gold price of $3,500/oz. The economic analysis assumes that Fortuna will provide all development funding via inter-company and shareholder loans to the mine operating entity, which will be repaid with interest from future gold sales.
Post-tax Project NPV5% is $1,009 million, with an IRR of 60% and a payback period of one year at a gold price of $3,500/oz. The payback period is defined as the time after process plant start-up that is required to recover the initial expenditures incurred developing the Diamba Sud Project.
The cashflow analysis was prepared on a constant 2026 US dollars basis. No inflation or escalation of revenue or costs were incorporated.
| 22.4 | Forecast Production and Mill Feed |
The annual mine production and mill feed schedule is shown in Figure 22.1 (Year 10 is a partial year). LOM mill feed will total 20.5 Mt ore at an average gold grade of 1.75 g/t Au. Mill feed commences in Year 1 and continues for 9.1 years.
Figure 22.1 Diamba Sud FS Production Profile
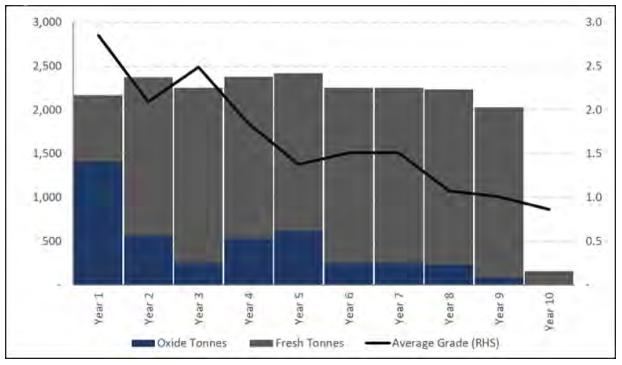
Figure prepared by Fortuna, 2026
| June 30, 2026 | Page 260 of 291 |
| | Diamba Sud Gold Project, Kédougou Region, Senegal Technical Report |
The Project will consist of the concurrent exploitation of multiple deposits, including Area A, Area D, Karakara, Western Splay, Kassassoko, Moungoundi, and Southern Arc. The overall strategy is to have staged overlapping production from these deposits to achieve a total production rate of 2.5 Mt/a during initial high oxide throughput (3 years) and 2.0 Mt/a thereafter. An ore stockpile will be maintained throughout the mine life. The stockpile size will average about five months of production, serve as a buffer between mining and process plant operation and serve as storage for lower-grade ore to be processed later in the mine life. Table 22.3 includes annual estimates of recovered gold, based on the projected overall process recovery estimate of 91% (see Section 13). Year 10 is a partial year. Recovered gold is estimated to total 1,053 koz over the mine life, for an average of 116 koz per year over the 9.1-year processing period.
Table 22.3 Estimate of Recovered Gold for the Diamba Sud Project
| Parameter | Unit | LOM Total |
Year 0 | Year 1 | Year 2 | Year 3 | Year 4 | Year 5 | Year 6 | Year 7 | Year 8 | Year 9 | Year 10 |
| Tonnes mined | kt | 20,500 | 315 | 3,173 | 1,635 | 2,396 | 3,006 | 2,430 | 1,599 | 2,939 | 1,112 | 1,845 | 49 |
| Tonnes milled | kt | 20,500 | - | 2,166 | 2,374 | 2,250 | 2,376 | 2,416 | 2,250 | 2,250 | 2,231 | 2,031 | 155 |
| Gold mill feed grade | g/t | 1.75 | - | 2.85 | 2.09 | 2.49 | 1.84 | 1.38 | 1.51 | 1.51 | 1.07 | 1.01 | 0.86 |
| Gold recovery | % | 91 | - | 93 | 93 | 94 | 93 | 87 | 93 | 90 | 86 | 87 | 86 |
| Gold recovered | koz | 1,053 | - | 184 | 149 | 169 | 131 | 93 | 101 | 98 | 67 | 57 | 4 |
| 22.5 | Cost Estimates |
| 22.5.1 | Capital and Operating Costs |
Capital and operating cost estimates are presented in Section 21 of this Report. Initial capital is estimated at $397.5 million (including $33.7 million contingency) with an additional $64 million of sustaining capital and $14.5 million of closure costs over the 9.4 year LOM.
LOM total operating costs average $65.30/t milled.
The electricity price is based on a self-owned power plant running on a hybrid HFO diesel and Solar PV + BESS.
| 22.5.2 | Closure and Salvage Value |
Total mine closure cost is estimated at $14.5 million, including $5.1 million for progressive rehabilitation, $8.7 million for active closure, and $0.7 million for passive closure.
No allowances for salvage value of process plant equipment or other equipment and facilities are included in the economic evaluation.
| 22.5.3 | Working Capital |
Working capital requirements are calculated as the difference between the timing of payments on expenses (payables) and receipt of funds from product sales (receivables).
Assumptions on all receivables are 100% of funds received on shipment, with shipment assumed to occur in the month of production. All costs are assumed to be paid in the period incurred.
| June 30, 2026 | Page 261 of 291 |
| | Diamba Sud Gold Project, Kédougou Region, Senegal Technical Report |
| 22.5.4 | All-in Sustaining Unit Cost Estimates |
Estimated unit costs, based on World Gold Council non-generally accepted accounting (GAAP) metrics, are summarized in Table 22.4. The Project is expected to produce gold at an average all-in sustaining cost of $1,332/oz of payable gold.
Table 22.4 Life of Mine All-in Sustaining Cost and All-in Cost
| Parameter | $M | $/t milled | $/payable oz |
| Operating cost | |||
| Mining2 | 699 | 34.12 | 664 |
| Processing | 330 | 16.09 | 313 |
| G&A | 177 | 8.65 | 168 |
| Subtotal, direct operating costs | 1,207 | 58.86 | 1,146 |
| Refining | 3 | 0.15 | 3 |
| Royalties | 111 | 5.39 | 105 |
| Social Fund | 18 | 0.90 | 18 |
| Total operating costs1 | 1,339 | 65.30 | 1,272 |
| Sustaining capital, and reclamation | |||
| Sustaining capital | 64 | 3.12 | 61 |
| All-in sustaining cost1 | 1,403 | 68.42 | 1,332 |
Note: (1) Cash costs and AISC per payable ounce of gold sold are non-IFRS financial measures. Please see “Cautionary Note Regarding Non-IFRS Measures”.
(2) Mining $/t milled includes pre-production ore tonnes mined (314,840 tonnes)
| 22.6 | Taxes and Royalties |
Several taxes and royalties are included in the economic evaluation.
| 22.6.1 | Government Royalty |
The State of Senegal is entitled to assess a gross revenue royalty on production from gold projects. Based on the tax stability provisions in Boya’s current Mining Convention signed with the State in 2015, and the provisions of the 2003 Mining Code, a royalty rate of 3% is payable on gold sales. The State retains the sovereign prerogative to review or revisit certain fiscal terms, including among others royalties and taxes payable, during the exploitation permit approval process, and as such, the current framework may be subject to amendment.
| 22.6.2 | Social Fund |
Under the 2016 Mining Code, the government of Senegal established a community development fund to be financed in part by assessing a gross revenue royalty of 0.5% to holders of an exploitation license.
| 22.6.3 | Duties and Levies |
The Government of Senegal assesses customs duties (10%) and other levies (totaling 5%) on imported goods. During the development phase and initial investment period, the holder of an exploitation permit is exempt from customs duties, including value-added tax (VAT), on the importation of machinery, materials, equipment, and spare parts included in the approved program and directly and definitively intended for mining operations. Operating and capital cost estimates include allowances for government duties and levies. Under Boya’s current Mining Convention, the Project is exempt from customs duties for seven years and benefits from a two-year suspension of VAT.
| June 30, 2026 | Page 262 of 291 |
| | Diamba Sud Gold Project, Kédougou Region, Senegal Technical Report |
| 22.6.4 | Value Added Tax |
Senegal has a VAT rate currently set at 18%. The holder of an exploitation permit is exempted from VAT on its imports and foreign services, the purchase of goods and services in the Senegal and on sales in connection with the mining operations up to the date of the first commercial production. For the purposes of the cashflow analysis, it was assumed that VAT is applicable on 2% of the sustaining capital and costs and 1% of the general and administrative costs and assumed to be refunded two months after it is paid.
| 22.6.5 | Corporate Income Tax |
A federal tax rate of 30% is applicable on income after deductions for gold mining projects in Senegal. Deductions from income for estimating income subject to income tax include the following items:
Depreciation
In this assessment, development and facilities are depreciated using a unit of production method. Depreciation commences once the facilities are placed into service and the mine and mill are operating. Using this approach, equipment and facilities are fully depreciated over the mine life.
Carry Forward Costs
Sunk exploration and other eligible project costs can be carried forward and deducted from income via depreciation.
Mine operating losses can also be carried forward and deducted from income in future years
Investment Tax Credit
An Investment Tax Credit amounting to 40% of upfront capital has also been assumed in line with Boya’s Mining Convention with Senegal. The credit is available for a five-year period after the start of operations and is subject to an annual cap of 50% of taxable income.
Other Deductions
Other deductions from income for the purpose of estimating income subject to tax include management fees and interest expenses.
| 22.6.6 | Withholding Taxes |
The government of Senegal assesses withholding taxes of 16% on interest income and 10% on dividends.
| 22.7 | Government-Carried Interest |
Under the mining code of Senegal, upon the grant of an exploitation permit to Boya, the State of Senegal will require Boya to designate and incorporate a new entity to hold the exploitation permit and operate the Diamba Sud Project. The State of Senegal is entitled to a 10% free carried ownership interest in the operating entity, and Fortuna will indirectly hold the remaining 90% interest. In addition, the State has the right to acquire up to an additional 25% contributory interest in the operating entity at a “fair price” as determined through an independent valuation. The percentage and timing of any such additional contributory interest is subject to negotiation with the State. The State’s interest has been modelled in accordance with the following:
| June 30, 2026 | Page 263 of 291 |
| | Diamba Sud Gold Project, Kédougou Region, Senegal Technical Report |
| · | Fortuna holds 90% and the State of Senegal holds 10% of the shares of Fortuna’s in country operating entity. |
| · | Fortuna’s sunk costs and funds provided to develop the mine will be booked as a shareholder loan to the operating company, to be repaid with interest out of available cash flow. |
| · | The remaining operating company cash flow after sustaining capital requirements and shareholder loan repayments have been met will be distributed to the two shareholders in the form of dividends, with 10% of the dividends going to the State of Senegal and 90% to Fortuna. |
| · | Dividends and interest received by Fortuna will be subject to Senegal withholding taxes. |
| 22.8 | Economic Results |
The pre-tax net present value with a 5% discount rate (NPV5%) is $1,379 million and with an IRR of 70% using a base gold price of $3,500/oz.
The post-tax NPV5% is $1,009 million, with an IRR of 60% and a payback period of one year at a gold price of $3,500/oz.
The State of Senegal is estimated to receive an undiscounted $969 million from the Diamba Sud Project in the form of royalties, fees, duties, dividends, corporate taxes, and withholding taxes.
An annualized cashflow forecast is presented in Table 22.5 reported by calendar year based on first gold pour in June 2028 on both a pre-tax and post-tax basis.
| June 30, 2026 | Page 264 of 291 |
| | Diamba Sud Gold Project, Kédougou Region, Senegal Technical Report |
Table 22.5 Cash Flow Forecast
| Parameter | Units | LOM Total |
2026 | 2027 | 2028 | 2029 | 2030 | 2031 | 2032 | 2033 | 2034 | 2035 | 2036 | 2037 |
| Production | ||||||||||||||
| Tonnes mined | kt | 20,500 | - | - | 2,358 | 1,842 | 2,713 | 2,032 | 3,162 | 1,368 | 3,040 | 1,562 | 1,512 | 912 |
| Tonnes milled | kt | 20,500 | - | - | 1,118 | 2,479 | 2,250 | 2,271 | 2,500 | 2,271 | 2,250 | 2,250 | 2,117 | 994 |
| Gold mill feed grade | g/t | 1.75 | - | - | 2.67 | 2.42 | 2.60 | 1.83 | 1.72 | 1.12 | 1.84 | 1.05 | 1.14 | 1.05 |
| Gold recovery | % | 91 | - | - | 92 | 93 | 94 | 94 | 90 | 89 | 93 | 86 | 87 | 87 |
| Gold recovered | koz | 1,053 | - | - | 88 | 179 | 177 | 125 | 125 | 73 | 123 | 66 | 68 | 29 |
| Gold Revenue | ||||||||||||||
| Gold price | $/oz | 3,500 | - | - | 3,500 | 3,500 | 3,500 | 3,500 | 3,500 | 3,500 | 3,500 | 3,500 | 3,500 | 3,500 |
| Gold sales | koz | 1,053 | - | - | 88 | 179 | 177 | 125 | 125 | 73 | 123 | 65 | 68 | 30 |
| Gold Sales Revenue | $M | 3,684 | - | - | 308 | 627 | 620 | 438 | 438 | 256 | 431 | 228 | 238 | 104 |
| Operating Costs | ||||||||||||||
| Mining | $M | (699) | - | - | (54) | (85) | (90) | (86) | (92) | (81) | (94) | (51) | (47) | (19) |
| Processing | $M | (330) | - | - | (20) | (37) | (36) | (36) | (37) | (37) | (37) | (37) | (36) | (17) |
| G&A | $M | (177) | - | - | (12) | (20) | (20) | (20) | (20) | (20) | (20) | (20) | (17) | (7) |
| Gold refining | $M | (3) | - | - | (0) | (1) | (1) | (0) | (0) | (0) | (0) | (0) | (0) | (0) |
| Total operating costs excluding royalties and social fund | $M | (1,210) | - | - | (86) | (142) | (147) | (142) | (149) | (138) | (152) | (108) | (100) | (44) |
| Royalties | $M | (111) | - | - | (9) | (19) | (19) | (13) | (13) | (8) | (13) | (7) | (7) | (3) |
| Social fund | $M | (18) | - | - | (2) | (3) | (3) | (2) | (2) | (1) | (2) | (1) | (1) | (1) |
| Total operating costs including royalties and social fund | $M | (1,339) | - | - | (97) | (164) | (169) | (158) | (165) | (147) | (167) | (116) | (108) | (47) |
| Capital and Closure Costs | ||||||||||||||
| Development capital | $M | (398) | (95) | (189) | (113) | - | - | - | - | - | - | - | - | - |
| Sustaining capital | $M | (64) | - | - | (19) | (15) | (7) | (5) | (7) | (5) | (3) | (2) | - | - |
| Closure Fund | $M | (15) | - | - | (9) | (0) | (1) | (1) | (1) | (1) | (1) | (1) | (1) | (0) |
| Total Capital and Closure Costs | $M | (476) | (95) | (189) | (141) | (16) | (8) | (5) | (8) | (6) | (4) | (3) | (1) | (0) |
| Project Valuation | ||||||||||||||
| Project net cash flow, pre-tax | $M | 1,870 | (95) | (189) | 70 | 446 | 442 | 274 | 265 | 102 | 260 | 108 | 129 | 56 |
| NPV5% | $M | 1,379 | ||||||||||||
| IRR | % | 70 | ||||||||||||
| Payback period | years | 1.0 | ||||||||||||
| Project net cash flow, after-tax | $M | 1,379 | (95) | (189) | 70 | 414 | 339 | 155 | 198 | 34 | 248 | 44 | 120 | 43 |
| NPV5% | $M | 1,009 | ||||||||||||
| IRR | % | 60 | ||||||||||||
| Payback period | years | 1.0 |
| June 30, 2026 | Page 265 of 291 |
| | Diamba Sud Gold Project, Kédougou Region, Senegal Technical Report |
| 22.9 | Sensitivity Analysis |
A sensitivity analysis was completed to evaluate the impact of changes in key operating and economic variables, including gold price, head grade, metallurgical recovery, capital costs, and operating costs.
The analysis shows that Diamba Sud’s NPV and IRR are most sensitive to revenue-related variables, including gold price, head grade, and process plant recovery. The Project is also more sensitive to changes in operating costs than capital costs.
The Diamba Sud Project contemplated in the FS demonstrates strong economic performance across a range of variables. Estimated NPV sensitivities for key operating and economic metrics are presented in Table 22.6, Table 22.7, and Table 22.8.
Like most gold mining projects, the key economic indicators of NPV5% and IRR are most sensitive to changes in gold price. A $250/oz reduction in the gold price reduces the Project’s after-tax NPV5% by $139 million and the IRR by 6%. A $250/oz increase in the gold price increases the Project’s NPV5% by $139 million and the IRR by 6%.
Table 22.6 After-Tax NPV Sensitivity to Discount Rate and Gold Price ($M)
| Gold Price ($/oz) | ||||||||
| 2,750 | 3,000 | 3,250 | 3,500 | 3,750 | 4,000 | 4,250 | ||
| Discount Rate | 3% | 675 | 834 | 988 | 1,141 | 1,294 | 1,447 | 1,600 |
| 5% | 587 | 731 | 870 | 1,009 | 1,148 | 1,287 | 1,426 | |
| 7% | 510 | 641 | 767 | 894 | 1,021 | 1,147 | 1,274 | |
Table 22.7 After-Tax IRR Sensitivity to Gold Price
| Gold Price ($/oz) | ||||||||
| 2,750 | 3,000 | 3,250 | 3,500 | 3,750 | 4,000 | 4,250 | ||
| IRR | 40% | 47% | 54% | 60% | 66% | 72% | 78% | |
Table 22.8 After-Tax NPV5% Sensitivity to Capital Costs and Operating Costs ($M)
| Operating Costs | ||||||
| -25% | -10% | 0% | 10% | 25% | ||
| Capital Costs | -25% | 1,235 | 1,135 | 1,068 | 1,001 | 900 |
| -10% | 1,200 | 1,099 | 1,032 | 965 | 865 | |
| 0% | 1,176 | 1,076 | 1,009 | 942 | 841 | |
| 10% | 1,152 | 1,052 | 985 | 918 | 817 | |
| 25% | 1,117 | 1,017 | 950 | 883 | 780 | |
The sensitivity of the after-tax NPV5% of the Project to changes in the key operating parameters of gold price, capital costs, operating costs, grade, and metallurgical recovery are shown in Figure 22.2. Similarly, the after-tax IRR of the Project changes in the key operating parameters are shown in Figure 22.3. The sensitivity results due to a parameter change assume the remaining parameters remain unaffected.
| June 30, 2026 | Page 266 of 291 |
| | Diamba Sud Gold Project, Kédougou Region, Senegal Technical Report |
Figure 22.2 After-Tax NPV5% Sensitivities to Key Input Parameters
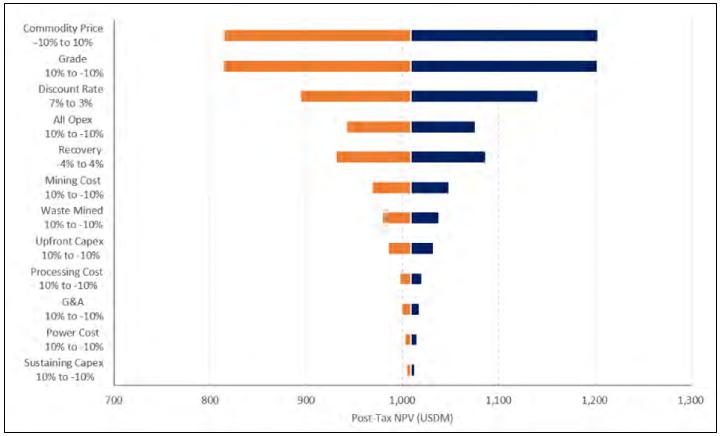
Figure prepared by Fortuna, 2026. Capex = capital cost estimate; Opex = operating cost estimate; G&A = general and administrative cost estimate
Figure 22.3 After-Tax IRR Sensitivity to Key Input Parameters
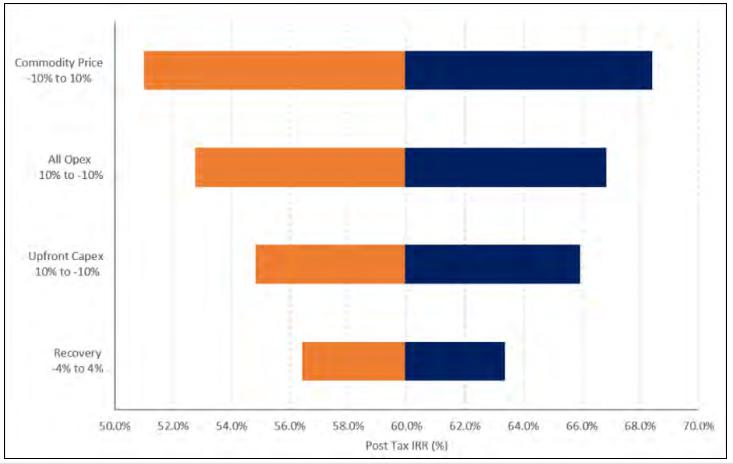
Figure prepared by Fortuna, 2025. Capex = capital cost estimate; Opex = operating cost estimate; recovery = metallurgical recovery.
| June 30, 2026 | Page 267 of 291 |
| | Diamba Sud Gold Project, Kédougou Region, Senegal Technical Report |
The project IRR is most sensitive to changes in revenue parameters (i.e. gold price and gold grade) and operating costs, while changes to metallurgical recovery and capital costs are secondary.
| 22.10 | Comment on Section 22 |
The economic analysis was prepared using a DCF methodology on a pre-tax and after-tax basis using a base case gold price of $3,500/oz.
The fiscal framework, including royalties, corporate income tax, investment tax credit, shareholder loan structure, and withholding tax treatment, reflects the terms of Boya's Mining Convention with the State of Senegal (2015) and the 2003 Mining Code and has been reviewed by a local Senegalese tax specialist.
Sensitivity analysis covers gold price, discount rate, capital costs, operating costs, grade, and metallurgical recovery. The project demonstrates robust economics across all tested scenarios. The QP is satisfied that the Project is economically viable based on the assumptions in this Report.
| June 30, 2026 | Page 268 of 291 |
| | Diamba Sud Gold Project, Kédougou Region, Senegal Technical Report |
| 23 | Adjacent Properties |
This section is not relevant to this Report.
| June 30, 2026 | Page 269 of 291 |
| | Diamba Sud Gold Project, Kédougou Region, Senegal Technical Report |
| 24 | Other Relevant Data and Information |
This section is not relevant to this Report.
| June 30, 2026 | Page 270 of 291 |
| | Diamba Sud Gold Project, Kédougou Region, Senegal Technical Report |
| 25 | Interpretation and Conclusions |
| 25.1 | Mineral Tenure, Surface Rights, Royalties and Agreements |
The QPs were provided with a legal opinion that supports that the mining tenure held by Boya for the Diamba Sud Project is valid and that Fortuna has a legal right to explore the property.
The Diamba Sud permit is an exploration permit (permis de recherche) which was granted to Boya in June 2015 under the 2003 Mining Code, before the 2016 Mining Code came into effect, and therefore it remains subject to the 2003 Mining Code for its duration and validity, except for procedural documents (related to renewals, authorizations and permit applications) which are under 2016 Mining Code. The exploration permit was granted for an initial period of three years, subject to being renewed twice for additional periods of three years. The exploration permit was renewed for a second time on June 9, 2021, for a period of three years, being the second and final renewal which expired on June 9, 2024. However, Boya obtained a special two-year retention period until June 21, 2026 to apply for an exploitation permit, complete the works necessary to file a FS and file the FS, and to conduct the environmental studies that are required in support of an application for an exploitation permit. Boya applied for an exploitation permit from the Ministry of Energy, Petroleum, and Mines on February 4, 2026, received a formal Decree for the environmental permit for the Diamba Sud Project Boya on June 11, 2026, and obtained an extension to the retention period of the exploration permit of 60 days until August 21, 2026 to file the FS with the Ministry of Mines. The State will then make a decision upon the application to grant the exploitation permit.
Boya entered into a Mining Convention with the State of Senegal dated April 8, 2015. Under the 2003 Mining Code, the Mining Convention between the State and the titleholder regulates the relationship between the parties during the exploration and exploitation periods. It should be noted, however, that the State retains the sovereign prerogative to review or revisit certain fiscal terms during the exploitation permit approval process, and as such, the current framework may be subject to amendment.
The permit comprises two blocks, the northern block, DS1, is approximately 46.56 km2 in area, and the southern block, DS2, some 20 km to the south is approximately 6.31 km2 in area, for a total permit area of 53.46 km2.
Mineral exploration permits, within their boundaries, entitle the holder exclusive surface rights to explore for the nominated mineral commodities specified (in this case, gold), as well as encumbrance-free disposal of materials extracted during exploration process. Such permits allow for beneficial ownership to be held by a foreign entity.
Boya has full and unrestricted surface rights to the land covered by the exploration permit. The perimeter of the exploration permit is free to access and is not subject to any kind of restriction.
The Diamba Sud Project is not subject to any back-in rights, liens, payments, or encumbrances.
Royalties that affect the Mineral Resources and Mineral Reserves and have been considered in the economic analysis are:
| June 30, 2026 | Page 271 of 291 |
| | Diamba Sud Gold Project, Kédougou Region, Senegal Technical Report |
| · | A 3% royalty to the State of Senegal on the gross revenue from gold production, with deductions allowed for transportation and refining costs. |
| · | A local contribution royalty of 0.5%, also calculated after deductions allowed, for transportation and refining costs. |
| 25.2 | Geology and Mineralization |
The Diamba Sud Project is located within the Loulo Mining district of the WAC.
Exploration has identified the Area A, Area D, Karakara, Kassassoko, Western Splay, Moungoundi, and Southern Arc deposits.
Mineralization at Diamba Sud is classified as Birimian-style mesothermal orogenic gold. Although not formally classified as such, the gold deposits of Diamba Sud show similarities to the post-collisional, atypical orogenic Loulo/Falémé-style deposits. This tentative classification is based on the correlation between the mineral assemblages, geochemistry, and the structural and lithological controls on mineralization with that of adjacent deposits that are found in close proximity to the SMSZ.
| 25.3 | Exploration, Drilling and Analytical Data Collection in Support of Mineral Resource Estimation |
Drill holes drilled under Boya and Fortuna management in the period 2015–2026 have data collected using industry-standard practices. Drill orientations are appropriate to the orientation of mineralization and core logging meets industry standards for exploration of mesothermal orogenic gold deposits.
Geotechnical logging is sufficient to support Mineral Resource and Mineral Reserve estimation and a FS study level assessment.
Collar and downhole surveys have been conducted using industry-standard instrumentation. Any uncertainties in survey information have been incorporated into subsequent resource confidence category classification.
All collection, splitting, and bagging of chip and core samples were carried out by Boya and Fortuna personnel since 2015 representing all of the information collected at the Project. No material factors were identified with the drilling programs that could affect Mineral Resource or Mineral Reserve estimation.
Sample preparation and assaying for samples that support Mineral Resource and Mineral Reserve estimation have followed approximately similar procedures for most drill programs since 2015. The preparation and assay procedures are adequate for the type of deposit and follow industry standard practices.
Sample security procedures met industry standards at the time the samples were collected. Current core and chip sample storage procedures and storage areas are consistent with industry standards.
| 25.4 | Data Verification |
Site visits were completed. The QPs individually reviewed the information in their areas of expertise, and concluded that the information supported Mineral Resource and Mineral Reserve estimation, and could be used in mine planning and in the economic analysis that supports the FS.
| June 30, 2026 | Page 272 of 291 |
| | Diamba Sud Gold Project, Kédougou Region, Senegal Technical Report |
| 25.5 | Metallurgical Testwork |
Metallurgical testwork was completed through a staged program. The metallurgical program included comminution, gravity recovery, cyanidation, rheology, mineralogical and variability testwork to support process plant design and evaluation of the various ore domains within the Project.
Initial testwork was completed on samples from Area A, Area D and Karakara deposits. Additional metallurgical investigations were subsequently completed on samples from the Kassassoko, Western Splay, Bougouda, Southern Arc and Moungoundi deposits to expand the metallurgical dataset and assess variability across ore sources included in the mine plan. The testwork program included:
| · | Comminution testing, including CWi, BWi, Ai and SMC testing. |
| · | Gravity concentration and intensive cyanidation testing. |
| · | Cyanide leach optimization and leach kinetics investigations. |
| · | Carbon adsorption testing. |
| · | Rheology investigations. |
| · | Bulk mineralogical investigations and diagnostic testing. |
The metallurgical testwork completed indicates favorable comminution, gravity recovery, and cyanidation characteristics for the majority of the mineralization types evaluated during the FS. The testwork programs completed across the various deposits and prospects support the suitability of a conventional gravity recovery and cyanide leaching flowsheet for treatment of the mineralized material.
The majority of tested samples demonstrated high overall gold recoveries under the selected process conditions. A limited number of fresh mineralization samples from Area D exhibited comparatively lower recoveries associated with partially locked or sulfide-associated gold.
Additional metallurgical testwork completed on samples from Kassassoko, Western Splay, Bougouda, Southern Arc and Moungoundi demonstrated metallurgical responses broadly consistent with the main Diamba Sud deposits.
Testwork and mineralogical analysis completed to date indicate that no deleterious elements were identified in concentrations that could be expected to materially impact metallurgical recovery, process performance or plant throughput.
Overall, the metallurgical testwork completed to date is considered sufficient to support the process design basis and metallurgical recovery estimations adopted for the current study stage.
| 25.6 | Mineral Resource Estimation |
The 2026 Mineral Resource estimate used RC and DD drill hole sample information obtained by Boya since 2015. Mineralized domains identifying potentially economically extractable material were modeled for each vein and used to code drill hole intervals for geostatistical analysis, block modeling and grade interpolation by ordinary kriging or inverse distance weighting.
Mineral Resources are reported based on open pit mining within SMU block sizes based on estimated operational costs and mining equipment sizes using cut-off grades in the
| June 30, 2026 | Page 273 of 291 |
| | Diamba Sud Gold Project, Kédougou Region, Senegal Technical Report |
block model calculated based on projected long-term metal prices, metallurgical recoveries, and operational costs. Mineral Resources have been reported above a gold cut-off grade range between 0.31 g/t and 0.33 g/t for oxide material and a variable gold cut-off grade for fresh material ranging from 0.35 to 0.42 g/t depending on the deposit.
Mineral Resources are categorized as Indicated or Inferred. The criteria used for classification includes the number of samples, spatial distribution, distance to block centroid, kriging efficiency, and slope of regression.
Mr. Chapman is of the opinion that Mineral Resources have been estimated using standard industry practices.
Furthermore, it is the opinion of Mr. Chapman that by the application of projected long-term gold prices, the average metallurgical recovery, as well as constraining the Mineral Resources to those SMU blocks inside an ultimate pit shell that accounts for projected operating costs, the Mineral Resources have ‘reasonable prospects for eventual economic extraction’.
| 25.7 | Mine Plan |
The Diamba Sud Project is planned as the simultaneous development of multiple deposits, including Area A, Area D, Karakara, Kassassoko, Moungoundi, Southern Arc and Western Splay, with no more than three pits to be mined at any one time. The overall mining and production strategy will be to maintain a variable mill processing throughput rate from 2.0–2.5 Mt/a (averaging 2.25 Mt/a) depending on the proportion of oxide ore mined. Oxide ore will primarily be sourced from the Area A–Area D pit. The other open pits will provide principally fresh ore.
The FS contemplates a total mine life of 9.4 years. The pit optimization shells were generated in Deswik software using a gold price of $2,900/oz and a revenue factor of 1.0. Optimization parameters incorporated included government royalties, refining, mining, processing, and general and administrative costs.
Mining activities at Diamba Sud will use conventional open-pit mining methods. Drill and blasting are planned for oxide and fresh ore, followed by conventional truck and shovel operations within the pits for the movement of ore and waste.
The estimated total material productive capacity of approximately 20.0 Mt will have sufficient capacity to allow for maintenance, transport between the pits, and make-up capacity to account for low productivity periods such as high rainfall events. A fleet of up to 15 Caterpillar 777 trucks (payload of 90 t) will be used to haul all ore and waste. Fortuna will engage a mining contractor for operations. A common pool of equipment will be used and scheduled across all active pits so that movement between the pits is minimized.
| 25.8 | Recovery |
The Diamba Sud process plant design is based on a metallurgical flowsheet envisioned for the production of gold doré at optimum recovery while minimizing initial capital expenditure and operating costs. The flowsheet comprises a conventional crushing, milling, gravity recovery, CIL, carbon elution, and gold recovery circuit.
The process requirements are well understood.
| June 30, 2026 | Page 274 of 291 |
| | Diamba Sud Gold Project, Kédougou Region, Senegal Technical Report |
| 25.9 | Infrastructure |
Mine and process infrastructure and supporting facilities are included in the general layout and will meet the needs of the mine plan and production rate envisaged in this Report:
| · | The process plant is designed to treat 2.0 Mt/a of fresh mill feed material, with capacity to process up to 2.5 Mt/a where the feed blend contains at least 63% fresh material and 37% oxide material. |
| · | The proposed TSF will be located approximately 5 km north of the process plant. The Stage 1 TSF has a design capacity of approximately 2.4 Mt, sufficient to contain tailings for about 12 months at design production levels, with annual raises planned thereafter. The TSF design provides sufficient capacity for the proposed life-of-mine tailings production of approximately 20.5 Mt. |
| · | Power demand on the operations will average of 11.0 MW provided from hybrid power generation with generators combined with solar PV + BESS on site. |
| · | Water demand under average operating conditions is estimated at approximately 59 L/s. About 80% of the water contained in slurry deposited into the TSF is expected to be recovered and pumped back to the process plant for reuse. Additional make-up water is expected to be sourced from open pit dewatering and site water management infrastructure, including the proposed water storage dam and associated water harvesting systems. |
| 25.10 | Markets and Contracts |
No market studies have been performed as a component of this FS; however Fortuna has sold gold doré from West Africa since 2020 and is familiar with selling this product.
There are no sales contracts in place on the Diamba Sud Project at the Report effective date. Diamba Sud will produce gold doré, which is readily marketable on an ‘ex-works’ or delivered basis to several refineries in Europe and Africa. There are no indications of the presence of penalty elements that may impact on the price or render the product unsalable.
The QP has reviewed the information provided by Fortuna on metal price projections and exchange rate forecasts and notes that the information provided support the assumptions used in this Report and is consistent with the source documents, and that the information is consistent with what is publicly available within industry norms.
| 25.11 | Environmental, Permitting and Social Considerations |
The Diamba Sud Project is currently held under an exploration permit which is subject to a special two-year retention period until June 21, 2026 to apply for an exploitation permit, complete the works necessary to file a FS and file the FS, and to conduct the environmental studies that are required in support of an application for an exploitation permit. Boya applied for an exploitation permit from the Ministry of Energy, Petroleum, and Mines on February 4, 2026, received a formal Decree for the environmental permit for the Diamba Sud Project Boya on June 11, 2026, and obtained an extension to the retention period of the exploration permit of 60 days until August 21, 2026 to file the FS with the Ministry of Mines. The State will then make a decision upon the application to grant the exploitation permit. The grant of the exploitation permit remains a key requirement for development of the Project.
| June 30, 2026 | Page 275 of 291 |
| | Diamba Sud Gold Project, Kédougou Region, Senegal Technical Report |
The environmental and social baseline for the Project has been established through studies covering socio-economic conditions, land and water use, surface water and groundwater resources, terrestrial and aquatic ecology and biodiversity, air quality, noise and vibration, climate change, traffic and transportation, and archaeology and cultural heritage. The ESIA was submitted to DiREC on October 6, 2025, and Boya received a formal decree approving the ESIA for the Diamba Sud Project in June 2026 (Decree n°011251 of 22/05/2026 granting the Environmental and Social Compliance Certificate for the Diamba Sud gold project).
The FS includes two material design additions relative to the Project design assessed in the ESIA: an airstrip to be located immediately north of the Diamba Sud permit and a solar photovoltaic power plant to be located immediately south of the process plant. These components are expected to require additional environmental and social permitting, such as impact studies or notices. Relevant national authorities, including DiREC, have been contacted to clarify the permitting pathway, with permitting considered feasible and planned to commence in the second half of 2026.
The ESIA identifies and assesses potential Project impacts and sets out environmental and social management measures designed to mitigate adverse impacts and enhance local benefits. These measures include an environmental and social management plan, stakeholder engagement plan, capacity building plan, livelihood restoration program, mine rehabilitation and closure plan, and voluntary environmental and social investment program.
With careful implementation of these environmental and social management measures, and subject to receipt of the exploitation permit and any additional approvals required for FS design additions, the Project is expected to be developed in a manner that complies with local regulatory requirements, aligns with international industry standards, and provides net socio-economic benefits to local communities and Senegal without compromising the integrity of the broader environment.
| 25.12 | Capital and Operating Costs |
The total initial capital cost for the Diamba Sud Project was estimated at $397.5 million, based on a feasibility study level estimate with an expected accuracy range of ±15%. The capital cost estimate comprises $181.7 million for the process plant and $215.8 million of Owner’s capital (net of sunk capital).
The process plant capital estimate was prepared by Lycopodium and is based on detailed engineering, vendor quotations, and benchmarked data from comparable projects. The estimate was initially completed in October 2025 and subsequently updated in Q2 2026. Benchmarking against vendor quotations and a parallel FEED study confirmed that pricing remained consistent with the FS estimate and no material escalation was required.
Owner’s capital included mining pre-production, major infrastructure, and supporting project costs required for project execution and operational readiness. These estimates were developed by Fortuna, supported by Knight Piésold for civil and water infrastructure components including the TSF, water storage dam, site roads, and surface water management. Additional pricing was informed by recent tender results and benchmarking against Fortuna’s operating assets in West Africa.
Mining pre-production capital included contractor mobilization, site establishment, and pre-stripping activities required to prepare initial pits for mining operations. Mining will be undertaken by an experienced mining contractor.
| June 30, 2026 | Page 276 of 291 |
| | Diamba Sud Gold Project, Kédougou Region, Senegal Technical Report |
Operating costs, including mining, processing and G&A costs, were estimated at $59.4/t of ore milled or $1,146 per payable ounce of gold sold over the LOM.
AISC, which included sustaining capital, closure, royalties and refining, were estimated at $1,322 per payable ounce of gold sold over the LOM.
Mining operating costs were developed based on budgetary quotations from experienced mining contractors, including contractors with operating experience in Senegal and the broader West African region.
Processing costs were prepared by Lycopodium based on the process design developed for the feasibility study. Costs were primarily derived from vendor quotations for major equipment and consumables, supplemented by first principles estimating and benchmarking against recent Lycopodium projects in West Africa and Senegal.
General and administrative costs were developed based on historical operating data from comparable Fortuna operations, including the Séguéla Mine in Côte d’Ivoire and the previously-owned Yaramoko Mine in Burkina Faso, supplemented by current pricing for services in Senegal.
Operating costs are considered appropriate for a feasibility study level estimate and reflect prevailing cost conditions in West Africa.
| 25.13 | Economic Analysis |
The Diamba Sud Project has been evaluated on a discounted cash flow basis. The economic analysis assumes that Fortuna will provide all development funding via inter-company and shareholder loans to the mine operating entity, which will be repaid with interest from future gold sales.
The results of the analysis show the Project to be economically robust. The pre-tax NPV5% is $1,379 million, with an IRR of 70% using a base gold price of $3,500/oz.
Post-tax Project NPV5% is $1,009 million, with an IRR of 60% and a payback period of one year at a gold price of $3,500/oz. The payback period is defined as the time after process plant start-up that is required to recover the initial expenditures incurred developing the Project.
| 25.14 | Opportunities and Risks |
A number of opportunities and risks were identified by the QPs.
| 25.14.1 | Exploration |
Opportunities include:
| · | Significant exploration upside at Southern Arc. |
| · | Untested prospective targets across the broader Diamba Sud tenement package. |
| · | Continuation of geological interpretation and modelling to improve understanding of the Diamba Sud deposits and to identify additional drill targets |
| 25.14.2 | Mineral Reserve Estimation, Mining and Cost Assumptions |
Opportunities include:
| June 30, 2026 | Page 277 of 291 |
| | Diamba Sud Gold Project, Kédougou Region, Senegal Technical Report |
| · | Optimization of stockpile management and blending strategies to support consistent throughput and recovery performance. |
| · | Optimization of mine design and scheduling to potentially enhance operational efficiency through ongoing engineering and design work. |
| · | Refinement of grade control and short-term mine planning to reduce dilution and improve mill feed management. |
| · | Optimization of stockpile management and blending strategies to support consistent throughput and recovery performance. |
| · | Optimization of mining contractor execution strategies, fleet selection, and productivity assumptions to reduce mining costs and improve schedule certainty. |
| · | Improvements in logistics, procurement, and construction execution through early works planning and early contractor involvement. |
| · | Refinement of operational readiness planning, including recruitment, training, maintenance systems, inventory management, and commissioning procedures. |
| · | Reduction in capital costs through the selected process plant EPCM contractor, alternative equipment suppliers, and subcontractor procurement strategies will be assessed during the execution phase. |
Risks Include:
| · | Changes to mining dilution, ore loss and grade control assumptions: actual mining performance may vary from mine plan assumptions due to orebody complexity, selective mining constraints, dilution, ore loss, grade control performance, and reconciliation outcomes. Mitigation includes detailed grade control drilling, ore/waste delineation, reconciliation processes, and ongoing mine planning optimization. |
| · | Material cost increases and inflation: global inflation and supply chain pressures could impact capital and operating costs. Mitigation includes proactive cost tracking, early contractor engagement, and appropriate contingencies within cost estimates. Advancing detailed mining studies and investment decision timeline is also expected to help limit exposure to inflationary pressures. |
| · | Long lead times for critical equipment: extended procurement and delivery times for key mechanical and power generation equipment pose schedule risks. Mitigation measures include early identification, prioritization, and ordering of long-lead items during future more detailed studies. |
| 25.14.3 | Metallurgical and Processing |
Opportunities include:
| · | Optimization of the process flowsheet to enhance recoveries and operating efficiencies through ongoing engineering and design work. |
| 25.14.4 | Geotechnical and Hydrogeological |
Risks include:
| · | Changes to the geotechnical, hydrogeological and water management assumptions: actual ground and water conditions may differ from design |
| June 30, 2026 | Page 278 of 291 |
| | Diamba Sud Gold Project, Kédougou Region, Senegal Technical Report |
| assumptions, particularly in weathered materials, structurally controlled zones, and during the wet season. Mitigation includes continued geotechnical and hydrogeological monitoring, dewatering planning, surface water controls, pit mapping, slope monitoring, and adaptive water balance management. |
| 25.14.5 | Environmental, Permitting and Tax Assumptions |
Opportunities include:
| · | Enhancement of the positive socio-economic impacts of the Project by developing partnerships with local institutions, such as for local employment. |
Risks include:
| · | On time completion of the environmental and social permitting for the new Project design components (airstrip and solar farm) of the added in the FS. |
| · | Delays in the grant of the Exploitation Permit: Project development remains dependent on the exploitation permit grant. Delays, conditions, or changes arising through the exploitation permit approval process could affect the Project schedule, development scope, fiscal terms, and execution strategy. |
| · | Changes to local content compliance: the evolving implementation of Senegal’s local content regulations may affect contracting and recruitment. Mitigation includes ongoing regular engagement with authorities, maintaining strong relationships with relevant government parties, dedicated local content specialists, and early alignment of procurement and staffing strategies to ensure compliance. |
| · | Changes to tax and royalty assumptions: certain taxes and royalties included in the economic analysis have been based upon the provisions included in the Mining Convention between Boya and the State of Senegal dated April 8, 2015, and in the 2003 Mining Code. The State retains the sovereign prerogative to review or revisit certain fiscal terms, including among others royalties and taxes payable, during the exploitation permit approval process, and as such, the current framework may be subject to amendment. |
| · | Interest of the State of Senegal in the Operating Entity: upon the grant of the exploitation permit, the State of Senegal is entitled to a 10% free-carried interest in the operating entity. In addition, the State has the right to acquire, up to an additional 25% contributory interest in the operating entity at a fair price determined through an independent valuation. The percentage and timing of any such additional contributory interest remain to be confirmed following negotiations with the State. There can be no assurance that the State’s interest will remain limited to 10%. The economic analysis presented in this Report is on a 100% Project basis. |
| June 30, 2026 | Page 279 of 291 |
| | Diamba Sud Gold Project, Kédougou Region, Senegal Technical Report |
| 26 | Recommendations |
| 26.1 | Overview |
The following recommendations outline the key activities required to advance the Diamba Sud Project following completion of the FS and support progression toward project execution. The next phase of work is focused on maintaining project momentum through engineering advancement, early works, procurement readiness, permitting and approvals, operational readiness, and ongoing technical validation.
In parallel with execution planning, exploration, infill drilling, and grade control drilling should continue where these activities support potential expansion of the known mineralization, improved geological confidence, mine plan refinement, operational control, and Project upside potential. These programs should be coordinated with ongoing engineering, mining, environmental, and permitting workstreams to ensure that new data are incorporated into Project designs, schedules, cost estimates, and risk management processes as appropriate.
A summary of the recommendations broken down by area and costs is presented in Table 26.1.
Table 26.1 Summary of Recommended Program Costs by Area
| Area | Estimated Cost ($M) |
| Exploration | 10.1 |
| Geotechnical | 0.8 |
| Water Management | 1.0 |
| Metallurgical | 0.2 |
| Environmental and Social | 0* |
Engineering - Process Plant FEED and detailed designs - Long-lead procurement support. - Infrastructure engineering and construction support - Owner’s engineering and project controls - Operational Readiness Program - Project execution, permitting, procurement, and cost control. |
2.0 0* 2.5 0* 3.0 0* |
*Work expected to be completed using in-house resources and part of normal operating costs for Fortuna’s West Africa regional office.
The recommended programs are generally independent and may be executed concurrently unless otherwise stated. Where activities have the potential to affect the execution schedule, capital cost estimate, permitting pathway, or mine plan, they should be integrated into the project execution plan and reviewed prior to final investment decision.
| 26.2 | Exploration |
An exploration and infill drilling program is recommended to expand the existing deposits that have not been fully defined and potentially support upgrading of Inferred Mineral Resources to higher confidence categories.
Key priorities for the exploration program include:
| June 30, 2026 | Page 280 of 291 |
| | Diamba Sud Gold Project, Kédougou Region, Senegal Technical Report |
| · | Ongoing step-out and expansion drilling at the Southern Arc and Moungoundi deposits. |
| · | Continued infill drilling at the Moungoundi, Southern Arc, Area A, Area D and Karakara deposits to potentially support upgrades in Mineral Resource classification and improve geological confidence. |
| · | Continuing regional auger, geochemical, and geophysical surveys across the Diamba Sud permit to generate new drill targets. |
| · | Detailed structural mapping and surface sampling of untested high-priority targets to refine the geological model and guide future drill programs. |
The budget to execute the exploration and infill program is estimated at approximately $10.1 million based on current contracted drill rates (average $215 per meter for diamond drilling and $65 per meter for reverse circulation drilling) and in-country expenses. The program for 2026 includes, but is not limited to:
| · | 11,300 m of infill and resource extension drilling (RC and core) across the Project area, guided by the objective of growing Mineral Resources and provision for advancing emerging prospects. |
| · | 24,000 m of target generation RC and core drilling at Gamba Gamba, Moungoundi North, and other emerging targets generated from 2025 auger and geophysical campaigns, as well as deep stratigraphic diamond core drilling to validate certain geological concepts and to examine likely geological targets for underground mining potential. |
| 26.3 | Geotechnical |
The geotechnical recommendations focus on supporting project execution planning and operational readiness for the proposed open pits. The emphasis should be on verifying the current slope design assumptions, improving confidence in structural and hydrogeological controls, and establishing the operational practices required to safely maintain pit wall performance during mining.
Recommended activities include:
| · | Update the site-wide structural and geotechnical models progressively as additional information becomes available from ongoing drilling programs and geotechnical logging. Model updates should be reviewed at least annually during active drilling and mining activities, or more frequently where material new structural, geotechnical, or hydrogeological information is identified. The updated models should incorporate major faults and relevant structural domains and be used to support periodic geotechnical stability reviews, confirming that pit slope performance is not adversely affected by the interaction of these structures with the existing rock mass fabric. |
| · | Continue full geotechnical logging in selected exploration and infill drill holes across the proposed open pits and any potential future deposits, including point load index testing and installation of piezometers where appropriate. |
| · | Maintain rig-based geotechnical logging practices where practical to preserve core integrity and improve the quality of structural and rock mass data collected from selected holes. |
| June 30, 2026 | Page 281 of 291 |
| | Diamba Sud Gold Project, Kédougou Region, Senegal Technical Report |
| · | Collect targeted laboratory samples, where additional data are required, to confirm intact rock, joint, and saprolite strength parameters for slope design verification and future optimization. |
| · | Continue to improve the understanding of groundwater conditions within the pit walls and surrounding areas through piezometer monitoring and integration with pit dewatering planning. |
| · | Ensure that surface water management controls are incorporated into pit development planning, particularly to limit ponding and degradation of duricrust and saprolite units during the wet season. |
| · | Provide for controlled blasting, scaling, crest cleaning, and periodic berm maintenance in the pit operating plans, particularly where narrow berm designs are used in bedrock. |
| · | Include provision in the capital and operating budgets for specialized scaling equipment, trained operators, and appropriate geotechnical supervision during mining. |
| · | Once pit benches are exposed, conduct routine geotechnical mapping to collect structural data, including structure type, orientation, continuity, infill, thickness, roughness, and condition. This information should be used for design reconciliation, slope performance monitoring, and assessment of future slope optimization opportunities. |
These activities are intended to validate the geotechnical assumptions used in the FS, support detailed pit engineering and execution planning, and establish the monitoring and operational controls required for safe mining. The ongoing collection of geotechnical, structural, and hydrogeological data will provide the basis for slope design verification, pit wall performance assessment, and future optimization as mining advances. Provision has been included in the operating cost estimate for dedicated geotechnical support during mining, comprising a senior geotechnical engineer, a geotechnical engineer and five geotechnical technicians. This work is expected to be completed internally using the aforementioned personnel and is not expected to result in additional expenditures beyond normal projected staffing costs of $0.8 million per annum.
| 26.4 | Water Management |
The Gamba Gamba Creek, also referred to as the Karakara watercourse, has been confirmed as the primary raw water source for the Project. Continuous monitoring of surface water flows should continue, with regular water balance and hydrological model updates to improve the dataset, validate catchment performance, and increase confidence in long-term water availability.
Additional hydrogeological drilling should continue near the proposed water storage dam to identify and confirm local aquifers that may provide backup and make-up water supplies for the Project. The program is expected to include approximately 10 priority targets, with 10 to 20 holes planned depending on whether suitable aquifers are intersected during drilling. Further drilling, pump testing, and technical assessment should also be completed for the Western Splay, Kassassoko, Southern Arc, and Moungoundi pits to improve confidence in groundwater conditions and refine pit dewatering requirements. The estimated cost for this hydrogeological drilling, pump testing and assessment is estimated to be approximately $1.0 million.
| June 30, 2026 | Page 282 of 291 |
| | Diamba Sud Gold Project, Kédougou Region, Senegal Technical Report |
Updated hydrological and hydrogeological data should be incorporated into the site water balance, pit dewatering plans, and surface water management designs as the Project advances. These activities are intended to improve confidence in the long-term raw water supply, refine pit dewatering assumptions, and reduce water supply and water management risks during project execution. This work is expected to be completed using in-house resources and part of normal operating costs for Fortuna’s West Africa regional office.
| 26.5 | Metallurgical |
Additional metallurgical testwork has been completed on the Southern Arc and Moungoundi deposits under conditions aligned with the process design criteria, including bottle roll leaching, BLEG, and supporting variability testwork. The results indicate that the mineralization is amenable to conventional cyanidation and consistent with the established processing route.
While the current metallurgical testwork is considered sufficient to support the FS level process design and recovery assumptions, it is recommended that further metallurgical testwork be completed on Southern Arc, Moungoundi, Western Splay and Kassassoko during FEED and detailed design. This additional work should increase confidence in recovery estimates, confirm variability across ore types, and further validate the proposed processing assumptions for these deposits.
The future testwork should focus on variability under plant-representative conditions, including grind size, leaching kinetics, and carbon adsorption behavior, to further validate process performance and support ongoing optimization. The estimated cost for this metallurgical testwork is estimated to be approximately $0.2 million.
| 26.6 | Environmental and Social |
It is recommended to continue to proactively engage with local authorities and communities to maintain strong support for the Project. Additionally, opportunities should be taken to optimize the Project by reducing its environmental footprint, whilst maximizing, as far as possible, the benefits for local communities. This work is expected to be completed using in-house resources and part of normal operating costs for Fortuna’s West Africa regional office.
| 26.7 | Engineering Studies |
It is recommended that the following engineering and project execution activities continue to be advanced to support the transition from the FS into project execution:
| · | Process plant FEED and detailed design. An early works allowance of approximately $2.0 million is recommended and has been advanced in parallel with completion of this FS to progress FEED and detailed design for the process plant while the Project awaits a final investment decision to commit to the full capital amount of approximately $397.5 million indicated in this Report. This scope is intended to advance engineering definition sufficiently to support the placement of orders for long-lead equipment and materials, maintain project momentum, and reduce schedule risk ahead of full project approval. |
| · | Long-lead procurement support. The early works scope should include vendor engagement, technical evaluation of long-lead items, preparation of procurement packages, and support for the timely placement of purchase orders where appropriate. This work is intended to preserve the project schedule and reduce |
| June 30, 2026 | Page 283 of 291 |
| | Diamba Sud Gold Project, Kédougou Region, Senegal Technical Report |
| exposure to extended equipment delivery periods. This work is expected to be completed using in-house resources and part of normal operating costs for Fortuna’s West Africa regional office. |
| · | Issued-for-construction documentation, site infrastructure design, and execution readiness. FEED and detailed design should continue to progress toward issued-for-construction documentation where applicable, including engineering development, project controls, procurement support, construction planning, commissioning readiness, Owner’s engineering, and technical supervision. In parallel, detailed design and issued-for-construction drawings and documentation for key site infrastructure should continue to be advanced, including the water storage dam, tailings storage facility, site roads, surface water management infrastructure, and associated construction supervision and engineering support. The estimated cost for this infrastructure engineering and construction support scope is approximately $2.5 million. |
| · | Owner’s engineering and project controls. Owner’s engineering support should be maintained to provide technical oversight, interface management, cost and schedule control, quality assurance, and coordination between the process plant, site infrastructure, procurement, and construction workstreams. This work is expected to be completed using in-house resources and part of normal operating costs for Fortuna’s West Africa regional office. |
| · | Operational readiness planning and implementation. A detailed operational readiness plan and implementation program should be developed and progressively implemented during FEED studies and project execution. This program should define the systems, personnel, procedures, training, maintenance strategies, spares and warehouse requirements, commissioning support, HSEC readiness, and handover requirements needed to support a safe and efficient transition from construction into operations. An allowance of approximately $3.0 million is recommended for this operational readiness program. |
| · | Project execution, permitting, procurement, and cost control. The Project execution plan, permitting register, procurement strategy, construction schedule, cost control framework, and risk and opportunity register should continue to be updated through FEED and project execution. This work should include confirmation of remaining permits and approvals, local content compliance requirements, long-lead procurement status, contractor readiness, capital cost updates, contingency, escalation assumptions, and execution schedule risks prior to final investment decision. This work is expected to be completed using in-house resources and part of normal operating costs for Fortuna’s West Africa regional office. |
| June 30, 2026 | Page 284 of 291 |
| | Diamba Sud Gold Project, Kédougou Region, Senegal Technical Report |
| 27 | References |
Allibone, A., Lawrence, D., Scott, J., Fanning, M., Lambert-Smith, J., Stenhouse, P., Harbidge, R., Vargas, C., Turnbull, R., & Holliday, J. (2020). Chapter 7: Paleoproterozoic Gold Deposits of the Loulo District, Western Mali. In R. H. Sillitoe, R. J. Goldfarb, F. Robert, and S. F. Simmons (Eds.), Geology of the World's Major Gold Deposits and Provinces (pp. 141–162). Society of Economic Geologists.
Australian Institute of Mining and Metallurgy (AusIMM). 2001. Monograph 9: Field Geologists Manual (4th ed.). RossCo Print, Victoria, Australia.
Australian National Committee on Large Dams (ANCOLD). 2019. Australian non-government, non-profit and voluntary association of organizations and individual professionals with a common technical interest in large dam safety and their environs.
CIM 2019. CIM Estimation of Mineral Resources and Mineral Reserves – Best Practice Guidelines. Prepared by the CIM Mineral Resource and Mineral Reserve Committee. Adopted by the CIM Council, November 29, 2019.
CIM, 2014. CIM Definition Standards on Mineral Resources and Mineral Reserves. Prepared by the CIM Standing Committee on Reserve Definitions. Adopted by the CIM Council, May 10, 2014.
Diallo, M., Baratoux, L., Dufréchou, G., Jessell, M. W., Vanderhaeghe, O., Ly, S., & Baratoux, D. (2020). Structure of the Paleoproterozoic Kédougou-Kéniéba Inlier (Senegal-Mali) deduced from gravity and aeromagnetic data. Journal of African Earth Sciences, 162, Article 103732.
Dioh, E., Debat, P., Diallo, M., Bossière, G., Ba, D., Diop, H., & Dia, A. (2006). Diversity of the Palaeoproterozoic granitoids of the Kédougou inlier (eastern Senegal): Petrographical and geochemical constraints. Journal of African Earth Sciences, 44(3), 351–371.
Earth Systems, 2025. Diamba Sud Gold Project Environmental, Social Impact Assessment Study - Preliminary Version (Main Report, Hazard Study, Key Management Plans, and Technical Annexes). Oct 6, 2025.
Global Industry Standard on Tailings Management (GISTM). 2020. Co-convened by ICMM, PRI (Principles for Responsible Investment) and UNEP (United Nations Environmental Program). Standard released on August 5, 2020.
Knight Piesold Consulting, 2025a. Diamba Sud Gold Project – Feasibility Study Hydrogeological Assessment – Rev B. July 25, 2025.
Knight Piesold Consulting, 2025b. Diamba Sud Gold Project – Prefeasibility Study Water Balance Modelling Summary – rev 1. July 17, 2025
Knight Piesold Consulting, 2025c. Diamba Sud Gold Project – Prefeasibility TSF Design Study Summary – Rev 4. Oct 9, 2025.
Knight Piesold Consulting, 2026. Diamba Sud Gold Project – Groundwater DFS Update – Rev A. May 22, 2026
Lambert-Smith, J.S., Lawrence, D.M., Vargas, C.A., Boyce, A.J., Treloar, P.J. & Herbert, S. (2016). The Gounkoto Au deposit, West Africa: Constraints on ore genesis and volatile sources from petrological, fluid inclusion and stable isotope data. Ore Geology Reviews, 78, 606–622.
| June 30, 2026 | Page 285 of 291 |
| | Diamba Sud Gold Project, Kédougou Region, Senegal Technical Report |
Lambert-Smith, J. S., Allibone, A., Treloar, P. J., Lawrence, D. M., Boyce, A. J. and Fanning, M. (2020) Stable C, O, and S isotope record of magmatic-hydrothermal interactions between the Falémé Fe Skarn and the Loulo Au systems in Western Mali. Economic Geology, 115(7), pp. 1537-1558.
Lawrence, D. M., Treloar, P. J., Rankin, A. H., Harbidge, P., & Holliday, J. (2013). The Geology and Mineralogy of the Loulo Mining District, Mali, West Africa: Evidence for Two Distinct Styles of Orogenic Gold Mineralization. Economic Geology, 108(2), 199-227.
Masurel, Q., Eglinger, A., Thébaud, N. et al. Paleoproterozoic gold events in the southern West African Craton: review and synopsis. Miner Deposita 57, 513–537 (2022).
Piteau Associates, 2025. Diamba Sud Project – Geotechnical Pit Slope Design Update. July 7, 2025.
Piteau Associates, 2026. Diamba Sud Project – 2025 – 2026 Geotechnical Pit Design Review for Diamba Sud Project. May 13, 2026
Pons, J., Oudin, C., & Valéro, J. (1992). Kinematics of Large Syn-Orogenic Intrusions: Example of the Lower Proterozoic Saraya Batholith (Eastern Senegal). Geologische Rundschau, 82(3), 473–486.
Read, J. and Stacey P. 2009. Guidelines for open pit slope design.
Weedon, P., Chapman, E.N., Espinoza R., Veillette, M., & Leendert, L. 2025. Technical Report on the Diamba Sud Gold Project, Senegal, prepared for Fortuna Silver Mines Inc., effective date October 15, 2025.
| June 30, 2026 | Page 286 of 291 |
| | Diamba Sud Gold Project, Kédougou Region, Senegal Technical Report |
Certificates
CERTIFICATE of QUALIFIED PERSON
I, Eric Chapman, Senior Vice President of Technical Services for Fortuna Mining Corp.(“Fortuna”), 820-1111 Melville St, Vancouver, BC V6E 3V6 Canada; do hereby certify that:
1. I am a co-author of the technical report prepared for Fortuna titled “Diamba Sud Gold Project, Kédougou Region, Senegal” that has an effective date of June 30, 2026 (the “Technical Report”).
2. I graduated with a Bachelor of Science (Honors) Degree in Geology from the University of Southampton (UK) in 1996 and a Master of Science (Distinction) Degree in Mining Geology from the Camborne School of Mines (UK) in 2003. I am a Professional Geologist of the Engineers and Geoscientists of the Province of British Columbia (Registration No. 36328) and a Chartered Geologist of the Geological Society of London (Membership No. 1007330). I have been practicing as a geoscientist and preparing Mineral Resource estimates for approximately 23 years and have completed more than 30 resource estimates for a variety of deposit types such as epithermal gold/silver veins, porphyry and orogenic gold deposits, and volcanogenic massive sulfide deposits. I have completed at least 15 Mineral Resource estimates for precious metal projects over the past five years.
As a result of my experience and qualifications, I am a Qualified Person as defined in National Instrument 43–101 Standards of Disclosure for Mineral Projects (“NI 43–101”).
3. I last visited the Diamba Sud Project on March 23 to 25, 2026, a duration of three days.
4. I am responsible for the preparation of Sections 1.1 to 1.4, 1.7, 1.9, 1.19 and the introduction to Section 1.20; Sections 2.1, 2.2, 2.3.1, and 2.4 to 2.7; Sections 3 to 6; Sections 10.3 and 10.4.1; Sections 12.1 to 12.3, 12.5, 12.6, 12.7.1 and 12.8; Section 14; Sections 25.1, 25.4, 25.6 and 25.14; Section 26.1 and Section 27 of the Technical Report.
5. I am not independent of Fortuna as independence is described by Section 1.5 of NI 43–101, as I am a Fortuna employee.
6. I have been involved with the Diamba Sud Project which is the subject of the Technical Report since September 2023, as I am a co-author and Qualified Person of a previous technical report on the Diamba Sud Project which is dated effective October 15, 2025.
7. I have read NI 43–101, and the sections of the Technical Report for which I am responsible have been prepared in compliance with that Instrument.
8. As at the effective date of the Technical Report, to the best of my knowledge, information and belief, the sections of the Technical Report for which I am responsible contain all scientific and technical information that is required to be disclosed to make the Technical Report not misleading.
Dated July 13, 2026.
[signed]
Eric Chapman, P. Geo.
| June 30, 2026 | Page 287 of 291 |
| | Diamba Sud Gold Project, Kédougou Region, Senegal Technical Report |
CERTIFICATE of QUALIFIED PERSON
I, Paul Weedon, Senior Vice President, Exploration of Fortuna Mining Corp. (“Fortuna”), 820-1111 Melville St, Vancouver, BC V6E 3V6 Canada, do hereby certify that:
1. I am a co-author of the technical report prepared for Fortuna titled “Diamba Sud Gold Project, Kédougou Region, Senegal” that has an effective date of June 30, 2026 (the “Technical Report”).
2. I graduated from Curtin University, Western Australia in December 1991 with a Bachelor of Science (Geology), and a Post Graduate Diploma of Economic Geology (Distinction) and have practiced my profession continuously since 1991. I am a professional Geologist and a Member of the Australian Institute of Geoscientists (MAIG #6001). I have worked across all roles of exploration and mining geology, covering open-pit and underground gold mining in production roles up to Technical Services Manager for large-scale, complex operations. My exploration experience extends from project generation through to project development and corporate roles. These roles have been conducted across Australasia, Africa, and Latin America. I have held my current position of Senior Vice President – Exploration for Fortuna Mining Corp. since October 2021.
As a result of my experience and qualifications, I am a Qualified Person as defined in National Instrument 43–101 Standards of Disclosure for Mineral Projects (“NI 43–101”).
3. I last visited the Diamba Sud Project from June 18 to June 24, 2026, a duration of seven days.
4. I am responsible for the preparation of Sections 1.5, 1.6, 1.19.1 and 1.20.1; Section 2.3.2; Sections 7 to 9; Sections 10.1, 10.2, 10.4 to 10.9; Section 11; Sections 12.4 and 12.7.2; Sections 25.2, 25.3 and 25.14.1; Section 26.2 and Section 27 of the Technical Report.
5. I am not independent of Fortuna as independence is described by Section 1.5 of NI 43–101, as I am a Fortuna employee.
6. I have been involved with the Diamba Sud Project which is the subject of the Technical Report since September 2023, as I am a co-author and Qualified Person of a previous technical report on the Diamba Sud Project which is dated effective October 15, 2025.
7. I have read NI 43–101, and the sections of the Technical Report for which I am responsible have been prepared in compliance with that Instrument.
8. As at the effective date of the Technical Report, to the best of my knowledge, information and belief, the sections of the Technical Report for which I am responsible contain all scientific and technical information that is required to be disclosed to make the Technical Report not misleading.
Dated July 13, 2026.
[signed]
Paul Weedon, MAIG
| June 30, 2026 | Page 288 of 291 |
| | Diamba Sud Gold Project, Kédougou Region, Senegal Technical Report |
CERTIFICATE of QUALIFIED PERSON
I, Raul Espinoza, Technical Services Director for Fortuna Mining Corp. (“Fortuna”), 820-1111 Melville St, Vancouver, BC V6E 3V6 Canada; do hereby certify that:
1. I am a co-author of the technical report prepared for Fortuna titled “Diamba Sud Gold Project, Kédougou Region, Senegal” that has an effective date of June 30, 2026 (the “Technical Report”).
2. I graduated with a Bachelor of Science Degree in Mining Engineering from Pontificia Universidad Catolica del Peru in 2001 and a Master of Engineering Science in Mining from Curtin University, Australia, in 2015. I am a Fellow of the Australasian Institute of Mining and Metallurgy and registered as a Chartered Professional in Mining - FAusIMM (CP) with Membership No. 309581. I have practiced my profession for 25 years and have been preparing Mineral Reserve estimates for approximately 12 years. My experience has covered operational, technical, managerial and consultancy functions for open pit and underground mines from early-stage projects through to producing mines in Peru, Argentina, Australia, Canada, Mexico, Burkina Faso, and Ivory Coast.
As a result of my experience and qualifications, I am a Qualified Person as defined in National Instrument 43–101 Standards of Disclosure for Mineral Projects (“NI 43–101”).
3. I last visited the Diamba Sud Project on March 23 to 25, 2026, a duration of three days.
4. I am responsible for the preparation of Sections 1.10, 1.11, 1.14 to 1.18, 1.19.2, 1.19.5, 1.20.5 and 1.20.6; Section 2.3.4; Section 12.7.3; Section 15; Sections 16.1, 16.4, 16.5.1, 16.5.2, and 16.6 to 16.8; Sections 18.1, 18.2, 18.7 to 18.10, 18.12 to 18.16 and 18.19; Sections 19 to 24; Sections 25.7, 25.9 to 25.13, 25.14.2 and 25.14.5; Sections 26.6 and 26.7; and Section 27 of the Technical Report.
5. I am not independent of Fortuna as independence is described by Section 1.5 of NI 43–101, as I am a Fortuna employee.
6. I have been involved with the Diamba Sud Project, which is the subject of the Technical Report since September 2023, as I am a co-author and Qualified Person of a previous technical report on the Diamba Sud Project which is dated effective October 15, 2025.
7. I have read NI 43–101, and the sections of the Technical Report for which I am responsible have been prepared in compliance with that Instrument.
8. As at the effective date of the Technical Report, to the best of my knowledge, information and belief, the sections of the Technical Report for which I am responsible contain all scientific and technical information that is required to be disclosed to make the Technical Report not misleading.
Dated July 13, 2026.
[signed]
Raul Espinoza, FAusIMM (CP)
| June 30, 2026 | Page 289 of 291 |
| | Diamba Sud Gold Project, Kédougou Region, Senegal Technical Report |
CERTIFICATE of QUALIFIED PERSON
I, Mathieu F. Veillette, Director, Geotechnical, Tailings and Water for Fortuna Mining Corp. (“Fortuna”), 820-1111 Melville St, Vancouver, BC V6E 3V6 Canada; do hereby certify that:
1. I am a co-author of the technical report prepared for Fortuna titled “Diamba Sud Gold Project, Kédougou Region, Senegal” that has an effective date of June 30, 2026 (the “Technical Report”).
2. I graduated with a Bachelor of Science Degree in Civil Engineering in 1997 from Queen’s University and a Graduate Diploma Business Administration from Simon Fraser University in 2018. I am a Professional Engineer of the Association of Professional Engineers and Geoscientists of the Province of British Columbia (Registration No. 28397), also a Professional Engineer in Colorado (Registration No. 36639) and Alaska (Registration No. 10914). I have practiced my profession continuously for 29 years in geotechnical and water management related fields. The majority of my experience has been in the mining industry including international projects on all stages of the mining process from advanced exploration through decommissioning and reclamation. My relevant work experience includes analysis, site investigations, design, construction, dewatering and operation of open pits, waste dumps, heap leach pads, tailings storage facilities, process ponds, water dams, diversion structures and other mining facilities in Canada (BC, QC), USA (CO, UT, NM, AZ, MT, AK, SC), México, Panamá, Venezuela, Guyana, Peru, Chile, Argentina, Bolivia, Cote d’Ivoire, Burkina Faso, Senegal, Australia, New Zealand and New Caledonia.
As a result of my experience and qualifications, I am a Qualified Person as defined in National Instrument 43–101 Standards of Disclosure for Mineral Projects (“NI 43–101”).
3. I last visited the Diamba Sud Project from March 23 to 25, 2026, a duration of three days.
4. I am responsible for the preparation of Sections 1.13, 1.19.4, 1.20.2 and 1.20.3; Section 2.3.3; Section 12.7.4; Sections 16.2, 16.3, 16.5.3 and 16.5.4; Sections 18.3 to 18.6, 18.11, 18.17 and 18.18; Section 25.14.4; Sections 26.3 and 26.4; and Section 27 of the Technical Report.
5. I am not independent of Fortuna as independence is described by Section 1.5 of NI 43–101, as I am a Fortuna employee.
6. I have been involved with the Diamba Sud Project which is the subject of the Technical Report since September 2023, as I am a co-author and Qualified Person of a previous technical report on the Diamba Sud Project which is dated effective October 15, 2025.
7. I have read NI 43–101, and the sections of the Technical Report for which I am responsible have been prepared in compliance with that Instrument.
8. As at the effective date of the Technical Report, to the best of my knowledge, information and belief, the sections of the Technical Report for which I am responsible contain all scientific and technical information that is required to be disclosed to make the Technical Report not misleading.
Dated July 13, 2026.
[signed]
Mathieu F. Veillette, P. Eng.
| June 30, 2026 | Page 290 of 291 |
| | Diamba Sud Gold Project, Kédougou Region, Senegal Technical Report |
CERTIFICATE of QUALIFIED PERSON
I, Ruan Venter, Manager of Process of Lycopodium (Americas) Ltd, 5090 Explorer Drive, Suite 700, Mississauga, ON L4W 4T9, Canada, do hereby certify that:
1. I am a co-author of the technical report prepared for Fortuna Mining Corp. (“Fortuna”) titled “Diamba Sud Gold Project, Kédougou Region, Senegal” that has an effective date of June 30, 2026 (the “Technical Report”).
2. I am a graduate of the North-West University, Potchefstroom, South Africa and hold a Bachelor of Engineering degree in Chemical Engineering with Specialization in Mineral Processing (2011). I am a member of Professional Engineers Ontario and registered as a Professional Engineer with membership #100592368. I have practiced my profession continuously for 15 years with metallurgical and operational experience in platinum flotation, chromite foundry sands, and gold operations within South Africa and East Africa; and was lead process engineer on gold and sulfide flotation projects ranging from testwork management, all phases of studies and detail design, up to commissioning of numerous projects as well as commissioning manager on three projects in Africa and Canada.
As a result of my experience and qualifications, I am a Qualified Person as defined in National Instrument 43–101 Standards of Disclosure for Mineral Projects (“NI 43–101”).
3. I last visited the Diamba Sud Project from March 23 to 25, 2026, a duration of three days.
4. I am responsible for the preparation of Sections 1.8, 1.12, 1.19.3 and 1.20.4; Section 2.3.5; Section 12.7.5; Section 13; Section 17; Sections 25.5, 25.8 and 25.14.3; and Section 26.5 of the Technical Report.
5. I am independent of Fortuna as independence is described by Section 1.5 of NI 43–101.
6. I have been involved with the Diamba Sud Project’s metallurgical testwork review and interpretation as well as process design which is the subject of the Technical Report since April 2025.
7. I have read NI 43–101, and the sections of the Technical Report for which I am responsible have been prepared in compliance with that Instrument.
8. As at the effective date of the Technical Report, to the best of my knowledge, information and belief, the sections of the Technical Report for which I am responsible contain all scientific and technical information that is required to be disclosed to make the Technical Report not misleading.
Dated July 13, 2026.
[signed]
Ruan Venter, P. Eng.
| June 30, 2026 | Page 291 of 291 |