Pay vs Performance Disclosure
number in Thousands
number in Thousands
Mar. 31, 2026
USD ($)
$ / shares
Mar. 31, 2025
USD ($)
$ / shares
Mar. 31, 2024
USD ($)
$ / shares
Mar. 31, 2023
USD ($)
$ / shares
Mar. 31, 2022
USD ($)
$ / shares
Value of Initial Fixed $100 Investment Based On: | |||||||||||||||||||||||||||||
Fiscal Year | Summary Compensation Table Total for PEO(1) | Compensation Actually Paid to PEO(2) | Average Summary Compensation Table Total for non-PEO NEOs(3) | Average Compensation Actually Paid to non-PEO NEOs(2)(3) | Total Shareholder Return(4) | Peer Group Total Shareholder Return(4) | Net Income (Loss)(5) | Adjusted EBITDA(6) | Net Revenue(7) | ||||||||||||||||||||
(in thousands) | |||||||||||||||||||||||||||||
(a) | (b) | (c) | (d) | (e) | (f) | (g) | (h) | (i) | (j) | ||||||||||||||||||||
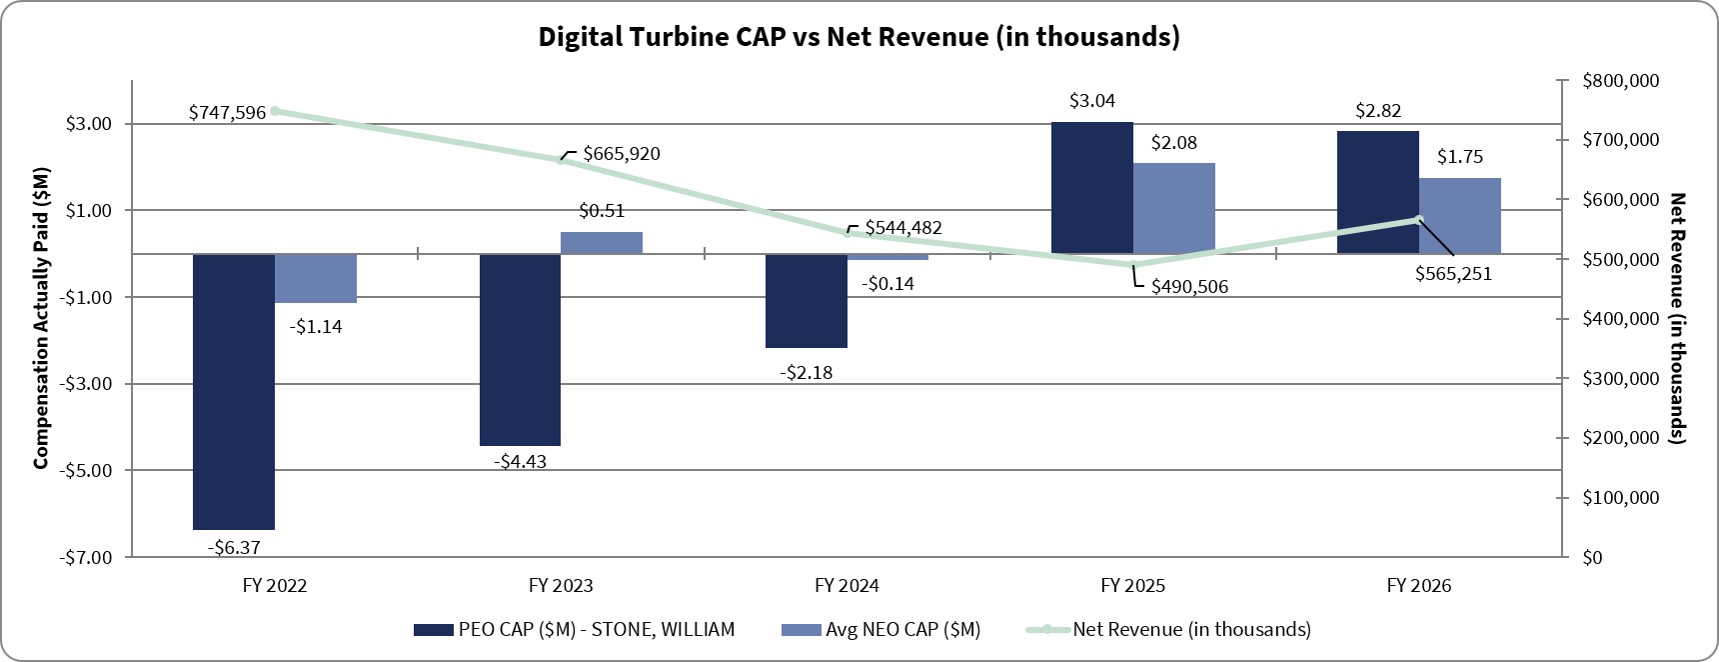
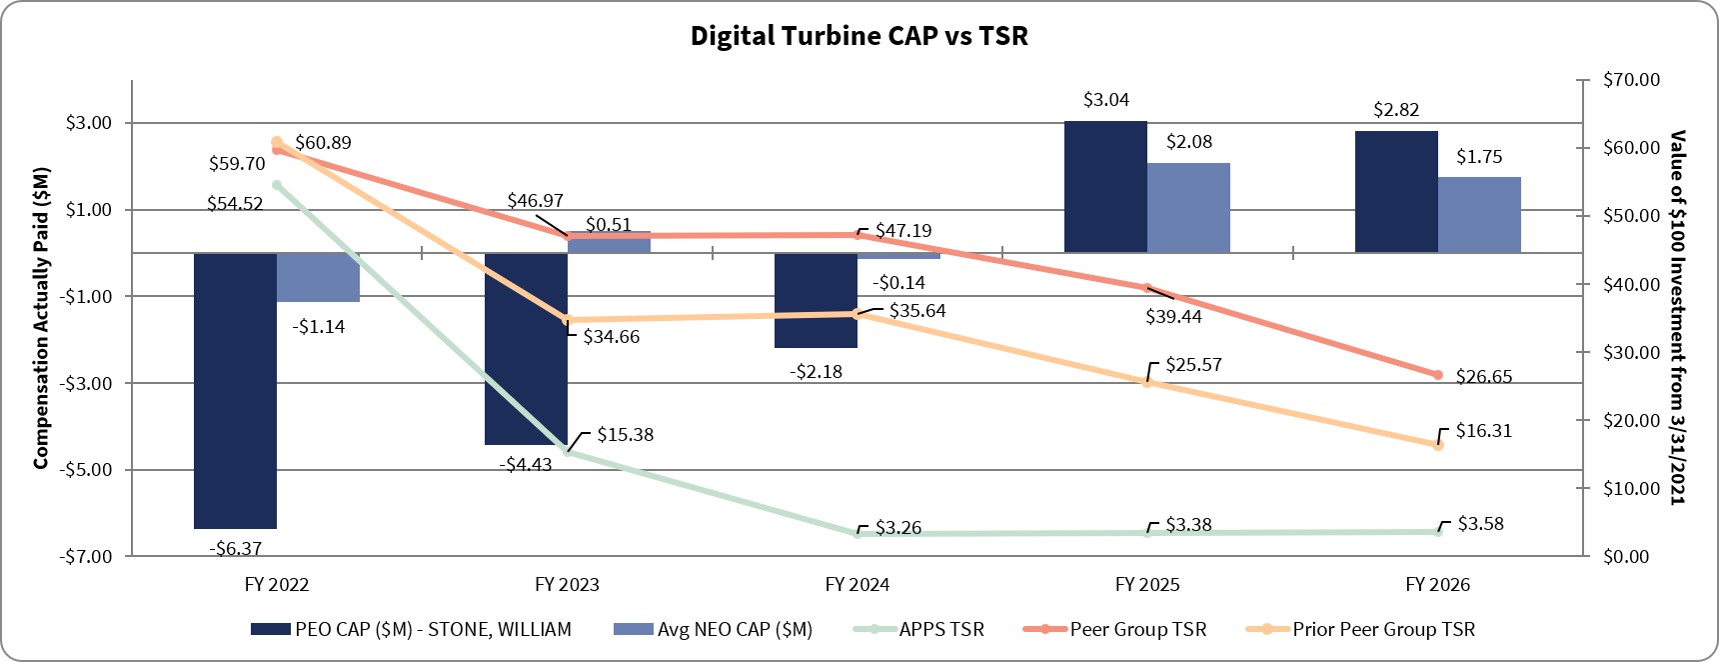
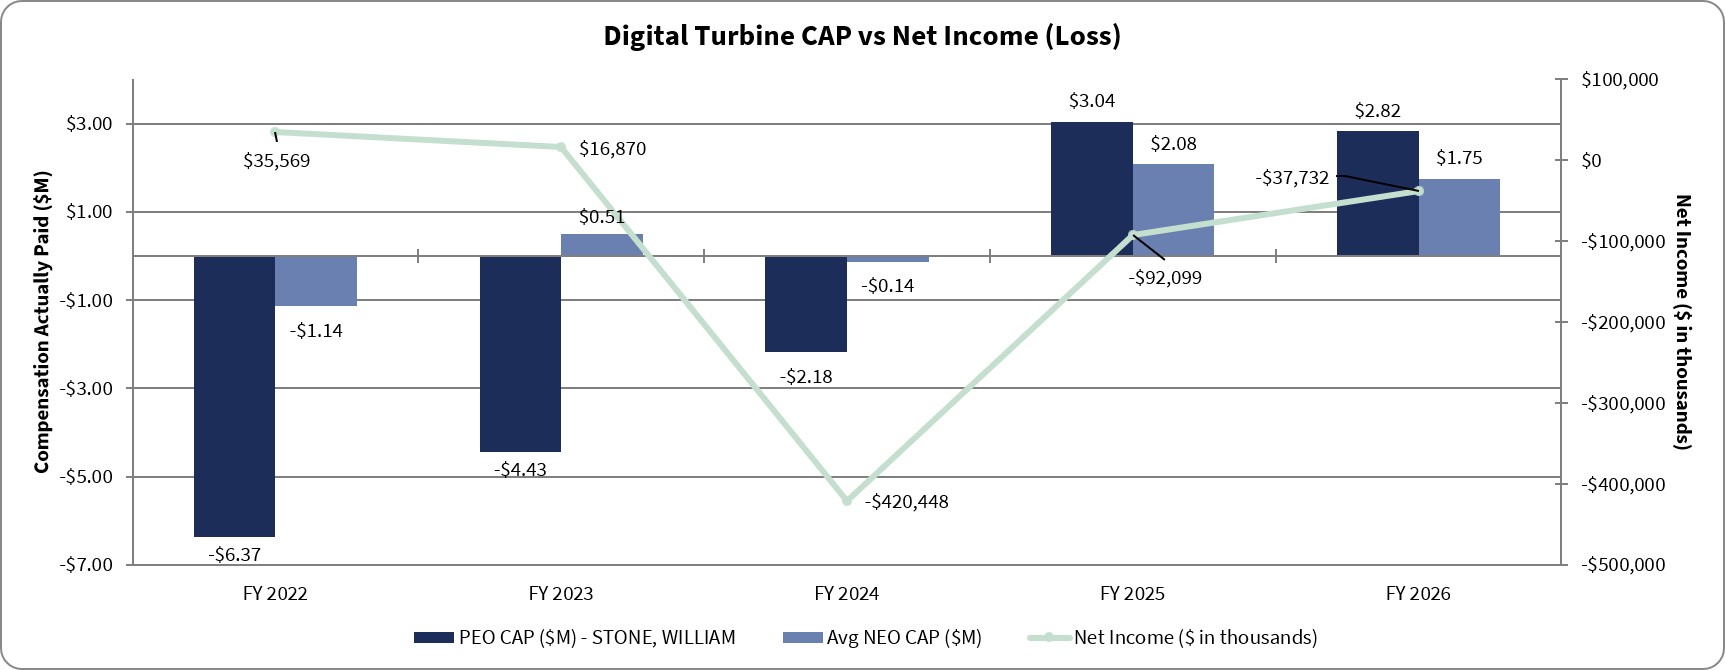
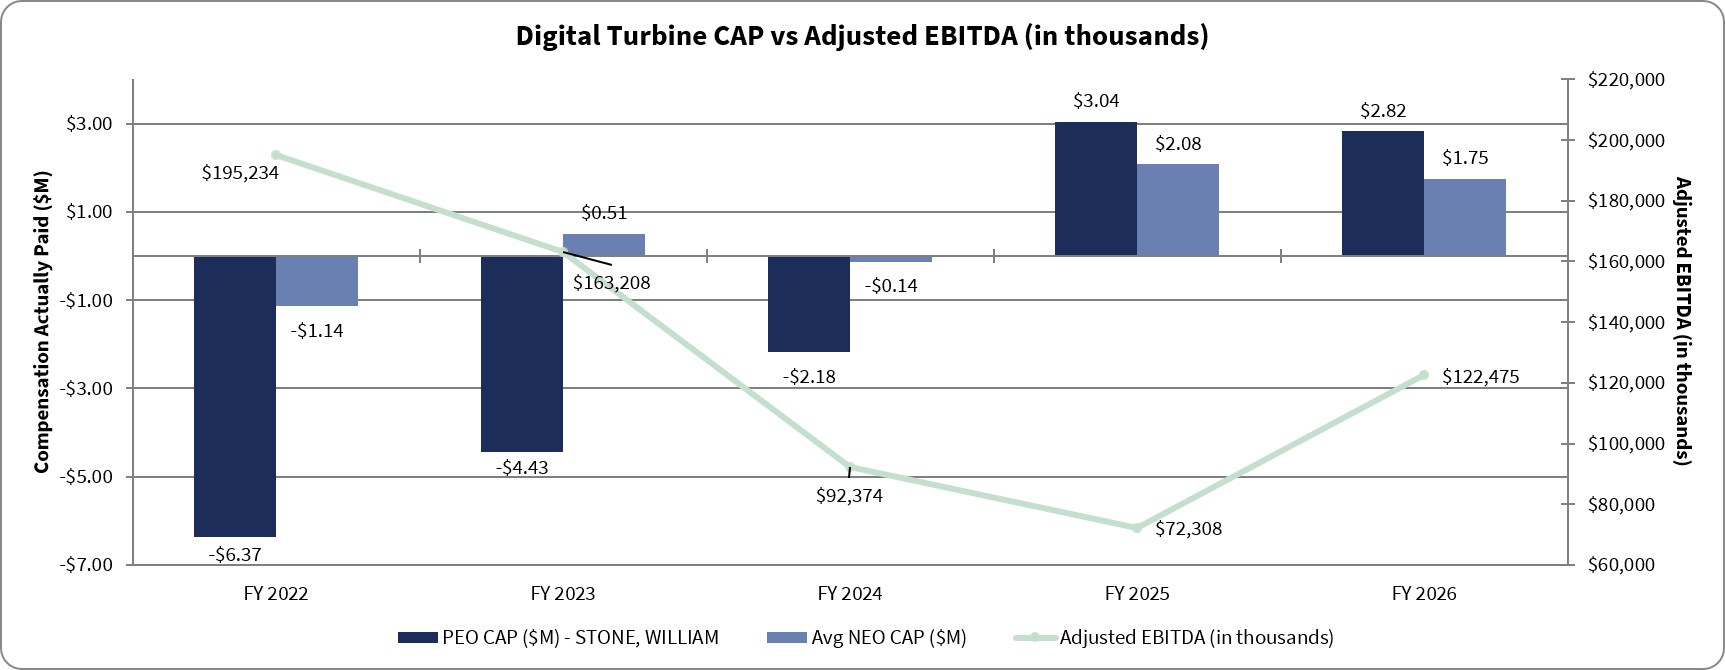
2026 | $ | 4,789,499 | $ | 2,822,141 | $ | 1,698,296 | $ | 1,748,232 | $ | 3.58 | $ | 26.65 | $ | (37,732) | $ | 122,475 | $ | 565,251 | |||||||||||
2025 | 2,483,750 | 3,042,741 | 2,221,074 | 2,080,753 | 3.38 | 39.44 | (92,099) | 72,308 | 490,506 | ||||||||||||||||||||
2024 | 7,904,631 | (2,181,012) | 2,604,263 | (139,030) | 3.26 | 47.19 | (420,448) | 92,374 | 544,482 | ||||||||||||||||||||
2023 | 8,216,442 | (4,432,027) | 2,188,452 | 505,401 | 15.38 | 46.97 | 16,870 | 163,208 | 665,920 | ||||||||||||||||||||
2022 | 7,748,317 | (6,366,994) | 1,005,692 | (1,136,768) | 54.52 | 59.70 | 35,569 | 195,234 | 747,596 | ||||||||||||||||||||
PEO | |||||||||||
FY 2026 | |||||||||||
SCT Total | $ | 4,789,499 | |||||||||
- | Grant Date Fair Value of Option Awards and Stock Awards Granted in Fiscal Year(a) | (3,000,000) | |||||||||
+ | Fair Value at Fiscal Year-End of Outstanding and Unvested Option Awards and Stock Awards Granted in Fiscal Year(b)(i) | 1,923,752 | |||||||||
+ | Change in Fair Value of Outstanding and Unvested Option Awards and Stock Awards Granted in Prior Fiscal Years(b)(ii) | (1,314,792) | |||||||||
+ | Fair Value at Vesting of Option Awards and Stock Awards Granted in Fiscal Year That Vested During Fiscal Year(b)(iii) | — | |||||||||
+ | Change in Fair Value as of Vesting Date of Option Awards and Stock Awards Granted in Prior Fiscal Years for Which Applicable Vesting Conditions Were Satisfied During Fiscal Year(b)(iv) | 423,682 | |||||||||
- | Fair Value as of Prior Fiscal Year-End of Option Awards and Stock Awards Granted in Prior Fiscal Years That Failed to Meet Applicable Vesting Conditions During Fiscal Year(b)(v) | — | |||||||||
Compensation Actually Paid | $ | 2,822,141 | |||||||||
(a)The grant date fair value of equity awards represents the total of the amounts reported in the “Stock Awards” and “Option Awards” columns in the Summary Compensation Table for the applicable year.
(b)The equity award adjustments for each applicable year include the addition (or subtraction, as applicable) of the following: (i) the year-end fair value of any equity awards granted in the applicable year that are outstanding and unvested as of the end of the year; (ii) the amount of change as of the end of the applicable year (from the end of the prior fiscal year) in fair value of any awards granted in prior years that are outstanding and unvested as of the end of the applicable year; (iii) for awards that are granted and vest in same applicable year, the fair value as of the vesting date; (iv) for awards granted in prior years that vest in the applicable year, the amount equal to the change as of the vesting date (from the end of the prior fiscal year) in fair value; (v) for awards granted in prior years that are determined to fail to meet the applicable vesting conditions during the applicable year, a deduction for the amount equal to the fair value at the end of the prior fiscal year; and (vi) the dollar value of any dividends or other earnings paid on stock or option awards in the applicable year prior to the vesting date that are not otherwise reflected in the fair value of such award or included in any other component of total compensation for the applicable year.
NEO | |||||||||||
FY 2026 | |||||||||||
SCT Total | $ | 1,698,296 | |||||||||
- | Grant Date Fair Value of Option Awards and Stock Awards Granted in Fiscal Year | (922,500) | |||||||||
+ | Fair Value at Fiscal Year-End of Outstanding and Unvested Option Awards and Stock Awards Granted in Fiscal Year | 623,982 | |||||||||
+ | Change in Fair Value of Outstanding and Unvested Option Awards and Stock Awards Granted in Prior Fiscal Years | (134,026) | |||||||||
+ | Fair Value at Vesting of Option Awards and Stock Awards Granted in Fiscal Year That Vested During Fiscal Year | 7,083 | |||||||||
+ | Change in Fair Value as of Vesting Date of Option Awards and Stock Awards Granted in Prior Fiscal Years for Which Applicable Vesting Conditions Were Satisfied During Fiscal Year | 475,397 | |||||||||
- | Fair Value as of Prior Fiscal Year-End of Option Awards and Stock Awards Granted in Prior Fiscal Years That Failed to Meet Applicable Vesting Conditions During Fiscal Year | — | |||||||||
Compensation Actually Paid | $ | 1,748,232 | |||||||||
PEO | |||||||||||
FY 2026 | |||||||||||
SCT Total | $ | 4,789,499 | |||||||||
- | Grant Date Fair Value of Option Awards and Stock Awards Granted in Fiscal Year(a) | (3,000,000) | |||||||||
+ | Fair Value at Fiscal Year-End of Outstanding and Unvested Option Awards and Stock Awards Granted in Fiscal Year(b)(i) | 1,923,752 | |||||||||
+ | Change in Fair Value of Outstanding and Unvested Option Awards and Stock Awards Granted in Prior Fiscal Years(b)(ii) | (1,314,792) | |||||||||
+ | Fair Value at Vesting of Option Awards and Stock Awards Granted in Fiscal Year That Vested During Fiscal Year(b)(iii) | — | |||||||||
+ | Change in Fair Value as of Vesting Date of Option Awards and Stock Awards Granted in Prior Fiscal Years for Which Applicable Vesting Conditions Were Satisfied During Fiscal Year(b)(iv) | 423,682 | |||||||||
- | Fair Value as of Prior Fiscal Year-End of Option Awards and Stock Awards Granted in Prior Fiscal Years That Failed to Meet Applicable Vesting Conditions During Fiscal Year(b)(v) | — | |||||||||
Compensation Actually Paid | $ | 2,822,141 | |||||||||
(a)The grant date fair value of equity awards represents the total of the amounts reported in the “Stock Awards” and “Option Awards” columns in the Summary Compensation Table for the applicable year.
(b)The equity award adjustments for each applicable year include the addition (or subtraction, as applicable) of the following: (i) the year-end fair value of any equity awards granted in the applicable year that are outstanding and unvested as of the end of the year; (ii) the amount of change as of the end of the applicable year (from the end of the prior fiscal year) in fair value of any awards granted in prior years that are outstanding and unvested as of the end of the applicable year; (iii) for awards that are granted and vest in same applicable year, the fair value as of the vesting date; (iv) for awards granted in prior years that vest in the applicable year, the amount equal to the change as of the vesting date (from the end of the prior fiscal year) in fair value; (v) for awards granted in prior years that are determined to fail to meet the applicable vesting conditions during the applicable year, a deduction for the amount equal to the fair value at the end of the prior fiscal year; and (vi) the dollar value of any dividends or other earnings paid on stock or option awards in the applicable year prior to the vesting date that are not otherwise reflected in the fair value of such award or included in any other component of total compensation for the applicable year.
NEO | |||||||||||
FY 2026 | |||||||||||
SCT Total | $ | 1,698,296 | |||||||||
- | Grant Date Fair Value of Option Awards and Stock Awards Granted in Fiscal Year | (922,500) | |||||||||
+ | Fair Value at Fiscal Year-End of Outstanding and Unvested Option Awards and Stock Awards Granted in Fiscal Year | 623,982 | |||||||||
+ | Change in Fair Value of Outstanding and Unvested Option Awards and Stock Awards Granted in Prior Fiscal Years | (134,026) | |||||||||
+ | Fair Value at Vesting of Option Awards and Stock Awards Granted in Fiscal Year That Vested During Fiscal Year | 7,083 | |||||||||
+ | Change in Fair Value as of Vesting Date of Option Awards and Stock Awards Granted in Prior Fiscal Years for Which Applicable Vesting Conditions Were Satisfied During Fiscal Year | 475,397 | |||||||||
- | Fair Value as of Prior Fiscal Year-End of Option Awards and Stock Awards Granted in Prior Fiscal Years That Failed to Meet Applicable Vesting Conditions During Fiscal Year | — | |||||||||
Compensation Actually Paid | $ | 1,748,232 | |||||||||
(3)The dollar amounts reported under Average Summary Compensation Table Total for Non-PEO NEOs represent the average of the amounts reported for the Company’s NEOs as a group (excluding the PEO) in the “Total” column of the Summary Compensation Table in each applicable year. The dollar amounts reported under Average Compensation Actually Paid for Non-PEO NEOs represent the average amount of “compensation actually paid” to the NEOs as a group (excluding the PEO), as computed in accordance with Item 402(v) of Regulation S-K. The dollar amounts do not reflect the actual average amount of compensation earned by or paid to the NEOs as a group (excluding the PEO) during the applicable year. The adjustments noted in Note 2 above were made to average total compensation for the NEOs as a group (excluding the PEO) for each year to determine the compensation actually paid, using the same methodology described above in Note 2. For 2026, reflects compensation information for our NEOs, other than our CEO, as described in the Compensation Discussion and Analysis of this Proxy Statement. For 2025, reflects compensation information for Mr. Lasher, Mr. Kanagaratnam, Mr. Kinsell and Mr. Garrison. For 2024, reflects
compensation information for Mr. Garrison, Mr. Gillis, Mr. Kanagaratnam and Mr. Miller. For 2023, reflects compensation information for Mr. Garrison, Mr. Gillis, Mr. Kanagaratnam and Mr. Miller. For 2022, reflects compensation information for Mr. Garrison, Mr. Miller, Mr. Gillis, and Ms. Christine Collins.
We believe the table above shows the alignment between compensation actually paid to the NEOs and the Company’s performance, consistent with our compensation philosophy as described in our Compensation Discussion and Analysis in this Proxy Statement. The charts below show, for the past three years, the relationship of the Company’s TSR relative to its peers as well as the relationship between the PEO and NEO “compensation actually paid” and (i) the Company’s TSR; (ii) the Company’s net income (loss); (iii) the Company’s adjusted EBITDA; and (iv) the Company’s revenue.
Most Important Performance Measures | ||
Adjusted EBITDA | ||
Net Revenue | ||
Net Income | ||
TSR | ||