Pay vs Performance Disclosure - USD ($)
Dec. 31, 2025
Dec. 31, 2024
Dec. 31, 2023
Pay Versus Performance Table
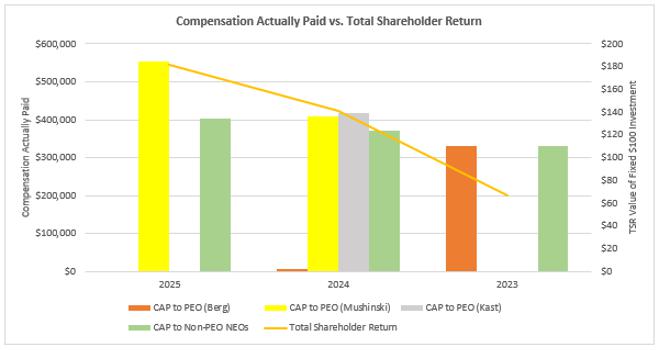
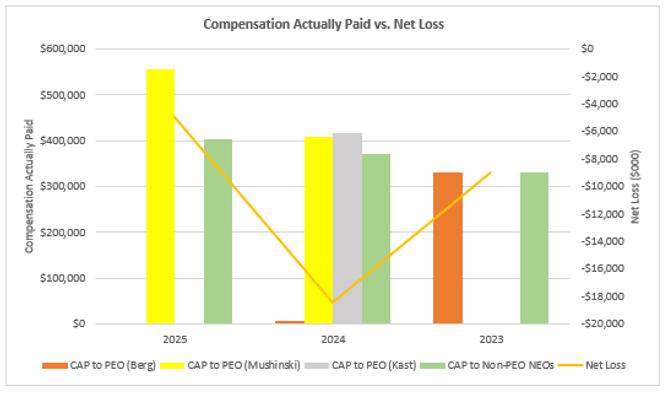
| Year | SCT Total for PEO (Berg) | SCT Total for PEO (Kast) | SCT Total for PEO (Mushinski) | CAP to PEO (Berg) | CAP to PEO (Kast) | CAP to PEO (Mushinski) | SCT Total for Non-PEO NEOs | CAP to Non-PEO NEOs | Value of Initial Fixed $100 Investment Based on Total Shareholder Return | Net Loss (dollars in thousands) | ||||||||||||||||||||||||||||||
| (a) | (b) | (b) | (b) | (c) | (c) | (c) | (d) | (e) | (f) | (g) | ||||||||||||||||||||||||||||||
| 2025 | $ | $ | $ | 555,000 | $ | $ | $ | 555,000 | $ | 403,800 | $ | 403,800 | $ | 181.28 | $ | (4,899 | ) | |||||||||||||||||||||||
| 2024 | $ | 70,359 | $ | 418,000 | $ | 410,023 | $ | 6,765 | $ | 418,000 | $ | 410,023 | $ | 367,758 | $ | 370,841 | $ | 140.84 | $ | (18,451 | ) | |||||||||||||||||||
| 2023 | $ | 357,320 | $ | $ | $ | 330,106 | $ | $ | $ | 348,791 | $ | 331,787 | $ | 66.79 | $ | (8,996 | ) | |||||||||||||||||||||||
| 1. | Mr. Berg was appointed the PEO on November 1, 2022, and served in that role until March 20, 2024. Ms. Kast served as the Company’s interim PEO during the period between Mr. Berg’s departure and Mr. Mushinski’s appointment. Mr. Mushinski was appointed as PEO on May 1, 2024. The following table contains a reconciliation of the amounts reflected in the SCT for each of Messrs. Berg and Mushinksi and Ms. Kast for each year covered in the PvP Table (as reported in column (b) above) as compared to the CAP to each of Messrs. Berg and Mushinksi and Ms. Kast for each such covered year (as reported in column (c) above). |
| Mr. Berg | Ms. Kast | Mr. Mushinski | ||||||||||||||||||
| 2023 | 2024 | 2024 | 2024 | 2025 | ||||||||||||||||
| SCT totals for PEOs for the covered year | $ | 357,320 | $ | 70,359 | $ | 418,000 | $ | 410,023 | $ | 555,000 | ||||||||||
| Less: Stock awards as reported in the SCT for the covered year | $ | $ | $ | $ | $ | |||||||||||||||
| Plus: Fair value of stock awards granted during the covered fiscal year - valued at year-end | $ | $ | $ | $ | $ | |||||||||||||||
| Plus (Minus): Change in fair value of stock awards granted in a prior fiscal year that vested during the covered year | $ | (6,343 | ) | $ | $ | $ | $ | |||||||||||||
| Plus (Minus): Change in fair value of stock awards granted in a prior fiscal year that were unvested at the end of covered year | $ | (20,871 | ) | $ | (63,594 | ) | $ | $ | $ | |||||||||||
| Compensation Actually Paid to the PEOs for the covered year | $ | 330,106 | $ | 6,765 | $ | 418,000 | $ | 410,023 | $ | 555,000 | ||||||||||
| 2. | The following table contains a reconciliation of the amounts reflected in the SCT for the Company’s non-PEO NEOs for each year covered in the PvP Table above (as reported in column (d) above) as compared to the CAP to the non-PEO NEO for each such covered year (as reported in column (e) above). The Company’s non-PEO NEOs whose compensation is used to calculate the amounts in the PvP Table above are Mr. Rich for fiscal years 2023, 2024 and 2025, Ms. Kast for fiscal years 2024 and 2025, and Jaye T. Pickarts for fiscal year 2024. |
| 2023 | 2024 | 2025 | ||||||||||
| SCT total for non-PEO NEO for the covered year | $ | 348,791 | $ | 367,758 | $ | 403,800 | ||||||
| Less: Stock awards as reported in the SCT for the covered year | $ | (43,791 | ) | $ | $ | |||||||
| Plus: Fair value of stock awards granted during the fiscal year that were unvested at the end of the fiscal year | $ | 12,423 | $ | $ | ||||||||
| Plus: Fair value of stock awards granted during the fiscal year that vested in the fiscal year | $ | 32,663 | $ | $ | ||||||||
| Plus (Minus): Change in fair value of stock awards granted in a prior fiscal year that vested during the covered year | $ | (5,320 | ) | $ | 953 | $ | ||||||
| Plus (Minus): Change in fair value of stock awards granted in a prior fiscal year that were unvested at the end of covered year | $ | (12,979 | ) | $ | 2,130 | $ | ||||||
| Compensation Actually Paid to the non-PEO NEO for the covered year | $ | 331,787 | $ | 370,841 | $ | 403,800 | ||||||
| Mr. Berg | Ms. Kast | Mr. Mushinski | ||||||||||||||||||
| 2023 | 2024 | 2024 | 2024 | 2025 | ||||||||||||||||
| SCT totals for PEOs for the covered year | $ | 357,320 | $ | 70,359 | $ | 418,000 | $ | 410,023 | $ | 555,000 | ||||||||||
| Less: Stock awards as reported in the SCT for the covered year | $ | $ | $ | $ | $ | |||||||||||||||
| Plus: Fair value of stock awards granted during the covered fiscal year - valued at year-end | $ | $ | $ | $ | $ | |||||||||||||||
| Plus (Minus): Change in fair value of stock awards granted in a prior fiscal year that vested during the covered year | $ | (6,343 | ) | $ | $ | $ | $ | |||||||||||||
| Plus (Minus): Change in fair value of stock awards granted in a prior fiscal year that were unvested at the end of covered year | $ | (20,871 | ) | $ | (63,594 | ) | $ | $ | $ | |||||||||||
| Compensation Actually Paid to the PEOs for the covered year | $ | 330,106 | $ | 6,765 | $ | 418,000 | $ | 410,023 | $ | 555,000 | ||||||||||
| 2. | The following table contains a reconciliation of the amounts reflected in the SCT for the Company’s non-PEO NEOs for each year covered in the PvP Table above (as reported in column (d) above) as compared to the CAP to the non-PEO NEO for each such covered year (as reported in column (e) above). The Company’s non-PEO NEOs whose compensation is used to calculate the amounts in the PvP Table above are Mr. Rich for fiscal years 2023, 2024 and 2025, Ms. Kast for fiscal years 2024 and 2025, and Jaye T. Pickarts for fiscal year 2024. |
| 2023 | 2024 | 2025 | ||||||||||
| SCT total for non-PEO NEO for the covered year | $ | 348,791 | $ | 367,758 | $ | 403,800 | ||||||
| Less: Stock awards as reported in the SCT for the covered year | $ | (43,791 | ) | $ | $ | |||||||
| Plus: Fair value of stock awards granted during the fiscal year that were unvested at the end of the fiscal year | $ | 12,423 | $ | $ | ||||||||
| Plus: Fair value of stock awards granted during the fiscal year that vested in the fiscal year | $ | 32,663 | $ | $ | ||||||||
| Plus (Minus): Change in fair value of stock awards granted in a prior fiscal year that vested during the covered year | $ | (5,320 | ) | $ | 953 | $ | ||||||
| Plus (Minus): Change in fair value of stock awards granted in a prior fiscal year that were unvested at the end of covered year | $ | (12,979 | ) | $ | 2,130 | $ | ||||||
| Compensation Actually Paid to the non-PEO NEO for the covered year | $ | 331,787 | $ | 370,841 | $ | 403,800 | ||||||