
Exhibit 99.2
Creating The Leading Pacific Banking Franchise July 13, 2026
Forward - looking Statements This communication may contain “forward - looking statements” within the meaning of the Private Securities Litigation Reform Act o f 1995, Section 27A of the Securities Act of 1933, as amended, and Section 21E of the Securities Exchange Act of 1934, as amended, including, among others, statements regarding the expected timing, completion and effects o f t he proposed business combination transaction between First Hawaiian, Inc. (“FHI”) and TriCo Bancshares (“TriCo”) (the “Transaction”) and the plans, objectives, expectations and intentions of FHI and TriCo. Any stateme nt that does not describe historical or current facts is a forward - looking statement. Forward - looking statements are often, but not always, made through the use of words or phrases such as “annualized,” “anticipate,” “believe,” “c ontinue,” “could,” “estimate,” “expect,” “goal,” “intend,” “may,” “might,” “outlook,” “plan,” “potential,” “predict,” “projection,” “seek,” “should,” “target,” “will,” “would” or the negative version of those words or other comparab le words or phrases of a future or forward - looking nature. FHI and TriCo caution that the forward - looking statements in this communication are not guarantees of future performance and inv olve a number of known and unknown risks, uncertainties and assumptions that are difficult to assess and are subject to change based on factors which are, in many instances, beyond FHI’s and TriCo’s control. A number of im portant factors could cause actual results to differ materially from those indicated in these forward - looking statements, including the following: changes in general economic, political, or industry conditions, and in condition s i mpacting the banking industry specifically; uncertainty in U.S. fiscal, monetary and trade policy, including the interest rate policies of the Federal Reserve Board or the effects of any declines in housing and commercial real estate pri ces, high or increasing unemployment rates, continued or renewed inflation, the impact of proposed or imposed tariffs by the U.S. government or retaliatory tariffs proposed or imposed by U.S. trading partners that could have an ad verse impact on customers or any recession or slowdown in economic growth particularly in the markets in which FHI and TriCo conduct business, including Hawaii, Guam, Saipan and California; volatility and disruptions in global cap ital and credit markets; the impact of bank failures or adverse developments at other banks on general investor sentiment regarding the stability and liquidity of banks; changes in interest rates that could significantly reduce net interest income and negatively affect asset yields and valuations and funding sources, including impacts on prepayment speeds; competitive pressures among financial institutions and nontraditional providers of financial services, inc lud ing on product pricing and services; concentrations within FHI’s or TriCo’s loan portfolio (including commercial real estate loans) or other asset classes, and the parties’ ability to attract and retain customer deposits, large lo ans to certain borrowers, access liquidity and capital, and manage deposit costs and funding sources; the success, impact, and timing of FHI’s and TriCo’s respective business strategies, including market acceptance of any new produ cts or services and FHI’s and TriCo’s ability to successfully implement strategic, operational, technology and integration initiatives; the failure to properly use and protect customer and employee information and data; cybersecurity ri sks , including the occurrence of fraudulent activity or a material breach of, or disruption to, the security of FHI’s, TriCo’s or their vendors’ systems; risks related to the development, implementation, use and management of artificial int elligence and other emerging technologies; the effects of failures or interruptions of information, communications or third - party service - provider systems; the nature, extent, timing, and results of governmental actions, examina tions, reviews, reforms, regulations, and interpretations; changes in laws or regulations; adverse weather conditions, natural disasters and other catastrophic events such as wildfires; the occurrence of any event, change or ot her circumstances that could give rise to the right of one or both of the parties to terminate the merger agreement to which FHI and TriCo are parties; the outcome of any legal proceedings that may be instituted against FHI or TriC o, including potential litigation relating to the Transaction; delays in completing the Transaction; the failure to obtain necessary regulatory approvals (and the risk that such approvals may result in the imposition of conditions that co uld adversely affect the combined company or the expected benefits of the Transaction); the failure to obtain stockholder or shareholder approvals, as applicable, or to satisfy any of the other conditions to the closing of the Transact ion on a timely basis or at all; changes in FHI’s or TriCo’s share price before closing, including as a result of the financial performance of the other party prior to closing, or more generally due to broader stock market movements, and the p erf ormance of financial companies and peer group companies; the possibility that the anticipated benefits of the Transaction are not realized when expected or at all, including as a result of the impact of, or problems arising from , t he integration of the two companies or as a result of the strength of the economy and competitive factors in the areas where FHI and TriCo do business; certain restrictions during the pendency of the proposed Transaction that may impa ct the parties’ ability to pursue certain business opportunities or strategic Transactions; the possibility that the Transaction may be more expensive to complete than anticipated, including as a result of unexpected factors or event s; diversion of management’s attention from ongoing business operations and opportunities; potential adverse reactions or changes to business or employee relationships, including those resulting from the announcement or comple tio n of the Transaction; the ability to complete the Transaction and integration of FHI and TriCo promptly and successfully; the dilution caused by FHI’s issuance of additional shares of its capital stock in connection with the Tran sac tion; and other factors that may affect the future results of FHI and TriCo. The foregoing factors should not be considered an exhaustive list and should be read together with the other cautionary state men ts set forth in FHI’s Annual Report on Form 10 - K for the year ended December 31, 2025 and its latest Quarterly Report on Form 10 - Q, which are on file with the Securities and Exchange Commission (the “SEC”) and available on FHI’s investor relations website, https://ir.fhb.com, under the heading “SEC Filings,” and in other documents FHI files with the SEC, and in TriCo’s Annual Report on Form 10 - K for the year ended December 31, 2025 and its latest Quarterly Report on Form 10 - Q, which are on file with the SEC and available on TriCo’s website, www.tcbk.com, under the “About” tab and the “Investor Relations” link and then under the heading “SEC Filings” and in other documents TriCo fi les with the SEC. If one or more events related to these or other risks or uncertainties materialize, or if our underlying assumptions prove to be incorrect, actual results may differ materially from what we anticipate. Accordingly, you sho uld not place undue reliance on any such forward - looking statements. Any forward - looking statement speaks only as of the date on which it is made, and neither FHI nor TriCo undertakes any obligatio n to update any forward - looking statement, whether as a result of new information, future developments or otherwise, except as required by applicable law. 2
Additional Information IMPORTANT ADDITIONAL INFORMATION AND WHERE TO FIND IT In connection with the proposed Transaction, FHI will file with the SEC a Registration Statement on Form S - 4 that will include a Joint Proxy Statement of FHI and TriCo and a Prospectus of FHI, as well as other relevant documents concerning the Transaction. Certain matters in respect of the Transaction involving FHI and TriCo will be submitted to FHI’s st ockholders and TriCo’s shareholders, as applicable, for their consideration. This communication does not constitute an offer to sell or the solicitation of an offer to buy any securities or a solicitati on of any vote or approval, nor shall there be any sale of securities, in any jurisdiction in which such offer, solicitation or sale would be unlawful prior to registration or qualification under the securities laws of any such jurisdict ion . INVESTORS, FHI STOCKHOLDERS AND TRICO SHAREHOLDERS ARE URGED TO READ THE REGISTRATION STATEMENT AND THE JOINT PROXY STATEMENT/PROSPECTUS REGARDING THE TRANSACTION WHEN THEY BECOME AVAILABLE AND ANY OTHER RELEVAN T D OCUMENTS FILED WITH THE SEC IN CONNECTION WITH THE TRANSACTION, AS WELL AS ANY AMENDMENTS OR SUPPLEMENTS TO THOSE DOCUMENTS, BECAUSE THEY WILL CONTAIN IMPORTANT INFORMATION. Stockholders or shareholders, as applicable, will be able to obtain a free copy of the definitive joint proxy statement/prosp ect us, as well as other filings containing information about the Transaction, FHI and TriCo, without charge, at the SEC’s website, www.sec.gov. Copies of the joint proxy statement/prospectus and the filings with the SEC that will be inc orp orated by reference in the joint proxy statement/prospectus can also be obtained, without charge, by directing a request to First Hawaiian, Inc., Attention: Secretary, 999 Bishop Street, Honolulu, HI 96813, (808) 525 - 7000 or to T riCo Bancshares, Attention: Shareholder Services, 63 Constitution Drive, Chico, CA 95973, (530) 898 - 0300. PARTICIPANTS IN THE SOLICITATION FHI, TriCo, and certain of their respective directors and executive officers may be deemed to be participants in the solicita tio n of proxies from FHI stockholders or TriCo shareholders in connection with the Transaction under the rules of the SEC. Information regarding FHI’s directors and executive officers is available in the sections entitled “Directors, Exec uti ve Officers and Corporate Governance” and “Security Ownership of Certain Beneficial Owners and Management and Related Stockholder Matters” in FHI’s Annual Report on Form 10 - K for the fiscal year ended December 31, 2025, which was file d with the SEC on February 27, 2026 (availabl e at https://www.sec.gov/ix?doc=/Archives/edgar/data/36377/000110465926021544/fhb - 20251231x10k.htm ); in the sections entitled “Corporate Governance and Board Matters,” “Compensation Discussion and Analysis,” “Executive Compensation Tables,” “Biographies of Executive Officers” and “Security Ownership of Certain Beneficial Owners, Directors and Ma nagement” in FHI’s definitive proxy statement relating to its 2026 Annual Meeting of Stockholders, which was filed with the SEC on March 12, 2026 (availabl e at https://www.sec.gov/ix?doc=/Archives/edgar/data/36377/000110465926026700/tm2532317 - 1_def14a.htm ); and other documents filed by FHI with the SEC. Information regarding TriCo’s directors and executive officers is available in the sections entitled “Directors, Executive Officers and C orp orate Governance” and “Security Ownership of Certain Beneficial Owners and Management and Related Stockholder Matters” in TriCo’s Annual Report on Form 10 - K for the fiscal year ended December 31, 2025, which was filed with the SEC on March 2, 2026 (availabl e at https://www.sec.gov/ix?doc=/Archives/edgar/data/356171/000035617126000010/tcbk - 20251231.htm ); in the sections entitled “Board of Directors,” “Corporate Governance, Board Nominations and Board Committees,” “Compensati on of Directors,” “Ownership of Voting Securities,” “Compensation Discussion and Analysis” and “Compensation of Named Executive Off icers” in TriCo’s definitive proxy statement relating to its 2026 Annual Meeting of Shareholders, which was filed with the SEC on April 17, 2026 (availab le at https://www.sec.gov/ix?doc=/Archives/edgar/data/356171/000035617126000033/tcbk - 20260417.htm ); and other documents filed by TriCo with the SEC. To the extent holdings of FHI common stock by the directors and executive officers of FHI or holdings of TriCo common stock by directors and executive off icers of TriCo have changed from the amounts held by such persons as reflected in the documents described above, such changes have been or will be reflected on Statements of Change in Ownership on Form 4 filed with the SEC. Other information regardin g t he participants in the proxy solicitation and a description of their direct and indirect interests, by security holdings or otherwise, will be contained in the joint proxy statement/prospectus relating to the Transaction. Free copies of this document, when available, may be obtained as described in the preceding paragraph. 3
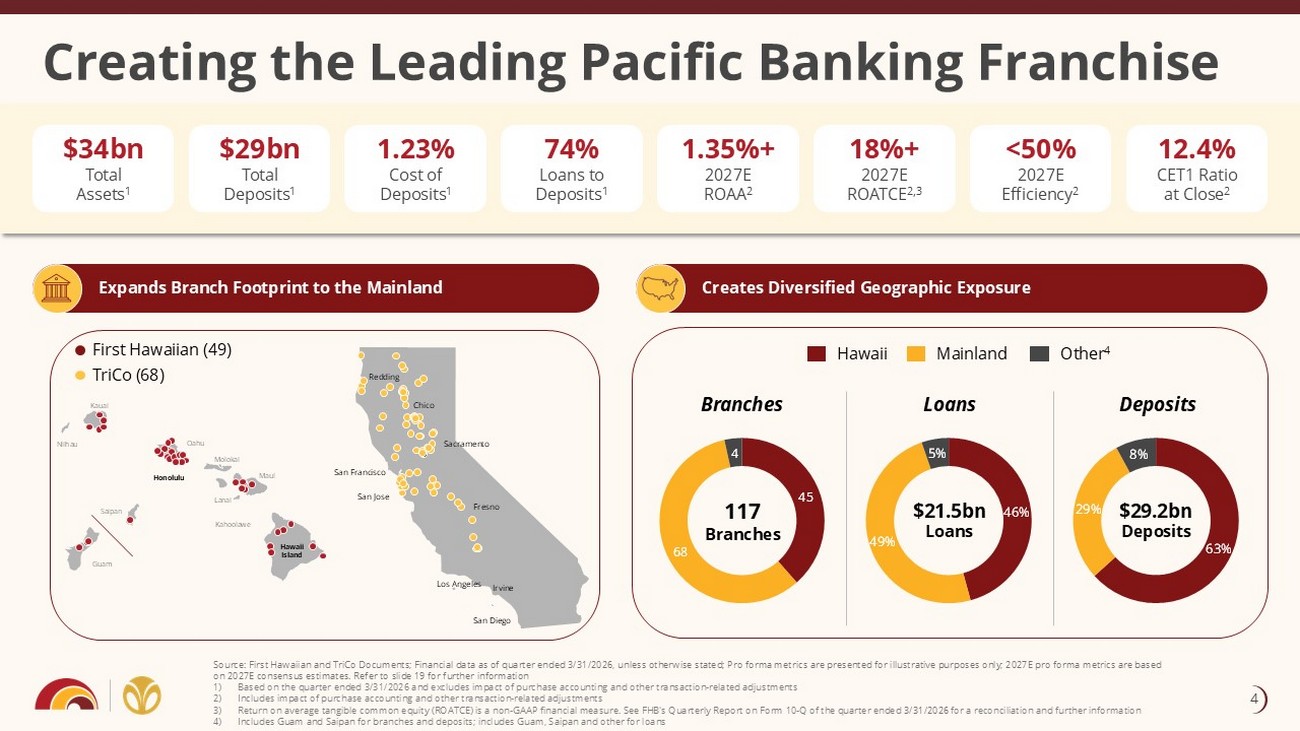
Creating the Leading Pacific Banking Franchise Source: First Hawaiian and TriCo Documents; Financial data as of quarter ended 3/31/2026, unless otherwise stated; Pro forma met rics are presented for illustrative purposes only; 2027E pro forma metrics are based on 2027E consensus estimates. Refer to slide 19 for further information 1) Based on the quarter ended 3/31/2026 and excludes impact of purchase accounting and other transaction - related adjustments 2) Includes impact of purchase accounting and other transaction - related adjustments 3) Return on average tangible common equity (ROATCE) is a non - GAAP financial measure. See FHB's Quarterly Report on Form 10 - Q of th e quarter ended 3/31/2026 for a reconciliation and further information 4) Includes Guam and Saipan for branches and deposits; includes Guam, Saipan and other for loans $34bn Total Assets 1 74% Loans to Deposits 1 $29bn Total Deposits 1 1.35%+ 2027E ROAA 2 18%+ 2027E ROATCE 2,3 12.4% CET1 Ratio at Close 2 <50% 2027E Efficiency 2 Branches Loans Deposits 117 Branches $21.5bn Loans $29.2bn Deposits Expands Branch Footprint to the Mainland Creates Diversified Geographic Exposure Kauai Niihau Oahu Molokai Maui Lanai Kahoolawe Honolulu Hawaii Island Saipan Guam Sacramento San Francisco San Jose Fresno First Hawaiian (49) TriCo (68) 1.23% Cost of Deposits 1 45 68 4 Hawaii Mainland Other 4 Redding Chico Los Angeles San Diego Irvine 4
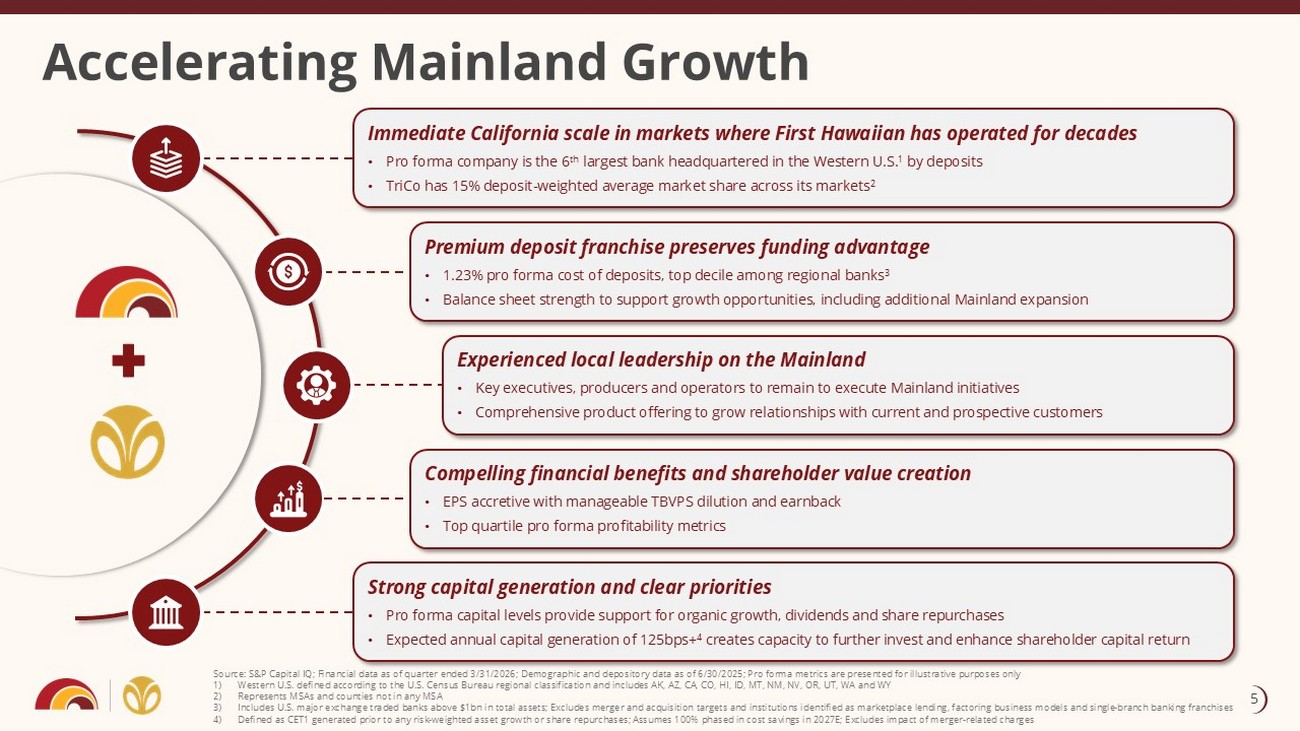
Accelerating Mainland Growth Immediate California scale in markets where First Hawaiian has operated for decades • Pro forma company is the 6 th largest bank headquartered in the Western U.S. 1 by deposits • TriCo has 15% deposit - weighted average market share across its markets 2 Premium deposit franchise preserves funding advantage • 1.23% pro forma cost of deposits, top decile among regional banks 3 • Balance sheet strength to support growth opportunities, including additional Mainland expansion Strong capital generation and clear priorities • Pro forma capital levels provide support for organic growth, dividends and share repurchases • Expected annual capital generation of 125bps+ 4 creates capacity to further invest and enhance shareholder capital return Source: S&P Capital IQ; Financial data as of quarter ended 3/31/2026; Demographic and depository data as of 6/30/2025; Pro forma metrics are presented for illustrative purposes only 1) Western U.S. defined according to the U.S. Census Bureau regional classification and includes AK, AZ, CA, CO, HI, ID, MT, NM, NV , OR, UT, WA and WY 2) Represents MSAs and counties not in any MSA 3) Includes U.S. major exchange traded banks above $1bn in total assets; Excludes merger and acquisition targets and institution s i dentified as marketplace lending, factoring business models and single - branch banking franchises 4) Defined as CET1 generated prior to any risk - weighted asset growth or share repurchases; Assumes 100% phased in cost savings in 2027E; Excludes impact of merger - related charges Compelling financial benefits and shareholder value creation • EPS accretive with manageable TBVPS dilution and earnback • Top quartile pro forma profitability metrics Experienced local leadership on the Mainland • Key executives, producers and operators to remain to execute Mainland initiatives • Comprehensive product offering to grow relationships with current and prospective customers 5
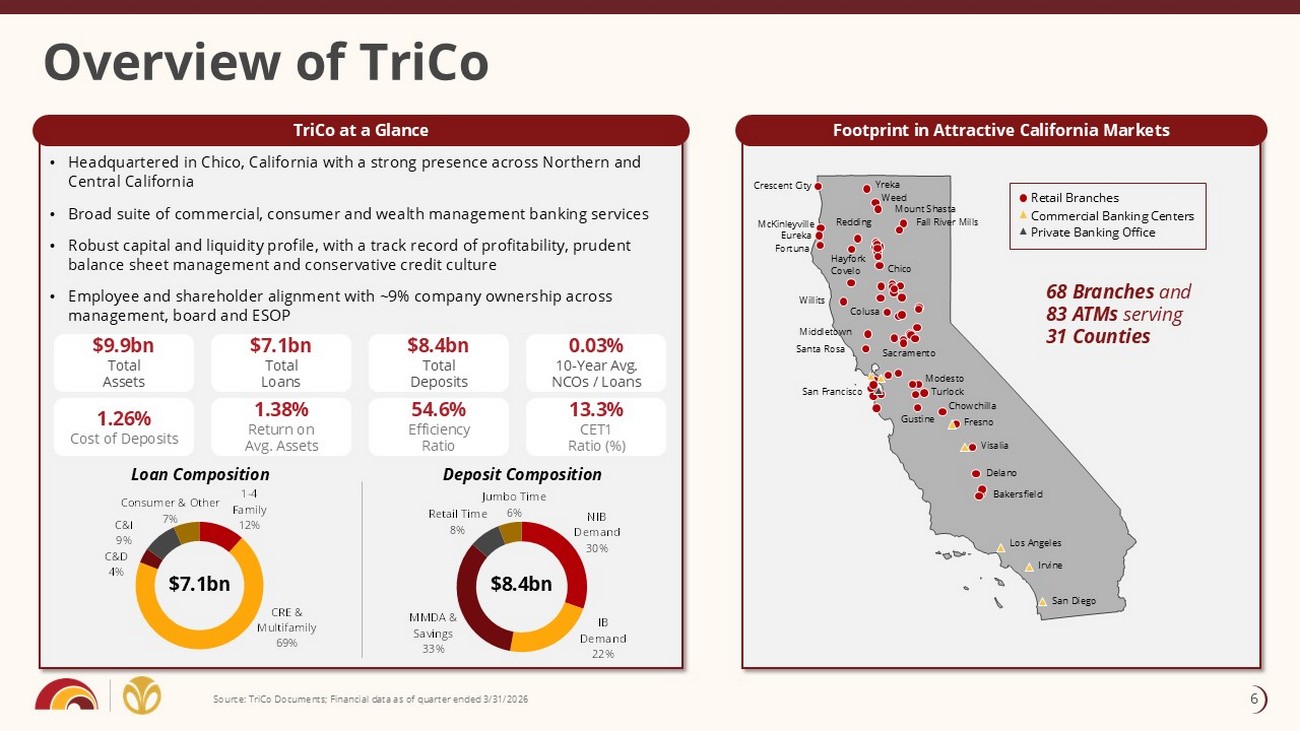
• Headquartered in Chico, California with a strong presence across Northern and Central California • Broad suite of commercial, consumer and wealth management banking services • Robust capital and liquidity profile, with a track record of profitability, prudent balance sheet management and conservative credit culture • Employee and shareholder alignment with ~9% company ownership across management, board and ESOP Footprint in Attractive California Markets TriCo at a Glance Overview of TriCo Source: TriCo Documents; Financial data as of quarter ended 3/31/2026 1.26% Cost of Deposits 1.38% Return on Avg. Assets 54.6% Efficiency Ratio 13.3% CET1 Ratio (%) 68 Branches and 83 ATMs serving 31 Counties $9.9bn Total Assets $7.1bn Total Loans $8.4bn Total Deposits 0.03% 10 - Year Avg. NCOs / Loans Retail Branches Commercial Banking Centers Private Banking Office Crescent City Fortuna Willits Covelo Middletown Santa Rosa San Francisco Redding Colusa Yreka Weed Mount Shasta Fall River Mills Sacramento Modesto Turlock Chowchilla Fresno Visalia Delano Bakersfield Gustine San Diego Irvine McKinleyville Eureka Hayfork Chico 1 - 4 Family 12% CRE & Multifamily 69% C&D 4% C&I 9% Consumer & Other 7% Loan Composition Deposit Composition $7.1bn $8.4bn Los Angeles NIB Demand 30% IB Demand 22% MMDA & Savings 33% Retail Time 8% Jumbo Time 6% 6
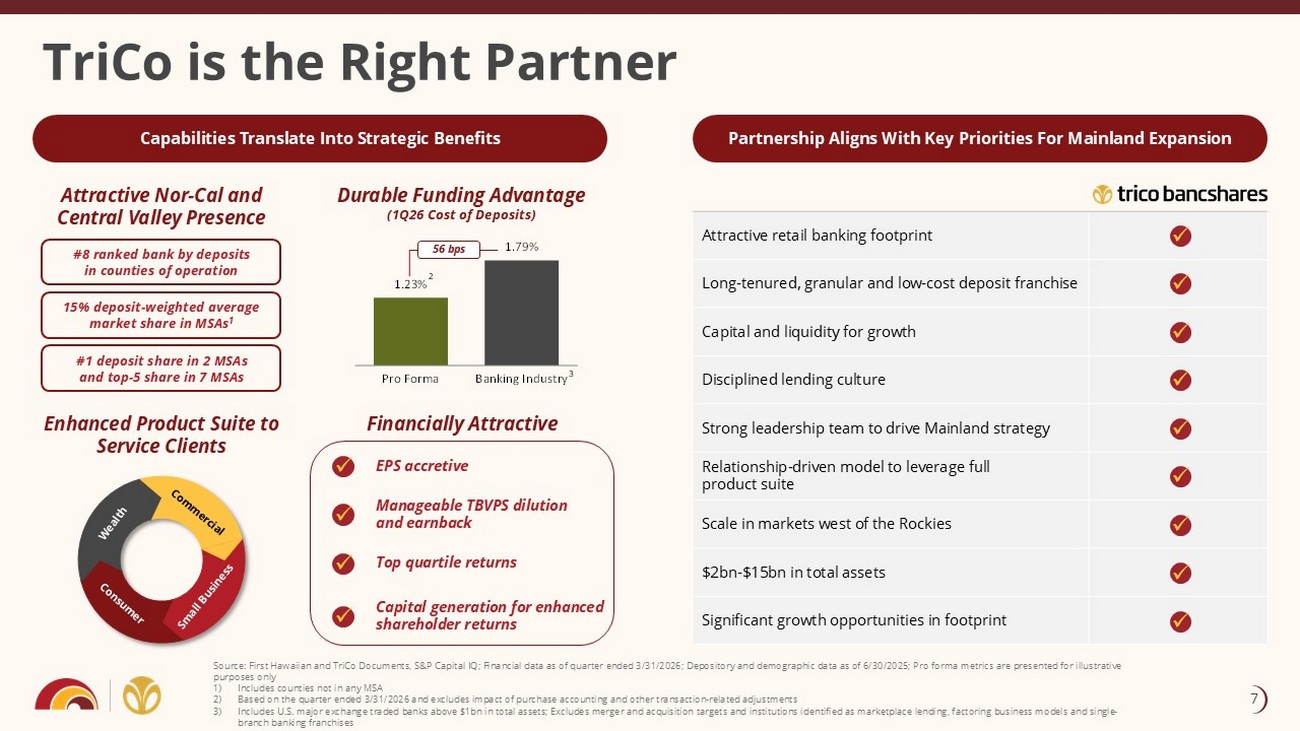
1.23% 1.79% Pro Forma Banking Industry TriCo is the Right Partner Attractive retail banking footprint Long - tenured, granular and low - cost deposit franchise Capital and liquidity for growth Disciplined lending culture Strong leadership team to drive Mainland strategy Relationship - driven model to leverage full product suite Scale in markets west of the Rockies $2bn - $15bn in total assets Significant growth opportunities in footprint Partnership Aligns With Key Priorities For Mainland Expansion Capabilities Translate Into Strategic Benefits Attractive Nor - Cal and Central Valley Presence Durable Funding Advantage (1Q26 Cost of Deposits) Enhanced Product Suite to Service Clients Financially Attractive 56 bps #8 ranked bank by deposits in counties of operation 15% deposit - weighted average market share in MSAs 1 #1 deposit share in 2 MSAs and top - 5 share in 7 MSAs Source: First Hawaiian and TriCo Documents, S&P Capital IQ; Financial data as of quarter ended 3/31/2026; Depository and demo gra phic data as of 6/30/2025; Pro forma metrics are presented for illustrative purposes only 1) Includes counties not in any MSA 2) Based on the quarter ended 3/31/2026 and excludes impact of purchase accounting and other transaction - related adjustments 3) Includes U.S. major exchange traded banks above $1bn in total assets; Excludes merger and acquisition targets and institution s i dentified as marketplace lending, factoring business models and single - branch banking franchises EPS accretive Manageable TBVPS dilution and earnback Top quartile returns Capital generation for enhanced shareholder returns x x x x x x x x x x x x x 3 2 7
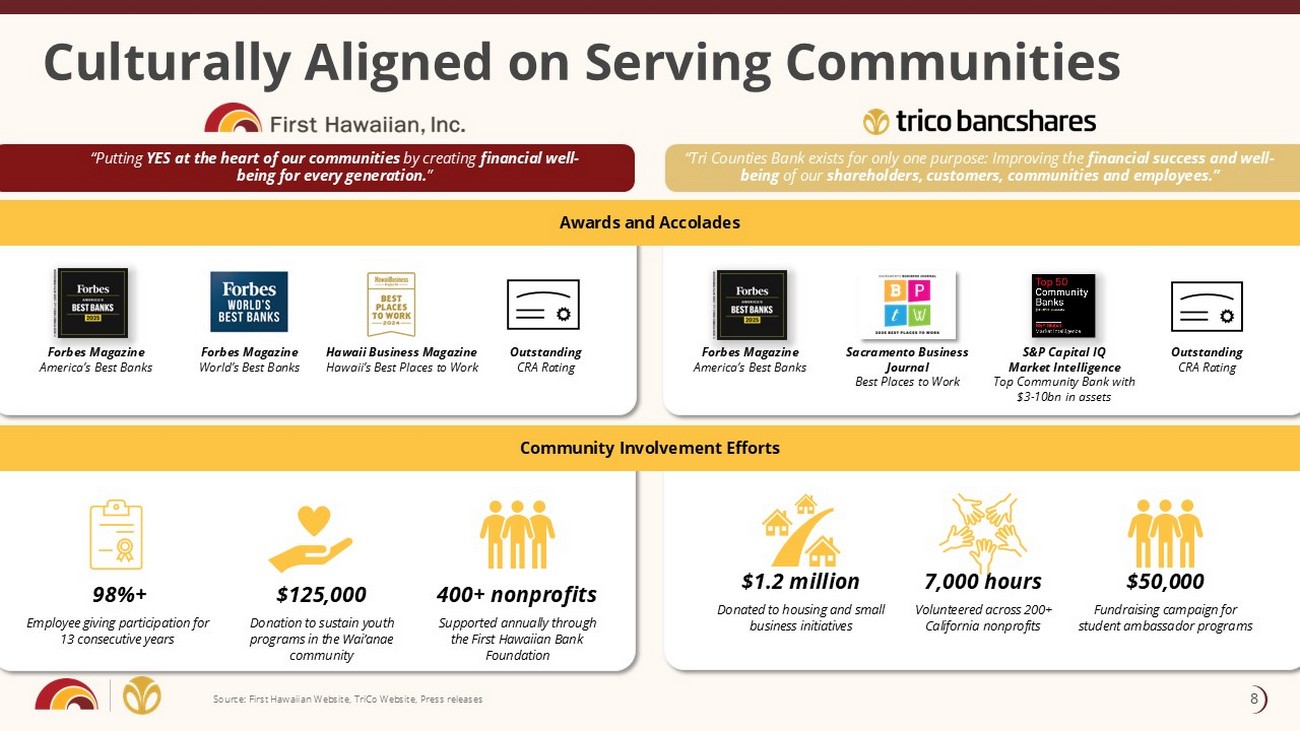
Culturally Aligned on Serving Communities Forbes Magazine America’s Best Banks Outstanding CRA Rating Sacramento Business Journal Best Places to Work S&P Capital IQ Market Intelligence Top Community Bank with $3 - 10bn in assets 7,000 hours Volunteered across 200+ California nonprofits $1.2 million Donated to housing and small business initiatives $50,000 Fundraising campaign for student ambassador programs Outstanding CRA Rating 98%+ Employee giving participation for 13 consecutive years 400+ nonprofits Supported annually through the First Hawaiian Bank Foundation $125,000 Donation to sustain youth programs in the Wai’anae community Forbes Magazine America’s Best Banks Forbes Magazine World’s Best Banks Hawaii Business Magazine Hawaii’s Best Places to Work “Putting YES at the heart of our communities by creating financial well - being for every generation. ” Community Involvement Efforts Awards and Accolades “Tri Counties Bank exists for only one purpose: Improving the financial success and well - being of our shareholders, customers, communities and employees.” Source: First Hawaiian Website, TriCo Website, Press releases Awards and Accolades Community Involvement Efforts 8
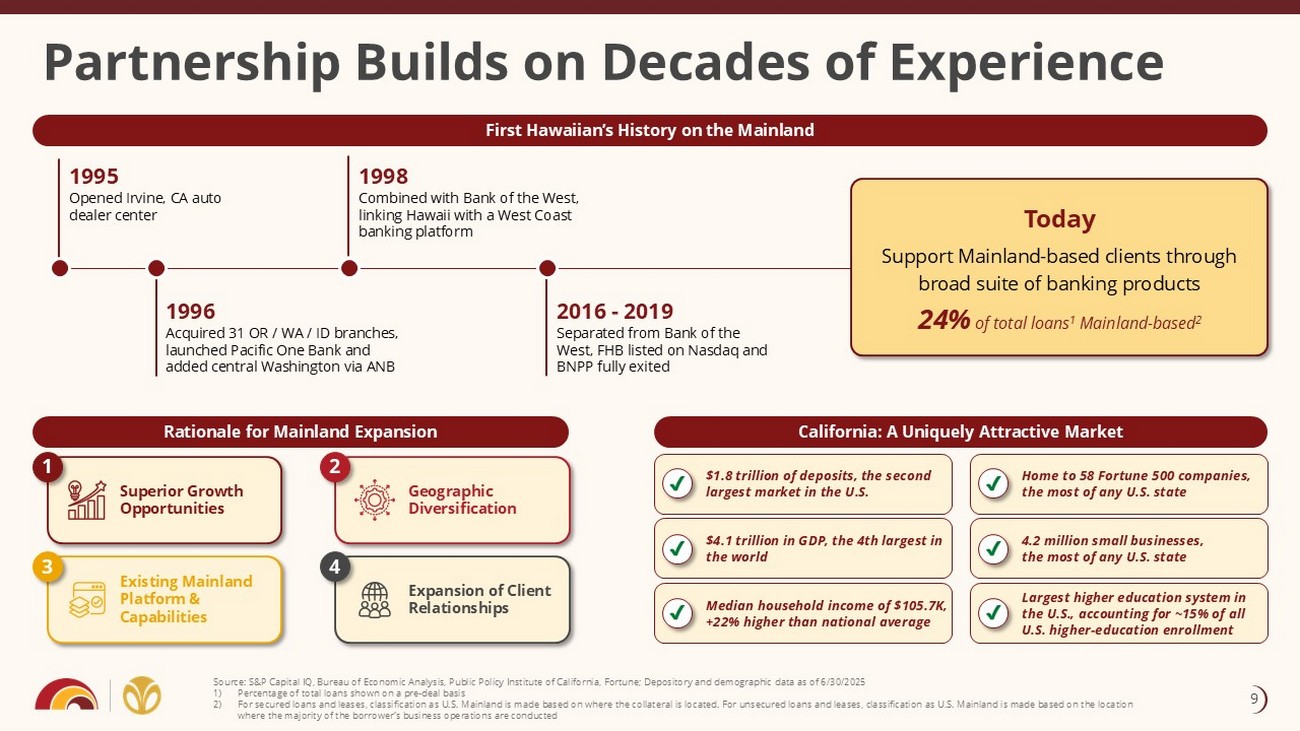
California: A Uniquely Attractive Market Rationale for Mainland Expansion First Hawaiian’s History on the Mainland Partnership Builds on Decades of Experience $1.8 trillion of deposits, the second largest market in the U.S. $4.1 trillion in GDP, the 4th largest in the world Median household income of $105.7K, +22% higher than national average Home to 58 Fortune 500 companies, the most of any U.S. state 4.2 million small businesses, the most of any U.S. state Largest higher education system in the U.S., accounting for ~15% of all U.S. higher - education enrollment 1995 Opened Irvine, CA auto dealer center Geographic Diversification Expansion of Client Relationships Superior Growth Opportunities Existing Mainland Platform & Capabilities 1 2 3 4 1998 Combined with Bank of the West, linking Hawaii with a West Coast banking platform 1996 Acquired 31 OR / WA / ID branches, launched Pacific One Bank and added central Washington via ANB Source: S&P Capital IQ, Bureau of Economic Analysis, Public Policy Institute of California, Fortune; Depository and demograph ic data as of 6/30/2025 1) Percentage of total loans shown on a pre - deal basis 2) For secured loans and leases, classification as U.S. Mainland is made based on where the collateral is located. For unsecured lo ans and leases, classification as U.S. Mainland is made based on the location where the majority of the borrower’s business operations are conducted 2016 - 2019 Separated from Bank of the West, FHB listed on Nasdaq and BNPP fully exited Today Support Mainland - based clients through broad suite of banking products 24% of total loans 1 Mainland - based 2 9
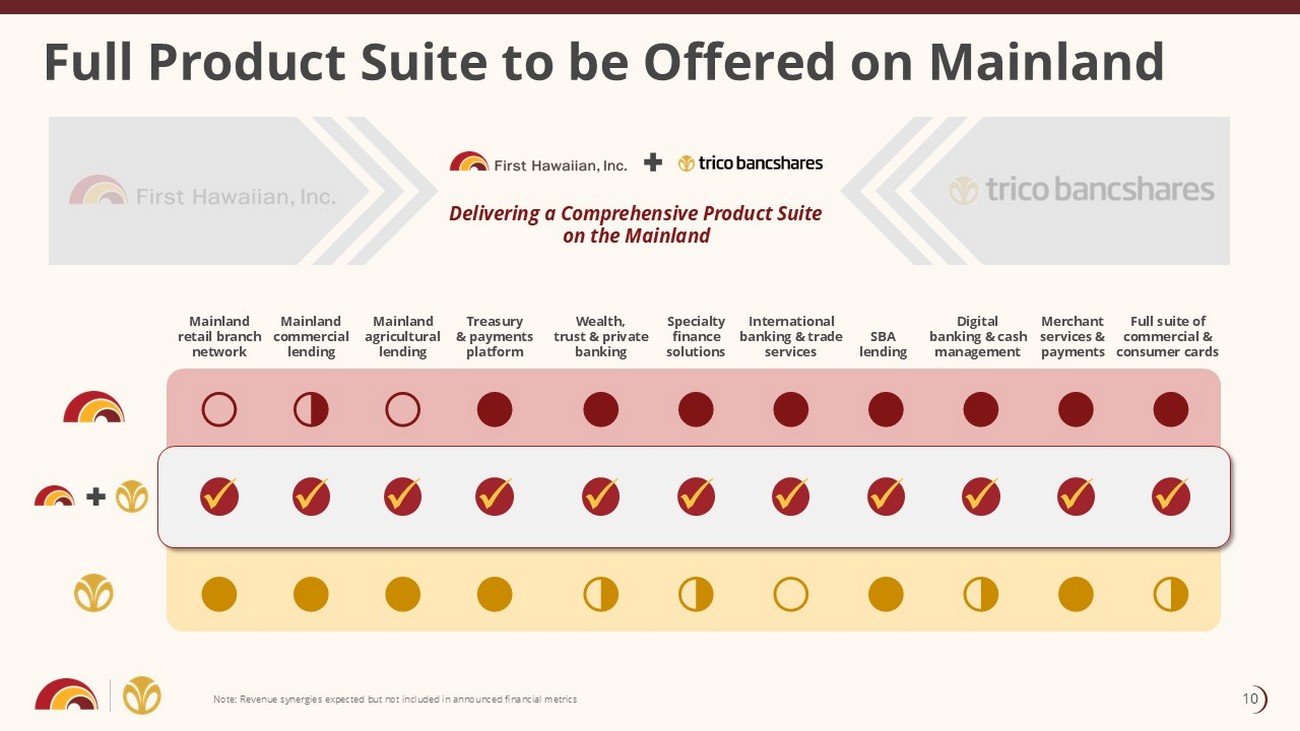
Full Product Suite to be Offered on Mainland Note: Revenue synergies expected but not included in announced financial metrics Delivering a Comprehensive Product Suite on the Mainland Treasury & payments platform Digital banking & cash management Wealth, trust & private banking Specialty finance solutions International banking & trade services SBA lending Merchant services & payments Mainland agricultural lending x x x x x x x x Mainland commercial lending Mainland retail branch network x x Full suite of commercial & consumer cards x ○ ● ○ ◑ ● ● ● ● ● ● ● ◑ ○ ● ● ◑ ◑ ● ● ● ◑ ● 10
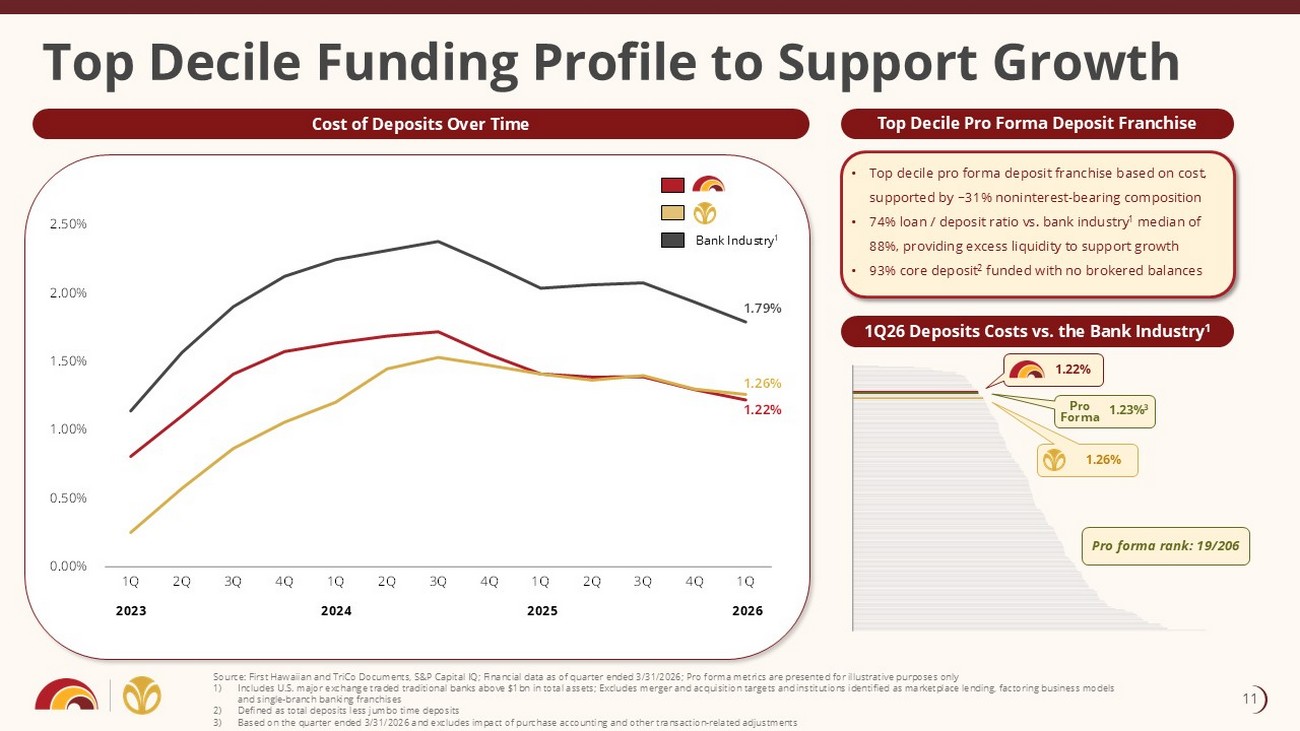
• Top decile pro forma deposit franchise based on cost, supported by ~31% noninterest - bearing composition • 74% loan / deposit ratio vs. bank industry 1 median of 88%, providing excess liquidity to support growth • 93% core deposit 2 funded with no brokered balances Top Decile Pro Forma Deposit Franchise 1.22% 1.26% 1.79% 0.00% 0.50% 1.00% 1.50% 2.00% 2.50% 1Q 2Q 3Q 4Q 1Q 2Q 3Q 4Q 1Q 2Q 3Q 4Q 1Q 2023 2024 2025 2026 Bank Industry 1 Top Decile Funding Profile to Support Growth Source: First Hawaiian and TriCo Documents, S&P Capital IQ; Financial data as of quarter ended 3/31/2026; Pro forma metrics a re presented for illustrative purposes only 1) Includes U.S. major exchange traded traditional banks above $1bn in total assets; Excludes merger and acquisition targets and in stitutions identified as marketplace lending, factoring business models and single - branch banking franchises 2) Defined as total deposits less jumbo time deposits 3) Based on the quarter ended 3/31/2026 and excludes impact of purchase accounting and other transaction - related adjustments Cost of Deposits Over Time 1Q26 Deposits Costs vs. the Bank Industry 1 Pro Forma 1.22% 1.23% 3 1.26% Pro forma rank: 19/206 11
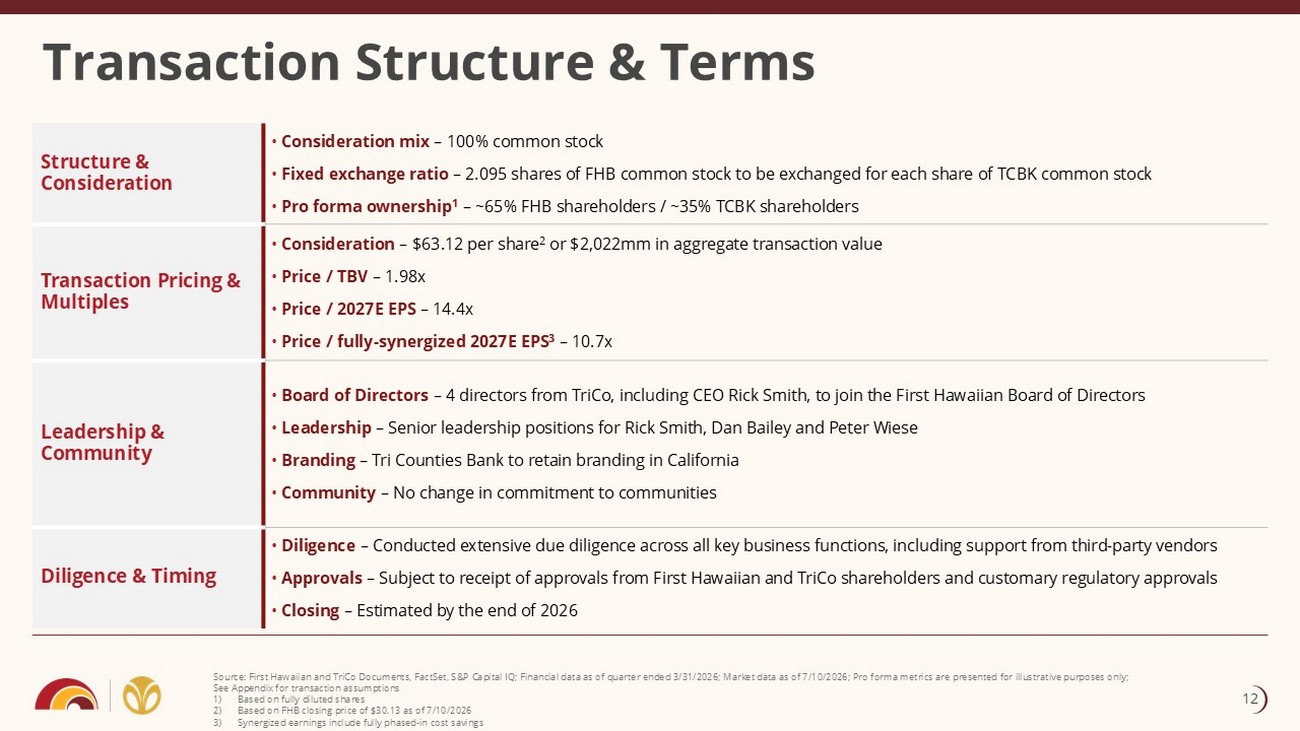
Transaction Structure & Terms Source: First Hawaiian and TriCo Documents, FactSet, S&P Capital IQ; Financial data as of quarter ended 3/31/2026; Market dat a a s of 7/10/2026; Pro forma metrics are presented for illustrative purposes only; See Appendix for transaction assumptions 1) Based on fully diluted shares 2) Based on FHB closing price of $30.13 as of 7/10/2026 3) Synergized earnings include fully phased - in cost savings • Consideration mix – 100% common stock • Fixed exchange ratio – 2.095 shares of FHB common stock to be exchanged for each share of TCBK common stock • Pro forma ownership 1 – ~65% FHB shareholders / ~35% TCBK shareholders Structure & Consideration • Consideration – $63.12 per share 2 or $2,022mm in aggregate transaction value • Price / TBV – 1.98x • Price / 2027E EPS – 14.4x • Price / fully - synergized 2027E EPS 3 – 10.7x Transaction Pricing & Multiples • Board of Directors – 4 directors from TriCo, including CEO Rick Smith, to join the First Hawaiian Board of Directors • Leadership – Senior leadership positions for Rick Smith, Dan Bailey and Peter Wiese • Branding – Tri Counties Bank to retain branding in California • Community – No change in commitment to communities Leadership & Community • Diligence – Conducted extensive due diligence across all key business functions, including support from third - party vendors • Approvals – Subject to receipt of approvals from First Hawaiian and TriCo shareholders and customary regulatory approvals • Closing – Estimated by the end of 2026 Diligence & Timing 12
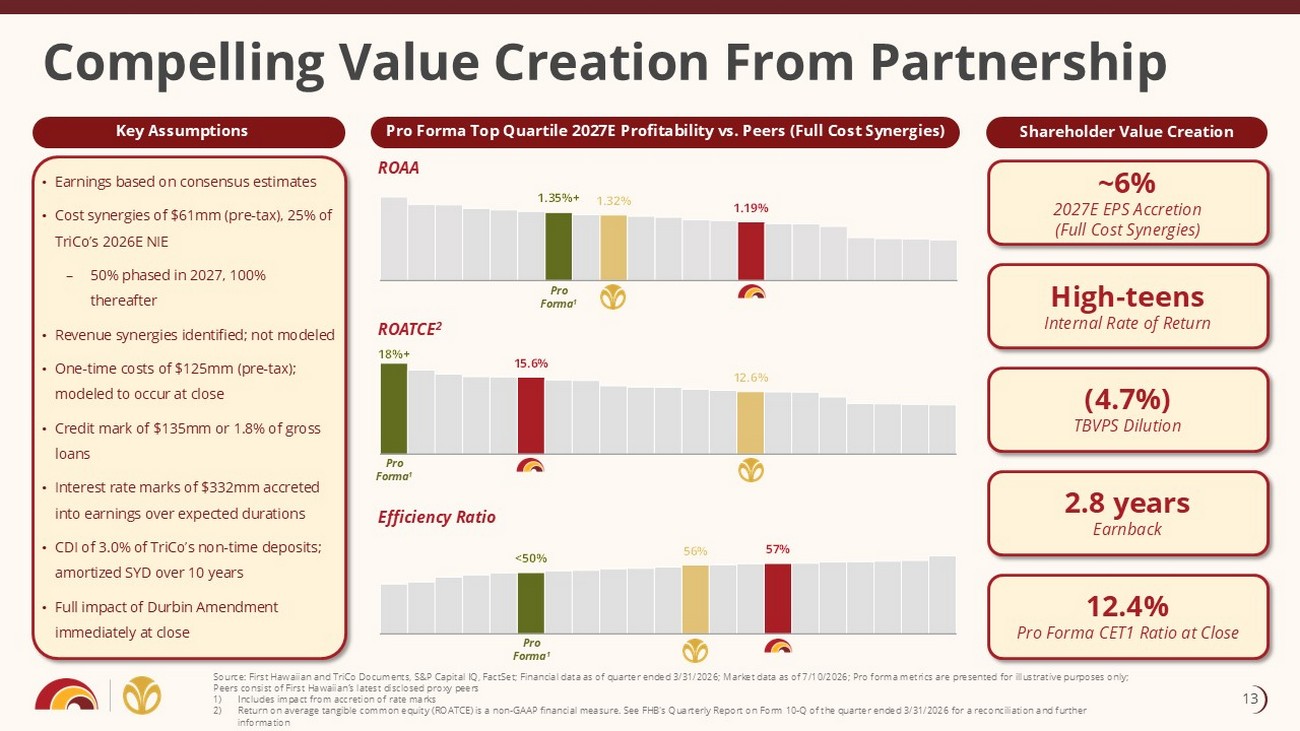
Pro Forma Top Quartile 2027E Profitability vs. Peers (Full Cost Synergies) • Earnings based on consensus estimates • Cost synergies of $61mm (pre - tax), 25% of TriCo’s 2026E NIE – 50% phased in 2027, 100% thereafter • Revenue synergies identified; not modeled • One - time costs of $125mm (pre - tax); modeled to occur at close • Credit mark of $135mm or 1.8% of gross loans • Interest rate marks of $332mm accreted into earnings over expected durations • CDI of 3.0% of TriCo’s non - time deposits; amortized SYD over 10 years • Full impact of Durbin Amendment immediately at close 1.35%+ 1.32% 1.19% Shareholder Value Creation Compelling Value Creation From Partnership ~6% 2027E EPS Accretion (Full Cost Synergies) High - teens Internal Rate of Return (4.7%) TBVPS Dilution 2.8 years Earnback ROAA ROATCE 2 Efficiency Ratio Pro Forma 1 Pro Forma 1 Pro Forma 1 Source: First Hawaiian and TriCo Documents, S&P Capital IQ, FactSet; Financial data as of quarter ended 3/31/2026; Market dat a a s of 7/10/2026; Pro forma metrics are presented for illustrative purposes only; Peers consist of First Hawaiian’s latest disclosed proxy peers 1) Includes impact from accretion of rate marks 2) Return on average tangible common equity (ROATCE) is a non - GAAP financial measure. See FHB's Quarterly Report on Form 10 - Q of th e quarter ended 3/31/2026 for a reconciliation and further information 12.4% Pro Forma CET1 Ratio at Close 18%+ 15.6% 12.6% <50% 56% 57% Key Assumptions 13
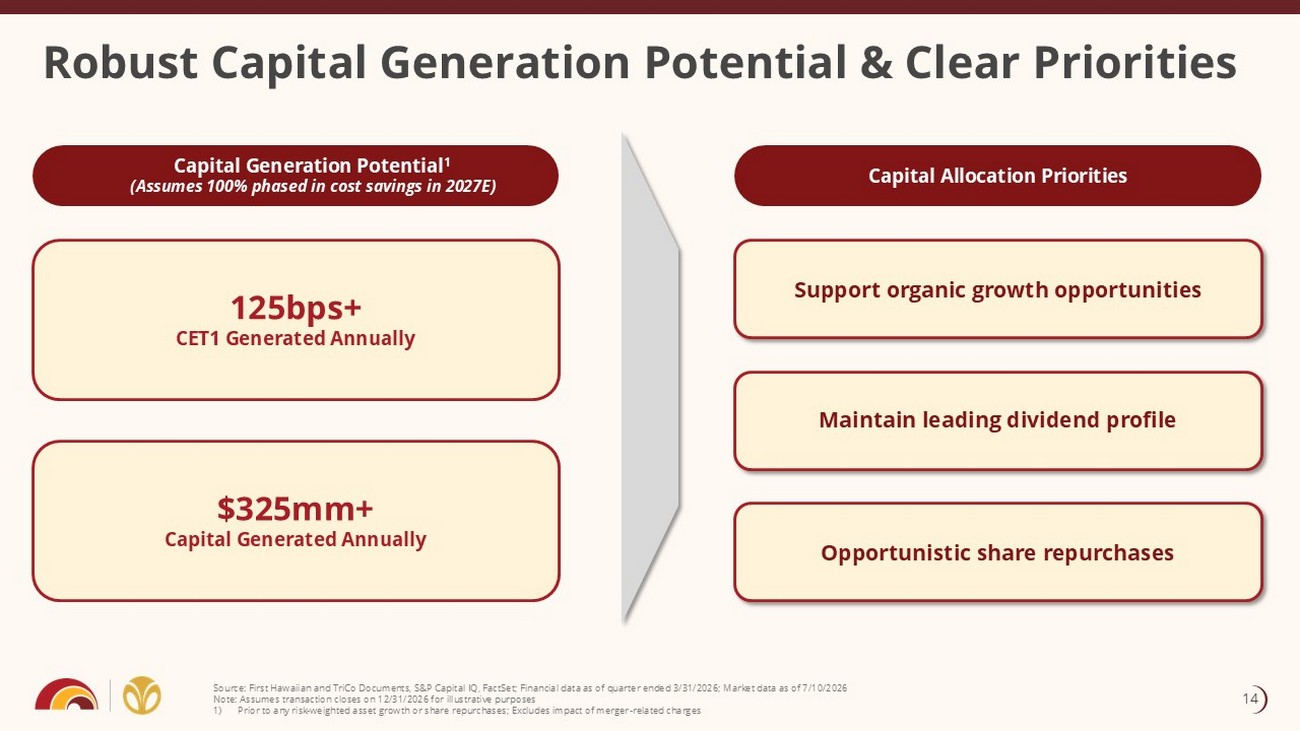
Source: First Hawaiian and TriCo Documents, S&P Capital IQ, FactSet; Financial data as of quarter ended 3/31/2026; Market dat a a s of 7/10/2026 Note: Assumes transaction closes on 12/31/2026 for illustrative purposes 1) Prior to any risk - weighted asset growth or share repurchases; Excludes impact of merger - related charges Robust Capital Generation Potential & Clear Priorities Capital Generation Potential 1 (Assumes 100% phased in cost savings in 2027E) $325mm+ Capital Generated Annually 125bps+ CET1 Generated Annually Support organic growth opportunities Maintain leading dividend profile Opportunistic share repurchases Capital Allocation Priorities 14
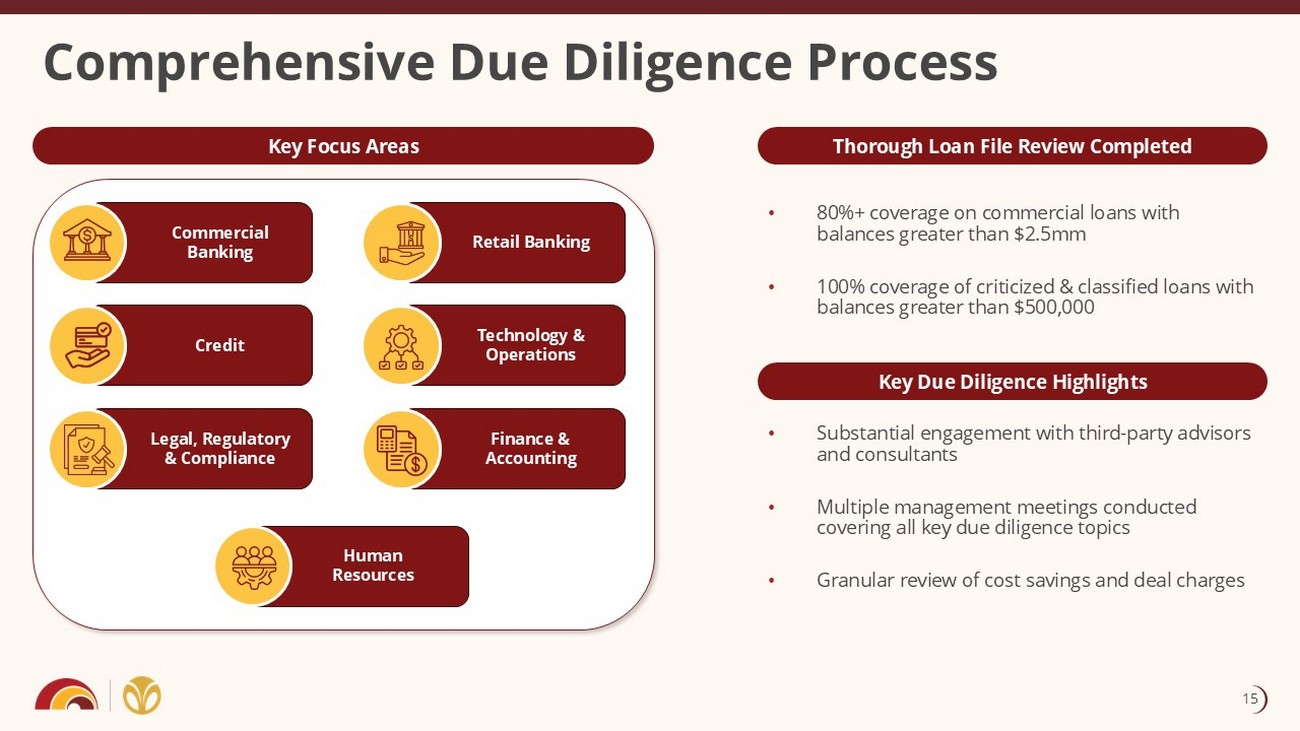
Thorough Loan File Review Completed Key Focus Areas • Substantial engagement with third - party advisors and consultants • Multiple management meetings conducted covering all key due diligence topics • Granular review of cost savings and deal charges Comprehensive Due Diligence Process Legal, Regulatory & Compliance Credit Commercial Banking Finance & Accounting Technology & Operations Retail Banking Human Resources Key Due Diligence Highlights • 80%+ coverage on commercial loans with balances greater than $2.5mm • 100% coverage of criticized & classified loans with balances greater than $500,000 15
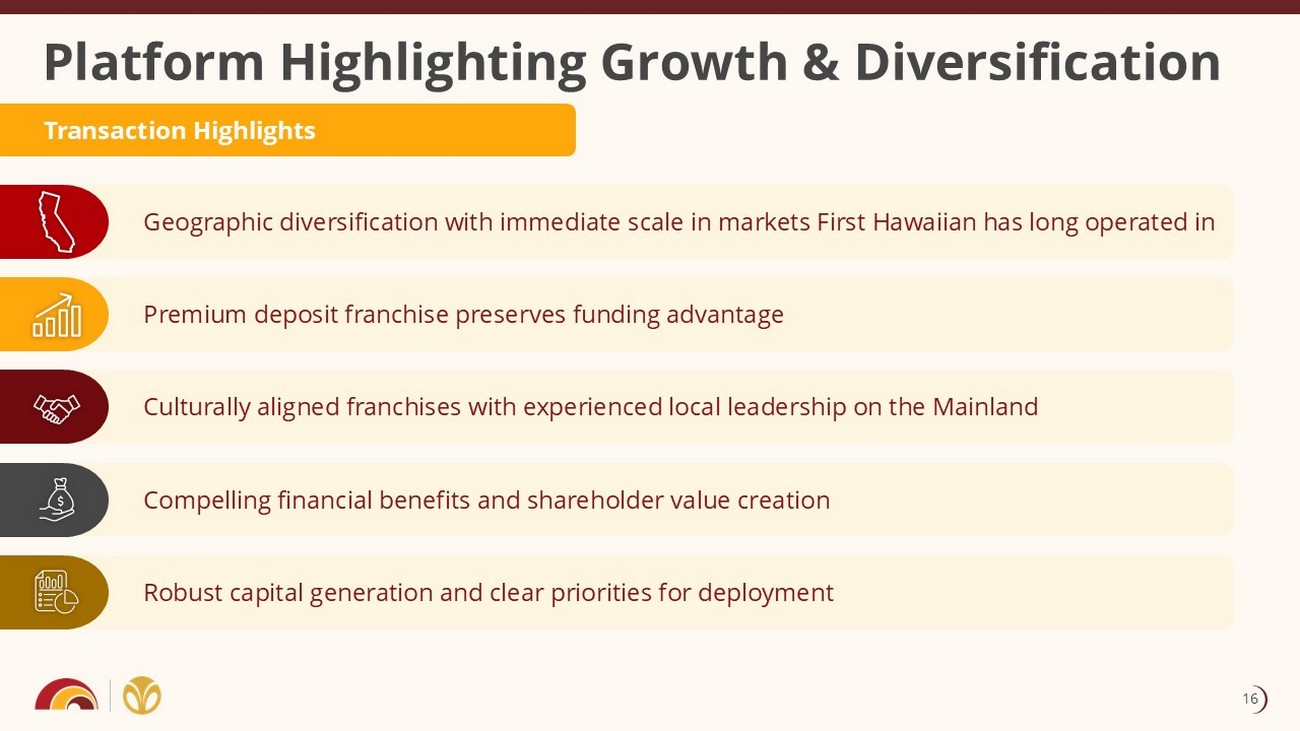
Culturally aligned franchises with experienced local leadership on the Mainland Geographic diversification with immediate scale in markets First Hawaiian has long operated in Premium deposit franchise preserves funding advantage Platform Highlighting Growth & Diversification Compelling financial benefits and shareholder value creation Robust capital generation and clear priorities for deployment Transaction Highlights 16
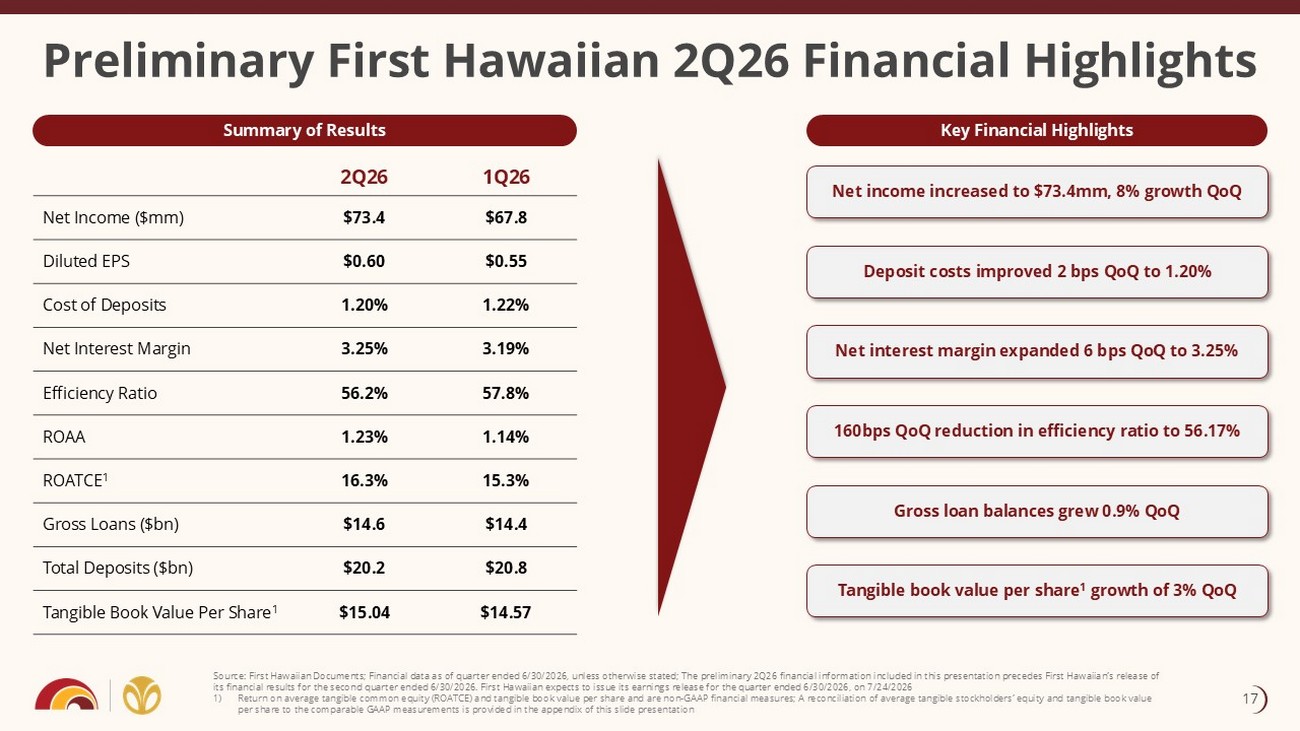
Preliminary First Hawaiian 2Q26 Financial Highlights 1Q26 2Q26 $67.8 $73.4 Net Income ($mm) $0.55 $0.60 Diluted EPS 1.22% 1.20% Cost of Deposits 3.19% 3.25% Net Interest Margin 57.8% 56.2% Efficiency Ratio 1.14% 1.23% ROAA 15.3% 16.3% ROATCE 1 $14.4 $14.6 Gross Loans ($bn) $20.8 $20.2 Total Deposits ($bn) $14.57 $15.04 Tangible Book Value Per Share 1 Source: First Hawaiian Documents; Financial data as of quarter ended 6/30/2026, unless otherwise stated; The preliminary 2Q26 financial information included in this presentation precedes First Hawaiian’s release of its financial results for the second quarter ended 6/30/2026. First Hawaiian expects to issue its earnings release for the qu art er ended 6/30/2026, on 7/24/2026 1) Return on average tangible common equity ( ROATCE ) and tangible book value per share and are non - GAAP financial measures; A reconciliation of average tangible stockholders’ equi ty and tangible book value per share to the comparable GAAP measurements is provided in the appendix of this slide presentation Net income increased to $73.4mm, 8% growth QoQ Net interest margin expanded 6 bps QoQ to 3.25% Deposit costs improved 2 bps QoQ to 1.20% 160bps QoQ reduction in efficiency ratio to 56.17% Tangible book value per share 1 growth of 3% QoQ Summary of Results Key Financial Highlights Gross loan balances grew 0.9% QoQ 17

Appendix
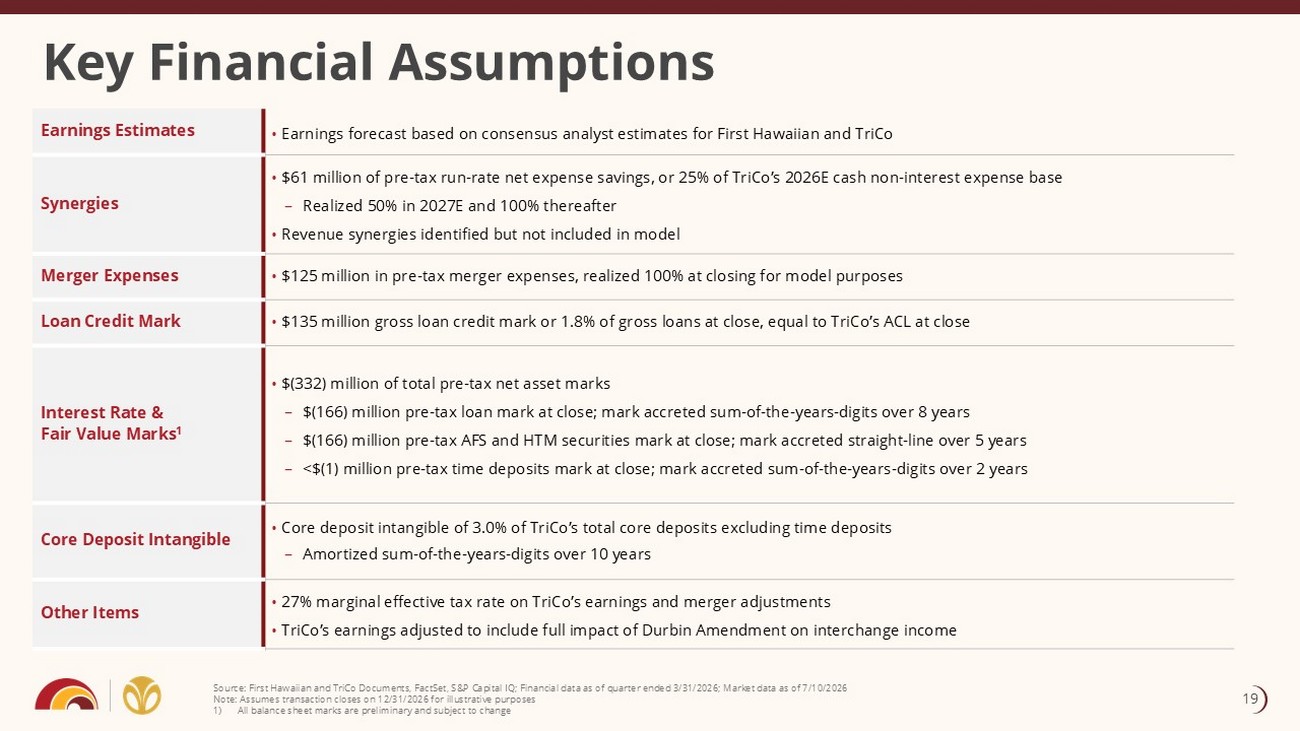
Key Financial Assumptions • Earnings forecast based on consensus analyst estimates for First Hawaiian and TriCo Earnings Estimates • $61 million of pre - tax run - rate net expense savings, or 25% of TriCo’s 2026E cash non - interest expense base – Realized 50% in 2027E and 100% thereafter • Revenue synergies identified but not included in model Synergies • $125 million in pre - tax merger expenses, realized 100% at closing for model purposes Merger Expenses • $135 million gross loan credit mark or 1.8% of gross loans at close, equal to TriCo’s ACL at close Loan Credit Mark • $(332) million of total pre - tax net asset marks – $(166) million pre - tax loan mark at close; mark accreted sum - of - the - years - digits over 8 years – $(166) million pre - tax AFS and HTM securities mark at close; mark accreted straight - line over 5 years – <$(1) million pre - tax time deposits mark at close; mark accreted sum - of - the - years - digits over 2 years Interest Rate & Fair Value Marks 1 • Core deposit intangible of 3.0% of TriCo’s total core deposits excluding time deposits – Amortized sum - of - the - years - digits over 10 years Core Deposit Intangible • 27% marginal effective tax rate on TriCo’s earnings and merger adjustments • TriCo’s earnings adjusted to include full impact of Durbin Amendment on interchange income Other Items Source: First Hawaiian and TriCo Documents, FactSet, S&P Capital IQ; Financial data as of quarter ended 3/31/2026; Market dat a a s of 7/10/2026 Note: Assumes transaction closes on 12/31/2026 for illustrative purposes 1) All balance sheet marks are preliminary and subject to change 19
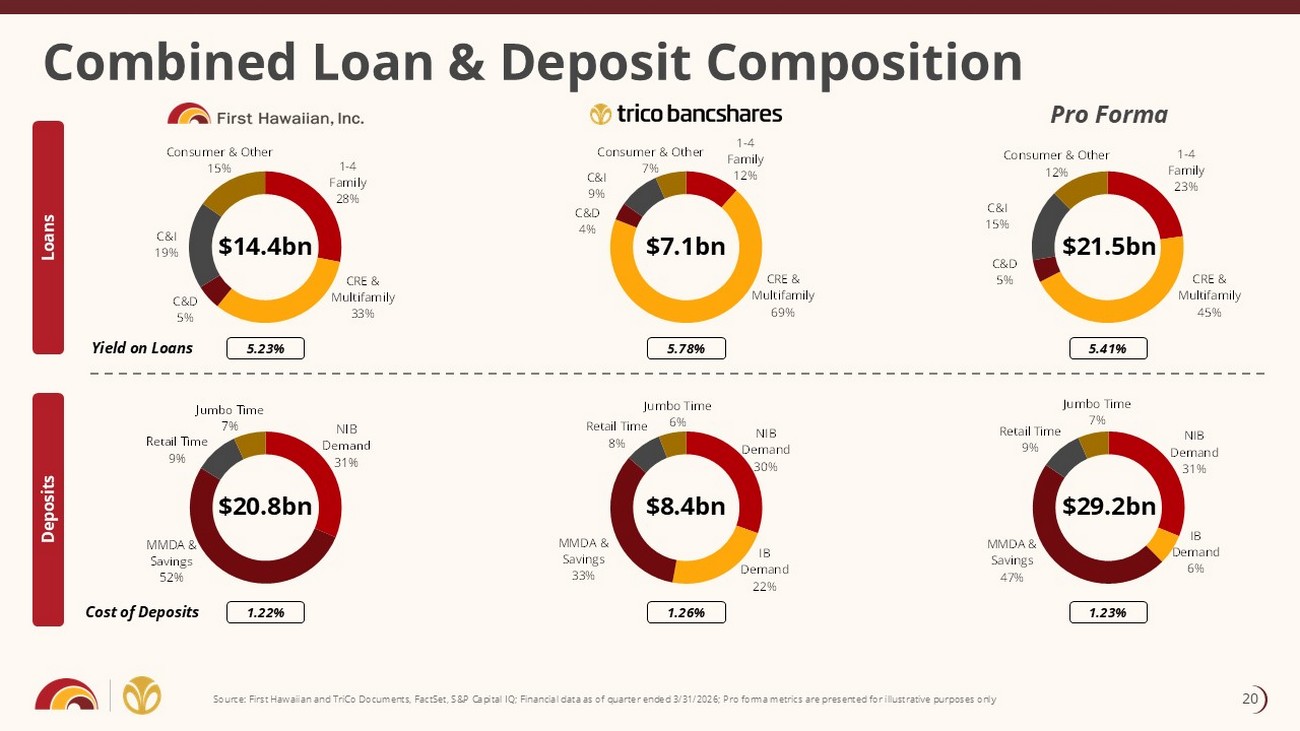
Combined Loan & Deposit Composition Loans Deposits Pro Forma 1 - 4 Family 28% CRE & Multifamily 33% C&D 5% C&I 19% Consumer & Other 15% 1 - 4 Family 12% CRE & Multifamily 69% C&D 4% C&I 9% Consumer & Other 7% $14.4bn $7.1bn $21.5bn $20.8bn $8.4bn $29.2bn 5.23% 5.78% 5.41% Yield on Loans 1.22% 1.26% 1.23% Cost of Deposits Source: First Hawaiian and TriCo Documents, FactSet, S&P Capital IQ; Financial data as of quarter ended 3/31/2026; Pro forma met rics are presented for illustrative purposes only NIB Demand 31% MMDA & Savings 52% Retail Time 9% Jumbo Time 7% NIB Demand 30% IB Demand 22% MMDA & Savings 33% Retail Time 8% Jumbo Time 6% 20
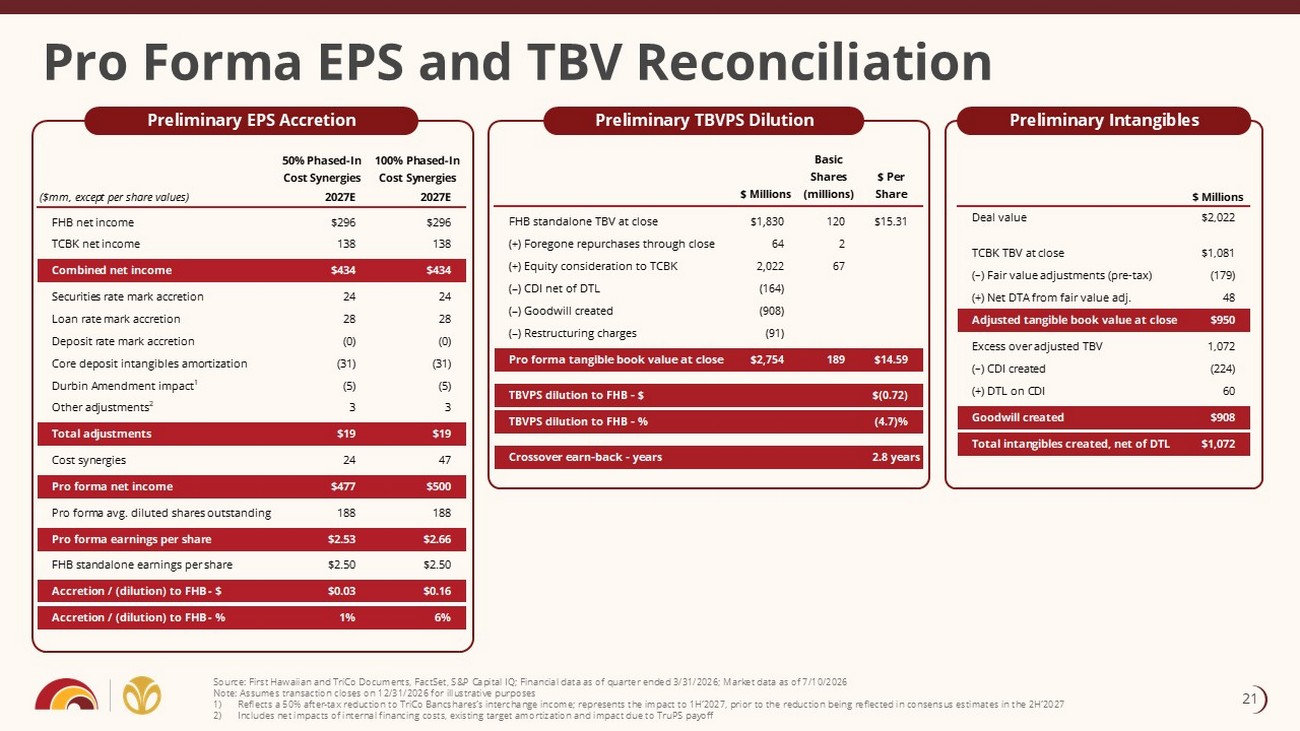
Pro Forma EPS and TBV Reconciliation Preliminary EPS Accretion Preliminary TBVPS Dilution Preliminary Intangibles Source: First Hawaiian and TriCo Documents, FactSet, S&P Capital IQ; Financial data as of quarter ended 3/31/2026; Market dat a a s of 7/10/2026 Note: Assumes transaction closes on 12/31/2026 for illustrative purposes 1) Reflects a 50% after - tax reduction to TriCo Bancshares’s interchange income; represents the impact to 1H’2027, prior to the redu ction being reflected in consensus estimates in the 2H’2027 2) Includes net impacts of internal financing costs, existing target amortization and impact due to TruPS payoff 50% Phased-In Cost Synergies 100% Phased-In Cost Synergies ($mm, except per share values) 2027E 2027E FHB net income $296 $296 TCBK net income 138 138 Combined net income $434 $434 Securities rate mark accretion 24 24 Loan rate mark accretion 28 28 Deposit rate mark accretion (0) (0) Core deposit intangibles amortization (31) (31) Durbin Amendment impact1 (5) (5) Other adjustments2 3 3 Total adjustments $19 $19 Cost synergies 24 47 Pro forma net income $477 $500 Pro forma avg. diluted shares outstanding 188 188 Pro forma earnings per share $2.53 $2.66 FHB standalone earnings per share $2.50 $2.50 Accretion / (dilution) to FHB - $ $0.03 $0.16 Accretion / (dilution) to FHB - % 1% 6% $ Millions Basic Shares (millions) $ Per Share FHB standalone TBV at close $1,830 120 $15.31 (+) Foregone repurchases through close 64 2 (+) Equity consideration to TCBK 2,022 67 (–) CDI net of DTL (164) (–) Goodwill created (908) (–) Restructuring charges (91) Pro forma tangible book value at close $2,754 189 $14.59 TBVPS dilution to FHB - $ $(0.72) TBVPS dilution to FHB - % (4.7)% Crossover earn-back - years 2.8 years 21
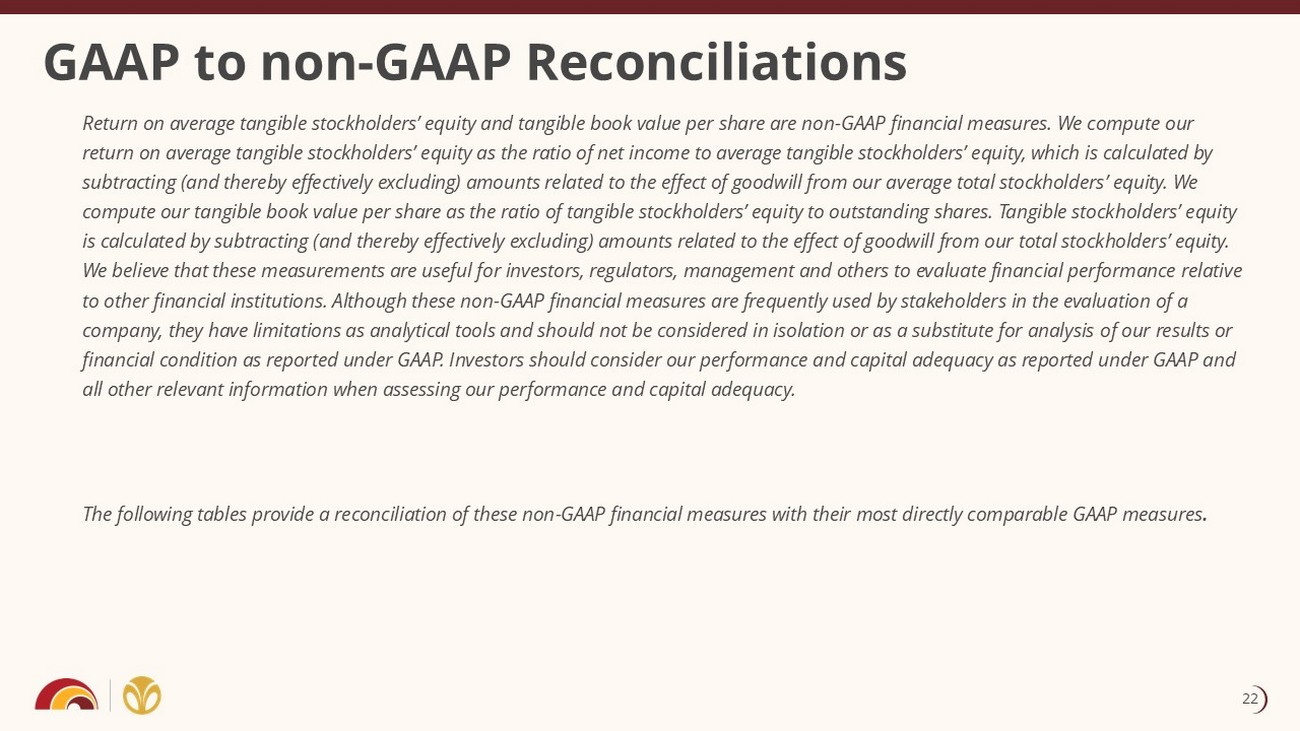
GAAP to non - GAAP Reconciliations Return on average tangible stockholders’ equity and tangible book value per share are non - GAAP financial measures. We compute ou r return on average tangible stockholders’ equity as the ratio of net income to average tangible stockholders’ equity, which is ca lculated by subtracting (and thereby effectively excluding) amounts related to the effect of goodwill from our average total stockholders ’ e quity. We compute our tangible book value per share as the ratio of tangible stockholders’ equity to outstanding shares. Tangible stock hol ders’ equity is calculated by subtracting (and thereby effectively excluding) amounts related to the effect of goodwill from our total sto ckh olders’ equity. We believe that these measurements are useful for investors, regulators, management and others to evaluate financial performa nce relative to other financial institutions. Although these non - GAAP financial measures are frequently used by stakeholders in the evaluatio n of a company, they have limitations as analytical tools and should not be considered in isolation or as a substitute for analysis of our results or financial condition as reported under GAAP. Investors should consider our performance and capital adequacy as reported under GAA P and all other relevant information when assessing our performance and capital adequacy. The following tables provide a reconciliation of these non - GAAP financial measures with their most directly comparable GAAP meas ures . 22
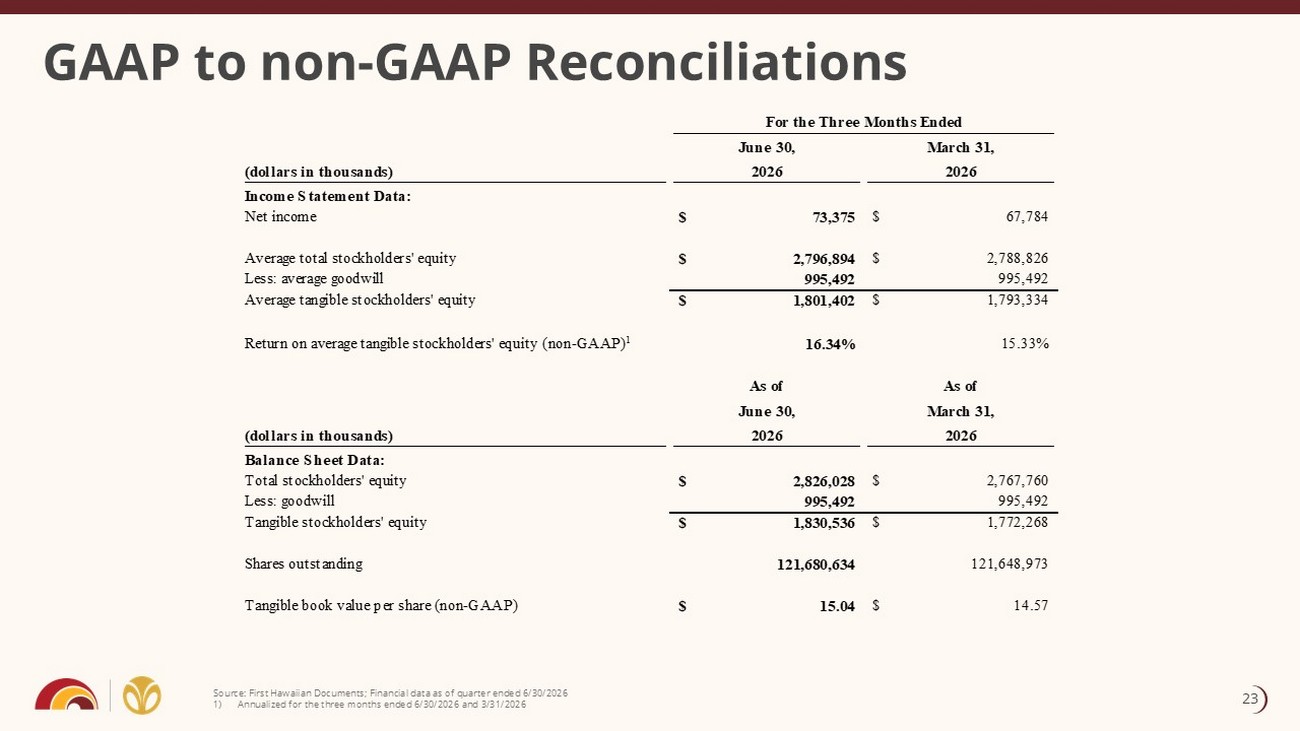
GAAP to non - GAAP Reconciliations Source: First Hawaiian Documents; Financial data as of quarter ended 6/30/2026 1) Annualized for the three months ended 6/30/2026 and 3/31/2026 For the Three Months Ended (dollars in thousands) June 30, 2026 March 31, 2026 Income Statement Data: Net income 73,375$ 67,784$ Average total stockholders' equity 2,796,894$ 2,788,826$ Less: average goodwill 995,492 995,492 Average tangible stockholders' equity 1,801,402$ 1,793,334$ Return on average tangible stockholders' equity (non-GAAP) 1 16.34% 15.33% (dollars in thousands) As of June 30, 2026 As of March 31, 2026 Balance Sheet Data: Total stockholders' equity 2,826,028$ 2,767,760$ Less: goodwill 995,492 995,492 Tangible stockholders' equity 1,830,536$ 1,772,268$ Shares outstanding 121,680,634 121,648,973 Tangible book value per share (non-GAAP) 15.04$ 14.57$ 23