Pay vs Performance Disclosure - USD ($)
Dec. 31, 2025
Dec. 31, 2024
Pay Versus Performance
The disclosure included in this section is prescribed by SEC rules and does not necessarily align with how the Company or the Compensation Committee view the link between the Company’s performance and named executive officer pay. This disclosure is intended to comply with the requirements of Item 402(v) of
Regulation S-K
applicable to “smaller reporting companies.” For additional information about our pay for performance compensation philosophy and how we seek to align executive compensation with the Company’s performance, refer to “Executive Compensation” above. The amounts set forth below under the headings “Compensation Actually Paid to PEO” and “Average Compensation Actually Paid to
Non-PEO
NEOs” have been calculated in a manner consistent with Item 402(v) of Regulation S-K.
Use of the term “compensation actually paid” (“CAP”) is required by the SEC’s rules and as a result of the calculation methodology required by the SEC, such amounts differ from compensation actually received by the individuals and the compensation decisions described in the “Executive Compensation” section above. Fiscal Year (1) |
Summary Compensation Table Total for PEO ($) (2) |
Compensation Actually Paid to PEO ($) (3) |
Average Summary Compensation Table Total for Non-PEO NEOs ($) (4) |
Average Compensation Actually Paid to Non-PEO NEOs ($) (5) (6) |
Value of Initial Fixed $100 Investment Based on Total Shareholder Return ($) (7) |
Net Income (Loss) ($M) (8) |
||||||||||||||||||
2025 |
895,410 | 2,436,913 | 733,437 | 1,668,242 | 230 | (29.56 | ) | |||||||||||||||||
2024 |
1,657,842 | 1,459,806 | 1,321,917 | 1,177,179 | 124 | (13.70 | ) | |||||||||||||||||
| (1) | A. Rachel Leheny, Ph.D. was our PEO for each fiscal year included in the table. The Non-PEO NEOs for each fiscal year included in the table were as follows: |
Fiscal Year |
Non-PEO NEOs | |
| 2025 | Sudarshan Hebbar and Eric W. Roberts | |
| 2024 | Sudarshan Hebbar and Eric W. Roberts |
| (2) | Amounts reported in this column reflect compensation amounts reported in the “Total” column of the Summary Compensation Table (“SCT”) for our Chief Executive Officer during the applicable year. |
| (3) | Amounts reported in this column represent the amount of “compensation actually paid” to our PEO, as computed in accordance with Item 402(v) of Regulation S-K. The dollar amounts do not reflect the actual amount of compensation earned by or paid to our PEO during the applicable year. The adjustments to these values are attributable largely to the changes in the value of our PEO’s equity compensation awards in light of stock price movements. In accordance with the requirements of Item 402(v) of Regulation S-K, the following adjustments were made to our PEO’s reported total compensation for each year to determine the compensation actually paid: |
PEO* |
||||||||
Prior FYE Current FYE Fiscal Year |
1/1/2024 1/1/2025 2024 |
12/31/2024 12/31/2025 2025 |
||||||
SCT Total |
$ | 1,657,842 | $ | 895,410 | ||||
- Grant Date Fair Value of Option Awards and Stock Awards Granted in Fiscal Year |
$ | 962,550 | $ | 464,485 | ||||
+ Fair Value at Fiscal Year-End of Outstanding and Unvested Option Awards and Stock Awards Granted in Fiscal Year |
$ | 533,585 | $ | 1,385,218 | ||||
+ Change in Fair Value of Outstanding and Unvested Option Awards and Stock Awards Granted in Prior Fiscal Years |
$ | 27,331 | $ | 449,518 | ||||
PEO* |
||||||||
Prior FYE Current FYE Fiscal Year |
1/1/2024 1/1/2025 2024 |
12/31/2024 12/31/2025 2025 |
||||||
+ Fair Value at Vesting of Option Awards and Stock Awards Granted in Fiscal Year That Vested During Fiscal Year |
$ | 147,459 | $ | 244,178 | ||||
+ Change in Fair Value as of Vesting Date of Option Awards and Stock Awards Granted in Prior Fiscal Years For Which Applicable Vesting Conditions Were Satisfied During Fiscal Year |
$ | 56,139 | $ | (72,927 | ) | |||
- Fair Value as of Prior Fiscal Year-End of Option Awards and Stock Awards Granted in Prior Fiscal Years That Failed to Meet Applicable Vesting Conditions During Fiscal Year |
$ | — | $ | — | ||||
Compensation Actually Paid |
$ | 1,459,806 | $ | 2,436,913 | ||||
| * | The amounts in this table were added to or deducted from the SCT amount to determine the CAP as determined in accordance with SEC regulations. “Compensation actually paid” does not necessarily represent cash, and/or equity value transferred to the PEO without restriction, but rather is a value calculated under applicable SEC rules. Fair values set forth in the table below are computed in accordance with ASC 718 as of the end of the respective fiscal year, other than fair values of the awards that vest in the covered year, which are valued as of the applicable vesting date. The valuation methods and underlying assumptions did not materially differ from those disclosed at the time of grant date of the equity awards. |
| (4) | Amounts reported in this column reflect the average of the compensation amounts reported in the “Total” column of the SCT for the Non-PEO NEOs as a group during the applicable year. |
| (5) | Amounts reported in this column represent the average amount of “compensation actually paid” to our Non-PEO NEOs, as computed in accordance with Item 402(v) of Regulation S-K. The dollar amounts do not reflect the actual amount of compensation earned by or paid to our Non-PEO NEOs during the applicable year. The adjustments to these values are attributable largely to the changes in the value of our Non-PEO NEOs’ equity compensation awards in light of stock price movements. In accordance with the requirements of Item 402(v) of Regulation S-K, the following adjustments were made to the average of the reported total compensation for our Non-PEO NEOs as a group for each year to determine the compensation actually paid: |
NEOs* |
||||||||
Prior FYE Current FYE Fiscal Year |
1/1/2024 1/1/2025 2024 |
12/31/2024 12/31/2025 2025 |
||||||
SCT Total |
$ | 1,321,917 | $ | 733,437 | ||||
- Grant Date Fair Value of Option Awards and Stock Awards Granted in Fiscal Year |
$ | 669,600 | $ | 316,104 | ||||
+ Fair Value at Fiscal Year-End of Outstanding and Unvested Option Awards and Stock Awards Granted in Fiscal Year |
$ | 371,190 | $ | 814,119 | ||||
+ Change in Fair Value of Outstanding and Unvested Option Awards and Stock Awards Granted in Prior Fiscal Years |
$ | 15,203 | $ | 297,676 | ||||
+ Fair Value at Vesting of Option Awards and Stock Awards Granted in Fiscal Year That Vested During Fiscal Year |
$ | 102,580 | $ | 186,129 | ||||
+ Change in Fair Value as of Vesting Date of Option Awards and Stock Awards Granted in Prior Fiscal Years For Which Applicable Vesting Conditions Were Satisfied During Fiscal Year |
$ | 35,889 | $ | (47,015 | ) | |||
- Fair Value as of Prior Fiscal Year-End of Option Awards and Stock Awards Granted in Prior Fiscal Years That Failed to Meet Applicable Vesting Conditions During Fiscal Year |
$ | — | $ | — | ||||
Compensation Actually Paid |
$ | 1,177,179 | $ | 1,668,242 | ||||
| * | The amounts in this table were added to or deducted from the SCT amount to determine the CAP as determined in accordance with SEC regulations. “Compensation actually paid” does not necessarily represent cash, and/or equity value transferred to the applicable NEO without restriction, but rather is a value calculated under applicable SEC rules. Fair values set forth in the table below are computed in accordance with ASC 718 as of the end of the respective fiscal year, other than fair values of the awards that vest in the covered year, which are valued as of the applicable vesting date. The valuation methods and underlying assumptions did not materially differ from those disclosed at the time of grant date of the equity awards. |
| (7) | Total shareholder return (“TSR”) is calculated by dividing (a) the sum of (i) the cumulative amount of dividends for the measurement period, assuming dividend reinvestment, and (ii) the difference between the Company’s share price at the end of each fiscal year shown and the beginning of the measurement period by (b) the Company’s share price at the beginning of the measurement period. The beginning of the measurement period for each fiscal year in the table is December 31, 2023. |
| (8) | The dollar amounts reported represent the amount of net loss attributable to common stockholders reflected in the Company’s audited financial statements for the applicable year. |
| (1) | A. Rachel Leheny, Ph.D. was our PEO for each fiscal year included in the table. The Non-PEO NEOs for each fiscal year included in the table were as follows: |
Fiscal Year |
Non-PEO NEOs | |
| 2025 | Sudarshan Hebbar and Eric W. Roberts | |
| 2024 | Sudarshan Hebbar and Eric W. Roberts |
| (3) | Amounts reported in this column represent the amount of “compensation actually paid” to our PEO, as computed in accordance with Item 402(v) of Regulation S-K. The dollar amounts do not reflect the actual amount of compensation earned by or paid to our PEO during the applicable year. The adjustments to these values are attributable largely to the changes in the value of our PEO’s equity compensation awards in light of stock price movements. In accordance with the requirements of Item 402(v) of Regulation S-K, the following adjustments were made to our PEO’s reported total compensation for each year to determine the compensation actually paid: |
PEO* |
||||||||
Prior FYE Current FYE Fiscal Year |
1/1/2024 1/1/2025 2024 |
12/31/2024 12/31/2025 2025 |
||||||
SCT Total |
$ | 1,657,842 | $ | 895,410 | ||||
- Grant Date Fair Value of Option Awards and Stock Awards Granted in Fiscal Year |
$ | 962,550 | $ | 464,485 | ||||
+ Fair Value at Fiscal Year-End of Outstanding and Unvested Option Awards and Stock Awards Granted in Fiscal Year |
$ | 533,585 | $ | 1,385,218 | ||||
+ Change in Fair Value of Outstanding and Unvested Option Awards and Stock Awards Granted in Prior Fiscal Years |
$ | 27,331 | $ | 449,518 | ||||
PEO* |
||||||||
Prior FYE Current FYE Fiscal Year |
1/1/2024 1/1/2025 2024 |
12/31/2024 12/31/2025 2025 |
||||||
+ Fair Value at Vesting of Option Awards and Stock Awards Granted in Fiscal Year That Vested During Fiscal Year |
$ | 147,459 | $ | 244,178 | ||||
+ Change in Fair Value as of Vesting Date of Option Awards and Stock Awards Granted in Prior Fiscal Years For Which Applicable Vesting Conditions Were Satisfied During Fiscal Year |
$ | 56,139 | $ | (72,927 | ) | |||
- Fair Value as of Prior Fiscal Year-End of Option Awards and Stock Awards Granted in Prior Fiscal Years That Failed to Meet Applicable Vesting Conditions During Fiscal Year |
$ | — | $ | — | ||||
Compensation Actually Paid |
$ | 1,459,806 | $ | 2,436,913 | ||||
| * | The amounts in this table were added to or deducted from the SCT amount to determine the CAP as determined in accordance with SEC regulations. “Compensation actually paid” does not necessarily represent cash, and/or equity value transferred to the PEO without restriction, but rather is a value calculated under applicable SEC rules. Fair values set forth in the table below are computed in accordance with ASC 718 as of the end of the respective fiscal year, other than fair values of the awards that vest in the covered year, which are valued as of the applicable vesting date. The valuation methods and underlying assumptions did not materially differ from those disclosed at the time of grant date of the equity awards. |
| (5) | Amounts reported in this column represent the average amount of “compensation actually paid” to our Non-PEO NEOs, as computed in accordance with Item 402(v) of Regulation S-K. The dollar amounts do not reflect the actual amount of compensation earned by or paid to our Non-PEO NEOs during the applicable year. The adjustments to these values are attributable largely to the changes in the value of our Non-PEO NEOs’ equity compensation awards in light of stock price movements. In accordance with the requirements of Item 402(v) of Regulation S-K, the following adjustments were made to the average of the reported total compensation for our Non-PEO NEOs as a group for each year to determine the compensation actually paid: |
NEOs* |
||||||||
Prior FYE Current FYE Fiscal Year |
1/1/2024 1/1/2025 2024 |
12/31/2024 12/31/2025 2025 |
||||||
SCT Total |
$ | 1,321,917 | $ | 733,437 | ||||
- Grant Date Fair Value of Option Awards and Stock Awards Granted in Fiscal Year |
$ | 669,600 | $ | 316,104 | ||||
+ Fair Value at Fiscal Year-End of Outstanding and Unvested Option Awards and Stock Awards Granted in Fiscal Year |
$ | 371,190 | $ | 814,119 | ||||
+ Change in Fair Value of Outstanding and Unvested Option Awards and Stock Awards Granted in Prior Fiscal Years |
$ | 15,203 | $ | 297,676 | ||||
+ Fair Value at Vesting of Option Awards and Stock Awards Granted in Fiscal Year That Vested During Fiscal Year |
$ | 102,580 | $ | 186,129 | ||||
+ Change in Fair Value as of Vesting Date of Option Awards and Stock Awards Granted in Prior Fiscal Years For Which Applicable Vesting Conditions Were Satisfied During Fiscal Year |
$ | 35,889 | $ | (47,015 | ) | |||
- Fair Value as of Prior Fiscal Year-End of Option Awards and Stock Awards Granted in Prior Fiscal Years That Failed to Meet Applicable Vesting Conditions During Fiscal Year |
$ | — | $ | — | ||||
Compensation Actually Paid |
$ | 1,177,179 | $ | 1,668,242 | ||||
| * | The amounts in this table were added to or deducted from the SCT amount to determine the CAP as determined in accordance with SEC regulations. “Compensation actually paid” does not necessarily represent cash, and/or equity value transferred to the applicable NEO without restriction, but rather is a value calculated under applicable SEC rules. Fair values set forth in the table below are computed in accordance with ASC 718 as of the end of the respective fiscal year, other than fair values of the awards that vest in the covered year, which are valued as of the applicable vesting date. The valuation methods and underlying assumptions did not materially differ from those disclosed at the time of grant date of the equity awards. |
Relationship Between PEO and
Non-PEO
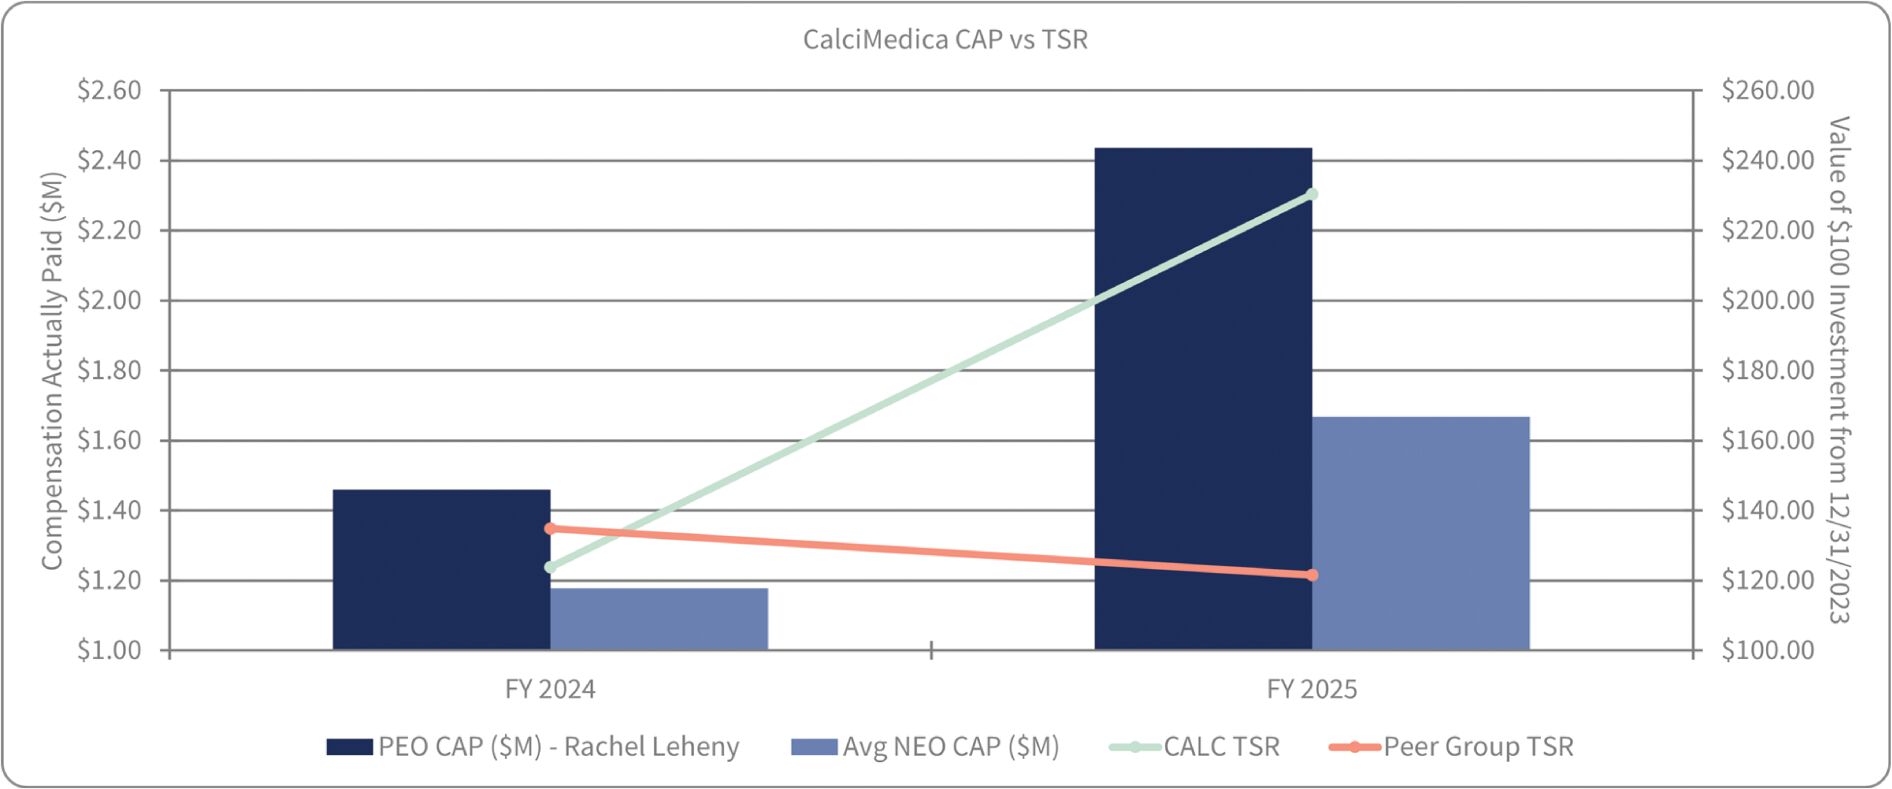
NEOs Compensation Actually Paid and Company Total Shareholder Return The following chart sets forth the relationship between Compensation Actually Paid to our PEOs, the average of Compensation Actually Paid to our other NEOs, and the Company’s cumulative TSR over the two most recently completed fiscal years.
Relationship Between PEO and
Non-PEO
NEOs Compensation Actually Paid and Net Loss The following chart sets forth the relationship between Compensation Actually Paid to our PEO, the average of Compensation
Actually
Paid to our other NEOs, and our net loss during each of the two most recently completed fiscal years. 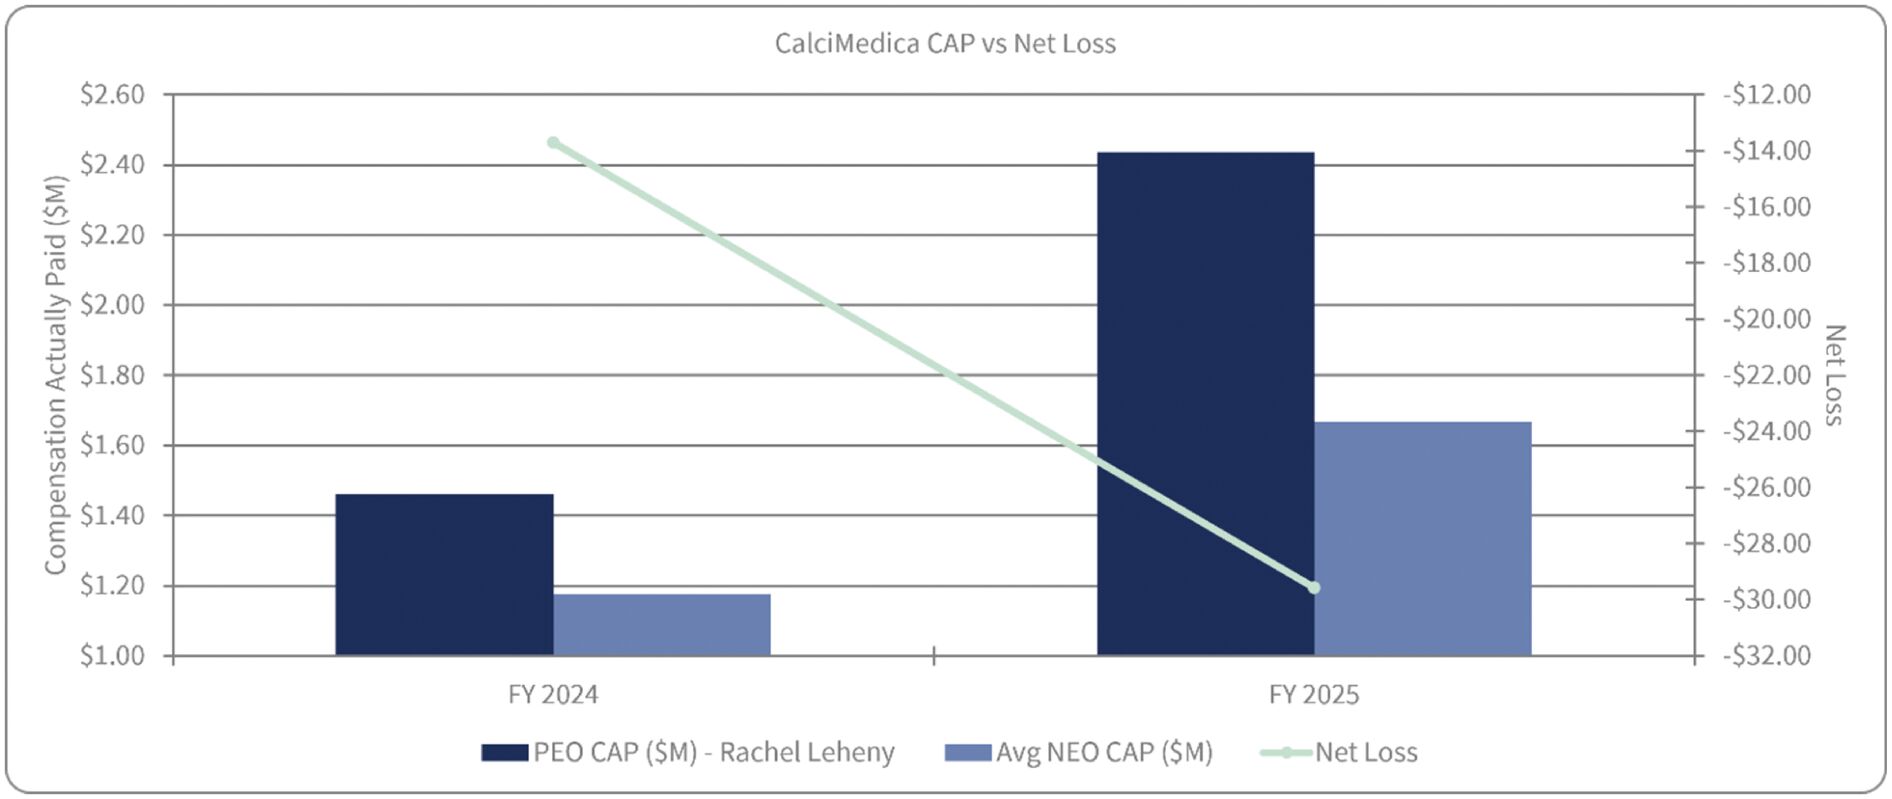
Relationship Between PEO and
Non-PEO
NEOs Compensation Actually Paid and Company Total Shareholder Return The following chart sets forth the relationship between Compensation Actually Paid to our PEOs, the average of Compensation Actually Paid to our other NEOs, and the Company’s cumulative TSR over the two most recently completed fiscal years.