| | | Average SCT | | Average Compensation | | Value of Initial Fixed $100 | | | | ||||||||||||||
SCT Total | Compensation | Total Compensation | Actually Paid to | Invested Based On: | ||||||||||||||||||||
Compensation for | Actually Paid to | for Other | Other | Company | Peer | Net Income | Adj. EBITDA6 | |||||||||||||||||
Year1 | | PEO1 | | PEO1,2 | | NEOs3 | | NEOs2,3 | | TSR4 | | Group4 | | ($M)5 | | ($M) | ||||||||
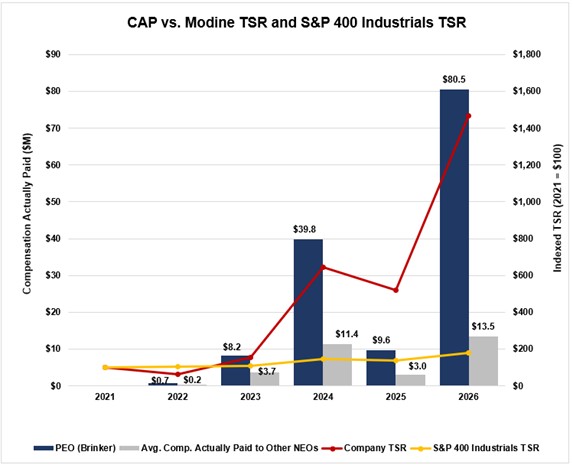
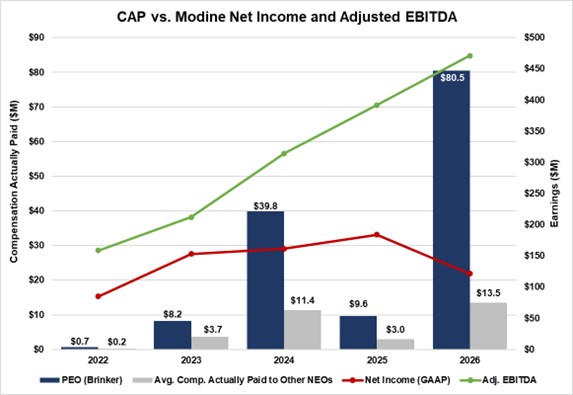
2026 | $ | 10,159,548 | $ | 80,479,068 | $ | 3,299,541 | $ | 13,497,421 | $ | 1,467.23 | $ | 178.19 | $ | 121.5 | $ | 471.0 | ||||||||
2025 | $ | 12,706,532 | $ | 9,639,794 | $ | 4,622,644 | $ | 2,953,383 | $ | 519.63 | $ | 135.97 | $ | 184.0 | $ | 392.1 | ||||||||
2024 | $ | 8,505,827 | $ | 39,819,460 | $ | 2,318,983 | $ | 11,394,298 | $ | 644.48 | $ | 146.90 | $ | 161.5 | $ | 314.3 | ||||||||
2023 | $ | 4,824,132 | $ | 8,200,158 | $ | 2,138,078 | $ | 3,658,664 | $ | 156.06 | $ | 108.59 | $ | 153.1 | $ | 212.1 | ||||||||
2022 | $ | 2,013,440 | $ | 712,768 | $ | 914,617 | $ | 246,552 | $ | 61.00 | $ | 104.34 | $ | 85.2 | $ | 158.8 | ||||||||
| (1) | “PEO” reflects compensation for Modine’s CEO, Neil Brinker. |
| (2) | CAP reflects the SEC methodology, with adjustments for calculating CAP from Summary Compensation Table (“SCT”) values provided in the table below. |
| (3) | NEOs used for the average non-CEO NEO for each fiscal year are as follows: |
−2026: Michael Lucareli, Eric McGinnis, Erin Roth and Jeremy Patten.
| − | 2025: Michael Lucareli, Eric McGinnis, Adrian Peace, Erin Roth and Brian Agen |
−2024: Michael Lucareli, Eric McGinnis, Adrian Peace and Brian Agen.
−2023: Michael Lucareli, Eric McGinnis, Sylvia Stein and Brian Agen.
− | 2022: Michael Lucareli, Eric McGinnis, Sylvia Stein, Brian Agen, Matthew McBurney, and Joel Casterton. |
| (4) | Cumulative TSR is measured as of a beginning date of April 1, 2021 (i.e., March 31, 2021, stock price is the base date for calculation); and peer group TSR reflects values for the S&P MidCap 400 Industrials Index, the same benchmark used in our 2026 annual report on Form 10-K. |
| (5) | Net Income reflects net earnings (loss) attributable to Modine, as disclosed in our financial statements. |
| (6) | Adjusted EBITDA is defined as “Operating Income” plus “Depreciation and Amortization Expenses,” both as reported externally for the Company’s audited financial statements, plus or minus permitted adjustments. |
| (1) | “PEO” reflects compensation for Modine’s CEO, Neil Brinker. |
| (3) | NEOs used for the average non-CEO NEO for each fiscal year are as follows: |
−2026: Michael Lucareli, Eric McGinnis, Erin Roth and Jeremy Patten.
| − | 2025: Michael Lucareli, Eric McGinnis, Adrian Peace, Erin Roth and Brian Agen |
−2024: Michael Lucareli, Eric McGinnis, Adrian Peace and Brian Agen.
−2023: Michael Lucareli, Eric McGinnis, Sylvia Stein and Brian Agen.
− | 2022: Michael Lucareli, Eric McGinnis, Sylvia Stein, Brian Agen, Matthew McBurney, and Joel Casterton. |
| (4) | Cumulative TSR is measured as of a beginning date of April 1, 2021 (i.e., March 31, 2021, stock price is the base date for calculation); and peer group TSR reflects values for the S&P MidCap 400 Industrials Index, the same benchmark used in our 2026 annual report on Form 10-K. |
Adjustments to Calculate Compensation Actually Paid
| Pension Benefits | Equity Awards | | | |||||||||||||||||||||||||||||||
Add Year-End | Add Change in | Deduct Fair | Add | ||||||||||||||||||||||||||||||||
Deduct SCT | Add | Deduct SCT | Fair Value of | Add Fair Value | Value of Prior | Add Change in | Value of Awards | Dividends | |||||||||||||||||||||||||||
Change in | Pension | Stock and | Unvested | of Equity | Years' Awards | Value of Vested | Not Meeting | Paid on | |||||||||||||||||||||||||||
Pension | Service | Option | Equity Granted | Vested and | Unvested at | Equity Granted | Vesting | Unvested | |||||||||||||||||||||||||||
Fiscal Year | | Executive | | SCT Total | | Value | | Cost | | Awards | | in Year | | Granted in Year | | FYE | | in Prior Years | | Conditions | | Equity | | Total CAP1 | |||||||||||
2026 | PEO (Brinker) | $ | 10,159,548 | N/A | $ | 0 | $ | (6,120,022) | $ | 27,913,332 | $ | 0 | $ | 47,109,899 | $ | 1,416,311 | $ | 0 | $ | 0 | $ | 80,479,068 | |||||||||||||
Avg. Non-PEO NEO | $ | 3,299,541 | $ | 0 | $ | 0 | $ | (2,106,374) | $ | 4,824,831 | $ | 0 | $ | 7,211,400 | $ | 268,022 | $ | 0 | $ | 0 | $ | 13,497,421 | |||||||||||||
2025 | PEO (Brinker) | $ | 12,706,532 | N/A | $ | 0 | $ | (5,175,010) | $ | 7,655,045 | $ | 0 | $ | (5,704,698) | $ | 157,925 | $ | 0 | $ | 0 | $ | 9,639,794 | |||||||||||||
Avg. Non-PEO NEO | $ | 4,622,644 | $ | (2,598) | $ | 0 | $ | (2,513,875) | $ | 1,527,632 | $ | 29,879 | $ | (998,927) | $ | 288,627 | $ | 0 | $ | 0 | $ | 2,953,383 | |||||||||||||
2024 | PEO (Brinker) | $ | 8,505,827 |
| N/A | $ | 0 | $ | (3,675,008) | $ | 23,073,770 | $ | 0 | $ | 11,109,400 | $ | 805,470 | $ | 0 | $ | 0 | $ | 39,819,460 | ||||||||||||
Avg. Non-PEO NEO | $ | 2,318,983 | $ | (956) | $ | 0 | $ | (773,249) | $ | 4,854,880 | $ | 0 | $ | 4,121,144 | $ | 873,495 | $ | 0 | $ | 0 | $ | 11,394,298 | |||||||||||||
2023 | PEO (Brinker) | $ | 4,824,132 |
| N/A | $ | 0 | $ | (1,485,011) | $ | 3,070,765 | $ | 0 | $ | 1,195,145 | $ | 595,127 | $ | 0 | $ | 0 | $ | 8,200,158 | ||||||||||||
Avg. Non-PEO NEO | $ | 2,138,078 | $ | 0 | $ | 0 | $ | (780,496) | $ | 1,417,493 | $ | 0 | $ | 717,756 | $ | 165,833 | $ | 0 | $ | 0 | $ | 3,658,664 | |||||||||||||
2022 | PEO (Brinker) | $ | 2,013,440 |
| N/A | $ | 0 | $ | (1,147,900) | $ | 540,677 | $ | 0 | $ | (398,489) | $ | (294,961) | $ | 0 | $ | 0 | $ | 712,768 | ||||||||||||
Avg. Non-PEO NEO | $ | 914,617 | $ | 0 | $ | 0 | $ | (408,039) | $ | 169,336 | $ | 26,867 | $ | (259,562) | $ | (119,480) | $ | (77,187) | $ | 0 | $ | 246,552 | |||||||||||||
| (1) | Columns may not sum due to rounding |
Adjustments to Calculate Compensation Actually Paid
| Pension Benefits | Equity Awards | | | |||||||||||||||||||||||||||||||
Add Year-End | Add Change in | Deduct Fair | Add | ||||||||||||||||||||||||||||||||
Deduct SCT | Add | Deduct SCT | Fair Value of | Add Fair Value | Value of Prior | Add Change in | Value of Awards | Dividends | |||||||||||||||||||||||||||
Change in | Pension | Stock and | Unvested | of Equity | Years' Awards | Value of Vested | Not Meeting | Paid on | |||||||||||||||||||||||||||
Pension | Service | Option | Equity Granted | Vested and | Unvested at | Equity Granted | Vesting | Unvested | |||||||||||||||||||||||||||
Fiscal Year | | Executive | | SCT Total | | Value | | Cost | | Awards | | in Year | | Granted in Year | | FYE | | in Prior Years | | Conditions | | Equity | | Total CAP1 | |||||||||||
2026 | PEO (Brinker) | $ | 10,159,548 | N/A | $ | 0 | $ | (6,120,022) | $ | 27,913,332 | $ | 0 | $ | 47,109,899 | $ | 1,416,311 | $ | 0 | $ | 0 | $ | 80,479,068 | |||||||||||||
Avg. Non-PEO NEO | $ | 3,299,541 | $ | 0 | $ | 0 | $ | (2,106,374) | $ | 4,824,831 | $ | 0 | $ | 7,211,400 | $ | 268,022 | $ | 0 | $ | 0 | $ | 13,497,421 | |||||||||||||
2025 | PEO (Brinker) | $ | 12,706,532 | N/A | $ | 0 | $ | (5,175,010) | $ | 7,655,045 | $ | 0 | $ | (5,704,698) | $ | 157,925 | $ | 0 | $ | 0 | $ | 9,639,794 | |||||||||||||
Avg. Non-PEO NEO | $ | 4,622,644 | $ | (2,598) | $ | 0 | $ | (2,513,875) | $ | 1,527,632 | $ | 29,879 | $ | (998,927) | $ | 288,627 | $ | 0 | $ | 0 | $ | 2,953,383 | |||||||||||||
2024 | PEO (Brinker) | $ | 8,505,827 |
| N/A | $ | 0 | $ | (3,675,008) | $ | 23,073,770 | $ | 0 | $ | 11,109,400 | $ | 805,470 | $ | 0 | $ | 0 | $ | 39,819,460 | ||||||||||||
Avg. Non-PEO NEO | $ | 2,318,983 | $ | (956) | $ | 0 | $ | (773,249) | $ | 4,854,880 | $ | 0 | $ | 4,121,144 | $ | 873,495 | $ | 0 | $ | 0 | $ | 11,394,298 | |||||||||||||
2023 | PEO (Brinker) | $ | 4,824,132 |
| N/A | $ | 0 | $ | (1,485,011) | $ | 3,070,765 | $ | 0 | $ | 1,195,145 | $ | 595,127 | $ | 0 | $ | 0 | $ | 8,200,158 | ||||||||||||
Avg. Non-PEO NEO | $ | 2,138,078 | $ | 0 | $ | 0 | $ | (780,496) | $ | 1,417,493 | $ | 0 | $ | 717,756 | $ | 165,833 | $ | 0 | $ | 0 | $ | 3,658,664 | |||||||||||||
2022 | PEO (Brinker) | $ | 2,013,440 |
| N/A | $ | 0 | $ | (1,147,900) | $ | 540,677 | $ | 0 | $ | (398,489) | $ | (294,961) | $ | 0 | $ | 0 | $ | 712,768 | ||||||||||||
Avg. Non-PEO NEO | $ | 914,617 | $ | 0 | $ | 0 | $ | (408,039) | $ | 169,336 | $ | 26,867 | $ | (259,562) | $ | (119,480) | $ | (77,187) | $ | 0 | $ | 246,552 | |||||||||||||
| (1) | Columns may not sum due to rounding |
Tabular List Metrics
The table below lists our most important performance measures used to link “Compensation Actually Paid” for our NEOs to company performance over the fiscal year ending March 31, 2026. These measures are used to determine payouts for our annual incentive plan and for our long-term performance cash plan. For more information on our incentive plan measures and goals (including on how the below measures are calculated), refer to the Compensation Discussion and Analysis section of this proxy statement. The performance measures included in this table are not ranked by relative importance.
Most Important Metrics
Adjusted EBITDA
Adjusted EBITDA Growth
Adjusted EBITDA Margin
Cash Flow ROI
| (6) | Adjusted EBITDA is defined as “Operating Income” plus “Depreciation and Amortization Expenses,” both as reported externally for the Company’s audited financial statements, plus or minus permitted adjustments. |