Pay vs Performance Disclosure - USD ($)
|
12 Months Ended |
Mar. 31, 2026 |
Mar. 31, 2025 |
Mar. 31, 2024 |
Mar. 31, 2023 |
Mar. 31, 2022 |
Mar. 31, 2021 |
| Pay vs Performance Disclosure |
|
|
|
|
|
|
| Pay vs Performance Disclosure, Table |
| | | | | | | | | | | | | | | | | | | | | | | | | | | | | | | | | | Year | Summary Compensation Table Total for PEO 1(1) | Compensation Actually Paid to PEO 1(2) | Summary Compensation Table Total for PEO 2(1) | Compensation Actually Paid to PEO 2(2) | Average Summary Compensation Table Total for Non-PEO Named Executive Officers(3) | Average Compensation Actually Paid to Non-PEO Named Executive Officers(4) | Value of Initial Fixed $100 Investment Based On: | Net Income(7) (in millions) | Company-Selected Measure: Revenue (in millions) | Total Stockholder
Return(5) | Peer Group Total Stockholder
Return(6) | | (a) | (b1) | (c1) | (b2) | (c2) | (d) | (e) | (f) | (g) | (h) | (i) | | 2026 | $21,234,453 | $12,489,583 | N/A | N/A | $8,414,779 | $5,005,174 | $77 | $91 | $163 | $2,018 | | 2025 | $19,380,348 | $18,938,941 | N/A | N/A | $5,788,479 | $6,868,720 | $98 | $102 | $484 | $1,699 | | 2024 | $17,279,634 | $17,971,992 | N/A | N/A | $7,433,349 | $8,056,184 | $96 | $99 | $155 | $1,431 | | 2023 | $14,563,163 | $13,144,670 | N/A | N/A | $5,281,405 | $413,716 | $88 | $78 | $108 | $1,159 | | 2022 | $20,970,696 | $16,561,640 | $11,063,656 | $12,634,504 | $6,105,139 | $6,838,009 | $98 | $94 | $52 | $929 |
|
|
|
|
|
|
| Company Selected Measure Name |
Revenue
|
|
|
|
|
|
| Named Executive Officers, Footnote |
The dollar amounts reported in columns (b1) and (b2) represent the amount of total compensation reported for Rick McConnell (“PEO 1”) and John Van Siclen (“PEO 2”) (collectively, our “PEOs”) for each corresponding covered fiscal year in the “Total” column of the Summary Compensation Table for each applicable fiscal year. The dollar amounts reported in column (d) represent the average of the amounts of total compensation reported for our named executive officers (collectively, our “NEOs”) as a group (excluding our PEOs) for each covered fiscal year in the “Total” column of the Summary Compensation Table for each applicable fiscal year. The names of each NEO included for purposes of calculating the average amounts of total compensation in each covered fiscal year are as follows: | | | | | | | | | | | | | | | | Fiscal Year | | 2026 | 2025 | 2024 | 2023 | 2022 | •Jim Benson •Dan Zugelder •Bernd Greifeneder •Steve McMahon | •Jim Benson •Dan Zugelder •Bernd Greifeneder •Matthias Dollentz-Scharer | •Jim Benson •Dan Zugelder •Bernd Greifeneder •Matthias Dollentz-Scharer
| •Jim Benson •Steve Pace •Bernd Greifeneder •Matthias Dollentz-Scharer •Kevin Burns | •Steve Pace •Bernd Greifeneder •Kevin Burns |
|
|
|
|
|
|
| Peer Group Issuers, Footnote |
The peer group used is the S&P Software and Services Select Index, as used in the performance graph shown in our Annual Report on Form 10-K for the fiscal year ended March 31, 2026. Total Stockholder Return is calculated by assuming that a $100 investment was made on the close of trading on March 31, 2021 and reinvesting all dividends until the last day of each reported fiscal year. We added the S&P Software and Services Select Index as an additional industry comparison in the performance graph shown in our Annual Report on Form 10-K for the fiscal year ended March 31, 2026 as we believe it is a relevant benchmark to measure our company’s stock performance. The performance graph shown in our Annual Report on Form 10-K for the fiscal year ended March 31, 2026 also included the S&P 500 Information Technology Index. The Total Stockholder Return for the S&P 500 Information Technology Index was $221, $172, $164, $113, and $120 for 2026, 2025, 2024, 2023, and 2022, respectively.
|
|
|
|
|
|
| Adjustment To PEO Compensation, Footnote |
The Compensation Actually Paid to our PEOs reflects the following adjustments required by applicable SEC rules from total compensation reported in the Summary Compensation Table: | | | | | | | | | | | | | | | | | | | | | | | | PEO 1 | | 2022 | 2023 | 2024 | 2025 | 2026 | | Summary Compensation Table - Total Compensation | (a) | $20,970,696 | $14,563,163 | $17,279,634 | $19,380,348 | $21,234,453 | - | Grant Date Fair Value of Stock Awards and Option Awards Granted in Fiscal Year | (b) | $20,310,016 | $13,234,082 | $15,896,813 | $18,000,733 | $19,790,764 | + | Fair Value at Fiscal Year End of Outstanding and Unvested Stock Awards and Option Awards Granted in Fiscal Year | (c) | $15,900,960 | $13,660,362 | $16,498,724 | $18,472,432 | $11,328,755 | + | Change in Fair Value of Outstanding and Unvested Stock Awards and Option Awards Granted in Prior Fiscal Years | (d) | $0 | $(1,291,320) | $(2,655,180) | $120,569 | $(2,796,276) | + | Fair Value at Vesting of Stock Awards and Option Awards Granted in Fiscal Year That Vested During Fiscal Year | (e) | $0 | $0 | $0 | $0 | $0 | + | Change in Fair Value as of Vesting Date of Stock Awards and Option Awards Granted in Prior Fiscal Years For Which Applicable Vesting Conditions Were Satisfied During Fiscal Year | (f) | $0 | $(553,453) | $2,745,626 | $(1,033,675) | $2,513,415 | - | Fair Value as of Prior Fiscal Year End of Stock Awards and Option Awards Granted in Prior Fiscal Years That Failed to Meet Applicable Vesting Conditions During Fiscal Year | (g) | $0 | $0 | $0 | $0 | $0 | = | Compensation Actually Paid | | $16,561,640 | $13,144,670 | $17,971,992 | $18,938,941 | $12,489,583 |
| | | | | | | | | | | | | | | | PEO 2 | | 2021 | 2022 | | Summary Compensation Table - Total Compensation | (a) | $8,448,615 | $11,063,656 | | - | Grant Date Fair Value of Stock Awards and Option Awards Granted in Fiscal Year | (b) | $7,120,723 | $9,704,469 | | + | Fair Value at Fiscal Year End of Outstanding and Unvested Stock Awards and Option Awards Granted in Fiscal Year | (c) | $11,890,776 | $9,777,960 | | + | Change in Fair Value of Outstanding and Unvested Stock Awards and Option Awards Granted in Prior Fiscal Years | (d) | $8,827,594 | $(376,473) | | + | Fair Value at Vesting of Stock Awards and Option Awards Granted in Fiscal Year That Vested During Fiscal Year | (e) | $0 | $0 | | + | Change in Fair Value as of Vesting Date of Stock Awards and Option Awards Granted in Prior Fiscal Years For Which Applicable Vesting Conditions Were Satisfied During Fiscal Year | (f) | $3,348,613 | $1,873,829 | | - | Fair Value as of Prior Fiscal Year End of Stock Awards and Option Awards Granted in Prior Fiscal Years That Failed to Meet Applicable Vesting Conditions During Fiscal Year | (g) | $0 | $0 | = | Compensation Actually Paid | | $25,394,875 | $12,634,504 |
For purposes of the adjustments to determine “Compensation Actually Paid”, we computed the fair value of equity awards in accordance with ASC 718 at the end of the relevant fiscal year, other than fair values of equity awards that vested within fiscal 2022, 2023, 2024, 2025 and 2026, as applicable, which are valued as of the applicable vesting date.
|
|
|
|
|
|
| Non-PEO NEO Average Total Compensation Amount |
$ 8,414,779
|
$ 5,788,479
|
$ 7,433,349
|
$ 5,281,405
|
$ 6,105,139
|
|
| Non-PEO NEO Average Compensation Actually Paid Amount |
$ 5,005,174
|
6,868,720
|
8,056,184
|
413,716
|
6,838,009
|
|
| Adjustment to Non-PEO NEO Compensation Footnote |
The Compensation Actually Paid to our NEOs (excluding PEOs) on average reflects the following adjustments required by applicable SEC rules from total compensation reported in the Summary Compensation Table: | | | | | | | | | | | | | | | | | | | | | | | | | NEO Average | | 2022 | 2023 | 2024 | 2025 | 2026 | | Summary Compensation Table - Total Compensation | (a) | $6,105,139 | $5,281,405 | $7,433,349 | $5,788,479 | $8,414,779 | | - | Grant Date Fair Value of Stock Awards and Option Awards Granted in Fiscal Year | (b) | $5,293,512 | $4,646,882 | $6,601,718 | $4,936,603 | $7,526,571 | | + | Fair Value at Fiscal Year End of Outstanding and Unvested Stock Awards and Option Awards Granted in Fiscal Year | (c) | $5,341,140 | $2,295,706 | $5,770,907 | $5,065,960 | $4,308,408 | | + | Change in Fair Value of Outstanding and Unvested Stock Awards and Option Awards Granted in Prior Fiscal Years | (d) | $(163,575) | $(249,155) | $216,797 | $63,175 | $(825,752) | | + | Fair Value at Vesting of Stock Awards and Option Awards Granted in Fiscal Year That Vested During Fiscal Year | (e) | $0 | $0 | $521,540 | $0 | $0 | | + | Change in Fair Value as of Vesting Date of Stock Awards and Option Awards Granted in Prior Fiscal Years For Which Applicable Vesting Conditions Were Satisfied During Fiscal Year | (f) | $848,817 | $(746,053) | $715,309 | $887,709 | $634,310 | | - | Fair Value as of Prior Fiscal Year End of Stock Awards and Option Awards Granted in Prior Fiscal Years That Failed to Meet Applicable Vesting Conditions During Fiscal Year | (g) | $0 | $1,521,305 | $0 | $0 | $0 | = | Compensation Actually Paid | | $6,838,009 | $413,716 | $8,056,184 | $6,868,720 | $5,005,174 |
For purposes of the adjustments to determine “Compensation Actually Paid”, we computed the fair value of equity awards in accordance with ASC 718 at the end of the relevant fiscal year, other than fair values of equity awards that vested within fiscal 2022, 2023, 2024, 2025 and 2026 as applicable, which are valued as of the applicable vesting date.
|
|
|
|
|
|
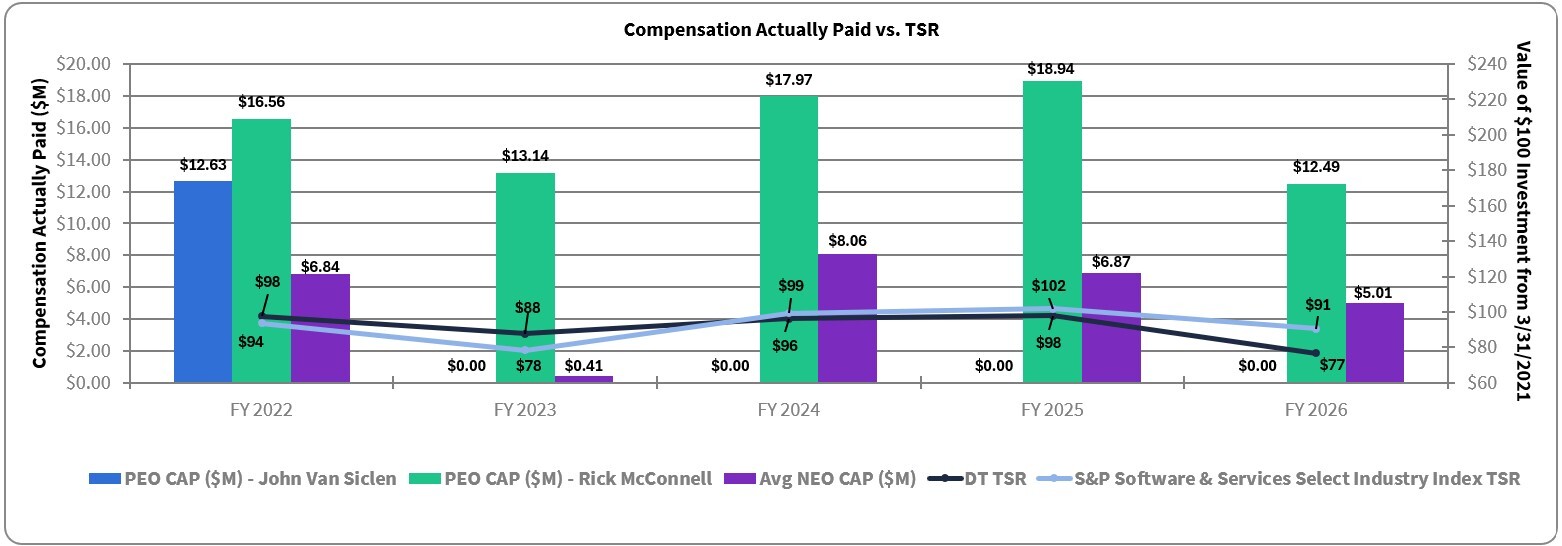
| Compensation Actually Paid vs. Total Shareholder Return |
Compensation Actually Paid and Company TSR and Peer Group TSR
The following chart illustrates the relationship between our Compensation Actually Paid and TSR.
|
|
|
|
|
|
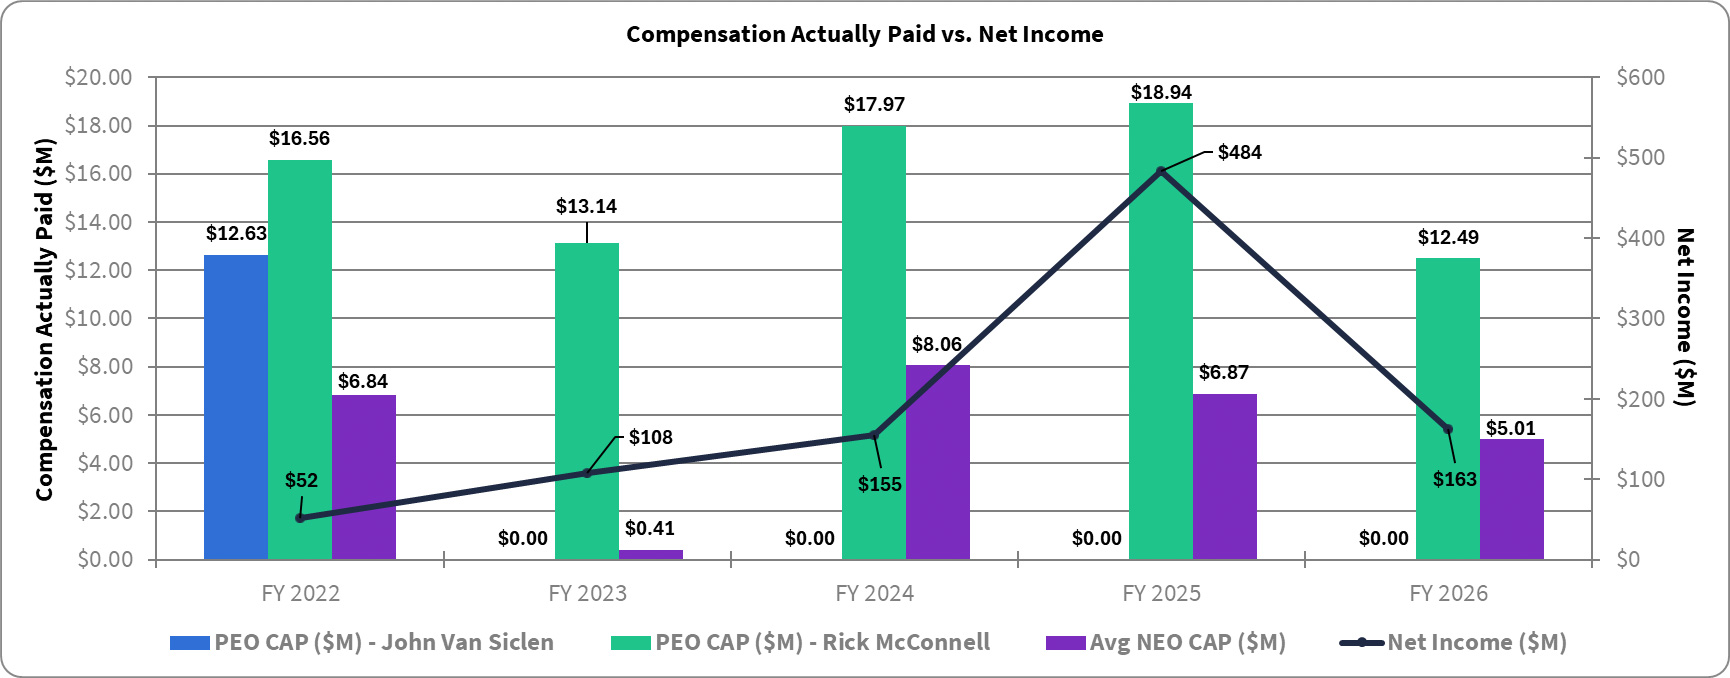
| Compensation Actually Paid vs. Net Income |
Compensation Actually Paid and Net Income
The following chart illustrates the relationship between our Compensation Actually Paid and Net Income (which is prepared and presented in accordance with GAAP). During fiscal 2025, Dynatrace completed an intra-entity asset transfer of the global economic rights of IP from a wholly owned U.S. subsidiary to a wholly-owned Swiss subsidiary, more closely aligning IP rights with business operations. The transfer generated an income tax benefit of $320.9 million.
|
|
|
|
|
|
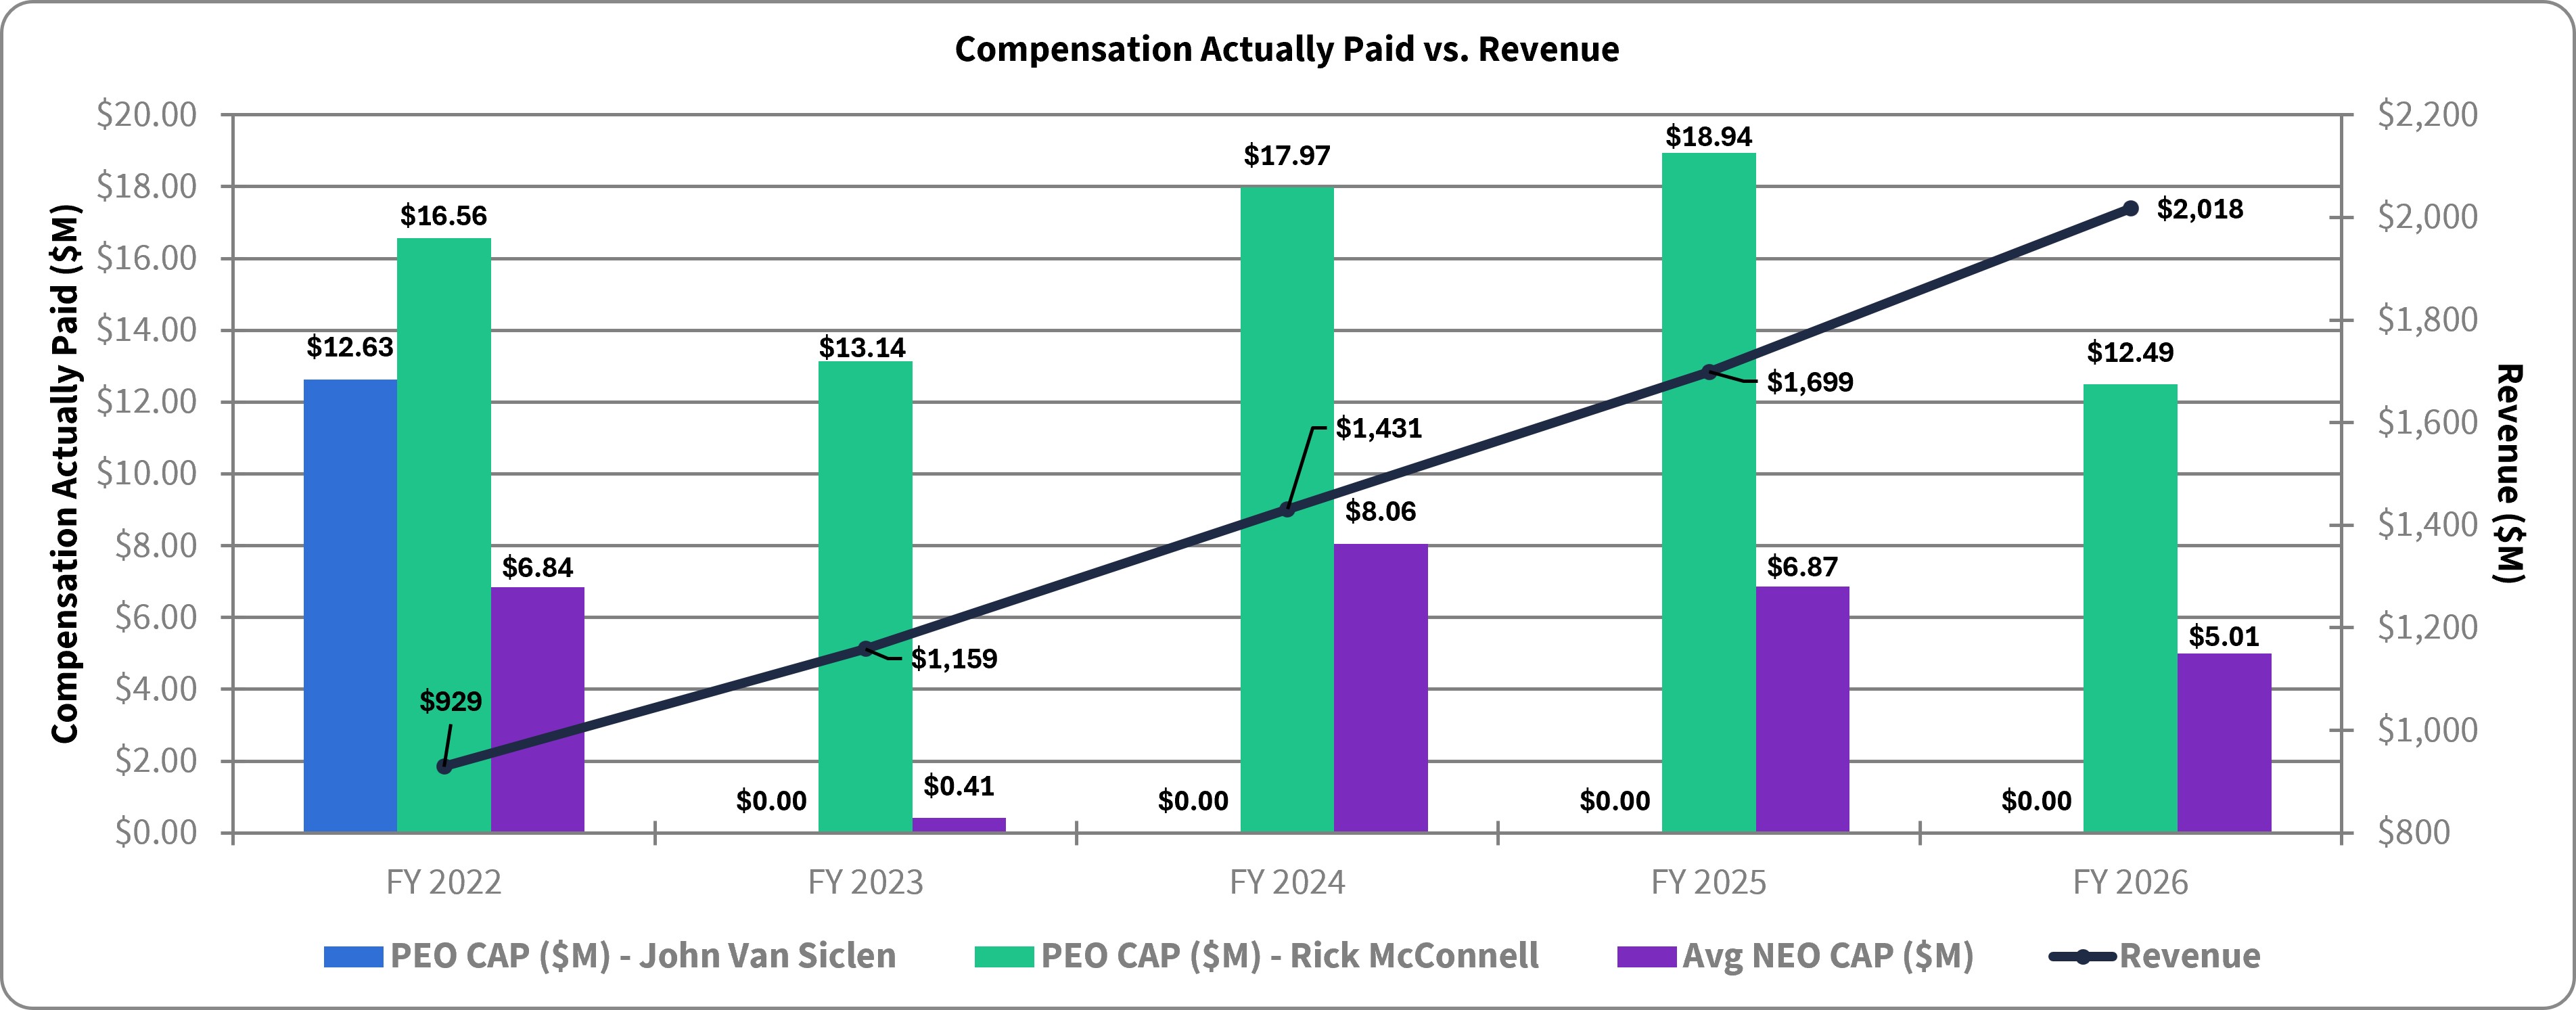
| Compensation Actually Paid vs. Company Selected Measure |
Compensation Actually Paid and Revenue
The following chart illustrates the relationship between our Compensation Actually Paid and Revenue.
|
|
|
|
|
|
| Total Shareholder Return Vs Peer Group |
Compensation Actually Paid and Company TSR and Peer Group TSR
The following chart illustrates the relationship between our Compensation Actually Paid and TSR.
|
|
|
|
|
|
| Tabular List, Table |
The financial performance measures listed below were the sole financial performance measures used to determine the compensation actually paid to our named executive officers in fiscal 2026:
Annual Recurring Revenue ("ARR") Revenue Non-GAAP Operating Income or ("NGOI")
|
|
|
|
|
|
| Total Shareholder Return Amount |
$ 77
|
98
|
96
|
88
|
98
|
|
| Peer Group Total Shareholder Return Amount |
91
|
102
|
99
|
78
|
94
|
|
| Net Income (Loss) |
$ 163,000,000
|
$ 484,000,000
|
$ 155,000,000
|
$ 108,000,000
|
$ 52,000,000
|
|
| Company Selected Measure Amount |
2,018,000,000
|
1,699,000,000
|
1,431,000,000
|
1,159,000,000
|
929,000,000
|
|
| Additional 402(v) Disclosure |
Total Stockholder Return is calculated by assuming that a $100 investment was made on the close of trading on March 31, 2021. Our company did not pay any dividends during fiscal years 2022, 2023, 2024, 2025 and 2026. The dollar amounts reported represent the amount of net income reflected in our audited financial statements for each covered fiscal year. During fiscal 2025, Dynatrace completed an intra-entity asset transfer of the global economic rights of IP from a wholly owned U.S. subsidiary to a wholly-owned Swiss subsidiary, more closely aligning IP rights with business operations. The transfer generated an income tax benefit of $320.9 million.
|
|
|
|
|
|
| Measure:: 1 |
|
|
|
|
|
|
| Pay vs Performance Disclosure |
|
|
|
|
|
|
| Name |
Annual Recurring Revenue ("ARR")
|
|
|
|
|
|
| Measure:: 2 |
|
|
|
|
|
|
| Pay vs Performance Disclosure |
|
|
|
|
|
|
| Name |
Revenue
|
|
|
|
|
|
| Measure:: 3 |
|
|
|
|
|
|
| Pay vs Performance Disclosure |
|
|
|
|
|
|
| Name |
Non-GAAP Operating Income or ("NGOI")
|
|
|
|
|
|
| Rick McConnell [Member] |
|
|
|
|
|
|
| Pay vs Performance Disclosure |
|
|
|
|
|
|
| PEO Total Compensation Amount |
$ 21,234,453
|
$ 19,380,348
|
$ 17,279,634
|
$ 14,563,163
|
$ 20,970,696
|
|
| PEO Actually Paid Compensation Amount |
$ 12,489,583
|
$ 18,938,941
|
$ 17,971,992
|
$ 13,144,670
|
16,561,640
|
|
| PEO Name |
Rick McConnell
|
Rick McConnell
|
Rick McConnell
|
Rick McConnell
|
|
|
| John Van Siclen [Member] |
|
|
|
|
|
|
| Pay vs Performance Disclosure |
|
|
|
|
|
|
| PEO Total Compensation Amount |
|
|
|
|
11,063,656
|
$ 8,448,615
|
| PEO Actually Paid Compensation Amount |
|
|
|
|
$ 12,634,504
|
25,394,875
|
| PEO Name |
|
|
|
|
John Van Siclen
|
|
| PEO | Rick McConnell [Member] | Aggregate Grant Date Fair Value of Equity Award Amounts Reported in Summary Compensation Table |
|
|
|
|
|
|
| Pay vs Performance Disclosure |
|
|
|
|
|
|
| Adjustment to Compensation, Amount |
$ (19,790,764)
|
$ (18,000,733)
|
$ (15,896,813)
|
$ (13,234,082)
|
$ (20,310,016)
|
|
| PEO | Rick McConnell [Member] | Year-end Fair Value of Equity Awards Granted in Covered Year that are Outstanding and Unvested |
|
|
|
|
|
|
| Pay vs Performance Disclosure |
|
|
|
|
|
|
| Adjustment to Compensation, Amount |
11,328,755
|
18,472,432
|
16,498,724
|
13,660,362
|
15,900,960
|
|
| PEO | Rick McConnell [Member] | Year-over-Year Change in Fair Value of Equity Awards Granted in Prior Years That are Outstanding and Unvested |
|
|
|
|
|
|
| Pay vs Performance Disclosure |
|
|
|
|
|
|
| Adjustment to Compensation, Amount |
(2,796,276)
|
120,569
|
(2,655,180)
|
(1,291,320)
|
0
|
|
| PEO | Rick McConnell [Member] | Vesting Date Fair Value of Equity Awards Granted and Vested in Covered Year |
|
|
|
|
|
|
| Pay vs Performance Disclosure |
|
|
|
|
|
|
| Adjustment to Compensation, Amount |
0
|
0
|
0
|
0
|
0
|
|
| PEO | Rick McConnell [Member] | Change in Fair Value as of Vesting Date of Prior Year Equity Awards Vested in Covered Year |
|
|
|
|
|
|
| Pay vs Performance Disclosure |
|
|
|
|
|
|
| Adjustment to Compensation, Amount |
2,513,415
|
(1,033,675)
|
2,745,626
|
(553,453)
|
0
|
|
| PEO | Rick McConnell [Member] | Prior Year End Fair Value of Equity Awards Granted in Any Prior Year that Fail to Meet Applicable Vesting Conditions During Covered Year |
|
|
|
|
|
|
| Pay vs Performance Disclosure |
|
|
|
|
|
|
| Adjustment to Compensation, Amount |
0
|
0
|
0
|
0
|
0
|
|
| PEO | John Van Siclen [Member] | Aggregate Grant Date Fair Value of Equity Award Amounts Reported in Summary Compensation Table |
|
|
|
|
|
|
| Pay vs Performance Disclosure |
|
|
|
|
|
|
| Adjustment to Compensation, Amount |
|
|
|
|
(9,704,469)
|
(7,120,723)
|
| PEO | John Van Siclen [Member] | Year-end Fair Value of Equity Awards Granted in Covered Year that are Outstanding and Unvested |
|
|
|
|
|
|
| Pay vs Performance Disclosure |
|
|
|
|
|
|
| Adjustment to Compensation, Amount |
|
|
|
|
9,777,960
|
11,890,776
|
| PEO | John Van Siclen [Member] | Year-over-Year Change in Fair Value of Equity Awards Granted in Prior Years That are Outstanding and Unvested |
|
|
|
|
|
|
| Pay vs Performance Disclosure |
|
|
|
|
|
|
| Adjustment to Compensation, Amount |
|
|
|
|
(376,473)
|
8,827,594
|
| PEO | John Van Siclen [Member] | Vesting Date Fair Value of Equity Awards Granted and Vested in Covered Year |
|
|
|
|
|
|
| Pay vs Performance Disclosure |
|
|
|
|
|
|
| Adjustment to Compensation, Amount |
|
|
|
|
0
|
0
|
| PEO | John Van Siclen [Member] | Change in Fair Value as of Vesting Date of Prior Year Equity Awards Vested in Covered Year |
|
|
|
|
|
|
| Pay vs Performance Disclosure |
|
|
|
|
|
|
| Adjustment to Compensation, Amount |
|
|
|
|
1,873,829
|
3,348,613
|
| PEO | John Van Siclen [Member] | Prior Year End Fair Value of Equity Awards Granted in Any Prior Year that Fail to Meet Applicable Vesting Conditions During Covered Year |
|
|
|
|
|
|
| Pay vs Performance Disclosure |
|
|
|
|
|
|
| Adjustment to Compensation, Amount |
|
|
|
|
0
|
$ 0
|
| Non-PEO NEO | Aggregate Grant Date Fair Value of Equity Award Amounts Reported in Summary Compensation Table |
|
|
|
|
|
|
| Pay vs Performance Disclosure |
|
|
|
|
|
|
| Adjustment to Compensation, Amount |
(7,526,571)
|
(4,936,603)
|
(6,601,718)
|
(4,646,882)
|
(5,293,512)
|
|
| Non-PEO NEO | Year-end Fair Value of Equity Awards Granted in Covered Year that are Outstanding and Unvested |
|
|
|
|
|
|
| Pay vs Performance Disclosure |
|
|
|
|
|
|
| Adjustment to Compensation, Amount |
4,308,408
|
5,065,960
|
5,770,907
|
2,295,706
|
5,341,140
|
|
| Non-PEO NEO | Year-over-Year Change in Fair Value of Equity Awards Granted in Prior Years That are Outstanding and Unvested |
|
|
|
|
|
|
| Pay vs Performance Disclosure |
|
|
|
|
|
|
| Adjustment to Compensation, Amount |
(825,752)
|
63,175
|
216,797
|
(249,155)
|
(163,575)
|
|
| Non-PEO NEO | Vesting Date Fair Value of Equity Awards Granted and Vested in Covered Year |
|
|
|
|
|
|
| Pay vs Performance Disclosure |
|
|
|
|
|
|
| Adjustment to Compensation, Amount |
0
|
0
|
521,540
|
0
|
0
|
|
| Non-PEO NEO | Change in Fair Value as of Vesting Date of Prior Year Equity Awards Vested in Covered Year |
|
|
|
|
|
|
| Pay vs Performance Disclosure |
|
|
|
|
|
|
| Adjustment to Compensation, Amount |
634,310
|
887,709
|
715,309
|
(746,053)
|
848,817
|
|
| Non-PEO NEO | Prior Year End Fair Value of Equity Awards Granted in Any Prior Year that Fail to Meet Applicable Vesting Conditions During Covered Year |
|
|
|
|
|
|
| Pay vs Performance Disclosure |
|
|
|
|
|
|
| Adjustment to Compensation, Amount |
$ 0
|
$ 0
|
$ 0
|
$ (1,521,305)
|
$ 0
|
|