Exhibit 96.1
July 9, 2026
Technical Report Summary
(under Item 1300 of Regulation S-K under the US Securities Act)
Technical Report Summary for the Chilwa Critical Minerals Project - Malawi
Report prepared by:
| ● | Belenos Holdings (Pty) Ltd |
CHILWA MINERALS - TECHNICAL REPORT SUMMARY
| Contents | |||
| 1.0 | Executive Summary | 1 | |
| 1.1 | Introduction | 1 | |
| 1.2 | Property Description | 1 | |
| 1.3 | Accessibility, Climate, Local Resources, Infrastructure and Physiography | 1 | |
| 1.4 | History | 2 | |
| 1.5 | Geological Setting, Mineralization, and Deposit | 2 | |
| 1.6 | Exploration | 3 | |
| 1.7 | Sample Preparation, Analyses, and Security | 4 | |
| 1.8 | Data Verification | 4 | |
| 1.9 | Mineral Processing and Metallurgical Testing | 4 | |
| 1.10 | Mineral Resource Estimate | 5 | |
| 1.11 | Conclusion and recommendations | 7 | |
| 2.0 | INTRODUCTION | 8 | |
| 2.1 | Introduction | 8 | |
| 2.2 | Terms of Reference | 8 | |
| 2.3 | Qualified Persons | 10 | |
| 2.4 | Qualified Person Laboratory Visit and Site Visit | 10 | |
| 2.5 | Information Sources and References | 11 | |
| 2.6 | Report Date | 11 | |
| 3.0 | Property Description | 11 | |
| 3.1 | Location | 11 | |
| 3.2 | Mineral Tenement and Land Tenure Status | 12 | |
| 3.2.1 | TERMS AND CONDITIONS | 12 | |
| 3.3 | Environmental Factors and Assumptions | 14 | |
| 4.0 | Accessibility, Climate, Local Resources, Infrastructure and Physiography | 14 | |
| 4.1 | Accessibility | 14 | |
| 4.2 | Climate | 15 | |
| 4.3 | Local Resources | 15 | |
| 4.4 | Infrastructure | 15 | |
| 4.5 | Physiography | 15 | |
| 5.0 | History | 17 | |
| 6.0 | Geological Setting and Mineralization | 17 | |
| 6.1 | Malawi Geology | 17 | |
| 6.2 | Regional Geology | 18 | |
| 7.0 | deposit types | 20 | |
| 8.0 | exploration | 21 | |
| 8.1 | Historic Exploration | 21 | |
| 8.2 | Current Exploration | 22 | |
| 9.0 | Drilling | 22 | |
i
CHILWA MINERALS - TECHNICAL REPORT SUMMARY
| 10.0 | SAMPLE PREPARATION, ANALYSES, AND SECURITY | 24 | |
| 10.1 | Sample Preparation | 24 | |
| 10.2 | Analyses | 25 | |
| 10.3 | Quality Assurance and Quality Control (QAQC) | 25 | |
| 11.0 | Data verification | 27 | |
| 12.0 | Mineral Processing and Metallurgical Testing | 29 | |
| 12.1 | Mining Method | 29 | |
| 12.2 | Processing | 29 | |
| 12.3 | Commodity Pricing | 32 | |
| 13.0 | Mineral Resource Estimate | 33 | |
| 13.1 | Modelling | 33 | |
| 13.2 | Statistical Analysis | 33 | |
| 13.3 | Variography | 33 | |
| 13.4 | Mineral assemblages | 33 | |
| 13.4.1 | Mineralogy | 33 | |
| 13.4.2 | Ilmenite, Rutile and Zircon | 34 | |
| 13.4.3 | Zircon | 34 | |
| 13.4.4 | Monazite | 34 | |
| 13.4.5 | Almandine Garnet | 35 | |
| 13.4.6 | XRF and QEMSCAN Analysis | 35 | |
| 13.5 | Block Modelling and Grade Estimation | 35 | |
| 13.6 | Grade Estimation Plan and Parameters | 35 | |
| 13.7 | Relative Density (RD) | 40 | |
| 13.8 | Block Model Validations | 41 | |
| 13.8.1 | Visual Validation | 41 | |
| 13.8.2 | Average Grade Conformance | 45 | |
| 13.8.3 | Swath Plot Check | 46 | |
| 13.9 | Cut-off Grade | 46 | |
| 14.0 | resource classification | 47 | |
| 15.0 | resource statement | 49 | |
| 16.0 | Conclusion and recommendations | 51 | |
| 17.0 | REFERENCES | 51 | |
ii
CHILWA MINERALS - TECHNICAL REPORT SUMMARY
| TABLES | ||
| Table 1. | List of abbreviations and technical terms. | 8 |
| Table 2. | Description of the mineral rights owned by Chilwa Minerals Africa. | 12 |
| Table 3. | Summary of the deposit characteristics of Lake Chilwa. | 21 |
| Table 4. | Drill holes and intersections used in the June 2025 Mineral Resource estimations (Chilwa Minerals, 2025a). | 23 |
| Table 5. | Drill holes and intersections used in the November 2025 Mineral Resource estimation update for Mposa (Chilwa Minerals, 2025b). | 23 |
| Table 6. | Resampled statistics (AMC,2023). | 25 |
| Table 7. | Statistics of the Mposa deposit of the aircore samples versus the sonic samples (Chilwa Minerals, 2025a). | 26 |
| Table 8: | Summary results of the field duplicates analyses (Chilwa Minerals, 2025a). | 26 |
| Table 9: | Summary results of the HG and LG Standard analyses (Chilwa Minerals, 2025b). | 26 |
| Table 10: | Summary results of the Blank analyses (Chilwa Minerals, 2025a). | 26 |
| Table 11: | Summary results of the laboratory repeats (Chilwa Minerals, 2025a). | 27 |
| Table 12. | Process design criteria for Primary concentrator Plant (TZMI. 2015). | 31 |
| Table 13. | Process design criteria – Mineral Separation Plant (TZMI. 2015). | 31 |
| Table 14. | Forecast prices of Chilwa Minerals’ planned products (Real 2025 US$), (TZMI. 2026). | 32 |
| Table 15: | Ilmenite and associated minerals (Wallmach et al, 2008). | 34 |
| Table 16: | Estimation parameters for the June 2025 estimations for the project area(Chilwa Minerals, 2025a). | 37 |
| Table 17: | Estimation parameters for the November 2025 update of Mposa Main NE and SW domains (Chilwa Minerals, 2025b). | 37 |
| Table 18. | The average dry bulk density values per deposit (AMC, 2023). | 40 |
| Table 19: | Comparisons of global input data with block model grades for all the deposits in the June 2025 estimates (Chilwa Minerals, 2025a). | 45 |
| Table 20: | Comparisons of global input data with block model grades for the domains of Mposa in the November 2025 update (Chilwa Minerals, 2025b). | 46 |
| Table 21. | The in situ Mineral Resource estimations reported from the block model with a 1.0% THM cut-off, are shown below for the project area, as at 21 November 2025. | 50 |
| FIGURES | ||
| Figure 1. | Regional map showing the Project areas and the Chilwa Tenement (EL0670/22R1, EL0671/22R1 and EL0835/25). | 11 |
| Figure 2. | Regional image of southern Malawi showing the location of Lake Chilwa (Google Earth). | 16 |
| Figure 3. | Simplified geological map of Malawi (Schlüter, 2008). | 18 |
| Figure 4. | Regional geology of the Lake Chilwa/Zomba area (after Garson, 1960 and Bloomfield, 1965 op. cit. AMC, 2023). | 19 |
| Figure 5. | Simplified stratigraphy with a south-west/north-east section through Mpyupyu (AMC, 2023). | 20 |
| Figure 6. | Plan of drill holes on Mposa. | 28 |
| Figure 7. | Section 2 on the Mposa deposit. | 29 |
| Figure 8. | High level process flowsheet (Ilmenite and zircon concentrate products), (TZMI. 2015). | 30 |
| Figure 9: | Theoretical TiO2-contents in FeTi-oxide phases (wt %) (Wallmach et al, 2008). | 34 |
| Figure 10. | The Mposa block model (November 2025 update) with the estimated THM % in plan view (Chilwa Minerals, 2025b). | 38 |
| Figure 11. | The Halala block model with the estimated THM % in plan view (Chilwa Minerals, 2025a). | 39 |
| Figure 12. | The Nkomato block model with the estimated THM % in plan view (Chilwa Minerals, 2025a). | 39 |
| Figure 13. | The Beacon (left) and Namanja West (right) block models with the estimated THM % in plan view (Chilwa Minerals, 2025a). | 40 |
| Figure 14. | Section 3 in the southern part of the Mposa deposit (6X vertical exaggeration) (November 2025 update) (Chilwa Minerals, 2025b). | 41 |
| Figure 15. | Section 1 in the Dune area of the Mpyupyu deposit (6X vertical exaggeration) (Chilwa Minerals, 2025a). | 41 |
| Figure 16. | Section 2 in the Flat area of the Mpyupyu deposit (6X vertical exaggeration) (Chilwa Minerals, 2025a). | 42 |
| Figure 17. | Section 1 in the Bimbi deposit (6X vertical exaggeration) (Chilwa Minerals, 2025a). | 42 |
| Figure 18. | Section 2 in the Bimbi NE deposit (6X vertical exaggeration) (Chilwa Minerals, 2025a). | 43 |
| Figure 19. | Section 1 in the Nkotamo deposit (6X vertical exaggeration) (Chilwa Minerals, 2025a). | 43 |
| Figure 20. | Section 1 in the Halala deposit (6X vertical exaggeration) (Chilwa Minerals, 2025a). | 44 |
| Figure 21. | Section 1 in the Beacon deposit (6X vertical exaggeration) (Chilwa Minerals, 2025a). | 44 |
| Figure 22. | Section 1 in the Namanja West deposit (6X vertical exaggeration) (Chilwa Minerals, 2025a). | 45 |
| Figure 23. | Key operating cost breakdown summary (TZMI, 2015) | 46 |
| Figure 24. | The Mineral Resource classification on Mposa Main and North (Chilwa Minerals, 2025b). | 47 |
| Figure 25. | The Mineral Resource classification on Bimbi (Chilwa Minerals, 2025a). | 48 |
| Figure 26. | The Mineral Resource classification on Mpyupyu (Chilwa Minerals, 2025a). | 49 |
iii
CHILWA MINERALS - TECHNICAL REPORT SUMMARY
| 1.0 | Executive Summary |
| 1.1 | Introduction |
Chilwa Minerals Ltd (CML) requested Belenos Holdings (Pty) Ltd (Belenos) to prepare a technical report for the Chilwa Critical Minerals Project in compliance with Item 1300 of Regulation S-K promulgated by the United States Securities and Exchange Commission (SEC). The Project is in southern Malawi along the shores of Lake Chilwa.
| 1.2 | Property Description |
Lake Chilwa is in Southern Malawi on the eastern border with Mozambique. The Project is located along the shores of Lake Chilwa, covers an area of 881.0136 km2 and historic exploration work on the northern and western shores indicated the presence of well mineralized fluvial and aeolian deposits with potential for economic exploitation of ilmenite and zircon.
| 1.3 | Accessibility, Climate, Local Resources, Infrastructure and Physiography |
Malawi is a landlocked country in Southeastern Africa. It is bordered by Zambia to the west, Tanzania to the north and northeast, and Mozambique to the east, south, and southwest The Nacala (harbour town on the Mozambique coast) Corridor railway line runs along the northern shore of Lake Chilwa. Access to the northern and western shore of Lake Chilwa is relatively easy in the dry season but can be tricky during the wet months. The area is densely populated and villages practicing subsistence farming widespread in the area.
Malawi’s climate is subtropical, characterized by two seasons: summer and winter. The climate is significantly modified by the varying country’s topography. Summer is wet but hot and starts from October to April.
Malawi is among the world’s least developed countries. Around 85% of the population lives in rural areas. The economy is based on agriculture, and more than one-third of GDP and 90% of export revenues come from this.
Malawi has 31 airports, seven with paved runways (two international airports) and 24 with unpaved runways. The country has 797 kilometres (495 mi) of railways, all narrow-gauge, and, as of 2003, 24,866 kilometres (15,451 mi) of roadways.
Lake Chilwa is in Southern Malawi, on the eastern border with Mozambique. The town of Zomba is located 20 km to the west of the EL, and the commercial capital of Blantyre, is located 80 km to the southwest.
1
CHILWA MINERALS - TECHNICAL REPORT SUMMARY
| 1.4 | History |
Historic work includes academic studies, prospecting by Brinkmann (Brinkmann 1991, 1992, and 1993), by companies (Millennium Mining Limited Investments, Tate Minerals, and Mota Engil Investments (Malawi) Limited) which included auger drilling, aircore drilling, pitting and bulk sample testing.
| 1.5 | Geological Setting, Mineralization, and Deposit |
Malawi geology is dominated by the East African Rift with Lake Chilwa the most southern major lake associated with the rift valley.
The regional geology and structural evolution of the Lake Chilwa region in southern Malawi have played a pivotal role in the formation of the lake and in the deposition and preservation of heavy mineral sands (HMS) within the Exploration Licence area. The basement geology is dominated by Pre-Cambrian Age Basement Complex rocks, including paragneisses and orthogneisses, which are widely exposed across the region. These rocks mainly comprise charnockitic gneiss, hornblende-biotite gneiss, and biotite gneiss, with granulite and quartzite occurring particularly to the north of the lake. Many of these basement units contain ilmenite and zircon as accessory minerals. Some of the biotite gneisses are described as garnetiferous, suggesting localized enrichment of heavy minerals. In addition, Pre-Karoo igneous rocks such as the Domasi biotite-granite and associated microgranites, which crop out along the Domasi River, also host abundant titanomagnetite and ilmenite. These rocks contribute significantly to the regional heavy mineral assemblage and the source potential for HMS deposits. A substantial component of the local geology is made up of Jurassic and Cretaceous age alkaline intrusives of the Chilwa Alkaline Province. These include major geological features such as the Zomba Massive (Malosa Mountain) to the west, the Mulanje Massive to the south, and the Mongolowe/Chaone/Chikala Hills to the northwest. Dominant lithologies include nepheline syenite, quartz syenite, and nepheline, with additional intrusives such as the Mpuyupyu Hill syenite and the carbonatite complexes of Chilwa Island and Tundulu. These rocks are consistently reported to contain zircon and ilmenite as major accessory minerals, reinforcing their role as significant contributors to the regional HMS potential.
Sediments that were deposited as HMS deposits at Lake Chilwa were eroded and transported from the regional rock masses by various rivers. Studies have shown that because of a predominant SE wind, a north flowing longshore current developed along the western shore of Lake Chilwa during the 631 masl period. The current transported sediments supplied by the rivers northwards along the shore. Fine material was winnowed out through wave action and moved northwards while the larger particles and HMS lagged behind and was concentrated on the beach through the removal of the fine and lighter particles. The SE wind probably also removed fine particles from the beached during lower lake levels and further concentrated the larger and heavier grains. Sediments deposited on the beaches were constantly reworked and matured through a combination of the pulses of sediment supply by the rivers, the longshore current, wave and wind action and fluctuating lake levels.
2
CHILWA MINERALS - TECHNICAL REPORT SUMMARY
| 1.6 | Exploration |
Claus Brinkmann (Brinkmann, 1991; Brinkman, 1992; Brinkmann, 1993) worked on the Mpyupyu deposit between 1991 and 1993 as part of an initiative by the German Federal Government to aid mineral evelopment in Malawi.
Millennium Mining Limited Investments (MML) explored the north shore HMS deposits with an auger drill programme of 31 holes and 104 air core (AC) holes were completed by Wallis Drilling on a 100 m × 100 m grid.
Tate Minerals (Tate) applied for the Lake Chilwa EL in 2012. Tate retrieved and digitized all available data and reports and had independent consultants review the results. In 2014, Tate entered a JV with Mota-Engil Investments (Malawi) Limited (MEIML) to explore the HMS deposits identified by previous exploration activities.
MEIML undertook several early-stage assessment programmes, including metallurgical and process testwork studies, in 2014 and 2015 to verify the presence and HM content of the HMS deposits identified by earlier exploration work. This included auger drilling on existing and new targets as well preliminary process optimization and metallurgical studies.
In 2021, Luso Global Mining B.V. (LGM), a fully owned subsidiary of MEIML, expressed a renewed interest in the Project and requested AMC to update the previous MREs using the re-assayed samples. AMC produced an updated mineralized inventories for Bimbi (including Northeast Bimbi), Mpyupyu, Mposa, and Halala, reporting the inventories at 1.0%, 3.0%, and 5.0% THM cut-offs.
In 2022, Chilwa Minerals Ltd (CML) concluded the current agreement with LGM. CML requested AMC to constrain the MREs prepared for LGM in 2021 to demonstrate the requirement of reasonable prospects for eventual economic extraction (RPEEE). AMC reported the MREs for the Bimbi (including Northeast Bimbi), Mpyupyu, Mposa, and Halala, at 1.0%, 1.5%, and 3.0% THM cut-offs.
CML’s drilling program at the Mposa Main (Mposa) target area commenced on 9 October 2023. The drilling program was designed to test the extent of potential mineralisation at depth as well as its lateral continuity by twinning selected existing holes as well as drilling further holes in the areas adjacent to Mposa. (Chilwa Minerals, 2024). Drilling was spaced 25m across-strike and 100m along strike for most of the targets in the Chilwa project area. Except for Mposa and Mpyupyu Dune, the sonic drilling was on a nominal 50m across strike and 50m along strike grid.
3
CHILWA MINERALS - TECHNICAL REPORT SUMMARY
| 1.7 | Sample Preparation, Analyses, and Security |
The estimation relies on data from two distinct exploration phases, being the recent work undertaken by Chilwa Minerals, utilising sonic rigs to extract core for Heavy Liquid Separation (‘HLS’) assay (sonic), and the 2014-2016 work undertaken by previous owners MEIML, utilising Aircore rigs as the principal means of capturing samples for HLS assay (Aircore).
Sample representivity was ensured through field duplicates generated from the final split of randomly selected samples—one in every 20. Additionally, blanks, site-constructed reference samples, and umpire samples (5% replication) were inserted per batch to monitor data quality. The final 1 kg sample, produced using proper riffle splitting techniques, is considered representative, comprising roughly 10% of the original parent sample.
Sample preparation involved initial drying, then crushing to 80% passing 3mm, followed by splitting of a sub-sample on a rotary splitter. The sub-sample (approximately 500g) was sent by air freight to LDE where it was analysed for slimes %, Oversize % and THM %. The Qualified person is of the opinion that the sampling techniques were to industry accepted standards.
The samples were sent for Heavy Liquid Separation assay at ALS Laboratory in Perth, Austaralia and, from 2025, to LightDeepEarth Laboratory (LDE), in Pretoria, South Africa (Chilwa Minerals, 2025a).
Within the QAQC process, the statistics of the Mposa deposit were compared between the aircore samples and the sonic samples and they correlate very well with only higher variances within the sonic samples.
The QAQC analyses on the Mposa sonic drill hole samples, were done on the field duplicates, the standards, the blanks and the laboratory repeats and the summary results were mostly acceptable.
It is the Qualified persons’ opinion that the independent QAQC program has demonstrated that acceptable levels of accuracy and precision have been established.
| 1.8 | Data Verification |
Verification includes various methods to check and validate the data supplied. It is the Qualified persons’ opinion that the data used for the mineral resource estimates were adequete for the purposes used for the reporting in this technical report summary.
| 1.9 | Mineral Processing and Metallurgical Testing |
Several metallurgical studies were completed by SGS, Mintek, AML and LDE on representative samples from the HMS deposits of the Lake Chilwa project. Detailed reports are available for the studies. The studies show that the mineralized sand from the HMS deposits can be processed into high grade ilmenite and zircon products with high recovery rates.
4
CHILWA MINERALS - TECHNICAL REPORT SUMMARY
| 1.10 | Mineral Resource Estimate |
Sectional interpretation was done on all the Chilwa Northern Deposits (Nkotamo, Halala, Beacon and Namanja West) on the project. On each section line the basal clay contact were modelled. These sectional interpretations were then wireframed to form DTM surfaces. The modelled basal clay contact of Mposa used, was modelled by the project geologist in Leapfrog. The basal clay contacts of Bimbi, Bimbi NE and Mpyupyu used, was modelled by AMC.
Univariate statistical analysis was carried out on the variables, THM %, Slimes % and Oversize % of the 1 m composited drill hole data on all the deposits in the June 2025 estimations, using Excel and Surpac.
Reflecting an overall change in strike from NNE to NE over the 8km of strike of the Mposa deposits, three mineralised domains were created in the November 2025 update, Main NE, Main SW (together referred to as Mposa Main) and Mposa North, that were formed along the northwestern edge of Lake Chilwa. Univariate statistical analysis was carried out on the variables, THM %, Slimes % and Oversize %, HfO₂ %, TiO₂ %, and ZrO₂ % of the 1m composited drill hole data using Excel and Surpac for each domain.
The inverse distance method for grade interpolation was used for the project area, with the estimation parameters derived from calculated variograms. Variograms were modelled for the following variables: THM %, Slime % and Oversize % from the composite data for each deposit area: Mposa NE and SW, Mpyupyu, Bimbi, Bimbi NE and Chilwa North. Variograms were calculated in Surpac with the composite data.
Mineralogy has been undertaken on THM concentrates using chemical data obtained using XRF combined with QEMSCAN analysis.
Block models with block sizes of 100m X 100m X 1m and minimum sub blocking of 25m X 25m X 0.5m were created within Surpac for all the HMS deposits in the June 2025 estimations. A new block model with block sizes of 50m X 50m X 0.5m without sub blocking was created within Surpac for the Mposa deposits in the November 2025 update).
Inverse distance with the power of 3 was used for in situ grade interpolation for the THM %, Slime % and Oversize % with the 1m composites within their respective ore domains in the June 2025 estimations for all the deposits.
Inverse distance with the power of 2.5 was used for in situ grade interpolation for the THM %, Slime %, Oversize %, HfO₂ %, TiO₂ %, and ZrO₂ % with the 1m composites within their respective ore domains in the November 2025 estimation update for the Mposa deposits.
Block model validations were undertaken by visual checking on the block model sections comparing with drilling data, by comparisons of global average input composite data with the block model estimated grades of all the deposits and with swath plot checks on the block model estimates.
The resource classification was primarily based on the drill hole density. The estimation passes were used in the classification process.
5
CHILWA MINERALS - TECHNICAL REPORT SUMMARY
The in situ Mineral Resource estimations reported from the block models with a 1.0% THM cut-off, are shown below for the project area, as at 21 November 2025.
| Mineral in ROM*** | ||||||||||||||||
| Deposit | Category | Volume | Tonnes | THM* | HMC** | Ilmenite | Zircon | Leucoxene | Rutile | Garnet | Monazite | THM cut-off | Recovery | Slimes | Oversize | RD |
| (million m³) | (million t) | (%) | (million t) | (%) | (%) | (%) | (%) | (%) | (%) | (%) | (%) | (%) | (%) | |||
| Mposa (Main) | Measured | 12.5 | 21.3 | 4.4 | 0.95 | 3.00 | 0.39 | 0.40 | 0.04 | 0.12 | 0.02 | 1.00 | 85-90 | 19.9 | 15.9 | 1.70 |
| Mposa (Main) | Indicated | 1.8 | 3.1 | 2.8 | 0.09 | 1.85 | 0.26 | 0.25 | 0.02 | 0.08 | 0.01 | 1.00 | 85-90 | 31.2 | 14.0 | 1.70 |
| Mposa (North) | Indicated | 0.7 | 1.2 | 2.3 | 0.03 | 0.88 | 0.18 | 0.14 | 0.03 | 0.22 | 0.00 | 1.00 | 85-90 | 13.7 | 39.9 | 1.70 |
| Bimbi | Indicated | 3.0 | 5.1 | 4.55 | 0.23 | 3.85 | 0.25 | N/A | 0.11 | n/e**** | n/e**** | 1.00 | 85-90 | 22.4 | 18.0 | 1.70 |
| Inferred | 1.4 | 2.4 | 3.79 | 0.09 | 3.21 | 0.21 | N/A | 0.09 | n/e**** | n/e**** | 1.00 | 85-90 | 24.4 | 16.5 | 1.70 | |
| Bimbi NE | Inferred | 7.4 | 12.5 | 2.57 | 0.32 | 2.18 | 0.14 | N/A | 0.06 | n/e**** | n/e**** | 1.00 | 85-90 | 20.2 | 5.0 | 1.70 |
| Mpyupyu (Dune) | Indicated | 5.4 | 9.2 | 6.21 | 0.57 | 5.37 | 0.22 | N/A | 0.15 | n/e**** | n/e**** | 1.00 | 85-90 | 29.0 | 9.4 | 1.70 |
| Mpyupyu (Flat) | Indicated | 9.4 | 15.9 | 4.52 | 0.72 | 3.86 | 0.19 | N/A | 0.12 | n/e**** | n/e**** | 1.00 | 85-90 | 24.0 | 5.8 | 1.70 |
| Inferred | 15.3 | 26.0 | 3.61 | 0.94 | 3.08 | 0.16 | N/A | 0.10 | n/e**** | n/e**** | 1.00 | 85-90 | 19.0 | 5.8 | 1.70 | |
| Nkotamo | Indicated | 1.6 | 2.4 | 3.70 | 0.09 | 2.23 | 0.23 | N/A | 0.10 | n/e**** | n/e**** | 1.00 | 85-90 | 19.1 | 24.8 | 1.50 |
| Halala | Indicated | 5.8 | 8.7 | 3.79 | 0.33 | 2.28 | 0.19 | N/A | 0.09 | n/e**** | n/e**** | 1.00 | 85-90 | 9.0 | 3.0 | 1.50 |
| Beacon | Indicated | 0.7 | 1.0 | 2.63 | 0.03 | 1.82 | 0.16 | N/A | 0.08 | n/e**** | n/e**** | 1.00 | 85-90 | 10.5 | 10.9 | 1.50 |
| Namanja West | Indicated | 3.0 | 4.5 | 3.66 | 0.16 | 2.63 | 0.25 | N/A | 0.10 | n/e**** | n/e**** | 1.00 | 85-90 | 7.0 | 4.4 | 1.50 |
| Total | Measured | 12.5 | 21.3 | 4.44 | 0.95 | 3.00 | 0.39 | N/A | 0.04 | n/e**** | n/e**** | 1.00 | 85-90 | 19.9 | 15.9 | 1.70 |
| Total | Indicated | 31.4 | 51.1 | 4.40 | 2.2 | 3.45 | 0.21 | N/A | 0.11 | n/e**** | n/e**** | 1.00 | 85-90 | 20.4 | 9.4 | 1.63 |
| Total | Measured + Indicated | 43.9 | 72.4 | 4.4 | 3.2 | 3.31 | 0.26 | N/A | 0.09 | n/e**** | n/e**** | 1.00 | 85-90 | 20.27 | 11.29 | 1.65 |
| Total | Inferred | 24.1 | 40.9 | 3.30 | 1.35 | 2.81 | 0.16 | N/A | 0.09 | n/e**** | n/e**** | 1.00 | 85-90 | 19.7 | 6.2 | 1.70 |
| * | Total Heavy Minerals; |
| ** | Heavy Mineral Concentrate; |
| *** | Run of Mine |
| **** | Not separately estimated. The mineral is included within THM but has not been estimated separately for this deposit due to insufficient mineralogical support.” The Mposa (Main) and Mposa (North) rows keep their existing leucoxene, garnet and monazite values — those are the deposits with QEMSCAN support. |
6
CHILWA MINERALS - TECHNICAL REPORT SUMMARY
| 1.11 | Conclusion and recommendations |
Under the assumptions presented in this Report, the Chilwa Mineral Sands Project represents a substantial Mineral Resource that warrants technical evaluation and studies.
It is the qualified person’s opinion that additional work is justified on the Project to upgrade the mineral resource confidence categories that are relevant to the technical and economic factors likely to influence the prospect of economic extraction.
Belenos recommended the following:
| ● | Infill drilling in the Inferred and Indicated areas to increase the confidence level to higher categories. |
| ● | XRF and QEMSCAN analysis in areas that that are not well covered to increase the confidence level to higher categories. |
| ● | Use the QEMSCAN data to estimate the garnet values in the block models. |
| ● | Updating the resource models periodic per deposit area as soon as all the new drilling assay and QEMSCAN data are available per deposit area. |
| ● | Define the optimum modelling THM % together with a maximum Slimes % from the metallurgical testings for the economic mining process and re-model the base clay footwall on all deposits accordingly. |
7
CHILWA MINERALS - TECHNICAL REPORT SUMMARY
| 2.0 | INTRODUCTION |
| 2.1 | Introduction |
Chilwa Minerals Ltd (CML) requested Belenos Holdings (Pty) Ltd (Belenos) to prepare a technical report for the Chilwa Critical Minerals Project in compliance with Item 1300 of Regulation S-K promulgated by the United States Securities and Exchange Commission (SEC). The Project is in southern Malawi along the shores of Lake Chilwa.
| 2.2 | Terms of Reference |
Mineral resources are reported for the Chilwa deposits using the definitions in Item 1300 of Regulation S-K.
All units of measurement used in this report use the International System of Units (SI) metric system unless otherwise stated. Mineral resources are reported in metric tonnes.
The Report uses US English.
A list of abbreviations and technical terms used in this Report is provided in Table 1.
Table 1. List of abbreviations and technical terms.
| Abbreviation/Technical Term | Description |
| % | percentage |
| °C | Degree Celsius |
| $m | US dollars (millions) |
| µm | micron |
| AC | air core drilling utilizes high-pressure air and dual-walled rods to penetrate the ground and return a crushed sample to the surface through the inner tube and then through a sampling system. The ground is cut through with the use of a steel blade type bit. |
| Almandine | Almandine (Fe₃Al₂Si₃O₁₂) member of the Garnet group |
| ALS | ALS Laboratory |
| AML | Allied Mineral Laboratories |
| AMC | AMC Consultants (UK) Limited |
| amphibole | amphibole is a group of inosilicate minerals, forming prism or needle like crystals |
| amphibolite | a metamorphic rock that contains amphibole, especially hornblende and actinolite, as well as plagioclase feldspar, but with little or no quartz |
| mamsl | meters above mean sea level |
| ASX | Australian Securities Exchange |
| A$ | Australian dollar |
| Auger drilling | a drilling method that uses a large helical-shaped screw to extract material from the ground |
| bulk sampling | bulk sampling is process of extracting a large, representative, sample of material from a mineralized target of sufficiently representative for metallurgical test work purposes |
| carbonatite | an igneous rock that contains > 50% carbonate minerals |
| charnockitic | orthopyroxene-bearing quartz-feldspar rock formed at high-temperature and pressure, commonly found in granulite facies metamorphic regions |
| Chilwa Alkaline province | The Chilwa Alkaline province is a diverse suite of intrusive and extrusive alkaline igneous rocks |
8
CHILWA MINERALS - TECHNICAL REPORT SUMMARY
| Abbreviation/Technical Term | Description |
| CML | Chilwa Minerals Ltd |
| colluvial | a general name for loose, unconsolidated sediments that have been deposited at the base of hillslopes by either rain wash, sheetwash, slow continuous downslope creep, or a variable combination of these processes. |
| DTM | digital terrain model |
| E | East |
| EL | Exploration License |
| Fault | a planar fracture or discontinuity in a volume of rock across which there has been significant displacement. |
| garnet | a group of silicate minerals that are used as gemstones and abrasives. |
| GDP | gross domestic product |
| gneiss | gneiss is a high-grade metamorphic rock that displays distinct foliation, representing alternating layers composed of different minerals. |
| granulite | granulites are a class of high-grade metamorphic rocks that have experienced high-temperature and moderate-pressure metamorphism. |
| HLS | heavy liquid separation |
| HM | heavy minerals (ilmenite, zircon, leucoxene, monazite and rutile) |
| HMC | Heavy mineral concentrate |
| HMS | heavy mineral sands (paleo dune, beach, or river deposits enriched in high density minerals such as ilmenite, zircon, leucoxene, monazite, and rutile). |
| hornblende | hornblende is a complex inosilicate series of minerals. It is not a recognized mineral, but the name is used as a general or field term, to refer to a dark amphibole. |
| ID | Inner diameter |
| ID2 | inverse distance to the power of 2 |
| ID2.5 | inverse distance to the power of 2.5 |
| ID3 | inverse distance to the power of 3 |
| IGR | Independent Geologist s Report |
| ilmenite | Fe TiO3 |
| JORC Code | Australasian Code for Reporting of Exploration Results, Mineral Resources and Ore Reserves (2012) |
| JV | Joint venture |
| Karoo Super Group | The Karoo Supergroup is the most widespread stratigraphic unit in Africa south of the Kalahari Desert. The supergroup consists of a sequence of sedimentary units deposited approximately 201 million years ago. |
| kg | kilogram |
| kg/t | kilograms/ton |
| km2 | square kilometers |
| lacustrine | Lacustrine deposits are sedimentary rock formations which formed in the bottom of ancient lakes. A common characteristic of lacustrine deposits is that a river or stream channel has carried sediment into the basin. |
| leucoxene | FeTiO3.TiO2 |
| LGM | Luso Global Mining B.V. |
| LDE | LightDeepEarth Laboratory |
| m | meters |
| Malawi | Republic of Malawi |
| MACRA | Malawi Communications Regulatory Authority |
| masl | metres above sea level |
| MEIML | Mota-Engil Investments (Malawi) Limited |
| MML | Millennium Mining Limited |
| monazite | (Ce,La,Th,Nd,Y)PO4 |
| MRE | Mineral Resource estimate |
| N | North |
9
CHILWA MINERALS - TECHNICAL REPORT SUMMARY
| Abbreviation/Technical Term | Description |
| NE | Northeast |
| NEB | Northeast Bimbi |
| NW | Northwest |
| nepheline | silica-undersaturated aluminosilicate, Na3KAl4Si4O16, that occurs in intrusive and volcanic rocks with low silica content. |
| OD | Outer diameter |
| orogeny | Orogeny is the primary mechanism by which mountains are formed on continent. |
| Project | Chilwa Critical Minerals Project |
| Ramsar | Ramsar identifies wetlands of international importance, especially those providing waterfowl habitat. |
| QAQC | quality assurance and quality control |
| Quaternary | the youngest period in Earth’s history circa the past 2.6 million years. |
| ROM | Run of mine |
| RPEEE | reasonable prospects for eventual economic extraction as referred to in the JORC Code. |
| rutile | TiO2 |
| S | South |
| SE | Southeast |
| SEC | The U.S. Securities and Exchange Commission |
| SG | specific gravity |
| SGS | SGS Laboratory |
| SW | Southwest |
| syenite | a coarse-grained intrusive igneous rock with a general composition similar to that of granite, but deficient in quartz. |
| SI | Systeme lnternationale |
| sonic core drilling | sonic core drilling is an advanced form of drilling which employs the use of high-frequency, resonant energy to advance a core barrel or casing into subsurface formations. |
| t/m3 | tons per cubic meter |
| THM | total heavy minerals |
| Tate | Tate Minerals |
| Tertiary | The first period of the Cenozoic era, 66 million to 2.6 million years ago. |
| US$ | United States dollar |
| UTM | Universal Transverse Mercator |
| W | West |
| WGS84 | World Geodetic System |
| zircon | ZrSiO4 |
| 2.3 | Qualified Persons |
This report was prepared by Belenos Holdings (Pty) Ltd (Belenos), with Bernhard Siebrits as the Lead Consulting Author - Mineral Resources and Bertus Cilliers as Lead Consulting Author – Exploration.
| 2.4 | Qualified Person Laboratory Visit and Site Visit |
A visit to LDE laboratory was undertaken by Bertus Cilliers November 2023.
A site visit to the exploration activities on the shores of Lake Chilwa, as well as the sample preparation facility at Zalewa was conducted in August 2025 by Bertus Cilliers.
10
CHILWA MINERALS - TECHNICAL REPORT SUMMARY
| 2.5 | Information Sources and References |
The reports and documents listed in Section 17.0 of the Report were used to support the preparation of the Report.
| 2.6 | Report Date |
The Report is current as of December 31, 2025.
| 3.0 | Property Description |
| 3.1 | Location |
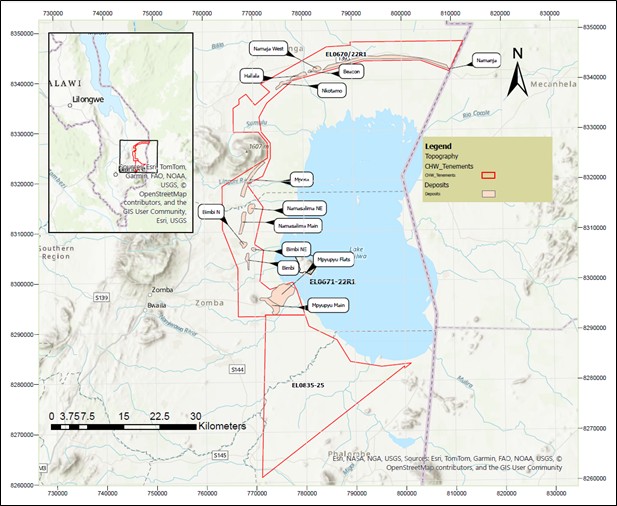
Lake Chilwa is in Southern Malawi on the eastern border with Mozambique (Figure 1). The Project is located along the shores of Lake Chilwa, covers an area of 881.0136 km2 and historic exploration work on the northern and western shores indicated the presence of well mineralized fluvial and aeolian deposits with potential for economic exploitation of ilmenite and zircon.
Figure 1. Regional map showing the Project areas and the Chilwa Tenement (EL0670/22R1, EL0671/22R1 and EL0835/25).
11
CHILWA MINERALS - TECHNICAL REPORT SUMMARY
| 3.2 | Mineral Tenement and Land Tenure Status |
Work is undertaken under exploration license EL0670/22/R1, 100% owned by Chilwa Minerals Africa. Chilwa Minerals Limited also controls (100%) of license EL0835/25 directly to the south of EL0670/22/R1 through its 100% subsidiary Phalombe Minerals (Figure 1).
EL0670/22/R1 and EL0835/25 have been issued with effect from 18 July 2025for 3- and 5-year exploration terms (Table 2).
Table 2. Description of the mineral rights owned by Chilwa Minerals Africa.
| License Number | Area (km²) | License Type | From/ Term | Mineral rights | Ownership Interest |
| EL0670/22/R1 | 418.29 | Exploration | 18th July 2025 for three-year term | Heavy Mineral Sands and Rare Earth Elements | 100% (Chilwa Minerals Africa) |
| EL0671/22/R1 | 12.84 | Exploration | 18th July 2025 for three-year term | Heavy Mineral Sands and Rare Earth Elements | 100% (Chilwa Minerals Africa) |
| EL0835/25 | 449.89 | Exploration | 18th July 2025 for five-year term | Heavy Mineral Sands and Rare Earth Elements | 100% (Phalombe Minerals)* |
*100% owned by Chilwa Minerals Africa
Licenses EL0670/22R1 and EL0671/22R1 carry with them the right to apply for a mining license in accordance with Section 146 of the Mines and Minerals Act (Act No. 25 of 2023).
License EL0835/25 includes an option to extend the term in accordance with Section 146 of the Mines and Minerals Act (Act No.25 of 2023).
The Company is not aware of any encumbrances or restrictions applied to any license. All statutory reporting to the relevant authorities is up to date at the time of writing.
| 3.2.1 | TERMS AND CONDITIONS |
All three licences have the same terms and conditions attached and are stated as follows;
The licensee shall:
| 1. | Programme of Exploration Activities |
| 1.1 | Carry out with expedition and diligence the following programme of exploration activities as set out in the licensee’s application: (a) Literature review (b) Detailed geological mapping with rock sampling for analysis (c) Collect samples and analyse them at certified laboratories (d) Detailed mineral exploration using different techniques, i.e., Geophysical surveying and geochemical sampling (e) Resource estimation or calculation (f) Evaluation of results (g) Presentation of exploration results (h) Carry out Pre-Feasibility as well as definitive feasibility studies (i) Conduct operations in accordance with the approved Environmental and Social Management Plan (ESMP) |
| 1.2 | Commence operations within one hundred and eighty (180) calendar days from the grant of the licence. |
| 1.3 | Carry out community consultations within the tenement area through the District Council and other relevant stakeholders prior to the commencement of any exploration activities. |
| 1.4 | The minimum expenditure required to be spent annually in connection with an approved exploration work programme shall be as prescribed in the Mines and Minerals (Fees) Regulation 2021. |
| 2. | Employment and Training of Malawi Citizens by licensee |
| 2.1 | Endeavor to employ and train citizens of Malawi for the exploration activities. |
| 2.2 | Be permitted to employ non-citizens in a post only if the skills required in that post are not obtainable by recruitment of a citizen of Malawi. |
12
CHILWA MINERALS - TECHNICAL REPORT SUMMARY
| 3. | Purchase of local goods |
| 3.1 | Use and purchase goods and services supplied and produced or manufactured in Malawi wherever they can be obtained at competitive terms, and are in substantive respects of quality comparable with those available from outside Malawi. |
| 3.2 | Make maximum use of local subcontractors, where subcontractors must undergo a national and competitive tendering process. A representative from the Mining and Minerals Regulatory Authority should be present during the tender opening to ensure transparency and compliance. |
| 3.3 | When it is necessary to import vehicles, machinery, plant or equipment and any such items, effect the purchase of the items through traders operating in Malawi, at competitive prices. |
| 4. | Further covenants by licensee |
| 4.1 | Comply with all conditions imposed under Part VII – Exploration Licence (Section 114 to Section 130) of the Mines and Minerals Act (Act No. 25 of 2023). |
| 4.2 | Keep all measures necessary for the conservation and protection of the environment. |
| 4.3 | Fill in, seal or fence off deep pits, trenches, shafts and excavations. |
| 4.4 | Re-instate, level, re-grass and replant any part of the licenced area which may have been damaged by the licensee’s prospecting operations. |
| 4.5 | Keep the Government of Malawi indemnified against all actions, claims and demands, which may be brought or made against it by reason of anything done by the licensee, licensee’s servants, agents or contractors. |
| 4.6 | Submit annual exploration expenditure report, mid-year progress report, annual end-of-year technical report, and any other report that may be required under the Act. |
| 4.7 | Not pollute the environment, in particular, streams or rivers. |
| 4.8 | Comply with all obligations imposed under or by virtue of any Act of Parliament for the time being in force. |
| 5. | Cancellation |
Nothing in Section 79 of the Mines and Minerals Act (Act No. 25 of 2023) shall affect any power exercisable by the Director General for Mines and Minerals Regulatory Authority under any other law to cancel the licence. Notwithstanding the preceding, Nothing in Section 79 of the Mines and Minerals Act (Act No. 25 of 2023) shall affect any power exercisable by the Director General for Mines and Minerals Regulatory Authority under any other law to cancel the licence.
13
CHILWA MINERALS - TECHNICAL REPORT SUMMARY
| 3.3 | Environmental Factors and Assumptions |
| ● | Lake Chilwa is recognized as a Ramsar-designated wetland. The Lake Chilwa EPL however covers grasslands along the lake shore used for grazing and farming, and none of the EL or deposits falls within the actual wetland. |
| ● | The mineralized sand deposits are populated by rural farming communities and small villages as they are elevated above the surrounding low-lying areas. |
| ● | Mining activities at Chilwa will involve dry mining methods using loaders and trucks with the expectation at this point in the project that all tailings will be backfilled into the mined-out areas. The low slimes levels of slime of the deposits should allow for the slimes directly backfilled with the gravity and oversize tailings. |
| ● | An extension of the exploration licenses has been granted by the Commissioner of Mines and Minerals from 18/07/2025 for three years for EL0670/22R1, EL0671/22R1 and five years for EL0835/25. |
| ● | At this time, no issues were identified that would materially impact the ability to eventually extract mineral resources at the project. |
| ● | There is a risk that commodity prices may not be consistent with assumptions made as it is dependend on the world economic growth. |
| 4.0 | Accessibility, Climate, Local Resources, Infrastructure and Physiography |
| 4.1 | Accessibility |
Malawi is a landlocked country in Southeastern Africa. It is bordered by Zambia to the west, Tanzania to the north and northeast, and Mozambique to the east, south, and southwest The Nacala (harbour town on the Mozambique coast) Corridor railway line runs along the northern shore of Lake Chilwa. Access to the northern and western shore of Lake Chilwa is relatively easy in the dry season but can be tricky during the wet months. The area is densely populated and villages practicing subsistence farming widespread in the area.
14
CHILWA MINERALS - TECHNICAL REPORT SUMMARY
| 4.2 | Climate |
Malawi’s climate is subtropical, characterized by two seasons: summer and winter. The climate is significantly modified by the varying country’s highlands and lowlands topography. Summer is wet but hot and starts from October to April. During the rainfall season, temperature can reach 37°C with relative humidity ranging between 50 to 80 percent. Annual rainfall ranges between 700 mm to 2,500 mm with the highest amounts being experienced over the highlands while the lowlands experience the lowest amounts. About 95 % of the annual precipitation falls during the wet summer season particularly from November to April with the highest rainfall experienced in January and February (Ngongondo et al. 2011 in: State of Malawi Climate, 2025).
| 4.3 | Local Resources |
Malawi is among the world’s least developed countries. Around 85% of the population lives in rural areas. The economy is based on agriculture, and more than one-third of GDP and 90% of export revenues come from this. In the past, the economy has been dependent on substantial economic aid from the World Bank, the International Monetary Fund (IMF), and other countries. The Malawian government faces challenges in developing a market economy, improving environmental protection, dealing with the rapidly growing HIV/AIDS problem, improving the education system, and satisfying its foreign donors to become financially independent
(Wikipedia, 2025).
| 4.4 | Infrastructure |
Malawi has 31 airports, seven with paved runways (two international airports) and 24 with unpaved runways. The country has 797 kilometres (495 mi) of railways, all narrow-gauge, 24,866 kilometres (15,451 mi) of roadways in various conditions, 6,956 kilometres (4,322 mi) paved and 8,495 kilometres (5,279 mi) unpaved. Malawi also has 700 kilometres (430 mi) of waterways on Lake Malawi and along the Shire River (Wikipedia, 2025).
Malawi’s water resources are plentiful, although some rural areas are inadequately supplied. Treated water for the major cities of Blantyre and Lilongwe is supplied by the Walker’s Ferry Scheme and the Kamuzu Dam, respectively. Most of the rivers are seasonal, but a few large ones, particularly the Shire River along its middle course, have considerable potential for irrigation and electricity generation. Power demands are met by hydroelectric schemes, including those at Nkula Falls, Kapichira, and Tedzani Falls, and by diesel plants. Major consumers of electric power include the industrial areas of the south near Blantyre, where electricity consumption has steadily multiplied, and the industrial area of Lilongwe; the vast sugar estates at Nchalo and Dwangwa also consume much electricity. By contrast, only a fraction of Malawians themselves have electrical access, and almost all domestic energy needs are met by firewood (Britannica, 2026).
| 4.5 | Physiography |
Malawi is a landlocked country in southeastern Africa, bordered by Zambia to the northwest, Tanzania to the northeast, and Mozambique to the south, southwest, and general east. It lies between latitudes 9° and 18°S, and longitudes 32° and 36°E. The Great Rift Valley runs through the country from north to south, and to the east of the valley lies Lake Malawi (also called Lake Nyasa), making up over three-quarters of Malawi’s eastern boundary. Lake Malawi is sometimes called the Calendar Lake as it is about 365 miles (587 km) long and 52 miles (84 km) wide. The Shire River flows from the south end of the lake and joins the Zambezi River 400 km (250 mi) farther south in Mozambique. The surface of Lake Malawi is at 457 m (1,500 ft) above sea level, with a maximum depth of 701 m (2,300 ft), which means the lake bottom is over 213 m (700 ft) below sea level at some points (Wikipedia, 2025).
15
CHILWA MINERALS - TECHNICAL REPORT SUMMARY
In the mountainous sections of Malawi surrounding the Rift Valley, plateaus rise generally 914 to 1,219 m (3,000 to 4,000 ft) above sea level, although some rise as high as 2,438 m (8,000 ft) in the north. To the south of Lake Malawi lies the Shire Highlands, gently rolling land at approximately 914 m (3,000 ft) above sea level. In this area, the Zomba and Mulanje mountain peaks rise to respective heights of 2,134 and 3,048 m (7,000 and 10,000 ft) (Wikipedia, 2025).
Lake Chilwa is in Southern Malawi, on the eastern border with Mozambique. The town of Zomba is located 20 km to the west of the EL, and the commercial capital of Blantyre, is located 80 km to the south-west (Figure 2).
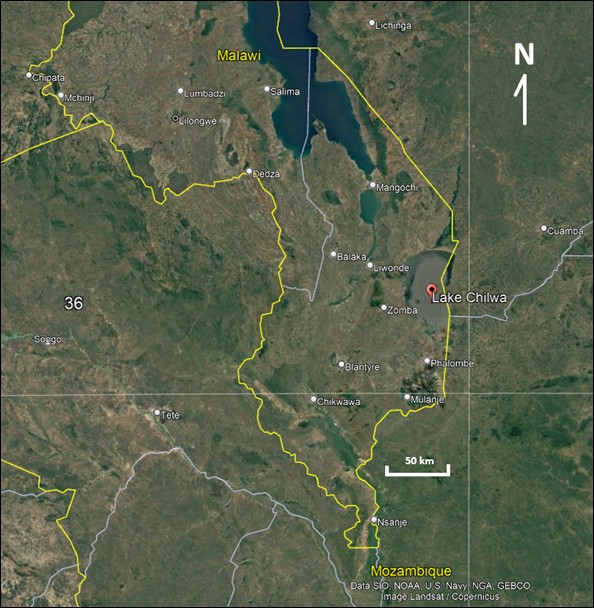
Figure 2. Regional image of southern Malawi showing the location of Lake Chilwa (Google Earth).
16
CHILWA MINERALS - TECHNICAL REPORT SUMMARY
Lake Chilwa measures 40 km from north-to-south and 30 km from east-to-west and is a shallow, saline body of water surrounded by dense swamps and marshes. A narrow belt of arable grassland surrounds the lake, which contains the HMS deposits that are being targeted by CML.
The lake is a Ramsar designated Wetland, however the EL is contained in a zone of arable grass along the western and northern shore of Lake Malawi.
Animal life indigenous to Malawi includes mammals such as elephants, hippos, antelopes, buffaloes, big cats, monkeys, rhinos, and bats; a great variety of birds, including birds of prey, parrots, and falcons; waterfowl and large waders; and owls and songbirds. Lake Malawi has been described as having one of the richest lake fish faunas in the world, being the home for some 200 mammals, 650 birds, 30+ mollusks, and 5,500+ plant species.
| 5.0 | History |
Historic work includes academic studies, prospecting by Brinkmann (Brinkmann 1991, 1992, and 1993), by companies (Millennium Mining Limited Investments, Tate Minerals, and Mota Engil Investments (Malawi) Limited) which included auger drilling, aircore drilling, pitting and bulk sample testing (AMC, 2023).
In 2016, AMC prepared a MRE for internal use by then owners Mota Engil Investments (Malawi) Limited (MEIML). During this process, it was found that assaying had not been undertaken incorrectly by the assay laboratory and the resource was classified at an Inferred level of confidence. The affected samples were re-assayed and in May 2021 AMC updated the MRE following the receipt of the re-assayed sample data.
| 6.0 | Geological Setting and Mineralization |
| 6.1 | Malawi Geology |
Malawi geology (Figure 3) is dominated by the East African Rift with Lake Chilwa the most southern major lake associated with the rift valley. The geology of Malawi is broadly grouped into four main lithological units: the Basement Complex, the Karoo Super group, Tertiary to Quaternary sedimentary deposits and the Chilwa Alkaline province (AMC, 2023).
17
CHILWA MINERALS - TECHNICAL REPORT SUMMARY
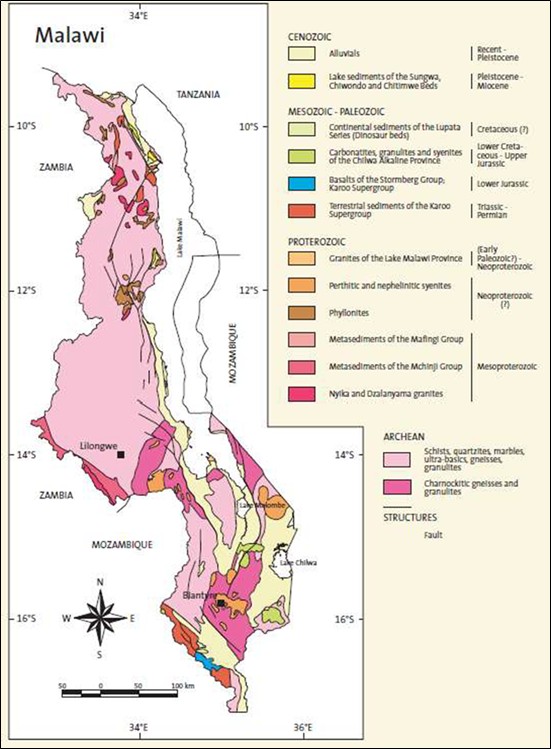
Figure 3. Simplified geological map of Malawi (Schlüter, 2008).
| 6.2 | Regional Geology |
The regional geology (Figure 4) and structural evolution of the Lake Chilwa region in southern Malawi have played a pivotal role in the formation of the lake and in the deposition and preservation of heavy mineral sands (HMS) within the Exploration Licence area. The basement geology is dominated by Pre-Cambrian Age Basement Complex rocks, including paragneisses and orthogneisses, which are widely exposed across the region. These rocks mainly comprise charnockitic gneiss, hornblende-biotite gneiss, and biotite gneiss, with granulite and quartzite occurring particularly to the north of the lake. Many of these basement units contain ilmenite and zircon as accessory minerals. Some of the biotite gneisses are described as garnetiferous, suggesting localized enrichment of heavy minerals. In addition, Pre-Karoo igneous rocks such as the Domasi biotite-granite and associated microgranites, which crop out along the Domasi River, also host abundant titanomagnetite and ilmenite. These rocks contribute significantly to the regional heavy mineral assemblage and the source potential for HMS deposits. A substantial component of the local geology is made up of Jurassic and Cretaceous age alkaline intrusives of the Chilwa Alkaline Province. These include major geological features such as the Zomba Massive (Malosa Mountain) to the west, the Mulanje Massive to the south, and the Mongolowe/Chaone/Chikala Hills to the northwest. Dominant lithologies include nepheline syenite, quartz syenite, and nepheline, with additional intrusives such as the Mpuyupyu Hill syenite and the carbonatite complexes of Chilwa Island and Tundulu. These rocks are consistently reported to contain zircon and ilmenite as major accessory minerals, reinforcing their role as significant contributors to the regional HMS potential.
18
CHILWA MINERALS - TECHNICAL REPORT SUMMARY
Following the emplacement of the Chilwa Alkaline Province rocks, tectonic activity along the Rift Valley Fault led to widespread erosion and peneplanation of the valley floor during the Late Cretaceous to early Tertiary periods. The modern landscape around Lake Chilwa consists of residual and colluvial deposits, along with extensive lacustrine and beach sediments composed of silts, clays, and sands. These sediments are closely tied to the lake’s tectonic and depositional evolution and serve as the primary host for current heavy mineral sand accumulations (AMC, 2023).
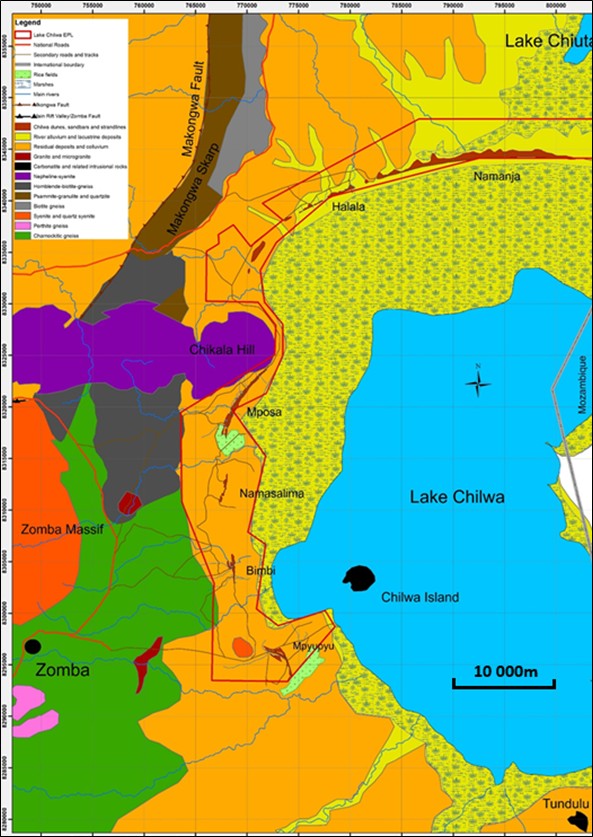
Figure 4. Regional geology of the Lake Chilwa/Zomba area (after Garson, 1960 and Bloomfield, 1965 op. cit. AMC, 2023).
19
CHILWA MINERALS - TECHNICAL REPORT SUMMARY
| 7.0 | deposit types |
All the deposits are sedimentary with sediments and HM that were eroded and transported from the regional rock masses by rivers into the Lake Chilwa. A north flowing longshore current developed from the a predominant SE wind, which transported sediments northwards. The sediments transported on the beaches were constanly reworked and matured through a combination of the longshore current, wave and wind action, as well as fluctuating lake levels (AMC, 2023).
There is a difference, both in deposit morphology and HMS heavy mineral assembly between the north (Halala and Nemanja) and the western shore deposits (Mpyupyu, Bimbi, and Mposa). This is attributed to the differences in the depositional environment as well as sediment supply to the different areas (AMC, 2023).
Several terraces and raised beach levels can be identified around Lake Chilwa. The early Holocene age 631 masl raised beach and terrace are very well developed along the western shore of Lake Chilwa. The lake craved a new terrace out of the older lacustrine silts and clays during this period as well as becoming separated from Lake Chiuta by the formation of the sand bar to the north of the lake. The 631 masl level represents a steady period in the history of Lake Chilwa and the formation of the mineralized beach sand deposits found at Mposa, Bimbi, Namasalima and Mpyupyu were initiated during this period. The water level of Lake Chilwa dropped further and formed the 623 masl raised beach and terrace, a few meters above the present-day lake level. This terrace level slopes gently down to the current lake level, a total drop of almost 10 m from the stable 631 masl level. It is on this raised beach level that the silty mineralized sand deposits of Bimbi NE and Mpyupyu East are preserved and which probably consist of material supplied and reworked from the 631 masl beach deposits along with sediment supply by the inflowing rivers (AMC, 2016).
Sediments that were deposited as HMS deposits at Lake Chilwa were eroded and transported from the regional rock masses by various rivers. Studies have shown that because of a predominant SE wind, a north flowing longshore current developed along the western shore of Lake Chilwa during the 631 masl period. The current transported sediments supplied by the rivers northwards along the shore. Fine material was winnowed out through wave action and moved northwards while the larger particles and HMS lagged behind and was concentrated on the beach through the removal of the fine and lighter particles. The SE wind probably also removed fine particles from the beached during lower lake levels and further concentrated the larger and heavier grains. Sediments deposited on the beaches were constantly reworked and matured through a combination of the pulses of sediment supply by the rivers, the longshore current, wave and wind action and fluctuating lake levels (AMC, 2023).
Figure 5 is the simplified stratigraphy with a cross-section through Mpyupyu showing the resultant geology of these processes (AMC, 2023). All the deposits are a combination of these processes and can be summarized as in Table 3.
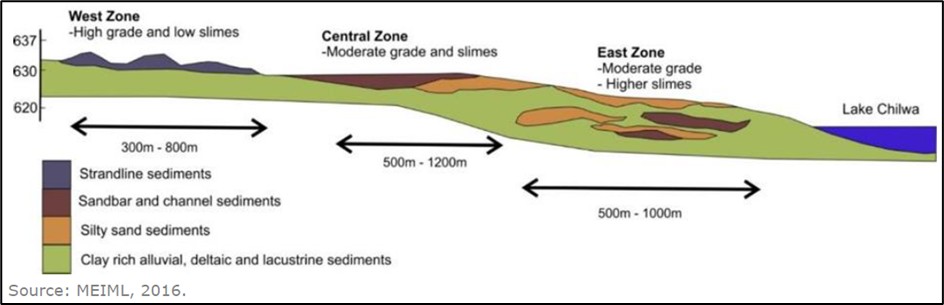
Figure 5. Simplified stratigraphy with a south-west/north-east section through Mpyupyu (AMC, 2023).
20
CHILWA MINERALS - TECHNICAL REPORT SUMMARY
Table 3. Summary of the deposit characteristics of Lake Chilwa.
| Deposits | Characteristics |
| North shore deposits (Halala, Nkotamo, Beacon and Namanja West) | Moderate grade with low slimes |
| Mposa, Bimbi and Mpyupyu Dune | High grade and low slimes |
| Mpyupyu Flat and Bimbi NE | Moderate grade and higher slimes |
| 8.0 | exploration |
| 8.1 | Historic Exploration |
Claus Brinkmann (Brinkmann, 1991; Brinkman, 1992; Brinkmann, 1993) worked on the Mpyupyu deposit between 1991 and 1993 as part of an initiative by the German Federal Government to aid mineral evelopment in Malawi. A total of 125 test pits were completed on a 500 m × 500 m grid to depths ranging from 2 m to 4.2 m, depending on the hight of the water table. HM-bearing sand was analysed for THM content and ilmenite. Brinkmann also undertook a radiometric survey of the Mpyupyu area. Eighty-eight (88) pits were used to delineate a grade and tonnage estimate of 125 Mt grading 4.3% THM at a cut-off grade of 2% THM (AMC, 2023).
Millennium Mining Limited Investments (MML) explored the north shore HMS deposits with an auger drill programme of 31 holes and 104 air core (AC) holes were completed by Wallis Drilling on a 100 m × 100 m grid. MML claimed to have defined a tonnage and grade estimate of 15.4 Mt grading 2.74% ilmenite and 0.2% zircon. No documentation to support the resource was made available to AMC. MML drilled a further 22 auger holes on the Namanja dune followed by an additional 58 auger holes on a 2 km line spacing and 100 m hole spacing. A compliant MRE was claimed by MML from the drilling programme. No supporting documentation was made available to AMC to support this estimate. MML also declared an Inferred Mineral Resource of 30 Mt comprising of 5.20% ilmenite, 0.14% rutile, 0.16% zircon, and 0.20% leucoxene for Halala. This is based on 10 auger holes to a depth of 10 m. No documentation supporting the resource estimation was made available to AMC. MML provided Ticor/Kumba with three bulk samples for testwork. The assemblages from the three samples average 9.8% THM, comprising 46% ilmenite, 6.4% magnetite, 0.7% rutile, 5.7% zircon, and 4.5% leucoxene. The remaining 37% was assumed to be garnets and amphiboles. There was no supporting documentation made available to AMC to justify these results. These MREs were for internal use only and were not publicly reported. AMC did not review the abovementioned statements or estimation methodology applied, and AMC does not assume any responsibilities for the accuracy of the figures (AMC,2023).
Tate Minerals (Tate) applied for the Lake Chilwa EL in 2012. Tate retrieved and digitized all available data and reports and had independent consultants review the results. The consensus opinion was that the quality of the previous exploration work accompanied by a lack of detail in the laboratory work and quality assurance and quality control (QAQC) data precluded its use for a compliant Mineral Resource reporting. In 2014, Tate entered a JV with MEIML to explore the HMS deposits identified by previous exploration activities (AMC,2023).
21
CHILWA MINERALS - TECHNICAL REPORT SUMMARY
Mota-Engil Investments (Malawi) Limited (MEIML) undertook several early-stage assessment programmes, including metallurgical and process testwork studies, in 2014 and 2015 to verify the presence and HM content of the HMS deposits identified by earlier exploration work. This included auger drilling on existing and new targets as well preliminary process optimization and metallurgical studies. Regional auger programmes indicated the potential for additional large, high-grade deposits on the EL. Following the completion of the studies, it was concluded that additional exploration and testwork should be undertaken. In 2015, an air core drilling (AC) and diamond core drilling (DD) programme was undertaken, with the stated aim being to obtain sufficient geological data to allow for a MRE that could be classified and reported. A total of 9,922 m (1,492 holes) of drilling was completed on the Mpyupyu, Bimbi, Mposa, and Halala deposits. MREs were completed and reported for Bimbi (including Northeast Bimbi), Mpyupyu, Mposa, and Halala. Due to a failure in the primary laboratory (SGS in Johannesburg) a significant proportion of the samples were incorrectly assayed resulting in overstated slimes and slightly understated THM values. This resulted in the MREs being classified at the Inferred level of confidence. The MREs produced were in situ resources that were not constrained by a pit shell. These MREs were for internal use only and were not publicly reported. The compromised samples were re-assayed, however, MEIML had decided to discontinue the exploration programme and the relationship with Tate (AMC,2023).
In 2021, Luso Global Mining B.V. (LGM), a fully owned subsidiary of MEIML, expressed a renewed interest in the Project and requested AMC to update the previous MREs using the re-assayed samples. AMC produced an updated mineralized inventories for Bimbi (including Northeast Bimbi), Mpyupyu, Mposa, and Halala, reporting the inventories at 1.0%, 3.0%, and 5.0% THM cut-offs (AMC,2023).
In 2022, Chilwa Minerals Ltd (CML) concluded the current agreement with LGM. CML requested AMC to constrain the MREs prepared for LGM in 2021 to demonstrate the requirement of reasonable prospects for eventual economic extraction (RPEEE). AMC reported the MREs for the Bimbi (including Northeast Bimbi), Mpyupyu, Mposa, and Halala, at 1.0%, 1.5%, and 3.0% THM cut-offs (AMC,2023).
| 8.2 | CURRENT Exploration |
CML’s drilling program at the Mposa Main (Mposa) target area commenced on 9 October 2023. The drilling program was designed to test the extent of potential mineralisation at depth as well as its lateral continuity by twinning selected existing holes as well as drilling further holes in the areas adjacent to Mposa. (Chilwa Minerals, 2024).
Sonic core drilling, using two Eijkelkamp CRS-V CompactRotoSonic rigs, was undertaken on the Mposa and Mpyupyu deposits (Chilwa Minerals, 2025a).
| 9.0 | Drilling |
The MRE in June 2025 was based on the Sonic drilling undertaken by CML at the Mposa Main area, the Mpyupyu Dune area and Aircore drilling undertaken by previous project owners Mota Engil Investments (Malawi) Ltd (Chilwa Minerals, 2025a).
Drilling was spaced 25m across-strike and 100m along strike for most of the targets in the Chilwa project area. Except for Mposa and Mpyupyu Dune, the Sonic drilling was on a nominal 50 m across strike and 50m along strike grid (Chilwa Minerals, 2025a).
22
CHILWA MINERALS - TECHNICAL REPORT SUMMARY
Drilling techniques for Aircore drilling have been previously reported as a component of the resource estimated by AMC (2023).
Drilling techniques for more recent sonic drilling, used for the Mposa and Mpyupyu deposit resource estimates are as follows (Chilwa Minerals, 2025a):
| ● | Drilling physicals are the same for both sonic rigs used. |
| ● | Drilling was undertaken using a single barrel (CB3 SW CoreBarrel 2m), which produced core of Inner Diameter (ID) = 76mm and Outer Diameter (OD) = 102mm). Where waterlogged sediment or loose sediment was encountered, an Aqualock (AL70) Sampler 2m barrel was used, which produced core of Inner Diameter (ID) = 70mm and Outer Diameter (OD) = 92mm. |
| ● | Drill rods were 1m in length. |
The drilling methods, drill holes and intervals used per deposit with the June 2025 estimation is provided in Table 4 (Chilwa Minerals, 2025a).
Table 4. Drill holes and intersections used in the June 2025 Mineral Resource estimations (Chilwa Minerals, 2025a).
| Deposit | Sonic DHs | Aircore DHs | Auger DHs | Total (m) | Avg (m) | Min (m) | Max (m) |
| Mposa | 782 | 4263 | 5.50 | 0.50 | 16.00 | ||
| Bimbi | 227 | 721 | 3.17 | 0.50 | 7.02 | ||
| Bimbi NE | 50 | 171 | 3.50 | 1.24 | 6.44 | ||
| Mpyupyu | 322 | 344 | 1892 | 3.04 | 0.50 | 8.00 | |
| Nkotamo | 48 | 21 | 435 | 3.39 | 0.50 | 16.00 | |
| Halala | 108 | 935 | 8.72 | 1.00 | 23.00 | ||
| Beacon | 25 | 1 | 155 | 5.37 | 1.00 | 13.00 | |
| Namanja West | 42 | 2 | 357 | 7.90 | 1.00 | 13.00 | |
| Total | 1104 | 844 | 24 | 8929 |
The drilling methods, drill holes and intervals used per deposit with the November estimation update for the Mposa deposits is provided in Table 5 (Chilwa Minerals, 2025b).
Table 5. Drill holes and intersections used in the November 2025 Mineral Resource estimation update for Mposa (Chilwa Minerals, 2025b).
| Deposit | Sonic DHs | Total (m) | Avg (m) | Min (m) | Max (m) |
| Mposa Main | 760 | 4720 | 6.21 | 0.60 | 17.00 |
| Mposa North | 13 | 67 | 5.15 | 0.85 | 13.00 |
| Total | 773 | 4787 |
23
CHILWA MINERALS - TECHNICAL REPORT SUMMARY
| 10.0 | SAMPLE PREPARATION, ANALYSES, AND SECURITY |
| 10.1 | Sample Preparation |
The estimation relies on data from two distinct exploration phases, being the recent work undertaken by Chilwa Minerals, utilising sonic rigs to extract core for Heavy Liquid Separation (‘HLS’) assay (sonic), and the 2014-2016 work undertaken by previous owners MEIML, utilising Aircore rigs as the principal means of capturing samples for HLS assay (Aircore) (Chilwa Minerals, 2025a).
Aircore sampling and sub-sampling techniques included:
| ● | At a core yard, entire samples were placed in drying pans and sun-dried. Due to high clay content, many of the dried samples were cemented and required manual disaggregation using a mortar and pestle setup consisting of a steel bin and an RC blast hole bit welded to a steel pipe. The disaggregated material was weighed and then riffle-split multiple times using a 50-50 riffle splitter to obtain approximately 1 kg of representative sub-sample for submission to SGS (AMC,2023). |
| ● | Sample representivity was ensured through field duplicates generated from the final split of randomly selected samples—one in every 20. Additionally, blanks, site-constructed reference samples, and umpire samples (5% replication) were inserted per batch to monitor data quality. The final 1 kg sample, produced using proper riffle splitting techniques, is considered representative, comprising roughly 10% of the original parent sample (Chilwa Minerals, 2025a). |
Sonic sampling and sub-sampling methods included:
| ● | Prior to the commencement of drilling, logging, and sampling, the geological team developed a standardized set of protocols and procedures. Sonic core drilling, using two Eijkelkamp CRS-V CompactRotoSonic rigs, was undertaken. The core was logged, as a first pass, at the rig, then relogged and sampled at the Chilwa base camp, located in Zomba. Sampling was based on geological changes observed in the core, with a standard sample length of 1.0 m. Samples were first subject to sample preparation at the Company’s facility in Zalewa, Malawi, with the aim of generating a representative split sub-sample of 500g for Heavy Liquid Separation assay at ALS Laboratory in Perth, Australia and, from 2025, to LightDeepEarth Laborarory (LDE), in Pretoria, South Africa (Chilwa Minerals, 2025a). |
| ● | Sample preparation involved initial drying, then crushing to 80% passing 3mm, followed by splitting of a sub-sample on a rotary splitter. The sub-sample (approximately 500g) was sent by air freight to LDE where it was analysed for slimes %, Oversize % and THM %. The Qualified person is of the opinion that the sampling techniques were to industry accepted standards (Chilwa Minerals, 2025a). |
24
CHILWA MINERALS - TECHNICAL REPORT SUMMARY
| ● | The core was logged and sampled at Chilwa base camp in Zalewa. Lose material was split using a scoop after having been homogenized; more competent core was split in the middle using a trowel or chisel. One half of the sample was bagged and labelled for submission and the other half stored on site in a plastic bag. |
| ● | Blanks (5%), site-produced reference material (High and Low standards (5%) as well as duplicates (5%) were added to outgoing sample batches (Chilwa Minerals, 2025a). |
| 10.2 | Analyses |
The samples were sent for Heavy Liquid Separation assay at ALS Laboratory in Perth, Australia and, from 2025, to LightDeepEarth Laboratory (LDE), in Pretoria, South Africa (Chilwa Minerals, 2025a).
Heavy liquid separation (sink-float) was the assay method for all assays used in the MRE. Samples are received and reconciled against the client list, weigh and dry mass recorded. Samples are then soaked to allow complete wetting of clay minerals and then subject to light attrition scrubbing for clay dispersion. Material is then deslimed with the sub 45 µm fraction discarded, then dried and screened on 1 mm. + 1 mm mass is recorded as well as mass of 45 to 1,000 µm fraction. Prepare sand samples are then split to achieve mass circa 300 g which is submitted to sink-float using tetrabromoethane. Sink and Float fractions are cleaned with acetone and weighed (Chilwa Minerals, 2025a).
XRF, or X-ray fluorescence, analysis was used to determine the chemical composition of heavy mineral concentrates, including chemistry relevant to titanium, zirconium and associated mineral components. QEMSCAN, or Quantitative Evaluation of Minerals by Scanning Electron Microscopy, was used to determine the mineralogical composition of heavy mineral concentrates by identifying and quantifying the mineral phases present in the concentrates. The qualified person used XRF and QEMSCAN results together to support the interpretation of the THM assemblage, the estimation of the reported “Mineral in ROM” values, and the assessment of mineralogical continuity. QEMSCAN analyses performed by SGS were used in the June 2025 estimates, and QEMSCAN analyses performed by LightDeepEarth Laboratory for Mposa composite samples, with results received on November 13, 2025, were used in the Mposa Mineral Resource estimate update.
| 10.3 | Quality Assurance and Quality Control (QAQC) |
AMC (2023) found in 2016 that the laboratory results from SGS compared with the standards and the umpire laboratory (AML), the slimes were high biased and the THM were low biased. Most of the samples were resampled as shown in Table 6 below. The QAQC was not done on the resampled data (AMC,2023).
Table 6. Resampled statistics (AMC,2023).
| Deposit | Total Aircore samples | Resampled | % Resampled |
| Mposa | 1863 | 1749 | 94 |
| Bimbi | 1240 | 70 | 6 |
| Mpyupyu | 1731 | 383 | 22 |
| Halala | 1308 | 1077 | 82 |
| Other (BEN NKA NAW) | 1768 | 686 | 39 |
| Total | 7910 | 3965 | 50 |
Sample representivity was ensured through field duplicates generated from the final split of randomly selected samples—one in every 20. Additionally, blanks, site-constructed reference samples, and umpire samples (5% replication) were inserted per batch to monitor data quality. The final 1 kg sample, produced using proper riffle splitting techniques, is considered representative, comprising roughly 10% of the original parent sample (Chilwa Minerals, 2025a).
The statistics of the Mposa deposit were compared between the aircore samples (94% resampled) and the sonic samples and they correlate very well with only higher variances within the sonic samples (Table 7) (Chilwa Minerals, 2025a).
25
CHILWA MINERALS - TECHNICAL REPORT SUMMARY
Table 7. Statistics of the Mposa deposit of the aircore samples versus the sonic samples (Chilwa Minerals, 2025a).
| Mposa Aircore - 1m Composites | Mposa Sonic - 1m Composites | ||||||
| Field | THM % | Slimes % | Oversize % | Field | THM % | Slimes % | Oversize % |
| Number | 1503 | 1506 | 1506 | Number | 4378 | 4378 | 4378 |
| Min | 0.02 | 1.04 | 0.20 | Min | 0.00 | 0.06 | 0.00 |
| Max | 32.14 | 64.85 | 69.28 | Max | 45.80 | 93.30 | 73.90 |
| Mean | 4.17 | 12.18 | 19.78 | Mean | 4.43 | 17.51 | 16.60 |
| Median | 2.85 | 8.42 | 17.69 | Median | 2.53 | 11.89 | 13.71 |
| Variance | 18.47 | 102.15 | 199.06 | Variance | 33.20 | 225.71 | 168.71 |
| Std. Dev. | 4.30 | 10.11 | 14.11 | Std. Dev. | 5.76 | 15.02 | 12.99 |
| CV | 1.03 | 0.83 | 0.71 | CV | 1.30 | 0.86 | 0.78 |
The QAQC analyses on the Mposa sonic drill hole samples, were done on the field duplicates, the standards, the blanks and the laboratory repeats and the summary results were as follow (Chilwa Minerals, 2025a):
The summary of the field duplicates is shown in Table 8. The reason for the marginal precisions were their very low values (Chilwa Minerals, 2025a).
Table 8: Summary results of the field duplicates analyses (Chilwa Minerals, 2025a).
| Type | HRD% | HARD% | No. Samples | Comment |
| THM % | 0.70 | 9.25 | 457 | No obvious bias, acceptable precision |
| Slimes % | 0.37 | 6.22 | 458 | No obvious bias, acceptable precision |
| Ovz % | 0.79 | 11.47 | 457 | No obvious bias, marginal precision |
The summary of the high grade (HG) and low grade standards for the ALS and LDE laboratories is shown in Table 9. The negative bias and the marginal precision with the LG standard were the result of banks inserted here (Chilwa Minerals, 2025b).
Table 9: Summary results of the HG and LG Standard analyses (Chilwa Minerals, 2025b).
| Lab | Type | HRD% | HARD% | No. Samples | No. of Outliers | Comment |
| ALS | HG THM % | -0.46 | 2.03 | 299 | 9 with 3 Std Dev | No obvious bias, excellent precision |
| LDE | HG THM % | -2.62 | 5.41 | 31 | 1 with 3 Std Dev | No obvious bias, acceptable precision |
| ALS | LG THM % | -14.08 | 17.02 | 286 | 87 with 3 Std Dev | Negative bias, marginal, precision |
| LDE | LG THM % | 0.93 | 2.48 | 31 | 2 with 3 Std Dev | No obvious bias, excellent precision |
The summary of the blanks is shown in Table 10. The reason for the evident negative bias and poor precision were the inserting of HG and LG standards here (Chilwa Minerals, 2025a).
Table 10: Summary results of the Blank analyses (Chilwa Minerals, 2025a).
| Type | HRD% | HARD% | No. Samples | No. of Outliers | Comment |
| THM % | -83.77 | 96.77 | 578 | 44 with 3 Std Dev | Evident negative bias, poor precision |
The summary of the laboratory repeats is shown in Table 11. All were with no obvious bias and excellent precision (Chilwa Minerals, 2025a).
26
CHILWA MINERALS - TECHNICAL REPORT SUMMARY
Table 11: Summary results of the laboratory repeats (Chilwa Minerals, 2025a).
| Type | HRD% | HARD% | No. Samples | Comment |
| THM % | 1.36 | -0.68 | 935 | No obvious bias, excellent precision |
As has previously been reported, a subset of samples from the historic Aircore program (2015) were found to have been compromised by insufficient turnaround in sieves used at SGS laboratories. Compromised samples were identified and resampled. The MRE reported is based on the resampled data.
A visit to LDE laboratory was undertaken by Mr Bertus Cilliers November 2023. It is the Qualified persons’ opinion that the independent QAQC program has demonstrated that acceptable levels of accuracy and precision have been established.
| 11.0 | Data verification |
Verification includes the following (Chilwa Minerals, 2025a);
| ● | Ensuring that all drill holes have appropriate XYZ coordinates. |
| ● | Comparing the maximum depth of the hole against the final depth indicated in the collar file. |
| ● | Comparing the final depth in the survey file against final depth in the collar file. |
| ● | Comparing the final depths of all geology, assay, core recovery against the final depth in the collar file. |
| ● | Checking for duplicate drill holes. |
| ● | Validate tables against logging conventions defined per table in project definition e.g. check geology logs for gaps and overlaps or assay logs for just overlaps (gaps are allowed). |
| ● | Checking that each depth interval has a main lithology. |
| ● | Checking that all fields that were set up as mandatory fields contain entries. |
| ● | Most of these validations protocols are generic come standard with database packages. |
As a further check on the drill hole data supplied, it was imported into the Surpac modelling software. The data was validated for duplicates, gaps, overlaps, impossible intervals in down-hole sequence for assay, collar coordinates, geology data and survey data. The drill holes were also visually checked in plan (Figure 6, Figure 11, Figure 12, Figure 13, Figure 25, and Figure 26) and in the sections (Figure 7) in Surpac (Chilwa Minerals, 2025a).
The digital terrain model (DTM) created over the project areas from Lidar surveys, confined the boundary of the drill holes used and the block model. All the drill holes constrained in the DTM covered areas were draped onto its surfaces to determine the elevations (Z) of the coordinates. For the Chilwa North Deposits (Nkotamo, Halala, Beacon and Namanja West) the surveyed collars were used (Chilwa Minerals, 2025a).
27
CHILWA MINERALS - TECHNICAL REPORT SUMMARY
Sampling techniques and data were reviewed by the previous Qualified person Mr Mark Burnett during a site visit completed in January 2025. The Qualified person’s review did not reveal any fatal flaws. The sampling and data collection techniques are considered to be industry standard.
A site visit to the exploration activities on the shores of Lake Chilwa, as well as the sample preparation facility at Zalewa was conducted in August 2025 by Bertus Cilliers. During the site visit the primary mineralization targets on both the western and northern shore of Lake Chilwa were visited.
| ● | During this site visit, all aspects of the exploration program were directly observed by the Qualified Person |
| ● | Observations of the drilling highlighted the excellent sample recoveries achieved by the sonic drilling method |
| ● | Logging of the sonic drilling was observed in the field and no issues were observed with the implementation of the standard protocol |
| ● | Sampling preparation and sub-sampling was observed in detail. No major flaws were identified. |
It is the Qualified persons’ opinion that the data used for the mineral resource estimates were adequate for the purposes used for the reporting in this technical report summary.
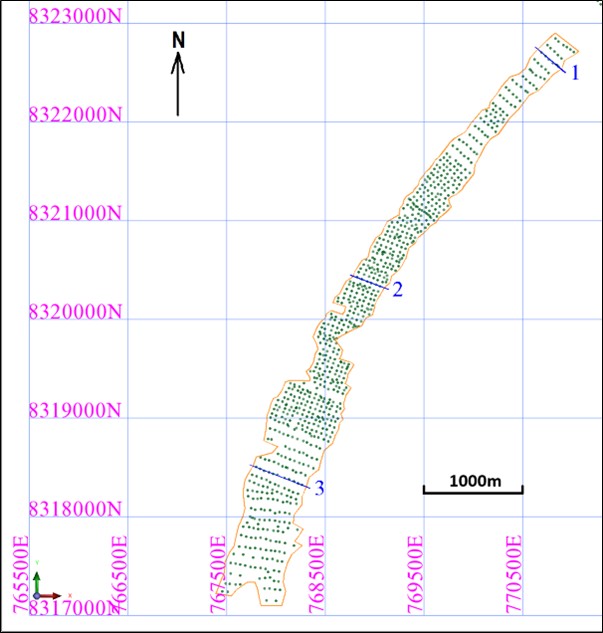
Figure 6. Plan of drill holes on Mposa.
28
CHILWA MINERALS - TECHNICAL REPORT SUMMARY
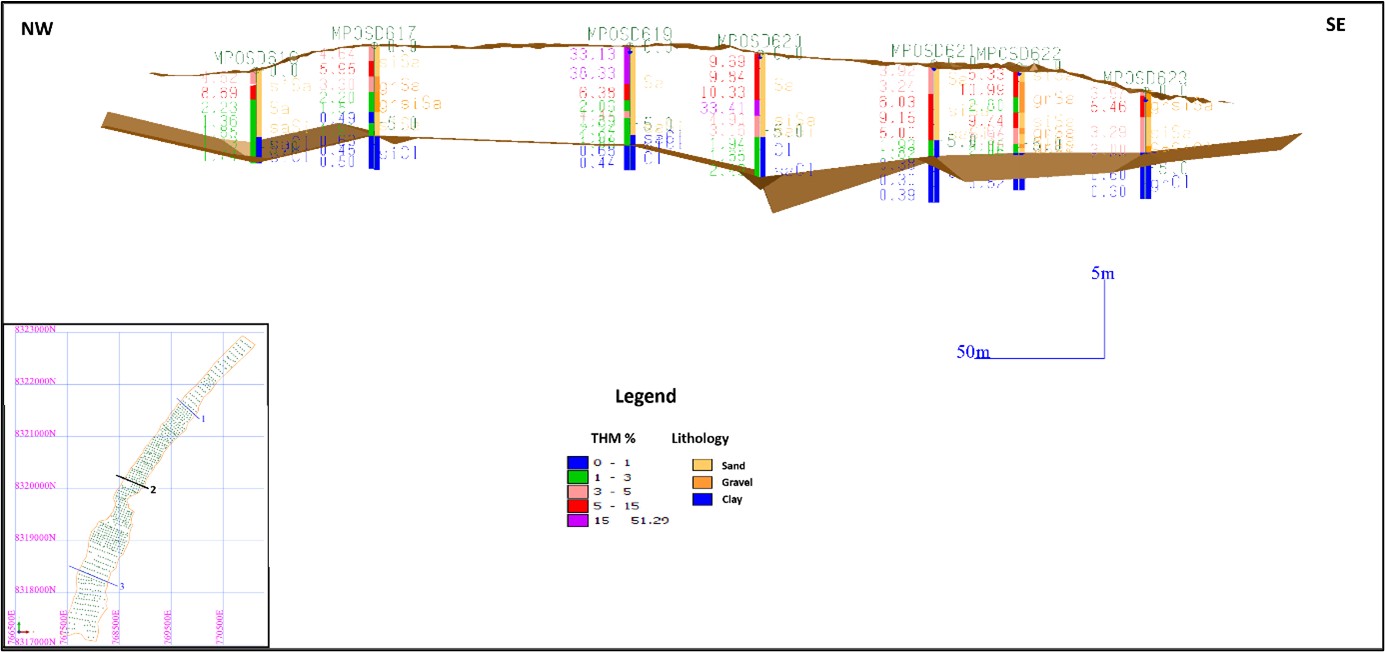
Figure 7. Section 2 on the Mposa deposit.
| 12.0 | Mineral Processing and Metallurgical Testing |
Several metallurgical studies were completed by SGS, Mintek, AML and LDE on representative samples from the HMS deposits of the Lake Chilwa project. Detailed reports are available for the studies. The studies show that the mineralized sand from the HMS deposits can be processed into high grade ilmenite and zircon products with high recovery rates (Chilwa Minerals, 2025a).
| 12.1 | Mining method |
The deposit characteristics, being predominantly unconsolidated sand in an area where the water table can be managed, are suited to dry mining with heavy earth moving equipment. Consequently, a dry mining method with a font end loader is preferred for the project concept as this allows for more flexibility than many other mining techniques and is better suited to mining of high slimes deposits (TZMI. 2015).
| 12.2 | Processing |
For the concept study, TZMI reviewed various metallurgical reports detailing test work programs aimed at evaluating samples from the Halala, Mpyupyu and Mposa deposits. The processing and mineral separation concepts have been based on TZMI’s interpretation of the test work results combined with recognized industry benchmarks and standards (TZMI. 2015).
Three test work programmes were completed at different laboratories, including (TZMI. 2015):
| ● | SGS, South Africa: SGS is an analytical laboratory providing services to the mining industry. Two bulk composites were prepared from drill samples for evaluation. |
| ● | Mintek, South Africa: Mintek is the Mineral Research Council of South Africa and provides test work and assessment services from their premises in Johannesburg, South Africa. Two bulk composites were prepared for initial flowsheet evaluation and sample characterization. |
| ● | Allied Mineral Laboratories (AML), Western Australia: AML is a specialist mineral processing laboratory with specific experience and expertise in the processing of samples from mineral sands deposits. Two samples of approximately 20 kg each were provided for the purpose of assessing product characteristics. |
| ● | The following conclusions were drawn based on the metallurgical test work results (TZMI. 2015): |
| ● | The samples were highly variable in particle sizing and therefore separation response; |
| ● | Gravity separation of the sand fractions using conventional equipment showed high separation efficiency; |
29
CHILWA MINERALS - TECHNICAL REPORT SUMMARY
| ● | Ilmenite product could be produced from all the concentrates with a TiO2 content ranging between 50 and 53%. The TiO2 balance indicated that more than 90% of the TiO2 in the gravity concentrate could be recovered to this product stream; |
| ● | Processing of the non-magnetic stream indicated that a product with a high ZrO2 grade could be isolated; |
| ● | Optical microscopy on samples generated by AML, indicated that some of the zircon in the tailings did have coatings and the impact of this on potential product recovery will have to be assessed. |
A high-level flow diagram of the proposed process flowsheet for producing ilmenite and zircon concentrate as per the baseline project concept is shown in the following schematic (Figure 8) (TZMI. 2015).
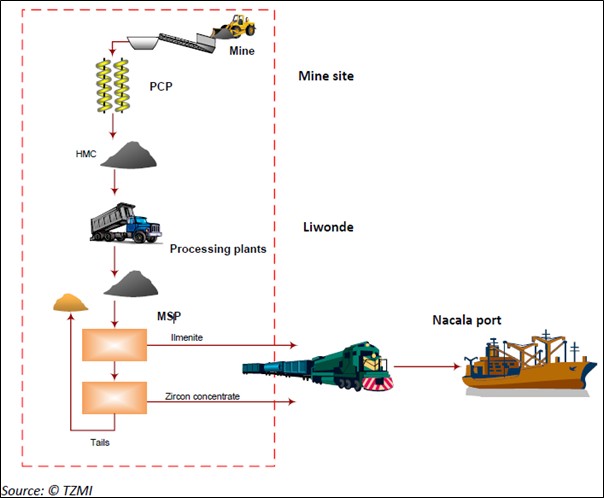
Figure 8. High level process flowsheet (Ilmenite and zircon concentrate products), (TZMI. 2015).
The proposed operation will include a number of key stages (TZMI. 2015):
| ● | Mined ore is slurried and pumped to the primary concentrator plant (PCP) located at the mine site; |
| ● | The Primary Concentrator Plant will consist of screening to remove coarse oversize, desliming to remove fines when necessary and gravity separation using spiral circuits to reject lighter gangue minerals; |
| ● | A heavy mineral concentrate containing >90% HM is separated from the lower density sands, slimes and tailings. |
| ● | The PCP tailings are pumped directly back into the mine void; |
30
CHILWA MINERALS - TECHNICAL REPORT SUMMARY
The HMC produced will be stockpiled adjacent to the PCP for loading onto haul trucks which will transport the concentrate to the mineral separation plant (MSP) at Liwonde;
| ● | The concentrate will be fed into the MSP where it will be dried and passed over magnetic and gravity separation stages to produce a magnetic ilmenite product and a zircon-rich non-magnetic concentrate; |
| ● | The ilmenite and zircon concentrate products will be stored in a warehouse prior to being transported to the Nacala port by rail for exporting in bulk by ship. |
The composition of the wet concentrator tailings, which make up the greatest volume of the tailings streams, is unchanged by the process and immediately returned to the back end of the mining void for stacking and re-profiling. Tailings streams produced at the MSP will be stockpiled and returned to the mine void via the haul trucks that are used to transport the HMC from the mine. The MSP tailings will be co-disposed with the wet concentrator tailings. TZMI has estimated product recovery figures for this study based on typical values experienced across the mineral sands industry and modified based on the outcome of the sighter evaluation work that has been completed. From this indicative flowsheet recoveries were modelled to provide the base for the concept study evaluation. The following table provides the mineral recovery figures which have been assumed for the proposed feed preparation circuit (TZMI. 2015).
Table 12. Process design criteria for Primary concentrator Plant (TZMI. 2015).
| Coarse Material | Fine Material | |
| HMC yield (% of feed) | 3-5% | 2-4% |
| HMC grade (% heavy mineral) | 88-90% | 88-90% |
| HM recovery to HMC | 85-90% | 85-90% |
| TiO2 recovery to HMC | >95% | >90% |
| ZrO2 recovery to HMC | >95% | >95% |
The following preliminary process design assumptions have been used for the Mineral Separation Plant assuming production of an ilmenite product, with a zircon concentrate (TZMI. 2015).
Table 13. Process design criteria – Mineral Separation Plant (TZMI. 2015).
| Primary Magnetic separation | ||
| Coarse Material | Fine Material | |
| MSP TiO2 recovery to ilmenite product | 90-95% | 90-95% |
| TiO2 grade in ilmenite product | 51-53% | 51-53% |
| Non-Magnetic circuit | ||
| Coarse Material | Fine Material | |
| MSP ZrO2 recovery to zircon concentrate | 90-95% | 90-95% |
| MSP ZrO2 recovery to zircon product | 75-80% | 70-75% |
Process testwork indicated that the losses in the mineral separation plant were minimal for the production of ilmenite and a non-magnetic concentrate. However, significant losses would be incurred when producing a final zircon product as a more complex circuit will be required to reject contaminants from the zircon (TZMI. 2015).
All products from the MSP: ilmenite and zircon concentrate, are dry and will be transferred and shipped as dry product. Final products will be loaded from the load out bins and product stockpiles onto trains which will transport the final products a distance of 670km to similar product storage sheds located at the Nacala port (TZMI. 2015).
31
CHILWA MINERALS - TECHNICAL REPORT SUMMARY
| 12.3 | Commodity Pricing |
TZMI estimates that a price for sulphate ilmenite of US$255 per tonne FOB may be applicable for the long term. For the years 2026 to 2030 the price ranges may be per tonne FOB from $177 (low in 2028) to $262 (high in 2030), (TZMI. 2026), (Table 14).
TZMI estimates that a price for zircon of US$1,504 per tonne FOB may be applicable for the long term. For the years 2026 to 2030 the price ranges may be per tonne FOB from $1,117 (low in 2028) to $1,401 (high in 2030), (TZMI. 2026), (Table 14).
TZMI estimates a long term price for rutile of $1,425 per ton FOB and for monazite $5,350 per ton FOB (TZMI. 2026), (Table 14).
Table 14. Forecast prices of Chilwa Minerals’ planned products (Real 2025 US$), (TZMI. 2026).
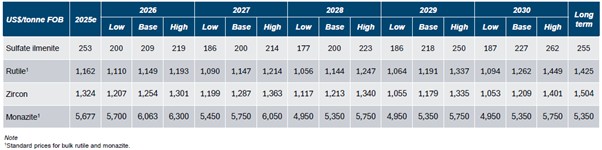
Assumptions for the planned products and forecast prices of the Chilwa Minerals (TZMI. 2026), (Table 14):
| ● | For the purpose of assessing the Lake Chilwa products the preliminary sulfate ilmenite and zircon product assays reported in the 2015 Concept Study have been used. |
| ● | Specifications for rutile and monazite products were not available at the time of writing. Market prices for standard bulk rutile and monazite have been provided. |
| ● | The sulfate ilmenite product will be targeted as a smelter feed for chloride slag production. |
| ● | The zircon produced is of standard grade quality. |
32
CHILWA MINERALS - TECHNICAL REPORT SUMMARY
| 13.0 | Mineral Resource Estimate |
| 13.1 | Modelling |
Sectional interpretation was done on all the Chilwa Northern Deposits (Nkotamo, Halala, Beacon and Namanja West) and on the Mposa Deposit. On each section line the basal clay contact together with a 1% THM cut-off were modelled. These sectional interpretations were then wireframed to form DTM surfaces. The basal clay contacts of Bimbi, Bimbi NE and Mpyupyu used, was modelled by AMC (Chilwa Minerals, 2025a).
| 13.2 | Statistical Analysis |
Univariate statistical analysis was carried out on the variables, THM %, Slimes % and Oversize % of the 1 m composited drill hole data on all the deposits in the June 2025 estimations, using Excel and Surpac (Chilwa Minerals, 2025a).
Reflecting an overall change in strike from NNE to NE over the 8km of strike of the Mposa deposits, three mineralised domains were created in the Novermber 2025 update, Main NE, Main SW (together referred to as Mposa Main) and Mposa North, that were formed along the northwestern edge of Lake Chilwa. Univariate statistical analysis was carried out on the variables, THM %, Slimes % and Oversize %, HfO₂ %, TiO₂ %, and ZrO₂ % of the 1m composited drill hole data using Excel and Surpac for each domain (Chilwa Minerals, 2025b).
| 13.3 | Variography |
The inverse distance method for grade interpolation was used for the project area, with the estimation parameters derived from calculated variograms. The estimation parameters for the June 2025 estimations were summarized in Table 16 and in Table 17 for the Mposa deposits update. Variograms were modelled for the following variables: THM %, Slime % and Oversize % from the composite data for each deposit area: Mposa NE and SW, Mpyupyu, Bimbi, Bimbi NE and Chilwa North. Variograms were calculated in Surpac with the composite data, and the following is a summary of the procedures followed (Chilwa Minerals, 2025a and 2025b):
| ● | Variograms were calculated on all the composite data for their respective deposit area. |
| ● | The variogram directions or ellipsoid bearings were chosen as the best fit variogram with their plunges and dip as horizontal. |
| 13.4 | Mineral assemblages |
| 13.4.1 | Mineralogy |
Mineralogy has been undertaken on THM concentrates using chemical data obtained using XRF combined with QEMSCAN analysis (Chilwa Minerals, 2025b).
33
CHILWA MINERALS - TECHNICAL REPORT SUMMARY
| 13.4.2 | Ilmenite, Rutile and Zircon |
Ilmenite can be expressed as (Fe,Mg,Mn)TiO3. With alteration and natural weathering of ilmenite, the removal of Fe, resulting in the formation of alteration minerals with increased Ti-contents relative to that of ilmenite. The minerals such as pseudorutile, ferropseudobrookite and anatase were generally grouped under leucoxene (Table 15 and Figure 9). Generally, the term “leucoxene” is used in the heavy minerals industry as a collective description for ilmenite alteration products with TiO2-components ranging from 65-90%. (Wallmach et al, 2008). Rutile is 100 % TiO2.
Table 15: Ilmenite and associated minerals (Wallmach et al, 2008).
| Mineral | Formula | Theoretical TiO2-content |
| Ilmenite | Fe2+TiO3 | 52.7% |
| Pseudorutile | Fe3+2Ti3O9 | 60.0% |
| Ferropseudobrookite | Fe2+Ti2O5 | 69.0% |
| Rutile | TiO2 | 100.0% |
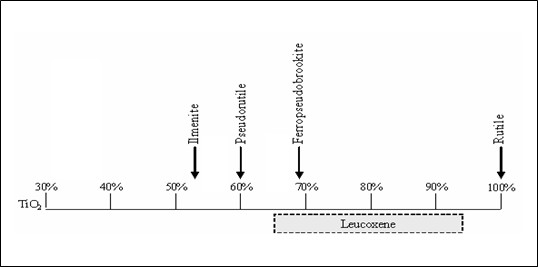
Figure 9: Theoretical TiO2-contents in FeTi-oxide phases (wt %) (Wallmach et al, 2008).
| 13.4.3 | Zircon |
Zirconium silicate (ZrSiO4), often with some hafnium and occasionally with some uranium, thorium, and yttrium. The variable formula for zircon: (Zr,Hf)SiO4 and (Zr,Hf,U,Th,Y)SiO4 (https://www.minerals.net/mineral/zircon.aspx).
| 13.4.4 | Monazite |
Monazite (Ce,La,Nd)PO₄ ) is a rare earth phosphate, most often dominated by cerium, but also with lanthanum and neodymium. May also contain yttrium, thorium, and uranium. The variable formula for monazite: (Ce,La,Nd,Y,Th,U)PO₄ (https://www.minerals.net/mineral/monazite.aspx).
34
CHILWA MINERALS - TECHNICAL REPORT SUMMARY
| 13.4.5 | Almandine Garnet |
Almandine (Fe₃Al₂Si₃O₁₂) is the most common member of the Garnet group. Almandine is an iron aluminum silicate. The iron is sometimes partially replaced with magnesium and manganese. The variable formula for almandine: (Fe,Mg,Mn)₃Al₂Si₃O₁₂ (https://www.minerals.net/mineral/almandine.aspx).
| 13.4.6 | XRF and QEMSCAN Analysis |
The XRF and QEMSCAN analysis was done to determine the mineralogy for the heavy mineral concentrates. SGS (2018) did QEMSCAN analysis that were used in the June 2025 estimates (Chilwa Minerals, 2025a).
LDE laboratory did QEMSCAN analysis for composite samples of the Mposa deposits with results received November 13, 2025, that were used in the Mposa MRE update (Chilwa Minerals, 2025b).
| 13.5 | Block Modelling and Grade Estimation |
Block models with block sizes of 100m X 100m X 1m and minimum sub blocking of 25m X 25m X 0.5m were created within Surpac for all the HMS deposits in the June 2025 estimations (Chilwa Minerals, 2025a).
A new block model with block sizes of 50m X 50m X 0.5m without sub blocking was created within Surpac for the Mposa deposits in the November 2025 update (Chilwa Minerals, 2025b).
| 13.6 | Grade Estimation Plan and Parameters |
Inverse distance with the power of 3 was used for in situ grade interpolation for the THM %, Slime % and Oversize % with the 1m composites within their respective ore domains in the June 2025 estimations for all the deposits (Chilwa Minerals, 2025a).
Inverse distance with the power of 2.5 was used for in situ grade interpolation for the THM %, Slime %, Oversize %, HfO₂ %, TiO₂ %, and ZrO₂ % with the 1m composites within their respective ore domains in the November 2025 estimation update for the Mposa deposits (Chilwa Minerals, 2025b).
All the estimation parameters used, derived from the variography, are listed in Table 16 and Table 17 for the June 2025 and November 2025 estimates respectively (Chilwa Minerals, 2025a and 2025b).
A three-pass grade interpolation plan was used. General aspects of the estimation are as follows (Chilwa Minerals, 2025a and 2025b):
| ● | A minimum of 3 samples and a maximum of 15 samples were used for all inverse distance runs; |
| ● | Pass 1: search radii set to the range in the variogram for major and 20m for vertical; |
| ● | Pass 2: search radii set to 1.5 times the range in the variogram for major and 30m for vertical; |
| ● | Pass 3: search radii set to 1000m for major and 50m for vertical to estimate all the blocks; |
35
CHILWA MINERALS - TECHNICAL REPORT SUMMARY
| ● | With the THM % estimation, the blocks were flagged = 1 after the first inverse distance run or pass1, flagged = 2 after pass 2 and flagged = 3 after pass 3; |
| ● | Block discretisation was set to 4(X) by 4 (Y) by 4 (Z); |
| ● | An octant search estimation method was used with the maximum of 3 adjacent empty octants in pass 1, a maximum of 5 adjacent empty octants in pass 2 and a maximum of 7 adjacent empty octants in pass 3; |
| ● | No sample limits per drill hole were applied. |
The following were conduted in the November 2025 update for the Mposa deposits (Chilwa Minerals, 2025b):
| ● | Pass 1: search radii set to the range in the variogram for major and 6m for vertical; |
| ● | Pass 2: search radii set to 1.5 times the range in the variogram for major and 9m for vertical; |
| ● | Pass 3: search radii set to 300m for major and 20m for vertical to estimate all the blocks; |
| ● | The parameters of the THM % were used for the estimations of HfO₂ %, TiO₂ %, and ZrO₂ % for their respective Mposa Main NE and SW domains except in the QEMSCAN zone of MPO-C09. |
| ● | The parameters of Mposa NE were used for the Mposa North deposit. |
36
CHILWA MINERALS - TECHNICAL REPORT SUMMARY
Table 16: Estimation parameters for the June 2025 estimations for the project area(Chilwa Minerals, 2025a).
| Parameters | Field | Mposa | Mpyupyu | ||||
| THM % | Slimes % | Ovz % | THM % | Slimes % | Ovz % | ||
| ellipsoid bearing | 30.00 | 10.00 | 10.00 | 70.00 | 130.00 | 170.00 | |
| ellipsoid plunge | 0.00 | 0.00 | 0.00 | 0.00 | 0.00 | 0.00 | |
| Anisotropy | ellipsoid dip | 0.00 | 0.00 | 0.00 | 0.00 | 0.00 | 0.00 |
| major:semi-major | 2.35 | 2.26 | 1.20 | 1.21 | 1.61 | 3.02 | |
| major:minor | 38.47 | 17.78 | 26.27 | 12.66 | 13.40 | 32.12 | |
| Model Type | Exponential | ||||||
| nugget | 0.11 | 0.25 | 0.27 | 0.28 | 0.38 | 0.30 | |
| sill | 1.15 | 0.75 | 0.65 | 1.17 | 0.74 | 0.77 | |
| horizontal ranges for pass 1 | 164 | 120 | 94 | 128 | 105 | 116 | |
| Variogram | vertical ranges for pass 1 | 20 | 20 | 20 | 20 | 20 | 20 |
| Model | ranges for pass 2 | 246 | 180 | 141 | 192 | 158 | 174 |
| vertical ranges for pass 2 | 30 | 30 | 30 | 30 | 30 | 30 | |
| ranges for pass 3 | 1000 | 1000 | 1000 | 1000 | 1000 | 1000 | |
| vertical ranges for pass 3 | 50 | 50 | 50 | 50 | 50 | 50 | |
| Parameters | Field | Bimbi | Chilwa North | ||||
| THM % | Slimes % | Ovz % | THM % | Slimes % | Ovz % | ||
| ellipsoid bearing | 50.00 | 50.00 | 30.00 | 30.00 | 100.00 | 20.00 | |
| ellipsoid plunge | 0.00 | 0.00 | 0.00 | 0.00 | 0.00 | 0.00 | |
| Anisotropy | ellipsoid dip | 0.00 | 0.00 | 0.00 | 0.00 | 0.00 | 0.00 |
| major:semi-major | 1.37 | 1.00 | 1.62 | 1.46 | 1.13 | 1.50 | |
| major:minor | 5.97 | 30.51 | 22.82 | 12.27 | 8.43 | 15.72 | |
| Model Type | Exponential | ||||||
| nugget | 0.22 | 0.10 | 0.24 | 0.14 | 0.06 | 0.04 | |
| sill | 0.92 | 0.87 | 0.83 | 0.86 | 0.54 | 1.03 | |
| horizontal ranges for pass 1 | 75 | 77 | 160 | 100 | 104 | 95 | |
| Variogram | vertical ranges for pass 1 | 20 | 20 | 20 | 20 | 20 | 20 |
| Model | ranges for pass 2 | 113 | 116 | 240 | 150 | 156 | 143 |
| vertical ranges for pass 2 | 30 | 30 | 30 | 30 | 30 | 30 | |
| ranges for pass 3 | 1000 | 1000 | 1000 | 1000 | 1000 | 1000 | |
| vertical ranges for pass 3 | 50 | 50 | 50 | 50 | 50 | 50 | |
Table 17: Estimation parameters for the November 2025 update of Mposa Main NE and SW domains (Chilwa Minerals, 2025b).
| Parameters | Field | Mposa NE | Mposa SW | ||||
| THM % | Slime % | Ovz % | THM % | Slime % | Ovz % | ||
| ellipsoid bearing | 40.00 | 110.00 | 130.00 | 30.00 | 0.00 | 20.00 | |
| ellipsoid plunge | 0.00 | 0.00 | 0.00 | 0.00 | 0.00 | 0.00 | |
| Anisotropy | ellipsoid dip | 0.00 | 0.00 | 0.00 | 0.00 | 0.00 | 0.00 |
| major:semi-major | 1.67 | 1.00 | 2.35 | 2.78 | 1.00 | 1.46 | |
| major:minor | 18.74 | 18.75 | 15.67 | 12.21 | 17.80 | 14.03 | |
| Model Type | Exponential | ||||||
| nugget | 0.10 | 0.44 | 0.16 | 0.15 | 0.23 | 0.07 | |
| sill | 0.96 | 0.73 | 0.85 | 1.08 | 0.71 | 0.98 | |
| horizontal ranges for pass 1 | 111 | 119 | 106 | 88 | 96 | 67 | |
| Variogram | vertical ranges for pass 1 | 6 | 6 | 7 | 7 | 5 | 5 |
| Model | ranges for pass 2 | 167 | 179 | 159 | 132 | 144 | 101 |
| vertical ranges for pass 2 | 9 | 10 | 10 | 11 | 8 | 7 | |
| ranges for pass 3 | 300 | 300 | 300 | 300 | 300 | 300 | |
| vertical ranges for pass 3 | 20 | 20 | 20 | 20 | 20 | 20 | |
37
CHILWA MINERALS - TECHNICAL REPORT SUMMARY
The estimated block models of Mposa, Nkomato, Halala, Beacon and Namanja West are shone in Figure 10 to Figure 13 with the THM % distribution from the top view (Chilwa Minerals, 2025a and 2025b).
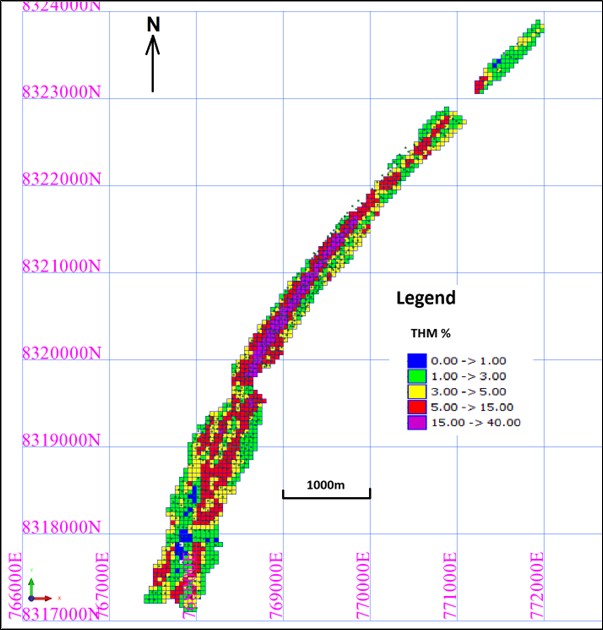
Figure 10. The Mposa block model (November 2025 update) with the estimated THM % in plan view (Chilwa Minerals, 2025b).
38
CHILWA MINERALS - TECHNICAL REPORT SUMMARY
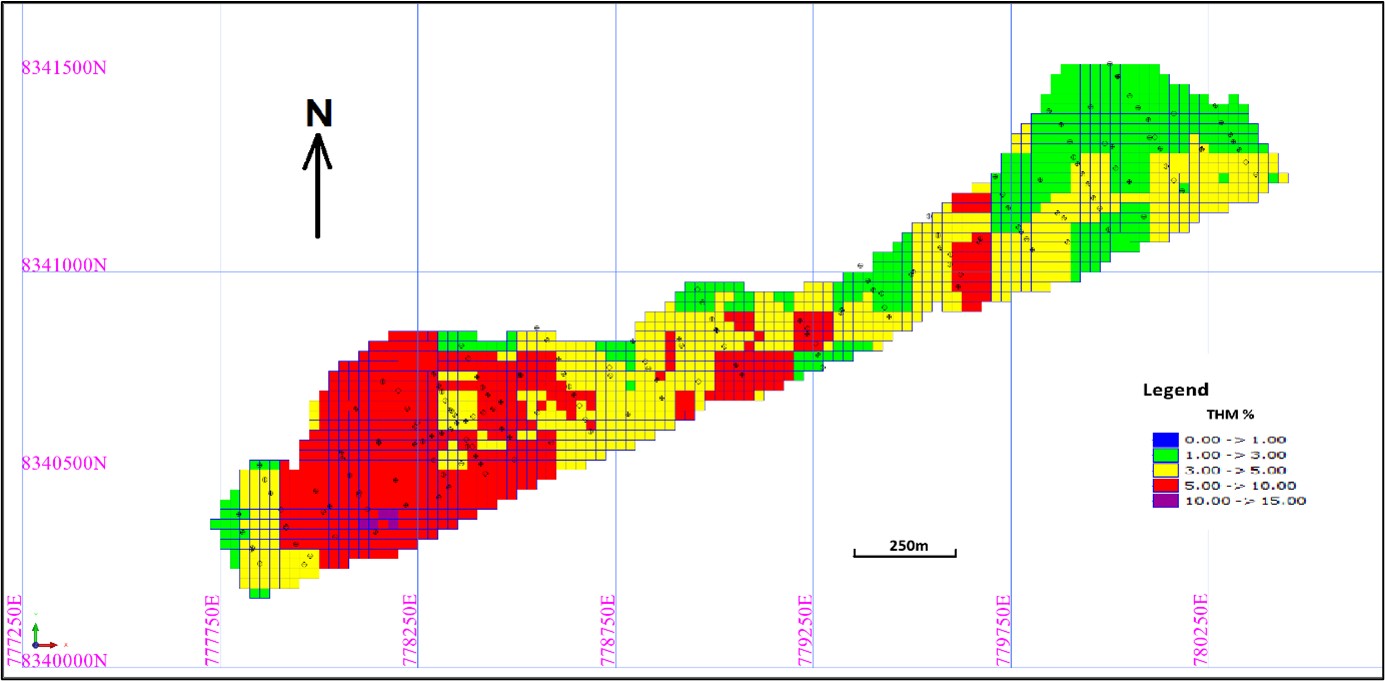
Figure 11. The Halala block model with the estimated THM % in plan view (Chilwa Minerals, 2025a).
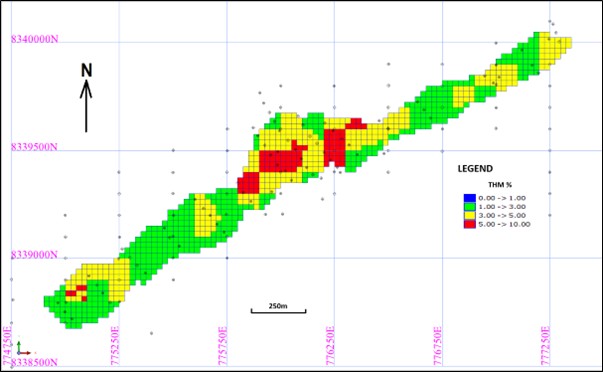
Figure 12. The Nkomato block model with the estimated THM % in plan view (Chilwa Minerals, 2025a).
39
CHILWA MINERALS - TECHNICAL REPORT SUMMARY
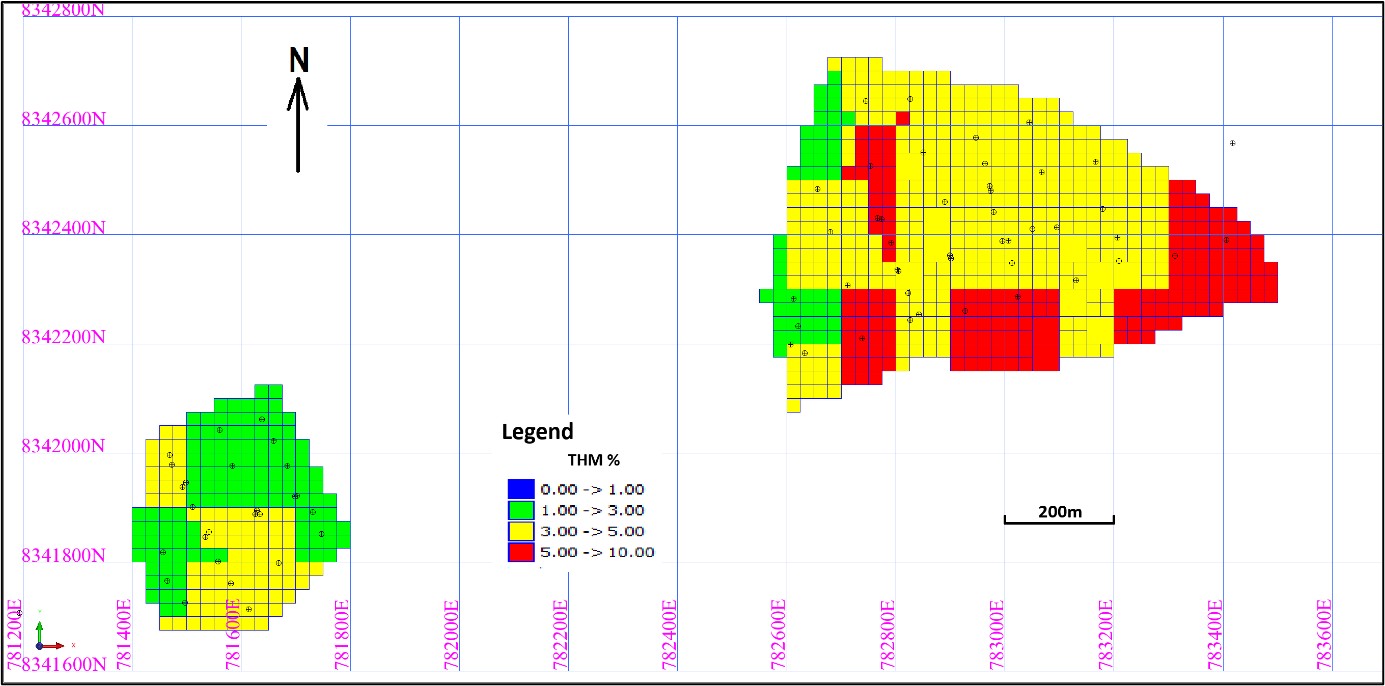
Figure 13. The Beacon (left) and Namanja West (right) block models with the estimated THM % in plan view (Chilwa Minerals, 2025a).
| 13.7 | Relative Density (RD) |
Density samples were taken according to normal industry standards. In situ wet and dry densities were determined using the sand-cone method. Sixty-four bulk density samples were taken, and the bulk density values range from 1.49 t/m3 to 1.78 t/m3. The average dry bulk density values per deposit are summarized in Table 18 (AMC, 2023).
Table 18. The average dry bulk density values per deposit (AMC, 2023).
| Deposit | No. Samples | Min. | Max. | Average |
| Mposa | 24 | 1.394 | 1.850 | 1.653 |
| Mpyupyu | 21 | 1.581 | 2.019 | 1.726 |
| Bimbi Main | 14 | 1.401 | 2.001 | 1.699 |
| NE Bimbi | 2 | 1.670 | 1.897 | 1.784 |
| N Chilwa | 3 | 1.405 | 1.584 | 1.490 |
40
CHILWA MINERALS - TECHNICAL REPORT SUMMARY
| 13.8 | Block Model Validations |
| 13.8.1 | Visual Validation |
The visual check on the block model sections generally correlates well with the input data. The blocks were coloured according to the THM % in the legend to compare with the drill holes with the same colour intervals (Figure 14 to Figure 22) (Chilwa Minerals, 2025a and 2025b).
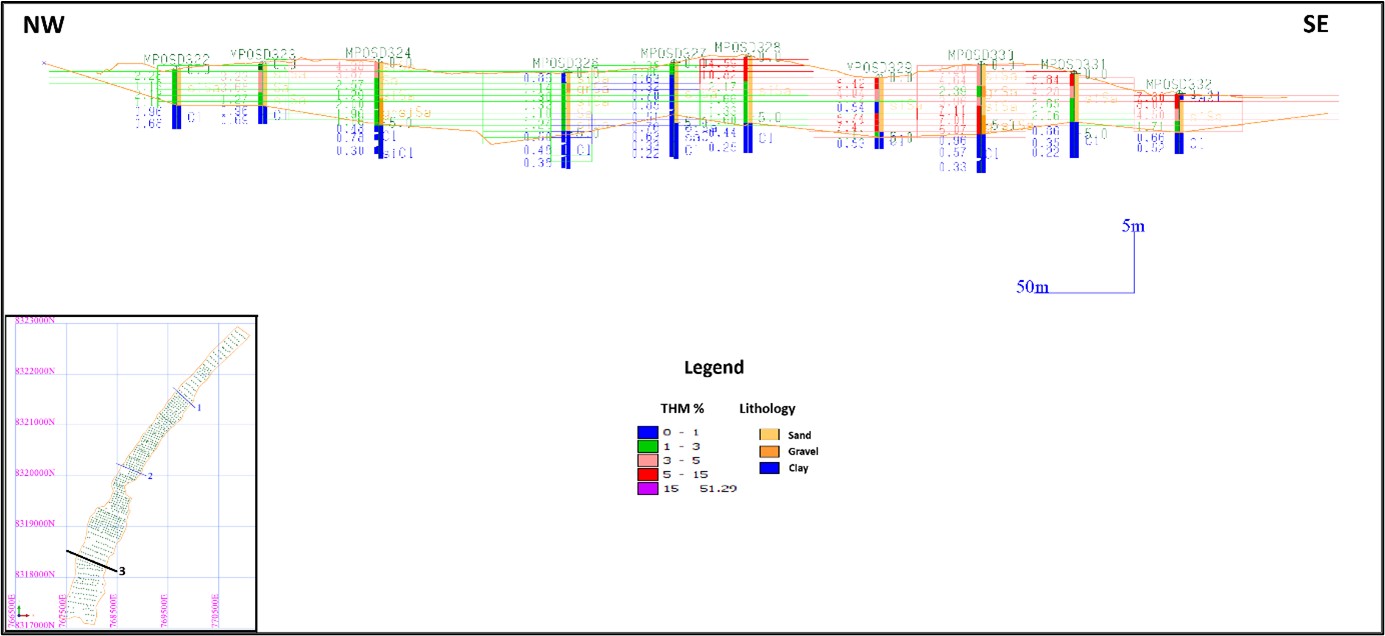
Figure 14. Section 3 in the southern part of the Mposa deposit (6X vertical exaggeration) (November 2025 update) (Chilwa Minerals, 2025b).
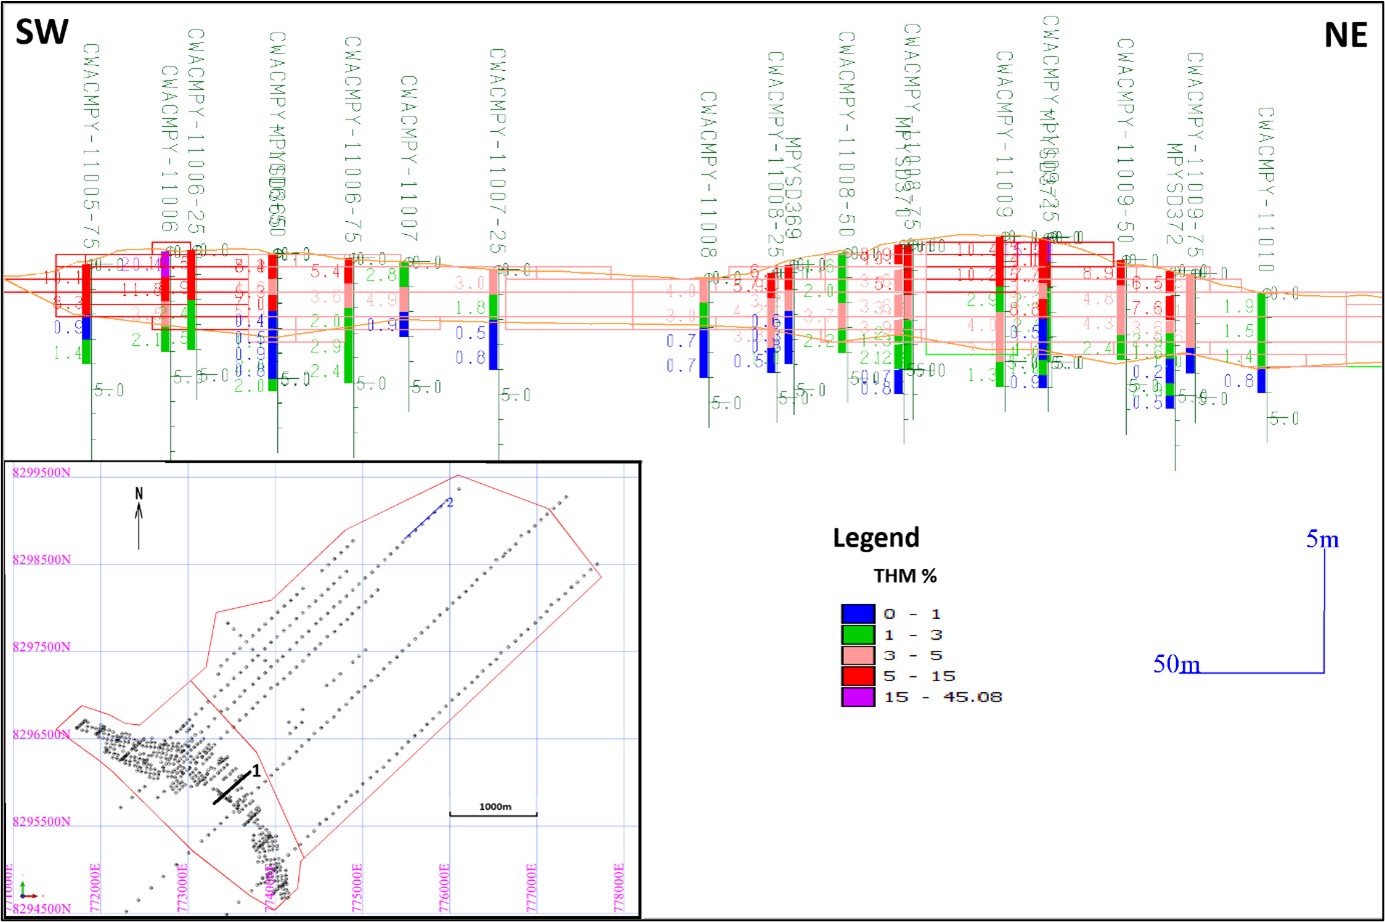
Figure 15. Section 1 in the Dune area of the Mpyupyu deposit (6X vertical exaggeration) (Chilwa Minerals, 2025a).
41
CHILWA MINERALS - TECHNICAL REPORT SUMMARY
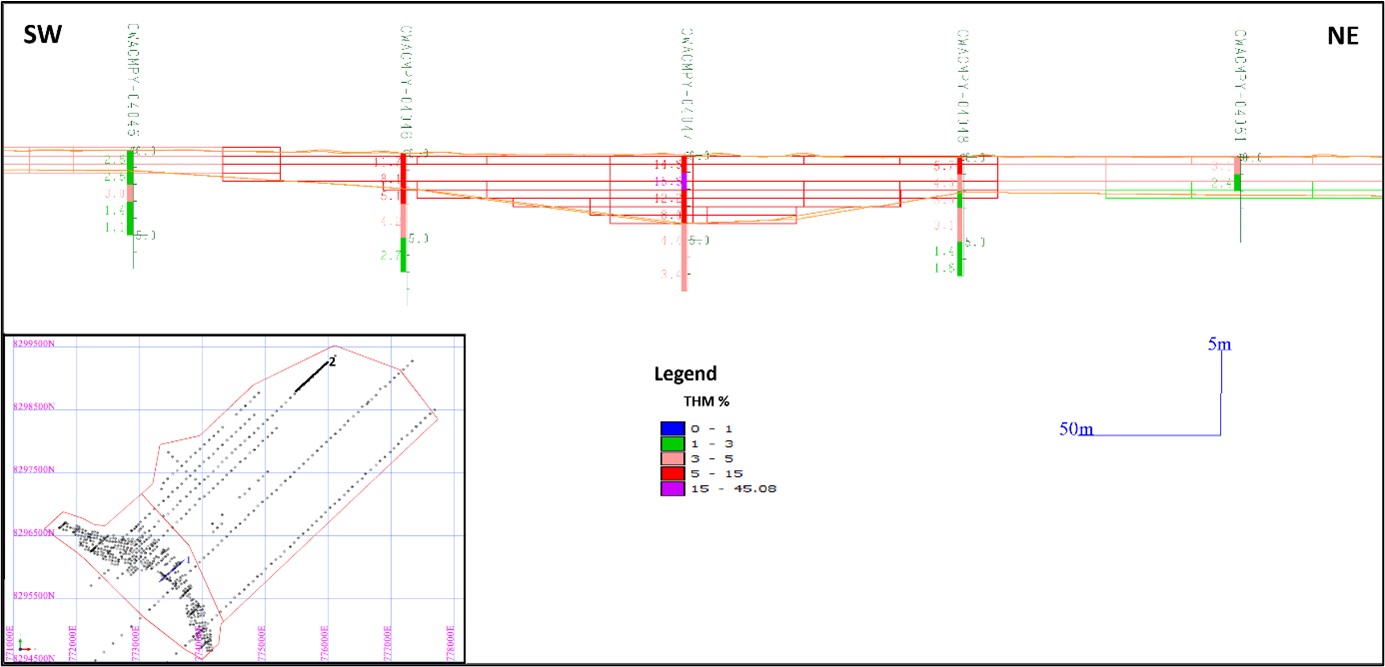
Figure 16. Section 2 in the Flat area of the Mpyupyu deposit (6X vertical exaggeration) (Chilwa Minerals, 2025a).
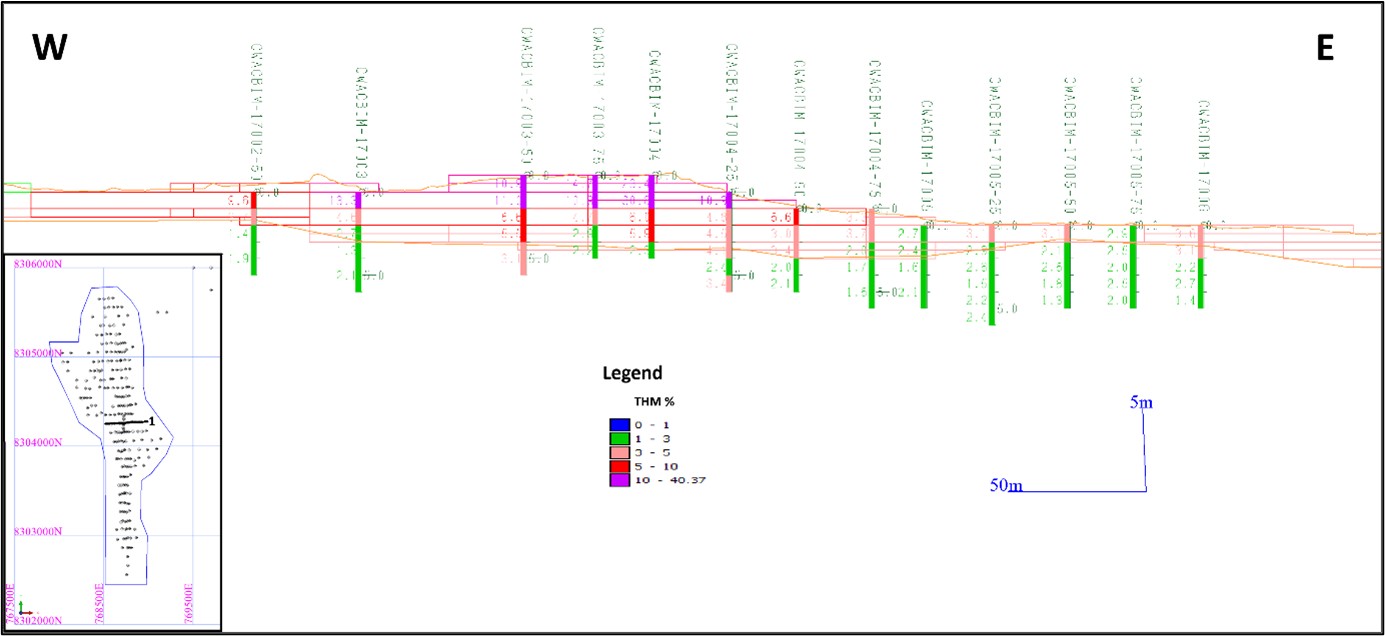
Figure 17. Section 1 in the Bimbi deposit (6X vertical exaggeration) (Chilwa Minerals, 2025a).
42
CHILWA MINERALS - TECHNICAL REPORT SUMMARY
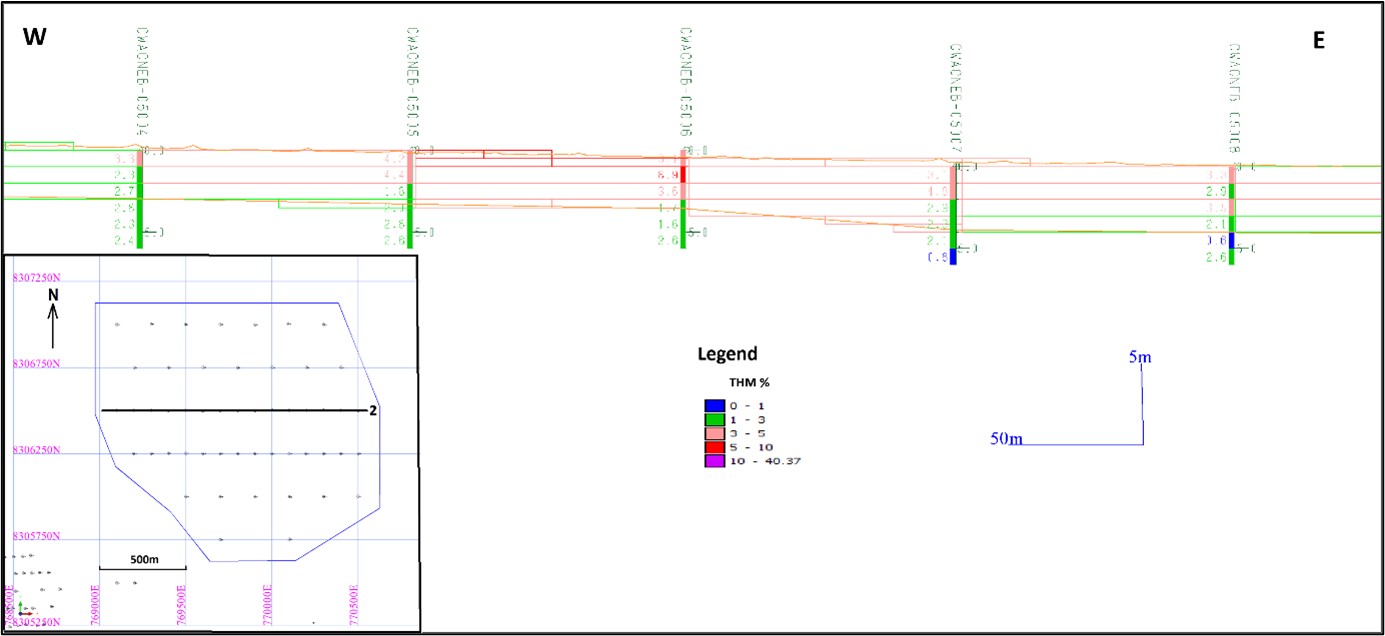
Figure 18. Section 2 in the Bimbi NE deposit (6X vertical exaggeration) (Chilwa Minerals, 2025a).
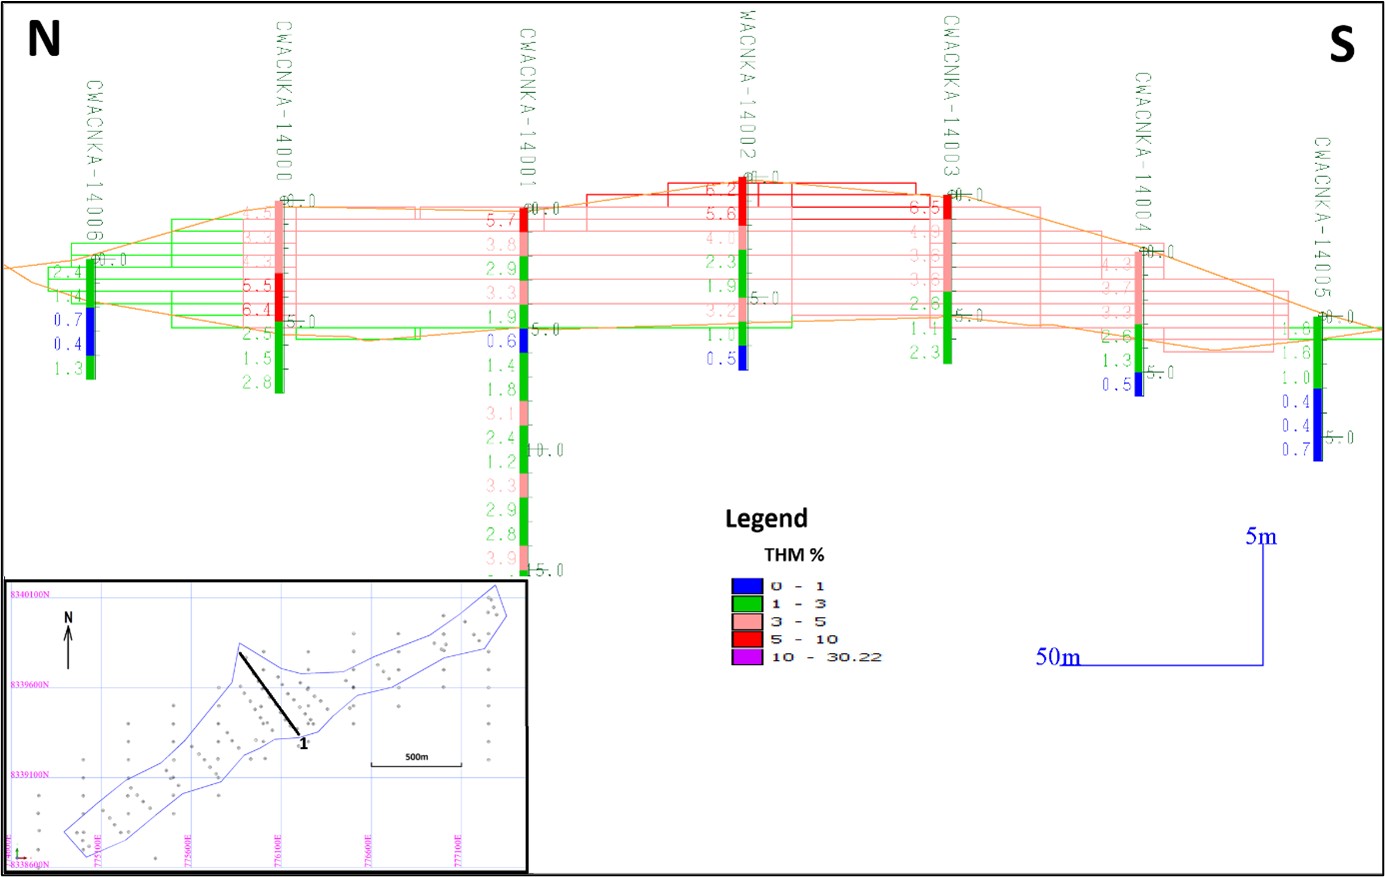
Figure 19. Section 1 in the Nkotamo deposit (6X vertical exaggeration) (Chilwa Minerals, 2025a).
43
CHILWA MINERALS - TECHNICAL REPORT SUMMARY
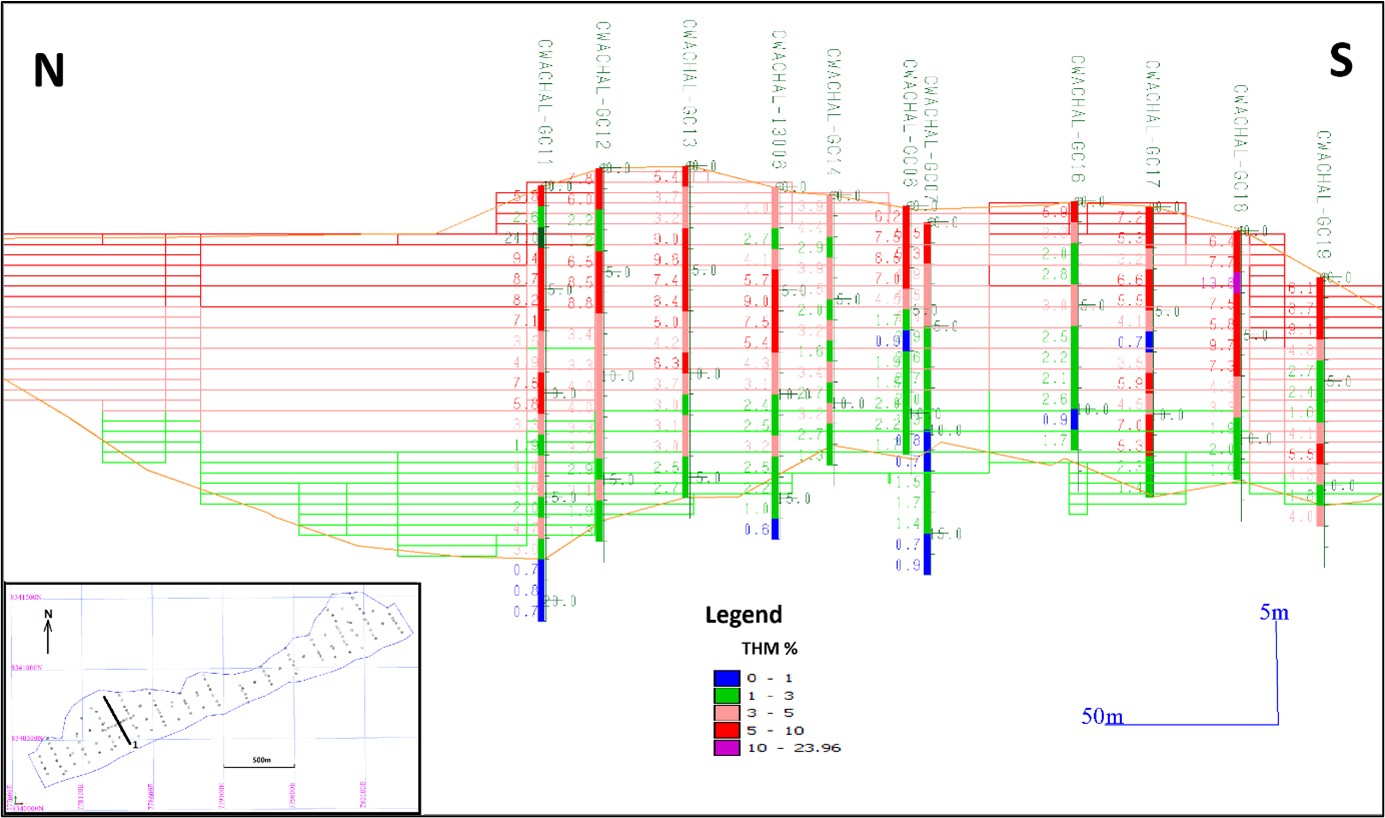
Figure 20. Section 1 in the Halala deposit (6X vertical exaggeration) (Chilwa Minerals, 2025a).
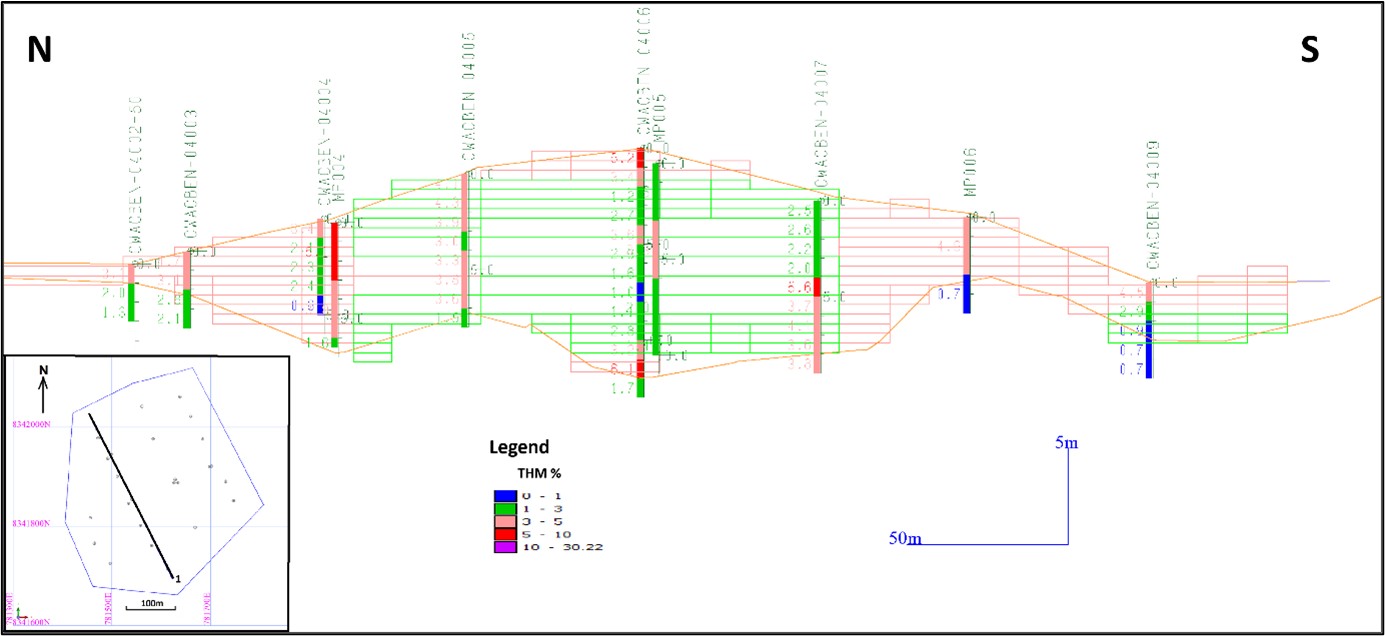
Figure 21. Section 1 in the Beacon deposit (6X vertical exaggeration) (Chilwa Minerals, 2025a).
44
CHILWA MINERALS - TECHNICAL REPORT SUMMARY
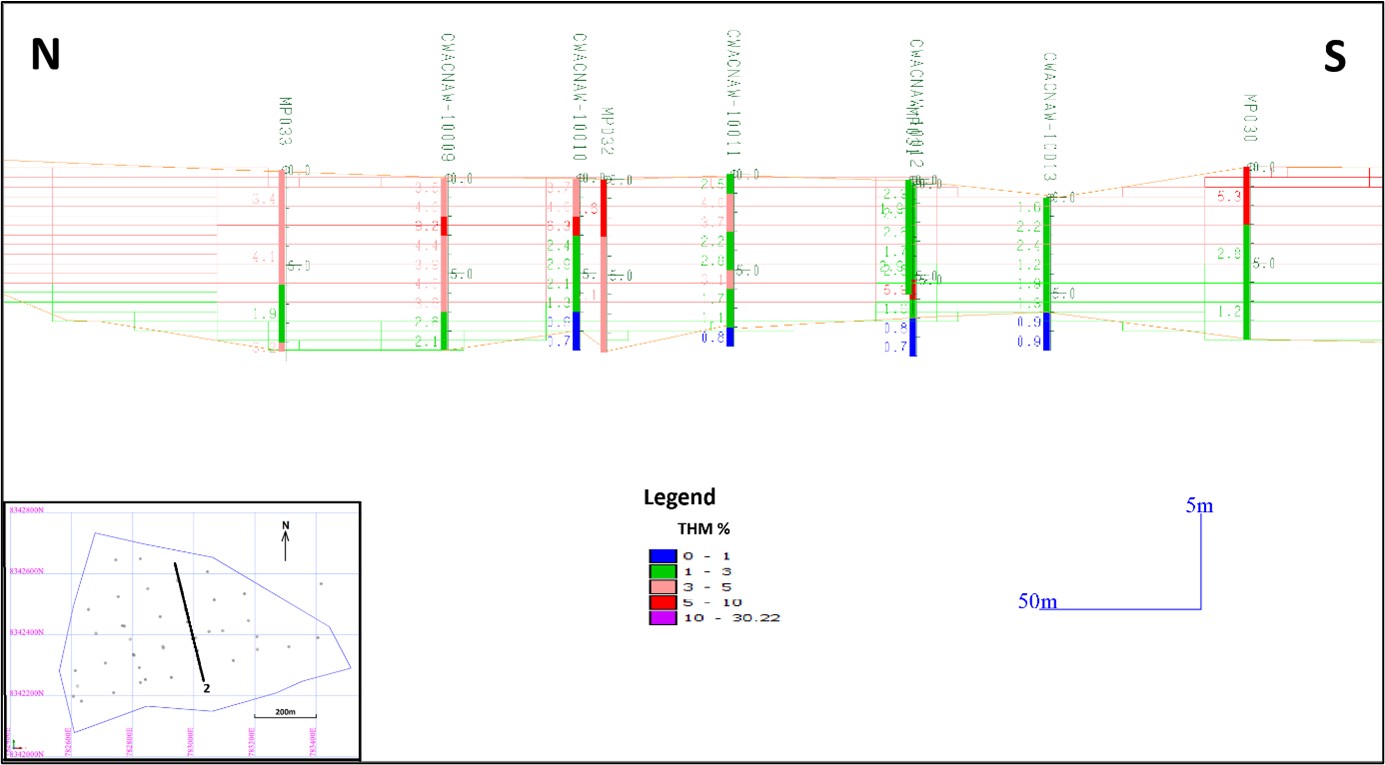
Figure 22. Section 1 in the Namanja West deposit (6X vertical exaggeration) (Chilwa Minerals, 2025a).
| 13.8.2 | Average Grade Conformance |
Comparisons of global average input composite data with the block model estimated grades of all the deposits in the June 2025 estimates compare reasonably well (Table 19). The higher difference in the THM % of Mposa was probably related to the high variances within the sonic samples (Chilwa Minerals, 2025a).
Table 19: Comparisons of global input data with block model grades for all the deposits in the June 2025 estimates (Chilwa Minerals, 2025a).
| Deposit | Type | THM % | Slimes % | Oversize % |
| Mposa Main | Composite | 4.43 | 17.51 | 16.60 |
| Block Model | 3.89 | 18.67 | 17.07 | |
| Difference | 12% | -7% | -3% | |
| Bimbi | Composite | 5.21 | 22.51 | 17.11 |
| Block Model | 4.31 | 23.04 | 17.52 | |
| Difference | 17% | -2% | -2% | |
| Bimbi NE | Composite | 2.58 | 19.42 | 5.24 |
| Block Model | 2.57 | 20.16 | 4.99 | |
| Difference | 0% | -4% | 5% | |
| Mpyupyu Dune | Composite | 6.43 | 28.89 | 9.41 |
| Block Model | 6.14 | 29.27 | 9.33 | |
| Difference | 5% | -1% | 1% | |
| Mpyupyu Flat | Composite | 4.14 | 21.80 | 5.46 |
| Block Model | 3.94 | 20.84 | 5.83 | |
| Difference | 5% | 4% | -7% | |
| Nkotamo | Composite | 3.82 | 18.40 | 24.96 |
| Block Model | 3.70 | 19.11 | 24.83 | |
| Difference | 3% | -4% | 1% | |
| Halala | Composite | 3.86 | 8.10 | 2.51 |
| Block Model | 3.91 | 8.75 | 2.99 | |
| Difference | -1% | -8% | -19% | |
| Beacon | Composite | 2.76 | 10.60 | 8.89 |
| Block Model | 2.63 | 10.51 | 10.87 | |
| Difference | 5% | 1% | -22% | |
| Namanja West | Composite | 3.48 | 7.47 | 4.10 |
| Block Model | 3.66 | 6.97 | 4.39 | |
| Difference | -5% | 7% | -7% |
45
Comparisons of global average input composite data with the block model estimated grades of all the deposits or domains of Mposa November 2025 update compare reasonably well (Table 20. The higher differences in Mposa North were probably related to the greater drilling grid of 200m x 50m (Chilwa Minerals, 2025b).
CHILWA MINERALS - TECHNICAL REPORT SUMMARY
Table 20: Comparisons of global input data with block model grades for the domains of Mposa in the November 2025 update (Chilwa Minerals, 2025b).
| Deposit | Type | THM % | Slimes % | Oversize % |
| Mposa Main NE | Composite | 5.57 | 18.93 | 15.43 |
| Block Model | 5.44 | 17.44 | 16.35 | |
| Difference | 2% | 8% | -6% | |
| Mposa Main SW | Composite | 3.05 | 25.34 | 14.56 |
| Block Model | 2.93 | 25.76 | 14.79 | |
| Difference | 4% | -2% | -2% | |
| Mposa North | Composite | 1.94 | 18.05 | 32.96 |
| Block Model | 2.13 | 13.54 | 40.16 | |
| Difference | -10% | 25% | -22% |
| 13.8.3 | Swath Plot Check |
The average grade conformance is a global representation over the entire domain. To assess average grade conformance progressively across the deposits, swath plots were used. In these plots, both data and model estimates are averaged into Easting, Northing and RL slices and the conformance of grade is assessed for each slice, in a particular direction. Swath plots, QQ plots and Scatter plots were run for all the 9 deposits. The overall grade conformance on the swath plots was acceptable, and it can be seen in the plots that the trends of the block means follow the sample means closely (Chilwa Minerals, 2025a and 2025b).
| 13.9 | Cut-off grade |
The 1.0% THM cut-off grade was selected by the qualified person based on the relationship between estimated operating cost per tonne of run-of-mine material and estimated recoverable revenue per tonne of run-of-mine material. The break-even cut-off grade is calculated as:
Break-even THM cut-off grade (%) = Estimated operating cost per tonne ROM ÷ Estimated recoverable revenue per tonne ROM generated by each 1.0% THM.
Estimated operating cost per tonne ROM includes mining cost, processing cost, site general and administrative cost, and other operating cost assumptions considered relevant by the qualified person. The unit operating cost for the base case model have been estimated at approximately US$8.65 per tonne by TZMI in 2015 (TZMI, 2015) (Figure 23). These 2015 costs were escalated on a yearly basis up to the year 2030. The average of the escalated costs for the period 2026 to 2030, equal to US$12.71 per tonne, was then used in the break-even calculation. Estimated recoverable revenue with the 1.0% THM cut-off and with a 90% recovery, were US$12.27 per tonne for the period to 2030 based on the applicable recovery assumptions (TZMI, 2015), and the commodity price assumptions (TZMI, 2026) for sulphate ilmenite, zircon, rutile and monazite. Based on the assumed operating costs, recoveries and commodity prices described in this technical report summary, the qualified person concluded that a 1.0% THM cut-off grade is reasonable for reporting Mineral Resources with reasonable prospects for eventual economic extraction. The 1.0% THM cut-off grade does not establish mineral reserves and should not be read as demonstrating economic viability.
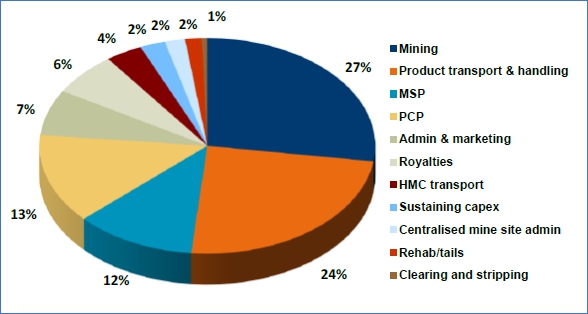
Figure 23. Key operating cost breakdown summary (TZMI, 2015)
46
CHILWA MINERALS - TECHNICAL REPORT SUMMARY
| 14.0 | resource classification |
The resource classification was primarily based on the drill hole density. The passes were used in the classification process. With the THM % estimation, the blocks were flagged = 1 after the first inverse distance run or pass1, flagged = 2 after pass 2 and flagged = 3 after pass 3 (see Section 13.6). The flagged 1 and 2 blocks were classified as Indicated and the flagged 3 blocks were assigned as Inferred in the June 2025 estimations. In the November 2025 Mposa update, the flagged 1 and some flagged 2 blocks were classified as Measured and the flagged 2 and 3 blocks were classified as Indicated. The coverage of the QEMSCAN samples were taken into consideration as the mineral assemblages in the THM were based on it. All the Mineral Resources were classified as Indicated except for Mposa, Bimbi NE and Mpyupyu. (Figure 24 to Figure 26) (Chilwa Minerals, 2025a and 2025b). The Measured Mineral Resource classification at Mposa was established by the qualified person based on all the estimated data derived from resent sonic drilling together with the good coverage of the QEMSCAN samples. At Mposa, approximately 83% of the Mineral Resources were classified as Measured and the remainder as Indicated The other deposits estimated with data derived from older air core drilling campaigns were classified as Indicated and Inferred. These are currently all being redrill with sonic drilling to be re-estimated for higher confidence categories.
The uncertainty associated with the Mineral Resource estimate varies by classification category. Measured Mineral Resources have the highest level of geological confidence and are supported by closer-spaced drilling, more complete mineralogical support, stronger grade-continuity evidence, and more robust QA/QC and database validation. Indicated Mineral Resources have a lower but sufficient level of confidence to support the application of technical and economic factors for purposes of assessing reasonable prospects for economic extraction. Inferred Mineral Resources have the lowest level of geological confidence and are based on more limited geological evidence and sampling. Inferred Mineral Resources are too speculative geologically to have modifying factors applied to them in a manner that would permit categorization as mineral reserves, may not be used to support economic viability, and may not be converted directly to mineral reserves.
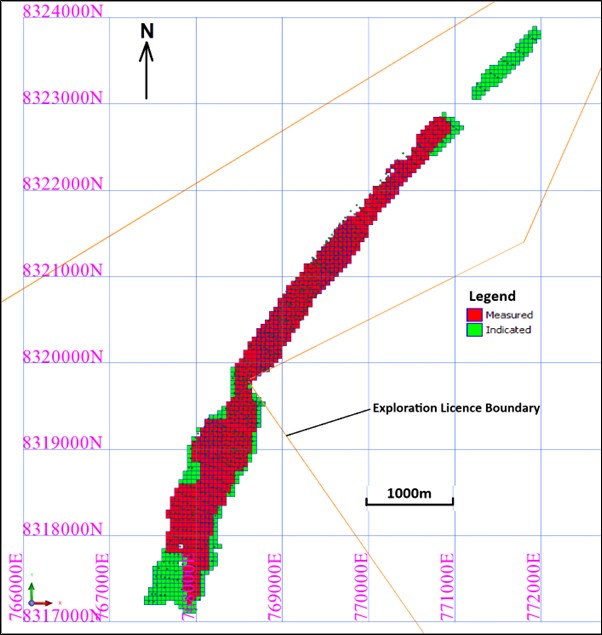
Figure 24. The Mineral Resource classification on Mposa Main and North (Chilwa Minerals, 2025b).
47
CHILWA MINERALS - TECHNICAL REPORT SUMMARY
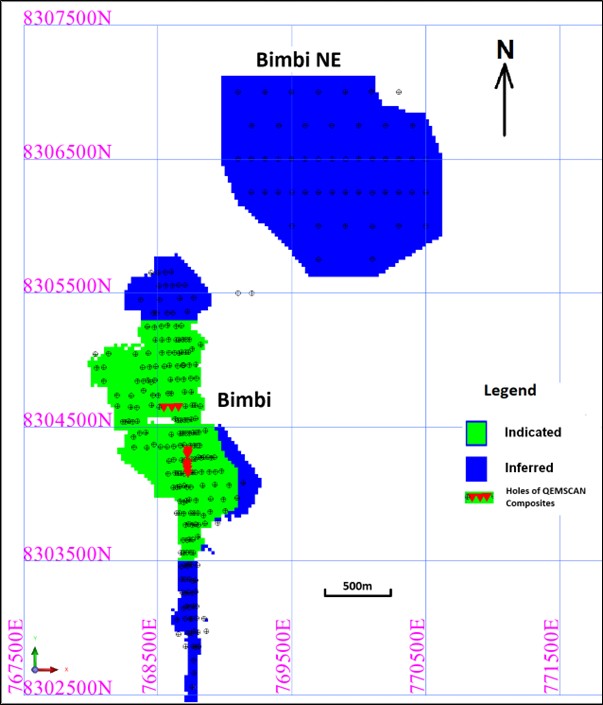
Figure 25. The Mineral Resource classification on Bimbi (Chilwa Minerals, 2025a).
48
CHILWA MINERALS - TECHNICAL REPORT SUMMARY
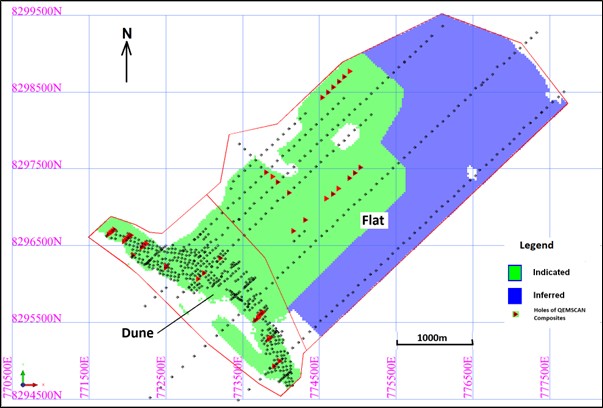
Figure 26. The Mineral Resource classification on Mpyupyu (Chilwa Minerals, 2025a).
| 15.0 | resource statement |
The in situ Mineral Resource estimations reported from the block model with a 1.0% THM cut-off, are shown below for the project area (Table 21). The 1.0% THM reporting cut-off reflects the qualified person’s break-even assessment based on the estimated operating cost, metallurgical recovery and commodity price assumptions described in the Technical Report Summary. For the cut-off grade equation and the underlying inputs, see Section 13.9 of the Technical Report Summary. The HM recovery to HMC recovery is from 85% to 90% (TZMI, 2015).
Commodity price assumptions used in the Mineral Resource estimate
The following commodity price assumptions were used by the qualified person in preparing the Mineral Resource estimate. The prices are stated in Real 2025 US dollars on an FOB basis and are used solely for purposes of assessing reasonable prospects for eventual economic extraction in connection with the Mineral Resource estimate. They are not forecasts by the Company and do not establish mineral reserves or demonstrate economic viability.
| Commodity | Long-term price assumption | Point of reference | Notes |
| Sulphate ilmenite | US$255 per tonne | FOB | Long-term price assumption used for mineral resource estimation |
| Zircon | US$1,504 per tonne | FOB | Long-term price assumption used for mineral resource estimation |
| Rutile | US$1,425 per tonne | FOB | Long-term price assumption used for mineral resource estimation |
| Monazite | US$5,350 per tonne | FOB | Long-term price assumption used for mineral resource estimation |
For additional discussion of commodity pricing, points of reference and metallurgical recovery factors, see Section 12.3 of the Technical Report Summary.
49
CHILWA MINERALS - TECHNICAL REPORT SUMMARY
Table 21. The in situ Mineral Resource estimations reported from the block model with a 1.0% THM cut-off, are shown below for the project area, as at 21 November 2025.
| Mineral in ROM*** | ||||||||||||||||
| Deposit | Category | Volume | Tonnes | THM* | HMC** | Ilmenite | Zircon | Leucoxene | Rutile | Garnet | Monazite | THM cut-off | Recovery | Slimes | Oversize | RD |
| (million m³) | (million t) | (%) | (million t) | (%) | (%) | (%) | (%) | (%) | (%) | (%) | (%) | (%) | (%) | |||
| Mposa (Main) | Measured | 12.5 | 21.3 | 4.4 | 0.95 | 3.00 | 0.39 | 0.40 | 0.04 | 0.12 | 0.02 | 1.00 | 85-90 | 19.9 | 15.9 | 1.70 |
| Mposa (Main) | Indicated | 1.8 | 3.1 | 2.8 | 0.09 | 1.85 | 0.26 | 0.25 | 0.02 | 0.08 | 0.01 | 1.00 | 85-90 | 31.2 | 14.0 | 1.70 |
| Mposa (North) | Indicated | 0.7 | 1.2 | 2.3 | 0.03 | 0.88 | 0.18 | 0.14 | 0.03 | 0.22 | 0.00 | 1.00 | 85-90 | 13.7 | 39.9 | 1.70 |
| Bimbi | Indicated | 3.0 | 5.1 | 4.55 | 0.23 | 3.85 | 0.25 | N/A | 0.11 | n/e**** | n/e**** | 1.00 | 85-90 | 22.4 | 18.0 | 1.70 |
| Inferred | 1.4 | 2.4 | 3.79 | 0.09 | 3.21 | 0.21 | N/A | 0.09 | n/e**** | n/e**** | 1.00 | 85-90 | 24.4 | 16.5 | 1.70 | |
| Bimbi NE | Inferred | 7.4 | 12.5 | 2.57 | 0.32 | 2.18 | 0.14 | N/A | 0.06 | n/e**** | n/e**** | 1.00 | 85-90 | 20.2 | 5.0 | 1.70 |
| Mpyupyu (Dune) | Indicated | 5.4 | 9.2 | 6.21 | 0.57 | 5.37 | 0.22 | N/A | 0.15 | n/e**** | n/e**** | 1.00 | 85-90 | 29.0 | 9.4 | 1.70 |
| Mpyupyu (Flat) | Indicated | 9.4 | 15.9 | 4.52 | 0.72 | 3.86 | 0.19 | N/A | 0.12 | n/e**** | n/e**** | 1.00 | 85-90 | 24.0 | 5.8 | 1.70 |
| Inferred | 15.3 | 26.0 | 3.61 | 0.94 | 3.08 | 0.16 | N/A | 0.10 | n/e**** | n/e**** | 1.00 | 85-90 | 19.0 | 5.8 | 1.70 | |
| Nkotamo | Indicated | 1.6 | 2.4 | 3.70 | 0.09 | 2.23 | 0.23 | N/A | 0.10 | n/e**** | n/e**** | 1.00 | 85-90 | 19.1 | 24.8 | 1.50 |
| Halala | Indicated | 5.8 | 8.7 | 3.79 | 0.33 | 2.28 | 0.19 | N/A | 0.09 | n/e**** | n/e**** | 1.00 | 85-90 | 9.0 | 3.0 | 1.50 |
| Beacon | Indicated | 0.7 | 1.0 | 2.63 | 0.03 | 1.82 | 0.16 | N/A | 0.08 | n/e**** | n/e**** | 1.00 | 85-90 | 10.5 | 10.9 | 1.50 |
| Namanja West | Indicated | 3.0 | 4.5 | 3.66 | 0.16 | 2.63 | 0.25 | N/A | 0.10 | n/e**** | n/e**** | 1.00 | 85-90 | 7.0 | 4.4 | 1.50 |
| Total | Measured | 12.5 | 21.3 | 4.44 | 0.95 | 3.00 | 0.39 | N/A | 0.04 | n/e**** | n/e**** | 1.00 | 85-90 | 19.9 | 15.9 | 1.70 |
| Total | Indicated | 31.4 | 51.1 | 4.40 | 2.2 | 3.45 | 0.21 | N/A | 0.11 | n/e**** | n/e**** | 1.00 | 85-90 | 20.4 | 9.4 | 1.63 |
| Total | Measured + Indicated | 43.9 | 72.4 | 4.4 | 3.2 | 3.31 | 0.26 | N/A | 0.09 | n/e**** | n/e**** | 1.00 | 85-90 | 20.27 | 11.29 | 1.65 |
| Total | Inferred | 24.1 | 40.9 | 3.30 | 1.35 | 2.81 | 0.16 | N/A | 0.09 | n/e**** | n/e**** | 1.00 | 85-90 | 19.7 | 6.2 | 1.70 |
| * | Total Heavy Minerals; |
| ** | Heavy Mineral Concentrate; |
| *** | Run of Mine |
| **** | Not separately estimated. The mineral is included within THM but has not been estimated separately for this deposit due to insufficient mineralogical support.” The Mposa (Main) and Mposa (North) rows keep their existing leucoxene, garnet and monazite values — those are the deposits with QEMSCAN support. |
THM means total heavy minerals and represents the total heavy mineral content as a percentage of run-of-mine material. The “Mineral in ROM” columns express the grade of each individual mineral as a percentage of run-of-mine material. Accordingly, the sum of the individual “Mineral in ROM” columns for ilmenite, zircon, leucoxene, rutile, garnet and monazite represents the reported valuable heavy mineral assemblage within the broader THM grade, while the balance of THM comprises other heavy minerals that are not separately reported as planned products. For example, for the Mposa (Main) Measured Mineral Resource, the reported THM grade of 4.4% includes ilmenite at 3.00%, zircon at 0.39%, leucoxene at 0.40%, rutile at 0.04%, garnet at 0.12% and monazite at 0.02% of run-of-mine material, for a reported valuable heavy mineral assemblage of approximately 3.97% of run-of-mine material, with the balance comprising other heavy minerals.
Inferred mineral resources are subject to uncertainty as to their existence and as to their economic and legal feasibility. The level of geological uncertainty associated with an inferred mineral resource is too high to apply relevant technical and economic factors likely to influence the prospects of economic extraction in a manner useful for the evaluation of economic viability. For the meanings of certain technical terms used in this prospectus, see “Glossary of Terms.”
We have no mineral reserves. Mineral resources are not mineral reserves and do not have demonstrated economic viability. Inferred mineral resources are subject to uncertainty as to their existence and as to their economic and legal feasibility, and are too speculative geologically to have economic considerations applied to them in a manner that would permit categorization as mineral reserves. For the meanings of certain technical terms used in this prospectus, see “Glossary of Terms.”
In the opinion of the qualified person, the principal technical and economic factors likely to influence the prospect of economic extraction for the reported Mineral Resources include drilling density, geological and grade continuity, THM assemblage, slimes and oversize content, product specifications, metallurgical recovery, mining and processing cost assumptions, infrastructure access, environmental and permitting requirements, and market assumptions. Subject to the limitations and uncertainties described in this technical report summary, the qualified person believes that the issues relating to these factors are capable of being further evaluated through additional drilling, mineralogical and metallurgical test work, QAQC and database validation, engineering studies, environmental baseline work and future technical studies. This opinion does not constitute a determination of mineral reserves and does not demonstrate economic viability.
50
CHILWA MINERALS - TECHNICAL REPORT SUMMARY
| 16.0 | Conclusion and recommendations |
Under the assumptions presented in this Report, the Chilwa Minerals Sand Project represents a substantial Mineral Resource that warrants technical evaluation and studies.
It is the qualified person’s opinion that additional work is justified on the Project to upgrade the mineral resource confidence categories that are relevant to the technical and economic factors likely to influence the prospect of economic extraction.
Belenos recommended the following:
| ● | Infill drilling in the Inferred and Indicated areas to increase the confidence level to higher categories. |
| ● | XRF and QEMSCAN analysis in areas that that are not well covered to increase the confidence level to higher categories. |
| ● | Use the QEMSCAN data to estimate the garnet values in the block models. |
| ● | Updating the resource models periodic per deposit area as soon as all the new drilling assay and QEMSCAN data are available per deposit area. |
| ● | Define the optimum modelling THM % together with a maximum Slimes % from the metallurgical testings for the economic mining process and re-model the base clay footwall on all deposits accordingly. |
| 17.0 | REFERENCES |
AMC., 2016. Technical report on the estimation of mineral resources, Chilwa HMS Project. Mota Engil Africa. November 22, 2016.
AMC., 2023. Independent Geologist’s Report, Chilwa Minerals Ltd.
Bloomfield, K., 1965. The geology of the Zomba area. Geological Survey Department Bulletin 16.
Brinkmann, K., 1991. Preliminary Note on the Occcurance of Heavy Mineral Sands in the Lake Chilwa Area. German Geological Advisory Group.
Brinkmann, K., 1992. On the Heavy Mineral Potential of Lake Chilwa Area. Progress Report No 2.
Brinkmann, K., 1993. The Heavy Mineral Potential of the Lake Chilwa Area. The Mpyupyu/Kachulu Deposit. Final Report. German Geological Advisory Group.
Britannica, 2026. https://www.britannica.com/place/Malawi/Resources-and-power
Chilwa Minerals., 2024. Annual Report 2024.
Chilwa Minerals., 2025a. Report RE02-062025: Modelling and Mineral Resource Estimation of the Chilwa Mineral Sand Deposits Final, June 2025.
Chilwa Minerals., 2025b. Report RE03-112025: Mposa Modelling and Mineral Resource Estimation Update of the Chilwa Mineral Sand Deposits Final, June 2025.
CSA Global., 2012. Memorandum, A Review of Tate Minerals Malawi HMS Projects.
Garson, M.S., 1960. The Geology of the Lake Chilwa Area. Geological Survey Department of the Nyasaland Protectorate. Bulletin No. 12.
SGS Report, 2018. SGS Report-18-154 Cosamo (Pty) Ltd Mineralogical Analysis Final.
Schlüter, T., 2008. Geological Atlas of Africa, with Notes on Stratigraphy, Tectonics, Economic Geology, Geohazards, Geosites and Geoscientific Education of Each Country, 2nd ed. xi + 307 pp. + CD-ROM. Berlin, Heidelberg, New York: Springer-Verlag.
TZMI Report, 2015. Lake Chilwa Heavy Mineral Sands Project – Concept Study. Mota-Engil Africa, TZ MINERALS INTERNATIONAL PTY LTD, November 2015.
TZMI Report, 2026. Lake Chilwa product pricing update. Chilwa Minerals, Project 12066, May 2026.
Wallmach T., Reyneke L., Horsch, H. and Whiteman, E. 2008. Shedding light and electrons on altered ilmenites and leucoxenes. Ninth International Congress for Applied Mineralogy, ICAM, 2008, AusIMM Proceedings, 567-578.
Wikipedia, 2025. https://en.wikipedia.org/wiki/Malawi#Economy
51