Shareholder Report
Apr. 30, 2026
USD ($)
$ / shares
WHAT WERE THE FUND COSTS FOR THE PAST YEAR? (based on a hypothetical $10,000 investment)
|
Fund Name
|
Costs of a $10,000 investment
|
Costs paid as a percentage of a $10,000 investment
|
|
Logan Capital Broad Innovative Growth ETF
|
$102
|
0.85%
|
HOW DID THE FUND PERFORM LAST YEAR AND WHAT AFFECTED ITS PERFORMANCE?
OVERVIEW OF TRAILING PERFORMANCE
During the 12-month trailing period ending April 30,2026 the Logan Capital Broad Innovative Growth ETF delivered a NAV total return of 39.94% beating the Russell 1000 Total Return Index, which returned 30.42%. Performance reflected Logan’s disciplined strategy and selective exposure to innovation-driven companies across sectors.
During the 12-month trailing period ending April 30,2026 the Logan Capital Broad Innovative Growth ETF delivered a NAV total return of 39.94% beating the Russell 1000 Total Return Index, which returned 30.42%. Performance reflected Logan’s disciplined strategy and selective exposure to innovation-driven companies across sectors.
MARKET CONTEXT
The Fund benefited from resilient U.S. economic conditions despite elevated market volatility, inflation concerns, and geopolitical uncertainty. Investor sentiment was influenced by changing tariff policies, Federal Reserve expectations, and rising oil prices tied to Middle East tensions. Equity market leadership broadened beyond large-cap technology companies as investors rotated toward value-oriented, industrial, energy, and cyclical sectors.
The Fund benefited from resilient U.S. economic conditions despite elevated market volatility, inflation concerns, and geopolitical uncertainty. Investor sentiment was influenced by changing tariff policies, Federal Reserve expectations, and rising oil prices tied to Middle East tensions. Equity market leadership broadened beyond large-cap technology companies as investors rotated toward value-oriented, industrial, energy, and cyclical sectors.
INVESTMENT POSITIONING AND SECTOR INFLUENCE
The Fund’s investment adviser maintained a disciplined and diversified investment approach focused on high-quality companies with strong balance sheets, durable cash flows, and long-term growth potential. Portfolio positioning emphasized selective exposure to industrial, infrastructure, energy, and AI-related investment themes while managing concentration and valuation risk within the technology sector. During periods of volatility, the adviser remained focused on long-term fundamentals and ongoing evaluation of macroeconomic, earnings, and geopolitical developments.
The Fund’s investment adviser maintained a disciplined and diversified investment approach focused on high-quality companies with strong balance sheets, durable cash flows, and long-term growth potential. Portfolio positioning emphasized selective exposure to industrial, infrastructure, energy, and AI-related investment themes while managing concentration and valuation risk within the technology sector. During periods of volatility, the adviser remained focused on long-term fundamentals and ongoing evaluation of macroeconomic, earnings, and geopolitical developments.
|
Top Contributors
|
|
|
↑
|
Information Technology
|
|
↑
|
Communication Services
|
|
↑
|
KLA Corporation
|
|
↑
|
Broadcom Inc.
|
|
↑
|
Amphenol Corporation
|
|
Top Detractors
|
|
|
↓
|
Materials
|
|
↓
|
Financials
|
|
↓
|
Copart Inc.
|
|
↓
|
Netflix
|
|
↓
|
Graphic Packaging Holding Corp
|
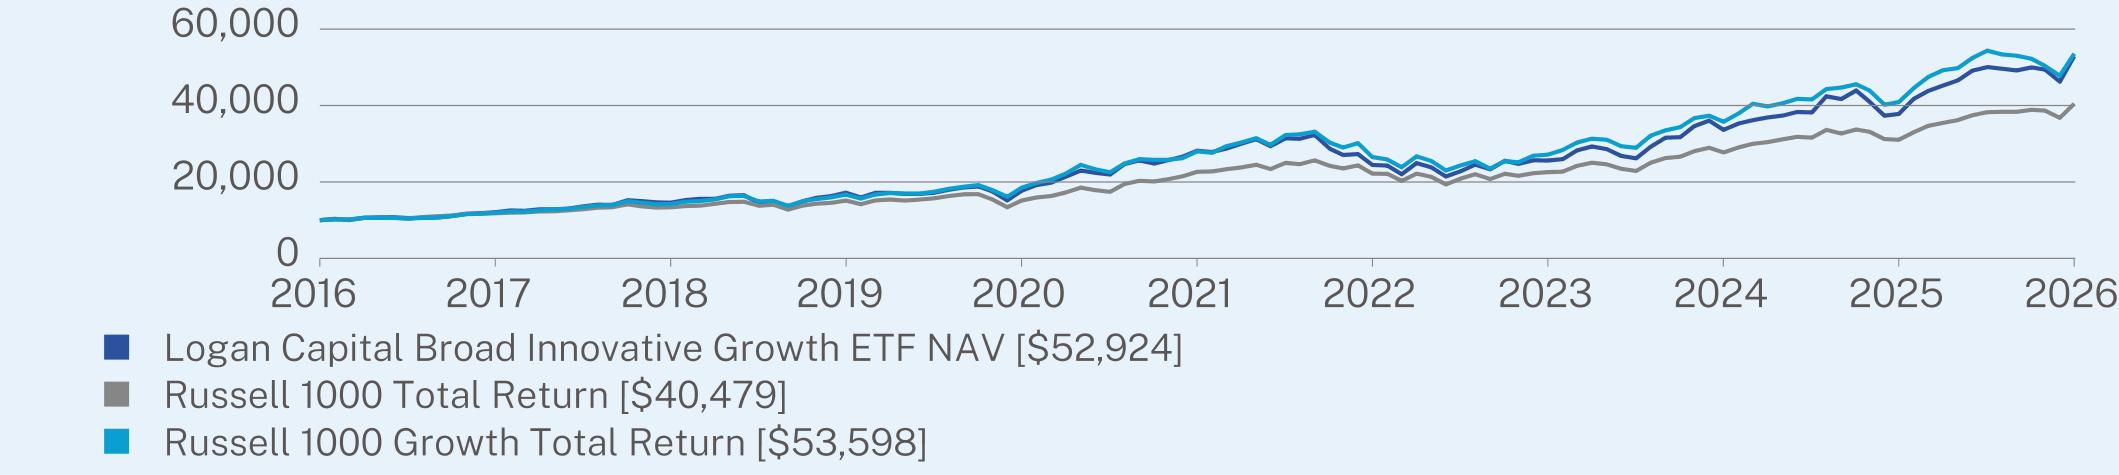
ANNUAL AVERAGE TOTAL RETURN (%)
|
|
1 Year
|
5 Year
|
10 Year
|
|
Logan Capital Broad Innovative Growth ETF NAV
|
39.94
|
13.43
|
18.13
|
|
Russell 1000 Total Return
|
30.42
|
12.32
|
15.01
|
|
Russell 1000 Growth Total Return
|
30.99
|
13.86
|
18.28
|
Visit https://logancapitalfunds.com/regulatory-info for more recent performance information.
KEY FUND STATISTICS (as of April 30, 2026)
|
Net Assets
|
$101,289,196
|
|
Number of Holdings
|
57
|
|
Net Advisory Fee
|
$578,477
|
|
Portfolio Turnover
|
7%
|
|
30-Day SEC Yield
|
-0.08%
|
|
30-Day SEC Yield Unsubsidized
|
-0.08%
|
WHAT DID THE FUND INVEST IN? (as of April 30, 2026)*
|
Top 10 Issuers
|
(%)
|
|
Alphabet, Inc.
|
7.4%
|
|
Broadcom, Inc.
|
6.1%
|
|
KLA Corp.
|
5.8%
|
|
Amphenol Corp.
|
5.4%
|
|
Amazon.com, Inc.
|
4.3%
|
|
Apple, Inc.
|
4.3%
|
|
AppLovin Corp.
|
4.0%
|
|
Netflix, Inc.
|
3.7%
|
|
Flex Ltd.
|
3.6%
|
|
Meta Platforms, Inc.
|
3.6%
|
|
Top Sectors
|
(%)
|
|
Information Technology
|
38.1%
|
|
Industrials
|
17.7%
|
|
Consumer Discretionary
|
16.0%
|
|
Communication Services
|
14.9%
|
|
Financials
|
6.5%
|
|
Health Care
|
2.7%
|
|
Materials
|
1.0%
|
|
Consumer Staples
|
1.0%
|
|
Cash & Other
|
2.1%
|
| [1] |
|