Shareholder Report
Apr. 30, 2026
USD ($)
Holding
What were the Fund costs for the last year?
(Based on a hypothetical $10,000 investment)
| Fund (Class) | Costs of a $10,000 investment | Costs paid as a percentage of a $10,000 investment |
| Private Capital Management Value Fund (Class I / VFPIX) |
$129 | 1.20% |
Management’s Discussion of Fund Performance
For the 12-month period ended April 30, 2026 (the “Reporting Period”), the Private Capital Management Value Fund (VFPIX) returned 14.3% – a solid result that nevertheless lagged the returns posted by the Russell 1000® Equal Weight Index and the small-cap Russell 2000® Index as reflected in the table that follows.
As Fund investors are aware, VFPIX’s annual returns generally do not closely correspond with benchmark results. Rather than seeking to replicate benchmark returns – which is the mandate for “passive” investments – VFPIX seeks to outperform its passive benchmark over multiyear periods by building a portfolio the Fund management team believes offers strong return potential and defensive characteristics. We pursue this goal through a high conviction, small-cap portfolio generally comprised of up to 35 investments. The underlying research is proprietary and seeks to understand our companies’ fundamentals, financials, and operational leadership teams. By investing in businesses trading at material discounts to their intrinsic value along with a 3+ year time horizon to see fair value recognized, we are able to focus on long-term, tax-efficient outcomes. Demonstrating the value of the Fund’s investment discipline, VFPIX outperforms both the Russell 1000® Equal Weight Index and the Russell 2000® Index over the trailing 5-year and trailing 10-year periods concluding April 30, 2026.
VFPIX’s process and portfolio should appeal to patient investors who are willing to accept benchmark variance in exchange for the potential to see material long-term excess returns. The Fund will frequently maintain more than 50% of its invested capital in its top 10 positions, which means that each investment has the capacity to be impactful to overall Fund results. From a diversification perspective, the Fund concluded the Reporting Period with portfolio investments spread across eight investment sectors, including most prominently Financials, Health Care, Consumer Discretionary, Industrials, Communication Services, and Information Technology. The Fund’s most significant sector contributors over the Reporting Period were Financials (5.6%), Health Care (5.6%) and Consumer Discretionary (4.1%), while its largest detracting sectors were Communication Services (-3.2%), and Information Technology (-1.8%).
Fund Performance
The following is a comparison of the change in value of a $10,000 investment in Private Capital Management Value Fund’s Class I Shares vs. the Russell 1000® Equal Weight Index and the Russell 2000® Index.
Growth of $ 10,000
For the years April 30, 2016 through April 30, 2026
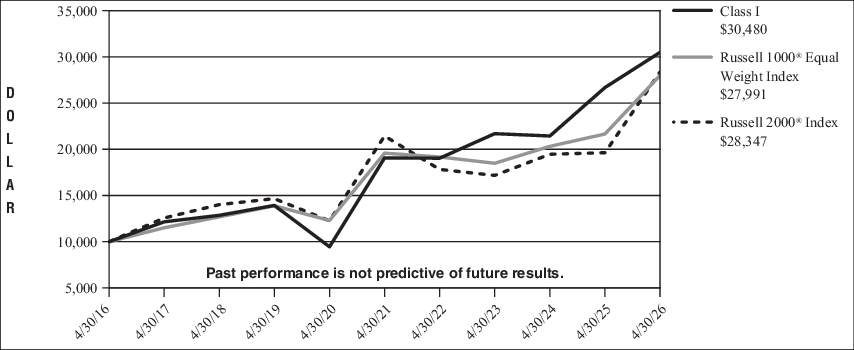
| Average Annual Total Returns | 1 Year | 5 Years | 10 Years |
| Class I | 14.26% | 9.84% | 11.79% |
| Russell 1000® Equal Weight Index | 29.29% | 7.41% | 10.84% |
| Russell 2000® Index | 44.41% | 5.75% | 10.98% |
Key Fund Statistics (as of April 30, 2026)
The following table outlines key Fund statistics that you should pay attention to.
| Fund net assets | $68,344,489 |
| Total number of portfolio holdings | 30 |
| Total advisory fee paid, net | $514,634 |
| Portfolio turnover rate as of the end of the reporting period | 14% |
Portfolio Holdings Summary Table (as of April 30, 2026)
The following table presents a summary by sector of the portfolio holdings of the Fund, as a percentage of net assets:
SECTOR ALLOCATION*
| Financials | 26.1% |
| Health Care | 15.1% |
| Communication Services | 11.8% |
| Industrials | 11.1% |
| Information Technology | 10.3% |
| Consumer Discretionary | 9.1% |
| Energy | 3.9% |
| Real Estate | 2.4% |
| Short-Term Investment | 10.3% |
| Liabilities in Excess of Other Assets | (0.1)% |
| TOTAL | 100.0% |
| * |
The Fund is a diversified fund, but nevertheless has invested a significant portion of its assets in the securities of a small number of issuers, which may cause the Fund’s value to fluctuate more widely than some other diversified funds. As a result of the Fund’s investment approach and the relative price movements of certain Fund holdings, at times the Fund’s holdings profile may approximate a portfolio of securities with percentage weightings typically associated with a non-diversified fund. |
Material Fund Changes During the Period
During the fiscal year ended April 30, 2026, there were no material changes to the Fund.
Changes in and Disagreements with Accountants
There were no changes in and/or disagreements with accountants.