Shareholder Report
Apr. 30, 2026
USD ($)
Holding
What were the Fund costs for the last year?
(Based on a hypothetical $10,000 investment)
| Fund (Class) | Costs of a $10,000 investment | Costs paid as a percentage of a $10,000 investment |
| Polen Growth Fund (Investor Class / POLRX) |
$124 | 1.24% |
Management’s Discussion of Fund Performance
- For the 12 months ended April 30, 2026, the Polen Growth Fund (the “Fund”) underperformed the Russell 1000® Growth Index and the S&P 500® Index.
- Stock selection in the Information Technology sector was the primary detractor from results (largely stemming from Software exposures) and Health Care also presented a headwind. By contrast, selection in Consumer Discretionary and Communication Services was positive.
- As for sector positioning (a residual of bottom-up stock selection), the overweights to Financials and Health Care represented meaningful headwinds to relative performance.
- The top three relative stock detractors (vs. the Russell 1000® Growth Index) were NVIDIA, ServiceNow, and CoStar Group. Positive relative contributors were Microsoft, Costco Wholesale (not owned), and Home Depot (not owned).
Fund Performance
The following is a comparison of the change in value of a $10,000 investment in Polen Growth Fund’s Investor Class vs. the S&P 500® Index and the Russell 1000® Growth Index.
Growth of $ 10,000
For the years April 30, 2016 through April 30, 2026
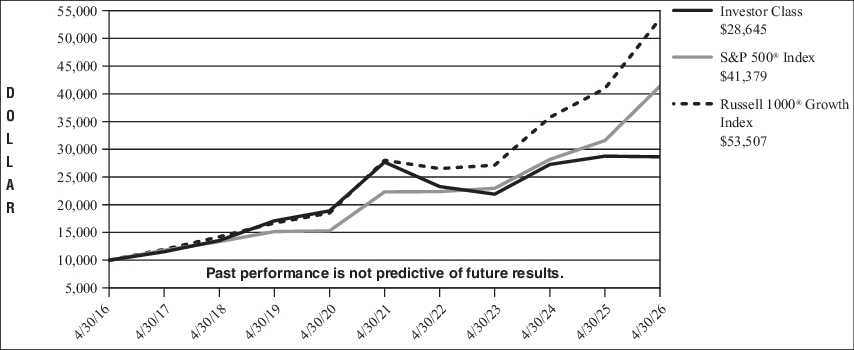
| Average Annual Total Returns | 1 Year | 5 Years | 10 Years |
| Investor Class | -0.39% | 0.69% | 11.10% |
| S&P 500® Index* | 31.05% | 13.14% | 15.26% |
| Russell 1000® Growth Index** | 30.63% | 13.82% | 18.26% |
| * |
The S&P 500® Index is a market capitalization weighted index that measures 500 common equities that are generally representative of the U.S. stock market. The index is maintained by S&P Dow Jones Indices. The performance of an index does not reflect any transaction costs, management fees, or taxes. |
| ** |
The Russell 1000® Growth Index is a market capitalization weighted index that measures the performance of the large-cap growth segment of the U.S. equity universe. It includes Russell 1000® Index companies with higher price-to-book ratios and higher forecasted growth values. The index is maintained by the FTSE Russell, a subsidiary of the London Stock Exchange Group. |
Key Fund Statistics (as of April 30, 2026)
The following table outlines key Fund statistics that you should pay attention to.
| Fund net assets | $2,164,743,098 |
| Total number of portfolio holdings | 27 |
| Total advisory fee paid | $39,354,982 |
| Portfolio turnover rate as of the end of the reporting period | 49% |
Portfolio Holdings Summary Table (as of April 30, 2026)
The following table presents a summary by sector of the portfolio holdings of the Fund, as a percentage of net assets:
Sector Allocation
| Information Technology | 35.4% |
| Financials | 15.8% |
| Health Care | 13.2% |
| Communication Services | 13.1% |
| Consumer Discretionary | 12.1% |
| Industrials | 2.4% |
| Exchange-Traded Funds | 6.2% |
| Short-Term Investment | 2.2% |
| Liabilities in Excess of Other Assets | (0.4)% |
| TOTAL | 100.0% |
Material Fund Changes During the Period
During the fiscal year ended April 30, 2026, there were no material changes to the Fund.
Changes in and Disagreements with Accountants
There were no changes in and/or disagreements with accountants.
What were the Fund costs for the last year?
(Based on a hypothetical $10,000 investment)
| Fund (Class) | Costs of a $10,000 investment | Costs paid as a percentage of a $10,000 investment |
| Polen Growth Fund (Institutional Class / POLIX) |
$99 | 0.99% |
Management’s Discussion of Fund Performance
- For the 12 months ended April 30, 2026, the Polen Growth Fund (the “Fund”) underperformed the Russell 1000® Growth Index and the S&P 500® Index.
- Stock selection in the Information Technology sector was the primary detractor from results (largely stemming from Software exposures) and Health Care also presented a headwind. By contrast, selection in Consumer Discretionary and Communication Services was positive.
- As for sector positioning (a residual of bottom-up stock selection), the overweights to Financials and Health Care represented meaningful headwinds to relative performance.
- The top three relative stock detractors (vs. the Russell 1000® Growth Index) were NVIDIA, ServiceNow, and CoStar Group. Positive relative contributors were Microsoft, Costco Wholesale (not owned), and Home Depot (not owned).
Fund Performance
The following is a comparison of the change in value of a $100,000 investment in Polen Growth Fund’s Institutional Class vs. the S&P 500® Index and the Russell 1000® Growth Index.
Growth of $100,000
For the years April 30, 2016 through April 30, 2026
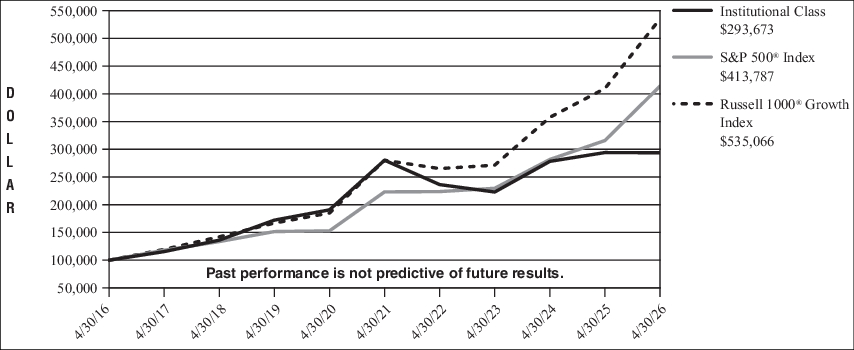
| Average Annual Total Returns | 1 Year | 5 Years | 10 Years |
| Institutional Class | -0.14% | 0.94% | 11.37% |
| S&P 500® Index* | 31.05% | 13.14% | 15.26% |
| Russell 1000® Growth Index** | 30.63% | 13.82% | 18.26% |
| * |
The S&P 500® Index is a market capitalization weighted index that measures 500 common equities that are generally representative of the U.S. stock market. The index is maintained by S&P Dow Jones Indices. The performance of an index does not reflect any transaction costs, management fees, or taxes. |
| ** |
The Russell 1000® Growth Index is a market capitalization weighted index that measures the performance of the large-cap growth segment of the U.S. equity universe. It includes Russell 1000® Index companies with higher price-to-book ratios and higher forecasted growth values. The index is maintained by the FTSE Russell, a subsidiary of the London Stock Exchange Group. |
Key Fund Statistics (as of April 30, 2026)
The following table outlines key Fund statistics that you should pay attention to.
| Fund net assets | $2,164,743,098 |
| Total number of portfolio holdings | 27 |
| Total advisory fee paid | $39,354,982 |
| Portfolio turnover rate as of the end of the reporting period | 49% |
Portfolio Holdings Summary Table (as of April 30, 2026)
The following table presents a summary by sector of the portfolio holdings of the Fund, as a percentage of net assets:
Sector Allocation
| Information Technology | 35.4% |
| Financials | 15.8% |
| Health Care | 13.2% |
| Communication Services | 13.1% |
| Consumer Discretionary | 12.1% |
| Industrials | 2.4% |
| Exchange-Traded Funds | 6.2% |
| Short-Term Investment | 2.2% |
| Liabilities in Excess of Other Assets | (0.4)% |
| TOTAL | 100.0% |
Material Fund Changes During the Period
During the fiscal year ended April 30, 2026, there were no material changes to the Fund.
Changes in and Disagreements with Accountants
There were no changes in and/or disagreements with accountants.
What were the Fund costs for the last year?
(Based on a hypothetical $10,000 investment)
| Fund (Class) | Costs of a $10,000 investment | Costs paid as a percentage of a $10,000 investment |
| Polen Global Growth Fund (Institutional Class / PGIIX) |
$103 | 1.03% |
Management’s Discussion of Fund Performance
- For the 12 months ended April 30, 2026, the Polen Global Growth Fund (the “Fund”) underperformed the MSCI All Country World® Index (“ACWI”)® Index.
- Stock selection in the Information Technology sector was the primary detractor from results (largely stemming from Software exposures), though Financials, Health Care, and Industrials also represented notable headwinds.
- As for sector positioning (a residual of bottom-up stock selection), the overweight to Health Care and underweight to Energy represented meaningful headwinds to relative performance. This was in part offset by the positive impact of being overweight Information Technology and underweight Consumer Staples.
- The top three relative stock detractors (vs. the MSCI ACWI Index) were Paycom Software, CoStar Group, and ServiceNow. Positive relative contributors were Taiwan Semiconductor, Alphabet, and Oracle.
Fund Performance
The following is a comparison of the change in value of a $100,000 investment in Polen Global Growth Fund’s Institutional Class vs. the MSCI All Country World® Index (“ACWI”) (Net Dividend).
Growth of $ 100,000
For the years April 30, 2016 through April 30, 2026
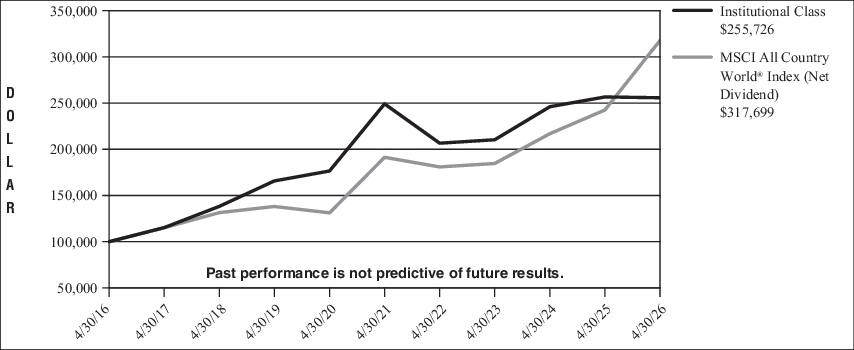
| Average Annual Total Returns | 1 Year | 5 Years | 10 Years |
| Institutional Class | -0.34% | 0.52% | 9.84% |
| MSCI All Country World® Index (“ACWI”) (Net Dividend)* | 31.00% | 10.68% | 12.25% |
| * |
The MSCI ACWI Index is a market capitalization weighted equity index that measures the performance of large and mid-cap segments across developed and emerging market countries. The index is maintained by Morgan Stanley Capital International. The performance of an index does not reflect any transaction costs, management fees, or taxes. |
Key Fund Statistics (as of April 30, 2026)
The following table outlines key Fund statistics that you should pay attention to.
| Fund net assets | $142,170,501 |
| Total number of portfolio holdings | 31 |
| Total advisory fee paid | $2,427,653 |
| Portfolio turnover rate as of the end of the reporting period | 55% |
Portfolio Holdings Summary Table (as of April 30, 2026)
The following table presents a summary by sector of the portfolio holdings of the Fund, as a percentage of net assets:
Sector Allocation
| Information Technology | 31.9% |
| Communication Services | 19.5% |
| Financials | 15.6% |
| Consumer Discretionary | 9.9% |
| Health Care | 7.9% |
| Industrials | 6.7% |
| Consumer, Non-cyclical | 4.5% |
| Exchange-Traded Funds | 3.4% |
| Short-Term Investment | 0.3% |
| Other Assets in Excess of Liabilities | 0.3% |
| TOTAL | 100.0% |
Material Fund Changes During the Period
During the fiscal year ended April 30, 2026, there were no material changes to the Fund.
Changes in and Disagreements with Accountants
There were no changes in and/or disagreements with accountants.
What were the Fund costs for the last year?
(Based on a hypothetical $10,000 investment)
| Fund (Class) | Costs of a $10,000 investment | Costs paid as a percentage of a $10,000 investment |
| Polen Global Growth Fund (Investor Class / PGIRX) |
$128 | 1.28% |
Management’s Discussion of Fund Performance
- For the 12 months ended April 30, 2026, the Polen Global Growth Fund (the “Fund”) underperformed the MSCI All Country World® Index (“ACWI”)® Index.
- Stock selection in the Information Technology sector was the primary detractor from results (largely stemming from Software exposures), though Financials, Health Care, and Industrials also represented notable headwinds.
- As for sector positioning (a residual of bottom-up stock selection), the overweight to Health Care and underweight to Energy represented meaningful headwinds to relative performance. This was in part offset by the positive impact of being overweight Information Technology and underweight Consumer Staples.
- The top three relative stock detractors (vs. the MSCI ACWI Index) were Paycom Software, CoStar Group, and ServiceNow. Positive relative contributors were Taiwan Semiconductor, Alphabet, and Oracle.
Fund Performance
The following is a comparison of the change in value of a $10,000 investment in Polen Global Growth Fund’s Investor Class vs. the MSCI All Country World® Index (“ACWI”) (Net Dividend).
Growth of $ 10,000
For the years April 30, 2016 through April 30, 2026
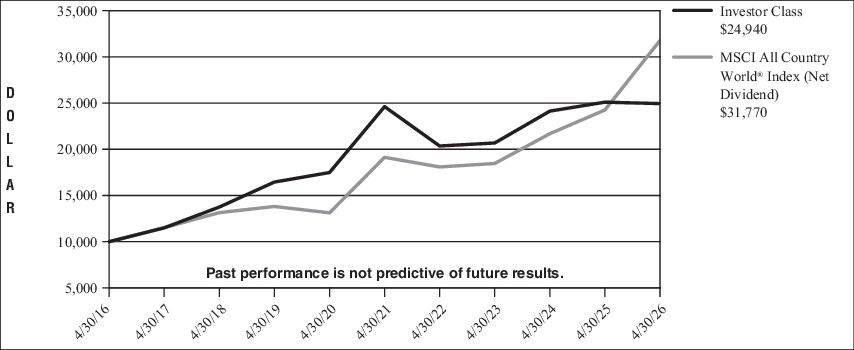
| Average Annual Total Returns | 1 Year | 5 Years | 10 Years |
| Investor Class | -0.62% | 0.26% | 9.57% |
| MSCI All Country World® Index (“ACWI”) (Net Dividend)* | 31.00% | 10.68% | 12.25% |
| * |
The MSCI ACWI Index is a market capitalization weighted equity index that measures the performance of large and mid-cap segments across developed and emerging market countries. The index is maintained by Morgan Stanley Capital International. The performance of an index does not reflect any transaction costs, management fees, or taxes. |
Key Fund Statistics (as of April 30, 2026)
The following table outlines key Fund statistics that you should pay attention to.
| Fund net assets | $142,170,501 |
| Total number of portfolio holdings | 31 |
| Total advisory fee paid | $2,427,653 |
| Portfolio turnover rate as of the end of the reporting period | 55% |
Portfolio Holdings Summary Table (as of April 30, 2026)
The following table presents a summary by sector of the portfolio holdings of the Fund, as a percentage of net assets:
Sector Allocation
| Information Technology | 31.9% |
| Communication Services | 19.5% |
| Financials | 15.6% |
| Consumer Discretionary | 9.9% |
| Health Care | 7.9% |
| Industrials | 6.7% |
| Consumer, Non-cyclical | 4.5% |
| Exchange-Traded Funds | 3.4% |
| Short-Term Investment | 0.3% |
| Other Assets in Excess of Liabilities | 0.3% |
| TOTAL | 100.0% |
Material Fund Changes During the Period
During the fiscal year ended April 30, 2026, there were no material changes to the Fund.
Changes in and Disagreements with Accountants
There were no changes in and/or disagreements with accountants.
What were the Fund costs for the last year?
(Based on a hypothetical $10,000 investment)
| Fund (Class) | Costs of a $10,000 investment | Costs paid as a percentage of a $10,000 investment |
| Polen International Growth Fund (Investor Class / POIRX) |
$127 | 1.35% |
Management’s Discussion of Fund Performance
- For the 12 months ended April 30, 2026, the Polen International Growth Fund (the “Fund”) underperformed the MSCI All Country World® Index (“ACWI”)®ex US Index.
- Stock selection in the Information Technology sector was the primary detractor from results (largely stemming from Software exposures), though Financials, Consumer Discretionary, Health Care, and Industrials also represented notable headwinds.
- As for sector positioning (a residual of bottom-up stock selection), the overweight to Information Technology and to a lesser extent, Consumer Staples, were notable tailwinds for performance. This was modestly offset by the zero exposure to Energy and the overweights to Consumer Discretionary and Health Care.
- The top three relative stock detractors (vs. the MSCI ACWI ex US Index) were SAP, Sage Group, and Monday.com. Positive relative contributors were ASML Holding NV, Tokyo Electron, and ASM International.
Fund Performance
The following is a comparison of the change in value of a $10,000 investment in Polen International Growth Fund’s Investor Class vs. the MSCI All Country World® Index (“ACWI”) (ex-USA) (Net Dividend).
Growth of $ 10,000
For the period March 15, 2017* through April 30, 2026
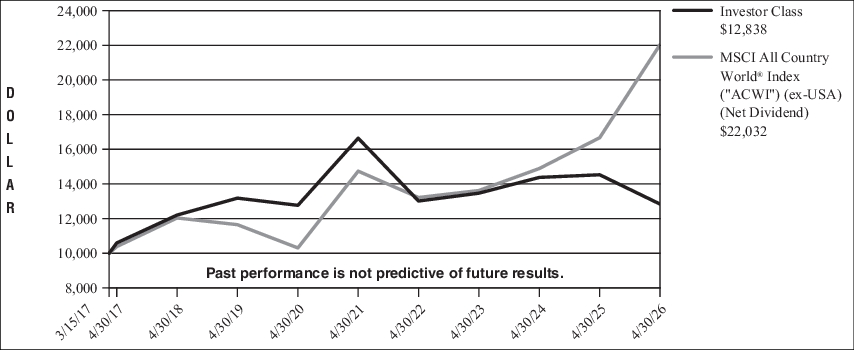
| Average Annual Total Returns | 1 Year | 5 Years | Since inception |
| Investor Class | -11.64% | -5.05% | 2.78%* |
| MSCI All Country World® Index (“ACWI”) (ex-USA) (Net Dividend)** | 32.20% | 8.38% | 9.04%*** |
| * |
The Polen International Growth Fund — Investor Class commenced operations on March 15, 2017. |
| ** |
The MSCI ACWI ex USA Index is a market capitalization weighted equity index that measures the performance of large and mid-cap segments across developed and emerging market countries (excluding the U.S.). The index is maintained by Morgan Stanley Capital International. The performance of an index does not reflect any transaction costs, management fees, or taxes. |
| *** |
Benchmark performance is from the commencement date of the Fund Class only and is not the commencement date of the benchmark itself. |
Key Fund Statistics (as of April 30, 2026)
The following table outlines key Fund statistics that you should pay attention to.
| Fund net assets | $28,950,544 |
| Total number of portfolio holdings | 29 |
| Total advisory fee paid, net | $972,490 |
| Portfolio turnover rate as of the end of the reporting period | 59% |
Portfolio Holdings Summary Table (as of April 30, 2026)
The following table presents a summary by sector of the portfolio holdings of the Fund, as a percentage of net assets:
Sector Allocation
| Information Technology | 35.4% |
| Financials | 14.8% |
| Communication Services | 13.8% |
| Industrials | 12.0% |
| Consumer Discretionary | 7.7% |
| Health Care | 7.5% |
| Consumer, Non-cyclical | 3.3% |
| Short-Term Investment | 2.4% |
| Other Assets in Excess of Liabilities | 3.1% |
| TOTAL | 100.0% |
Material Fund Changes During the Period
During the fiscal year ended April 30, 2026, there were no material changes to the Fund.
Changes in and Disagreements with Accountants
There were no changes in and/or disagreements with accountants.
What were the Fund costs for the last year?
(Based on a hypothetical $10,000 investment)
| Fund (Class) | Costs of a $10,000 investment | Costs paid as a percentage of a $10,000 investment |
| Polen International Growth Fund (Institutional Class / POIIX) |
$104 | 1.10% |
Management’s Discussion of Fund Performance
- For the 12 months ended April 30, 2026, the Polen International Growth Fund (the “Fund”) underperformed the MSCI All Country World® Index (“ACWI”)®ex US Index.
- Stock selection in the Information Technology sector was the primary detractor from results (largely stemming from Software exposures), though Financials, Consumer Discretionary, Health Care, and Industrials also represented notable headwinds.
- As for sector positioning (a residual of bottom-up stock selection), the overweight to Information Technology and to a lesser extent, Consumer Staples, were notable tailwinds for performance. This was modestly offset by the zero exposure to Energy and the overweights to Consumer Discretionary and Health Care.
- The top three relative stock detractors (vs. the MSCI ACWI ex US Index) were SAP, Sage Group, and Monday.com. Positive relative contributors were ASML Holding NV, Tokyo Electron, and ASM International.
Fund Performance
The following is a comparison of the change in value of a $100,000 investment in Polen International Growth Fund’s Institutional Class vs. the MSCI All Country World® Index (“ACWI”) (ex-USA) (Net Dividend).
Growth of $ 100,000
For the period December 30, 2016* through April 30, 2026
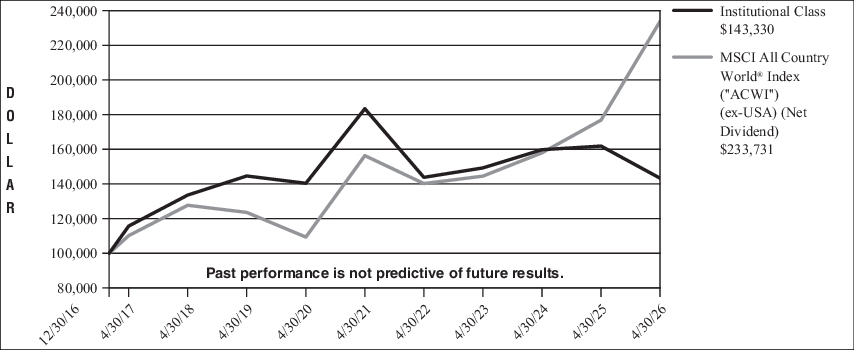
| Average Annual Total Returns | 1 Year | 5 Years | Since inception |
| Institutional Class | -11.44% | -4.81% | 3.93%* |
| MSCI All Country World® Index (“ACWI”) (ex-USA) (Net Dividend)** | 32.20% | 8.38% | 9.53%*** |
| * |
The Polen International Growth Fund — Institutional Class commenced operations on December 30, 2016. |
| ** |
The MSCI ACWI ex USA Index is a market capitalization weighted equity index that measures the performance of large and mid-cap segments across developed and emerging market countries (excluding the U.S.). The index is maintained by Morgan Stanley Capital International. The performance of an index does not reflect any transaction costs, management fees, or taxes. |
| *** |
Benchmark performance is from the commencement date of the Fund Class only and is not the commencement date of the benchmark itself. |
Key Fund Statistics (as of April 30, 2026)
The following table outlines key Fund statistics that you should pay attention to.
| Fund net assets | $28,950,544 |
| Total number of portfolio holdings | 29 |
| Total advisory fee paid, net | $972,490 |
| Portfolio turnover rate as of the end of the reporting period | 59% |
Portfolio Holdings Summary Table (as of April 30, 2026)
The following table presents a summary by sector of the portfolio holdings of the Fund, as a percentage of net assets:
Sector Allocation
| Information Technology | 35.4% |
| Financials | 14.8% |
| Communication Services | 13.8% |
| Industrials | 12.0% |
| Consumer Discretionary | 7.7% |
| Health Care | 7.5% |
| Consumer, Non-cyclical | 3.3% |
| Short-Term Investment | 2.4% |
| Other Assets in Excess of Liabilities | 3.1% |
| TOTAL | 100.0% |
Material Fund Changes During the Period
During the fiscal year ended April 30, 2026, there were no material changes to the Fund.
Changes in and Disagreements with Accountants
There were no changes in and/or disagreements with accountants.
What were the Fund costs for the last year?
(Based on a hypothetical $10,000 investment)
| Fund (Class) | Costs of a $10,000 investment | Costs paid as a percentage of a $10,000 investment |
| Polen 5Perspectives Small Growth Fund (Institutional Class / PBSIX) |
$140 | 1.10% |
Management’s Discussion of Fund Performance
- For the 12 months ended April 30, 2026, the Polen 5Perspectives Small Growth Fund (the “Fund”) outperformed the Russell 2000® Growth Index.
- Stock selection in the Industrials sector was the primary contributor to relative performance, though to a lesser extent Communication Services and Consumer Staples also contributed. By contrast, selection in Financials, Health Care, Consumer Discretionary, and Materials weighed on results.
- As for sector positioning (a residual of bottom-up stock selection), the overweights to Industrials and the underweights to Information Technology, Health Care, and Financials benefitted relative results. The underweight to Energy represented a modest headwind to relative performance.
- The top three relative stock contributors (vs. the Russell 2000® Growth Index) were Bloom Energy, Powell Industries, and Argan. The bottom three relative stock detractors were Figure Technology, Stride, and EXLService Holdings.
Fund Performance
The following is a comparison of the change in value of a $100,000 investment in Polen 5Perspectives Small Growth Fund’s Institutional Class vs. the Russell 3000® Index and the Russell 2000® Growth Index.
Growth of $ 100,000
For the period November 1, 2017* through April 30, 2026
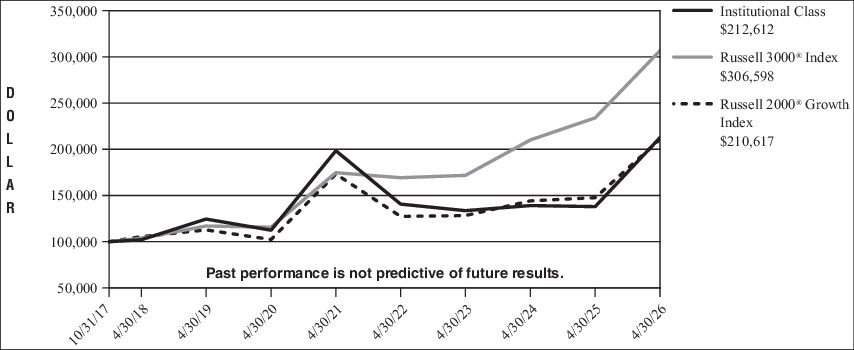
| Average Annual Total Returns | 1 Year | 5 Years | Since inception |
| Institutional Class | 54.12% | 1.39% | 9.28%* |
| Russell 3000® Index** | 31.01% | 11.91% | 14.09%*** |
| Russell 2000® Growth Index**** | 42.64% | 4.00% | 9.16%*** |
| * |
The Polen 5Perspectives Small Growth Fund — Institutional Class commenced operations on November 1, 2017. |
| ** |
The Russell 3000® Index measures the performance of the 3,000 largest U.S. companies based on market capitalization, which represents approximately 98% of the investable U.S. equity market. |
| *** |
Benchmark performance is from the commencement date of the Fund Class only and is not the commencement date of the benchmark itself. |
| **** |
The Russell 2000® Growth Index is a market capitalization weighted index that measures the performance of the small-cap growth segment of the U.S. equity universe. It includes Russell 2000® Index companies with higher price/book ratios and higher forecasted growth values. The index is maintained by the FTSE Russell, a subsidiary of the London Stock Exchange Group. The performance of an index does not reflect any transaction costs, management fees, or taxes. |
Key Fund Statistics (as of April 30, 2026)
The following table outlines key Fund statistics that you should pay attention to.
| Fund net assets | $61,358,067 |
| Total number of portfolio holdings | 86 |
| Total advisory fee paid, net | $163,235 |
| Portfolio turnover rate as of the end of the reporting period | 232% |
Portfolio Holdings Summary Table (as of April 30, 2026)
The following table presents a summary by sector of the portfolio holdings of the Fund, as a percentage of net assets:
Sector Allocation
| Industrials | 38.1% |
| Information Technology | 24.0% |
| Health Care | 15.9% |
| Consumer Discretionary | 9.0% |
| Financials | 4.2% |
| Communication Services | 3.7% |
| Energy | 3.0% |
| Materials | 0.8% |
| Real Estate | 0.7% |
| Short-Term Investment | 1.1% |
| Liabilities in Excess of Other Assets | (0.5)% |
| TOTAL | 100.0% |
Material Fund Changes During the Period
During the fiscal year ended April 30, 2026, there were no material changes to the Fund.
Changes in and Disagreements with Accountants
There were no changes in and/or disagreements with accountants.
What were the Fund costs for the last year?
(Based on a hypothetical $10,000 investment)
| Fund (Class) | Costs of a $10,000 investment | Costs paid as a percentage of a $10,000 investment |
| Polen 5Perspectives Small Growth Fund (Investor Class / PBSRX) |
$171 | 1.35% |
Management’s Discussion of Fund Performance
- For the 12 months ended April 30, 2026, the Polen 5Perspectives Small Growth Fund (the “Fund”) outperformed the Russell 2000® Growth Index.
- Stock selection in the Industrials sector was the primary contributor to relative performance, though to a lesser extent Communication Services and Consumer Staples also contributed. By contrast, selection in Financials, Health Care, Consumer Discretionary, and Materials weighed on results.
- As for sector positioning (a residual of bottom-up stock selection), the overweights to Industrials and the underweights to Information Technology, Health Care, and Financials benefitted relative results. The underweight to Energy represented a modest headwind to relative performance.
- The top three relative stock contributors (vs. the Russell 2000® Growth Index) were Bloom Energy, Powell Industries, and Argan. The bottom three relative stock detractors were Figure Technology, Stride, and EXLService Holdings.
Fund Performance
The following is a comparison of the change in value of a $10,000 investment in Polen 5Perspectives Small Growth Fund’s Investor Class vs. the Russell 3000® Index and the Russell 2000® Growth Index.
Growth of $ 10,000
For the period February 8, 2019* through April 30, 2026
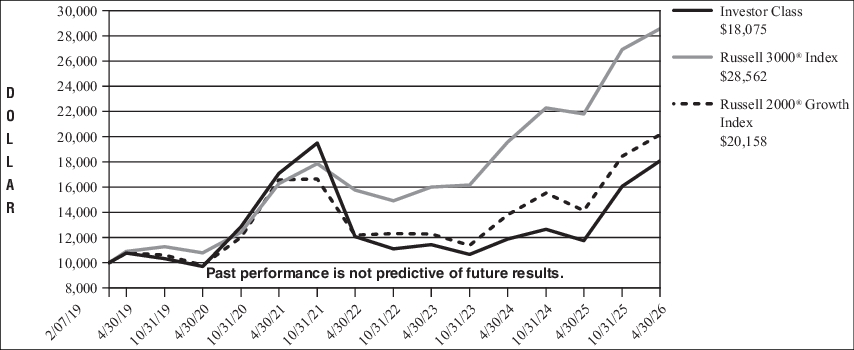
| Average Annual Total Returns | 1 Year | 5 Years | Since inception |
| Investor Class | 53.84% | 1.14% | 8.54%* |
| Russell 3000® Index** | 31.01% | 11.91% | 15.63%*** |
| Russell 2000® Growth Index**** | 42.64% | 4.00% | 10.19%*** |
| * |
The Polen 5Perspectives Small Growth Fund — Investor Class commenced operations on February 8, 2019. |
| ** |
The Russell 3000® Index measures the performance of the 3,000 largest U.S. companies based on market capitalization, which represents approximately 98% of the investable U.S. equity market. |
| *** |
Benchmark performance is from the commencement date of the Fund Class only and is not the commencement date of the benchmark itself. |
| **** |
The Russell 2000® Growth Index is a market capitalization weighted index that measures the performance of the small-cap growth segment of the U.S. equity universe. It includes Russell 2000® Index companies with higher price/book ratios and higher forecasted growth values. The index is maintained by the FTSE Russell, a subsidiary of the London Stock Exchange Group. The performance of an index does not reflect any transaction costs, management fees, or taxes. |
Key Fund Statistics (as of April 30, 2026)
The following table outlines key Fund statistics that you should pay attention to.
| Fund net assets | $61,358,067 |
| Total number of portfolio holdings | 86 |
| Total advisory fee paid, net | $163,235 |
| Portfolio turnover rate as of the end of the reporting period | 232% |
Portfolio Holdings Summary Table (as of April 30, 2026)
The following table presents a summary by sector of the portfolio holdings of the Fund, as a percentage of net assets:
Sector Allocation
| Industrials | 38.1% |
| Information Technology | 24.0% |
| Health Care | 15.9% |
| Consumer Discretionary | 9.0% |
| Financials | 4.2% |
| Communication Services | 3.7% |
| Energy | 3.0% |
| Materials | 0.8% |
| Real Estate | 0.7% |
| Short-Term Investment | 1.1% |
| Liabilities in Excess of Other Assets | (0.5)% |
| TOTAL | 100.0% |
Material Fund Changes During the Period
During the fiscal year ended April 30, 2026, there were no material changes to the Fund.
Changes in and Disagreements with Accountants
There were no changes in and/or disagreements with accountants.
What were the Fund costs for the last year?
(Based on a hypothetical $10,000 investment)
| Fund (Class) | Costs of a $10,000 investment | Costs paid as a percentage of a $10,000 investment |
| Polen 5Perspectives Small Growth Fund (Class Y / PBSYX) |
$127 | 1.00% |
Management’s Discussion of Fund Performance
- For the 12 months ended April 30, 2026, the Polen 5Perspectives Small Growth Fund (the “Fund”) outperformed the Russell 2000® Growth Index.
- Stock selection in the Industrials sector was the primary contributor to relative performance, though to a lesser extent Communication Services and Consumer Staples also contributed. By contrast, selection in Financials, Health Care, Consumer Discretionary, and Materials weighed on results.
- As for sector positioning (a residual of bottom-up stock selection), the overweights to Industrials and the underweights to Information Technology, Health Care, and Financials benefitted relative results. The underweight to Energy represented a modest headwind to relative performance.
- The top three relative stock contributors (vs. the Russell 2000® Growth Index) were Bloom Energy, Powell Industries, and Argan. The bottom three relative stock detractors were Figure Technology, Stride, and EXLService Holdings.
Fund Performance
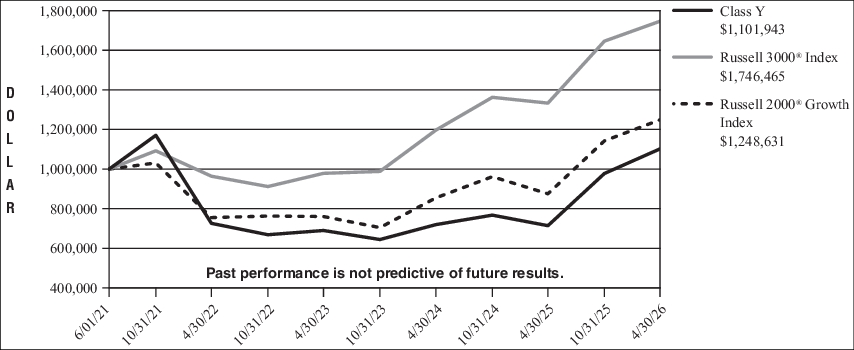
The following is a comparison of the change in value of a $1,000,000 investment in Polen 5Perspectives Small Growth Fund’s Class Y vs. the Russell 3000® Index and the Russell 2000® Growth Index.
Growth of $ 1,000,000
For the period June 1, 2021* through April 30, 2026
| Average Annual Total Returns | 1 Year | Since inception |
| Class Y | 54.29% | 1.99%* |
| Russell 3000® Index** | 31.01% | 12.02%*** |
| Russell 2000® Growth Index**** | 42.64% | 4.62%*** |
| * |
The Polen 5Perspectives Small Growth Fund — Class Y commenced operations on June 1, 2021. |
| ** |
The Russell 3000® Index measures the performance of the 3,000 largest U.S. companies based on market capitalization, which represents approximately 98% of the investable U.S. equity market. |
| *** |
Benchmark performance is from the commencement date of the Fund Class only and is not the commencement date of the benchmark itself. |
| **** |
The Russell 2000® Growth Index is a market capitalization weighted index that measures the performance of the small-cap growth segment of the U.S. equity universe. It includes Russell 2000® Index companies with higher price/book ratios and higher forecasted growth values. The index is maintained by the FTSE Russell, a subsidiary of the London Stock Exchange Group. The performance of an index does not reflect any transaction costs, management fees, or taxes. |
Key Fund Statistics (as of April 30, 2026)
The following table outlines key Fund statistics that you should pay attention to.
| Fund net assets | $61,358,067 |
| Total number of portfolio holdings | 86 |
| Total advisory fee paid, net | $163,235 |
| Portfolio turnover rate as of the end of the reporting period | 232% |
Portfolio Holdings Summary Table (as of April 30, 2026)
The following table presents a summary by sector of the portfolio holdings of the Fund, as a percentage of net assets:
Sector Allocation
| Industrials | 38.1% |
| Information Technology | 24.0% |
| Health Care | 15.9% |
| Consumer Discretionary | 9.0% |
| Financials | 4.2% |
| Communication Services | 3.7% |
| Energy | 3.0% |
| Materials | 0.8% |
| Real Estate | 0.7% |
| Short-Term Investment | 1.1% |
| Liabilities in Excess of Other Assets | (0.5)% |
| TOTAL | 100.0% |
Material Fund Changes During the Period
During the fiscal year ended April 30, 2026, there were no material changes to the Fund.
Changes in and Disagreements with Accountants
There were no changes in and/or disagreements with accountants.
This report describes changes to the Fund that occurred during the reporting period.
What were the Fund costs for the last year?
(Based on a hypothetical $10,000 investment)
| Fund (Class) | Costs of a $10,000 investment | Costs paid as a percentage of a $10,000 investment |
| Polen Emerging Markets Growth Fund (Institutional Class / PGEIX) |
$150 | 1.25% |
Management’s Discussion of Fund Performance
- For the 12 months ending April 30, 2026, the Polen Emerging Markets Growth Fund (the “Fund”) underperformed the MSCI Emerging Markets Index Net Dividends.
- Negative relative performance was driven by the Fund’s underweight and stock selection in Information Technology, which more than offset positive stock selection in Financials.
- The reporting period reflected a rebound in Chinese equities, followed by challenges in the latter part of 2025 stemming from the Fund’s underweight exposure to AI-related companies. Performance strengthened notably at the start of 2026, supported by the closing of this underweight position alongside positive stock selection.
- The top relative stock detractors were SK Hynix, Wizz Air, and TOTVS, while the top relative contributors were Accton Technology, SK Square, and Sanil Electric.
Fund Performance
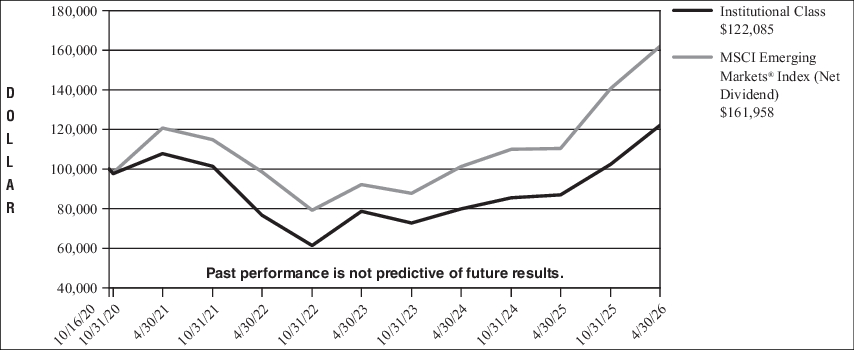
The following is a comparison of the change in value of a $100,000 investment in Polen Emerging Markets Growth Fund’s Institutional Class vs. the MSCI Emerging Markets® Index (Net Dividend).
Growth of $100,000
For the period October 16, 2020* through April 30, 2026
| Average Annual Total Returns | 1 Year | 5 Years | Since inception |
| Institutional Class | 40.37% | 2.52% | 3.67%* |
| MSCI Emerging Markets® Index (Net Dividend)** | 46.68% | 6.05% | 9.10%*** |
| * |
The Polen Emerging Markets Growth Fund — Institutional Class commenced operations on October 16, 2020. |
| ** |
The MSCI Emerging Markets Index is a market capitalization weighted equity index that measures the performance of the large and mid-cap segments across emerging market countries. The index is maintained by Morgan Stanley Capital International. The performance of an index does not reflect any transaction costs, management fees, or taxes. |
| *** |
Benchmark performance is from the commencement date of the Fund Class only and is not the commencement date of the benchmark itself. |
Key Fund Statistics (as of April 30, 2026)
The following table outlines key Fund statistics that you should pay attention to.
| Fund net assets | $4,867,650 |
| Total number of portfolio holdings | 37 |
| Total advisory fee paid, net | $0 |
| Portfolio turnover rate as of the end of the reporting period | 76% |
Portfolio Holdings Summary Table (as of April 30, 2026)
The following table presents a summary by sector of the portfolio holdings of the Fund, as a percentage of net assets:
Sector Allocation
| Information Technology | 44.9% |
| Industrials | 17.8% |
| Financials | 10.7% |
| Consumer Discretionary | 9.2% |
| Communication Services | 6.9% |
| Consumer Staples | 3.2% |
| Health Care | 3.2% |
| Materials | 2.2% |
| Energy | 1.3% |
| Short-Term Investment | 4.5% |
| Liabilities in Excess of Other Assets | (3.9)% |
| TOTAL | 100.0% |
Material Fund Changes During the Period
On June 16, 2026, the Fund’s Board of Trustee approved a plan to liquidate and terminate the Fund, which is expected to occur on or about July 31, 2026.
Changes in and Disagreements with Accountants
There were no changes in and/or disagreements with accountants.
What were the Fund costs for the last year?
(Based on a hypothetical $10,000 investment)
| Fund (Class) | Costs of a $10,000 investment | Costs paid as a percentage of a $10,000 investment |
| Polen Opportunistic High Yield Fund (Institutional Class / DDJCX) |
$91 | 0.89% |
Management’s Discussion of Fund Performance
Summary of Results
Over the trailing twelve-month period ending April 30, 2026, the Polen Opportunistic High Yield Fund’s Institutional share Class (DDJCX) returned 5.52% net of fees versus 7.66% for the ICE BofA U.S. High Yield Index (the “Index”).
Top Contributors to Performance
- Relative performance benefited from the fund’s income advantage and shorter duration amid rising U.S. Treasury yields.
- The Fund’s holdings in the Telecommunications, Retail and Capital Goods sectors.
- The three largest absolute contributors were Dexko Global, Infinite Electronics and Asurion.
- The three largest relative contributors were Dexko Global, Skechers and Infinite Electronics.
Top Detractors to Performance
- The Fund’s overweight to CCC-rated credits and corresponding underweight to BB-rated credits.
- Holdings across the CCC-rated spectrum were the largest detractors.
- The Fund’s underweight in the Energy sector and overweight to the Capital Goods and Technology & Electronics sectors.
- The Fund’s holdings in the Basic Industry, Healthcare, Automotive and Media sectors lagged.
- The three largest absolute detractors were Oldcastle BuildingEnvelope, RealTruck Group and Eyecare Partners.
Fund Performance
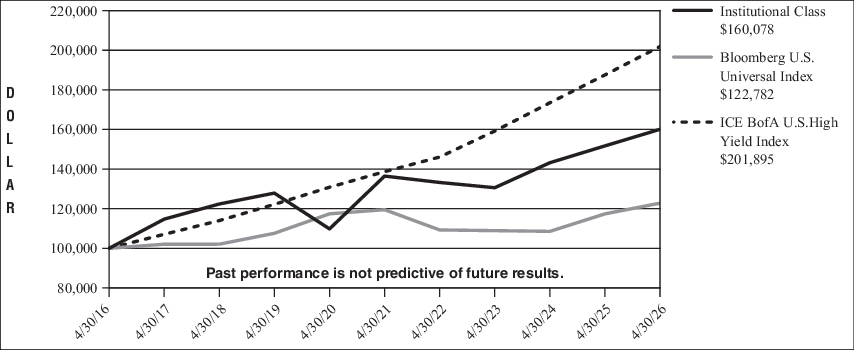
The following is a comparison of the change in value of a $100,000 investment in Polen Opportunistic High Yield Fund’s Institutional Class vs. the Bloomberg U.S. Universal Index and the ICE BofA U.S. High Yield Index.
Growth of $ 100,000
For the years September 30, 2016 through April 30, 2026
| Average Annual Total Returns | 1 Year | 5 Years | 10 Years |
| Institutional Class | 5.52% | 3.24% | 4.82% |
| Bloomberg U.S. Universal Index* | 4.59% | 0.54% | 2.07% |
| ICE BofA U.S. High Yield Index* | 7.66% | 7.80% | 7.28% |
| * |
The ICE BofA U.S. High Yield Index is maintained by ICE Data Indices, LLC and comprised of U.S. dollar denominated, below investment grade corporate debt publicly issued in the U.S. domestic market. The Bloomberg U.S. Universal Index benchmark covers U.S.-dollar denominated, taxable bonds that are rated either investment grade or high-yield. |
Key Fund Statistics (as of April 30, 2026)
The following table outlines key Fund statistics that you should pay attention to.
| Fund net assets | $297,721,322 |
| Total number of portfolio holdings | 135 |
| Total advisory fee paid, net | $2,053,616 |
| Portfolio turnover rate as of the end of the reporting period | 74% |
Portfolio Holdings Summary Table (as of April 30, 2026)
The following table presents a summary by sector of the portfolio holdings of the Fund, as a percentage of net assets:
Sector Allocation
| Consumer, Non-cyclical | 21.6% |
| Consumer, Cyclical | 14.5% |
| Industrials | 12.0% |
| Communication Services | 11.7% |
| Materials | 11.2% |
| Information Technology | 10.4% |
| Financials | 7.0% |
| Energy | 4.8% |
| Consumer Discretionary | 2.6% |
| Asset Backed Securities | 0.9% |
| Health Care | 0.1% |
| Other Assets in Excess of Liabilities | 3.2% |
| TOTAL | 100.0% |
Material Fund Changes During the Period
During the fiscal year ended April 30, 2026, there were no material changes to the Fund.
Changes in and Disagreements with Accountants
There were no changes in and/or disagreements with accountants.
What were the Fund costs for the last year?
(Based on a hypothetical $10,000 investment)
| Fund (Class) | Costs of a $10,000 investment | Costs paid as a percentage of a $10,000 investment |
| Polen Opportunistic High Yield Fund (Investor Class / DDJRX) |
$117 | 1.14% |
Management’s Discussion of Fund Performance
Summary of Results
Over the trailing twelve-month period ending April 30, 2026, the Polen Opportunistic High Yield Fund’s Investor share class (DDJRX) returned 5.16% net of fees versus 7.66% for the ICE BofA U.S. High Yield Index (the “Index”).
Top Contributors to Performance
- Relative performance benefited from the fund’s income advantage and shorter duration amid rising U.S. Treasury yields.
- The Fund’s holdings in the Telecommunications, Retail and Capital Goods sectors.
- The three largest absolute contributors were Dexko Global, Infinite Electronics and Asurion.
- The three largest relative contributors were Dexko Global, Skechers and Infinite Electronics.
Top Detractors to Performance
- The Fund’s overweight to CCC-rated credits and corresponding underweight to BB-rated credits.
- Holdings across the CCC-rated spectrum were the largest detractors.
- The Fund’s underweight in the Energy sector and overweight to the Capital Goods and Technology & Electronics sectors.
- The Fund’s holdings in the Basic Industry, Healthcare, Automotive and Media sectors lagged.
- The three largest absolute detractors were Oldcastle BuildingEnvelope, RealTruck Group and Eyecare Partners.
Fund Performance
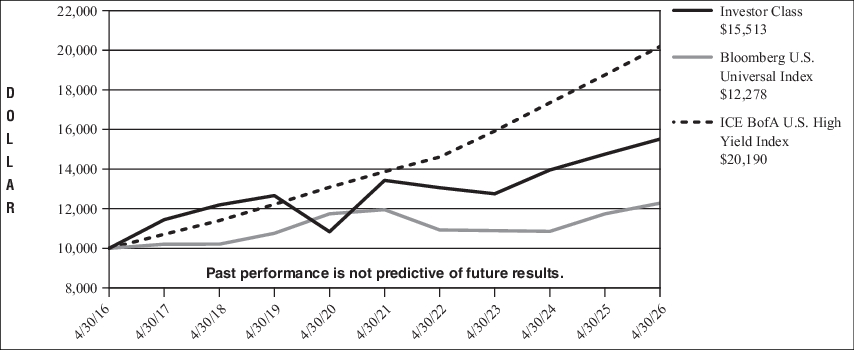
The following is a comparison of the change in value of a $10,000 investment in Polen Opportunistic High Yield Fund’s Investor Class vs. the Bloomberg U.S. Universal Index and the ICE BofA U.S. High Yield Index.
Growth of $ 10,000
For the years September 30, 2016 through April 30, 2026
| Average Annual Total Returns | 1 Year | 5 Years | 10 Years |
| Investor Class | 5.16% | 2.93% | 4.49% |
| Bloomberg U.S. Universal Index* | 4.59% | 0.54% | 2.07% |
| ICE BofA U.S. High Yield Index* | 7.66% | 7.80% | 7.28% |
| * |
The ICE BofA U.S. High Yield Index is maintained by ICE Data Indices, LLC and comprised of U.S. dollar denominated, below investment grade corporate debt publicly issued in the U.S. domestic market. The Bloomberg U.S. Universal Index benchmark covers U.S.-dollar denominated, taxable bonds that are rated either investment grade or high-yield. |
Key Fund Statistics (as of April 30, 2026)
The following table outlines key Fund statistics that you should pay attention to.
| Fund net assets | $297,721,322 |
| Total number of portfolio holdings | 135 |
| Total advisory fee paid, net | $2,053,616 |
| Portfolio turnover rate as of the end of the reporting period | 74% |
Portfolio Holdings Summary Table (as of April 30, 2026)
The following table presents a summary by sector of the portfolio holdings of the Fund, as a percentage of net assets:
Sector Allocation
| Consumer, Non-cyclical | 21.6% |
| Consumer, Cyclical | 14.5% |
| Industrials | 12.0% |
| Communication Services | 11.7% |
| Materials | 11.2% |
| Information Technology | 10.4% |
| Financials | 7.0% |
| Energy | 4.8% |
| Consumer Discretionary | 2.6% |
| Asset Backed Securities | 0.9% |
| Health Care | 0.1% |
| Other Assets in Excess of Liabilities | 3.2% |
| TOTAL | 100.0% |
Material Fund Changes During the Period
During the fiscal year ended April 30, 2026, there were no material changes to the Fund.
Changes in and Disagreements with Accountants
There were no changes in and/or disagreements with accountants.
What were the Fund costs for the last year?
(Based on a hypothetical $10,000 investment)
| Fund (Class) | Costs of a $10,000 investment | Costs paid as a percentage of a $10,000 investment |
| Polen Opportunistic High Yield Fund (Class Y / DDJIX) |
$81 | 0.79% |
Management’s Discussion of Fund Performance
Summary of Results
Over the trailing twelve-month period ending April 30, 2026, the Polen Opportunistic High Yield Fund’s Class Y share class (DDJIX) returned 5.52% net of fees versus 7.66% for the ICE BofA U.S. High Yield Index (the “Index”).
Top Contributors to Performance
- Relative performance benefited from the fund’s income advantage and shorter duration amid rising U.S. Treasury yields.
- The Fund’s holdings in the Telecommunications, Retail and Capital Goods sectors.
- The three largest absolute contributors were Dexko Global, Infinite Electronics and Asurion.
- The three largest relative contributors were Dexko Global, Skechers and Infinite Electronics.
Top Detractors to Performance
- The Fund’s overweight to CCC-rated credits and corresponding underweight to BB-rated credits.
- Holdings across the CCC-rated spectrum were the largest detractors.
- The Fund’s underweight in the Energy sector and overweight to the Capital Goods and Technology & Electronics sectors.
- The Fund’s holdings in the Basic Industry, Healthcare, Automotive and Media sectors lagged.
- The three largest absolute detractors were Oldcastle BuildingEnvelope, RealTruck Group and Eyecare Partners.
Fund Performance
The following is a comparison of the change in value of a $1,000,000 investment in Polen Opportunistic High Yield Fund’s Class Y vs. the Bloomberg U.S. Universal Index and the ICE BofA U.S. High Yield Index.
Growth of $ 1,000,000
For the years September 30, 2016 through April 30, 2026
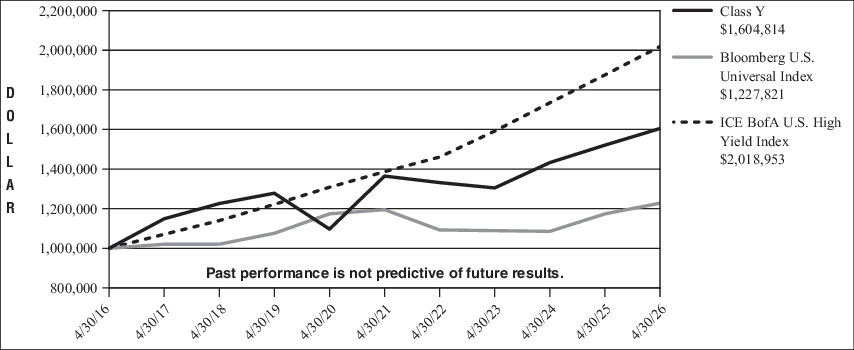
| Average Annual Total Returns | 1 Year | 5 Years | 10 Years |
| Class Y | 5.52% | 3.29% | 4.84% |
| Bloomberg U.S. Universal Index* | 4.59% | 0.54% | 2.07% |
| ICE BofA U.S. High Yield Index* | 7.66% | 7.80% | 7.28% |
| * |
The ICE BofA U.S. High Yield Index is maintained by ICE Data Indices, LLC and comprised of U.S. dollar denominated, below investment grade corporate debt publicly issued in the U.S. domestic market. The Bloomberg U.S. Universal Index benchmark covers U.S.-dollar denominated, taxable bonds that are rated either investment grade or high-yield. |
Key Fund Statistics (as of April 30, 2026)
The following table outlines key Fund statistics that you should pay attention to.
| Fund net assets | $297,721,322 |
| Total number of portfolio holdings | 135 |
| Total advisory fee paid, net | $2,053,616 |
| Portfolio turnover rate as of the end of the reporting period | 74% |
Portfolio Holdings Summary Table (as of April 30, 2026)
The following table presents a summary by sector of the portfolio holdings of the Fund, as a percentage of net assets:
Sector Allocation
| Consumer, Non-cyclical | 21.6% |
| Consumer, Cyclical | 14.5% |
| Industrials | 12.0% |
| Communication Services | 11.7% |
| Materials | 11.2% |
| Information Technology | 10.4% |
| Financials | 7.0% |
| Energy | 4.8% |
| Consumer Discretionary | 2.6% |
| Asset Backed Securities | 0.9% |
| Health Care | 0.1% |
| Other Assets in Excess of Liabilities | 3.2% |
| TOTAL | 100.0% |
Material Fund Changes During the Period
During the fiscal year ended April 30, 2026, there were no material changes to the Fund.
Changes in and Disagreements with Accountants
There were no changes in and/or disagreements with accountants.