Shareholder Report
Apr. 30, 2026
USD ($)
Holding
WHAT WERE THE FUND COSTS FOR THE LAST SIX MONTHS?
(Based on a hypothetical $10,000 investment)
| Fund | Costs of a $10,000 investment | Costs paid as a percentage of a $10,000 investment |
| First Trust Preferred Securities and Income ETF | $42 | 0.84%(1) |
|
(1) |
Annualized. |
KEY FUND STATISTICS (As of April 30, 2026)
| Fund net assets | $6,365,546,025 |
| Total number of portfolio holdings | 259 |
| Portfolio turnover rate | 13% |
WHAT DID THE FUND INVEST IN? (As of April 30, 2026)
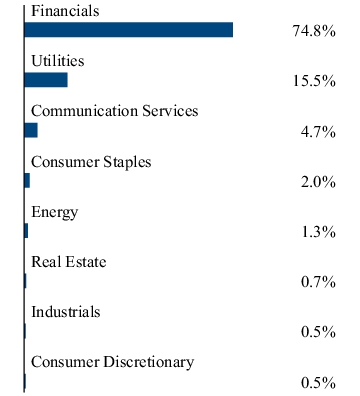
The tables below show the investment makeup of the Fund, representing the percentage of total investments of the Fund.
Top Ten Holdings
| Bank of America Corp., 6.63% | 2.6% |
| Wells Fargo & Co., Series L, 7.50% | 2.1% |
| Barclays PLC, 8.00% | 1.7% |
| NextEra Energy Capital Holdings, Inc., Series U, 6.50%, 06/01/85 | 1.4% |
| JPMorgan Chase & Co., Series NN, 6.88% | 1.4% |
| Xcel Energy, Inc., 6.25%, 10/15/85 | 1.3% |
| Credit Agricole S.A., 7.13% | 1.2% |
| Citigroup, Inc., 6.63% | 1.2% |
| BNP Paribas S.A., 7.20% | 1.1% |
| T-Mobile USA, Inc., 5.50%, 03/01/70 | 1.1% |
Sector Allocation
Top Ten Holdings
| Bank of America Corp., 6.63% | 2.6% |
| Wells Fargo & Co., Series L, 7.50% | 2.1% |
| Barclays PLC, 8.00% | 1.7% |
| NextEra Energy Capital Holdings, Inc., Series U, 6.50%, 06/01/85 | 1.4% |
| JPMorgan Chase & Co., Series NN, 6.88% | 1.4% |
| Xcel Energy, Inc., 6.25%, 10/15/85 | 1.3% |
| Credit Agricole S.A., 7.13% | 1.2% |
| Citigroup, Inc., 6.63% | 1.2% |
| BNP Paribas S.A., 7.20% | 1.1% |
| T-Mobile USA, Inc., 5.50%, 03/01/70 | 1.1% |
This report describes changes to the Fund that occurred during or after the reporting period.
WHAT WERE THE FUND COSTS FOR THE LAST SIX MONTHS?
(Based on a hypothetical $10,000 investment)
| Fund | Costs of a $10,000 investment | Costs paid as a percentage of a $10,000 investment |
| First Trust Managed Municipal ETF | $24 | 0.48%(1) |
|
(1) |
Annualized. |
KEY FUND STATISTICS (As of April 30, 2026)
| Fund net assets | $2,009,807,714 |
| Total number of portfolio holdings | 1,256 |
| Portfolio turnover rate | 9% |
WHAT DID THE FUND INVEST IN? (As of April 30, 2026)
The tables below show the investment makeup of the Fund, representing the percentage of total investments of the Fund.
Sector Allocation
| Hospital | 14.0% |
| Airport | 11.0% |
| Gas | 9.5% |
| Insured | 8.6% |
| Government Obligation Bond - Unlimited Tax | 8.0% |
| Certificates of Participation | 6.2% |
| Dedicated Tax | 5.9% |
| Utility | 5.0% |
| Special Assessment | 4.6% |
| All Other | 27.2% |
Credit Quality (1)
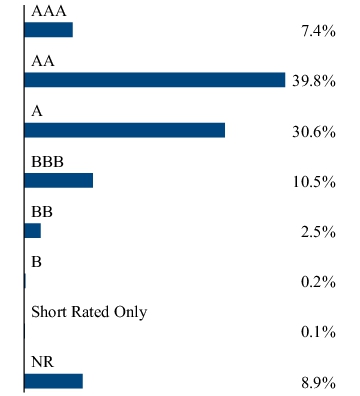
(1) The credit quality and ratings information presented above reflect the ratings assigned by one or more nationally recognized statistical rating organizations (NRSROs), including S&P Global Ratings, Moody’s Investors Service, Inc., Fitch Ratings or a comparably rated NRSRO. For situations in which a security is rated by more than one NRSRO and the ratings are not equivalent, the highest rating is used. Sub-investment grade ratings are those rated BB+/Ba1 or lower. Investment grade ratings are those rated BBB-/Baa3 or higher. “NR” indicates no rating. The credit ratings shown relate to the creditworthiness of the issuers of the underlying securities in the Fund, and not to the Fund or its shares. Credit ratings are subject to change.
HOW HAS THE FUND MATERIALLY CHANGED?
This is a summary of certain changes to the Fund since November 1, 2025. For more complete information, you may review the Fund’s prospectus and any applicable supplements at www.ftportfolios.com/fund-documents/etf/FMB or upon request at 1-800-621-1675 or info@ftportfolios.com.
Effective February 1, 2026, the Board of Trustees has approved a permanent contractual reduction of the annual unitary management fee for the Fund. The annual unitary management fee for the Fund is now 0.39%. Additionally, under the Fund’s new fee structure, the Fund will not be eligible for any breakpoint discounts described in the Fund’s prospectus or statement of additional information.
Effective February 1, 2026, the Board of Trustees has approved a permanent contractual reduction of the annual unitary management fee for the Fund. The annual unitary management fee for the Fund is now 0.39%. Additionally, under the Fund’s new fee structure, the Fund will not be eligible for any breakpoint discounts described in the Fund’s prospectus or statement of additional information.
This is a summary of certain changes to the Fund since November 1, 2025. For more complete information, you may review the Fund’s prospectus and any applicable supplements at www.ftportfolios.com/fund-documents/etf/FMB or upon request at 1-800-621-1675 or info@ftportfolios.com.
WHAT WERE THE FUND COSTS FOR THE LAST SIX MONTHS?
(Based on a hypothetical $10,000 investment)
| Fund | Costs of a $10,000 investment | Costs paid as a percentage of a $10,000 investment |
| First Trust Long/Short Equity ETF | $67 | 1.32%(1) |
|
(1)
|
Annualized.
|
KEY FUND STATISTICS (As of April 30, 2026)
| Fund net assets | $2,295,406,802 |
| Total number of portfolio holdings | 393 |
| Portfolio turnover rate | 118% |
WHAT DID THE FUND INVEST IN? (As of April 30, 2026)
The tables below show the investment makeup of the Fund, representing the percentage of net assets and percentage of total investments, respectively, of the Fund.
Fund Allocation
| Common Stocks | 94.5% |
| Exchange-Traded Funds | 1.9% |
| Money Market Funds | 1.7% |
| Common Stocks Sold Short | (27.1%) |
| Net Other Assets and Liabilities(1) | 29.0% |
| Total | 100.0% |
Sector Allocation
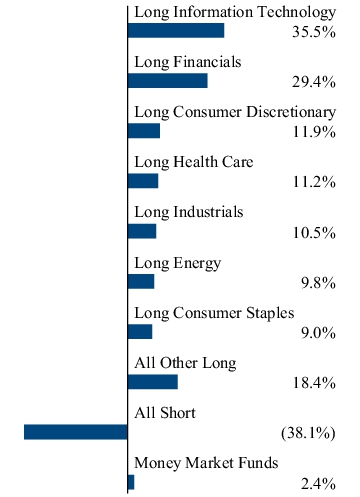
(1) Includes variation margin on futures contracts.
WHAT WERE THE FUND COSTS FOR THE LAST SIX MONTHS?
(Based on a hypothetical $10,000 investment)
| Fund | Costs of a $10,000 investment | Costs paid as a percentage of a $10,000 investment |
| First Trust Emerging Markets Local Currency Bond ETF | $43 | 0.85%(1) |
|
(1) |
Annualized. |
KEY FUND STATISTICS (As of April 30, 2026)
| Fund net assets | $352,924,715 |
| Total number of portfolio holdings | 80 |
| Portfolio turnover rate | 12% |
WHAT DID THE FUND INVEST IN? (As of April 30, 2026)
The tables below show the investment makeup of the Fund, representing the percentage of total investments of the Fund.
Top Ten Holdings
| Malaysia Government Bond, 2.63%, 04/15/31 | 5.3% |
| Indonesia Treasury Bond, 8.38%, 03/15/34 | 4.3% |
| Republic of Poland Government Bond, 6.00%, 10/25/33 | 3.9% |
| Indonesia Treasury Bond, 8.25%, 05/15/36 | 3.5% |
| Indonesia Treasury Bond, 7.00%, 09/15/30 | 3.5% |
| Republic of South Africa Government Bond, 8.25%, 03/31/32 | 3.5% |
| India Government Bond, 7.18%, 07/24/37 | 3.4% |
| Brazil Notas do Tesouro Nacional, Series F, 10.00%, 01/01/35 | 3.4% |
| Bonos de la Tesoreria de la Republica en pesos, 4.70%, 09/01/30 | 3.4% |
| Indonesia Treasury Bond, 9.00%, 03/15/29 | 3.2% |
Credit Quality (1)
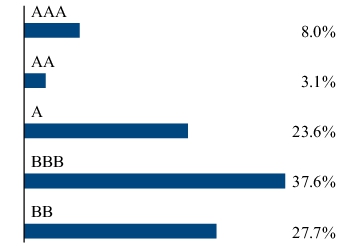
(1) The ratings are by S&P Global Ratings. A credit rating is an assessment provided by a nationally recognized statistical rating organization (NRSRO) of the creditworthiness of an issuer with respect to debt obligations. Ratings are measured on a scale that generally ranges from AAA (highest) to D (lowest). Investment grade is defined as those issuers that have a long-term credit rating of BBB- or higher. “NR” indicates no rating. The credit ratings shown relate to the credit worthiness of the issuers of the underlying securities in the Fund, and not to the Fund or its shares. Credit ratings are subject to change.
Top Ten Holdings
| Malaysia Government Bond, 2.63%, 04/15/31 | 5.3% |
| Indonesia Treasury Bond, 8.38%, 03/15/34 | 4.3% |
| Republic of Poland Government Bond, 6.00%, 10/25/33 | 3.9% |
| Indonesia Treasury Bond, 8.25%, 05/15/36 | 3.5% |
| Indonesia Treasury Bond, 7.00%, 09/15/30 | 3.5% |
| Republic of South Africa Government Bond, 8.25%, 03/31/32 | 3.5% |
| India Government Bond, 7.18%, 07/24/37 | 3.4% |
| Brazil Notas do Tesouro Nacional, Series F, 10.00%, 01/01/35 | 3.4% |
| Bonos de la Tesoreria de la Republica en pesos, 4.70%, 09/01/30 | 3.4% |
| Indonesia Treasury Bond, 9.00%, 03/15/29 | 3.2% |
This report describes changes to the Fund that occurred during or after the reporting period.
WHAT WERE THE FUND COSTS FOR THE LAST SIX MONTHS?
(Based on a hypothetical $10,000 investment)
| Fund | Costs of a $10,000 investment | Costs paid as a percentage of a $10,000 investment |
| First Trust RiverFront Dynamic Developed International ETF | $44 | 0.83%(1) |
|
(1) |
Annualized. |
KEY FUND STATISTICS (As of April 30, 2026)
| Fund net assets | $152,427,930 |
| Total number of portfolio holdings | 149 |
| Portfolio turnover rate | 2% |
WHAT DID THE FUND INVEST IN? (As of April 30, 2026)
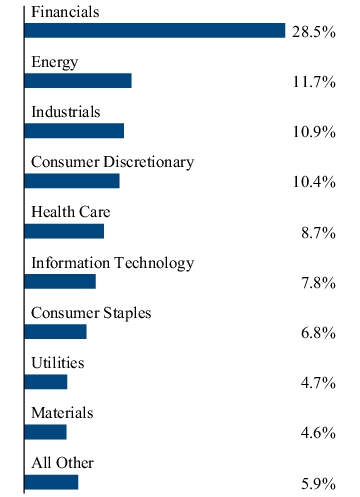
The tables below show the investment makeup of the Fund, representing the percentage of total investments of the Fund.
Top Ten Holdings
| Advantest Corp. | 3.4% |
| HSBC Holdings PLC | 3.1% |
| Shell PLC | 2.3% |
| Novartis AG | 2.1% |
| ASML Holding N.V. | 2.0% |
| TotalEnergies SE | 1.9% |
| ABB Ltd. | 1.9% |
| UBS Group AG | 1.8% |
| Barclays PLC | 1.7% |
| Allianz SE | 1.6% |
Sector Allocation
Top Ten Holdings
| Advantest Corp. | 3.4% |
| HSBC Holdings PLC | 3.1% |
| Shell PLC | 2.3% |
| Novartis AG | 2.1% |
| ASML Holding N.V. | 2.0% |
| TotalEnergies SE | 1.9% |
| ABB Ltd. | 1.9% |
| UBS Group AG | 1.8% |
| Barclays PLC | 1.7% |
| Allianz SE | 1.6% |
HOW HAS THE FUND MATERIALLY CHANGED?
This is a summary of certain changes to the Fund since November 1, 2025. For more complete information, you may review the Fund’s prospectus and any applicable supplements at www.ftportfolios.com/fund-documents/etf/RFDI or upon request at 1-800-621-1675 or info@ftportfolios.com.
The Board of Trustees for the Fund approved a change in the Fund’s name and ticker symbol. This change is expected to become effective on or about August 24, 2026. The Fund’s name will change to “First Trust Active Factor International ETF,” and the Fund’s ticker will change to “AFDM.”
In connection with the change to the Fund’s name, the Fund will adopt a non-fundamental investment policy to invest at least 80% of its net assets (including investment borrowings) in the equity securities of international developed market companies listed and traded on U.S. and non-U.S. exchanges, and will no longer pursue its current dynamic developed international strategy. The Fund will instead seek to follow a multi-factor quantitative methodology to construct a portfolio of securities exhibiting exposure to the value, momentum, quality and low volatility factors. Additionally, the Fund’s annual unitary management fee will be reduced to 0.80% of the Fund’s average daily net assets, the Fund’s portfolio management team will change to members of the First Trust Investment Committee, and the Fund will no longer have a sub-advisor.
The Board of Trustees for the Fund approved a change in the Fund’s name and ticker symbol. This change is expected to become effective on or about August 24, 2026. The Fund’s name will change to “First Trust Active Factor International ETF,” and the Fund’s ticker will change to “AFDM.”
In connection with the change to the Fund’s name, the Fund will adopt a non-fundamental investment policy to invest at least 80% of its net assets (including investment borrowings) in the equity securities of international developed market companies listed and traded on U.S. and non-U.S. exchanges, and will no longer pursue its current dynamic developed international strategy. The Fund will instead seek to follow a multi-factor quantitative methodology to construct a portfolio of securities exhibiting exposure to the value, momentum, quality and low volatility factors. Additionally, the Fund’s annual unitary management fee will be reduced to 0.80% of the Fund’s average daily net assets, the Fund’s portfolio management team will change to members of the First Trust Investment Committee, and the Fund will no longer have a sub-advisor.
This is a summary of certain changes to the Fund since November 1, 2025. For more complete information, you may review the Fund’s prospectus and any applicable supplements at www.ftportfolios.com/fund-documents/etf/RFDI or upon request at 1-800-621-1675 or info@ftportfolios.com.
WHAT WERE THE FUND COSTS FOR THE LAST SIX MONTHS?
(Based on a hypothetical $10,000 investment)
| Fund | Costs of a $10,000 investment | Costs paid as a percentage of a $10,000 investment |
| First Trust RiverFront Dynamic Emerging Markets ETF | $51 | 0.95%(1) |
|
(1) |
Annualized. |
KEY FUND STATISTICS (As of April 30, 2026)
| Fund net assets | $77,642,719 |
| Total number of portfolio holdings | 112 |
| Portfolio turnover rate | 2% |
WHAT DID THE FUND INVEST IN? (As of April 30, 2026)
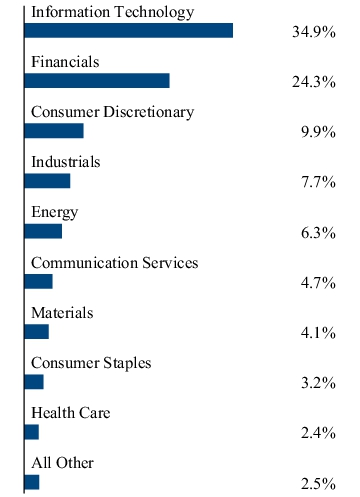
The tables below show the investment makeup of the Fund, representing the percentage of total investments of the Fund.
Top Ten Holdings
| Taiwan Semiconductor Manufacturing Co., Ltd. | 16.1% |
| Unimicron Technology Corp. | 3.8% |
| iShares MSCI China ETF | 3.5% |
| Tencent Holdings Ltd. | 3.5% |
| MediaTek, Inc. | 3.4% |
| Jentech Precision Industrial Co., Ltd. | 2.4% |
| Industrial & Commercial Bank of China Ltd., Class H | 2.2% |
| Alibaba Group Holding Ltd. | 2.1% |
| Global Unichip Corp. | 1.9% |
| International Container Terminal Services, Inc. | 1.9% |
Sector Allocation
Top Ten Holdings
| Taiwan Semiconductor Manufacturing Co., Ltd. | 16.1% |
| Unimicron Technology Corp. | 3.8% |
| iShares MSCI China ETF | 3.5% |
| Tencent Holdings Ltd. | 3.5% |
| MediaTek, Inc. | 3.4% |
| Jentech Precision Industrial Co., Ltd. | 2.4% |
| Industrial & Commercial Bank of China Ltd., Class H | 2.2% |
| Alibaba Group Holding Ltd. | 2.1% |
| Global Unichip Corp. | 1.9% |
| International Container Terminal Services, Inc. | 1.9% |
WHAT WERE THE FUND COSTS FOR THE LAST SIX MONTHS?
(Based on a hypothetical $10,000 investment)
| Fund | Costs of a $10,000 investment | Costs paid as a percentage of a $10,000 investment |
| First Trust Institutional Preferred Securities and Income ETF | $43 | 0.85%(1) |
|
(1) |
Annualized. |
KEY FUND STATISTICS (As of April 30, 2026)
| Fund net assets | $1,888,652,516 |
| Total number of portfolio holdings | 172 |
| Portfolio turnover rate | 14% |
WHAT DID THE FUND INVEST IN? (As of April 30, 2026)
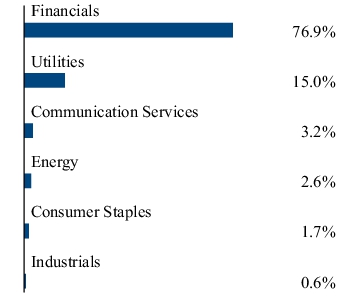
The tables below show the investment makeup of the Fund, representing the percentage of total investments of the Fund.
Top Ten Holdings
| Bank of America Corp., 6.63% | 3.0% |
| Credit Agricole S.A., 7.13% | 1.9% |
| ING Groep N.V., 7.00% | 1.8% |
| Toronto-Dominion Bank (The), 8.13%, 10/31/82 | 1.7% |
| Banco Bilbao Vizcaya Argentaria S.A., 7.75% | 1.7% |
| Citigroup, Inc., 6.63% | 1.7% |
| Enbridge, Inc., 8.50%, 01/15/84 | 1.6% |
| Banco Santander S.A., 9.63% | 1.5% |
| Charles Schwab (The) Corp., Series H, 4.00% | 1.5% |
| Bank of Montreal, 7.70%, 05/26/84 | 1.5% |
Sector Allocation
Top Ten Holdings
| Bank of America Corp., 6.63% | 3.0% |
| Credit Agricole S.A., 7.13% | 1.9% |
| ING Groep N.V., 7.00% | 1.8% |
| Toronto-Dominion Bank (The), 8.13%, 10/31/82 | 1.7% |
| Banco Bilbao Vizcaya Argentaria S.A., 7.75% | 1.7% |
| Citigroup, Inc., 6.63% | 1.7% |
| Enbridge, Inc., 8.50%, 01/15/84 | 1.6% |
| Banco Santander S.A., 9.63% | 1.5% |
| Charles Schwab (The) Corp., Series H, 4.00% | 1.5% |
| Bank of Montreal, 7.70%, 05/26/84 | 1.5% |
| [1] | Annualized. |
| [2] | Annualized. |
| [3] | Annualized. |
| [4] | Annualized. |
| [5] | Annualized. |
| [6] | Annualized. |
| [7] | Annualized. |