Shareholder Report
Apr. 30, 2026
USD ($)
$ / shares
WHAT WERE THE FUND COSTS FOR THE PAST YEAR? (based on a hypothetical $10,000 investment)
|
Fund Name
|
Costs of a $10,000 investment
|
Costs paid as a percentage of a $10,000 investment
|
|
The Acquirers Fund
|
$83
|
0.75%
|
HOW DID THE FUND PERFORM LAST YEAR AND WHAT AFFECTED ITS PERFORMANCE?
During the fiscal year ended April 30, 2026, The Acquirers Fund (ZIG) rose approximately 22.52 percent at NAV. The Fund underperformed the S&P 500 Total Return Index, which gained 31.05 percent over the same period. Market conditions were shaped by two distinct phases: a sharp tariff-driven equity selloff in early April 2025 that compressed valuations across cyclical and value-oriented sectors, followed by a strong recovery through the second half of 2025 as tariff fears subsided, the Federal Reserve cut its policy rate three times (a cumulative 75 basis points to a range of 3.50–3.75 percent), and corporate earnings growth remained robust. The second half saw equity market leadership broaden meaningfully beyond mega-cap technology into industrials, financials, and materials — all sectors where the Fund carried significant exposure. This broadening of market gains, combined with historically wide valuation spreads between cheap and median stocks as measured by the Acquirer’s Multiple®, provided a tailwind for the Fund’s deep-value, mid-cap-tilted portfolio after multiple years of relative headwinds.
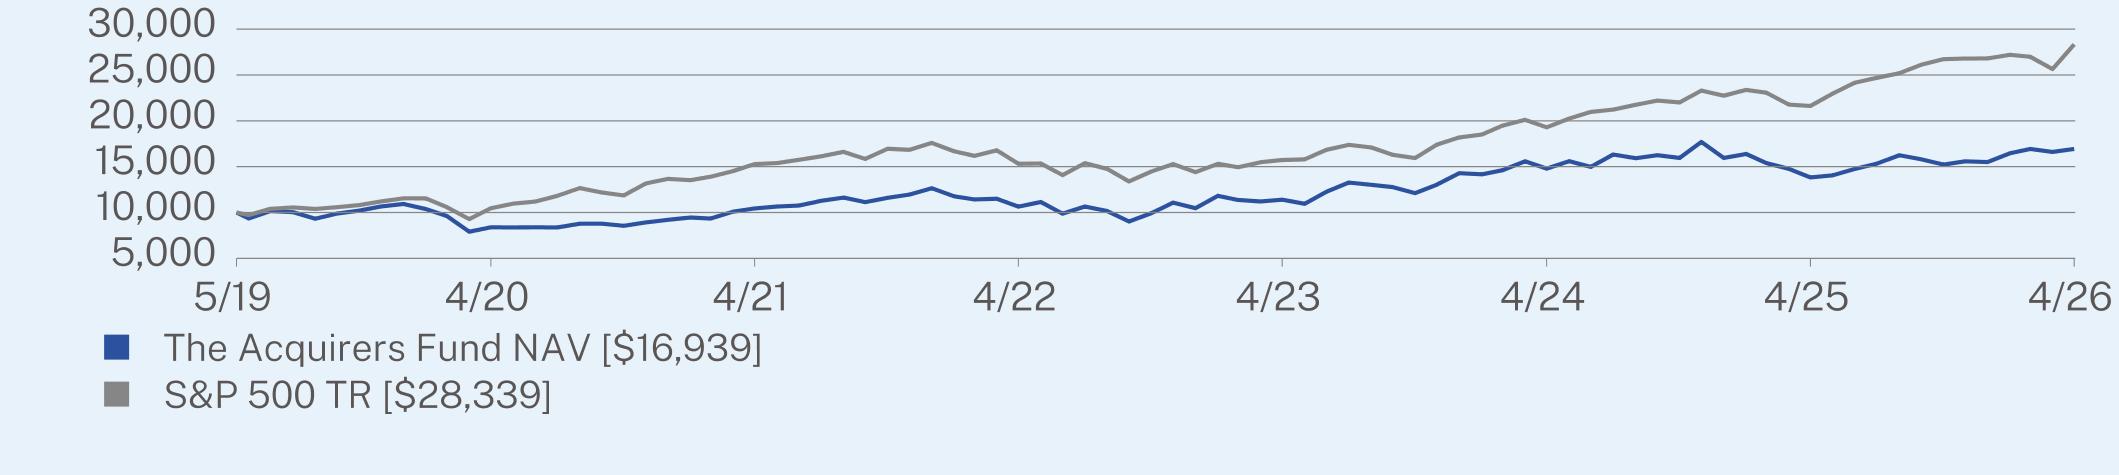
ANNUAL AVERAGE TOTAL RETURN (%)
|
|
1 Year
|
5 Year
|
Since Inception
(05/14/2019) |
|
The Acquirers Fund NAV
|
22.52
|
10.15
|
7.86
|
|
S&P 500 TR
|
31.05
|
13.14
|
16.13
|
Visit https://acquirersfund.com/ for more recent performance information.
KEY FUND STATISTICS (as of April 30, 2026)
|
Net Assets
|
$32,734,043
|
|
Number of Holdings
|
32
|
|
Net Advisory Fee
|
$258,891
|
|
Portfolio Turnover
|
107%
|
WHAT DID THE FUND INVEST IN? (as of April 30, 2026)
|
Top 10 Issuers
|
(% of Net Assets)
|
|
Crocs, Inc.
|
4.3%
|
|
Mueller Industries, Inc.
|
4.0%
|
|
Olin Corp.
|
3.7%
|
|
Synchrony Financial
|
3.7%
|
|
Altria Group, Inc.
|
3.6%
|
|
VeriSign, Inc.
|
3.6%
|
|
Southern Copper Corp.
|
3.5%
|
|
Lantheus Holdings, Inc.
|
3.5%
|
|
California Resources Corp.
|
3.4%
|
|
Artisan Partners Asset Management, Inc.
|
3.3%
|
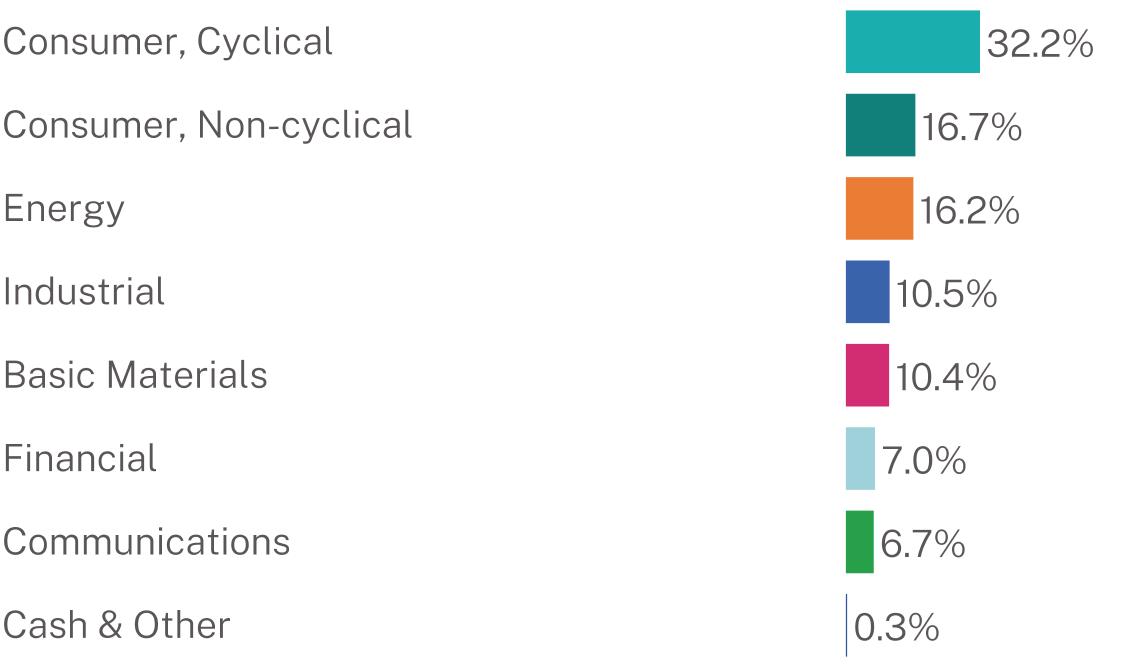
Industry Breakdown (% of Net Assets)