| PURE CYCLE Exhibit 99.2 CORPO:RATION FINANC AL RESULTS Q3-2026 - EARNINGS PRESENTATION Presented By: MARK HARDING |
| PURE CYCLE CORPORATION PAGE 2 FORWARD LOOKING STATEMENT Statements that are not historical tacts contained or incorporated by reference in this presentation are "forward-looking statements" ("FLS"} within the meaning of the Private Securities Litigation Reform Act of 1995, Section 27A of the Securities Act of 1933 and Section 21 C of the Securities Exchange Act of 1934 as amended. FLS involve risks and uncertainties that could cause actual results to differ from projected results. The words "anticipate," "believe,'' "estimate," "expect," "plan," "intend" and similar expressions, as they relate to us, are intended to identify FLS. Such statements reflect our current views with respect to future events and are subject to certain risks, uncertainties and assumptions. We are not able to predict all factors that may affect future results. We cannot assure you that any of our expectations will be realized. Our actual results could differ materially from those discussed in or implied by these forward-looking statements. Factors that may cause actual rnsults to dirffer materially from those contemplated by such FLS include, without limitation: the ri sk factors discussed in our most recent Annual Report on Form 10-K; the timingr of new home construction and other development in the areas where we may sell our water, which in turn may be impacted by credit availability; popt.Jllation growth; employment rates; greneraI1 economic conditions; the market price of water; changes in customer consumption patterns; changes in applicable statutory and regulatory requirements; changes in governmental policies and procedures; uncertainties in the estimation of water available under decrees; uncertainties in the estimation of costs of delivery of water and treatment of wastewater; uncertainties in the estimation of the servi'Ce life of our systems; uncertainties in the estimation of costs of construction projects; uncertainties in the amount and timingr of reimbursable public improvement payments: uncertainty in the single family home rental market and our ability to rent homes in a timely manner or at the amount we project; the strength and financial resources of our competitors; our ability to find and retain skilled personnel; climatic and weather conditions, including flood, droughts and freezing conditions; labor relations; availability and cost of labor, material and equipment; delays in anticipated permit and construction dates; environmental risks and regulations; our ability to raise capital; our ability to negotiate contracts with new customers; and uncertainties in water court rulings; and other factors discussed from time to time in our press releases, public statements and documents filed or furniished with the SEC. |
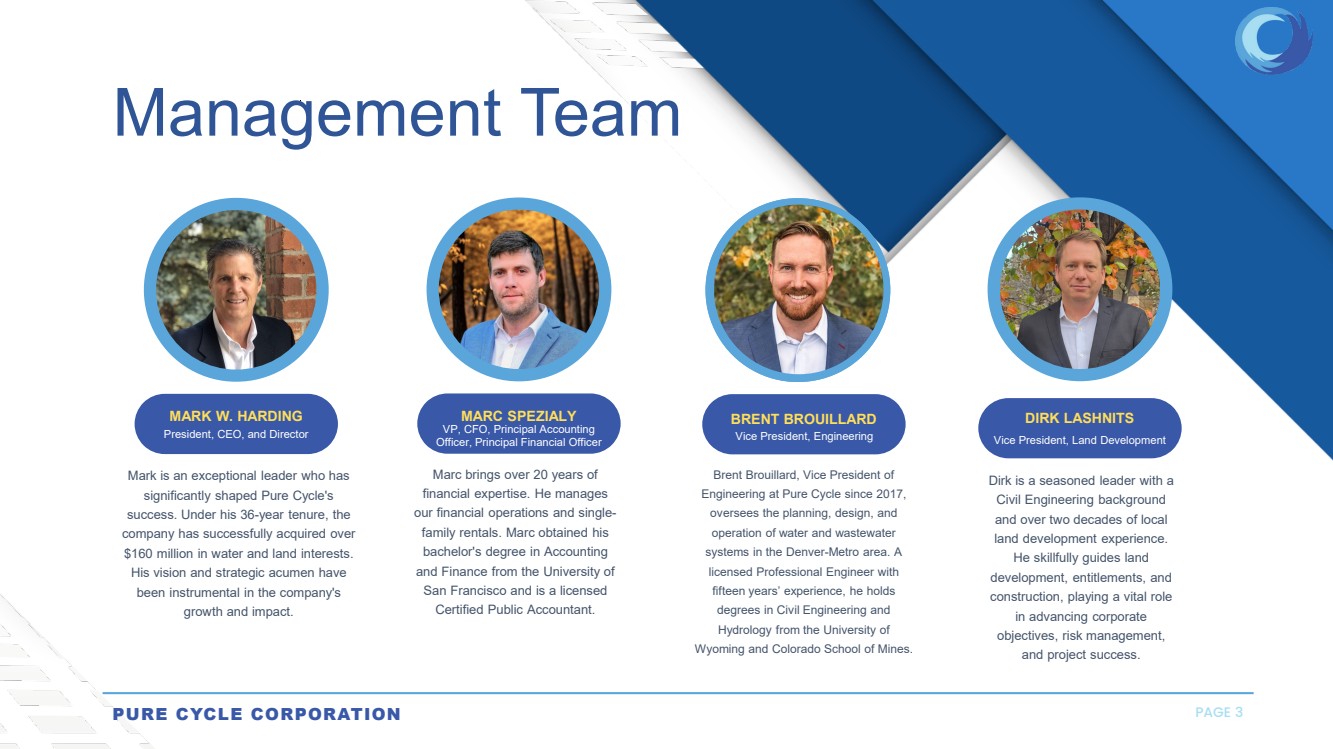
| MARK W. HARDING President, CEO, and Director Mark is an exceptional leader who has significantly shaped Pure Cycle's success. Under his 36-year tenure, the company has successfully acquired over $160 million in water and land interests. His vision and strategic acumen have been instrumental in the company's growth and impact. MARC SPEZIALY VP, CFO, Principal Accounting Officer, Principal Financial Officer Marc brings over 20 years of financial expertise. He manages our financial operations and single-family rentals. Marc obtained his bachelor's degree in Accounting and Finance from the University of San Francisco and is a licensed Certified Public Accountant. BRENT BROUILLARD Vice President, Engineering Brent Brouillard, Vice President of Engineering at Pure Cycle since 2017, oversees the planning, design, and operation of water and wastewater systems in the Denver-Metro area. A licensed Professional Engineer with fifteen years’ experience, he holds degrees in Civil Engineering and Hydrology from the University of Wyoming and Colorado School of Mines. DIRK LASHNITS Vice President, Land Development Dirk is a seasoned leader with a Civil Engineering background and over two decades of local land development experience. He skillfully guides land development, entitlements, and construction, playing a vital role in advancing corporate objectives, risk management, and project success. PURE CYCLE CORPORATION PAGE 3 Management Team |
| PURE CYCLE CORPORATION PAGE 4 BOARD OF DIRECTORS Mark W. Harding Patrick J. Beirne Susan D. Heitmann Wanda J. Abel Frederick A. Fendel III President and CEO Chair of the Board Director and Chair of the Audit Committee Jeffrey G. Sheets Director Director and Chair of the Nominating Director and Governance Committee I I I I I I |
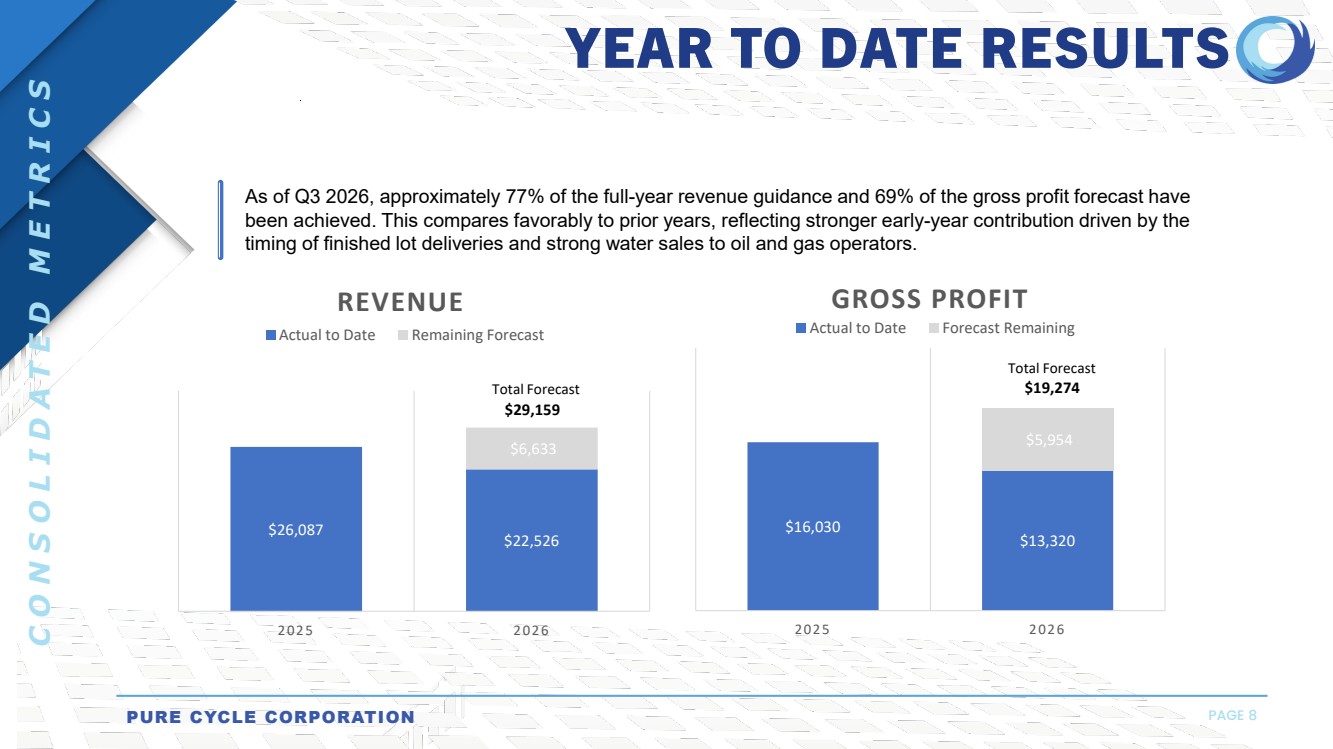
| INVESTMENT SNAPSHOT PURE CYCLE CORPORATION PAGE 5 Pure Cycle has posted net income for seven consecutive years, demonstrating a durable and resilient earnings model. Revenues from water and wastewater utilities, rental income, and service fees underwrite financial predictability. As of Q3 ‘26, $14.6M in cash and restricted cash. $59.1M Note Receivable enabling flexibility in capital allocation decisions. Phases 1 & 2 development of approximately 1,500 lots across multiple years ensures revenue continuity into FY26 and beyond. 28 Straight Profitable Quarters Recurring Revenue Base Sky Ranch Development Visibility Capital Position & Liquidity |
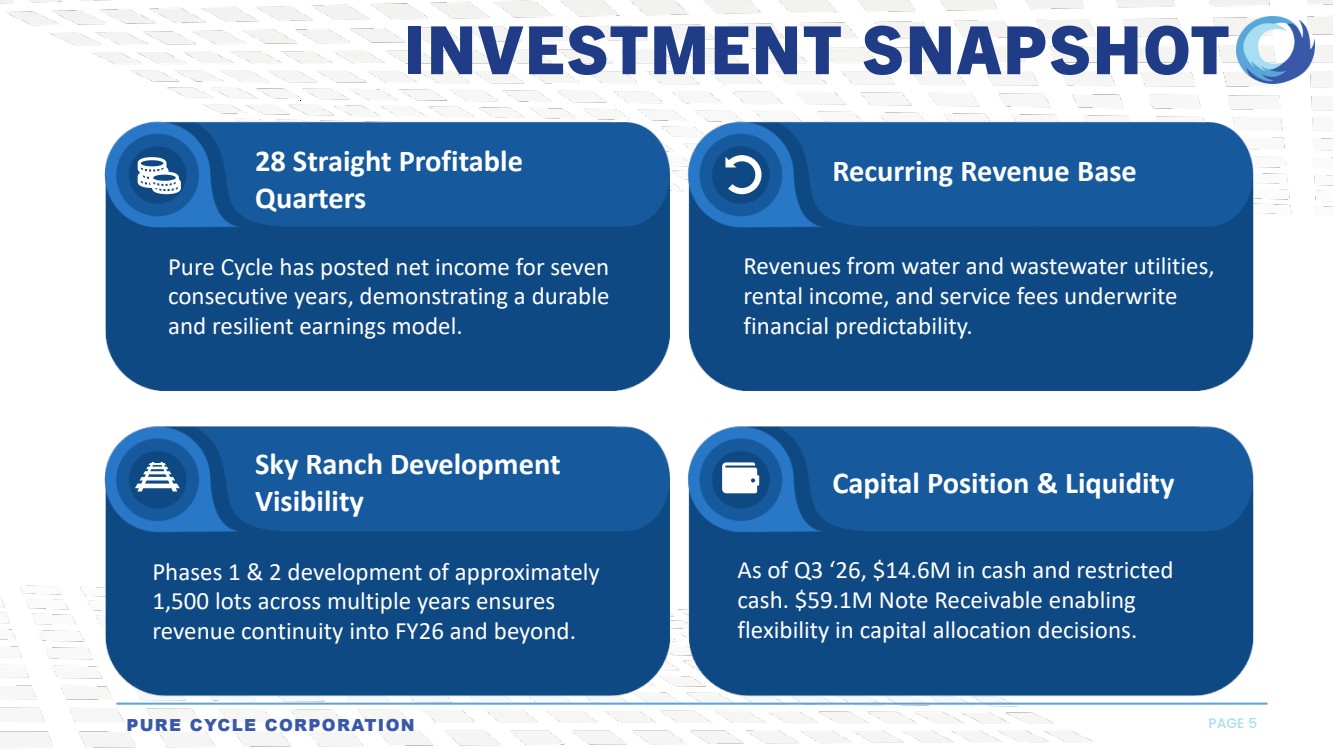
| 3rd Quarter Results PURE CYCLE CORPORATION PAGE 6 CONSOLIDATED METRICS Q3 2026 results reflect higher revenue, driven primarily by an increase in water sales to oil and gas operators and continued land development of Phase 2D. Gross profit was affected by land development costs, which can fluctuate from quarter to quarter based on the types of costs incurred and the percentage of costs eligible for reimbursement. $7,604 $5,140 $8,222 $- $1,000 $2,000 $3,000 $4,000 $5,000 $6,000 $7,000 $8,000 $9,000 Q3 2024 Q3 2025 Q3 2026 QoQ Q3 Revenue Revenue $4,866 $3,257 $4,285 $- $1,000 $2,000 $3,000 $4,000 $5,000 $6,000 Q3 2024 Q3 2025 Q3 2026 QoQ Q3 Gross Profit ■ ■ Gross Profit |
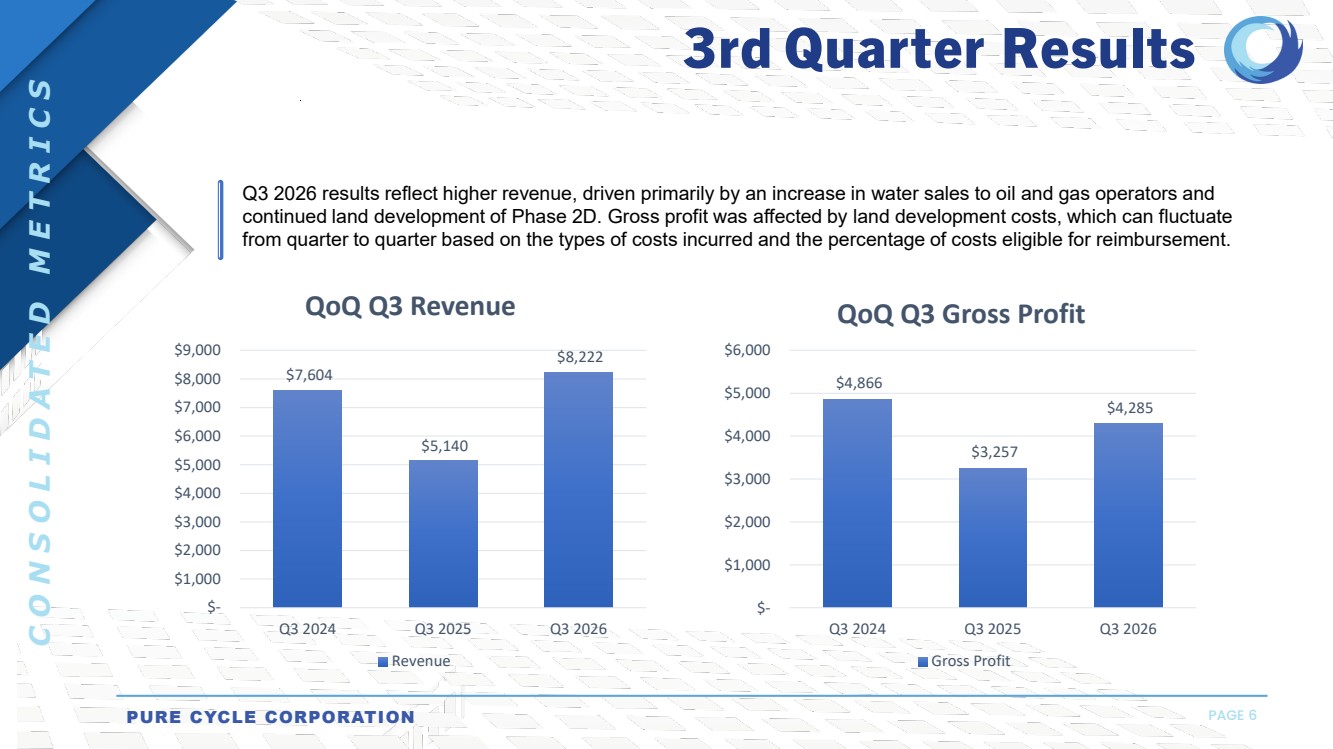
| PURE CYCLE CORPORATION PAGE 7 CONSOLIDATED METRICS Q3 2026 net income increased approximately 31% year over year to $2.9 million, with EPS of $0.12, up from $0.09 in Q3 2025, reflecting higher profitability. $2,825 $2,256 $2,948 $- $500 $1,000 $1,500 $2,000 $2,500 $3,000 $3,500 Q3 2024 Q3 2025 Q3 2026 QoQ Q3 Net Income Net Income $0.12 $0.09 $0.12 $0.00 $0.02 $0.04 $0.06 $0.08 $0.10 $0.12 $0.14 Q3 2024 Q3 2025 Q3 2026 QoQ Q3 EPS EPS 3rd Quarter Results ■ ■ |
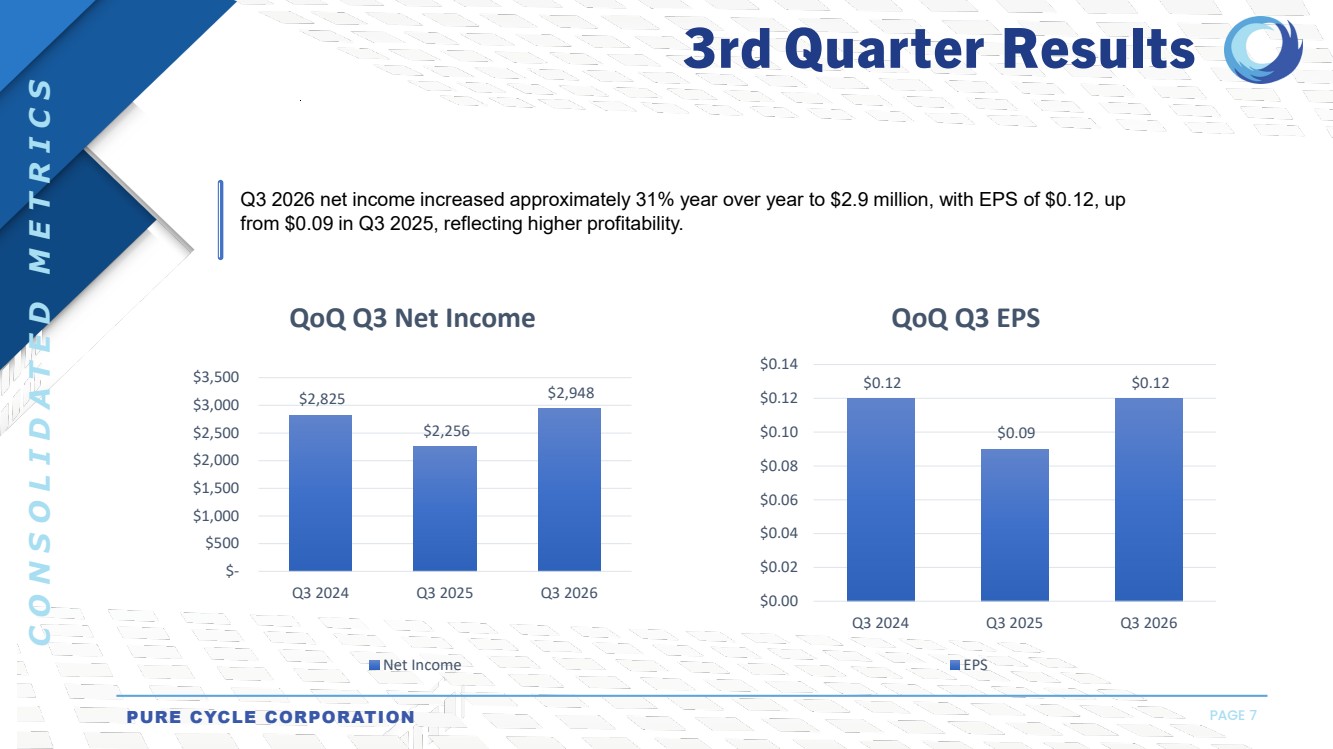
| YEAR TO DATE RESULTS PURE CYCLE CORPORATION PAGE 8 CONSOLIDATED METRICS As of Q3 2026, approximately 77% of the full-year revenue guidance and 69% of the gross profit forecast have been achieved. This compares favorably to prior years, reflecting stronger early-year contribution driven by the timing of finished lot deliveries and strong water sales to oil and gas operators. $26,087 $22,526 $6,633 $29,159 2025 2026 REVENUE Actual to Date Remaining Forecast Total Forecast $16,030 $13,320 $5,954 $19,274 2025 2026 GROSS PROFIT Actual to Date Forecast Remaining Total Forecast ■ ■ ■ ■ |
| YEAR TO DATE RESULTS PURE CYCLE CORPORATION PAGE 9 CONSOLIDATED METRICS As of Q3 2026, approximately 71% of the full-year net income and 71% of the EPS guidance have been achieved, representing a stronger early-year contribution compared to FY 2025, when earnings were more back-half weighted. $13,110 $8,618 $3,586 $12,204 2025 2026 NET INCOME Actual to Date Remaining Forecast Total Forecast $0.54 $0.36 $0.15 $0.51 2025 2026 BASIC EPS Actual to Date Total Total Forecast ■ ■ - - |
| Water Utilities |
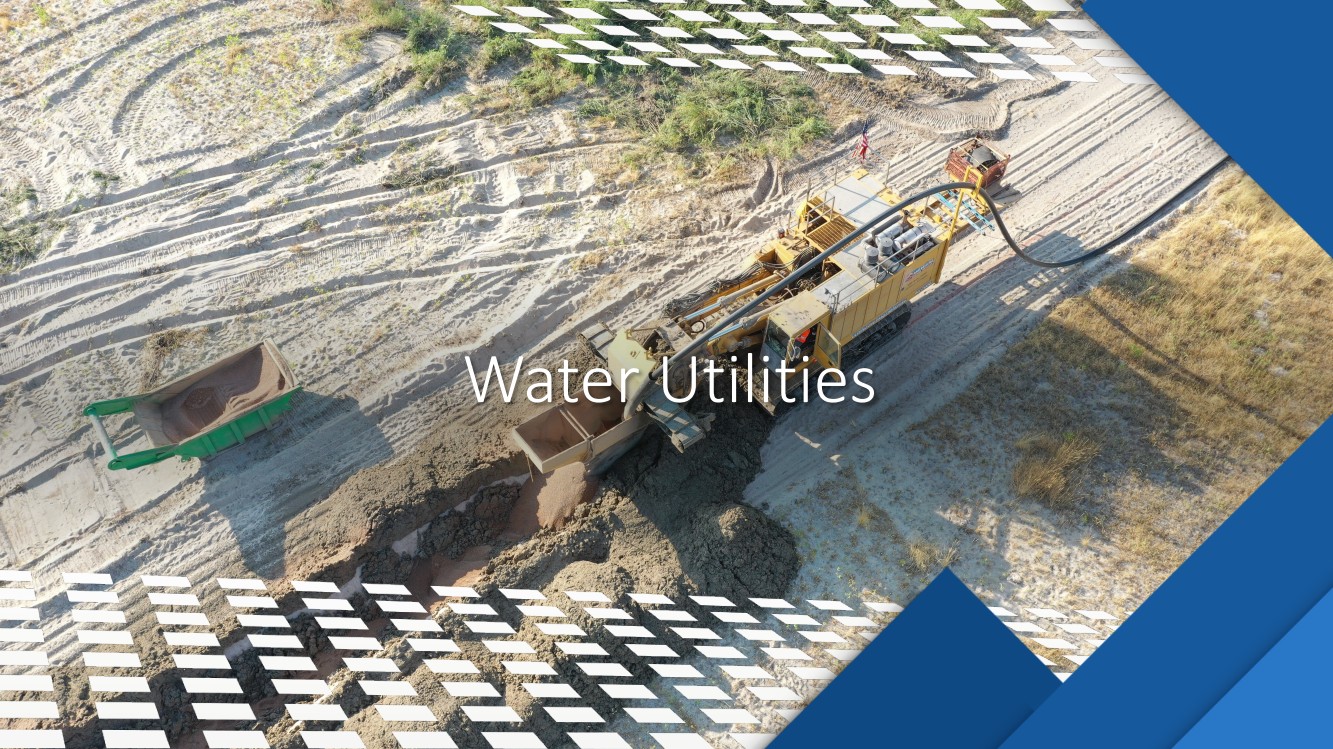
| Base utility fees and service charges add steady income, smoothing quarterly earnings volatility. Industrial water sales to oil & gas operations generate incremental, high-margin income tied to drilling and fracking, further strengthening the return on Pure Cycle’s water assets. Incremental taps deliver high-margin contribution as infrastructure investment outpaced tap connections. WATER & WASTEWATER SEGMENT PERFORMANCE PURE CYCLE CORPORATION PAGE 11 DOMESTIC INDUSTRIAL CONNECTIONS Recurring Utility Revenues Oil & Gas Water Sales Customer Growth |
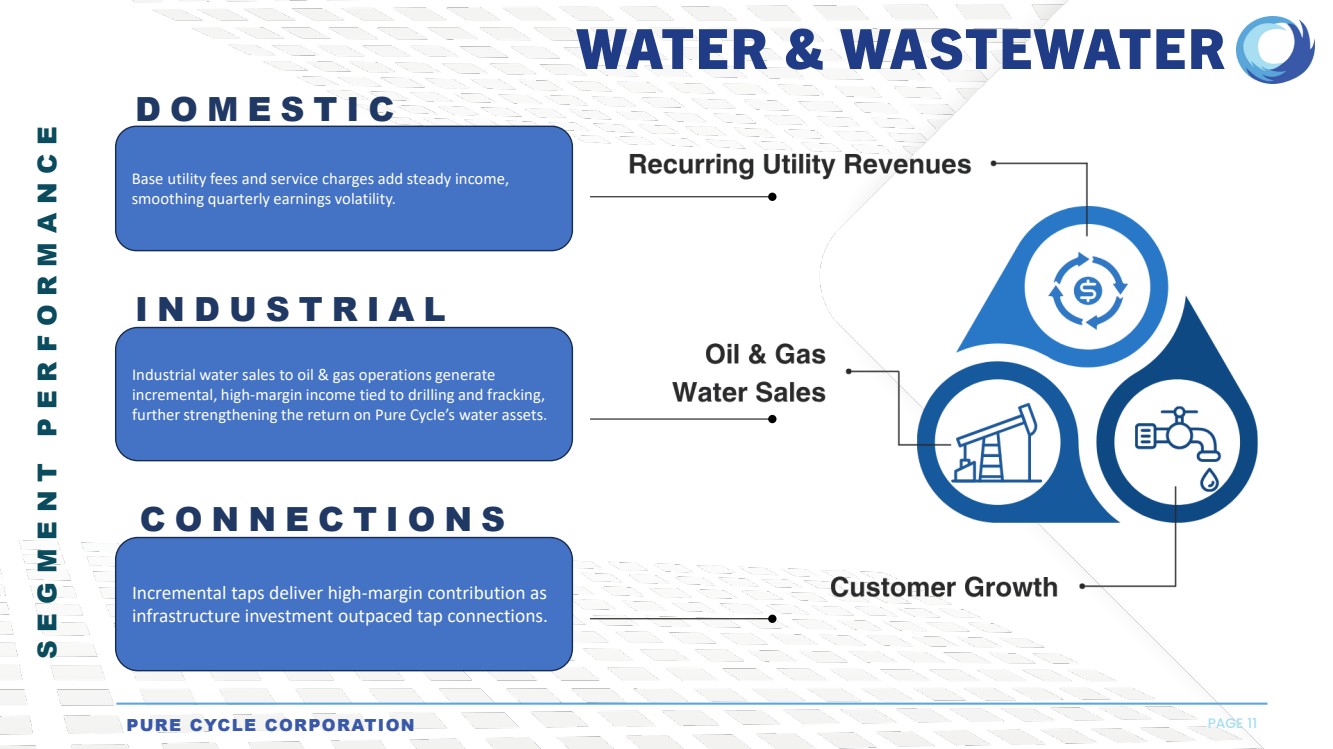
| WATER REVENUE PURE CYCLE CORPORATION PAGE 12 CONSOLIDATED METRICS - 1,000 2,000 3,000 4,000 5,000 FY 2020 FY 2021 FY 2022 FY 2023 FY 2024 FY 2025 FY 2026 FY 2027 FY 2028 FY 2029 FY 2030 WATER UTILITY CUSTOMER GROWTH Actual Projected $992 $1,331 $1,612 $4,770 $897 $2,930 $1,162 $5,292 $5,554 $6,924 $7,520 $10,096 YTD 2024 YTD 2025 YTD 2026 WATER REVENUES BY TYPE (000S) Recurring W/WW O&G Tap Fees 22% Customer CAGR Avg Customer Annual Revenue $1,500 Recurring water and wastewater revenue increased approximately 21% from 9mo 2025 to 9mo 2026, demonstrating consistent growth in the core utility business. Water segment revenues remain strong consisting of tap fee revenue from multiple phases of Sky Ranch being delivered as well as increased demand for Industrial water sales due to drilling in our service area. This combination supports a growing recurring base while capturing near-term value from system expansion. ■ ■ ■ ■ ■ |
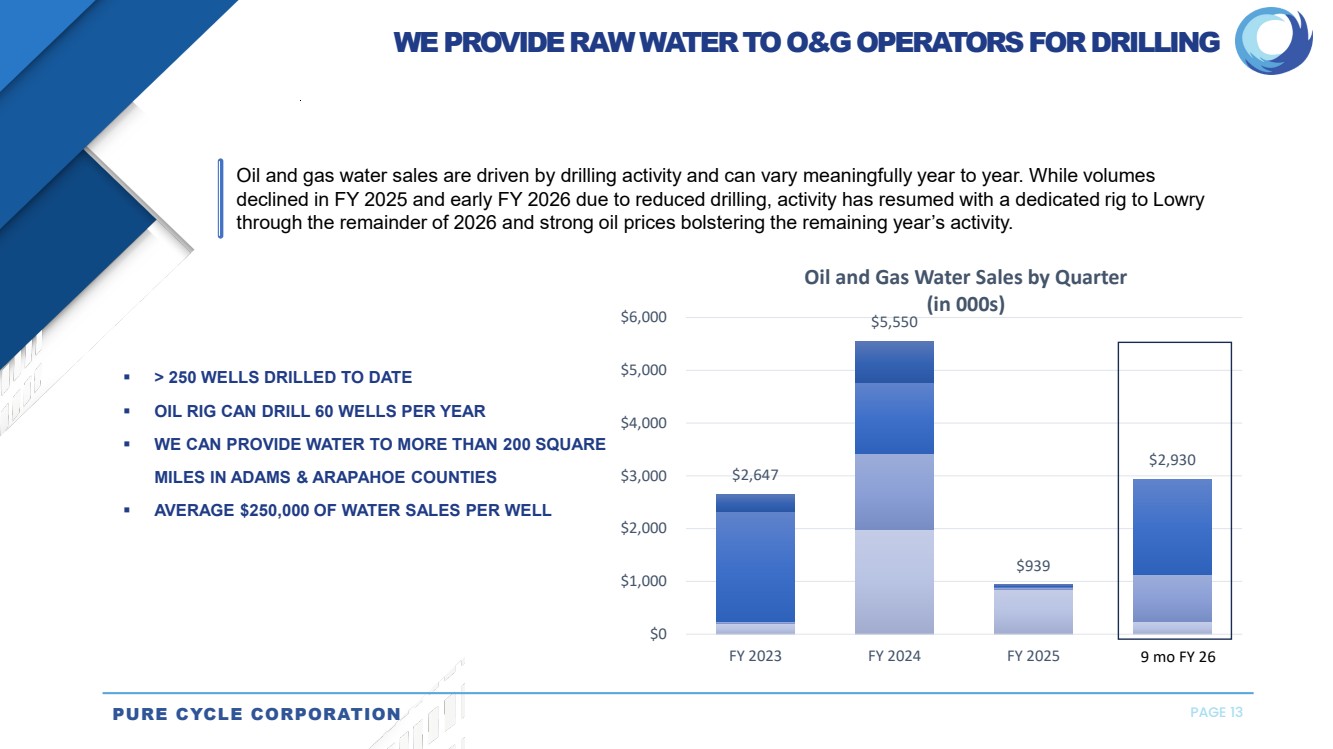
| PURE CYCLE CORPORATION PAGE 13 $2,647 $5,550 $939 $2,930 $0 $1,000 $2,000 $3,000 $4,000 $5,000 $6,000 FY 2023 FY 2024 FY 2025 FY 2026 Oil and Gas Water Sales by Quarter (in 000s) 9 mo FY 26 > 250 WELLS DRILLED TO DATE OIL RIG CAN DRILL 60 WELLS PER YEAR WE CAN PROVIDE WATER TO MORE THAN 200 SQUARE MILES IN ADAMS & ARAPAHOE COUNTIES AVERAGE $250,000 OF WATER SALES PER WELL WE PROVIDE RAW WATER TO O&G OPERATORS FOR DRILLING Oil and gas water sales are driven by drilling activity and can vary meaningfully year to year. While volumes declined in FY 2025 and early FY 2026 due to reduced drilling, activity has resumed with a dedicated rig to Lowry through the remainder of 2026 and strong oil prices bolstering the remaining year’s activity. |
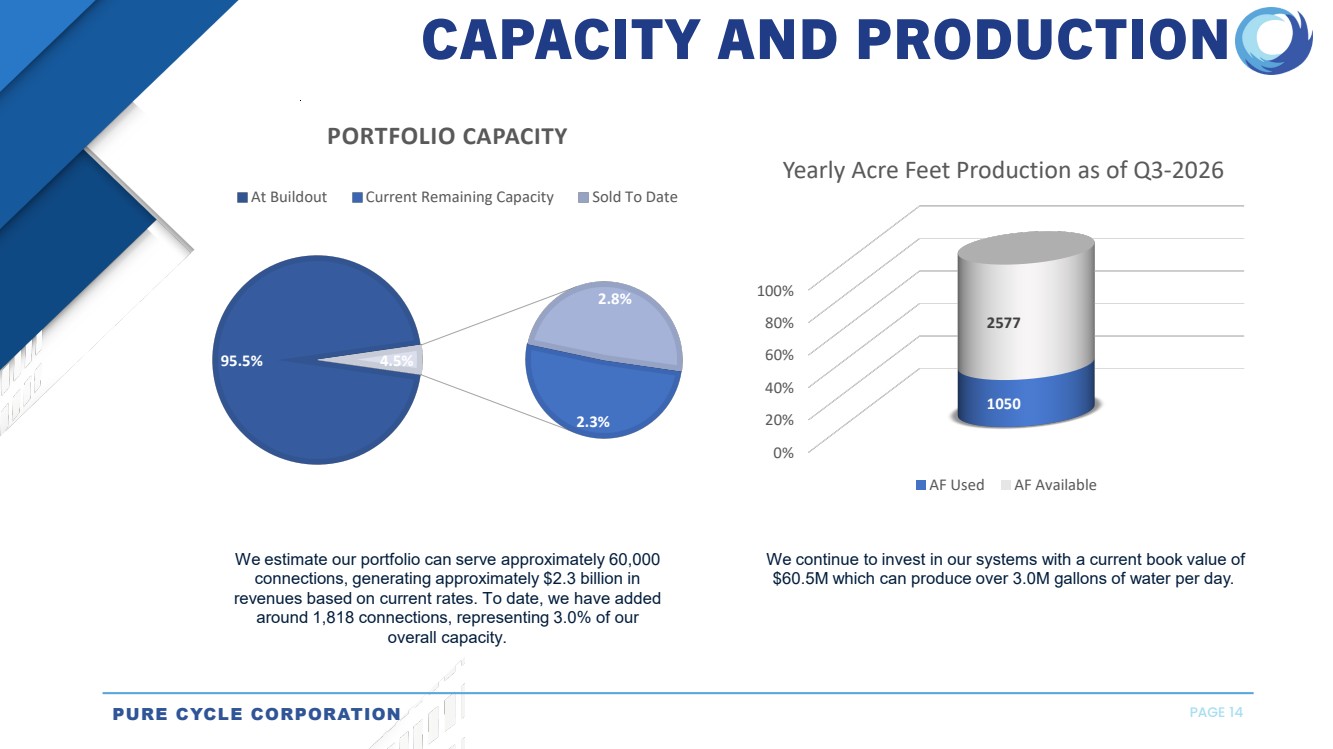
| PURE CYCLE CORPORATION PAGE 14 We continue to invest in our systems with a current book value of $60.5M which can produce over 3.0M gallons of water per day. We estimate our portfolio can serve approximately 60,000 connections, generating approximately $2.3 billion in revenues based on current rates. To date, we have added around 1,818 connections, representing 3.0% of our overall capacity. 95.5% 2.3% 2.8% 4.5% PORTFOLIO CAPACITY At Buildout Current Remaining Capacity Sold To Date CAPACITY AND PRODUCTION 0% 20% 40% 60% 80% 100% 1050 2577 Yearly Acre Feet Production as of Q3-2026 AF Used AF Available ■ ■ , , ,, , , , , _,,/ , , , , ,, ,, , ■ |
| Land Development |
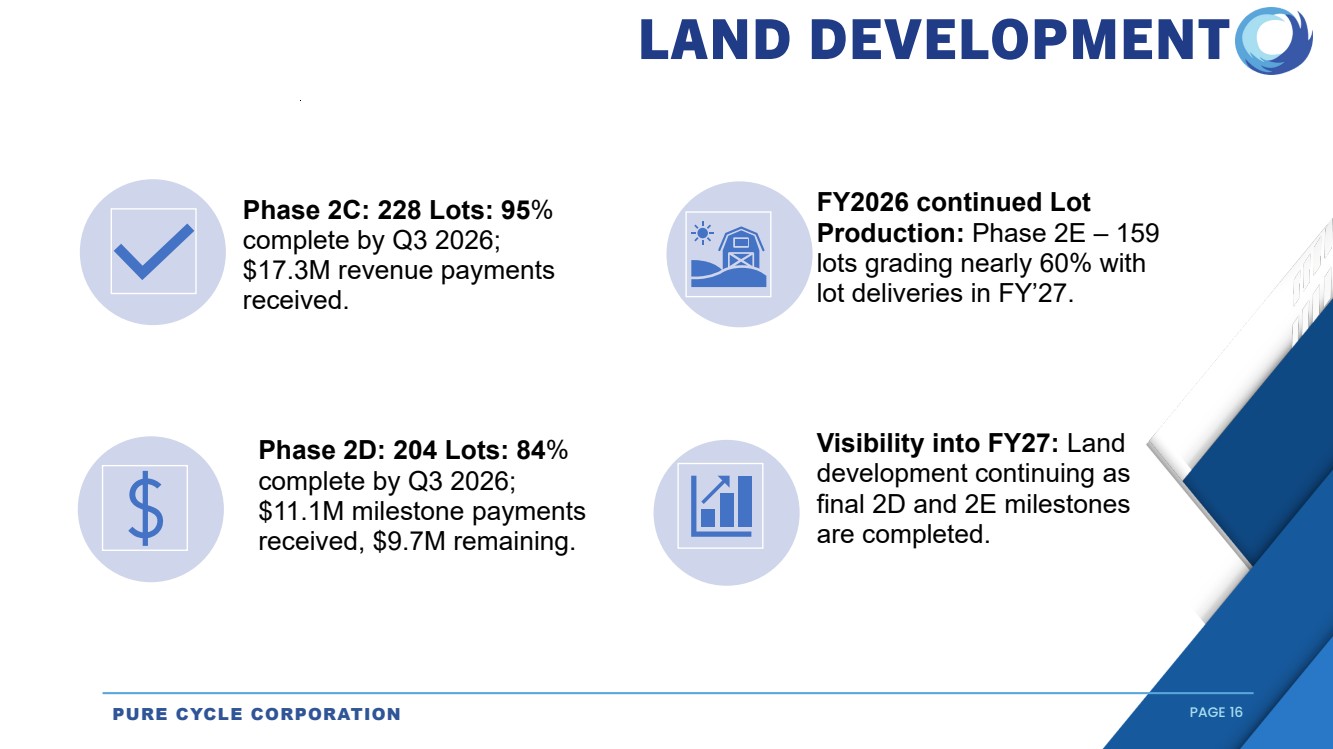
| PURE CYCLE CORPORATION PAGE 16 LAND DEVELOPMENT Phase 2D: 204 Lots: 84% complete by Q3 2026; $11.1M milestone payments received, $9.7M remaining. Visibility into FY27: Land development continuing as final 2D and 2E milestones are completed. FY2026 continued Lot Production: Phase 2E – 159 lots grading nearly 60% with lot deliveries in FY’27. Phase 2C: 228 Lots: 95% complete by Q3 2026; $17.3M revenue payments received. |
| PURE CYCLE CORPORATION PAGE 17 LAND DEVELOPMENT REVENUE $8,906 $6,994 $11,918 $- $2,000 $4,000 $6,000 $8,000 $10,000 $12,000 $14,000 YTD 2024 YTD 2025 YTD 2026 YTD Total Land Development Revenue (000s) $687 $2,150 Lot Revenue Contribution by Phase Q3 2026 (000s) Phase 2B Phase 2C Phase 2D Land development revenue increased significantly in the first 9 months of FY 2026, driven by higher finished lot deliveries. Revenue was primarily generated from Phase 2D, with some landscaping completion in Phase 2C, reflecting the continued progression of Phase 2 development. Period-over-period land development revenue increased to $11.9 million, up materially from prior-year periods due to delivery timing. ■ ■ ■ |
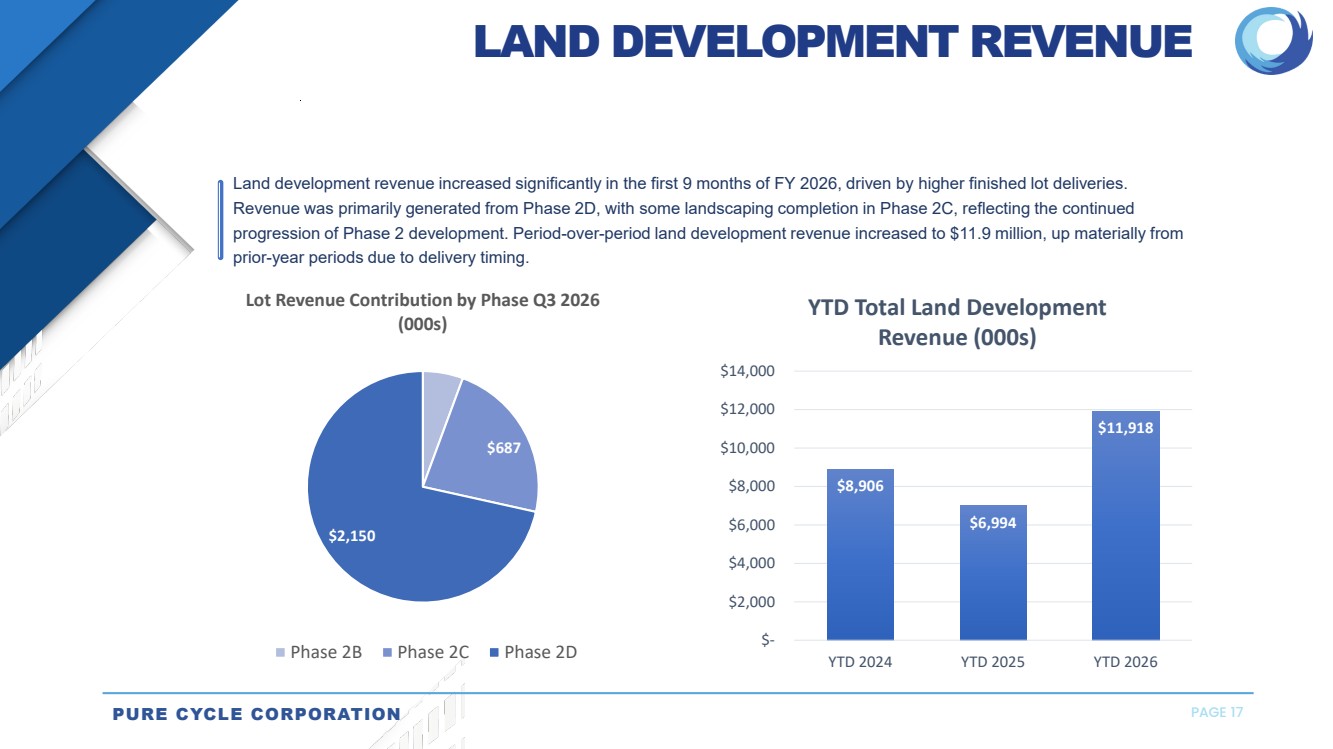
| PAGE 18 Phase 2A & 2B — Complete +$18.4M Lot Revenue +$6.3M Tap Fees +$300K/yr SFR Rents +$343K/yr W/WW Sales ✓ COMPLETE +$17.3M Lot Revenue +$7.3M Tap Fees +$510K/yr SFR Rents +$316K/yr W/WW Sales ✓ COMPLETE PHASE 2A 229 Lots PHASE 2B 211 Lots |
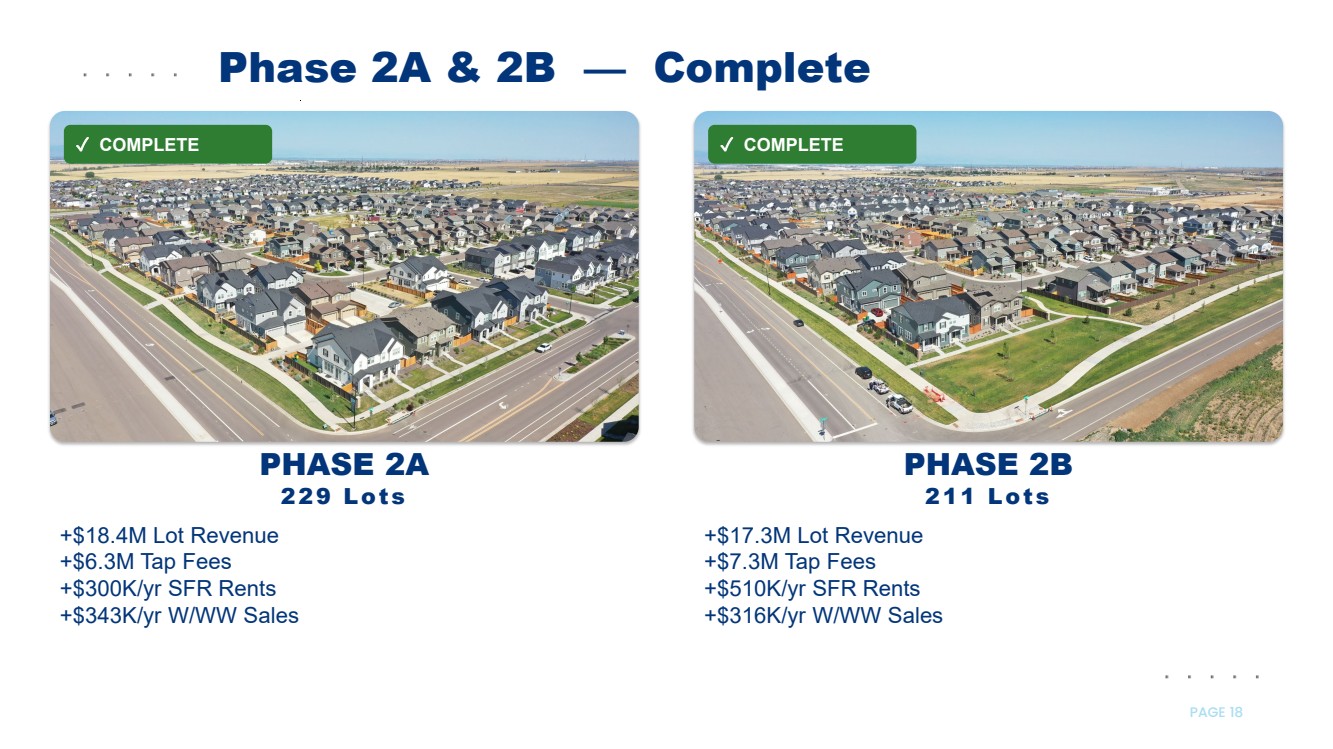
| PAGE 19 +$20.7M Lot Revenue +$8.1M Tap Fees +$60K/yr SFR Rents +$306K/yr W/WW Sales PHASE 2C 228 Lots PHASE 2D 204 Lots +$17.8M Lot Revenue +$8.6M Tap Fees +$870K/yr SFR Rents +$342K/yr W/WW Sales PHASE 2E 159 Lots +$14.0M Lot Revenue +$4.3M Tap Fees No SFR Rents +$240K/yr W/WW Sales Phase 2C, 2D & 2E — In Progress IN PROGRESS IN PROGRESS IN PROGRESS |
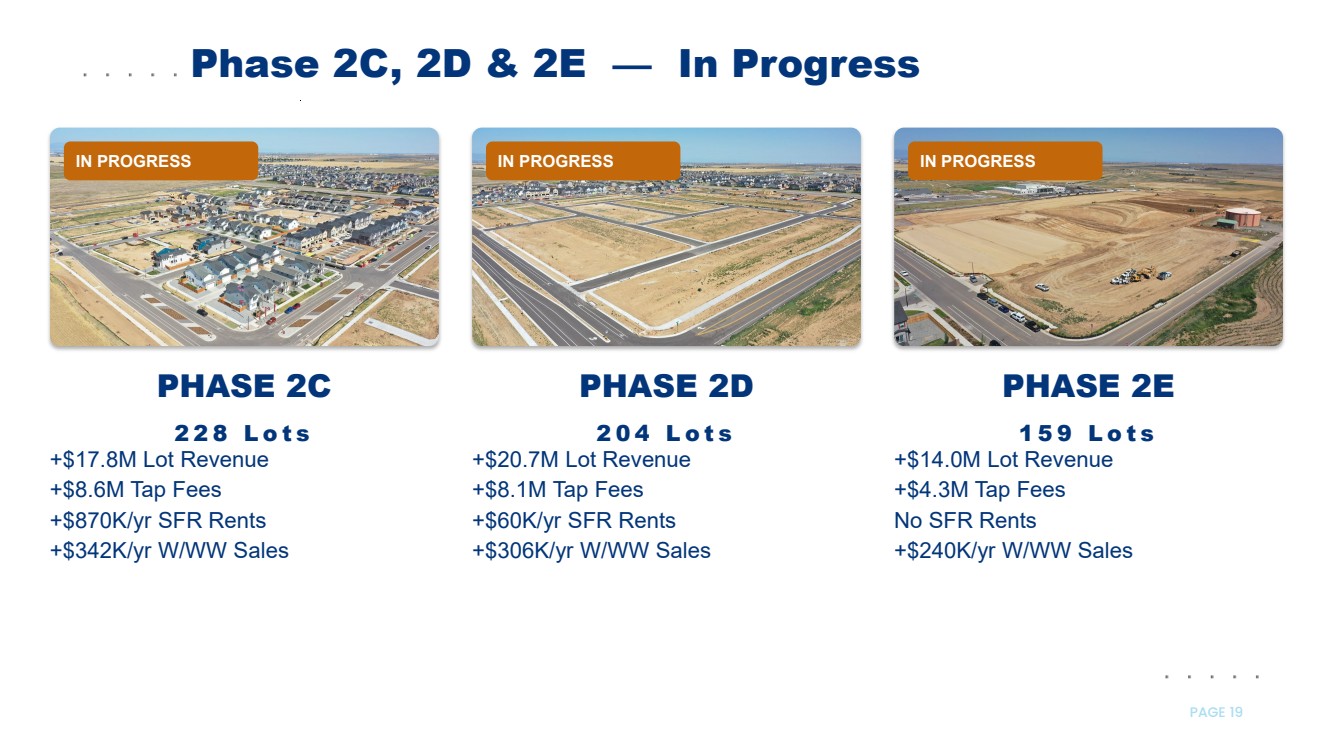
| PURE CYCLE CORPORATION PAGE 20 LAND DEVELOPMENT TIMELINE Our land development continues to advance on schedule across Phases 2C through 2E. Phase 2C is now substantially complete; Phase 2D is well underway, with landscape work beginning in the second half of fiscal 2026; and Phase 2E is finishing up the grading phase, setting up continued lot deliveries through 2027. Fiscal Year 2025 2026 QUARTER Q1 ,Q,2 ,Q3 Q4 Q1 Q2 Q3, ,Q4 Phase 2 C ANISHED Phase 2 D WET I ANISHED (Phase 2 E D |
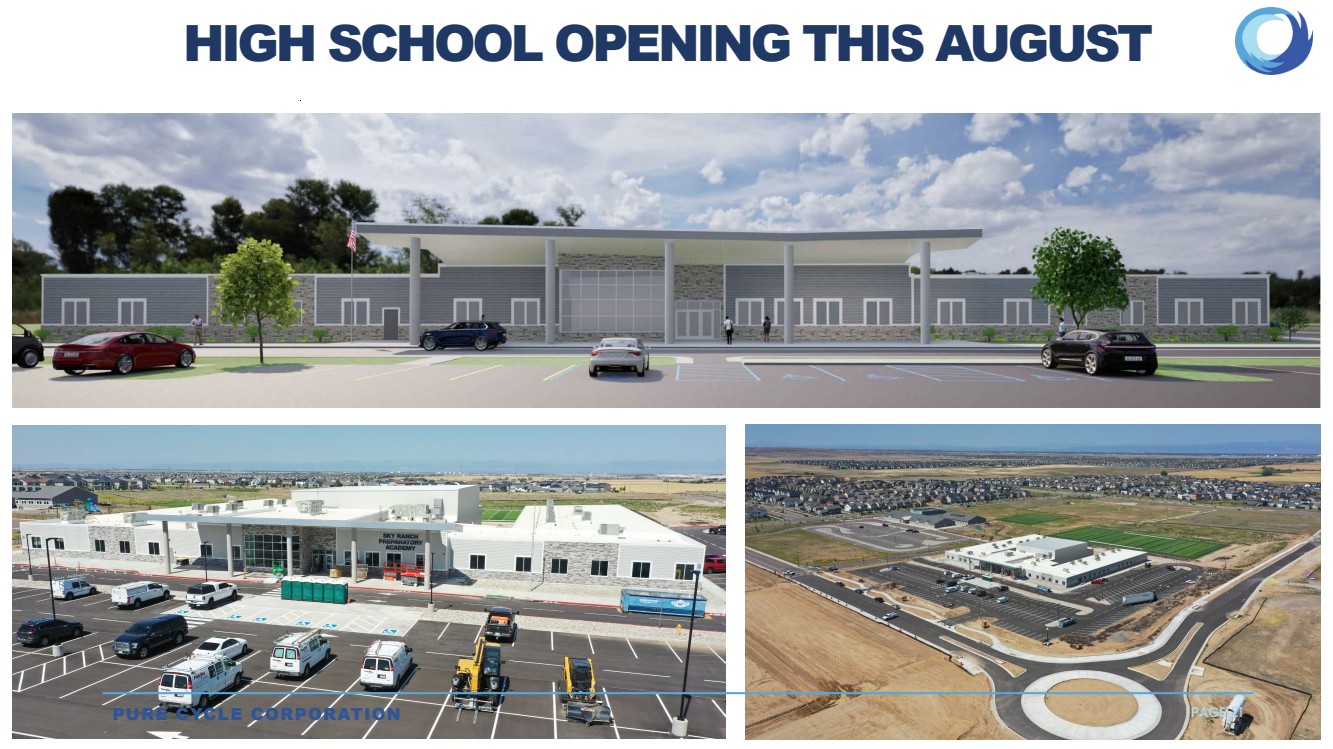
| Pg. 21 HIGH SCHOOL OPENING THIS AUGUST PURE CYCLE CORPORATION PAGE 21 |
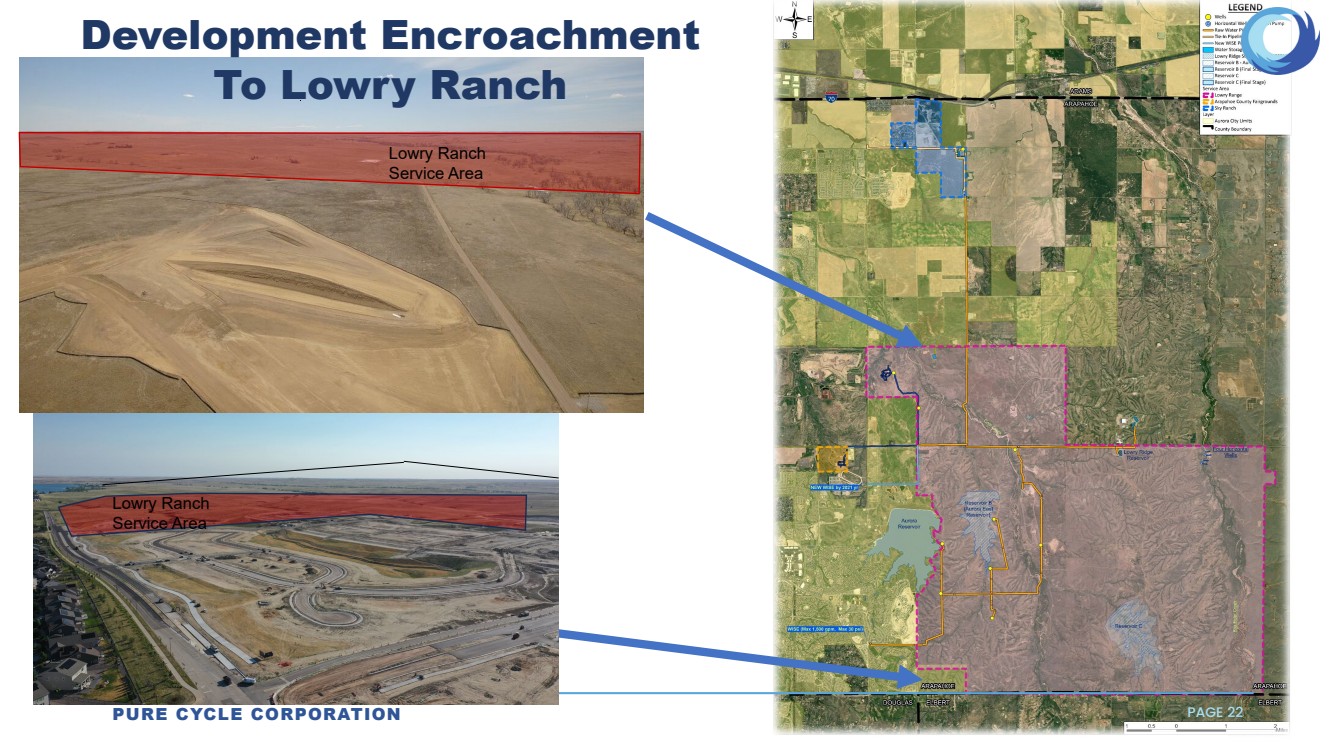
| PURE CYCLE CORPORATION Pg. PAGE 2222 Lowry Ranch Service Area Lowry Ranch Service Area Development Encroachment To Lowry Ranch = Tie•ln Pipeli - NewWISEP ...,, ,--,,~-- WaterStorag ~ Lowry RidgeS [:JReservoirS-Au c=] ReserY<JirS(FinalSt c::J ReservolrC c:J ReserY<JirC(Final Stage) Servlce Afea C' ,I Lowry Range C,IAr.ip.,hoeCountyFairgrounds C'.I SkvRanch ~ ... , |
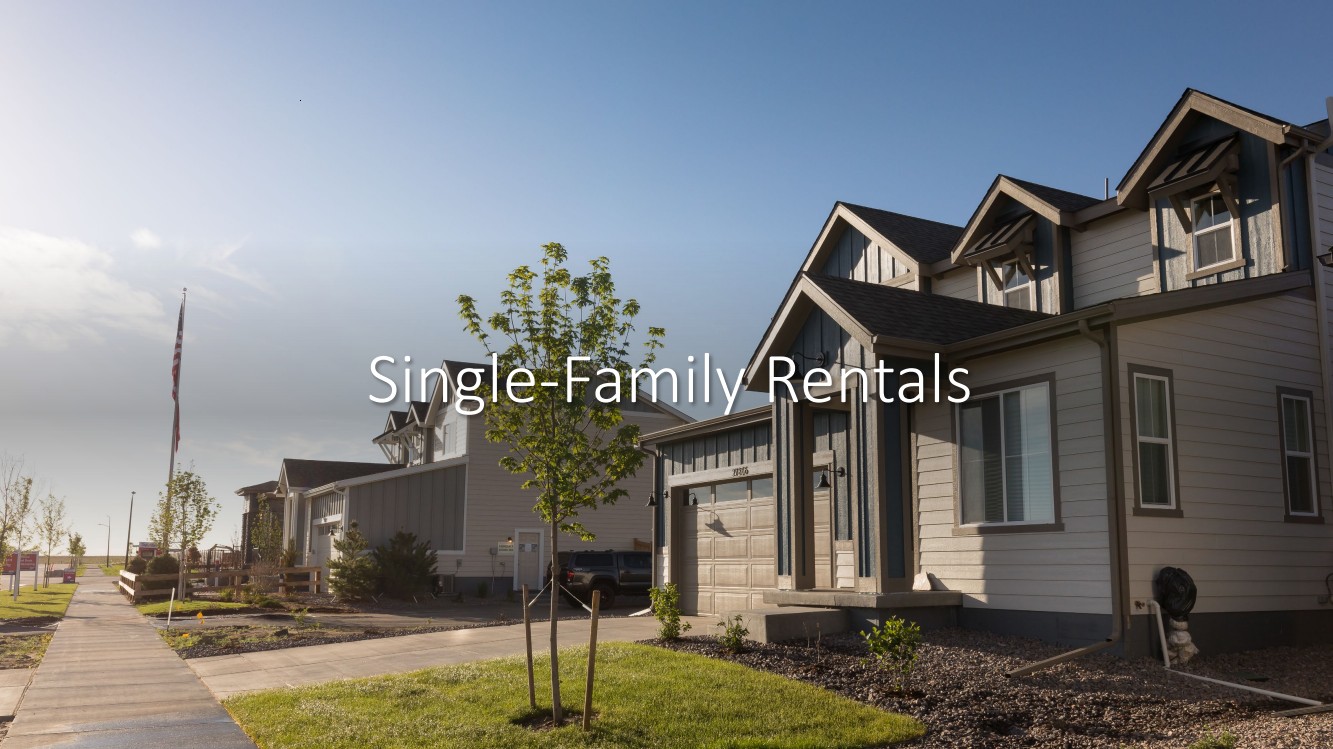
| Single-Family Rentals |
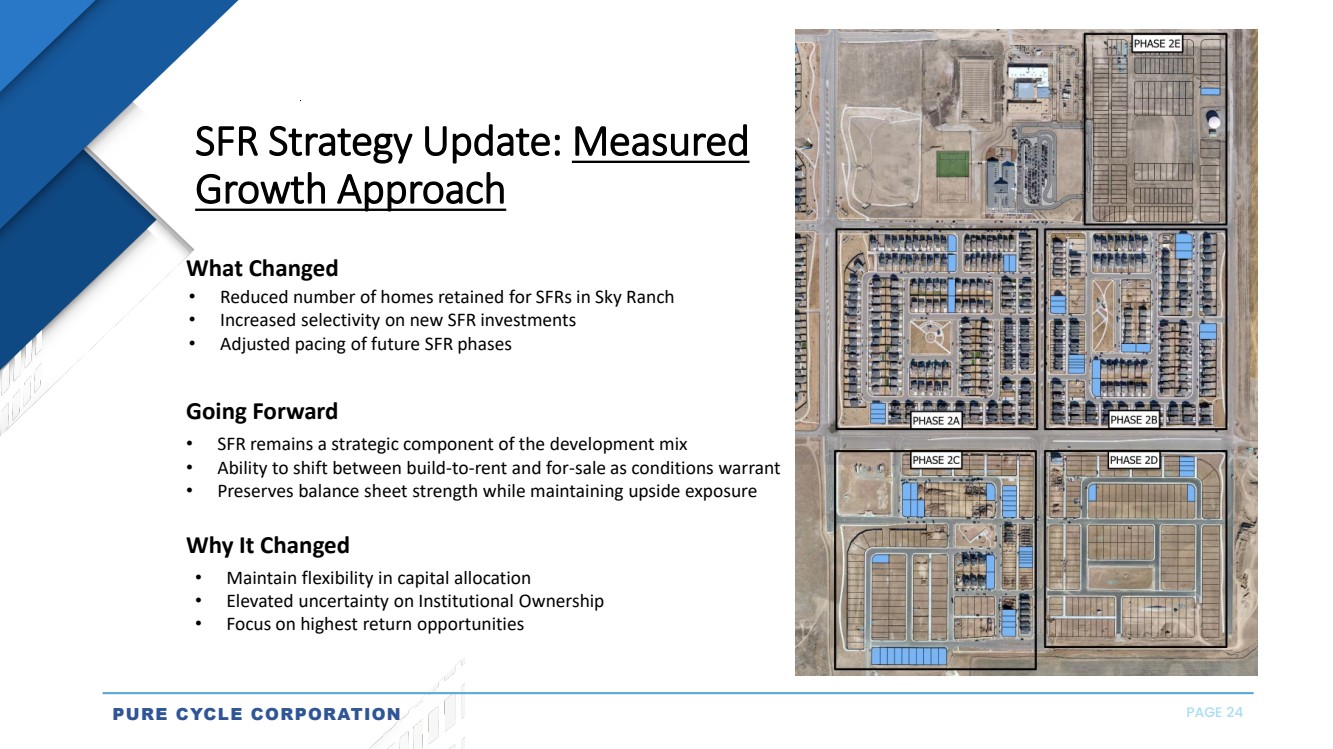
| PURE CYCLE CORPORATION PAGE 24 SFR Strategy Update: Measured Growth Approach What Changed • Reduced number of homes retained for SFRs in Sky Ranch • Increased selectivity on new SFR investments • Adjusted pacing of future SFR phases • SFR remains a strategic component of the development mix • Ability to shift between build-to-rent and for-sale as conditions warrant • Preserves balance sheet strength while maintaining upside exposure Going Forward • Maintain flexibility in capital allocation • Elevated uncertainty on Institutional Ownership • Focus on highest return opportunities Why It Changed |
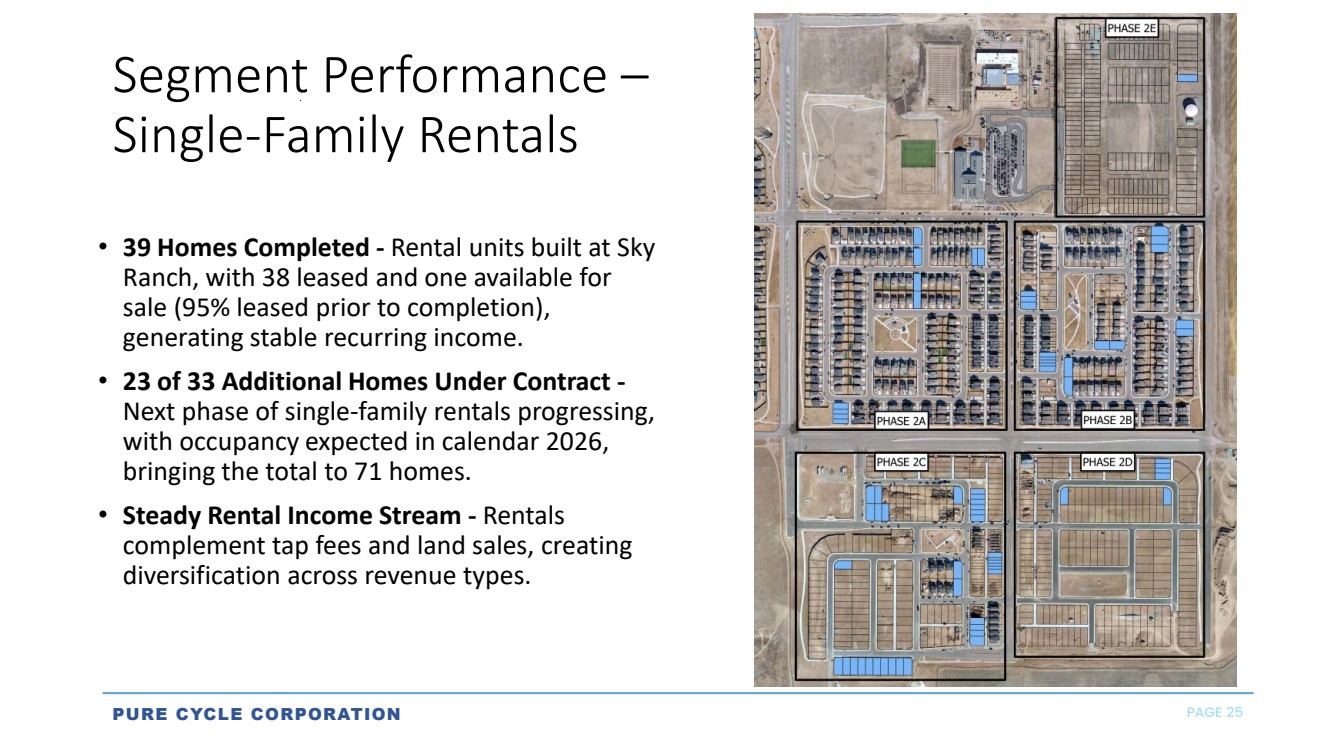
| PURE CYCLE CORPORATION PAGE 25 Segment Performance – Single -Family Rentals • 39 Homes Completed - Rental units built at Sky Ranch, with 38 leased and one available for sale (95% leased prior to completion), generating stable recurring income. • 23 of 33 Additional Homes Under Contract - Next phase of single -family rentals progressing, with occupancy expected in calendar 2026, bringing the total to 71 homes. • Steady Rental Income Stream - Rentals complement tap fees and land sales, creating diversification across revenue types. |
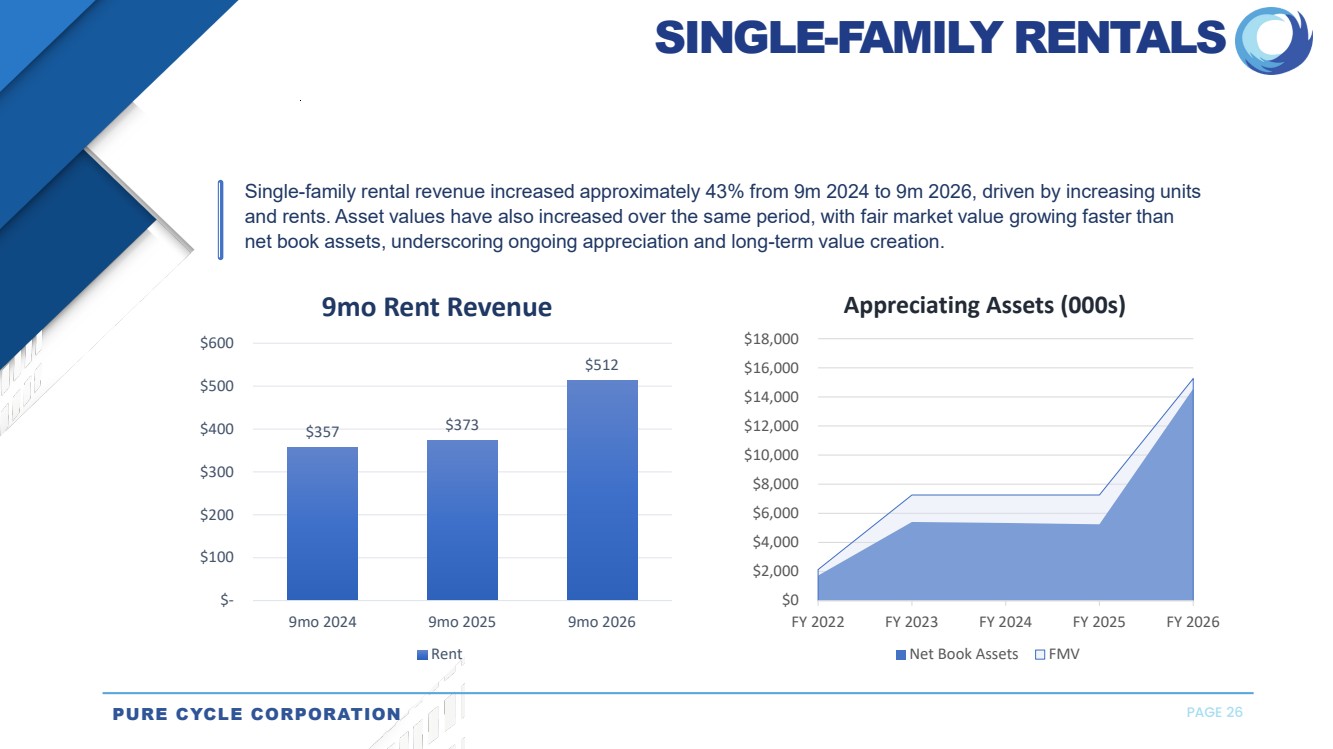
| PURE CYCLE CORPORATION PAGE 26 Single-family rental revenue increased approximately 43% from 9m 2024 to 9m 2026, driven by increasing units and rents. Asset values have also increased over the same period, with fair market value growing faster than net book assets, underscoring ongoing appreciation and long-term value creation. SINGLE-FAMILY RENTALS $357 $373 $512 $- $100 $200 $300 $400 $500 $600 9mo 2024 9mo 2025 9mo 2026 9mo Rent Revenue Rent $0 $2,000 $4,000 $6,000 $8,000 $10,000 $12,000 $14,000 $16,000 $18,000 FY 2022 FY 2023 FY 2024 FY 2025 FY 2026 Appreciating Assets (000s) ■ ■ Net Book Assets □ FMV |
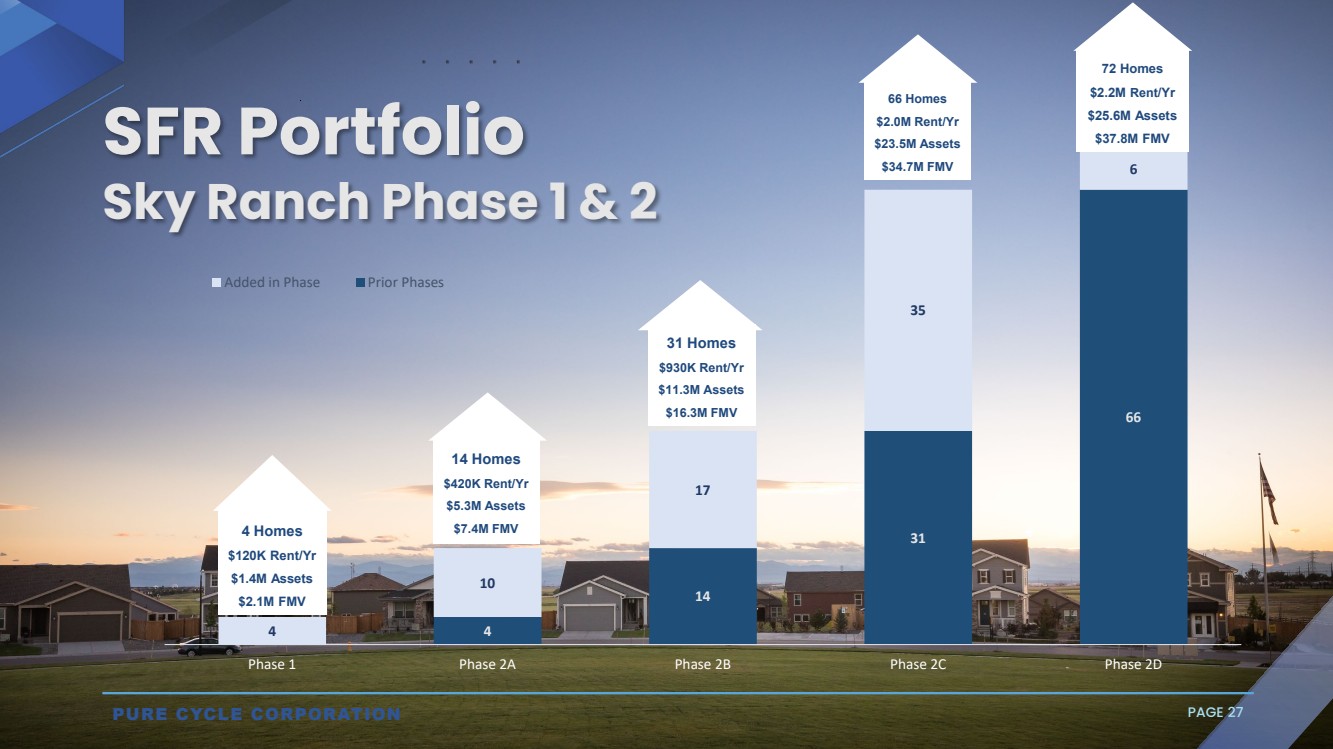
| 4 14 31 66 4 10 17 35 6 Phase 1 Phase 2A Phase 2B Phase 2C Phase 2D Added in Phase Prior Phases 14 Homes $420K Rent/Yr $5.3M Assets $7.4M FMV 31 Homes $930K Rent/Yr $11.3M Assets $16.3M FMV 4 Homes $120K Rent/Yr $1.4M Assets $2.1M FMV 72 Homes $2.2M Rent/Yr $25.6M Assets SFR Portfolio $37.8M FMV Sky Ranch Phase 1 & 2 PURE CYCLE CORPORATION PAGE 27 66 Homes $2.0M Rent/Yr $23.5M Assets $34.7M FMV |
| Capital Allocation & Shareholder Value |

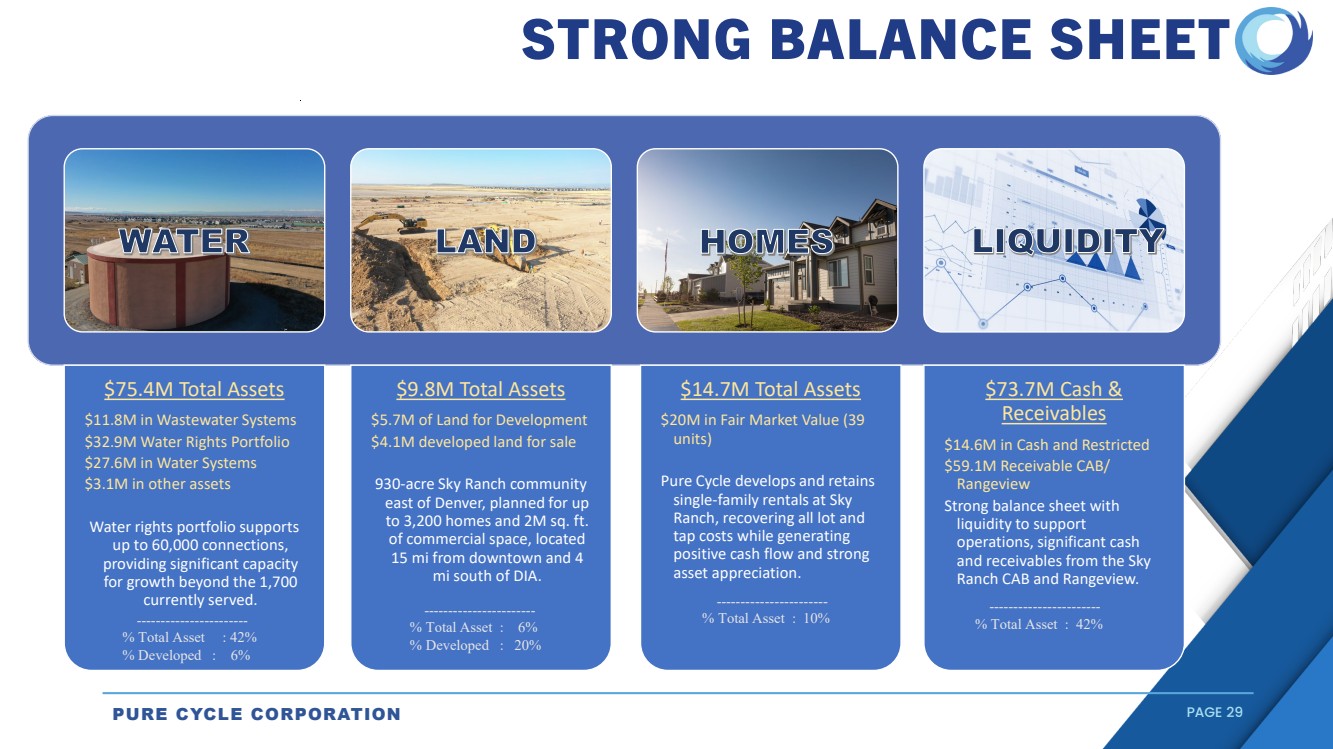
| PURE CYCLE CORPORATION PAGE 29 $75.4M Total Assets $11.8M in Wastewater Systems $32.9M Water Rights Portfolio $27.6M in Water Systems $3.1M in other assets Water rights portfolio supports up to 60,000 connections, providing significant capacity for growth beyond the 1,700 currently served. $9.8M Total Assets $5.7M of Land for Development $4.1M developed land for sale 930-acre Sky Ranch community east of Denver, planned for up to 3,200 homes and 2M sq. ft. of commercial space, located 15 mi from downtown and 4 mi south of DIA. $14.7M Total Assets $20M in Fair Market Value (39 units) Pure Cycle develops and retains single-family rentals at Sky Ranch, recovering all lot and tap costs while generating positive cash flow and strong asset appreciation. $73.7M Cash & Receivables $14.6M in Cash and Restricted $59.1M Receivable CAB/ Rangeview Strong balance sheet with liquidity to support operations, significant cash and receivables from the Sky Ranch CAB and Rangeview. STRONG BALANCE SHEET ----------------------- % Total Asset : 42% % Developed : 6% ----------------------- % Total Asset : 6% % Developed : 20% ----------------------- % Total Asset : 10% ----------------------- % Total Asset : 42% ll&U . ., . . ~ . : . . . |
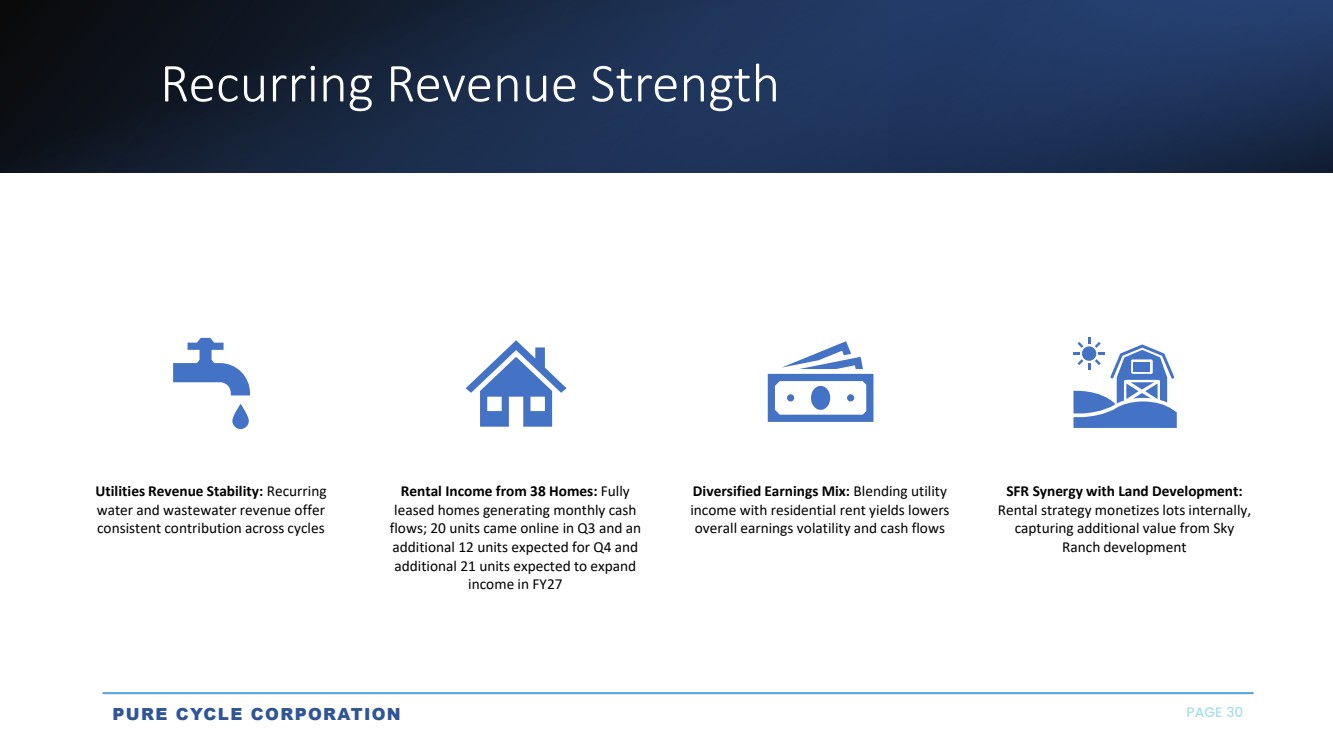
| Recurring Revenue Strength Utilities Revenue Stability: Recurring water and wastewater revenue offer consistent contribution across cycles Rental Income from 38 Homes: Fully leased homes generating monthly cash flows; 20 units came online in Q3 and an additional 12 units expected for Q4 and additional 21 units expected to expand income in FY27 Diversified Earnings Mix: Blending utility income with residential rent yields lowers overall earnings volatility and cash flows SFR Synergy with Land Development: Rental strategy monetizes lots internally, capturing additional value from Sky Ranch development PURE CYCLE CORPORATION PAGE 30 |
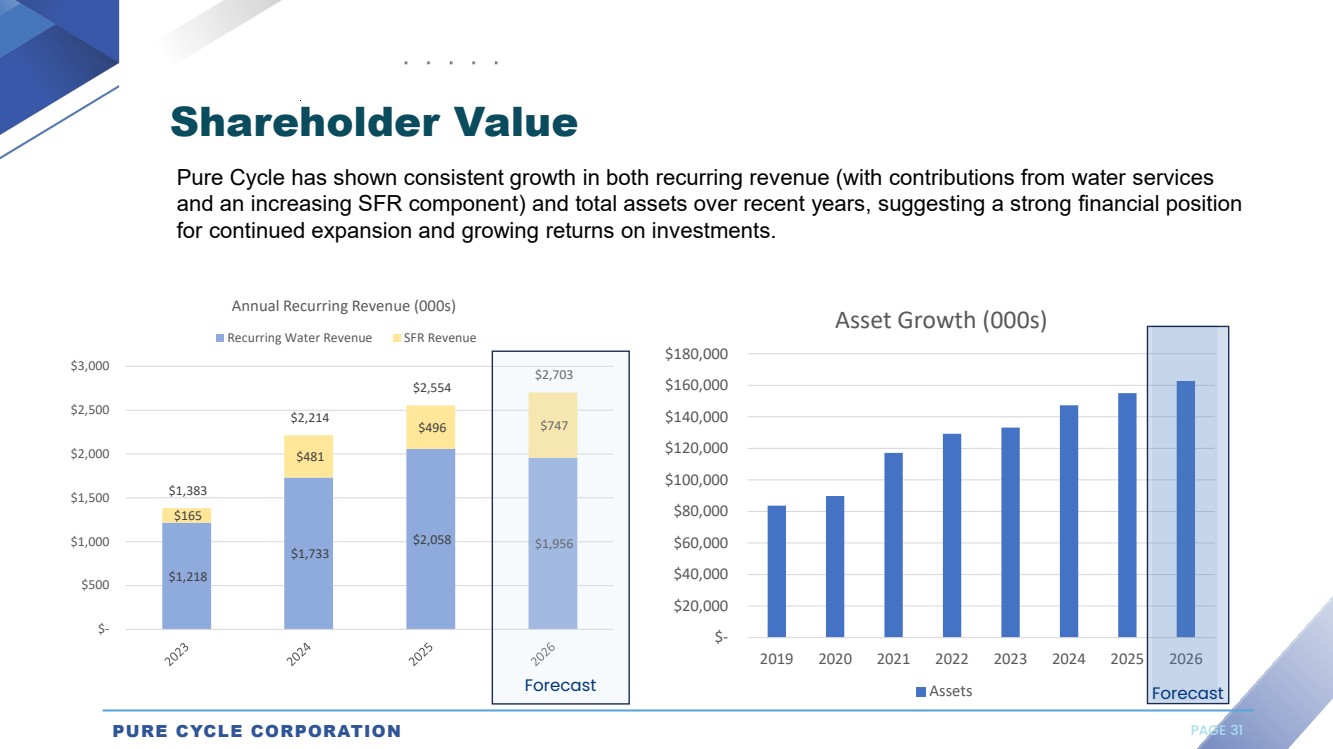
| $1,218 $1,733 $2,058 $1,956 $165 $481 $496 $747 $1,383 $2,214 $2,554 $2,703 $- $500 $1,000 $1,500 $2,000 $2,500 $3,000 Annual Recurring Revenue (000s) Recurring Water Revenue SFR Revenue $- $20,000 $40,000 $60,000 $80,000 $100,000 $120,000 $140,000 $160,000 $180,000 2019 2020 2021 2022 2023 2024 2025 2026 Asset Growth (000s) Assets Shareholder Value Pure Cycle has shown consistent growth in both recurring revenue (with contributions from water services and an increasing SFR component) and total assets over recent years, suggesting a strong financial position for continued expansion and growing returns on investments. Forecast Forecast PURE CYCLE CORPORATION PAGE 31 ■ ■ ■ |
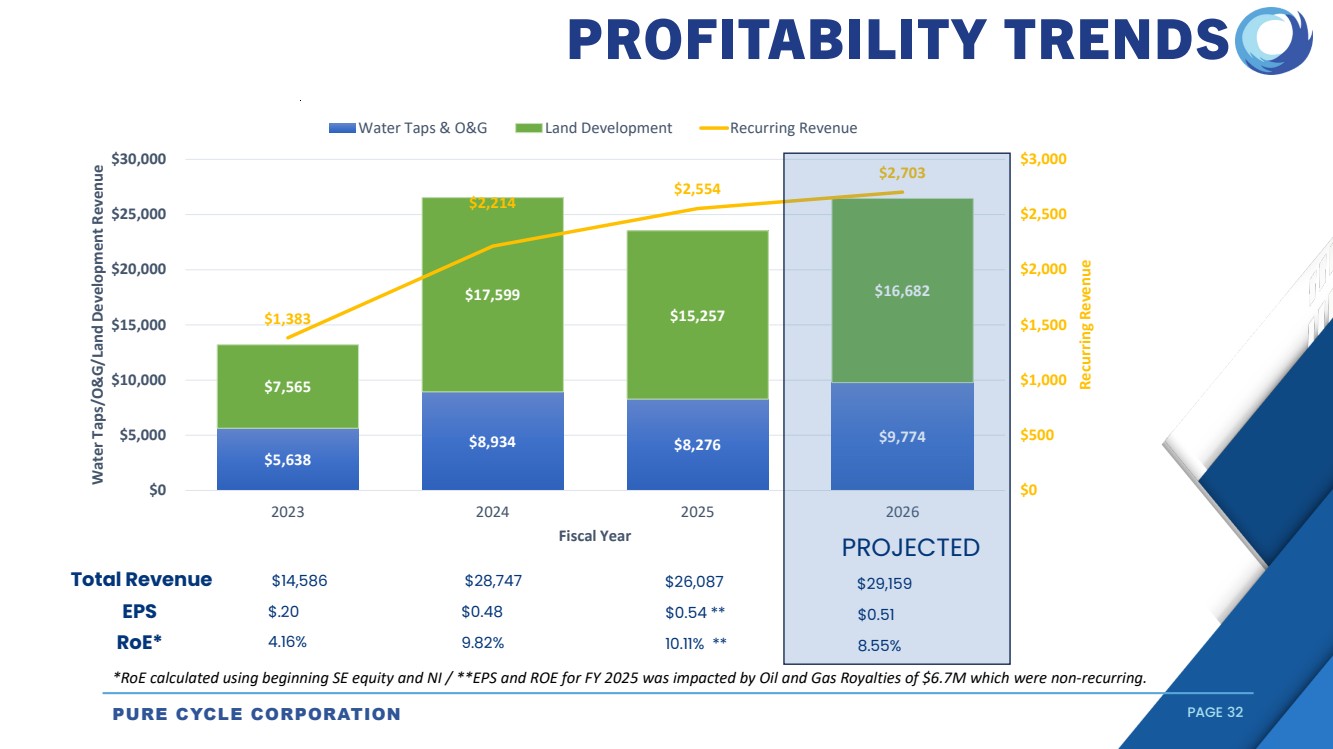
| PURE CYCLE CORPORATION PAGE 32 $5,638 $8,934 $8,276 $9,774 $7,565 $17,599 $15,257 $16,682 $1,383 $2,214 $2,554 $2,703 $0 $500 $1,000 $1,500 $2,000 $2,500 $3,000 $0 $5,000 $10,000 $15,000 $20,000 $25,000 $30,000 2023 2024 2025 2026 Recurring Revenue Water Taps/O&G/Land Development Revenue Fiscal Year Water Taps & O&G Land Development Recurring Revenue $.20 $0.48 RoE* 4.16% 9.82% $0.54 ** 10.11% ** $0.51 8.55% EPS Total Revenue $14,586 $28,747 $26,087 $29,159 PROJECTED PROFITABILITY TRENDS *RoE calculated using beginning SE equity and NI / **EPS and ROE for FY 2025 was impacted by Oil and Gas Royalties of $6.7M which were non-recurring. - - |
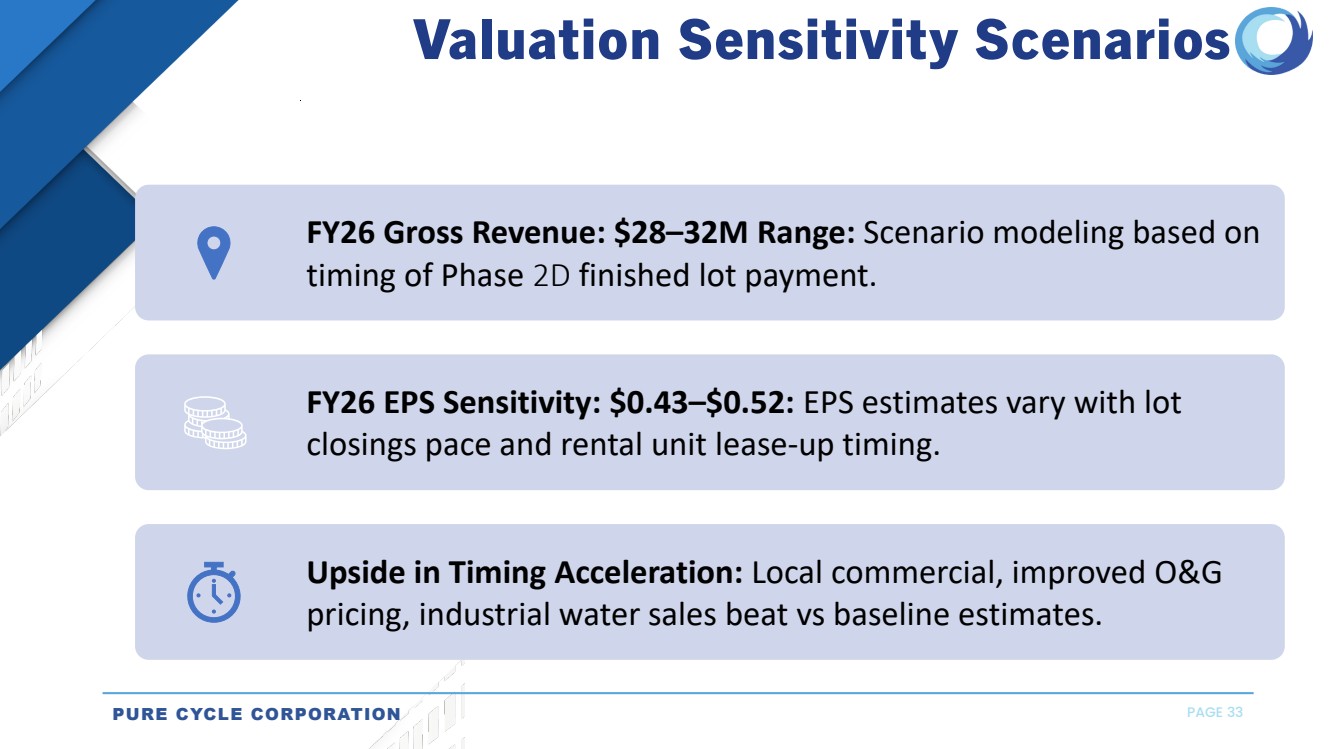
| PURE CYCLE CORPORATION PAGE 33 FY26 Gross Revenue: $28–32M Range: Scenario modeling based on timing of Phase 2D finished lot payment. FY26 EPS Sensitivity: $0.43–$0.52: EPS estimates vary with lot closings pace and rental unit lease-up timing. Upside in Timing Acceleration: Local commercial, improved O&G pricing, industrial water sales beat vs baseline estimates. Valuation Sensitivity Scenarios |
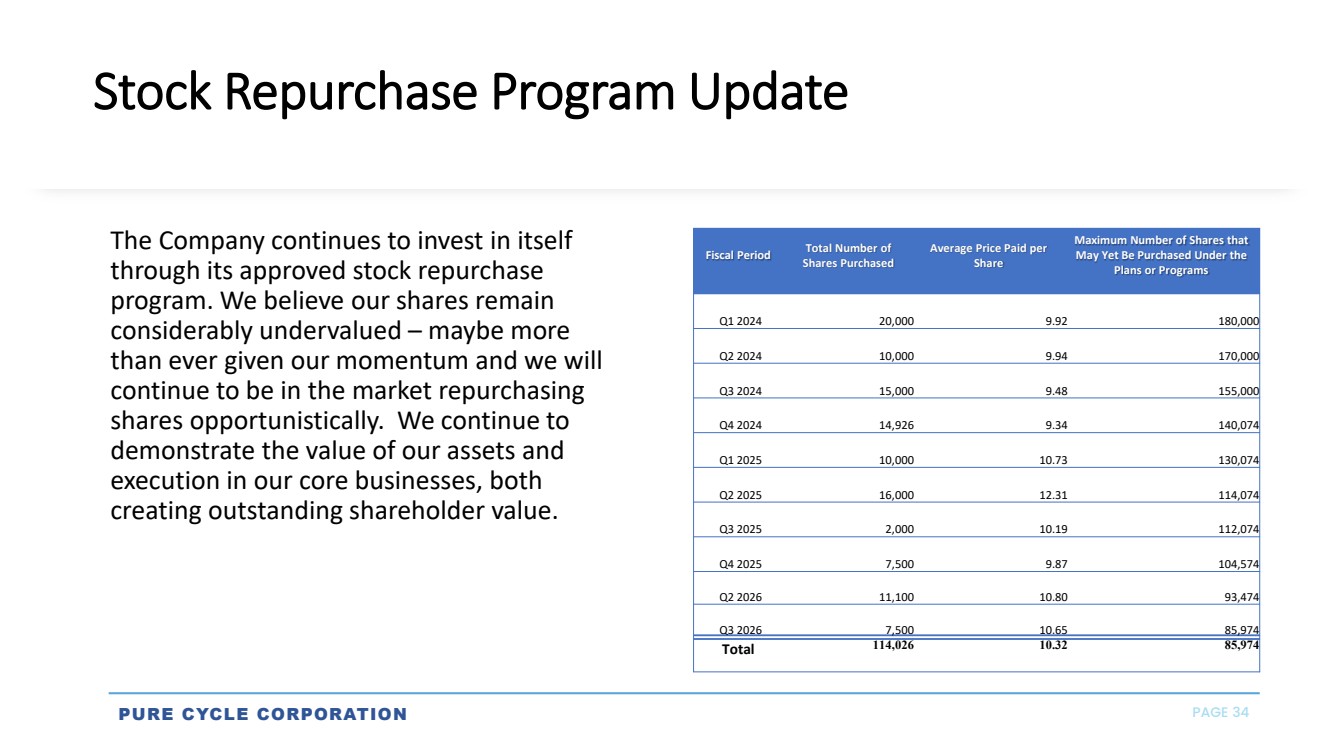
| Stock Repurchase Program Update The Company continues to invest in itself through its approved stock repurchase program. We believe our shares remain considerably undervalued – maybe more than ever given our momentum and we will continue to be in the market repurchasing shares opportunistically. We continue to demonstrate the value of our assets and execution in our core businesses, both creating outstanding shareholder value. Fiscal Period Total Number of Shares Purchased Average Price Paid per Share Maximum Number of Shares that May Yet Be Purchased Under the Plans or Programs Q1 2024 20,000 9.92 180,000 Q2 2024 10,000 9.94 170,000 Q3 2024 15,000 9.48 155,000 Q4 2024 14,926 9.34 140,074 Q1 2025 10,000 10.73 130,074 Q2 2025 16,000 12.31 114,074 Q3 2025 2,000 10.19 112,074 Q4 2025 7,500 9.87 104,574 Q2 2026 11,100 10.80 93,474 Q3 2026 7,500 10.65 85,974 Total 114,026 10.32 85,974 PURE CYCLE CORPORATION PAGE 34 |
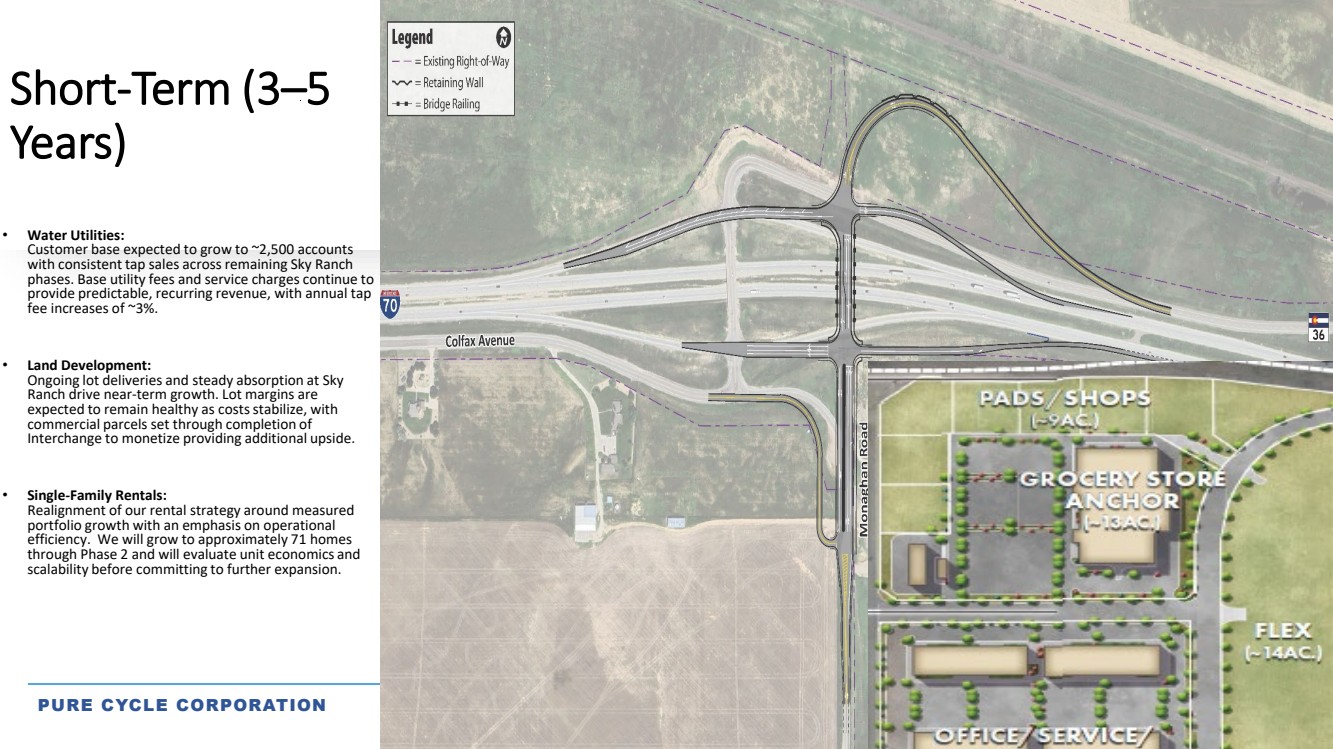
| Short-Term (3–5 Years) • Water Utilities: Customer base expected to grow to ~2,500 accounts with consistent tap sales across remaining Sky Ranch phases. Base utility fees and service charges continue to provide predictable, recurring revenue, with annual tap fee increases of ~3%. • Land Development: Ongoing lot deliveries and steady absorption at Sky Ranch drive near-term growth. Lot margins are expected to remain healthy as costs stabilize, with commercial parcels set through completion of Interchange to monetize providing additional upside. • Single-Family Rentals: Realignment of our rental strategy around measured portfolio growth with an emphasis on operational efficiency. We will grow to approximately 71 homes through Phase 2 and will evaluate unit economics and scalability before committing to further expansion. PURE CYCLE CORPORATION PAGE 35 Legend 8 - - = Existing Right-of-Way v-v = Retaining Wall ---- = Bridge Railing Colfax Avenue / --- /i / / - -- 1:-r-~ I 1 -~ I I -- I --- ----------- -~ ---.....: -----......: --- |
| SKY RANCH UPDATE |
| Earnings Presentation Q&A PURE CYCLE CORPORATION www.purecyclewater.com |