
Q3 - FY26 July 9, 2026 Nasdaq: SLP
Safe Harbor Statement Except for historical information, the matters discussed in this presentation are forward-looking statements within the meaning of the Private Securities Litigation Reform Act of 1995, that involve risks and uncertainties. Words like “believe,” “will”, “can”, “expect,” “anticipate” and similar expressions (or the negative of such terms, as well as other words or expressions referencing future events, conditions or circumstances) mean that these are our best estimates as of this writing, but there can be no assurances that expected or anticipated results or events will actually take place, so our actual future results could differ significantly from those statements. Statements include but are not limited to those relating to fiscal year 2026 guidance, expected revenue growth and mix, margins and profitability, demand for our services and software, pricing actions, client spending levels and long-term business strategies. Factors that could cause or contribute to such differences include, but are not limited to: effectiveness of our operational structure, our ability to maintain our competitive advantages and commercialize AI and cloud-enabled solutions, evolving regulatory and data privacy standards governing AI technologies, acceptance of new software and improved versions of our existing software by our customers, the general economics of the pharmaceutical industry, our ability to finance growth, our ability to continue to attract and retain highly qualified technical staff, market conditions, macroeconomic factors, and a sustainable market. Further information on our risk factors is contained in our quarterly, annual and current reports and filed with the U.S. Securities and Exchange Commission. Non-GAAP Financial Measures This presentation includes certain financial measures not presented in accordance with generally accepted accounting principles (“GAAP”) such as Adjusted EBITDA, Adjusted EBITDA Margin, Adjusted Net Income, and Adjusted Diluted EPS and certain ratios and other metrics derived there from. These non-GAAP financial measures are not measures of financial performance in accordance with GAAP and may exclude items that are significant in understanding and assessing financial results. Therefore, these measures should not be considered in isolation or as an alternative to net income, cash flows from operations or other measures of profitability, liquidity or performance under GAAP. You should be aware that the presentation of these measures may not be comparable to similarly-titled measures used by other companies. We believe (i) these non-GAAP measures of financial results provide useful information to management and investors regarding certain financial and business trends; and (ii) that the use of these non-GAAP financial measures provides an additional tool for investors to use in evaluating ongoing operating results and trends in and in comparing financial measures with other similar companies, many of which present similar non- GAAP financial measures to investors. These non-GAAP financial measures are subject to inherent limitations as they reflect the exercise of judgments by management about which expense and income are excluded or included in determining these non-GAAP financial measures. Reconciliations of these non-GAAP measures to the most directly comparable GAAP measures are set forth in the appendix to this presentation. 1
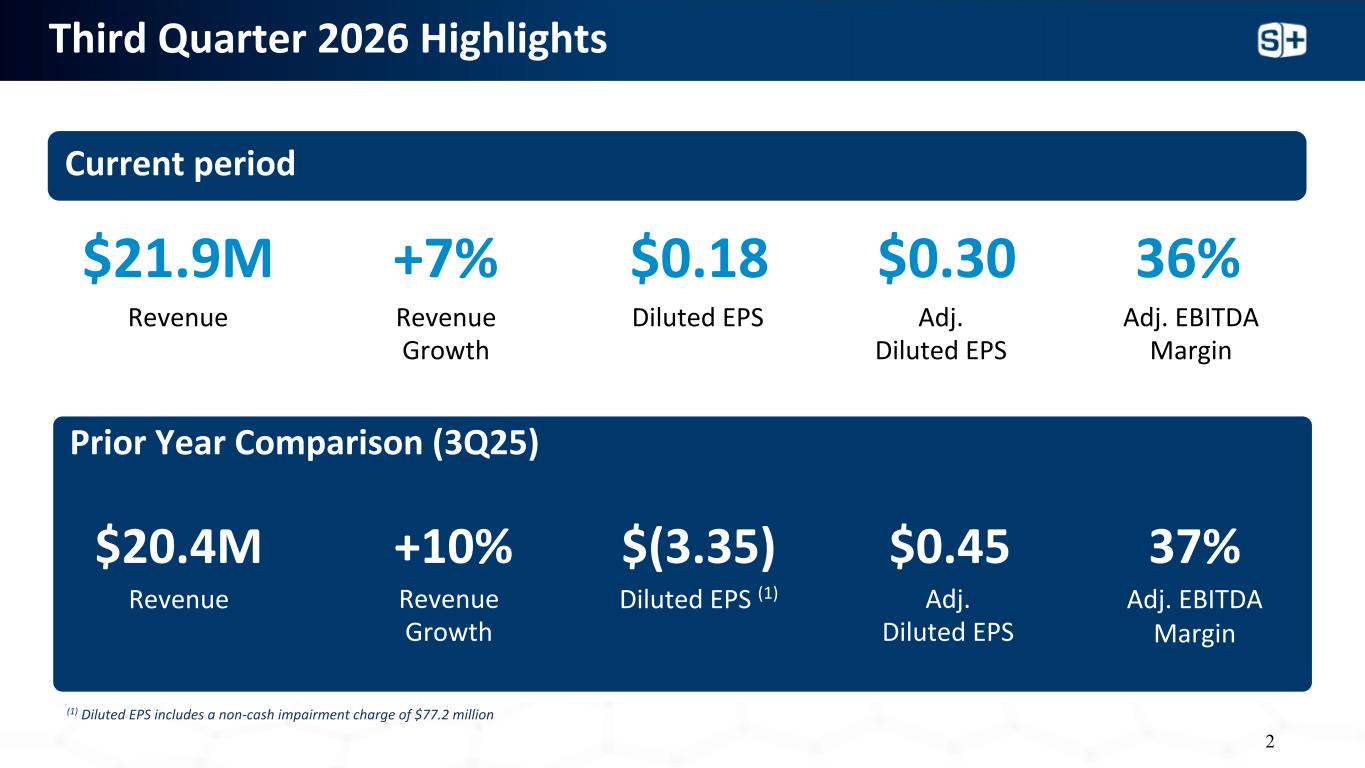
Third Quarter 2026 Highlights $0.18 Diluted EPS $21.9M Revenue 36% Adj. EBITDA Margin +7% Revenue Growth Current period Prior Year Comparison (3Q25) $0.30 Adj. Diluted EPS $20.4M Revenue $(3.35) Diluted EPS (1) 37% Adj. EBITDA Margin +10% $0.45 Revenue Growth Adj. Diluted EPS 2 (1) Diluted EPS includes a non-cash impairment charge of $77.2 million
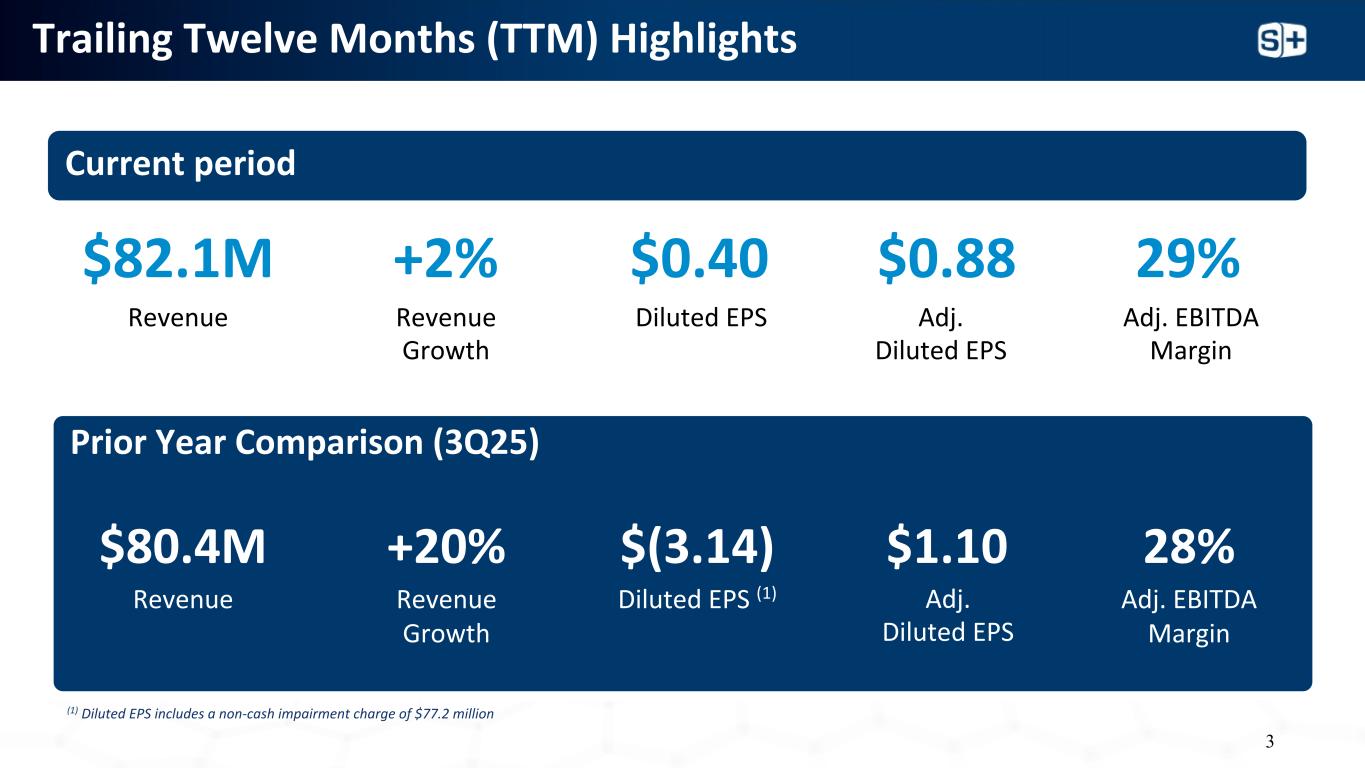
Trailing Twelve Months (TTM) Highlights $0.40 Diluted EPS $82.1M Revenue 29% Adj. EBITDA Margin +2% Revenue Growth Current period Prior Year Comparison (3Q25) $0.88 Adj. Diluted EPS $80.4M Revenue $(3.14) Diluted EPS (1) 28% Adj. EBITDA Margin +20% Revenue Growth $1.10 (1) Diluted EPS includes a non-cash impairment charge of $77.2 million Adj. Diluted EPS 3
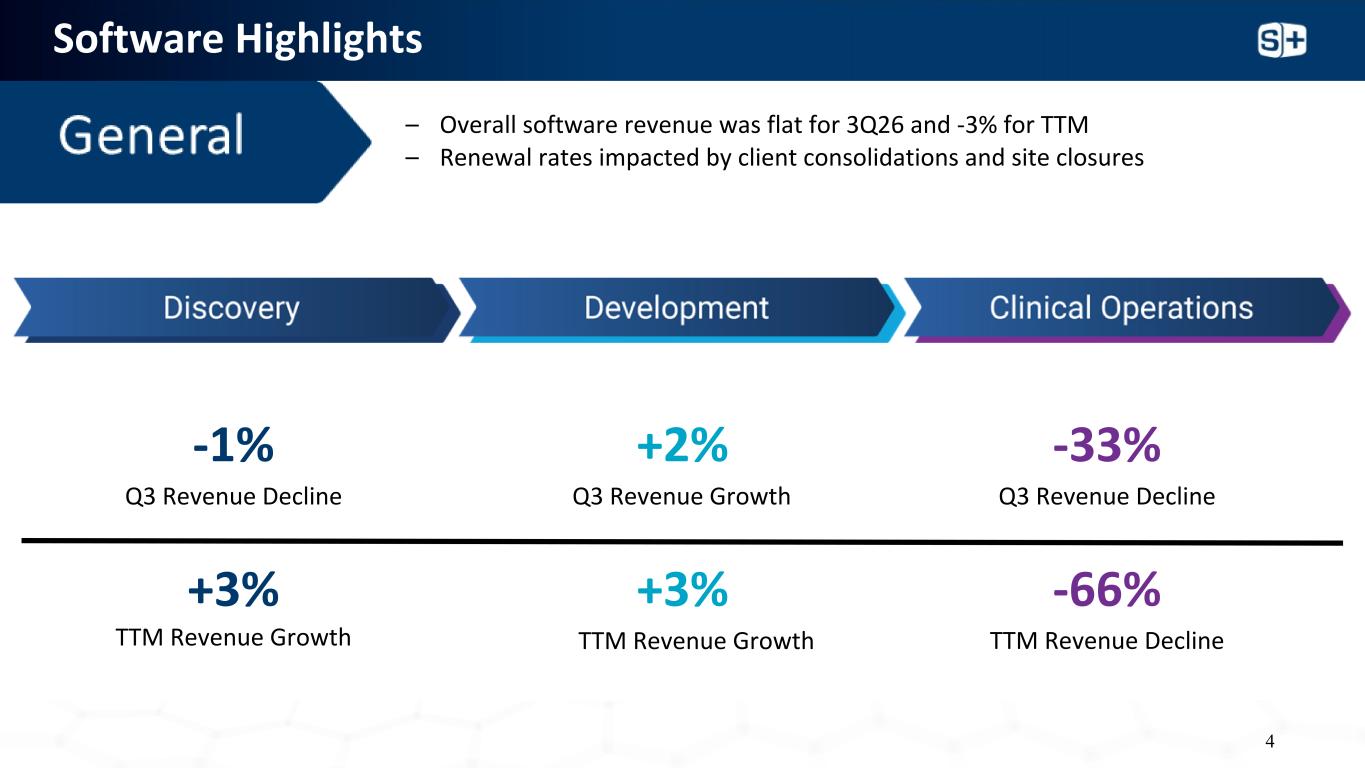
Software Highlights $18.7M Revenue $0.04 Diluted EPS 22% Adj. EBITDA Margin -1% Q3 Revenue Decline +2% Q3 Revenue Growth -33% Q3 Revenue Decline +3% TTM Revenue Growth +3% TTM Revenue Growth -66% TTM Revenue Decline – Overall software revenue was flat for 3Q26 and -3% for TTM – Renewal rates impacted by client consolidations and site closures Pro-ficiency® CLINICAL OPS 4
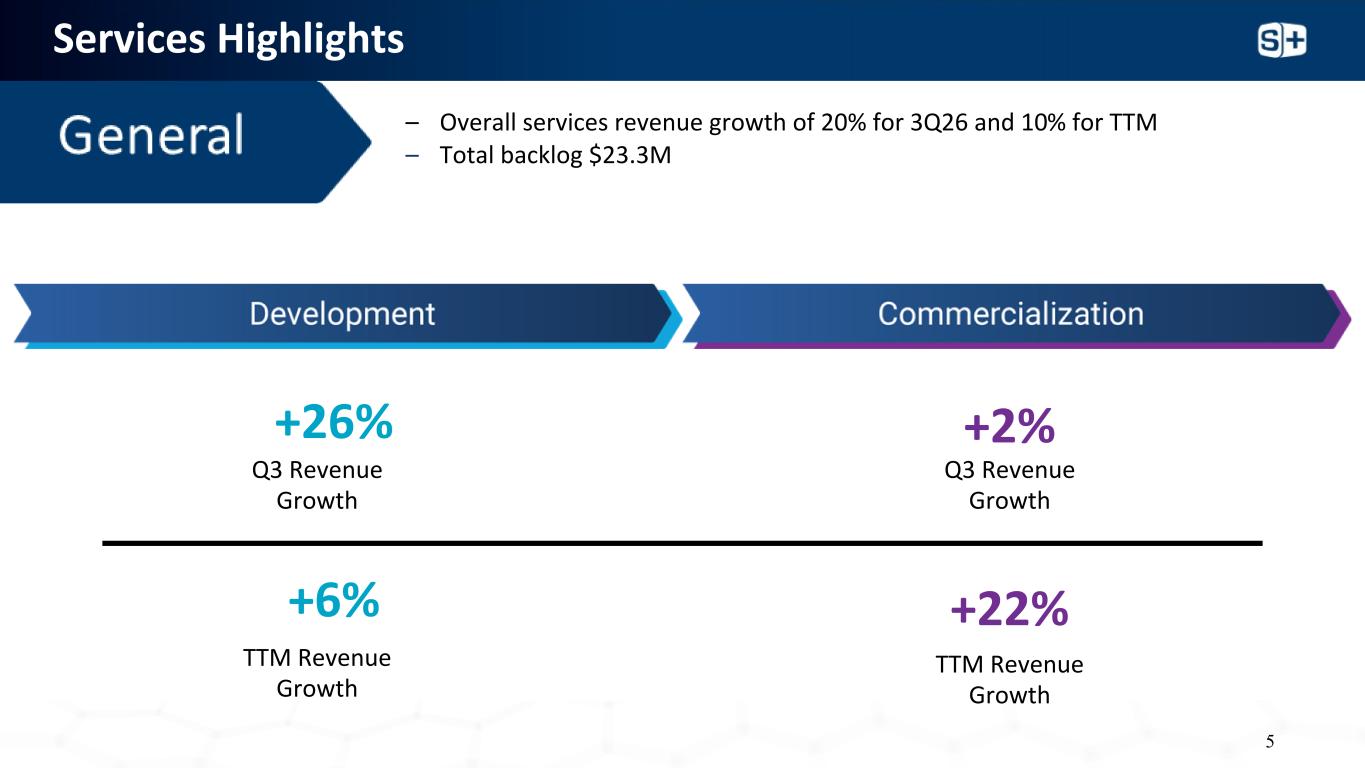
Services Highlights $18.7M Revenue $0.04 Diluted EPS 22% Adj. EBITDA Margin +19% Revenue Growth $0.18 Adj. Diluted EPS +26% Q3 Revenue Growth +2% Q3 Revenue Growth TTM Revenue Growth TTM Revenue Growth +6% +22% – Overall services revenue growth of 20% for 3Q26 and 10% for TTM – Total backlog $23.3M Med Comm Services COMMERCIALIZATION 5
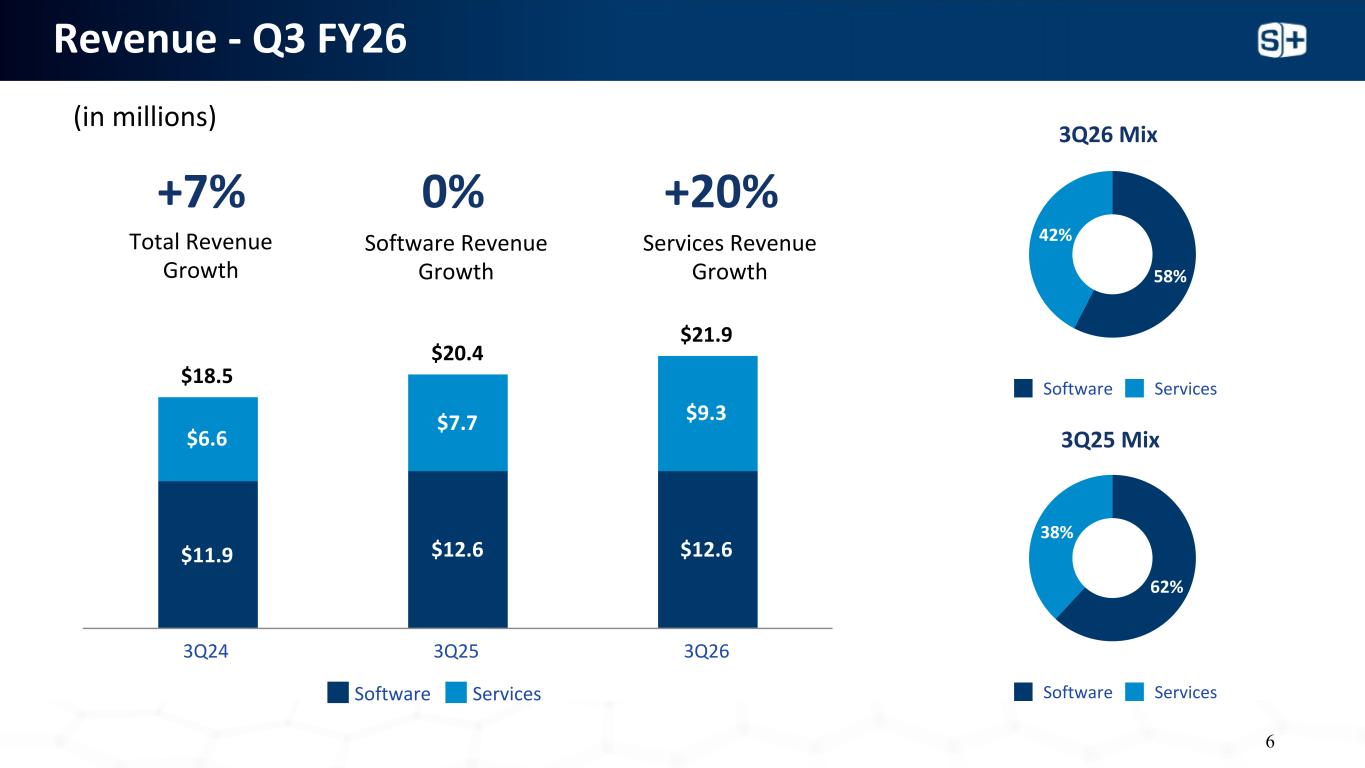
Revenue - Q3 FY26 58% 42% Software Services 62% 38% Software Services (in millions) Software Revenue Growth Total Revenue Growth Services Revenue Growth +7% 0% +20% 3Q26 Mix 3Q25 Mix $11.9 $12.6 $12.6 $6.6 $7.7 $9.3 $18.5 $20.4 $21.9 Software Services 3Q24 3Q25 3Q26 6
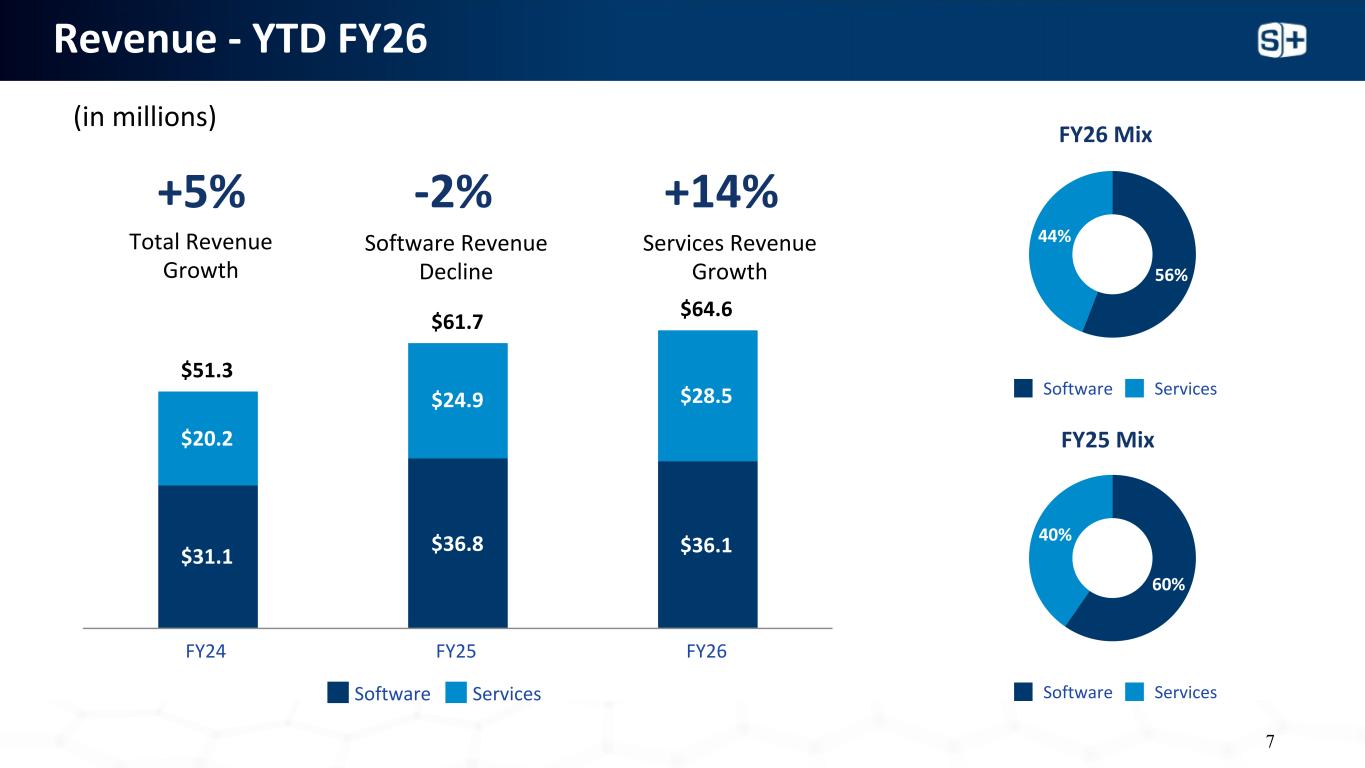
Revenue - YTD FY26 56% 44% Software Services 60% 40% Software Services (in millions) Software Revenue Decline Total Revenue Growth Services Revenue Growth +5% -2% +14% FY26 Mix FY25 Mix $31.1 $36.8 $36.1 $20.2 $24.9 $28.5 $51.3 $61.7 $64.6 Software Services FY24 FY25 FY26 7
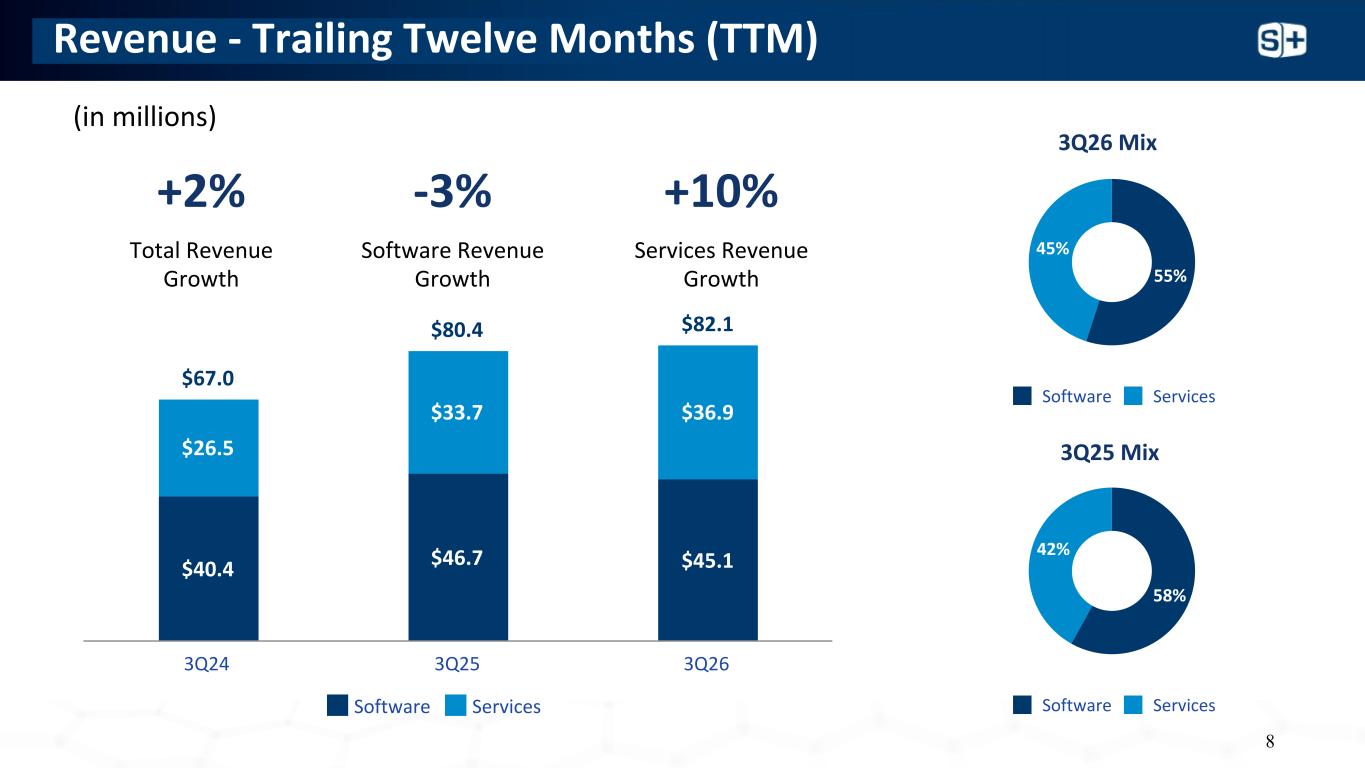
Revenue - Trailing Twelve Months (TTM) 55% 45% Software Services 58% 42% Software Services (in millions) Software Revenue Growth Total Revenue Growth Services Revenue Growth +2% -3% +10% 3Q26 Mix 3Q25 Mix $40.4 $46.7 $45.1 $26.5 $33.7 $36.9 $67.0 $80.4 $82.1 Software Services 3Q24 3Q25 3Q26 8
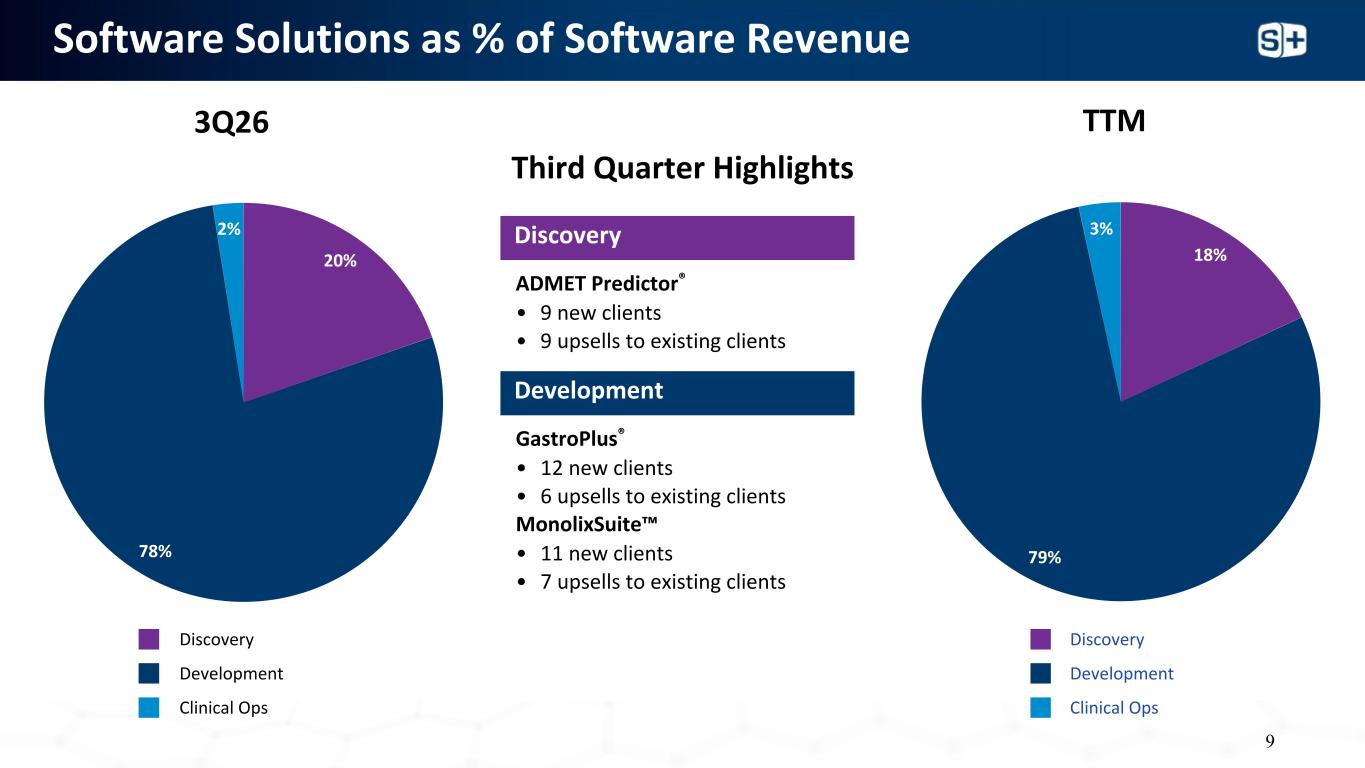
Software Solutions as % of Software Revenue 20% 78% 2% 3Q26 18% 79% 3% TTM GastroPlus® • 12 new clients • 6 upsells to existing clients ADMET Predictor® • 9 new clients • 9 upsells to existing clients MonolixSuite™ • 11 new clients • 7 upsells to existing clients Third Quarter Highlights Discovery Development Discovery Development Clinical Ops Discovery Development Clinical Ops 9
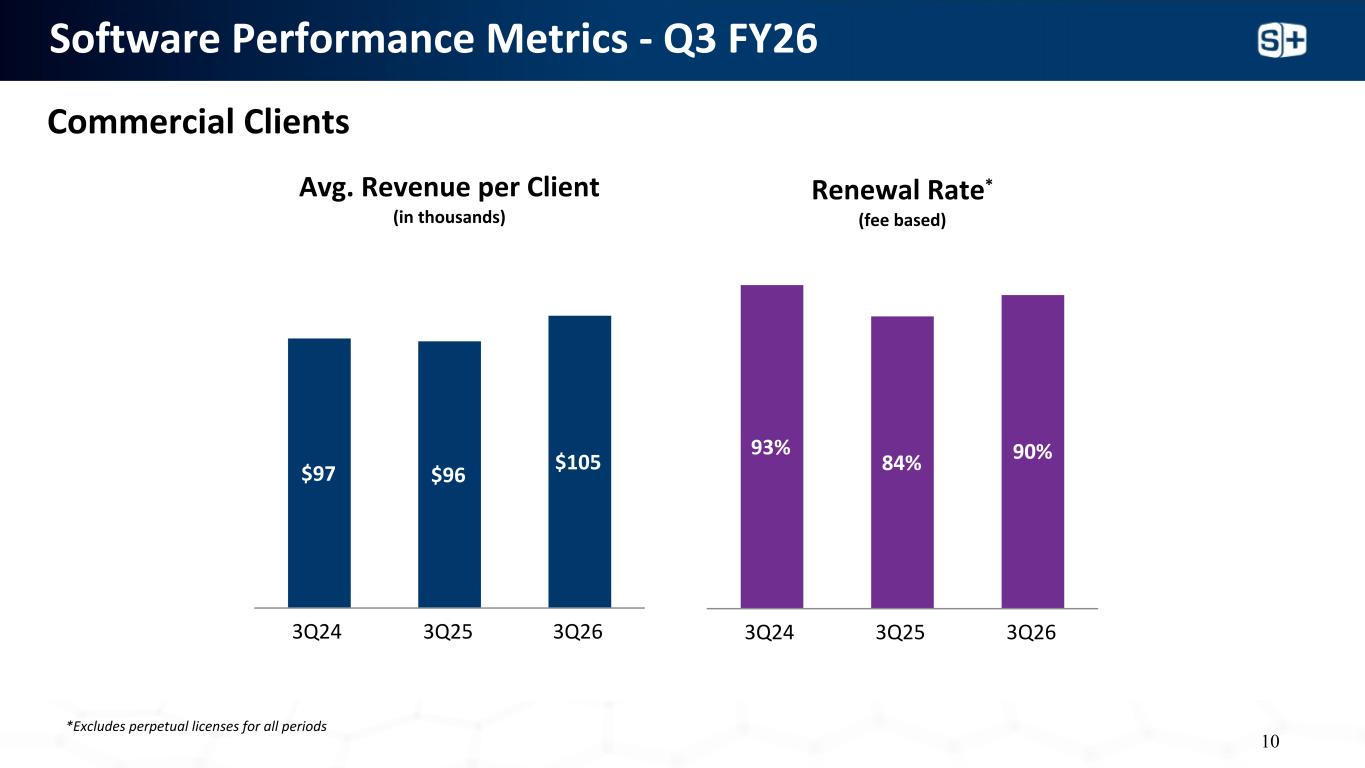
Software Performance Metrics - Q3 FY26 $97 $96 $105 3Q24 3Q25 3Q26 Avg. Revenue per Client (in thousands) Commercial Clients Renewal Rate* (fee based) 93% 84% 90% 3Q24 3Q25 3Q26 10 *Excludes perpetual licenses for all periods
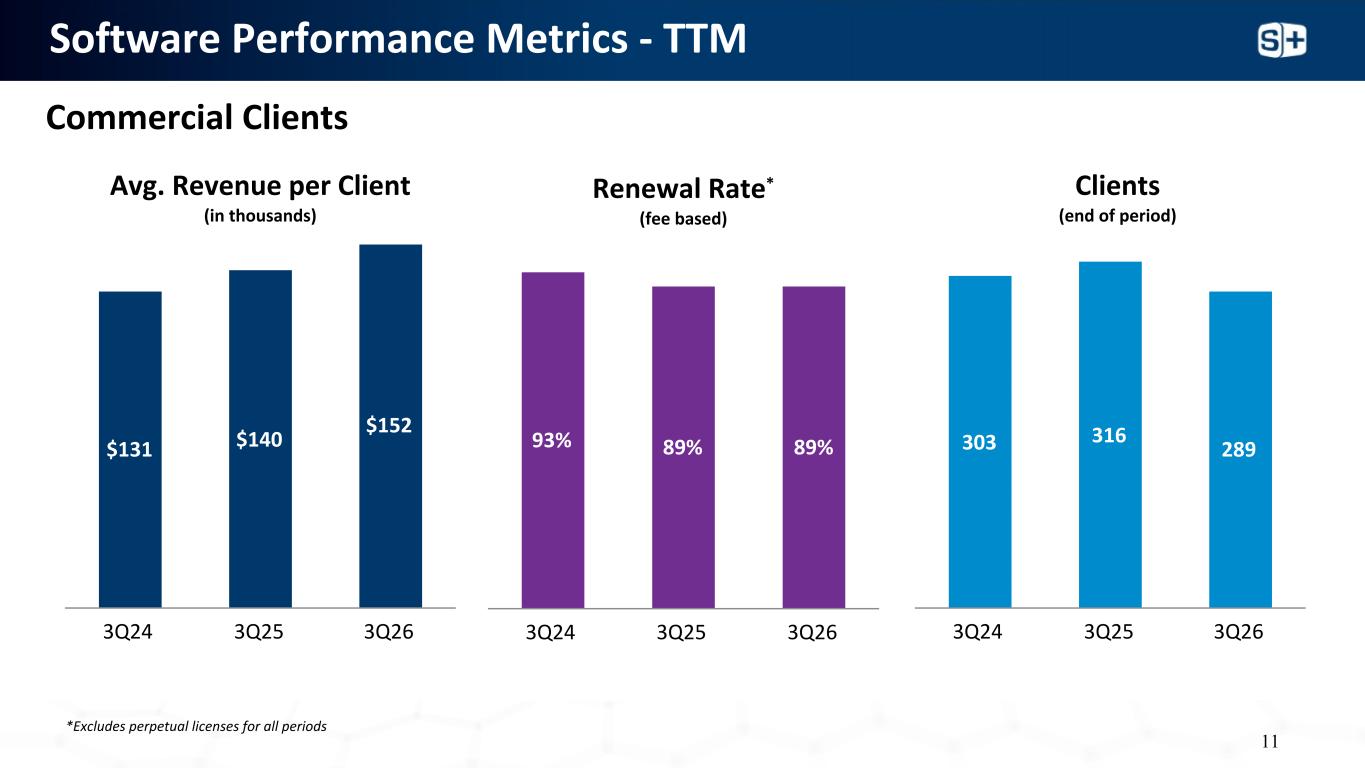
Software Performance Metrics - TTM Avg. Revenue per Client (in thousands) Renewal Rate* (fee based) $131 $140 $152 3Q24 3Q25 3Q26 93% 89% 89% 3Q24 3Q25 3Q26 303 316 289 3Q24 3Q25 3Q26 Commercial Clients Clients (end of period) 11 *Excludes perpetual licenses for all periods
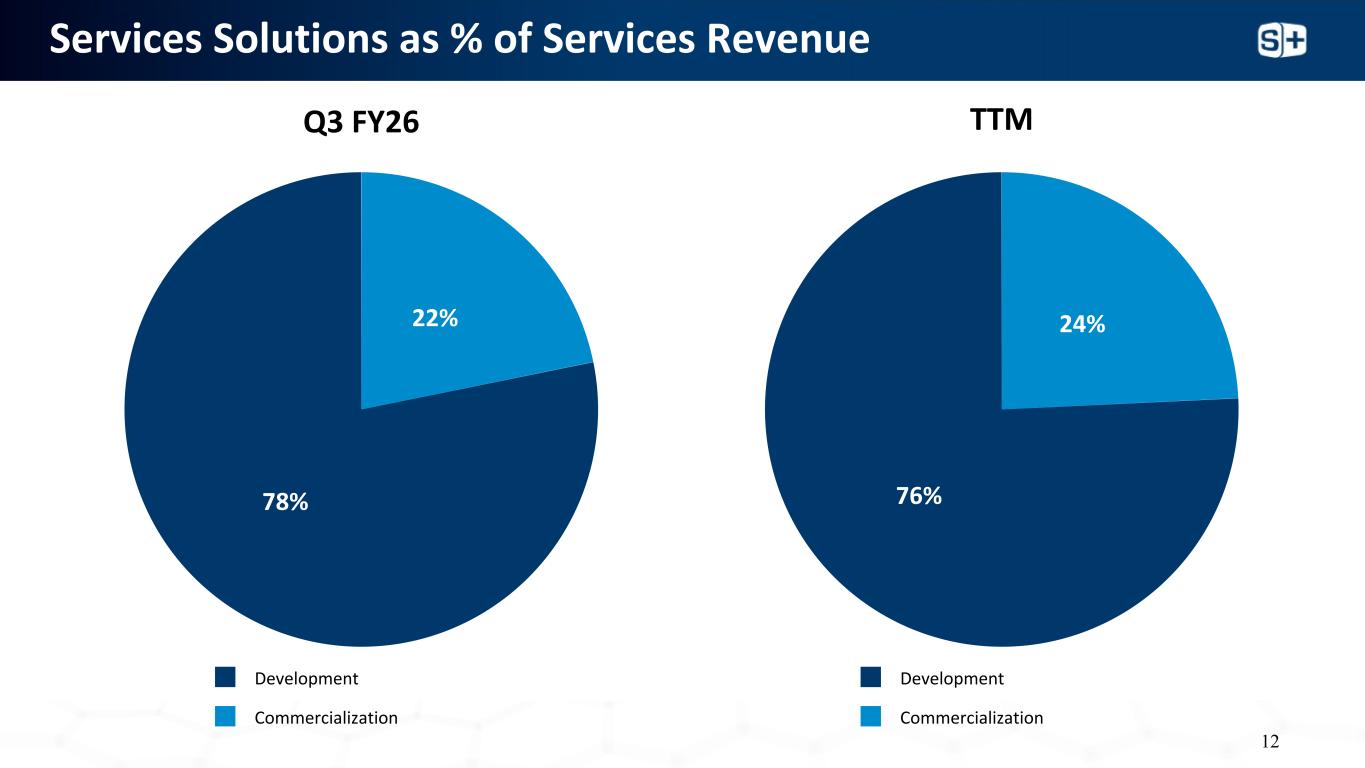
Services Solutions as % of Services Revenue 22% 78% Q3 FY26 24% 76% TTM Development Commercialization Development Commercialization 12
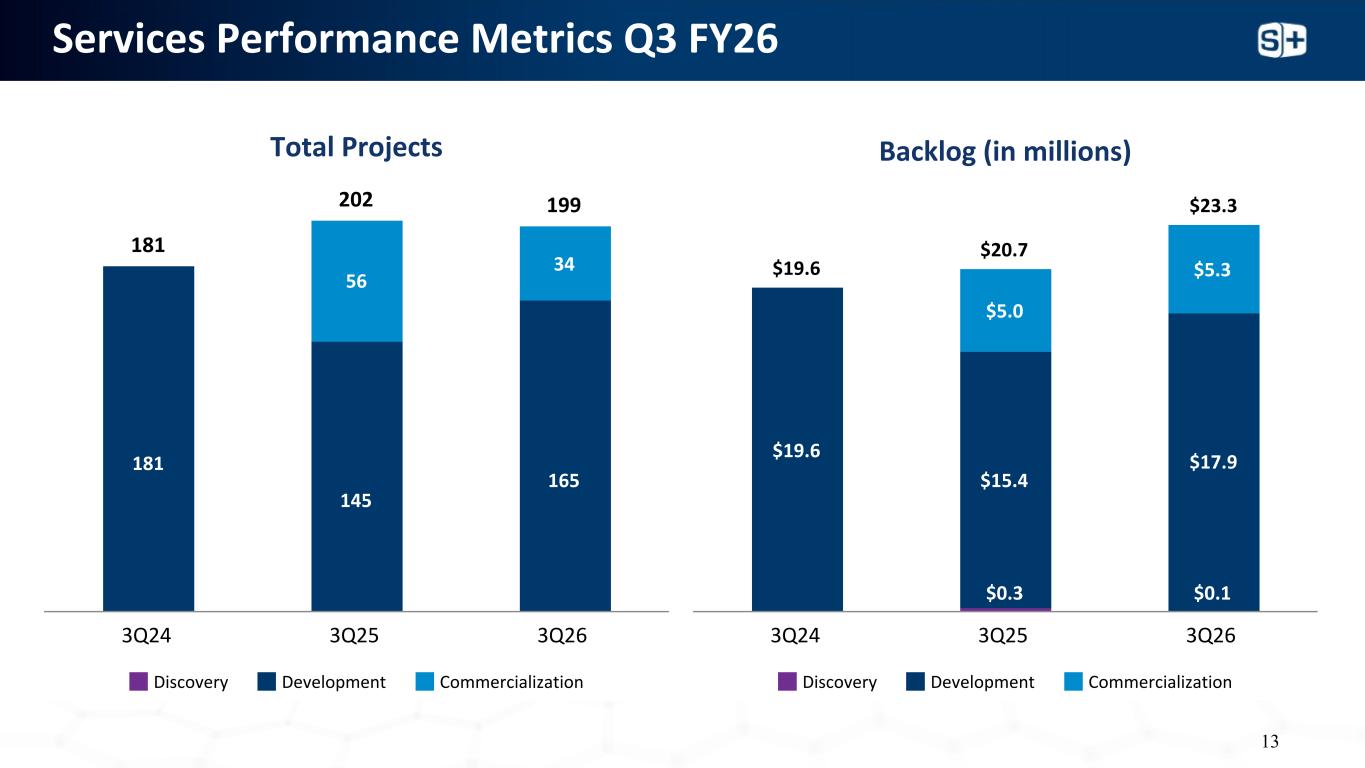
Services Performance Metrics Q3 FY26 $0.3 $0.1 $19.6 $15.4 $17.9 $5.0 $5.3$19.6 $20.7 $23.3 Discovery Development Commercialization 3Q24 3Q25 3Q26 181 145 165 56 34 181 202 199 Discovery Development Commercialization 3Q24 3Q25 3Q26 Total Projects Backlog (in millions) 13
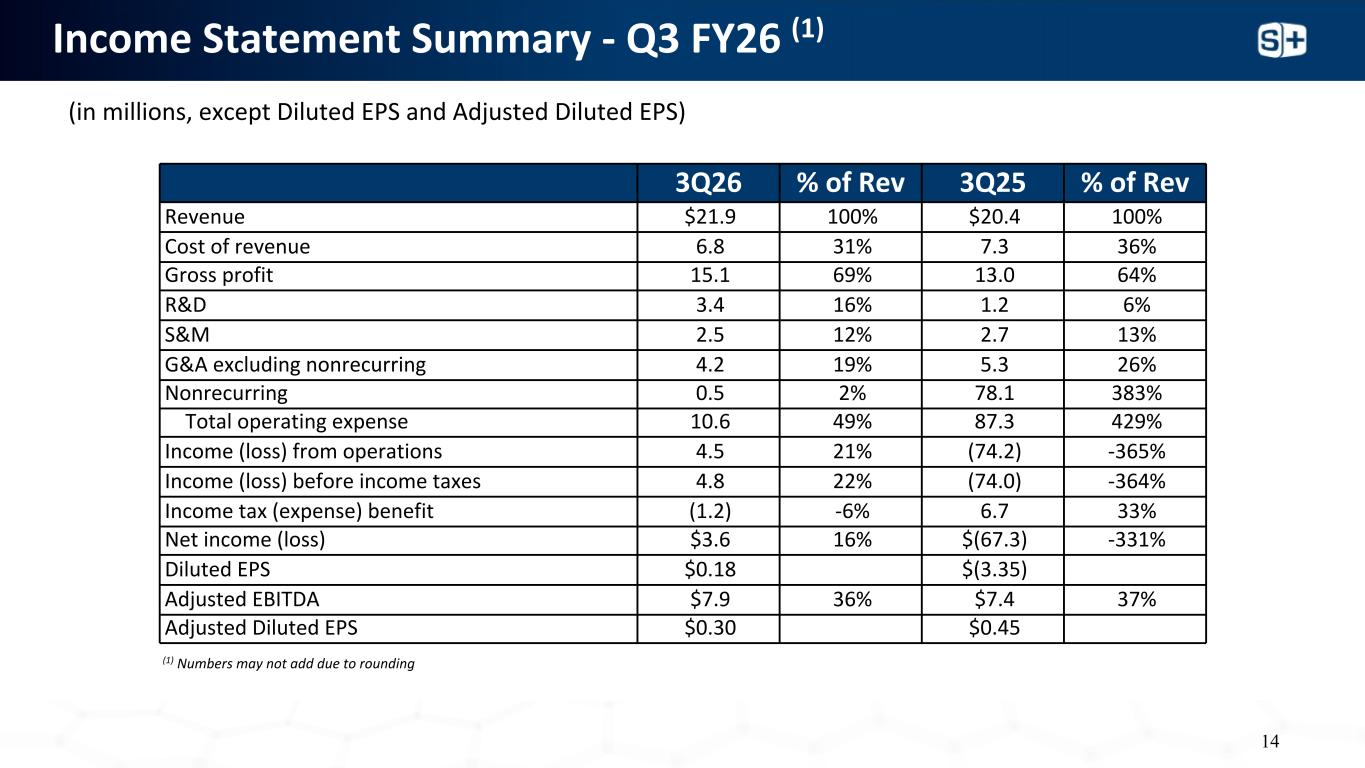
Income Statement Summary - Q3 FY26 (1) (in millions, except Diluted EPS and Adjusted Diluted EPS) 3Q26 % of Rev 3Q25 % of Rev Revenue $21.9 100% $20.4 100% Cost of revenue 6.8 31% 7.3 36% Gross profit 15.1 69% 13.0 64% R&D 3.4 16% 1.2 6% S&M 2.5 12% 2.7 13% G&A excluding nonrecurring 4.2 19% 5.3 26% Nonrecurring 0.5 2% 78.1 383% Total operating expense 10.6 49% 87.3 429% Income (loss) from operations 4.5 21% (74.2) -365% Income (loss) before income taxes 4.8 22% (74.0) -364% Income tax (expense) benefit (1.2) -6% 6.7 33% Net income (loss) $3.6 16% $(67.3) -331% Diluted EPS $0.18 $(3.35) Adjusted EBITDA $7.9 36% $7.4 37% Adjusted Diluted EPS $0.30 $0.45 (1) Numbers may not add due to rounding 14
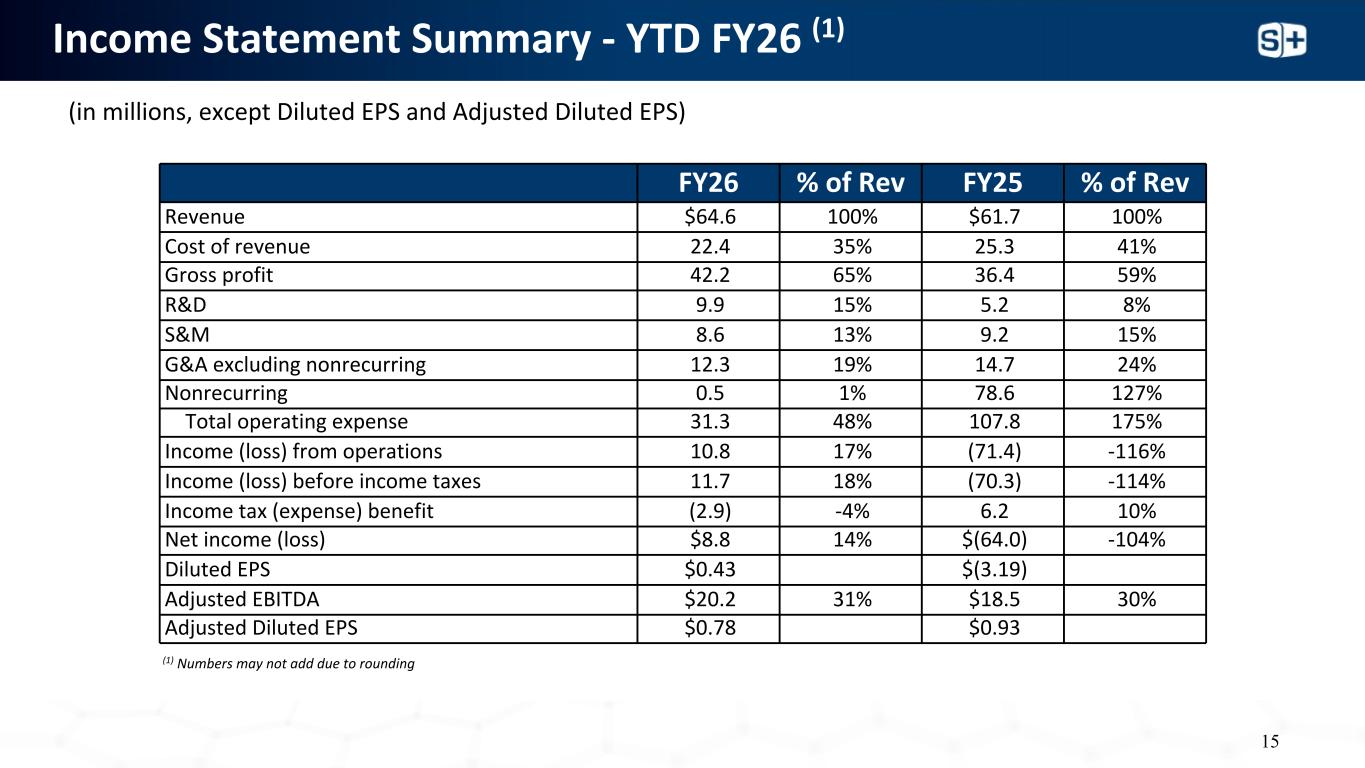
Income Statement Summary - YTD FY26 (1) (in millions, except Diluted EPS and Adjusted Diluted EPS) FY26 % of Rev FY25 % of Rev Revenue $64.6 100% $61.7 100% Cost of revenue 22.4 35% 25.3 41% Gross profit 42.2 65% 36.4 59% R&D 9.9 15% 5.2 8% S&M 8.6 13% 9.2 15% G&A excluding nonrecurring 12.3 19% 14.7 24% Nonrecurring 0.5 1% 78.6 127% Total operating expense 31.3 48% 107.8 175% Income (loss) from operations 10.8 17% (71.4) -116% Income (loss) before income taxes 11.7 18% (70.3) -114% Income tax (expense) benefit (2.9) -4% 6.2 10% Net income (loss) $8.8 14% $(64.0) -104% Diluted EPS $0.43 $(3.19) Adjusted EBITDA $20.2 31% $18.5 30% Adjusted Diluted EPS $0.78 $0.93 (1) Numbers may not add due to rounding 15
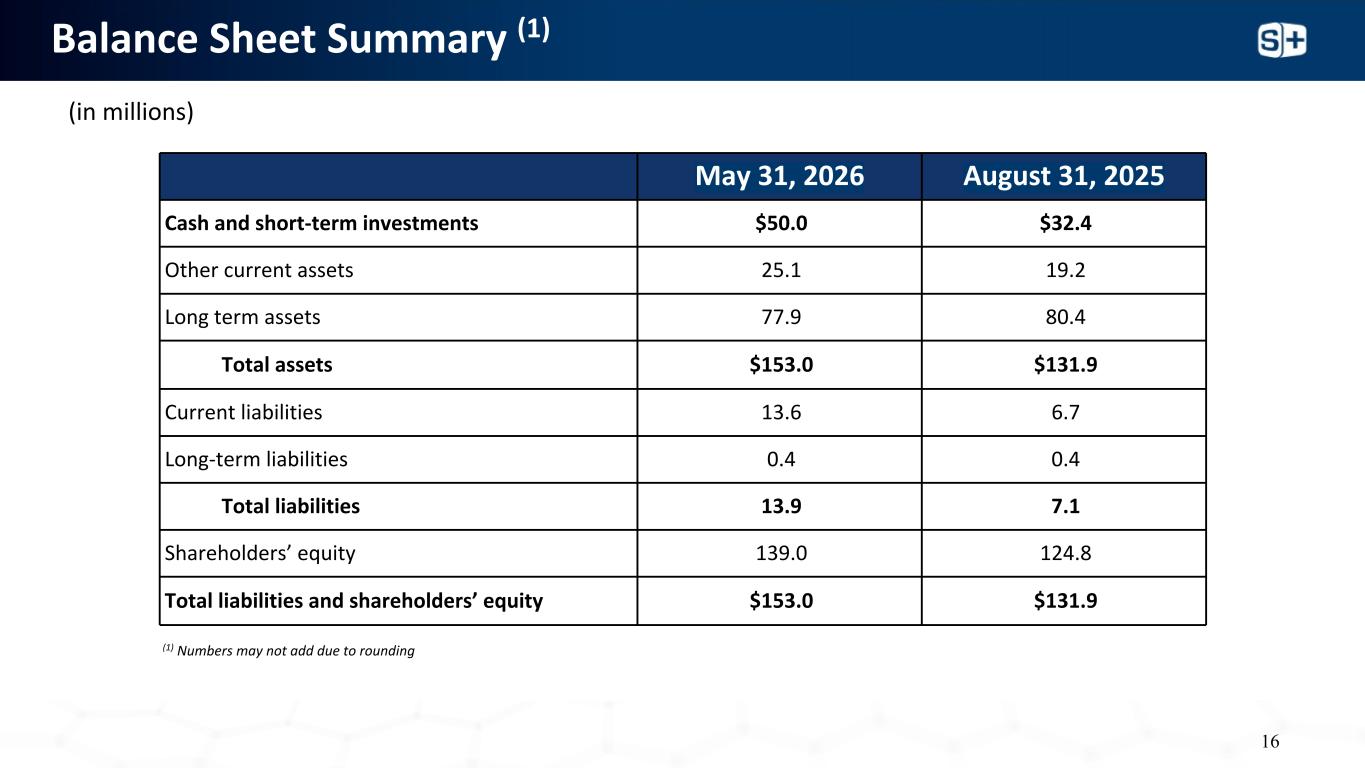
Balance Sheet Summary (1) (in millions) (1) Numbers may not add due to rounding May 31, 2026 August 31, 2025 Cash and short-term investments $50.0 $32.4 Other current assets 25.1 19.2 Long term assets 77.9 80.4 Total assets $153.0 $131.9 Current liabilities 13.6 6.7 Long-term liabilities 0.4 0.4 Total liabilities 13.9 7.1 Shareholders’ equity 139.0 124.8 Total liabilities and shareholders’ equity $153.0 $131.9 16
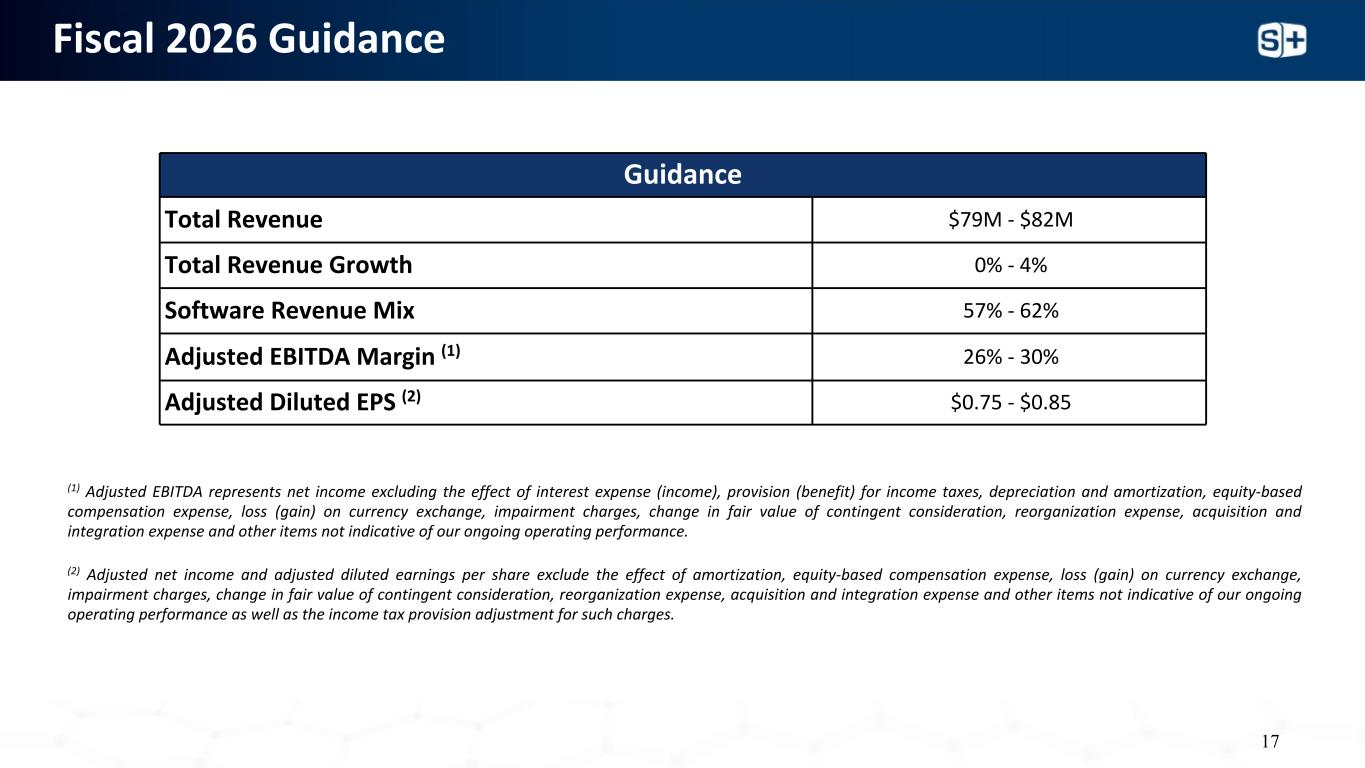
Fiscal 2026 Guidance Guidance Total Revenue $79M - $82M Total Revenue Growth 0% - 4% Software Revenue Mix 57% - 62% Adjusted EBITDA Margin (1) 26% - 30% Adjusted Diluted EPS (2) $0.75 - $0.85 (1) Adjusted EBITDA represents net income excluding the effect of interest expense (income), provision (benefit) for income taxes, depreciation and amortization, equity-based compensation expense, loss (gain) on currency exchange, impairment charges, change in fair value of contingent consideration, reorganization expense, acquisition and integration expense and other items not indicative of our ongoing operating performance. (2) Adjusted net income and adjusted diluted earnings per share exclude the effect of amortization, equity-based compensation expense, loss (gain) on currency exchange, impairment charges, change in fair value of contingent consideration, reorganization expense, acquisition and integration expense and other items not indicative of our ongoing operating performance as well as the income tax provision adjustment for such charges. 17
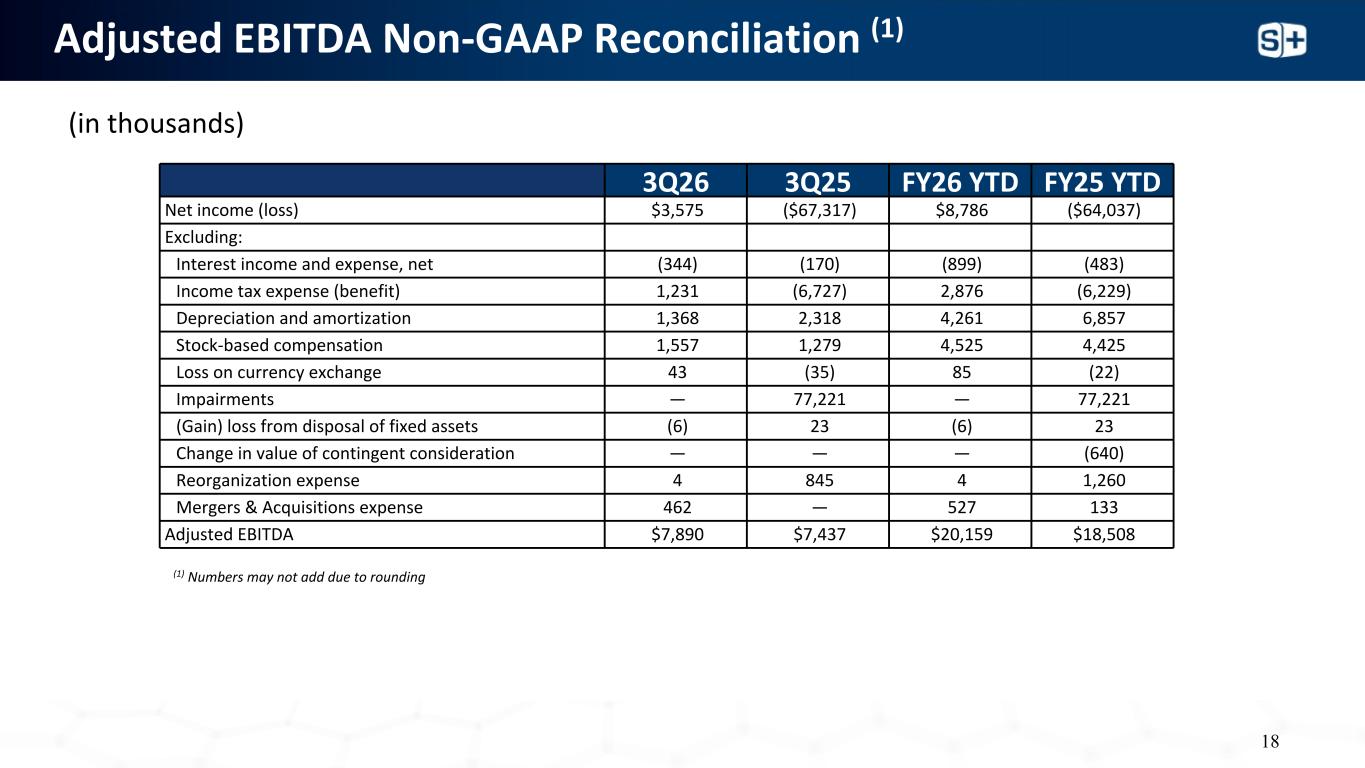
Adjusted EBITDA Non-GAAP Reconciliation (1) 3Q26 3Q25 FY26 YTD FY25 YTD Net income (loss) $3,575 ($67,317) $8,786 ($64,037) Excluding: Interest income and expense, net (344) (170) (899) (483) Income tax expense (benefit) 1,231 (6,727) 2,876 (6,229) Depreciation and amortization 1,368 2,318 4,261 6,857 Stock-based compensation 1,557 1,279 4,525 4,425 Loss on currency exchange 43 (35) 85 (22) Impairments — 77,221 — 77,221 (Gain) loss from disposal of fixed assets (6) 23 (6) 23 Change in value of contingent consideration — — — (640) Reorganization expense 4 845 4 1,260 Mergers & Acquisitions expense 462 — 527 133 Adjusted EBITDA $7,890 $7,437 $20,159 $18,508 (in thousands) (1) Numbers may not add due to rounding 18
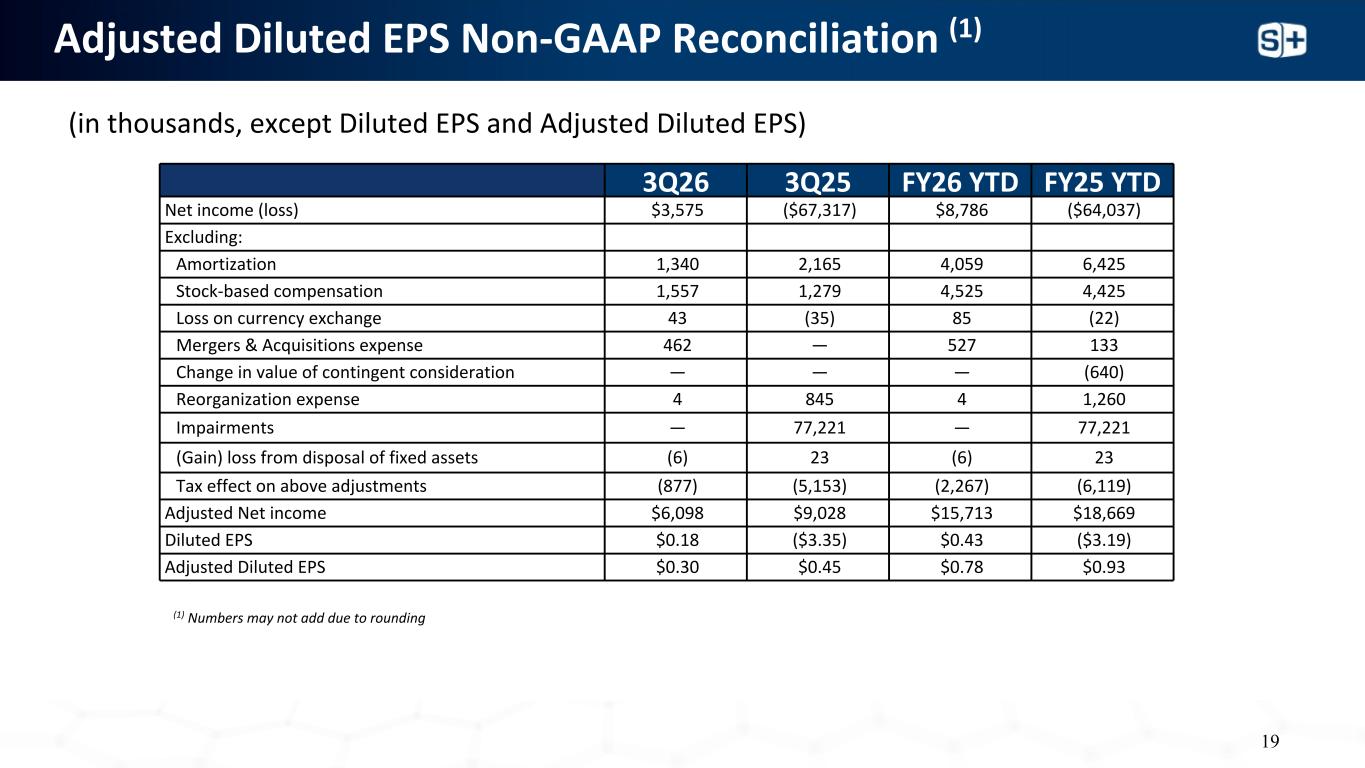
Adjusted Diluted EPS Non-GAAP Reconciliation (1) 3Q26 3Q25 FY26 YTD FY25 YTD Net income (loss) $3,575 ($67,317) $8,786 ($64,037) Excluding: Amortization 1,340 2,165 4,059 6,425 Stock-based compensation 1,557 1,279 4,525 4,425 Loss on currency exchange 43 (35) 85 (22) Mergers & Acquisitions expense 462 — 527 133 Change in value of contingent consideration — — — (640) Reorganization expense 4 845 4 1,260 Impairments — 77,221 — 77,221 (Gain) loss from disposal of fixed assets (6) 23 (6) 23 Tax effect on above adjustments (877) (5,153) (2,267) (6,119) Adjusted Net income $6,098 $9,028 $15,713 $18,669 Diluted EPS $0.18 ($3.35) $0.43 ($3.19) Adjusted Diluted EPS $0.30 $0.45 $0.78 $0.93 (in thousands, except Diluted EPS and Adjusted Diluted EPS) (1) Numbers may not add due to rounding 19

Lisa Fortuna Financial Profiles slp@finprofiles.com | +1-310-622-8251 Investor Relations Contact: Thank You