Shareholder Report
Apr. 30, 2026
USD ($)
$ / shares
WHAT WERE THE FUND COSTS FOR THE PAST YEAR? (based on a hypothetical $10,000 investment)
|
Class Name
|
Costs of a $10,000 investment
|
Costs paid as a percentage of a $10,000 investment
|
|
Institutional Class
|
$110
|
1.03%
|
HOW DID THE FUND PERFORM LAST YEAR AND WHAT AFFECTED ITS PERFORMANCE?
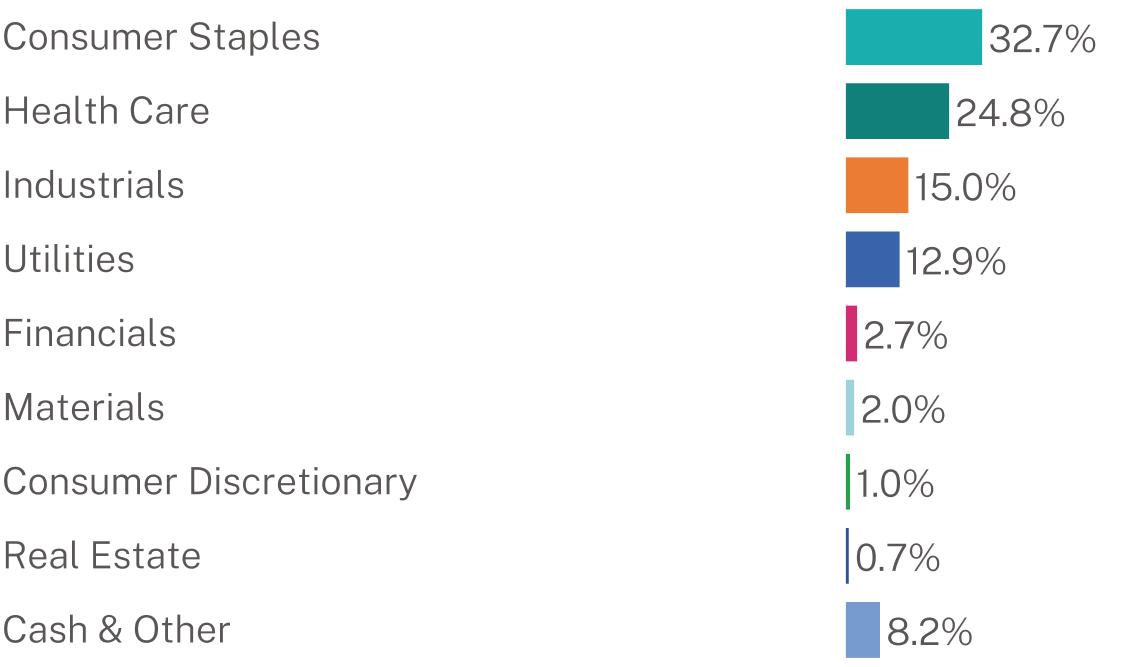
Performance over the last year was challenging with the broad market largely uninterested in concepts other than artificial intelligence (AI), financial speculation, “Mag 7” (Nvidia, Apple, Microsoft, Alphabet, Amazon, Meta Platforms, Tesla), and profitless companies. Unequivocally a difficult investment environment for our process and investment approach here at Nuance. The portfolio’s overweight position in the Consumer Staples sector was a primary detractor to performance. Outperformance by Estée Lauder Companies Inc. (EL) was more than offset by underperformance in Clorox Company (CLX), Henkel AG & Co. KGaA (HENKY), Kimberly-Clark Corporation (KMB), and Beiersdorf AG (BDRFY). We continue to believe that transitory concerns around slower growth in multiple household and personal care product categories have presented strong risk reward opportunities in the sector. Stock selection within the Financials sector contributed positively to performance, driven primarily by Northern Trust Corporation (NTRS). The portfolio’s overweight positioning in the Utilities sector negatively impacted performance primarily driven by our position in California Water Service Group (CWT), which lagged the market, but remains a top risk reward in our opinion. Our positioning in the Industrials sector contributed positively to performance as our holdings within the Ground Transportation industry outperformed, primarily our position in Werner Enterprises, Inc. (WERN). Within the materials sector, our investment in AptarGroup (ATR) underperformed. Health Care positively impacted performance, driven primarily by our investments in Hologic Inc. (HOLX), Thermo Fisher Scientific Inc. (TMO), and Waters Corporation (WAT). The portfolio saw positive attribution from underweight positions in Real Estate and Consumer Discretionary, while our underweight positions in Communication Services, Energy and Information Technology negatively impacted performance. Finally, our cash position was a drag on performance for the year.
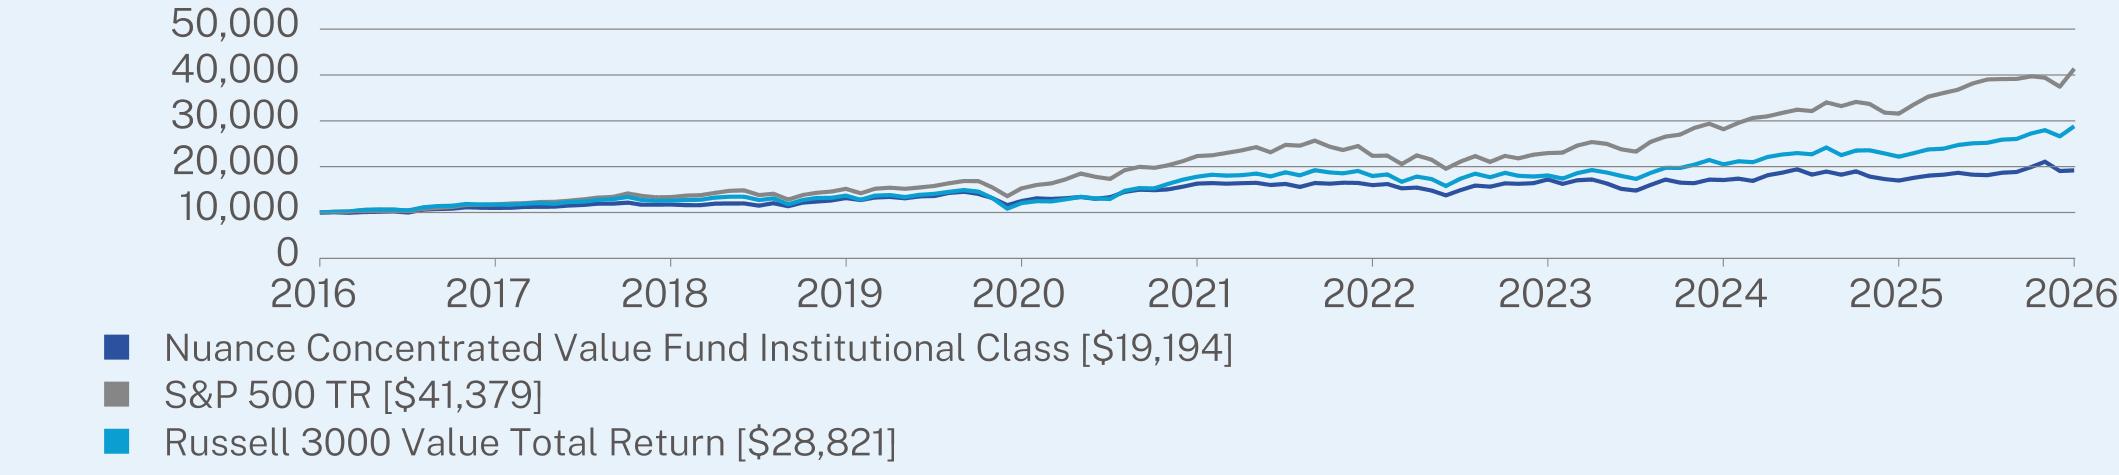
ANNUAL AVERAGE TOTAL RETURN (%)
|
|
1 Year
|
5 Year
|
10 Year
|
|
Institutional Class
|
13.17
|
3.31
|
6.74
|
|
S&P 500 TR
|
31.05
|
13.14
|
15.26
|
|
Russell 3000 Value Total Return
|
29.96
|
10.09
|
11.17
|
Visit https://nuanceinvestments.com/concentrated-value-fund/ for more recent performance information.
KEY FUND STATISTICS (as of April 30, 2026)
|
Net Assets
|
$42,909,086
|
|
Number of Holdings
|
32
|
|
Net Advisory Fee
|
$521,566
|
|
Portfolio Turnover
|
114%
|
WHAT DID THE FUND INVEST IN? (as of April 30, 2026)
|
Top Holdings
|
(% of Net Assets)
|
|
QIAGEN NV
|
9.0%
|
|
Clorox Co.
|
8.9%
|
|
Beiersdorf AG
|
8.8%
|
|
California Water Service Group
|
7.9%
|
|
Marten Transport Ltd.
|
5.7%
|
|
Kimberly-Clark Corp.
|
4.7%
|
|
Solventum Corp.
|
4.7%
|
|
Henkel AG & Co. KGaA
|
4.6%
|
|
Masimo Corp.
|
4.6%
|
|
Kenvue, Inc.
|
4.4%
|
Sector Breakdown (% of net assets)
WHAT WERE THE FUND COSTS FOR THE PAST YEAR? (based on a hypothetical $10,000 investment)
|
Class Name
|
Costs of a $10,000 investment
|
Costs paid as a percentage of a $10,000 investment
|
|
Investor Class
|
$136
|
1.28%
|
HOW DID THE FUND PERFORM LAST YEAR AND WHAT AFFECTED ITS PERFORMANCE?
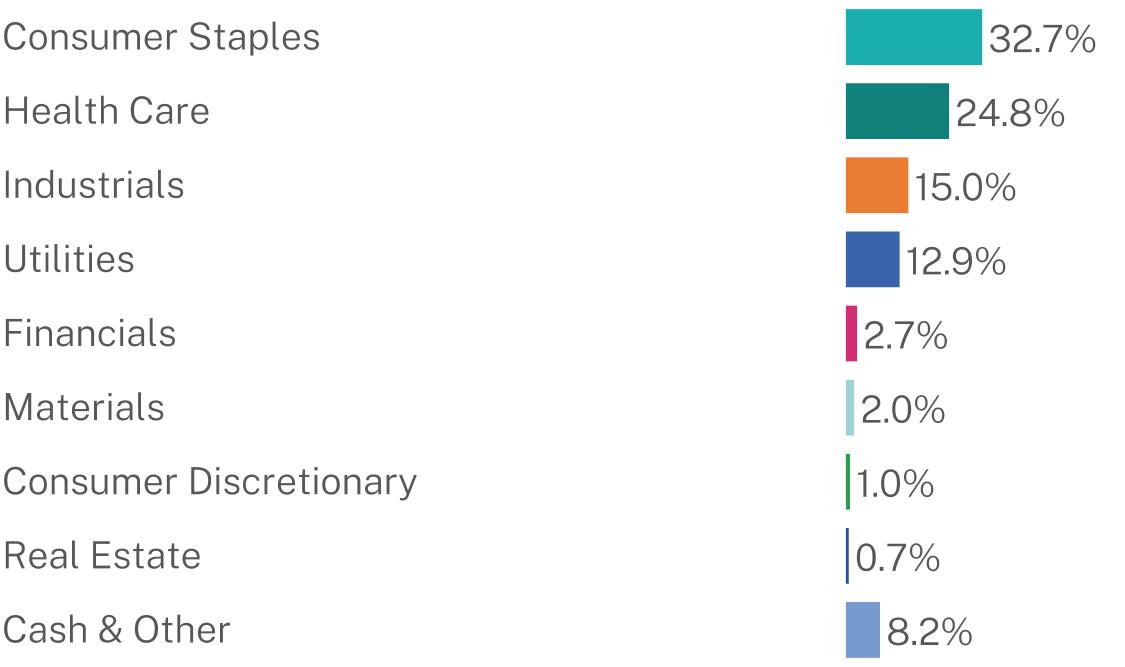
Performance over the last year was challenging with the broad market largely uninterested in concepts other than artificial intelligence (AI), financial speculation, “Mag 7” (Nvidia, Apple, Microsoft, Alphabet, Amazon, Meta Platforms, Tesla), and profitless companies. Unequivocally a difficult investment environment for our process and investment approach here at Nuance. The portfolio’s overweight position in the Consumer Staples sector was a primary detractor to performance. Outperformance by Estée Lauder Companies Inc. (EL) was more than offset by underperformance in Clorox Company (CLX), Henkel AG & Co. KGaA (HENKY), Kimberly-Clark Corporation (KMB), and Beiersdorf AG (BDRFY). We continue to believe that transitory concerns around slower growth in multiple household and personal care product categories have presented strong risk reward opportunities in the sector. Stock selection within the Financials sector contributed positively to performance, driven primarily by Northern Trust Corporation (NTRS). The portfolio’s overweight positioning in the Utilities sector negatively impacted performance primarily driven by our position in California Water Service Group (CWT), which lagged the market, but remains a top risk reward in our opinion. Our positioning in the Industrials sector contributed positively to performance as our holdings within the Ground Transportation industry outperformed, primarily our position in Werner Enterprises, Inc. (WERN). Within the materials sector, our investment in AptarGroup (ATR) underperformed. Health Care positively impacted performance, driven primarily by our investments in Hologic Inc. (HOLX), Thermo Fisher Scientific Inc. (TMO), and Waters Corporation (WAT). The portfolio saw positive attribution from underweight positions in Real Estate and Consumer Discretionary, while our underweight positions in Communication Services, Energy and Information Technology negatively impacted performance. Finally, our cash position was a drag on performance for the year.
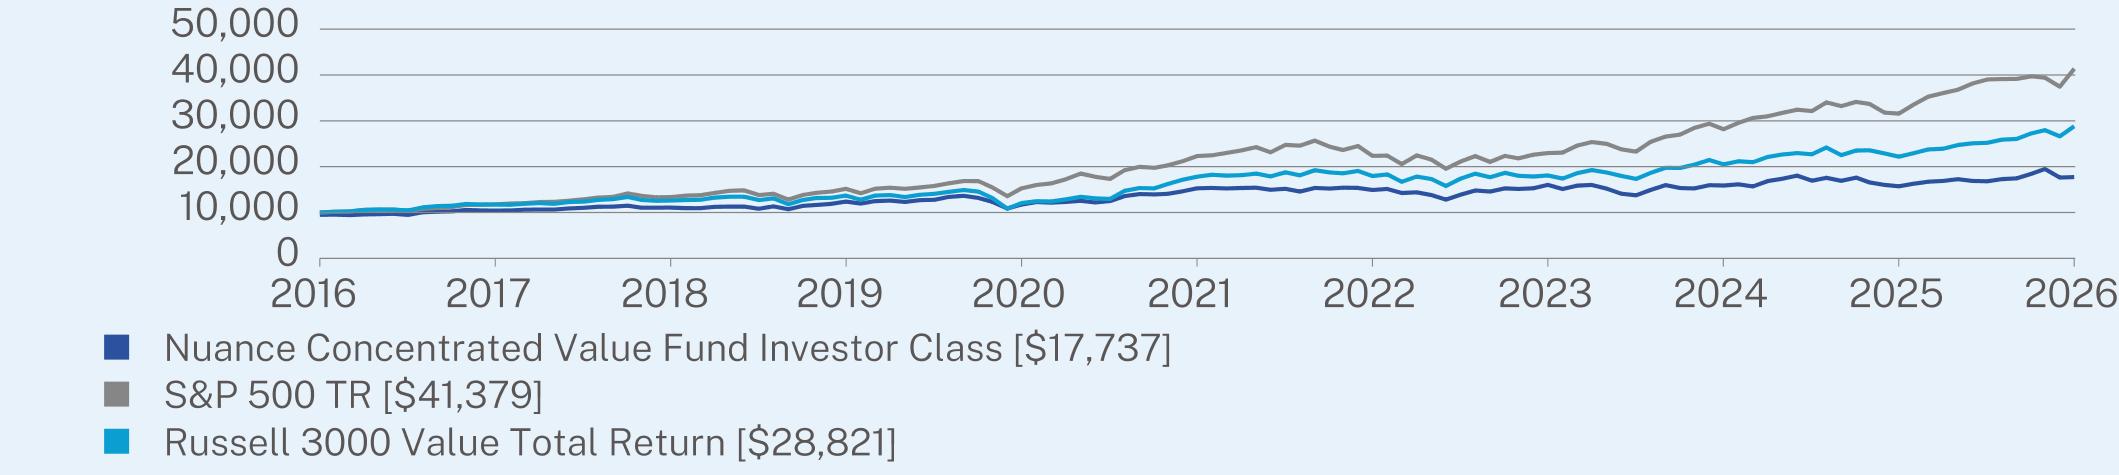
ANNUAL AVERAGE TOTAL RETURN (%)
|
|
1 Year
|
5 Year
|
10 Year
|
|
Investor Class (without sales charge)
|
12.90
|
3.03
|
6.45
|
|
Investor Class (with maximum 5.00% sales charge)
|
7.26
|
1.98
|
5.90
|
|
S&P 500 TR
|
31.05
|
13.14
|
15.26
|
|
Russell 3000 Value Total Return
|
29.96
|
10.09
|
11.17
|
Visit https://nuanceinvestments.com/concentrated-value-fund/ for more recent performance information.
KEY FUND STATISTICS (as of April 30, 2026)
|
Net Assets
|
$42,909,086
|
|
Number of Holdings
|
32
|
|
Net Advisory Fee
|
$521,566
|
|
Portfolio Turnover
|
114%
|
WHAT DID THE FUND INVEST IN? (as of April 30, 2026)
|
Top Holdings
|
(% of Net Assets)
|
|
QIAGEN NV
|
9.0%
|
|
Clorox Co.
|
8.9%
|
|
Beiersdorf AG
|
8.8%
|
|
California Water Service Group
|
7.9%
|
|
Marten Transport Ltd.
|
5.7%
|
|
Kimberly-Clark Corp.
|
4.7%
|
|
Solventum Corp.
|
4.7%
|
|
Henkel AG & Co. KGaA
|
4.6%
|
|
Masimo Corp.
|
4.6%
|
|
Kenvue, Inc.
|
4.4%
|
Sector Breakdown (% of net assets)
WHAT WERE THE FUND COSTS FOR THE PAST YEAR? (based on a hypothetical $10,000 investment)
|
Class Name
|
Costs of a $10,000 investment
|
Costs paid as a percentage of a $10,000 investment
|
|
Institutional Class
|
$101
|
0.94%
|
HOW DID THE FUND PERFORM LAST YEAR AND WHAT AFFECTED ITS PERFORMANCE?
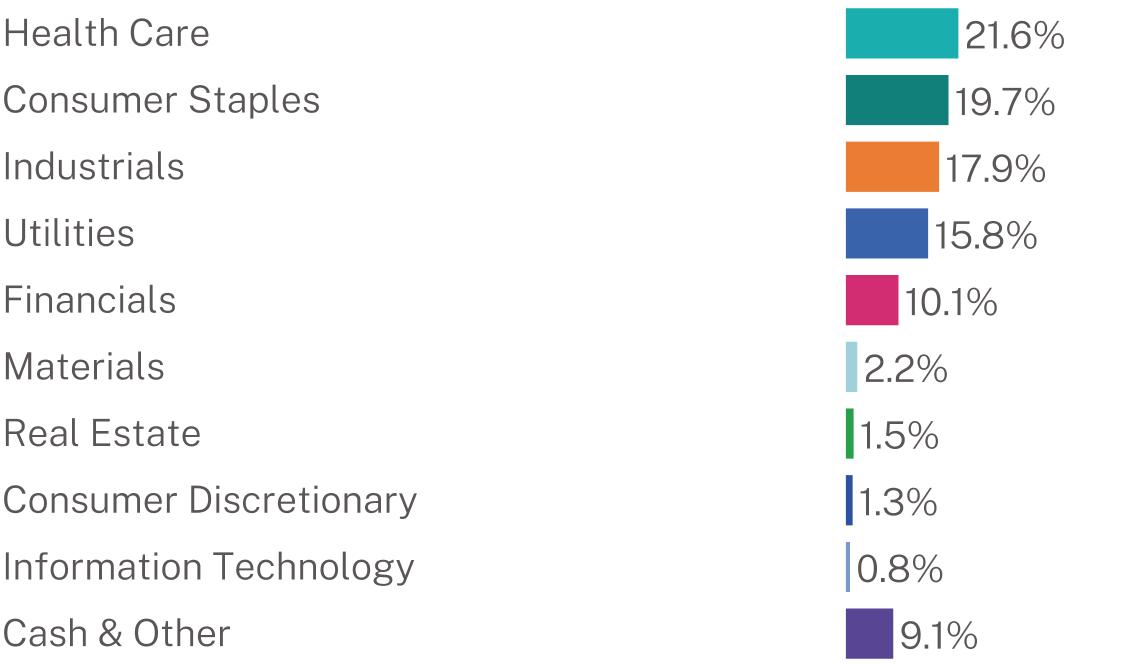
Performance over the last year was challenging with the broad market largely uninterested in concepts other than artificial intelligence (AI), financial speculation, “Mag 7” (Nvidia, Apple, Microsoft, Alphabet, Amazon, Meta Platforms, Tesla), and profitless companies. Unequivocally a difficult investment environment for our process and investment approach here at Nuance. The portfolio’s overweight position in the Consumer Staples sector was a primary detractor to performance. Outperformance by Estée Lauder Companies Inc. (EL) was more than offset by underperformance in Clorox Company (CLX), Henkel AG & Co. KGaA (HENKY), Kimberly-Clark Corporation (KMB), and Beiersdorf AG (BDRFY). We continue to believe that transitory concerns around slower growth in multiple household and personal care product categories have presented strong risk reward opportunities in the sector. Stock selection within the Financials sector contributed positively to performance, driven primarily by Northern Trust Corporation (NTRS). The portfolio’s overweight positioning in the Utilities sector negatively impacted performance primarily driven by our position in California Water Service Group (CWT), which lagged the market, but remains a top risk reward in our opinion. Our positioning in the Industrials sector contributed positively to performance as our holdings within the Ground Transportation industry outperformed, primarily our position in Werner Enterprises, Inc. (WERN). Health Care negatively impacted performance, driven primarily by our investment in QIAGEN NV (QGEN), which we have added to over the course of the year. Within the materials sector, our investment in AptarGroup (ATR) underperformed. The portfolio saw positive attribution from underweight positions in Real Estate, Communication Services, and Consumer Discretionary, while our underweight positions in Energy and Information Technology negatively impacted performance. Finally, our cash position was a drag on performance for the year.
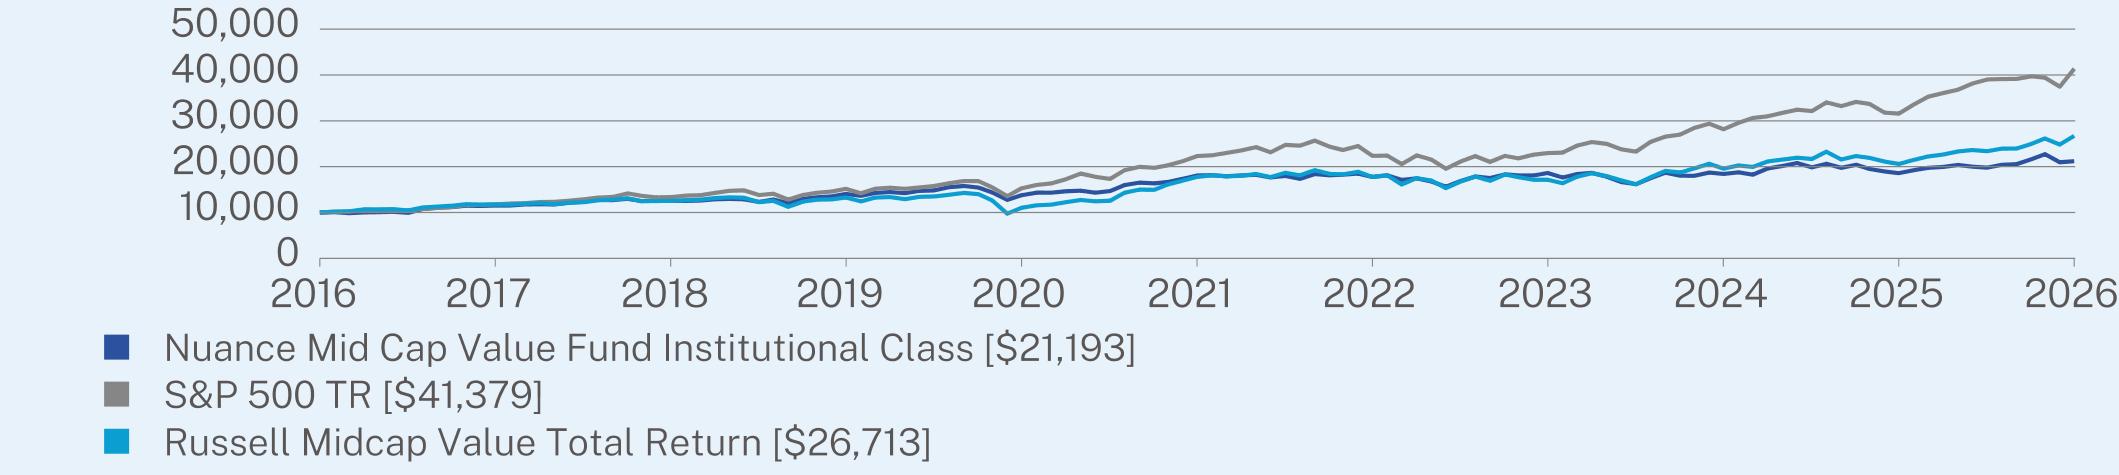
ANNUAL AVERAGE TOTAL RETURN (%)
|
|
1 Year
|
5 Year
|
10 Year
|
|
Institutional Class
|
14.01
|
3.24
|
7.80
|
|
S&P 500 TR
|
31.05
|
13.14
|
15.26
|
|
Russell Midcap Value Total Return
|
29.76
|
8.50
|
10.32
|
Visit https://nuanceinvestments.com/mid-cap-value-fund/ for more recent performance information.
KEY FUND STATISTICS (as of April 30, 2026)
|
Net Assets
|
$289,467,910
|
|
Number of Holdings
|
55
|
|
Net Advisory Fee
|
$3,107,253
|
|
Portfolio Turnover
|
110%
|
WHAT DID THE FUND INVEST IN? (as of April 30, 2026)
|
Top Holdings
|
(% of Net Assets)
|
|
California Water Service Group
|
7.0%
|
|
QIAGEN NV
|
6.7%
|
|
Marten Transport Ltd.
|
5.8%
|
|
Clorox Co.
|
4.8%
|
|
Beiersdorf AG
|
4.7%
|
|
Werner Enterprises, Inc.
|
4.5%
|
|
Solventum Corp.
|
4.5%
|
|
Charles Schwab Corp.
|
3.6%
|
|
Kenvue, Inc.
|
3.1%
|
|
Henkel AG & Co. KGaA - ADR
|
2.9%
|
Sector Breakdown (% of net assets)
MATERIAL FUND CHANGES
Effective August 28, 2025, the Investment Adviser has contractually agreed to waive its investment advisory fee and reimburse the Fund’s other expenses to the extent necessary to ensure that the Fund’s operating expenses (excluding acquired fund fees and expenses, brokerage commissions, leverage, interest, taxes, and extraordinary expense) do not exceed 0.95% of its average daily net assets of the Fund’s Institutional Class. Prior to August 28, 2025, the Investment Adviser had contractually agreed to cap this rate at 0.93% of average daily net assets of the Fund’s Institutional Class.
WHAT WERE THE FUND COSTS FOR THE PAST YEAR? (based on a hypothetical $10,000 investment)
|
Class Name
|
Costs of a $10,000 investment
|
Costs paid as a percentage of a $10,000 investment
|
|
Investor Class
|
$127
|
1.19%
|
HOW DID THE FUND PERFORM LAST YEAR AND WHAT AFFECTED ITS PERFORMANCE?
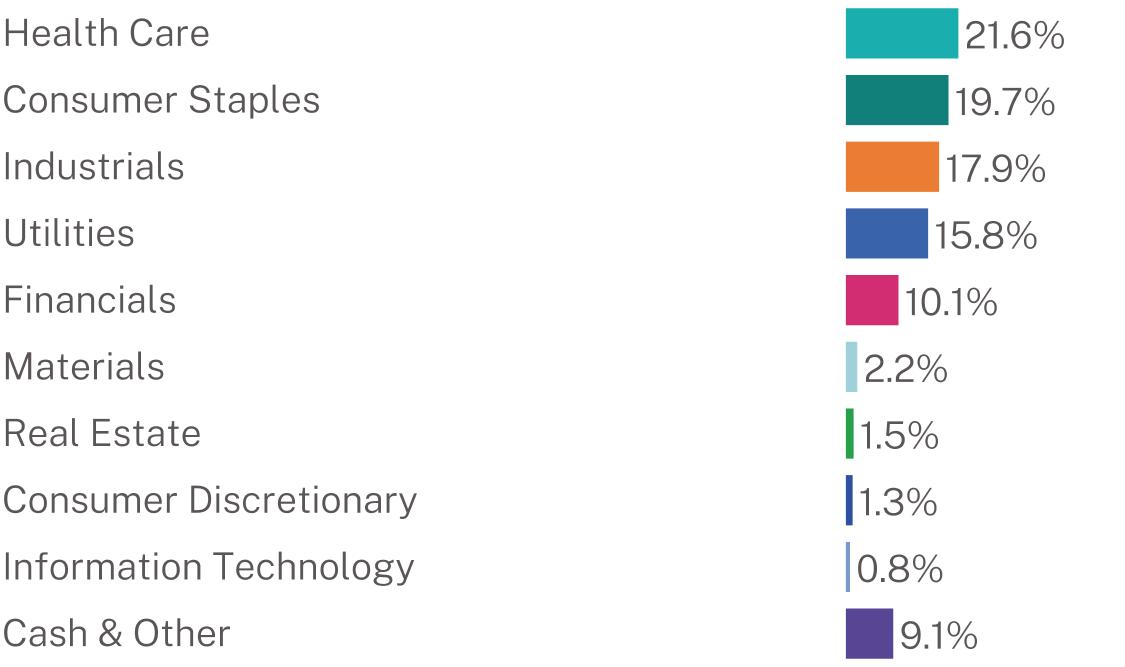
Performance over the last year was challenging with the broad market largely uninterested in concepts other than artificial intelligence (AI), financial speculation, “Mag 7” (Nvidia, Apple, Microsoft, Alphabet, Amazon, Meta Platforms, Tesla), and profitless companies. Unequivocally a difficult investment environment for our process and investment approach here at Nuance. The portfolio’s overweight position in the Consumer Staples sector was a primary detractor to performance. Outperformance by Estée Lauder Companies Inc. (EL) was more than offset by underperformance in Clorox Company (CLX), Henkel AG & Co. KGaA (HENKY), Kimberly-Clark Corporation (KMB), and Beiersdorf AG (BDRFY). We continue to believe that transitory concerns around slower growth in multiple household and personal care product categories have presented strong risk reward opportunities in the sector. Stock selection within the Financials sector contributed positively to performance, driven primarily by Northern Trust Corporation (NTRS). The portfolio’s overweight positioning in the Utilities sector negatively impacted performance primarily driven by our position in California Water Service Group (CWT), which lagged the market, but remains a top risk reward in our opinion. Our positioning in the Industrials sector contributed positively to performance as our holdings within the Ground Transportation industry outperformed, primarily our position in Werner Enterprises, Inc. (WERN). Health Care negatively impacted performance, driven primarily by our investment in QIAGEN NV (QGEN), which we have added to over the course of the year. Within the materials sector, our investment in AptarGroup (ATR) underperformed. The portfolio saw positive attribution from underweight positions in Real Estate, Communication Services, and Consumer Discretionary, while our underweight positions in Energy and Information Technology negatively impacted performance. Finally, our cash position was a drag on performance for the year.
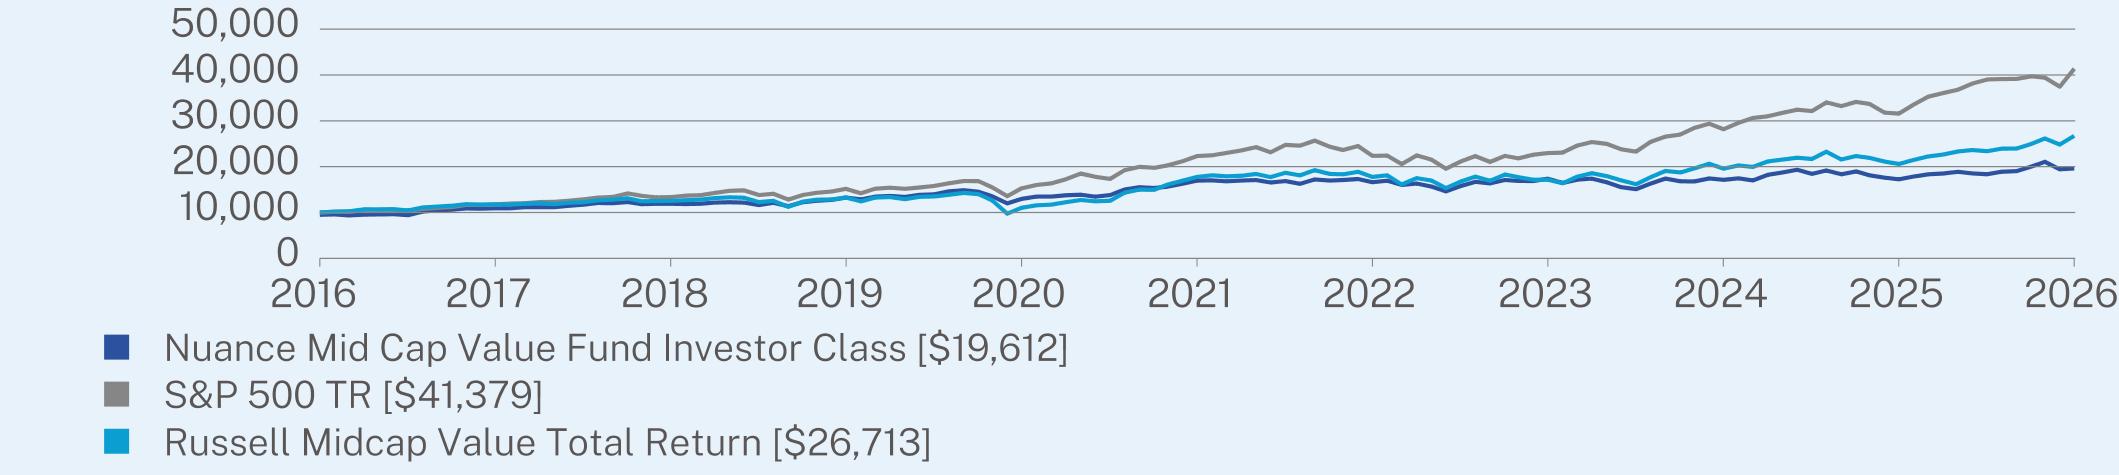
ANNUAL AVERAGE TOTAL RETURN (%)
|
|
1 Year
|
5 Year
|
10 Year
|
|
Investor Class (without sales charge)
|
13.69
|
2.94
|
7.51
|
|
Investor Class (with maximum 5.00% sales charge)
|
8.00
|
1.89
|
6.97
|
|
S&P 500 TR
|
31.05
|
13.14
|
15.26
|
|
Russell Midcap Value Total Return
|
29.76
|
8.50
|
10.32
|
Visit https://nuanceinvestments.com/mid-cap-value-fund/ for more recent performance information.
KEY FUND STATISTICS (as of April 30, 2026)
|
Net Assets
|
$289,467,910
|
|
Number of Holdings
|
55
|
|
Net Advisory Fee
|
$3,107,253
|
|
Portfolio Turnover
|
110%
|
WHAT DID THE FUND INVEST IN? (as of April 30, 2026)
|
Top Holdings
|
(% of Net Assets)
|
|
California Water Service Group
|
7.0%
|
|
QIAGEN NV
|
6.7%
|
|
Marten Transport Ltd.
|
5.8%
|
|
Clorox Co.
|
4.8%
|
|
Beiersdorf AG
|
4.7%
|
|
Werner Enterprises, Inc.
|
4.5%
|
|
Solventum Corp.
|
4.5%
|
|
Charles Schwab Corp.
|
3.6%
|
|
Kenvue, Inc.
|
3.1%
|
|
Henkel AG & Co. KGaA - ADR
|
2.9%
|
Sector Breakdown (% of net assets)
MATERIAL FUND CHANGES
Effective August 28, 2025, the Investment Adviser has contractually agreed to waive its investment advisory fee and reimburse the Fund’s other expenses to the extent necessary to ensure that the Fund’s operating expenses (excluding acquired fund fees and expenses, brokerage commissions, leverage, interest, taxes, and extraordinary expense) do not exceed 1.20% of its average daily net assets of the Fund’s Investor Class. Prior to August 28, 2025, the Investment Adviser had contractually agreed to cap this rate at 1.18% of average daily net assets of the Fund’s Investor Class.
WHAT WERE THE FUND COSTS FOR THE PAST YEAR? (based on a hypothetical $10,000 investment)
|
Class Name
|
Costs of a $10,000 investment
|
Costs paid as a percentage of a $10,000 investment
|
|
Z Class
|
$85
|
0.79%
|
HOW DID THE FUND PERFORM LAST YEAR AND WHAT AFFECTED ITS PERFORMANCE?
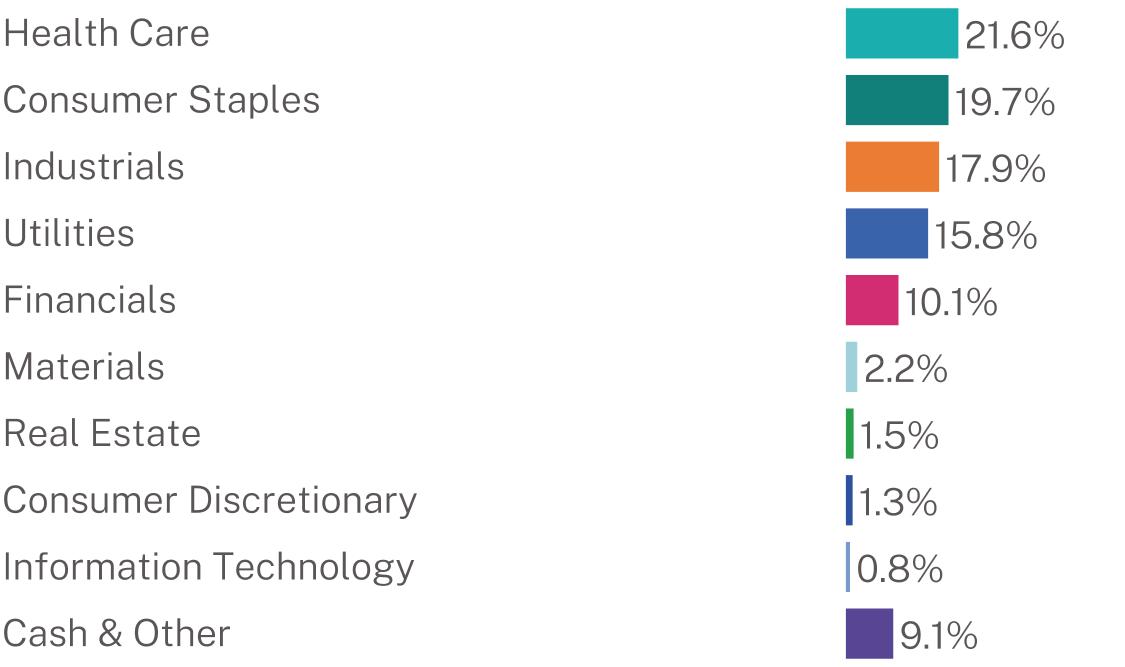
Performance over the last year was challenging with the broad market largely uninterested in concepts other than artificial intelligence (AI), financial speculation, “Mag 7” (Nvidia, Apple, Microsoft, Alphabet, Amazon, Meta Platforms, Tesla), and profitless companies. Unequivocally a difficult investment environment for our process and investment approach here at Nuance. The portfolio’s overweight position in the Consumer Staples sector was a primary detractor to performance. Outperformance by Estée Lauder Companies Inc. (EL) was more than offset by underperformance in Clorox Company (CLX), Henkel AG & Co. KGaA (HENKY), Kimberly-Clark Corporation (KMB), and Beiersdorf AG (BDRFY). We continue to believe that transitory concerns around slower growth in multiple household and personal care product categories have presented strong risk reward opportunities in the sector. Stock selection within the Financials sector contributed positively to performance, driven primarily by Northern Trust Corporation (NTRS). The portfolio’s overweight positioning in the Utilities sector negatively impacted performance primarily driven by our position in California Water Service Group (CWT), which lagged the market, but remains a top risk reward in our opinion. Our positioning in the Industrials sector contributed positively to performance as our holdings within the Ground Transportation industry outperformed, primarily our position in Werner Enterprises, Inc. (WERN). Health Care negatively impacted performance, driven primarily by our investment in QIAGEN NV (QGEN), which we have added to over the course of the year. Within the materials sector, our investment in AptarGroup (ATR) underperformed. The portfolio saw positive attribution from underweight positions in Real Estate, Communication Services, and Consumer Discretionary, while our underweight positions in Energy and Information Technology negatively impacted performance. Finally, our cash position was a drag on performance for the year.
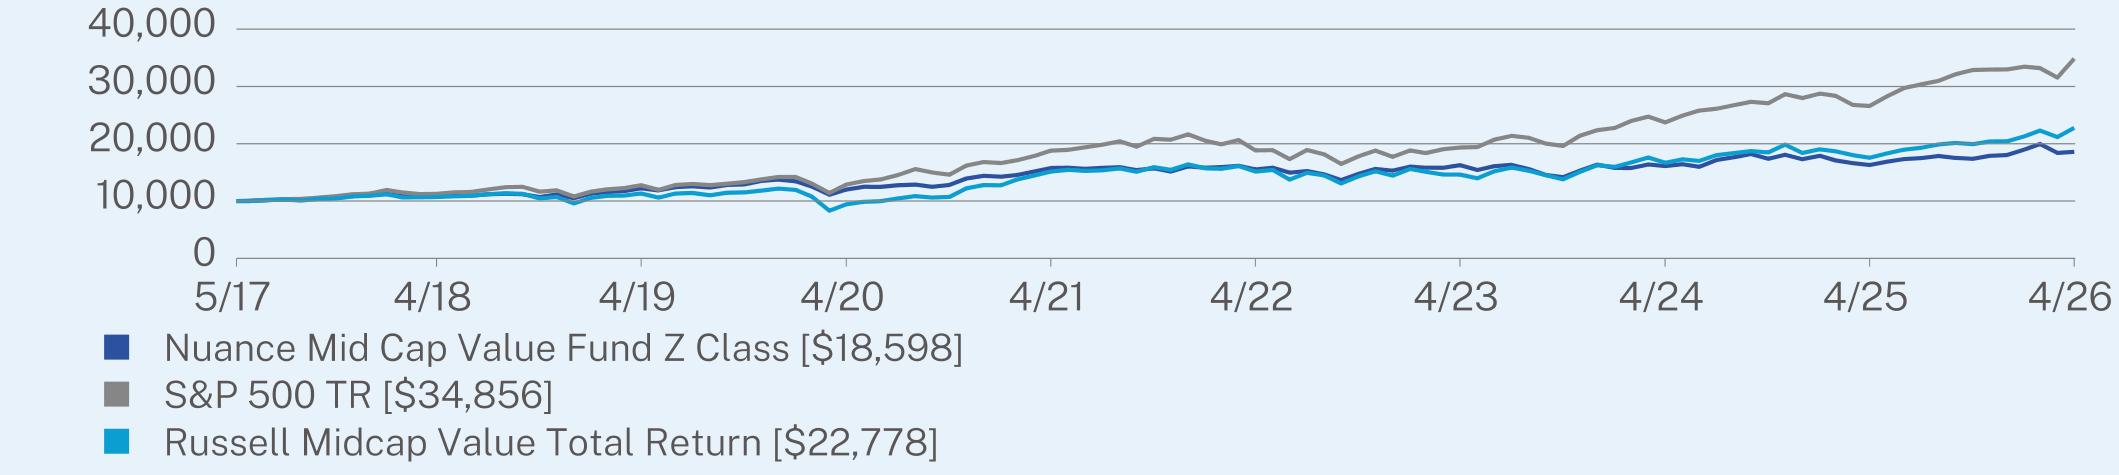
ANNUAL AVERAGE TOTAL RETURN (%)
|
|
1 Year
|
5 Year
|
Since Inception
(05/08/2017) |
|
Z Class
|
14.16
|
3.36
|
7.16
|
|
S&P 500 TR
|
31.05
|
13.14
|
14.92
|
|
Russell Midcap Value Total Return
|
29.76
|
8.50
|
9.60
|
Visit https://nuanceinvestments.com/mid-cap-value-fund/ for more recent performance information.
KEY FUND STATISTICS (as of April 30, 2026)
|
Net Assets
|
$289,467,910
|
|
Number of Holdings
|
55
|
|
Net Advisory Fee
|
$3,107,253
|
|
Portfolio Turnover
|
110%
|
WHAT DID THE FUND INVEST IN? (as of April 30, 2026)
|
Top Holdings
|
(% of Net Assets)
|
|
California Water Service Group
|
7.0%
|
|
QIAGEN NV
|
6.7%
|
|
Marten Transport Ltd.
|
5.8%
|
|
Clorox Co.
|
4.8%
|
|
Beiersdorf AG
|
4.7%
|
|
Werner Enterprises, Inc.
|
4.5%
|
|
Solventum Corp.
|
4.5%
|
|
Charles Schwab Corp.
|
3.6%
|
|
Kenvue, Inc.
|
3.1%
|
|
Henkel AG & Co. KGaA - ADR
|
2.9%
|
Sector Breakdown (% of net assets)
MATERIAL FUND CHANGES
Effective August 28, 2025, the Investment Adviser has contractually agreed to waive its investment advisory fee and reimburse the Fund’s other expenses to the extent necessary to ensure that the Fund’s operating expenses (excluding acquired fund fees and expenses, brokerage commissions, leverage, interest, taxes, and extraordinary expense) do not exceed 0.80% of its average daily net assets of the Fund’s Z Class. Prior to August 28, 2025, the Investment Adviser had contractually agreed to cap this rate at 0.78% of average daily net assets of the Fund’s Z Class.