Pay vs Performance Disclosure - USD ($)
Mar. 31, 2024
Aug. 21, 2023
Mar. 10, 2024
Mar. 31, 2026
Mar. 31, 2025
Mar. 31, 2024
Pay Versus Performance
In accordance with rules adopted by the SEC pursuant to the Dodd-Frank Wall Street Reform and Consumer Protection Act of 2010, we provide the following disclosure regarding executive “Compensation Actually Paid” (“CAP”) and certain performance measures required for Smaller Reporting Companies. The following table provides the information required for our NEOs for each of the fiscal years ended March 31, 2024, March 31, 2025, and March 31, 2026 along with the required financial information for each fiscal year:
CEO | Non-CEO NEOs | Value of Initial Fixed of $100 Investment Based on Total Shareholder Return(3) ($) | Net Income (Loss) (in millions) ($) | |||||||||||||||
Year | Summary Compensation Table Total(1) ($) | Compensation Actually Paid(1) ($) | Average Summary Compensation Table Total(2) ($) | Average Compensation Actually Paid(1)(2) ($) | ||||||||||||||
2026(4) | 1,566,023 | 3,879,004 | 238,398 | 295,799 | 519.05 | 2.8 | ||||||||||||
2025(4) | 1,457,102 | 1,320,602 | 826,337 | 815,537 | 71.43 | (7.2) | ||||||||||||
2024(4) | 493,654 | 493,654 | 765,743 | 374,493 | 100.00 | 7.4 | ||||||||||||
2024(5) | 449,511 | 449,511 | — | — | — | — | ||||||||||||
2024(6) | 670,622 | 206,010 | — | — | — | — | ||||||||||||
(1) | SEC rules require certain adjustments be made to the Summary Compensation Table totals to determine CAP as reported in the Pay Versus Performance table. CAP does not necessarily represent cash and/or equity value transferred to the applicable NEO without restriction, but rather is a value calculated under applicable SEC rules. A significant portion of the CAP amounts shown relate to changes in values of unvested awards over the course of the applicable reporting year. Our NEOs do not participate in a defined benefit plan, so no adjustment for pension benefits is included in the table below. |
(2) | Non-CEO NEOs reflect the average Summary Compensation Table total compensation and average Compensation Actually Paid for the following executives by year: |
2026: John J. Juric and John P. Miller
2025 and 2024: John J. Juric
(3) | Because we have less than three full years of trading data, for purposes of the requirement in Item 402(v)(2)(iv), we measure cumulative total shareholder return beginning on the date of our emergence from bankruptcy. Total shareholder return is calculated using the fair value of our Common Stock as set forth in valuation reports as of March 31, 2024 and December 7, 2023. |
(4) | CEO reflects Vince J. Canino, who became President and CEO of the Company on March 11, 2024. |
(5) | CEO reflects Robert C. Flexon, who was appointed Executive Chairman on August 9, 2023 and served as our Interim President and CEO of the Company from August 22, 2023 until March 10, 2024. Mr. Flexon remained Executive Chairman until March 31, 2024. |
(6) | CEO reflects Darren R. Jamison, who served as our President and CEO until August 22, 2023. |
The following tables below details these adjustments to compensation as reported in the Summary Compensation Table for our CEOs and the average of our non-CEO NEOs:
2026 | 2025 | 2024 | |||||||||||||
Vince J. Canino | Vince J. Canino | Vince J. Canino | Robert C. Flexon | Darren R. Jamison | |||||||||||
Total Compensation from Summary Compensation Table | $1,566,023 | $1,457,102 | $493,654 | $449,511 | $670,622 | ||||||||||
Adjustment for grant date values in the Summary Compensation Table | $(71,905) | $(46,500) | $(472,500) | $(35,869) | $(362,167) | ||||||||||
Year-end fair value of unvested awards granted in the current year | $671,031 | $37,500 | $472,500 | — | — | ||||||||||
Year-over-year difference of year-end fair values for unvested awards granted in prior years | $866,772 | $(90,000) | — | — | — | ||||||||||
Fair values at vest date for awards granted and vested in current year | — | — | — | $35,869 | — | ||||||||||
Difference in fair value between prior year-end fair values and vest date fair values for awards granted in prior years | $847,083 | $(37,500) | — | — | $(2,888) | ||||||||||
Forfeitures during current year equal to prior year-end fair value | — | — | — | — | $(99,557) | ||||||||||
Total Adjustments for Equity Awards | $2,312,981 | $(136,500) | — | — | $(464,612) | ||||||||||
Compensation Actually Paid (as calculated) | $3,879,004 | $1,320,602 | $493,654 | $449,511 | $206,010 | ||||||||||
2026 | 2025 | 2024 | |||||||
Average Non- CEO NEOs | Average Non- CEO NEOs | Average Non- CEO NEOs | |||||||
Total Compensation from Summary Compensation Table | $238,398 | $826,337 | $765,743 | ||||||
Adjustment for grant date values in the Summary Compensation Table | $(21,900) | $(55,800) | $(292,590) | ||||||
Year-end fair value of unvested awards granted in the current year | $11,306 | $45,000 | — | ||||||
Year-over-year difference of year-end fair values for unvested awards granted in prior years | — | — | — | ||||||
Fair values at vest date for awards granted and vested in current year | $43,750 | — | $67,590 | ||||||
Difference in fair value between prior year-end fair values and vest date fair values for awards granted in prior years | $41,120 | — | — | ||||||
Forfeitures during current year equal to prior year-end fair value | $(16,875) | — | $(166,250) | ||||||
Total Adjustments for Equity Awards | $57,401 | $(10,800) | $(391,250) | ||||||
Compensation Actually Paid (as calculated) | $295,799 | $815,537 | $374,493 | ||||||
(2) | Non-CEO NEOs reflect the average Summary Compensation Table total compensation and average Compensation Actually Paid for the following executives by year: |
2026: John J. Juric and John P. Miller
2025 and 2024: John J. Juric
(4) | CEO reflects Vince J. Canino, who became President and CEO of the Company on March 11, 2024. |
(5) | CEO reflects Robert C. Flexon, who was appointed Executive Chairman on August 9, 2023 and served as our Interim President and CEO of the Company from August 22, 2023 until March 10, 2024. Mr. Flexon remained Executive Chairman until March 31, 2024. |
(6) | CEO reflects Darren R. Jamison, who served as our President and CEO until August 22, 2023. |
(1) | SEC rules require certain adjustments be made to the Summary Compensation Table totals to determine CAP as reported in the Pay Versus Performance table. CAP does not necessarily represent cash and/or equity value transferred to the applicable NEO without restriction, but rather is a value calculated under applicable SEC rules. A significant portion of the CAP amounts shown relate to changes in values of unvested awards over the course of the applicable reporting year. Our NEOs do not participate in a defined benefit plan, so no adjustment for pension benefits is included in the table below. |
The following tables below details these adjustments to compensation as reported in the Summary Compensation Table for our CEOs and the average of our non-CEO NEOs:
2026 | 2025 | 2024 | |||||||||||||
Vince J. Canino | Vince J. Canino | Vince J. Canino | Robert C. Flexon | Darren R. Jamison | |||||||||||
Total Compensation from Summary Compensation Table | $1,566,023 | $1,457,102 | $493,654 | $449,511 | $670,622 | ||||||||||
Adjustment for grant date values in the Summary Compensation Table | $(71,905) | $(46,500) | $(472,500) | $(35,869) | $(362,167) | ||||||||||
Year-end fair value of unvested awards granted in the current year | $671,031 | $37,500 | $472,500 | — | — | ||||||||||
Year-over-year difference of year-end fair values for unvested awards granted in prior years | $866,772 | $(90,000) | — | — | — | ||||||||||
Fair values at vest date for awards granted and vested in current year | — | — | — | $35,869 | — | ||||||||||
Difference in fair value between prior year-end fair values and vest date fair values for awards granted in prior years | $847,083 | $(37,500) | — | — | $(2,888) | ||||||||||
Forfeitures during current year equal to prior year-end fair value | — | — | — | — | $(99,557) | ||||||||||
Total Adjustments for Equity Awards | $2,312,981 | $(136,500) | — | — | $(464,612) | ||||||||||
Compensation Actually Paid (as calculated) | $3,879,004 | $1,320,602 | $493,654 | $449,511 | $206,010 | ||||||||||
(1) | SEC rules require certain adjustments be made to the Summary Compensation Table totals to determine CAP as reported in the Pay Versus Performance table. CAP does not necessarily represent cash and/or equity value transferred to the applicable NEO without restriction, but rather is a value calculated under applicable SEC rules. A significant portion of the CAP amounts shown relate to changes in values of unvested awards over the course of the applicable reporting year. Our NEOs do not participate in a defined benefit plan, so no adjustment for pension benefits is included in the table below. |
The following tables below details these adjustments to compensation as reported in the Summary Compensation Table for our CEOs and the average of our non-CEO NEOs:
2026 | 2025 | 2024 | |||||||
Average Non- CEO NEOs | Average Non- CEO NEOs | Average Non- CEO NEOs | |||||||
Total Compensation from Summary Compensation Table | $238,398 | $826,337 | $765,743 | ||||||
Adjustment for grant date values in the Summary Compensation Table | $(21,900) | $(55,800) | $(292,590) | ||||||
Year-end fair value of unvested awards granted in the current year | $11,306 | $45,000 | — | ||||||
Year-over-year difference of year-end fair values for unvested awards granted in prior years | — | — | — | ||||||
Fair values at vest date for awards granted and vested in current year | $43,750 | — | $67,590 | ||||||
Difference in fair value between prior year-end fair values and vest date fair values for awards granted in prior years | $41,120 | — | — | ||||||
Forfeitures during current year equal to prior year-end fair value | $(16,875) | — | $(166,250) | ||||||
Total Adjustments for Equity Awards | $57,401 | $(10,800) | $(391,250) | ||||||
Compensation Actually Paid (as calculated) | $295,799 | $815,537 | $374,493 | ||||||
Compensation Actually Paid and Cumulative Total Shareholder Return
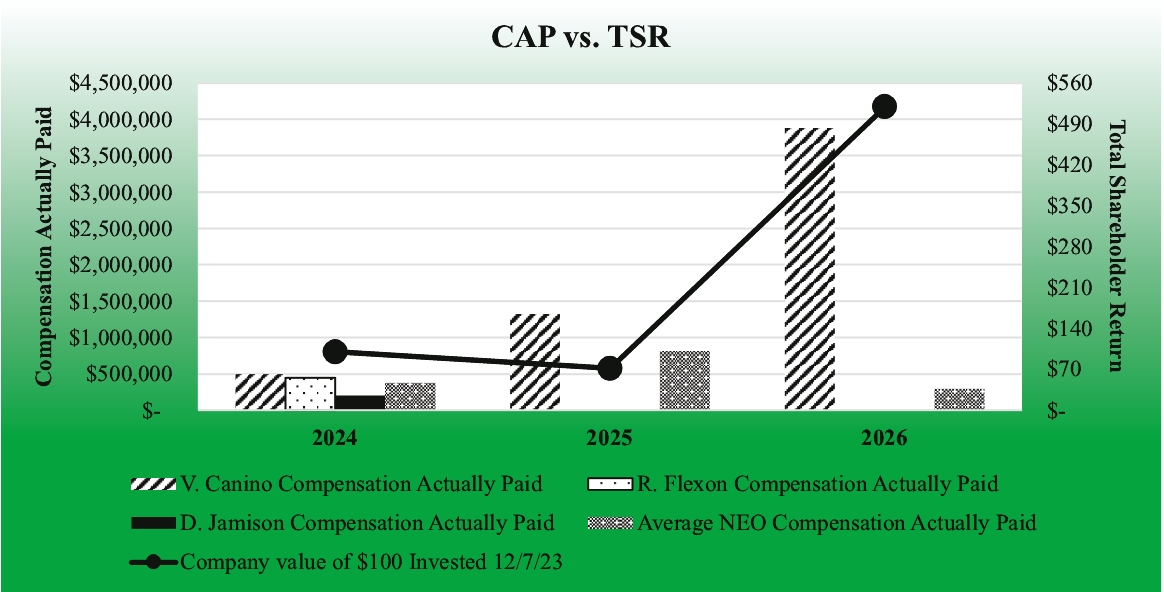
The graph below compares the compensation actually paid to our CEOs and the average of the compensation actually paid to our remaining Non-CEO NEOs, with our cumulative total stockholder return for the fiscal years ended March 31, 2026, 2025, and 2024. Total stockholder return amounts reported in the graph assume an initial fixed investment of $100 at the beginning of the period.
Compensation Actually Paid and Net Income (Loss)
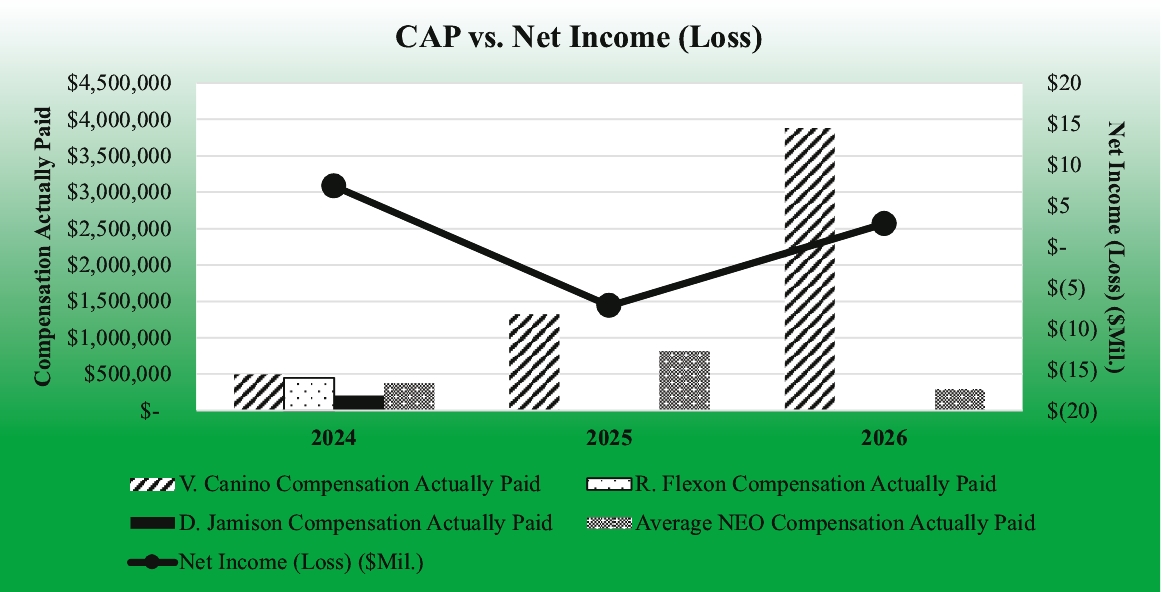
The graph below compares the compensation actually paid to our CEOs and the average of the compensation actually paid to our Non-CEO NEOs, with our net income (loss) for the fiscal years ended March 31, 2026, 2025, and 2024.