Shareholder Report
Apr. 30, 2026
USD ($)
$ / shares
WHAT WERE THE FUND COSTS FOR THE PAST YEAR? (based on a hypothetical $10,000 investment)
|
Fund Name
|
Costs of a $10,000 investment
|
Costs paid as a percentage of a $10,000 investment
|
|
Aptus Collared Investment Opportunity ETF
|
$86
|
0.79%
|
HOW DID THE FUND PERFORM LAST YEAR AND WHAT AFFECTED ITS PERFORMANCE?
The Aptus Collared Investment Opportunity (“ACIO” or the “Fund”) underperformed the S&P 500® Index (the “Index”) during the fiscal year as the Index appreciated 31.05%. The Fund returned 17.90% at NAV. With this, the strategy took on a lower level of risk to obtain the return. The Fund’s performance was consistent with a market environment that exhibited strong up-trending behavior for much of the fiscal year. During March 2026, the S&P 500 fell -4.98% while ACIO fell only -3.36%. The Index in April 2026 returned 10.49% with the Fund capturing 73.1% of that upswing (7.67% at NAV). The active nature of the Fund is designed to reduce drawdowns during market pullbacks, which was accomplished during the fiscal year, while participating as much as possible to strong upward moving markets.
|
Top Contributors
|
|
|
↑
|
NVIDIA Corp.
|
|
↑
|
Alphabet, Inc. - Class C
|
|
↑
|
Broadcom, Inc.
|
|
Top Detractors
|
|
|
↓
|
S&P 500 Index Option 06/20/2025 P5400
|
|
↓
|
S&P 500 Index Option 05/15/2026 P6250
|
|
↓
|
S&P 500 Index Option 10/17/2025 P6000
|
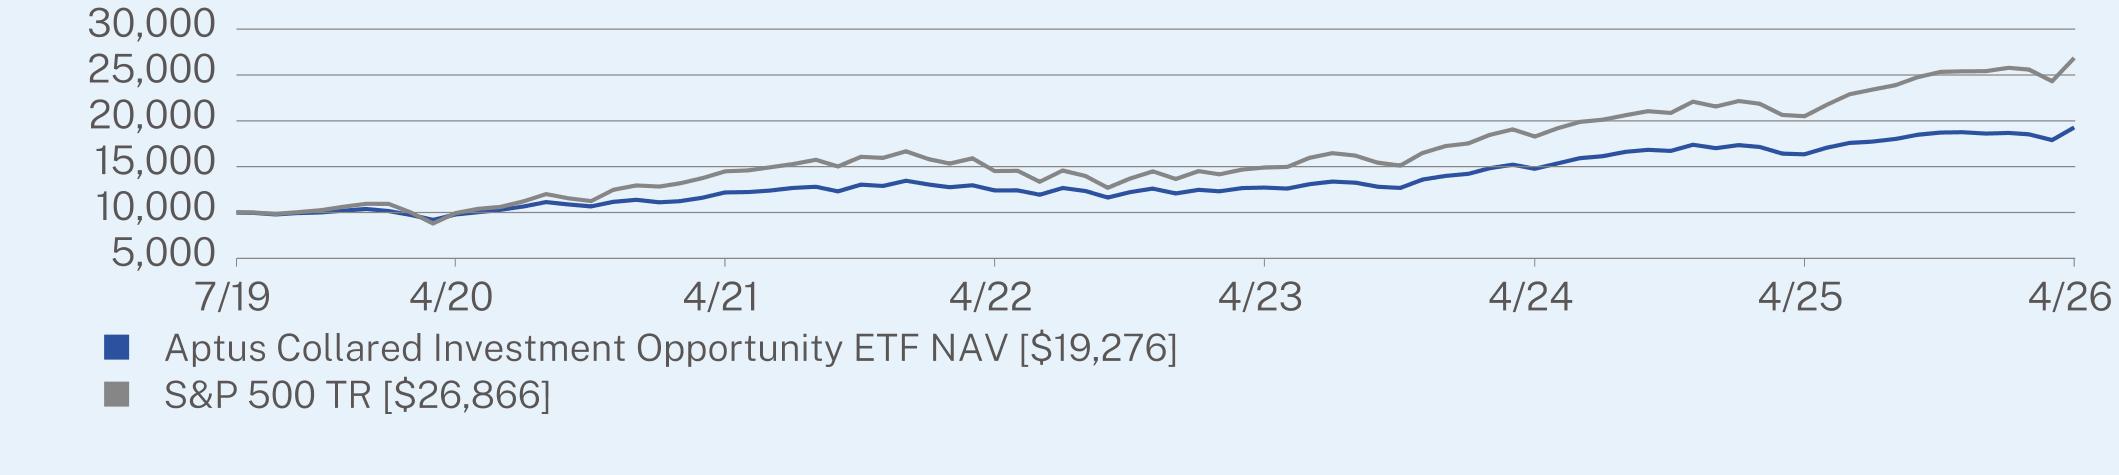
ANNUAL AVERAGE TOTAL RETURN (%)
|
|
1 Year
|
5 Year
|
Since Inception
(07/09/2019) |
|
Aptus Collared Investment Opportunity ETF NAV
|
17.90
|
9.60
|
10.11
|
|
S&P 500 TR
|
31.05
|
13.14
|
15.62
|
KEY FUND STATISTICS (as of April 30, 2026)
|
Net Assets
|
$2,286,779,255
|
|
Number of Holdings
|
221
|
|
Net Advisory Fee
|
$16,635,121
|
|
Portfolio Turnover
|
34%
|
WHAT DID THE FUND INVEST IN? (as of April 30, 2026)
|
Top 10 Issuers
|
(%)*
|
|
NVIDIA Corp.
|
7.8%
|
|
Alphabet, Inc.
|
6.4%
|
|
Apple, Inc.
|
6.4%
|
|
Microsoft Corp.
|
4.9%
|
|
Amazon.com, Inc.
|
4.2%
|
|
Broadcom, Inc.
|
3.2%
|
|
Meta Platforms, Inc.
|
2.2%
|
|
Tesla, Inc.
|
1.7%
|
|
Visa, Inc.
|
1.7%
|
|
JPMorgan Chase & Co.
|
1.7%
|
|
Security Type
|
(%)*
|
|
Common Stocks
|
100.3%
|
|
Purchased Options
|
1.0%
|
|
Exchange Traded Funds
|
0.7%
|
|
Money Market Funds
|
0.4%
|
|
Written Options
|
-2.9%
|
|
Cash & Other
|
0.5%
|
|
Top Sectors
|
(%)*
|
|
Technology
|
32.2%
|
|
Communications
|
17.7%
|
|
Financial
|
13.9%
|
|
Consumer, Non-cyclical
|
12.7%
|
|
Industrial
|
8.6%
|
|
Consumer, Cyclical
|
7.6%
|
|
Energy
|
3.6%
|
|
Utilities
|
2.4%
|
|
Basic Materials
|
1.6%
|
|
Cash & Other
|
(0.3)%
|
WHAT WERE THE FUND COSTS FOR THE PAST YEAR? (based on a hypothetical $10,000 investment)
|
Fund Name
|
Costs of a $10,000 investment*
|
Costs paid as a percentage of a $10,000 investment**
|
|
Aptus Deferred Income ETF
|
$80
|
0.80%
|
HOW DID THE FUND PERFORM LAST YEAR AND WHAT AFFECTED ITS PERFORMANCE?
The Aptus Deferred Income ETF (“DEFR” or the “Fund”) outperformed the Bloomberg U.S. Aggregate Bond Index (the “Index”) by 0.86% since inception (May 13, 2025) with DEFR’s performance for the fiscal period of 6.40% at NAV versus the Index which was up 5.54%. The outperformance was driven primarily by the options strategy within the swap wrapper, which benefited during a period of market volatility and strong returns. The strategy continues to deliver solid performance while maintaining what we believe to be a strong tax-efficient structure.
|
Top Contributors
|
|
|
↑
|
Systematic Dynamic PutWrite Series 1 (“RCXTSOA7”) Total Return Swaps
|
|
Top Detractors
|
|
|
↓
|
Invesco QQQ Trust Series 1 Box Spread 03/20/2026
|
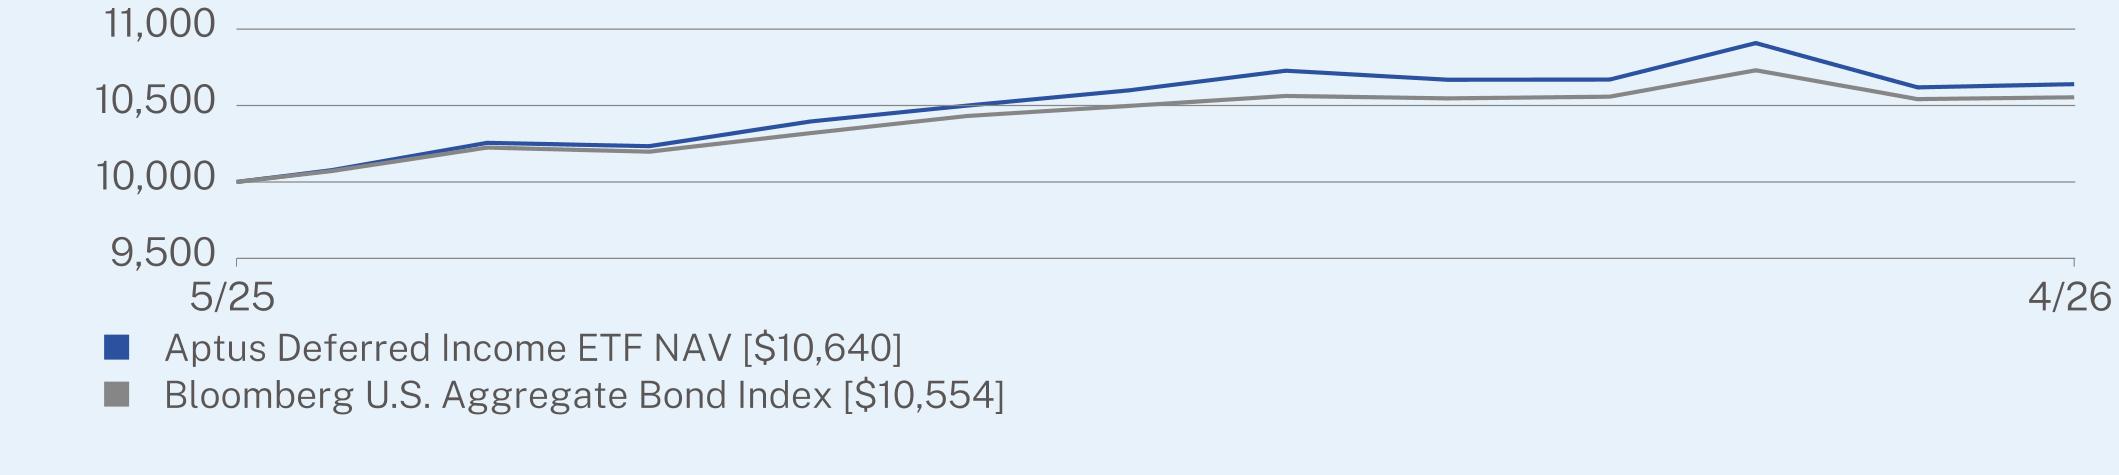
CUMULATIVE TOTAL RETURN (%)
|
|
Since Inception
(05/13/2025) |
|
Aptus Deferred Income ETF NAV
|
6.40
|
|
Bloomberg U.S. Aggregate Bond Index
|
5.54
|
KEY FUND STATISTICS (as of April 30, 2026)
|
Net Assets
|
$117,704,933
|
|
Number of Holdings
|
11
|
|
Net Advisory Fee
|
$637,521
|
|
Portfolio Turnover
|
0%
|
WHAT DID THE FUND INVEST IN? (as of April 30, 2026)
|
Top Holdings
|
(%)*
|
|
Invesco QQQ Trust Series 1, Expiration: 07/17/2026; Exercise Price: $100.00
|
54.1%
|
|
Invesco QQQ Trust Series 1, Expiration: 07/17/2026; Exercise Price: $1,100.00
|
40.3%
|
|
U.S. Treasury Bill 07/09/2026, 3.54%
|
4.9%
|
|
RCXTSOA7 TRS 05/14/2030
|
1.9%
|
|
iShares 7-10 Year Treasury Bond ETF, Expiration: 07/17/2026; Exercise Price: $96.44
|
0.2%
|
|
First American Treasury Obligations Fund - Class X
|
0.2%
|
|
iShares TIPS Bond ETF, Expiration: 07/17/2026; Exercise Price: $112.78
|
0.1%
|
|
Invesco QQQ Trust Series 1, Expiration: 07/17/2026; Exercise Price: $100.00
|
0.0%
|
|
Invesco QQQ Trust Series 1, Expiration: 07/17/2026; Exercise Price: $1,100.00
|
0.0%
|
|
iShares TIPS Bond ETF, Expiration: 07/17/2026; Exercise Price: $112.78
|
-0.6%
|
|
Security Type
|
(%)*
|
|
Purchased Options
|
94.7%
|
|
U.S. Treasury Bills
|
4.9%
|
|
Total Return Swaps
|
1.9%
|
|
Money Market Funds
|
0.2%
|
|
Written Options
|
-1.8%
|
|
Cash & Other
|
0.1%
|
|
Top Sectors
|
(%)*
|
|
Cash & Other
|
100.0%
|
WHAT WERE THE FUND COSTS FOR THE PAST YEAR? (based on a hypothetical $10,000 investment)
|
Fund Name
|
Costs of a $10,000 investment
|
Costs paid as a percentage of a $10,000 investment
|
|
Aptus Defined Risk ETF
|
$72
|
0.69%
|
HOW DID THE FUND PERFORM LAST YEAR AND WHAT AFFECTED ITS PERFORMANCE?
Aptus Defined Risk ETF (“DRSK” or the “Fund”) outperformed by 4.04% versus the Bloomberg US Aggregate Bond Index (the “Index”) during the fiscal year as the equity option exposure within the strategy was buoyed by the return of U.S. Large Caps. The Fund was up 8.10% at NAV while the Index was only up 4.06%. Of the three components of DRSK - (1) Laddered Corporate Bond Portfolio, (2) Long Puts on S&P 500, and (3) Long Call Options on Individual Stocks and the S&P 500 – the long call option positions added the most relative value. The ladder did not benefit nearly as much as the overall market as measured by the S&P 500, which was +31.05% during the fiscal year. The overall bond portfolio was additive, however, as the strategy was lower duration relative to the benchmark. We believe that the strategy did exactly what it was designed to do, weather choppy markets and capture equity premiums when long volatility is rewarded.
|
Top Contributors
|
|
|
↑
|
S&P 500 Index Option 06/18/2026 C7000
|
|
↑
|
Thermo Fisher Scientific, Inc. Option 10/17/2025 C470
|
|
↑
|
Merck & Co., Inc. Option 04/17/2026 C100
|
|
Top Detractors
|
|
|
↓
|
S&P 500 Index Option 06/18/2026 C7300
|
|
↓
|
Merk & Co., Inc. Option 03/20/2026 C110
|
|
↓
|
ServiceNow, Inc. Option 09/19/2025 C1100
|
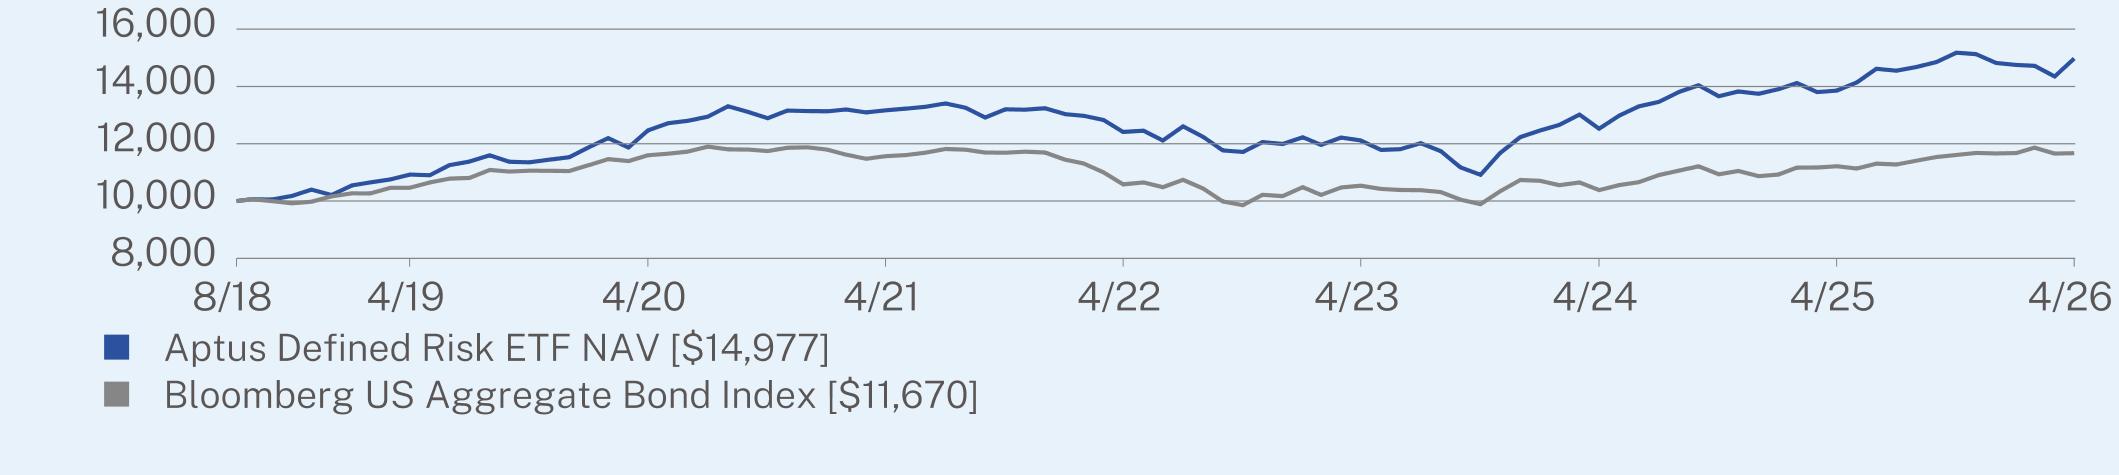
ANNUAL AVERAGE TOTAL RETURN (%)
|
|
1 Year
|
5 Year
|
Since Inception
(08/07/2018) |
|
Aptus Defined Risk ETF NAV
|
8.10
|
2.61
|
5.37
|
|
Bloomberg US Aggregate Bond Index
|
4.06
|
0.18
|
2.02
|
KEY FUND STATISTICS (as of April 30, 2026)
|
Net Assets
|
$1,480,793,479
|
|
Number of Holdings
|
25
|
|
Net Advisory Fee
|
$9,504,802
|
|
Portfolio Turnover
|
19%
|
|
30-Day SEC Yield
|
3.79%
|
|
30-Day SEC Yield Unsubsidized
|
3.79%
|
WHAT DID THE FUND INVEST IN? (as of April 30, 2026)
|
Top 10 Issuers
|
(%)*
|
|
Invesco BulletShares 2032 Corporate Bond ETF
|
12.2%
|
|
Invesco BulletShares 2031 Corporate Bond ETF
|
11.9%
|
|
iShares iBonds Dec 2032 Term Corporate ETF
|
10.9%
|
|
iShares iBonds Dec 2031 Term Corporate ETF
|
10.5%
|
|
Invesco BulletShares 2030 Corporate Bond ETF
|
10.5%
|
|
iShares iBonds Dec 2029 Term Corporate ETF
|
10.1%
|
|
Invesco BulletShares 2033 Corporate Bond ETF
|
10.1%
|
|
iShares iBonds Dec 2030 Term Corporate ETF
|
9.0%
|
|
Invesco BulletShares 2034 Corporate Bond ETF
|
4.9%
|
|
iShares iBonds Dec 2034 Term Corporate ETF
|
2.4%
|
|
Security Type
|
(%)*
|
|
Exchange Traded Funds
|
92.5%
|
|
Purchased Options
|
3.9%
|
|
Money Market Funds
|
1.2%
|
|
Written Options
|
-0.6%
|
|
Cash & Other
|
3.0%
|
|
Top Sectors
|
(%)*
|
|
Investment Grade Corporate Bonds
|
92.5%
|
|
Cash & Other
|
7.5%
|
WHAT WERE THE FUND COSTS FOR THE PAST YEAR? (based on a hypothetical $10,000 investment)
|
Fund Name
|
Costs of a $10,000 investment
|
Costs paid as a percentage of a $10,000 investment
|
|
Aptus Drawdown Managed Equity ETF
|
$88
|
0.79%
|
HOW DID THE FUND PERFORM LAST YEAR AND WHAT AFFECTED ITS PERFORMANCE?
The Aptus Drawdown Managed Equity ETF (“ADME” or the “Fund”) underperformed the S&P 500® Index (the “Index”) during the fiscal year as the Index appreciated 31.05%. Though, we would state that the strategy outkicked its coverage, participating with 75.5% of the upside, returning 23.45% at NAV. With this, the strategy took on a lower level of risk to obtain the return. The Fund’s performance was consistent with a market environment that exhibited strong up-trending behavior for much of the fiscal year. During April 2026 the Index gained 10.49% after negative performance in March with the beginning of the war in Iran. ADME captured 89.2% of that market upswing after being relatively similar to the Index for March 2026 performance. The active nature of the Fund is designed to reduce drawdowns during larger market pullbacks, which was accomplished during the fiscal year, while participating as much as possible to strong upward moving markets.
|
Top Contributors
|
|
|
↑
|
NVIDIA Corp.
|
|
↑
|
Alphabet, Inc. - Class C
|
|
↑
|
Broadcom, Inc.
|
|
Top Detractors
|
|
|
↓
|
Cboe Volatility Index Option 01/21/2026 C23
|
|
↓
|
S&P 500 Index Option 05/15/2026 P5700
|
|
↓
|
S&P 500 Index Option 06/27/2025 P5955
|
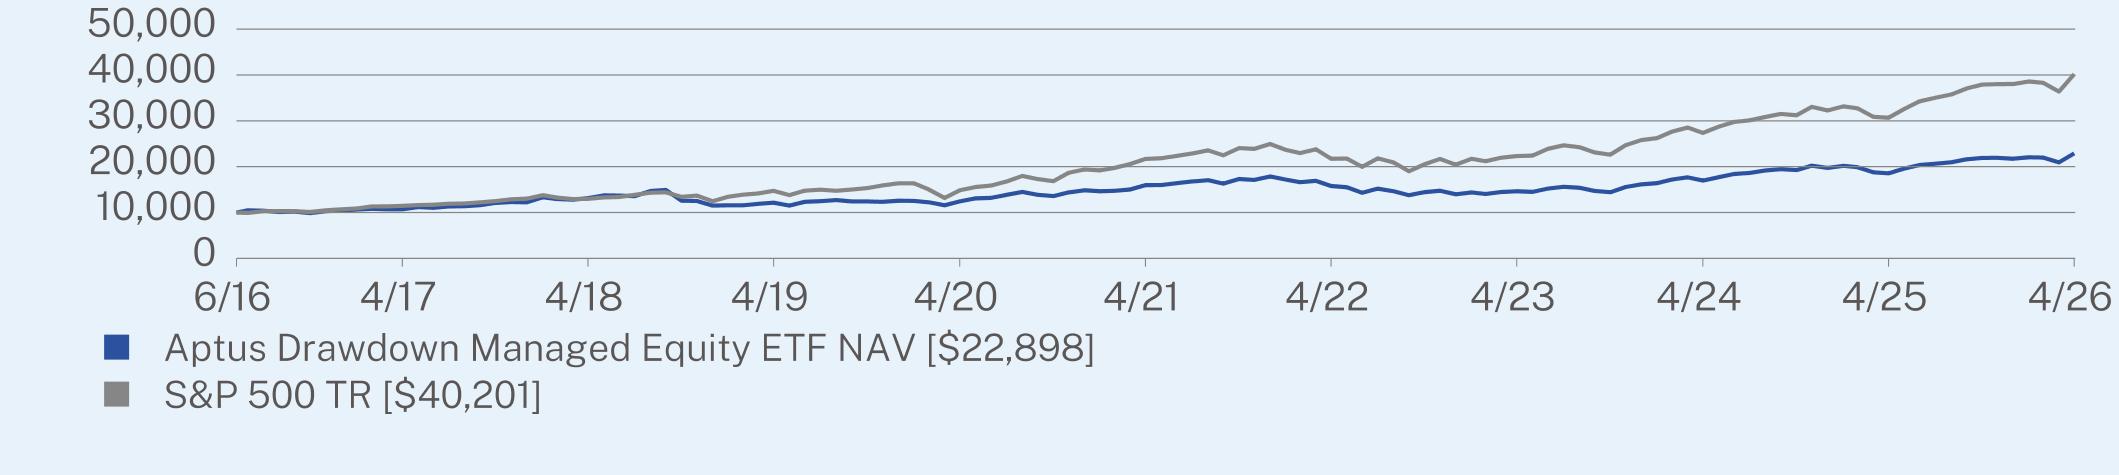
ANNUAL AVERAGE TOTAL RETURN (%)
|
|
1 Year
|
5 Year
|
Since Inception
(06/08/2016) |
|
Aptus Drawdown Managed Equity ETF NAV
|
23.45
|
7.46
|
8.73
|
|
S&P 500 TR
|
31.05
|
13.14
|
15.10
|
KEY FUND STATISTICS (as of April 30, 2026)
|
Net Assets
|
$265,368,107
|
|
Number of Holdings
|
154
|
|
Net Advisory Fee
|
$1,884,126
|
|
Portfolio Turnover
|
33%
|
WHAT DID THE FUND INVEST IN? (as of April 30, 2026)
|
Top 10 Issuers
|
(%)*
|
|
NVIDIA Corp.
|
7.8%
|
|
Alphabet, Inc.
|
6.5%
|
|
Apple, Inc.
|
6.4%
|
|
Microsoft Corp.
|
4.9%
|
|
Amazon.com, Inc.
|
4.2%
|
|
Broadcom, Inc.
|
3.2%
|
|
Meta Platforms, Inc.
|
2.2%
|
|
Caterpillar, Inc.
|
2.0%
|
|
Tesla, Inc.
|
1.7%
|
|
Visa, Inc.
|
1.7%
|
|
Security Type
|
(%)*
|
|
Common Stocks
|
99.3%
|
|
Purchased Options
|
0.7%
|
|
Money Market Funds
|
0.2%
|
|
Written Options
|
-0.4%
|
|
Cash & Other
|
0.2%
|
|
Top Sectors
|
(%)*
|
|
Technology
|
32.0%
|
|
Communications
|
17.6%
|
|
Financial
|
13.7%
|
|
Consumer, Non-cyclical
|
12.5%
|
|
Industrial
|
8.5%
|
|
Consumer, Cyclical
|
7.5%
|
|
Energy
|
3.6%
|
|
Utilities
|
2.3%
|
|
Basic Materials
|
1.6%
|
|
Cash & Other
|
0.7%
|
WHAT WERE THE FUND COSTS FOR THE PAST YEAR? (based on a hypothetical $10,000 investment)
|
Fund Name
|
Costs of a $10,000 investment
|
Costs paid as a percentage of a $10,000 investment
|
|
Aptus Enhanced Yield ETF
|
$61
|
0.59%
|
HOW DID THE FUND PERFORM LAST YEAR AND WHAT AFFECTED ITS PERFORMANCE?
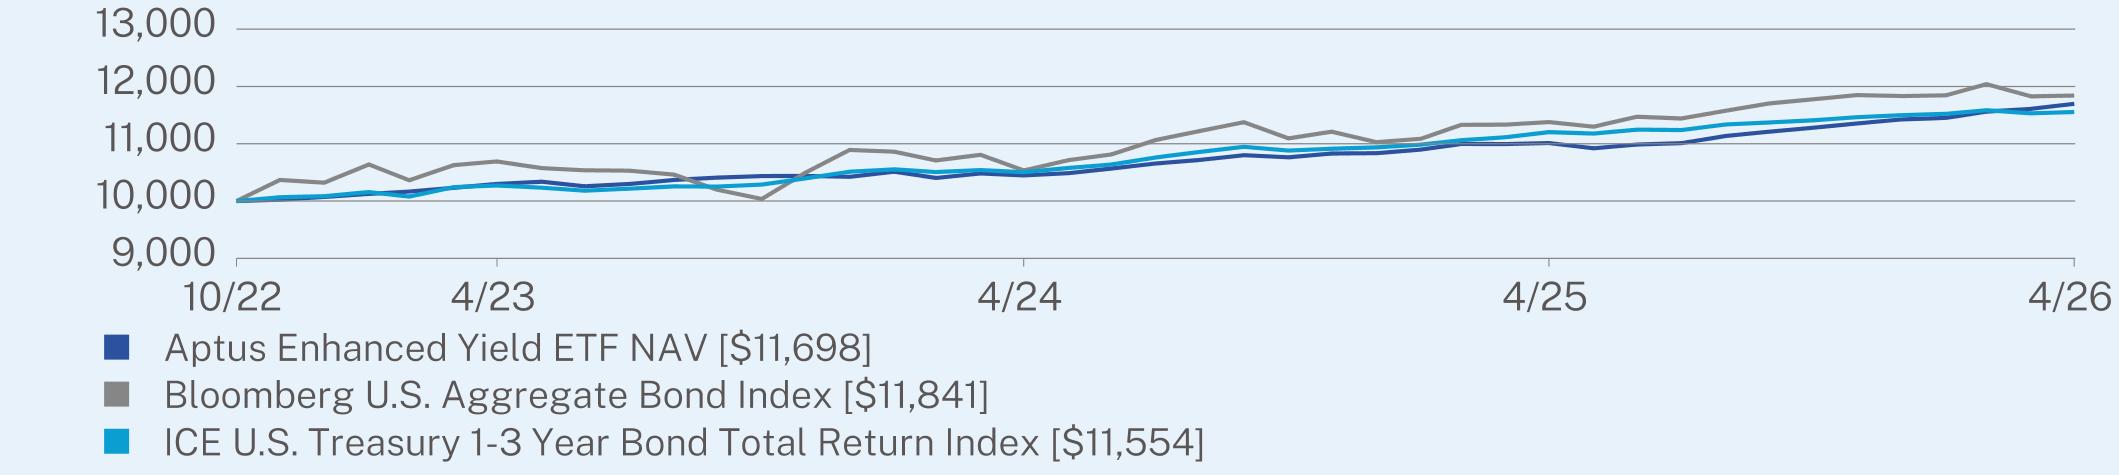
Softer economic data and cooling inflation talk drove a broad rally in bonds, while equity volatility on average was elevated during the fiscal year amid geopolitical concerns and uncertainty around the timing of rate cuts. We saw equity volatility rise as measured by the Cboe Volatility Index (VIX) above 25 for much of March, dropping to ~17 by the fiscal year end. The Aptus Enhanced Yield ETF (“JUCY” or the “Fund”) returned 6.23% at NAV, beating the Fund’s primary benchmark, the Bloomberg U.S. Aggregate Bond Index which returned 4.06% and the secondary benchmark, the ICE U.S. Treasury 1-3 Year Bond Index which returned 3.13%. The fixed income portfolio outpaced the benchmark with the boosted performance by the Fund’s total return swap which has a systematic trading strategy that includes US equity index and VIX options/futures.
|
Top Contributors
|
|
|
↑
|
Diversified Equity Volatility Harvesting Series (“RCTXTEVHT”) Total Return Swaps
|
|
↑
|
United States Treasury 4.375% 08/15/2026
|
|
↑
|
United States Treasury 1.00% 07/31/2028
|
|
Top Detractors
|
|
|
↓
|
United States Treasury 3.625% 12/31/2030
|
ANNUAL AVERAGE TOTAL RETURN (%)
|
|
1 Year
|
Since Inception
(10/31/2022) |
|
Aptus Enhanced Yield ETF NAV
|
6.23
|
4.59
|
|
Bloomberg U.S. Aggregate Bond Index
|
4.06
|
4.95
|
|
ICE U.S. Treasury 1-3 Year Bond Total Return Index
|
3.13
|
4.22
|
Managed Distributions:
The Fund seeks to maintain relatively stable monthly distributions at a rate that is approximately between 5% and 12%. Although the amount of income earned from U.S. government securities by the Fund will vary from month-to-month, the Fund may pay out a return of capital to meet those targets if monthly distributions exceed the current income generated by the Fund. A return of capital, which for tax purposes is treated as a return of a shareholder’s investment, reduces a shareholder’s basis in the Fund’s shares, thus reducing any loss or increasing any gain on a subsequent taxable disposition of Fund shares. Current estimates of the return of capital for the Fund is available on the Fund’s website at www.aptusetfs.com/JUCY.
KEY FUND STATISTICS (as of April 30, 2026)
|
Net Assets
|
$234,745,964
|
|
Number of Holdings
|
11
|
|
Net Advisory Fee
|
$1,407,685
|
|
Portfolio Turnover
|
13%
|
|
30-Day SEC Yield
|
3.21%
|
|
30-Day SEC Yield Unsubsidized
|
3.21%
|
WHAT DID THE FUND INVEST IN? (as of April 30, 2026)
|
Top 10 Issuers
|
(%)*
|
|
United States Government
|
94.1%
|
|
First American Treasury Obligations Fund
|
3.7%
|
|
RCXTEVHT TRS 09/22/2027 (Goldman Sachs)
|
1.3%
|
|
Security Type
|
(%)*
|
|
U.S. Treasury Securities
|
86.7%
|
|
U.S. Treasury Bills
|
7.4%
|
|
Money Market Funds
|
3.7%
|
|
Total Return Swaps
|
1.3%
|
|
Cash & Other
|
0.9%
|
|
Top Sectors
|
(%)*
|
|
United States Treasury Note/Bond
|
86.7%
|
|
Cash & Other
|
13.3%
|
Material Fund Changes:
The Fund previously seeked to achieve its objective through a hybrid fixed income and equity-linked note (“ELN”) strategy. The Fund now seeks to achieve its objective through a combination of fixed income securities, Flexible Exchange (“FLEX”) Options, and total return swaps.
The Fund’s Principal Risks were adjusted during the reporting period to reflect the changes to the Fund’s Principal Investment Strategy. For a full list of risks, refer to the Fund’s Prospectus which can be obtained by calling (800) 617-0004 or visiting the Fund’s website at www.aptusetfs.com/JUCY.
WHAT WERE THE FUND COSTS FOR THE PAST YEAR? (based on a hypothetical $10,000 investment)
|
Fund Name
|
Costs of a $10,000 investment
|
Costs paid as a percentage of a $10,000 investment
|
|
Aptus International Enhanced Yield ETF
|
$46
|
0.39%
|
HOW DID THE FUND PERFORM LAST YEAR AND WHAT AFFECTED ITS PERFORMANCE?
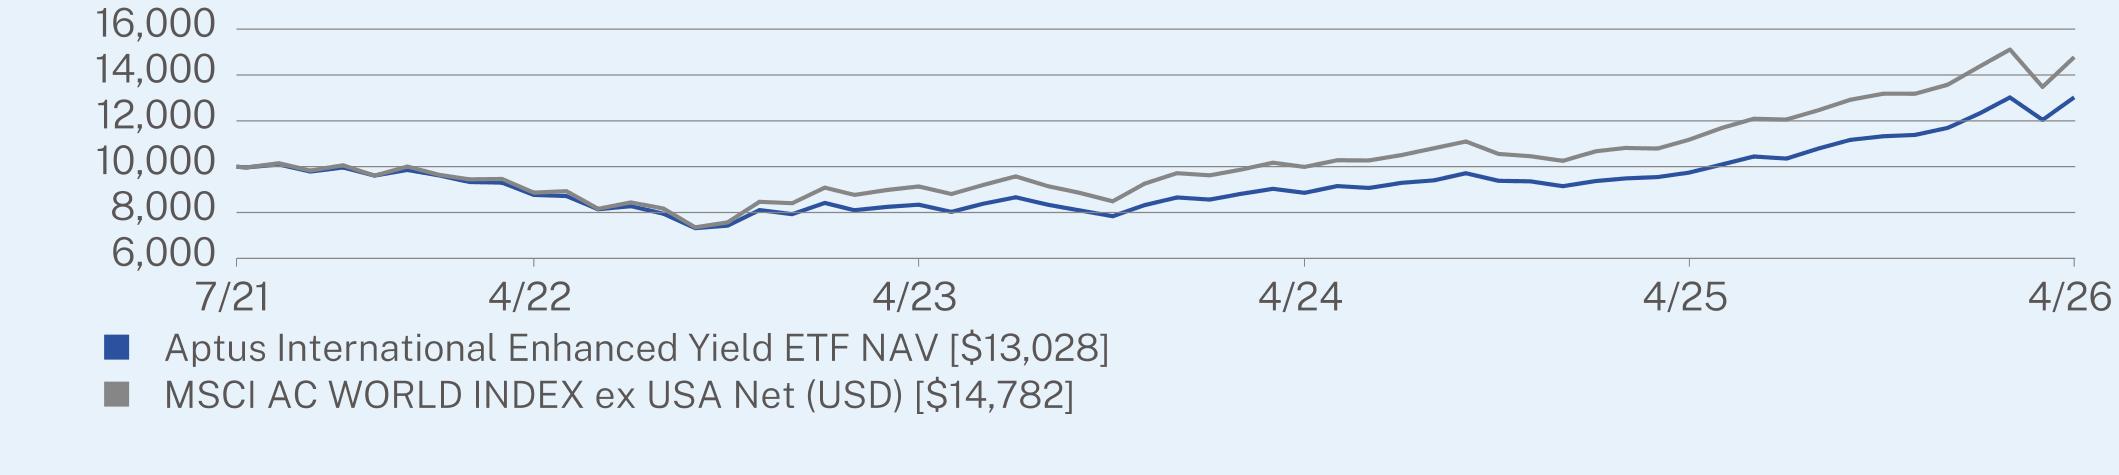
The Aptus International Enhanced Yield ETF (“IDUB” or the “Fund”) returned 33.70% at NAV, outperforming the benchmark MSCI AC World Index ex-US by 1.50%. The underlying ETFs in IDUB used for exposure beat broader U.S. indices marking a strong rebound for international equities, with the MSCI AC World Index ex-US rising 32.20% as investors rotated away from U.S. equities in favor of global markets. Stimulus efforts in several major markets were at the core of the rally, with investors pushing market multiples higher in anticipation of potential growth. Global risk assets responded positively, with developed markets leading the way. Emerging markets also benefited from improving fundamentals and a weaker dollar. It wasn’t until the conflict with Iran in March/April 2026 that really started moving international stocks downwards. Performance differentials between internationals and U.S. domestic indices were greater than 7% for the last two months of the fiscal year.
|
Top Contributors
|
|
|
↑
|
Vanguard Total International Stock Index Fund ETF
|
|
↑
|
iShares Core MSCI International Developed Markets ETF
|
|
↑
|
State Street SPDR Portfolio Emerging Markets ETF
|
|
Top Detractors
|
|
|
↓
|
BNP Paribas Issuance B.V., ELN, (linked to iShares MSCI EAFE ETF) 02/13/2025
|
|
↓
|
Citigroup Global Markets Holdings Inc., ELN, (linked to iShares MSCI EAFE ETF) 05/23/2024
|
|
↓
|
UBS AG, ELN, (linked to iShares MSCI EAFE ETF) 04/10/2025
|
ANNUAL AVERAGE TOTAL RETURN (%)
|
|
1 Year
|
Since Inception
(07/22/2021) |
|
Aptus International Enhanced Yield ETF NAV
|
33.70
|
5.70
|
|
MSCI AC WORLD INDEX ex USA Net (USD)
|
32.20
|
8.53
|
Managed Distributions:
The Fund seeks to maintain relatively stable quarterly distributions at a rate that is approximately double the distribution rate of its broad-based securities benchmark, the MSCI AC World Index ex USA (Net). Although the amount of income earned from dividends on the Fund’s underlying equity securities, the appreciation of the Fund’s equity holdings, and income from U.S. government securities by the Fund will vary from quarter-to-quarter, the Fund may pay out a return of capital to meet those targets if quarterly distributions exceed the current income generated by the Fund. A return of capital, which for tax purposes is treated as a return of a shareholder’s investment, reduces a shareholder’s basis in the Fund’s shares, thus reducing any loss or increasing any gain on a subsequent taxable disposition of Fund shares. Current estimates of the return of capital for the Fund is available on the Fund’s website at www.aptusetfs.com/IDUB.
KEY FUND STATISTICS (as of April 30, 2026)
|
Net Assets
|
$467,981,879
|
|
Number of Holdings
|
5
|
|
Net Advisory Fee
|
$1,455,589
|
|
Portfolio Turnover
|
151%
|
WHAT DID THE FUND INVEST IN? (as of April 30, 2026)
|
Top 10 Issuers
|
(%)*
|
|
Vanguard Total International Stock ETF
|
98.4%
|
|
RCXTGVHT Total Return Swaps (Goldman Sachs)
|
1.0%
|
|
United States Government
|
0.5%
|
|
First American Treasury Obligations Fund
|
0.2%
|
|
Security Type
|
(%)*
|
|
Exchange Traded Funds
|
98.4%
|
|
Total Return Swaps
|
1.0%
|
|
U.S. Treasury Bills
|
0.5%
|
|
Money Market Funds
|
0.2%
|
|
Cash & Other
|
-0.1%
|
|
Top Sectors
|
(%)*
|
|
International Equity
|
98.4%
|
|
Cash & Other
|
1.6%
|
Material Fund Changes:
The Fund previously seeked to achieve its objective through a hybrid equity and equity-linked note (“ELN”) strategy. The Fund now seeks to achieve its objective through a combination of equity securities and total return swaps.
The Fund’s Principal Risks were adjusted during the reporting period to reflect the changes to the Fund’s Principal Investment Strategy. For a full list of risks, refer to the Fund’s Prospectus which can be obtained by calling (800) 617-0004 or visiting the Fund’s website at www.aptusetfs.com/IDUB.
WHAT WERE THE FUND COSTS FOR THE PAST YEAR? (based on a hypothetical $10,000 investment)
|
Fund Name
|
Costs of a $10,000 investment
|
Costs paid as a percentage of a $10,000 investment
|
|
Aptus Large Cap Enhanced Yield ETF
|
$46
|
0.39%
|
HOW DID THE FUND PERFORM LAST YEAR AND WHAT AFFECTED ITS PERFORMANCE?
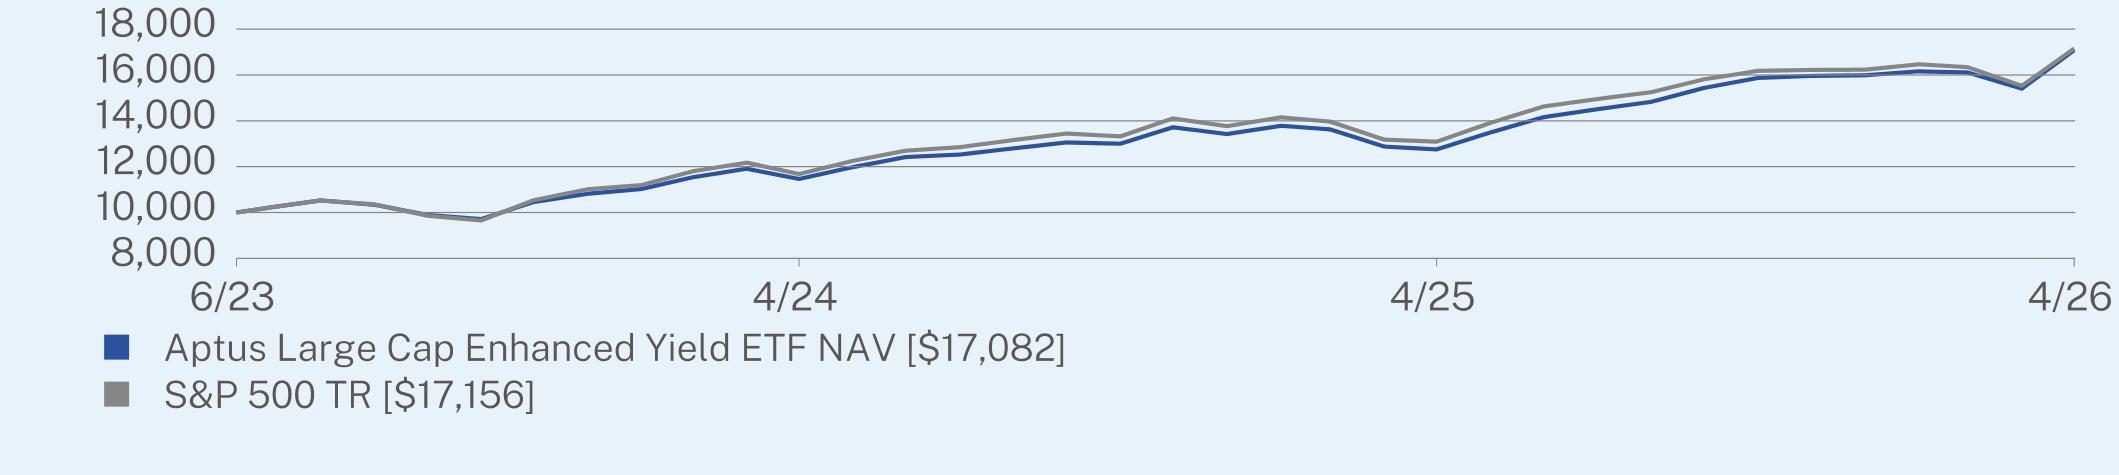
The Aptus Large Cap Enhanced Yield ETF (“DUBS” or the “Fund”) outperformed versus the S&P 500® Index (the “Index”) during the fiscal year. The strategy has an options overlay (in addition to underlying equity beta) that aims to outperform the Index when the market trends higher, while also addressing the riskiest market environments. Trending higher was the main characteristic of the market during the fiscal year other than the larger selloff seen in March 2026. The underlying strategy within the Fund was changed from primarily investing in Equity Linked Notes and individual U.S. large cap equity security names to primarily investing in other ETFs that track the S&P 500 as well as total return swaps on a systematic trading strategy involving U.S. market index options and futures. During the fiscal year, DUBS returned 33.95% at NAV, while the S&P 500 returned 31.05%. During the major bout of volatility in March 2026, DUBS bested the benchmark by 0.60%, returning -4.38%. All-in-all, the strategy performed up to our expectations during the year.
|
Top Contributors
|
|
|
↑
|
State Street SPDR Portfolio S&P 500 ETF
|
|
↑
|
BNY Mellon U.S. Large Cap Core Equity ETF
|
|
↑
|
Diversified Equity Volatility Harvesting Index (“RCXTEVHT”) Total Return Swaps
|
|
Top Detractors
|
|
|
↓
|
Apple, Inc.
|
|
↓
|
UnitedHealth Group, Inc.
|
|
↓
|
Eli Lilly & Co.
|
ANNUAL AVERAGE TOTAL RETURN (%)
|
|
1 Year
|
Since Inception
(06/13/2023) |
|
Aptus Large Cap Enhanced Yield ETF NAV
|
33.95
|
20.42
|
|
S&P 500 TR
|
31.05
|
20.60
|
Managed Distributions:
The Fund seeks to maintain relatively stable quarterly distributions at a rate that is approximately double the distribution rate of its broad-based securities benchmark, the S&P 500 Index. Although the amount of income earned from dividends on the Fund’s underlying equity securities, the appreciation of the Fund’s equity holdings, and income from U.S. government securities by the Fund will vary from quarter-to-quarter, the Fund may pay out a return of capital to meet those targets if quarterly distributions exceed the current income generated by the Fund. A return of capital, which for tax purposes is treated as a return of a shareholder’s investment, reduces a shareholder’s basis in the Fund’s shares, thus reducing any loss or increasing any gain on a subsequent taxable disposition of Fund shares. Current estimates of the return of capital for the Fund is available on the Fund’s website at www.aptusetfs.com/DUBS.
KEY FUND STATISTICS (as of April 30, 2026)
|
Net Assets
|
$355,894,487
|
|
Number of Holdings
|
7
|
|
Net Advisory Fee
|
$1,042,336
|
|
Portfolio Turnover
|
93%
|
WHAT DID THE FUND INVEST IN? (as of April 30, 2026)
|
Top 10 Issuers
|
(%)*
|
|
State Street SPDR Portfolio S&P 500 ETF
|
73.5%
|
|
BNY Mellon US Large Cap Core Equity ETF
|
24.9%
|
|
RCXTEVHT Total Return Swaps (Goldman Sachs)
|
1.1%
|
|
First American Treasury Obligations Fund
|
0.3%
|
|
United States Government
|
0.2%
|
|
Security Type
|
(%)*
|
|
Exchange Traded Funds
|
98.4%
|
|
Total Return Swaps
|
1.1%
|
|
Money Market Funds
|
0.3%
|
|
U.S. Treasury Bills
|
0.2%
|
|
Cash & Other
|
0.0%
|
|
Top Sectors
|
(%)*
|
|
Large Cap Core Equity
|
98.4%
|
|
Cash & Other
|
1.6%
|
Material Fund Changes:
The Fund previously seeked to achieve its objective through a hybrid equity and equity-linked note (“ELN”) strategy. The Fund now seeks to achieve its objective through a combination of equity securities, including other ETFs, and total return swaps.
The Fund’s Principal Risks were adjusted during the reporting period to reflect the changes to the Fund’s Principal Investment Strategy. For a full list of risks, refer to the Fund’s Prospectus which can be obtained by calling (800) 617-0004 or visiting the Fund’s website at www.aptusetfs.com/DUBS.
WHAT WERE THE FUND COSTS FOR THE PAST YEAR? (based on a hypothetical $10,000 investment)
|
Fund Name
|
Costs of a $10,000 investment
|
Costs paid as a percentage of a $10,000 investment
|
|
Aptus Large Cap Upside ETF
|
$87
|
0.79%
|
HOW DID THE FUND PERFORM LAST YEAR AND WHAT AFFECTED ITS PERFORMANCE?
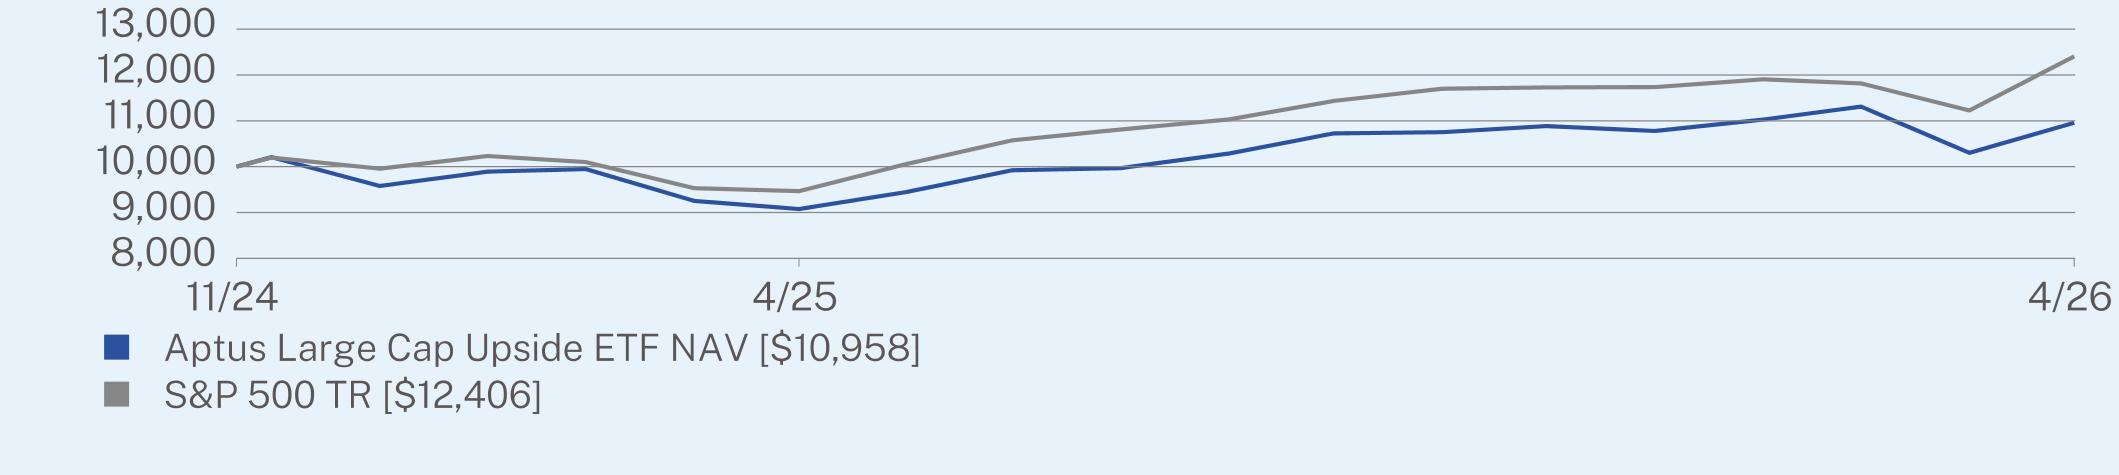
The Aptus Large Cap Upside ETF (“UPSD” or the “Fund”) underperformed the S&P 500 by -10.32%, returning 20.73% at NAV. The minimum volatility equity exposure was the primary detractor from performance relative to the Index. The minimum volatility basket of stocks underperformed the S&P 500 during the fiscal year by 19.13% with the swap minimally assisting in recouping some of the performance drag from the equity basket. The trend exposure detracted from returns, as positive momentum entering the period reversed sharply due to policy-related uncertainty around tariffs, fiscal stimulus, and monetary shifts.
|
Top Contributors
|
|
|
↑
|
Amazon.com, Inc.
|
|
↑
|
Systematic Equity Futures Trend and Dynamic PutWrite Series 1 (“RCXTSOA6”) Total Return Swaps
|
|
↑
|
NVIDIA Corp.
|
|
Top Detractors
|
|
|
↓
|
Dollar General Corp.
|
|
↓
|
Lockheed Martin Corp.
|
|
↓
|
Hershey Co.
|
ANNUAL AVERAGE TOTAL RETURN (%)
|
|
1 Year
|
Since Inception
(11/20/2024) |
|
Aptus Large Cap Upside ETF NAV
|
20.73
|
6.56
|
|
S&P 500 TR
|
31.05
|
16.13
|
KEY FUND STATISTICS (as of April 30, 2026)
|
Net Assets
|
$103,735,284
|
|
Number of Holdings
|
103
|
|
Net Advisory Fee
|
$686,596
|
|
Portfolio Turnover
|
32%
|
WHAT DID THE FUND INVEST IN? (as of April 30, 2026)
|
Top 10 Issuers
|
(%)*
|
|
NVIDIA Corp.
|
5.0%
|
|
Apple, Inc.
|
5.0%
|
|
Microsoft Corp.
|
3.7%
|
|
Alphabet, Inc.
|
3.5%
|
|
RCXTSOA6 Total Return Swaps (Goldman Sachs)
|
3.1%
|
|
Amazon.com, Inc.
|
2.3%
|
|
Welltower, Inc.
|
1.5%
|
|
Cboe Global Markets, Inc.
|
1.5%
|
|
CME Group, Inc.
|
1.4%
|
|
First American Treasury Obligations Fund
|
1.4%
|
|
Security Type
|
(%)*
|
|
Common Stocks
|
95.4%
|
|
Total Return Swaps
|
3.1%
|
|
Money Market Funds
|
1.4%
|
|
Cash & Other
|
0.1%
|
|
Top Sectors
|
(%)*
|
|
Consumer, Non-cyclical
|
26.3%
|
|
Technology
|
20.0%
|
|
Communications
|
13.7%
|
|
Financial
|
13.3%
|
|
Consumer, Cyclical
|
6.2%
|
|
Industrial
|
6.0%
|
|
Energy
|
4.2%
|
|
Utilities
|
3.4%
|
|
Basic Materials
|
2.3%
|
|
Cash & Other
|
4.6%
|
WHAT WERE THE FUND COSTS FOR THE PAST YEAR? (based on a hypothetical $10,000 investment)
|
Fund Name
|
Costs of a $10,000 investment
|
Costs paid as a percentage of a $10,000 investment
|
|
Opus Small Cap Value ETF
|
$88
|
0.79%
|
HOW DID THE FUND PERFORM LAST YEAR AND WHAT AFFECTED ITS PERFORMANCE?
The Opus Small Cap Value ETF (“OSCV” or the “Fund”) underperformed both the S&P 500 Index (the “Index”) and its secondary benchmark, the S&P Small Cap 600 Value Index, by 9.24% and 21.47%, respectively. Small cap stocks, in general, had a resurgence during the fiscal year, outperforming its large cap brethren. The underperformance versus the Index was a result of a strong surge in April where the S&P 500 Index recovered sharply from a month of decline in March. OSCV has historically provided results consistent with outperforming during down trending markets or when the market is rewarding higher quality (and typically lower volatility) stocks. The fiscal year was a challenging period for the fund on a relative basis, as the highest beta stocks in the small cap benchmark significantly outpaced both quality and lower volatility stocks, an environment in which the fund has historically lagged the small cap benchmark.
|
Top Contributors
|
|
|
↑
|
Primoris Services Corp.
|
|
↑
|
Curtiss-Wright Corp.
|
|
↑
|
Comfort Systems USA, Inc.
|
|
Top Detractors
|
|
|
↓
|
Compass Diversified Holdings
|
|
↓
|
Chemed Corp.
|
|
↓
|
Murphy USA, Inc.
|
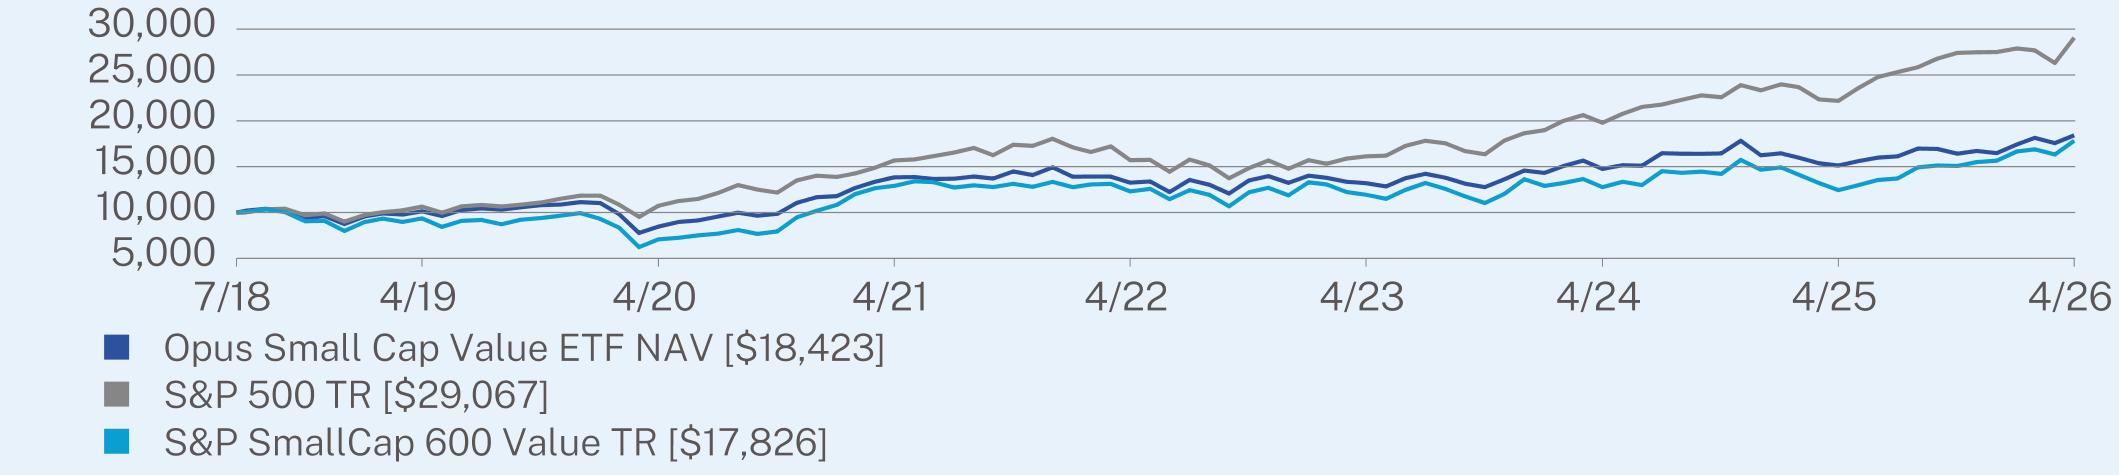
ANNUAL AVERAGE TOTAL RETURN (%)
|
|
1 Year
|
5 Year
|
Since Inception
(07/17/2018) |
|
Opus Small Cap Value ETF NAV
|
21.81
|
5.89
|
8.16
|
|
S&P 500 TR
|
31.05
|
13.14
|
14.69
|
|
S&P SmallCap 600 Value TR
|
43.28
|
6.67
|
7.71
|
KEY FUND STATISTICS (as of April 30, 2026)
|
Net Assets
|
$682,149,264
|
|
Number of Holdings
|
67
|
|
Net Advisory Fee
|
$4,998,759
|
|
Portfolio Turnover
|
15%
|
WHAT DID THE FUND INVEST IN? (as of April 30, 2026)
|
Top 10 Issuers
|
(%)*
|
|
Primoris Services Corp.
|
3.3%
|
|
Viper Energy, Inc.
|
2.8%
|
|
Hawkins, Inc.
|
2.6%
|
|
Ensign Group, Inc.
|
2.5%
|
|
Hanover Insurance Group, Inc.
|
2.5%
|
|
American Healthcare REIT, Inc.
|
2.5%
|
|
Arcosa, Inc.
|
2.5%
|
|
nVent Electric PLC
|
2.4%
|
|
Texas Roadhouse, Inc.
|
2.3%
|
|
Primerica, Inc.
|
2.1%
|
|
Security Type
|
(%)*
|
|
Common Stocks
|
98.1%
|
|
Money Market Funds
|
1.9%
|
|
Cash & Other
|
0.0%**
|
|
Top Sectors
|
(%)*
|
|
Financial
|
36.2%
|
|
Industrial
|
22.2%
|
|
Consumer, Cyclical
|
11.8%
|
|
Energy
|
9.4%
|
|
Consumer, Non-cyclical
|
8.6%
|
|
Utilities
|
4.7%
|
|
Basic Materials
|
3.4%
|
|
Communications
|
1.8%
|
|
Cash & Other
|
1.9%
|
WHAT WERE THE FUND COSTS FOR THE PAST YEAR? (based on a hypothetical $10,000 investment)
|
Fund Name
|
Costs of a $10,000 investment*
|
Costs paid as a percentage of a $10,000 investment**
|
|
Aptus April Buffer ETF
|
$14
|
0.25%
|
HOW DID THE FUND PERFORM LAST YEAR AND WHAT AFFECTED ITS PERFORMANCE?
The Aptus April Buffer ETF (“APRB” or the “Fund”) underperformed by 3.43% versus the S&P 500® Index (the “Index” or “Benchmark”) since inception (October 13, 2025) based on NAV performance. During that time the Fund returned 5.59% at NAV while the Index was up 9.02%. The Fund seeks to provide investors with returns that match the share price performance of the SPDR® S&P 500® ETF Trust (“SPY”) up to a predetermined upside Cap, before fees and expenses, while providing a Buffer of 15%, before fees and expenses, over a full investment period. By design of the Fund’s strategy, due to the Cap, it is expected that the Fund will underperform relative to its Benchmark in upward trending markets. The Index delivered strong performance for the fiscal period ending April 30, 2026 as momentum in mega-cap technology stocks and enthusiasm surrounding Artificial Intelligence continued even with very volatile performance across several other sectors.
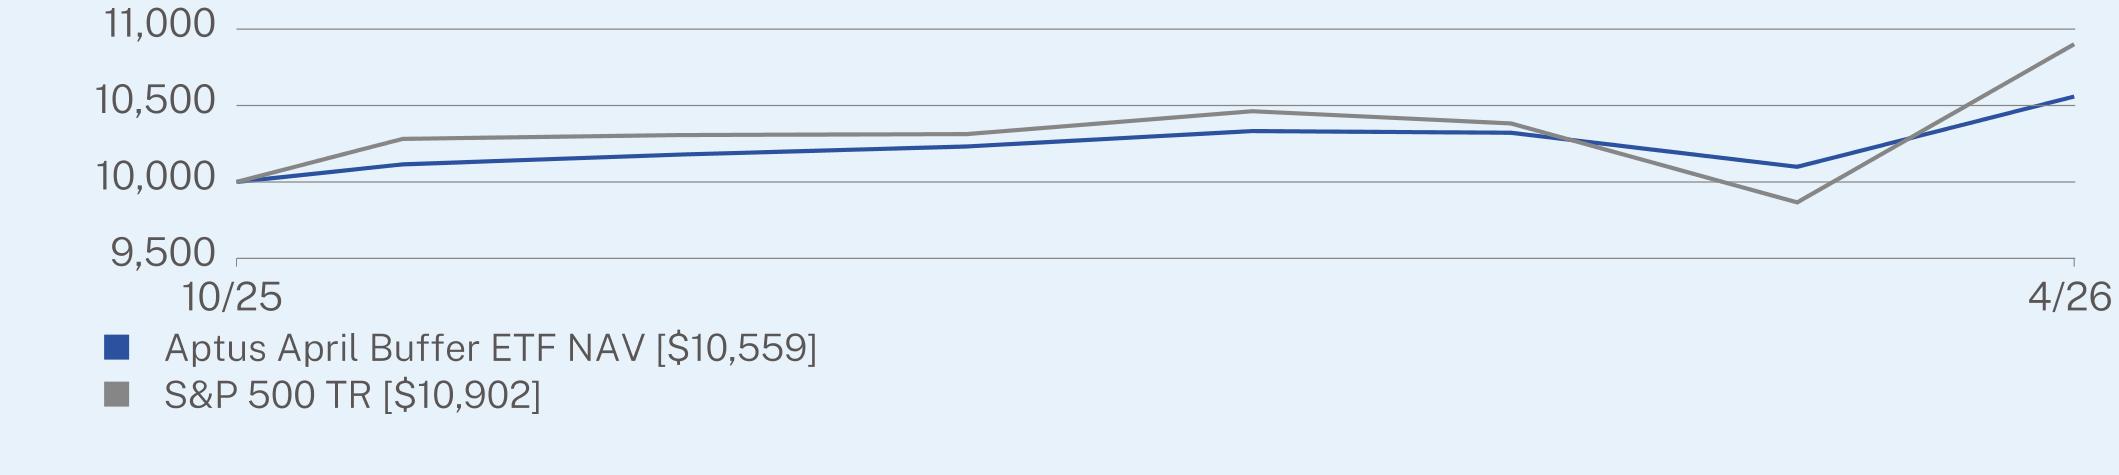
CUMULATIVE TOTAL RETURN (%)
|
|
Since Inception
(10/13/2025) |
|
Aptus April Buffer ETF NAV
|
5.59
|
|
S&P 500 TR
|
9.02
|
KEY FUND STATISTICS (as of April 30, 2026)
|
Net Assets
|
$22,174,315
|
|
Number of Holdings
|
5
|
|
Net Advisory Fee
|
$19,675
|
|
Portfolio Turnover
|
0%
|
WHAT DID THE FUND INVEST IN? (as of April 30, 2026)
|
Top Holdings
|
(%)*
|
|
SPDR S&P 500 ETF Trust, Expiration: 03/30/2027; Exercise Price: $6.32
|
105.5%
|
|
SPDR S&P 500 ETF Trust, Expiration: 03/30/2027; Exercise Price: $631.97
|
3.0%
|
|
First American Treasury Obligations Fund - Class X
|
0.1%
|
|
SPDR S&P 500 ETF Trust, Expiration: 03/30/2027; Exercise Price: $537.17
|
-1.4%
|
|
SPDR S&P 500 ETF Trust, Expiration: 03/30/2027; Exercise Price: $736.81
|
-7.2%
|
|
Security Type
|
(%)*
|
|
Purchased Options
|
108.5%
|
|
Money Market Funds
|
0.1%
|
|
Written Options
|
-8.6%
|
|
Cash & Other
|
0.0%
|
WHAT WERE THE FUND COSTS FOR THE PAST YEAR? (based on a hypothetical $10,000 investment)
|
Fund Name
|
Costs of a $10,000 investment*
|
Costs paid as a percentage of a $10,000 investment**
|
|
Aptus January Buffer ETF
|
$15
|
0.26%
|
HOW DID THE FUND PERFORM LAST YEAR AND WHAT AFFECTED ITS PERFORMANCE?
The Aptus January Buffer ETF (“JANB” or the “Fund”) underperformed by 2.65% versus the S&P 500® Index (the “Index” or “Benchmark”) since inception (October 13, 2025) based on NAV performance. During that time the Fund returned 6.37% at NAV while the Index was up 9.02%. The Fund seeks to provide investors with returns that match the share price performance of the SPDR® S&P 500® ETF Trust (“SPY”) up to a predetermined upside Cap, before fees and expenses, while providing a Buffer of 15%, before fees and expenses, over a full investment period. By design of the Fund’s strategy, due to the Cap, it is expected that the Fund will underperform relative to its Benchmark in upward trending markets. The Index delivered strong performance for the fiscal period ending April 30, 2026 as momentum in mega-cap technology stocks and enthusiasm surrounding Artificial Intelligence continued even with very volatile performance across several other sectors.
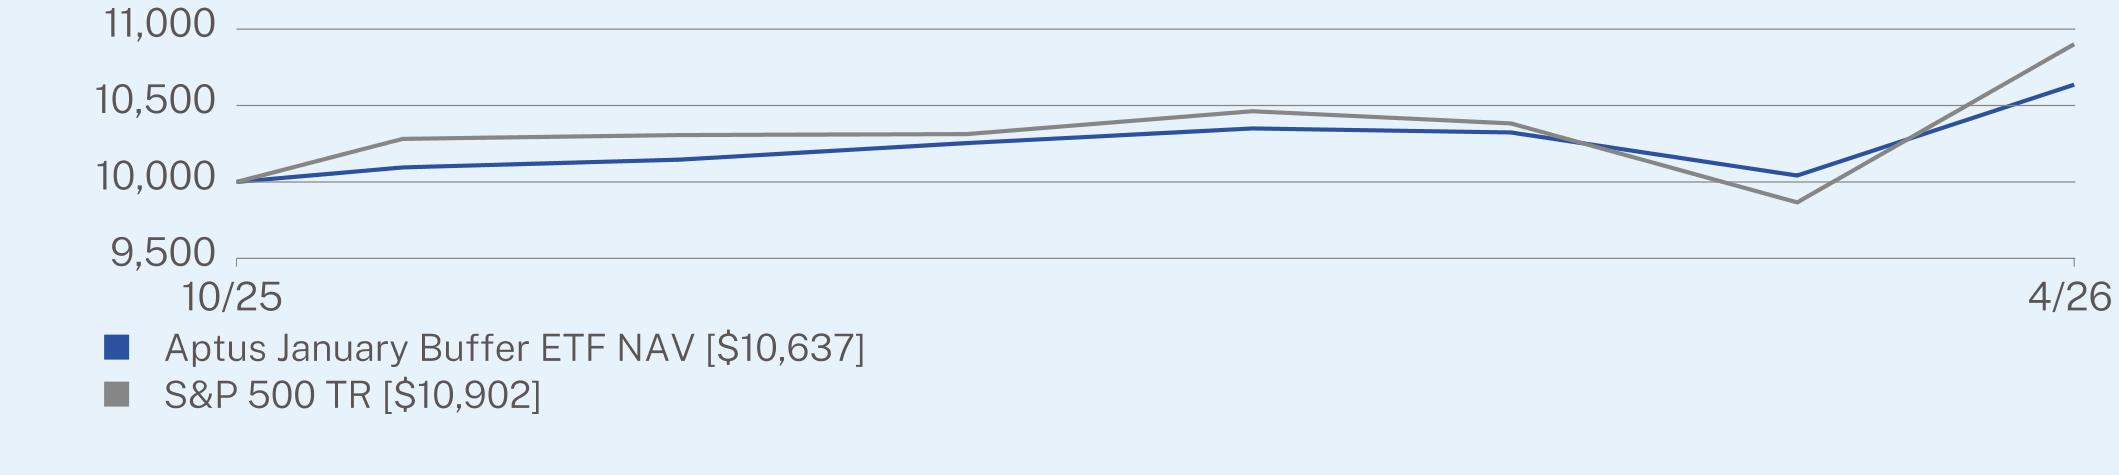
CUMULATIVE TOTAL RETURN (%)
|
|
Since Inception
(10/13/2025) |
|
Aptus January Buffer ETF NAV
|
6.37
|
|
S&P 500 TR
|
9.02
|
KEY FUND STATISTICS (as of April 30, 2026)
|
Net Assets
|
$58,501,264
|
|
Number of Holdings
|
5
|
|
Net Advisory Fee
|
$41,458
|
|
Portfolio Turnover
|
0%
|
WHAT DID THE FUND INVEST IN? (as of April 30, 2026)
|
Top Holdings
|
(%)*
|
|
SPDR S&P 500 ETF Trust, Expiration: 12/30/2026; Exercise Price: $6.87
|
99.8%
|
|
SPDR S&P 500 ETF Trust, Expiration: 12/30/2026; Exercise Price: $687.01
|
3.6%
|
|
First American Treasury Obligations Fund - Class X
|
0.1%
|
|
SPDR S&P 500 ETF Trust, Expiration: 12/30/2026; Exercise Price: $583.96
|
-1.4%
|
|
SPDR S&P 500 ETF Trust, Expiration: 12/30/2026; Exercise Price: $783.53
|
-2.1%
|
|
Security Type
|
(%)*
|
|
Purchased Options
|
103.4%
|
|
Money Market Funds
|
0.1%
|
|
Written Options
|
-3.5%
|
|
Cash & Other
|
0.0%
|
WHAT WERE THE FUND COSTS FOR THE PAST YEAR? (based on a hypothetical $10,000 investment)
|
Fund Name
|
Costs of a $10,000 investment*
|
Costs paid as a percentage of a $10,000 investment**
|
|
Aptus July Buffer ETF
|
$14
|
0.25%
|
HOW DID THE FUND PERFORM LAST YEAR AND WHAT AFFECTED ITS PERFORMANCE?
The Aptus July Buffer ETF (“JULB” or the “Fund”) underperformed by 2.65% versus the S&P 500® Index (the “Index” or “Benchmark”) since inception (October 13, 2025) based on NAV performance. During that time the Fund returned 6.37% at NAV while the Index was up 9.02%. The Fund seeks to provide investors with returns that match the share price performance of the SPDR® S&P 500® ETF Trust (“SPY”) up to a predetermined upside Cap, before fees and expenses, while providing a Buffer of 15%, before fees and expenses, over a full investment period. By design of the Fund’s strategy, due to the Cap, it is expected that the Fund will underperform relative to its Benchmark in upward trending markets. The Index delivered strong performance for the fiscal period ending April 30, 2026 as momentum in mega-cap technology stocks and enthusiasm surrounding Artificial Intelligence continued even with very volatile performance across several other sectors.
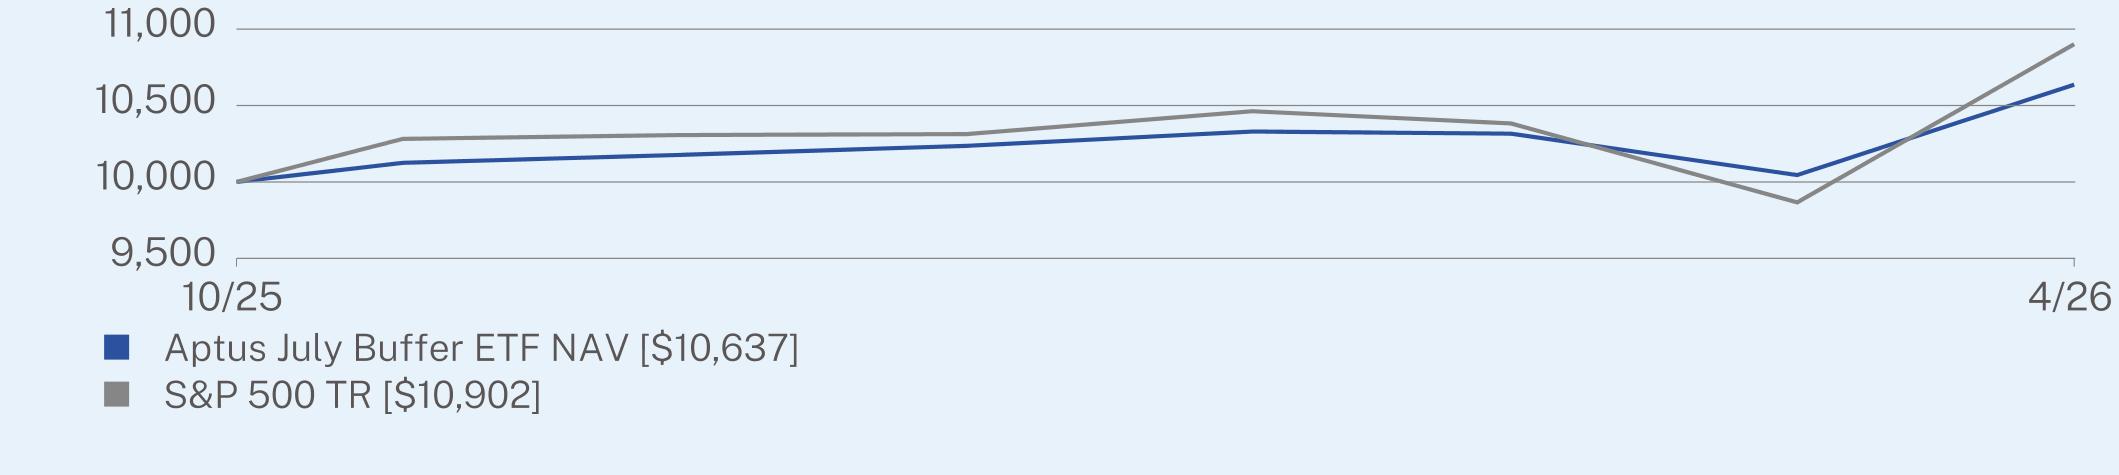
CUMULATIVE TOTAL RETURN (%)
|
|
Since Inception
(10/13/2025) |
|
Aptus July Buffer ETF NAV
|
6.37
|
|
S&P 500 TR
|
9.02
|
KEY FUND STATISTICS (as of April 30, 2026)
|
Net Assets
|
$35,899,941
|
|
Number of Holdings
|
5
|
|
Net Advisory Fee
|
$28,241
|
|
Portfolio Turnover
|
0%
|
WHAT DID THE FUND INVEST IN? (as of April 30, 2026)
|
Top Holdings
|
(%)*
|
|
SPDR S&P 500 ETF Trust, Expiration: 06/29/2026; Exercise Price: $6.63
|
100.9%
|
|
SPDR S&P 500 ETF Trust, Expiration: 06/29/2026; Exercise Price: $663.04
|
0.7%
|
|
First American Treasury Obligations Fund - Class X
|
0.1%
|
|
SPDR S&P 500 ETF Trust, Expiration: 06/29/2026; Exercise Price: $563.58
|
-0.1%
|
|
SPDR S&P 500 ETF Trust, Expiration: 06/29/2026; Exercise Price: $732.20
|
-1.6%
|
|
Security Type
|
(%)*
|
|
Purchased Options
|
101.6%
|
|
Money Market Funds
|
0.1%
|
|
Written Options
|
-1.7%
|
|
Cash & Other
|
0.0%
|
WHAT WERE THE FUND COSTS FOR THE PAST YEAR? (based on a hypothetical $10,000 investment)
|
Fund Name
|
Costs of a $10,000 investment*
|
Costs paid as a percentage of a $10,000 investment**
|
|
Aptus October Buffer ETF
|
$22
|
0.40%
|
HOW DID THE FUND PERFORM LAST YEAR AND WHAT AFFECTED ITS PERFORMANCE?
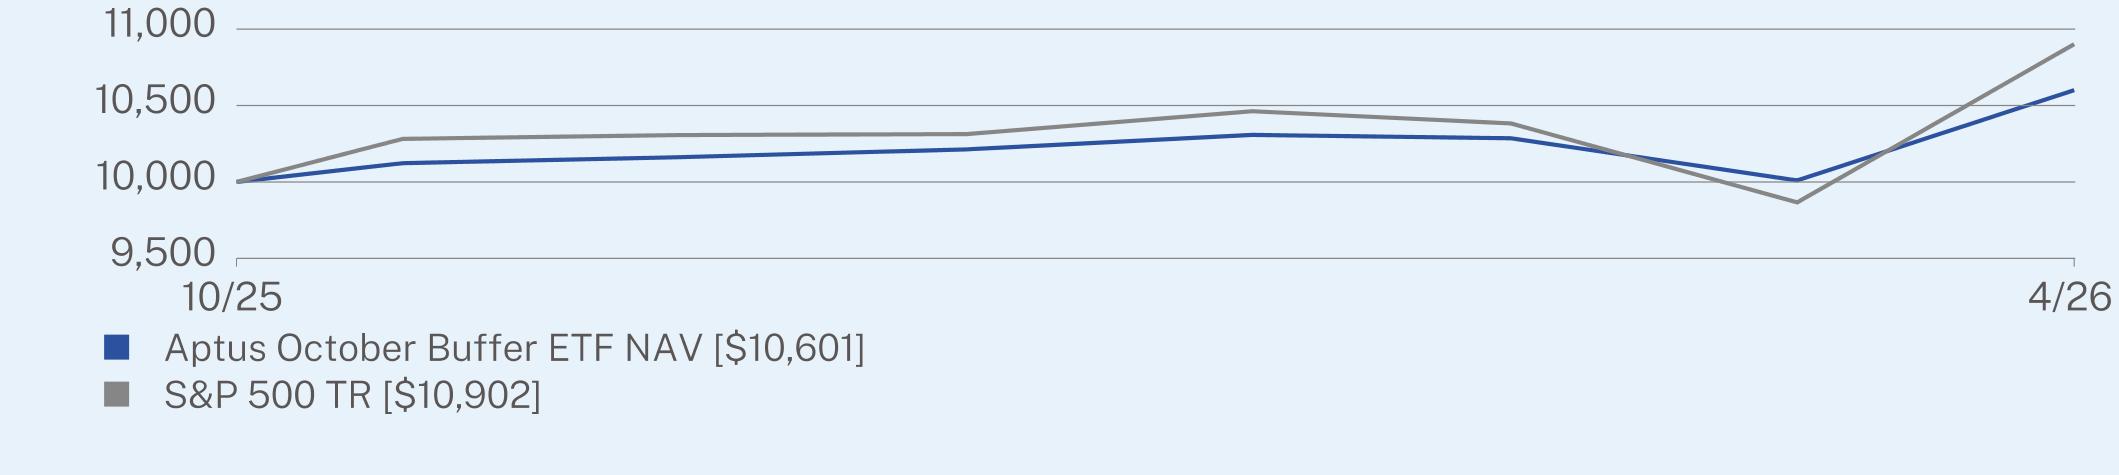
CUMULATIVE TOTAL RETURN (%)
|
|
Since Inception
(10/13/2025) |
|
Aptus October Buffer ETF NAV
|
6.01
|
|
S&P 500 TR
|
9.02
|
The Aptus October Buffer ETF (“OCTB” or the “Fund”) underperformed by 3.01% versus the S&P 500® Index (the “Index” or “Benchmark”) since inception (October 13, 2025) based on NAV performance. During that time the Fund returned 6.01% at NAV while the Index was up 9.02%. The Fund seeks to provide investors with returns that match the share price performance of the SPDR® S&P 500® ETF Trust (“SPY”) up to a predetermined upside Cap, before fees and expenses, while providing a Buffer of 15%, before fees and expenses, over a full investment period. By design of the Fund’s strategy, due to the Cap, it is expected that the Fund will underperform relative to its Benchmark in upward trending markets. The Index delivered strong performance for the fiscal period ending April 30, 2026 as momentum in mega-cap technology stocks and enthusiasm surrounding Artificial Intelligence continued even with very volatile performance across several other sectors.
KEY FUND STATISTICS (as of April 30, 2026)
|
Net Assets
|
$40,549,189
|
|
Number of Holdings
|
5
|
|
Net Advisory Fee
|
$34,046
|
|
Portfolio Turnover
|
0%
|
WHAT DID THE FUND INVEST IN? (as of April 30, 2026)
|
Top Holdings
|
(%)*
|
|
SPDR S&P 500 ETF Trust, Expiration: 09/29/2026; Exercise Price: $6.63
|
100.7%
|
|
SPDR S&P 500 ETF Trust, Expiration: 09/29/2026; Exercise Price: $663.04
|
1.9%
|
|
First American Treasury Obligations Fund - Class X
|
0.2%
|
|
SPDR S&P 500 ETF Trust, Expiration: 09/29/2026; Exercise Price: $563.58
|
-0.6%
|
|
SPDR S&P 500 ETF Trust, Expiration: 09/29/2026; Exercise Price: $754.21
|
-2.2%
|
|
Security Type
|
(%)*
|
|
Purchased Options
|
102.6%
|
|
Money Market Funds
|
0.2%
|
|
Written Options
|
-2.8%
|
|
Cash & Other
|
0.0%
|
WHAT WERE THE FUND COSTS FOR THE PAST YEAR? (based on a hypothetical $10,000 investment)
|
Fund Name
|
Costs of a $10,000 investment*
|
Costs paid as a percentage of a $10,000 investment**
|
|
Aptus Laddered Buffer ETF
|
$0
|
0.05%
|
HOW DID THE FUND PERFORM LAST YEAR AND WHAT AFFECTED ITS PERFORMANCE?
The Aptus Laddered Buffer ETF (“ABUF” or the “Fund”) underperformed by 4.92% versus the S&P 500® Index (the “Index”) since inception (March 31, 2026) based on NAV performance. During that time the Fund returned 5.57% while the Index was up 10.49%. The laddered approach seeks to eliminate timing risk of choosing which of the underlying ETFs to invest in separately, allowing a rolling exposure to each individual underlying ETF for continued buffer on the downside with limited participation in up trending markets. The Fund by nature will underperform in up trending markets, but aims to capture as much as the cap of the underlying securities as possible for each of their investment periods. The Index was led by momentum in mega-cap technology stocks and enthusiasm surrounding Artificial Intelligence.
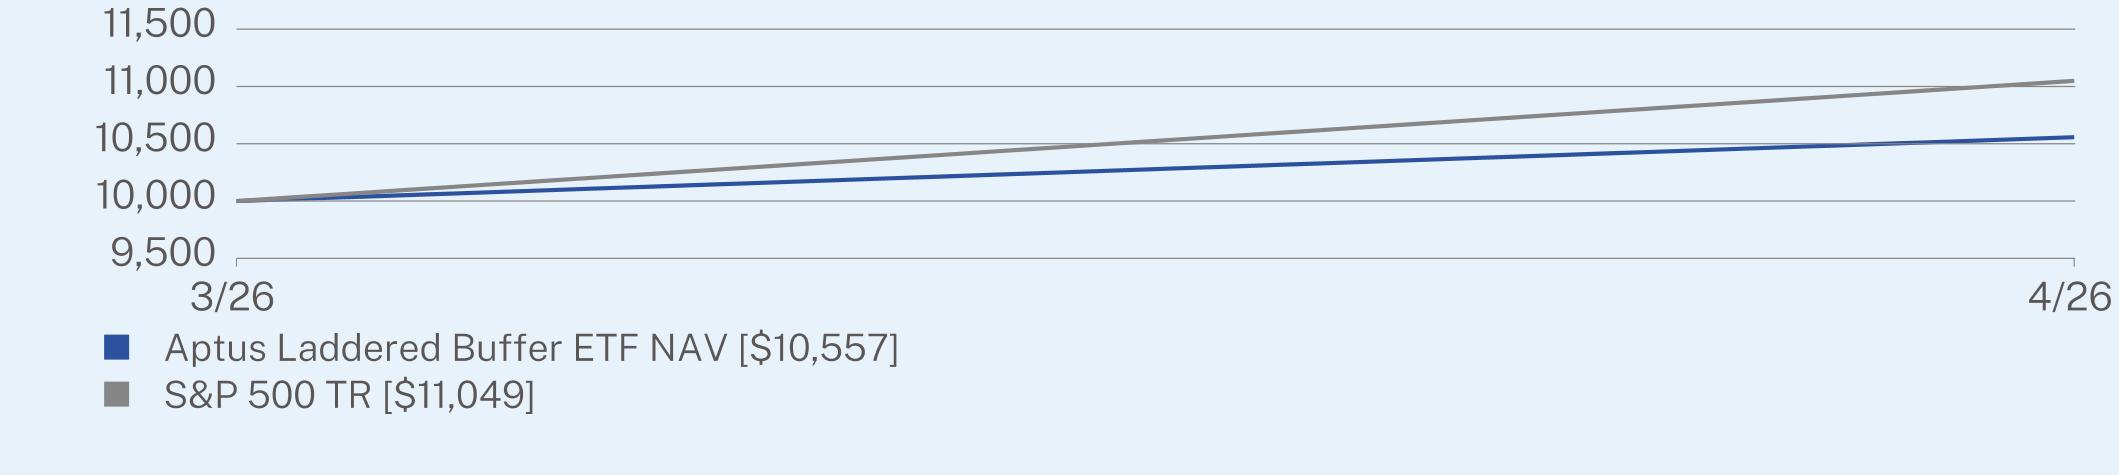
CUMULATIVE TOTAL RETURN (%)
|
|
Since Inception
(03/31/2026) |
|
Aptus Laddered Buffer ETF NAV
|
5.57
|
|
S&P 500 TR
|
10.49
|
KEY FUND STATISTICS (as of April 30, 2026)
|
Net Assets
|
$527,873
|
|
Number of Holdings
|
5
|
|
Net Advisory Fee
|
$21
|
|
Portfolio Turnover
|
0%
|
WHAT DID THE FUND INVEST IN? (as of April 30, 2026)
|
Top Holdings
|
(%)*
|
|
Aptus January Buffer ETF
|
25.1%
|
|
Aptus October Buffer ETF
|
25.0%
|
|
Aptus July Buffer ETF
|
25.0%
|
|
Aptus April Buffer ETF
|
24.7%
|
|
First American Treasury Obligations Fund - Class X
|
0.2%
|
|
Security Type
|
(%)*
|
|
Exchange Traded Funds
|
99.8%
|
|
Money Market Funds
|
0.2%
|
|
Cash & Other
|
0.0%
|
| [1] |
|
||
| [2] |
|
||
| [3] |
|
||
| [4] |
|
||
| [5] |
|
||
| [6] |
|
||
| [7] |
|
||
| [8] |
|
||
| [9] |
|
||
| [10] |
|
||
| [11] |
|
||
| [12] |
|