Exhibit 4.7
 |
SIGNATURES OF AUTHORS
| Prepare By: | “Signed by Matthew Dumala” | Date: April 23, 2026 |
| Matthew R. Dumala, P.Eng.(BC) | ||
| Archer Cathro Geological (US) Ltd. | ||
| Prepare By: | “Signed by Art Ibrado” | Date: April 23, 2026 |
| Art Ibrado, PhD, PE(AZ) | ||
| Fort Lowell Consulting PLLC |
| Manhattan Mineral Resource – Amended April 23, 2026 | Page | i |
| |
CONTENTS
| SIGNATURES OF AUTHORS | i | ||
| CONTENTS | ii | ||
| LIST OF TABLES | vii | ||
| LIST OF FIGURES | ix | ||
| 1.0 | SUMMARY | 11 | |
| 1.1 | Project Description | 11 | |
| 1.2 | History | 11 | |
| 1.3 | Geology and Mineralization | 11 | |
| 1.4 | Exploration | 12 | |
| 1.5 | Metallurgy | 12 | |
| 1.6 | Mineral Resource Estimate | 12 | |
| 1.7 | Interpretation and Conclusions | 13 | |
| 1.8 | Recommendations | 14 | |
| 2.0 | INTRODUCTION | 15 | |
| 2.1 | General | 15 | |
| 2.2 | Purpose of the Report | 15 | |
| 2.3 | Sources of Information | 15 | |
| 2.4 | Qualified Persons | 15 | |
| 2.5 | Definition of Terms | 16 | |
| 3.0 | RELIANCE ON OTHER EXPERTS | 18 | |
| 4.0 | PROPERTY DESCRIPTION AND LOCATION | 19 | |
| 4.1 | Project Location and Overview | 19 | |
| 4.2 | Claims Summary, Fees, and Taxes | 20 | |
| 4.3 | Property Overview and Legal Access | 22 | |
| 4.3.1 | Goldwedge Property | 22 | |
| 4.3.2 | Manhattan Property | 22 | |
| 4.3.3 | Keystone-Jumbo Mine and Associated Claims | 22 | |
| 4.3.4 | Other Claim Blocks | 24 | |
| 4.4 | Acquisitions and Royalties | 24 | |
| 4.5 | Exploration Authorizations | 26 | |
| 4.6 | Permits and Environmental Liabilities | 26 | |
| Manhattan Mineral Resource – Amended April 23, 2026 | Page | ii |
| |
| 5.0 | ACCESSIBILITY, CLIMATE, LOCAL RESOURCES, INFRASTRUCTURE, AND PHYSIOGRAPHY | 27 | |
| 5.1 | Access and Infrastructure | 27 | |
| 5.2 | Water Resources | 29 | |
| 5.3 | Climate | 29 | |
| 5.4 | Topography, Elevation, and Vegetation | 29 | |
| 6.0 | HISTORY | 31 | |
| 6.1 | Manhattan | 33 | |
| 6.2 | Goldwedge | 34 | |
| 6.3 | Keystone Jumbo | 34 | |
| 6.4 | Historical Resources | 35 | |
| 7.0 | GEOLOGICAL SETTING AND MINERALIZATION | 39 | |
| 7.1 | Regional Geology | 39 | |
| 7.1.1 | Lithological Descriptions | 40 | |
| 7.2 | Property Geology | 42 | |
| 7.2.1 | Alteration | 45 | |
| 7.2.2 | Property Mineralization | 45 | |
| 8.0 | DEPOSIT TYPES | 49 | |
| 9.0 | EXPLORATION | 51 | |
| 9.1 | Soil Sampling | 51 | |
| 9.2 | Underground Sampling | 53 | |
| 10.0 | DRILLING | 54 | |
| 10.1 | Drilling Summary | 54 | |
| 10.2 | Drilling Methods | 56 | |
| 10.2.1 | Reverse Circulation Drilling | 57 | |
| 10.2.2 | Diamond Drilling | 63 | |
| 10.3 | Historical Drilling | 63 | |
| 10.3.1 | Historical Drilling Methods | 63 | |
| 10.3.2 | Historical Drilling Results | 65 | |
| 11.0 | SAMPLE PREPARATION, ANALYSIS, AND SECURITY | 65 | |
| 11.1 | Historical Drilling | 66 | |
| 11.1.2 | Historical QAQC | 68 | |
| 11.2 | Scorpio Gold | 68 | |
| 11.2.1 | Geochemical Soil Sampling | 69 |
| Manhattan Mineral Resource – Amended April 23, 2026 | Page | iii |
| |
| 11.2.2 | Drilling – Sample Preparation | 70 | |
| 11.2.3 | Drilling - Sample Security | 70 | |
| 11.2.4 | Drilling - Sample Analysis | 70 | |
| 11.2.5 | Quality Assurance and Quality Control | 72 | |
| 12.0 | DATA VERIFICATION | 72 | |
| 12.1 | Historical Drill Hole Data | 72 | |
| 12.1.1 | Drill Hole Collars | 72 | |
| 12.1.2 | Drill Hole Assays | 73 | |
| 12.2 | Historical Metallurgical Data | 73 | |
| 12.3 | Scorpio Data | 75 | |
| 12.4 | Site Visits | 75 | |
| 12.4.1 | Matthew R. Dumala, P.Eng | 75 | |
| 12.4.2 | Patrick Loury, M.Sc., CPG | 75 | |
| 12.5 | Summary Statement | 76 | |
| 13.0 | MINERAL PROCESSING AND METALLURGICAL TESTING | 76 | |
| 13.1 | Historical Operations and Production | 76 | |
| 13.1.1 | Historical Processing at Manhattan Mill | 78 | |
| 13.2 | Metallurgical Testing | 78 | |
| 13.2.1 | Summa Corporation – 1975 | 78 | |
| 13.2.2 | Tenneco - Houston International Minerals Corporation Testing – 1983 Feasibility Study | 78 | |
| 13.2.3 | Metallurgical Tests on Goldwedge Composite for FMC in 1986 by Heinen-Lindstrom Consultants | 81 | |
| 13.2.4 | Gravity Concentration Tests at Minerals Processing Laboratory (Sparks, NV, 1986) | 82 | |
| 13.2.5 | Metallurgical Tests on Goldwedge Composite for FMC in 1988 by McClelland Laboratories | 83 | |
| 13.2.6 | January 2007 METCON Tests for Royal Standard Minerals Inc. | 83 | |
| 13.2.7 | March 2012 McClelland Tests for Manhattan Mining Company | 86 | |
| 14.0 | MINERAL RESOURCE ESTIMATE | 91 | |
| 14.1 | Mineral Resource Statement | 91 | |
| 14.2 | Database | 92 | |
| 14.3 | Mineral Resource Estimate | 96 | |
| 14.3.1 | Data Preparation | 96 | |
| 14.3.2 | Wireframes | 97 |
| Manhattan Mineral Resource – Amended April 23, 2026 | Page | iv |
| |
| 14.3.3 | Exploratory Data Analysis | 106 | |
| 14.3.4 | Variography | 111 | |
| 14.3.5 | Block Model Set Up | 115 | |
| 14.3.6 | Grade Interpolation | 116 | |
| 14.3.7 | Bulk Density Modelling | 118 | |
| 14.3.8 | Mineral Resource Classification | 119 | |
| 14.3.9 | Model Validation | 120 | |
| 14.3.10 | Assessment of Reasonable Prospects for Eventual Economic Extraction | 133 | |
| 14.4 | Discussion of Mineral Resources, Risks, and Recommendations | 141 | |
| 15.0 | MINERAL RESERVE ESTIMATES | 144 | |
| 16.0 | MINING METHODS | 144 | |
| 17.0 | RECOVERY METHODS | 144 | |
| 18.0 | PROJECT INFRASTRUCTURE | 144 | |
| 19.0 | MARKET STUDIES AND CONTRACTS | 144 | |
| 20.0 | ENVIRONMENTAL STUDIES, PERMITTING AND SOCIAL OR COMMUNITY IMPACT | 144 | |
| 20.0 | CAPITAL AND OPERATING COSTS | 144 | |
| 21.0 | ECONOMIC ANALYSIS | 144 | |
| 23.0 | ADJACENT PROPERTIES | 145 | |
| 24.0 | OTHER RELEVANT DATA AND INFORMATION | 146 | |
| 25.0 | INTERPRETATION AND CONCLUSIONS | 147 | |
| 26.0 | RECOMMENDATIONS | 148 | |
| 26.1 | Recommendations for Future Exploration Programs | 148 | |
| 26.1.1 | Mapping and Sampling | 148 | |
| 26.1.2 | Data Compilation | 148 | |
| 26.1.3 | QA/QC Program | 148 | |
| 26.2 | Recommended Metallurgical Tests for Future Studies | 148 | |
| 26.2.1 | Composites for Testing | 148 | |
| 26.2.2 | Mineral Characterization | 149 | |
| 26.2.3 | Metallurgical Tests | 149 | |
| 26.3 | Recommendations for Future Resource Estimations | 150 | |
| 26.3.1 | Additional Drilling | 150 | |
| 26.3.2 | Historical Mine Surveys | 150 | |
| 26.3.3 | Density Data Collection | 150 |
| Manhattan Mineral Resource – Amended April 23, 2026 | Page | v |
| |
| 26.4 | Permitting Recommendations | 150 | |
| 26.4.1 | Permits and Authorizations | 150 | |
| 26.4.2 | Water Rights | 151 | |
| 26.4.3 | Permit Considerations with Respect to Potential Future Activities | 151 | |
| 26.4.4 | Water Right Considerations with Respect to Potential Future Activities | 151 | |
| 26.5 | Proposed Budget | 152 | |
| 27.0 | REFERENCES | 153 | |
| 28.0 | CERTIFICATES OF QUALIFIED PERSONS | 156 | |
| Appendix I: Claim Locations | 160 | ||
| Appendix II: Claim List | 162 | ||
| Patented Claims | 163 | ||
| Unpatented Federal Claims | 165 | ||
| Manhattan Mineral Resource – Amended April 23, 2026 | Page | vi |
| |
LIST OF TABLES
| Table 1-1: Manhattan Project Mineral Resource Statement | 13 |
| Table 2-1: Qualified Persons | 15 |
| Table 4-1: Summary of Claims | 20 |
| Table 6-1: Manhattan Production 1984-1983 (Nevada Department of Taxation) | 33 |
| Table 6-2: Keystone Jumbo Historical Resources | 35 |
| Table 6-3: Basis of Historical Resource Estimate | 37 |
| Table 6-4: Historical Resources Estimation Ranges | 37 |
| Table 7-1: Mineralized Zones | 47 |
| Table 9-1: Keystone Jumbo soil sample statistics | 51 |
| Table 9-2: Historical gold soil sample statistics | 51 |
| Table 9-3: Underground Channel Sampling - Significant Results | 53 |
| Table 10-1: Scorpio Gold drill hole summary | 54 |
| Table 10-2: Scorpio Gold drill hole highlights | 56 |
| Table 10-3: Historical Drilling Methods | 64 |
| Table 11-1: List of Laboratories | 65 |
| Table 11-2: 2024 Certified Reference Material | 71 |
| Table 12-1: Screen metallics results | 74 |
| Table 12-2: Check sample results | 74 |
| Table 13-1: History of Production at Manhattan. | 77 |
| Table 13-2: Echo Bay Operating Data from 1986 through 1988. | 78 |
| Table 13-3: Results of Bottle-Roll Cyanidation of Panned Concentrate. | 78 |
| Table 13-4: Results of Scrubbing Tests. | 79 |
| Table 13-5: Results of Gravity Concentration Tests. | 80 |
| Table 13-6: Results of Flotation Tests | 80 |
| Table 13-7: Screen Analysis of Cyanide Leach Residue | 82 |
| Table 13-8: Gravity Concentration Test Results – 1986. | 83 |
| Table 13-9. Assay Results of Goldwedge A-1 and B-1 Samples (2007). | 84 |
| Table 13-10. Results of METCON’s Gravity and Flotation Tests on Goldwedge Samples A-1 and B-1 (2007). | 85 |
| Table 13-11. Reagent Scheme Used in METCON Flotation Tests (2007). | 86 |
| Table 13-12: Gravity Concentration Test Results, Goldwedge Sample #6, P80 = 200 Mesh Feed Size | 86 |
| Table 13-13: Flotation of Rougher Tailing from Gravity Concentration Test on Goldwedge Sample #6 . | 87 |
| Table 13-14: Overall Mass Balance - Gravity/Flotation Test Series | 87 |
| Table 13-15: Overall Mass Balance - Gravity/Cyanidation Test Series and Whole-Ore Leach | 89 |
| Table 14-1: Mineral Resource Statement | 91 |
| Table 14-2: Drillhole database summary statistics | 95 |
| Table 14-3: Lithology Codes | 100 |
| Table 14-4: Estimation domains | 105 |
| Table 14-5: Contact analysis summary | 107 |
| Table 14-6: Topcut statistics for domains used in estimation | 110 |
| Table 14-7: Variogram parameters for mineralized domains used in estimation | 114 |
| Table 14-8: Block model parameters | 116 |
| Manhattan Mineral Resource – Amended April 23, 2026 | Page | vii |
| |
| Table 14-9: Estimation parameters | 117 |
| Table 14-10: Density values assigned to block model | 118 |
| Table 14-11: Estimate mean comparison between Au_ID3, Au_ID3 Uncapped, Au_NN, and Au_OK | 121 |
| Table 14-12: Sequential Gaussian Simulation parameters for Au in mineralized estimation domains | 131 |
| Table 14-13: Pit optimization parameters | 133 |
| Table 14-14: Mineral Resource Statement | 134 |
| Table 14-15: Average pit-constrained gold grade and contained ounces at various cut-off grades | 141 |
| Manhattan Mineral Resource – Amended April 23, 2026 | Page | viii |
| |
LIST OF FIGURES
| Figure 4-1: General Location | 19 |
| Figure 4-2: Claim Locations | 21 |
| Figure 4-3: Project Royalties | 25 |
| Figure 5-1: Goldwedge Mine Infrastructure | 28 |
| Figure 6-1: Historical Locations | 32 |
| Figure 6-2: Historical Resource Areas | 36 |
| Figure 7-1: Simplified Regional Geology | 41 |
| Figure 7-2: Property Geology | 43 |
| Figure 7-3: Generalized Cross Section | 44 |
| Figure 7-4: Property Targets | 48 |
| Figure 8-1: Epithermal Deposit Model (Hedenquist et al, 2000) | 49 |
| Figure 9-1: Keystone Jumbo Gold Soil Geochemistry | 52 |
| Figure 9-2: Channel Sample Locations – AxCut (Scorpio, 2020) | 53 |
| Figure 10-1: Drill Hole Locations | 55 |
| Figure 10-2: Goldwedge Section A-A' (Loury, 2025) | 59 |
| Figure 10-3: Goldwedge Section B-B' (Loury, 2025) | 60 |
| Figure 10-4:West Pit Section C-C' (Loury, 2025) | 61 |
| Figure 10-5: USD and East Pit Section D-D' (Loury, 2025) | 62 |
| Figure 13-1: Results of Cyanide Leach Tests, Fort Lowell Consulting 2025, using Tenneco data 1983 | 81 |
| Figure 13-2: Cyanide Leaching Kinetics of 8-mesh Goldwedge Composite, Fort Lowell Consulting 2025 using data from Heinen-Lindstrom Consultants, 1986. | 82 |
| Figure 13-3: Cyanide Leaching Kinetics of 200-mesh Goldwedge Composite, McClelland Laboratories, 1988. | 84 |
| Figure 13-4: Cyanide Leaching Kinetics of 200-mesh Goldwedge Sample #6, McClelland Laboratories, 2012. | 88 |
| Figure 13-5: Micrographs of large free gold particles seen in the gravity concentrate, McClelland Laboratories 2012. | 90 |
| Figure 14-1: Plan view showing 2025 Block Model, Resource pit, and Resource reporting zone (Loury, 2025) | 92 |
| Figure 14-2: Drill collar locations and Resource Pit Outline (Loury, 2025) | 94 |
| Figure 14-3: Underground workings wireframes and block model flag (variable: UG_Workings_Pct) (Loury, 2025) | 97 |
| Figure 14-4: Manhattan-Goldwedge Fault Model (Loury, 2025) | 99 |
| Figure 14-5: Manhattan-Goldwedge Lithology model, excluding overburden/dump material (Loury, 2025) | 100 |
| Figure 14-6: Manhattan-Goldwedge Overburden Model (Loury, 2025) | 101 |
| Figure 14-7: Mineralized domains used to constrain grade estimation in the Manhattan-Goldwedge block model (Loury, 2025) | 102 |
| Figure 14-8: Section A-A’ showing the MIN_NellieGray_Reliance domain (Loury, 2025) | 103 |
| Figure 14-9: Section C-C’ showing the MIN_West_Pit estimation domain (Loury, 2025) | 104 |
| Figure 14-10: Section D-D’ showing the MIN_East_Pit and MIN_USD_Pit estimation domains (Loury, 2025) | 105 |
| Manhattan Mineral Resource – Amended April 23, 2026 | Page | ix |
| |
| Figure 14-11: Global compositing interval length statistics for composites used in estimation (Loury, 2025) | 106 |
| Figure 14-12: Contact plot examples from the MIN_West_Pit domain (Loury, 2025) | 107 |
| Figure 14-13: Topcut analysis for the MIN_West_Pit estimation domain (Loury, 2025) | 108 |
| Figure 14-14: Topcut analysis for the MIN_NellieGray_Reliance estimation domain (Loury, 2025) | 109 |
| Figure 14-15: Normal scores variography and backtransform model for gold estimation in the MIN_West_Pit domain (Loury, 2025) | 112 |
| Figure 14-16: Normal scores variography and backtransform model for gold estimation in the MIN_NellieGray_Reliance domain (Loury, 2025) | 113 |
| Figure 14-17: Model extents for the Manhattan-Goldwedge 5x5x5m Block Model (Loury, 2025) | 115 |
| Figure 14-18: Manhattan-Goldwedge Resource Classification (Loury, 2025) | 120 |
| Figure 14-19: Section locations for Figure 14-20 through Figure 14-22 (Loury, 2025) | 122 |
| Figure 14-20: West Pit validation section 4,265,605mN (Loury, 2025) | 123 |
| Figure 14-21: East Pit validation section 4,265,280mN (Loury, 2025) | 124 |
| Figure 14-22: Goldwedge validation section 4,266,240mN (Loury, 2025) | 125 |
| Figure 14-23: Swath plots from the MIN_East_Pit domain (Loury, 2025) | 127 |
| Figure 14-24: Swath plots from the MIN_NellieGray_Reliance domain (Loury, 2025) | 128 |
| Figure 14-25: Swath plots from the MIN_West_Pit domain (Loury, 2025) | 129 |
| Figure 14-26: Cell declustering and weights for the MIN_West_Pit estimation domain (Loury, 2025) | 130 |
| Figure 14-27: Grade-tonnage curve comparison between ID3, OK, and SGS for Au in select mineralized domains (Loury, 2025) | 131 |
| Figure 14-28: Plan view showing 2025 Block Model, Resource pit, Resource reporting zone, and section lines for Figure 14-29 through Figure 14-32 (Loury, 2025) | 135 |
| Figure 14-29: Section AA-AA’ showing pit-constrained Inferred Resources in the Goldwedge area (Loury, 2025) | 136 |
| Figure 14-30: Section BB-BB’ showing pit-constrained Inferred Resources in the Mustang Hill and West Pit areas (Loury, 2025) | 137 |
| Figure 14-31: Section CC-CC’ showing pit-constrained Inferred Resources in the East Pit and USD Pit areas (Loury, 2025) | 138 |
| Figure 14-32: Section DD-DD’ showing pit-constrained Inferred Resources in the Goldwedge, West Pit, and USD Pit areas (Loury, 2025) | 139 |
| Figure 14-33: Grade-tonnage curves for pit-constrained Inferred Resources at various gold cutoff grades (Loury, 2025) | 140 |
| Manhattan Mineral Resource – Amended April 23, 2026 | Page | x |
| |
| 1.0 | SUMMARY |
| 1.1 | PROJECT DESCRIPTION |
The Manhattan Property consists of 678 federal lode claims, 28 patented lode claims, and three federal placer claims, 100% owned by Scorpio Gold Corporation (“Scorpio”) in the Manhattan Mining District, located in Nye County Nevada. The claims are located on Forest Service Land and registered with the Bureau of Land Management (“BLM”). The Manhattan Property consists of claims staked directly by Scorpio and several claim blocks acquired by Scorpio with varying royalty percentages.
The Property is located 53 km, north-northeast of Tonopah and can be accessed year-round from Nevada State Route 377, which is accessible from Nevada State Route 376. Unpaved roads, and numerous unmaintained 4x4 trails provide access to most areas on the Property. A 2,000 m long paved airstrip, is located at the town of Round Mountain, 17 km to the northwest.
| 1.2 | HISTORY |
The Manhattan Mining District was first prospected for silver and copper in the 1860s. A gold-rich outcrop was discovered in April 1905 and the first claims staked on what is known as the April Fool Mine. By the following year, numerous prospectors were working numerous claims in the area. The majority of production from the Reliance Mine occurred between 1932 and 1941, with an estimated production of 59,108 tons at a recovered grade of 0.435 oz/ton (14.91 g/t) (Kral, 1951). While the bulk of the early production occurred before World War II, both lode and placer mining continued until the early 1950’s.
In the 1980s, more than 150,000 ounces of gold was produced from open pit mines on the Property, by Huston Oil and Minerals Corporation, subsequently Tenneco Minerals Co., and Echo Bay Mines. In the early 1990’s Echo Bay merged with its partners at Round Mountain to form Round Mountain Gold, later operated by Kinross Gold. Kinross sold their interests in the Manhattan Property to Scorpio Gold in 2021.
The Goldwedge area has a history of being mined by both small-scale underground and placer methods. In 1997, the project was sublet to Royal Gold who in 2001, Royal Standard Metals acquired the property and consolidated the area. In 2003, RSM began construction of an exploration decline to collect a bulk sample. Scorpio obtained the Goldwedge Property from Royal Standard Metals in 2012.
| 1.3 | GEOLOGY AND MINERALIZATION |
The Manhattan Property covers two main lithologic assemblages. The older quartzite-siltite-phyllite-argillite assemblage assigned to the Cambrian age Gold Hill Formation hosts the mineralization in the southern end of the Goldwedge deposit and extends south into the open pits. While the overlying thin-bedded limestone assemblage, assigned to the Ordovician Age Zanzibar Limestone, hosts the majority of the deposit to the north. The Zanzibar Limestone assemblage grades upward into an interbedded sequence of micritic limestone-laminated calcareous siltstone-black chert-argillite which is characteristic of a restricted basin type deposition. To the northeast, these sedimentary rocks abruptly cut by Tertiary volcanic rocks forming the Manhattan Caldera.
| Manhattan Mineral Resource – Amended April 23, 2026 | 11 |
| |
Mineralization in the Manhattan district represents the superposition of a 25 to 15Ma low-sulphidation epithermal gold-silver system over a complex architecture of Oligocene volcanic cover and strongly deformed Paleozoic basement. The mineralization appears dominated by fault zones that cut the basement (and also the volcanics), some of which are clearly ‘standard’ normal faults with surrounding steeper-dipping vein arrays.
| 1.4 | EXPLORATION |
Since acquiring the property, Scorpio has largely focused on drilling, both from surface and underground. Surface exploration has been limited to mapping, and grid-soil sampling over the Keystone Jumbo.
Since acquiring the property in 2012, Scorpio has drilled 121 holes, totaling 15,820.39 metres on the property (Table 10-1). This includes 31 diamond drill holes from surface, 39 diamond drill holes from underground, and 51 reverse circulation (“RC”) holes from surface. In addition to drilling completed by Scorpio, there has been more than 2,000 drill holes completed on the Property by previous operators since 1973. At the time of this report Scorpio has compiled and validated 1,435 of these drill holes, totaling 102,254.20 metres of drilling. The majority of this drilling has been reverse circulation or rotary, with only a limited amount of diamond drilling.
| 1.5 | METALLURGY |
At this stage of the study, no current metallurgical testing has been performed on any samples from the mineral deposit. However, the Manhattan area has a long history of mining and production, including a few metallurgical tests that have been performed. These tests were conducted on samples whose origins are difficult to track and may not satisfy current sampling standards. Nevertheless, these historical records indicate a mineral deposit that appear to have a conventional path to metallurgical recovery.
| 1.6 | MINERAL RESOURCE ESTIMATE |
The Manhattan resource model was prepared by Loury Geoscience Consulting LLC and Matthew Dumala. Geologic and estimation domains were constructed using Leapfrog Geo v. 2024.1.3, including input from analyses completed in ioGAS v.8.3. Geostatistical evaluations and EDA, including topcut selection, declustering, and variography, were completed using Snowden Supervisor v.9.0. Resource estimation was prepared using Leapfrog EDGE v.2024.1.3. Pit optimization was completed by Fuse Advisors using Datamine NPVS software.
The Mineral Resource Estimate (“MRE”) is based on a total of 92,635 meters of drilling completed in 1,341 drillholes. Estimates of Mineral Resources were completed using a three-dimensional block model with a regular block size of 5x5x5 meters, with estimation domains constructed based on modeled mineralization controls and geostatistical analysis of the drill sample data. The effects of potentially anomalous high-grade sample data are controlled using traditional top-cutting as well as limiting the distance of influence during block grade interpolation. Blocks were classified under the “Inferred” category, in accordance with the 2014 Canadian Institute of Mining, Metallurgy, and Petroleum Standards for Mineral Resources and Mineral Reserves, Definitions and Guidelines, May 2014 (the “CIM Definition Standards”). Measured or Indicated resources were not classified. Inferred resources were classified based on a drill data spacing of 50 meters or less (25 meters to the closest drillhole), considering blocks which were estimated using two or more drillholes only. Model validation for the final reported Inverse Distance Cubed (“ID3”) estimate includes statistical validation using Ordinary Kriging (“OK”) and Nearest Neighbor (“NN”) estimates, Swath plot comparisons between composite data and the three estimation methods, visual validation on cross sections and plan levels, and grade-tonnage envelopes from Sequential Gaussian Simulation.
| Manhattan Mineral Resource – Amended April 23, 2026 | 12 |
| |
Mineral Resources are reported below the most recent light detection and ranging (“LiDAR”) topographic surface and are contained within economically constrained pit shells generated using the Hochbaum Pseudoflow algorithm implemented in Datamine’s Studio NPVS software. Open pit Mineral Resources are reported in Table 1-1 using a 0.3 g/t Au cutoff grade.
Table 1-1: Manhattan Project Mineral Resource Statement
| Classification | Tonnage | Gold Grade | Gold Contained |
| kt | g/t | koz | |
| Measured | — | — | — |
| Indicated | — | — | — |
| Inferred | 18,342 | 1.26 | 740 |
Notes:
| 1. | Inferred resource estimates are based on economically constrained open pits generated using the Hochbaum Pseudoflow algorithm in Datamine’s Studio NPVS and the following optimization parameters (all dollar values are in US dollars): |
| ● | Inferred Resource classification only. |
| ● | $2,500/ounce gold price. |
| ● | Mill recovery of 90% for gold. |
| ● | 50 degree pit slope angle for in-situ rock, 30 degree pit slope angle for overburden. |
| ● | Mining costs of $3.00 per tonne for both ore and waste. |
| ● | Milling costs of $15.00 per tonne processed. |
| ● | G&A cost of $3.50 per tonne processed. |
| ● | 2% royalty costs. |
| ● | A 0.3 g/t gold only cutoff was applied for Inferred resource reporting. |
| ● | Ore loss and dilution not applied. |
| 2. | Mineral Resources are not Mineral Reserves (as that term is defined in the CIM Definition Standards) and do not have demonstrated economic viability. The estimate of mineral resources may be materially affected by environmental, permitting, legal, title, taxation, sociopolitical, marketing, or other relevant issues. |
| 3. | The quantity and grade of reported Inferred resources in this estimate are conceptual in nature and there has been insufficient exploration to define these Inferred resources as an Indicated or Measured mineral resource. |
| 4. | The mineral resources in this estimate were calculated with the Canadian Institute of Mining, Metallurgy and Petroleum (CIM) Standards on Mineral Resources and Reserves, Definitions and Guidelines prepared by the CIM Standing Committee on Reserve Definitions. |
| 1.7 | INTERPRETATION AND CONCLUSIONS |
At Manhattan, most high-grade gold mineralization occurs in high-angle structures that range in thickness from metres to tens of metres wide. Where these structures intersect adjacent zones of fracture induced permeability it can form breccias or strongly veined mineralised bodies. Similarly, where they intersect receptive, often flat-lying carbonate beds, the gold mineralization can “blow-out” to form breccias or along the beds forming stacked mantos. Surrounding the high-grade structures, there is an envelope of progressively lower gold grades that can extend up to hundreds of metres of the central structural “feeder” zone.
| Manhattan Mineral Resource – Amended April 23, 2026 | 13 |
| |
| 1.8 | RECOMMENDATIONS |
Additional infill diamond drilling in conjunction with surface exploration is recommended at the Manhattan property. Metallurgical testing should be completed on drill samples produced from this program. Efforts to collect and digitize historical data should continue.
All existing permits and authorizations should continue to be maintained and kept current.
An initial exploration program, including diamond drilling and metallurgic testing is estimated at $2,782,991. All prices are expressed in $US.
| Drilling | ||||
| Diamond Drilling (6,300 m) | $1,264,650 | |||
| Equipment Rentals | $80,820 | |||
| Geological Support | $311,870 | |||
| Consumables | $279,777 | |||
| Assays | $286,800 | |||
| Downhole geophysical survesy | $44,471 | |||
| SUB TOTAL: Drilling | $2,268,388 | |||
| Field Exploration | ||||
| Expert Mapping Program | $30,000 | |||
| Colorado School of mines partnership (Pit Mapping, age dating & thin sections) |
$50,000 | |||
| Field Mapping Program | $53,220 | |||
| Rock Sample Geochemistry | $9,000 | |||
| Airborne geophysics - Magnetic survey | $78,000 | |||
| SUB TOTAL: Field Exploration | $220,220 | |||
| Site maintenance and General Supplies | $142,383 | |||
| Metallurgical testwork | $152,000 | |||
| TOTAL | $2,782,991 | |||
| Manhattan Mineral Resource – Amended April 23, 2026 | 14 |
| |
| 2.0 | INTRODUCTION |
| 2.1 | GENERAL |
Scorpio Gold Corporation (“Scorpio”) commissioned the Authors to prepare a Mineral Resource Estimate (“MRE”) for the Manhattan Property (“Property”). The Property, located in Nye County, Nevada, comprises 678 federal lode claims located on Forest Service Lands, 28 patented claims, and three federal placer claims. The MRE was prepared in accordance with Canadian disclosure requirements of National Instrument 43-101 (“NI 43-101”) and the requirements of Form 43-101 F1.
| 2.2 | PURPOSE OF THE REPORT |
The purpose of this report is to present the results of a Mineral Resource Estimate and provide a summary of the Manhattan Property.
Mineral Resources are estimated in accordance with the 2019 edition of the Canadian Institute of Mining, Metallurgy and Exploration (“CIM”) Estimation of Mineral Resources & Mineral Reserves Best Practice Guidelines (2019 CIM Best Practice Guidelines).
| 2.3 | SOURCES OF INFORMATION |
This report is based on data provided to the Authors by Scorpio, on or before June 4, 2025. The sources of data include historical data and reports compiled by the Company and previous contractors.
The References section of this report contains a list of all reports and sources of data that was used in the preparation of this report.
| 2.4 | QUALIFIED PERSONS |
The Qualified Persons for this report are listed in Table 2-1. All of Qualified Persons are independent of the Scorpio Gold Corporation.
Table 2-1: Qualified Persons
| Qualified Person | Company | Last Site Visit | Report Sections |
| Matthew Dumala, P.Eng.(BC) | Archer Cathro Geological (US) Ltd. | April 10, 2025 | 1.0 (except 1.5), 2.0, thru 11.0), 14.0, 23.0 thru 25.0, 26.0 (except 26.2), 27.0 |
| Art Ibrado, PhD, PE(AZ) | Fort Lowell Consulting pllc | N/A | 1.5,13.0, 26.2 |
| Manhattan Mineral Resource – Amended April 23, 2026 | 15 |
| |
| 2.5 | DEFINITION OF TERMS |
Unless otherwise stated, measurements are reported in metric unit, and all monetary values are in US dollars.
All UTM coordinates are in NAD 83 Zone 11.
Units of measure, and conversion factors used in this report include:
| 1 troy ounce gold | = 31.1034768 grams |
| 1 gram per metric tonne | = 0.0292 troy ounces per short ton |
| 1 centimetre | = 0.3937 inch |
| 1 metre | = 3.2808 feet | = 1.0936 yard |
| 1 kilometre | = 0.6214 mile |
| 1 hectare | = 2.471 acres | = 0.0039 square mile |
| 1 tonne | = 1.1023 short tons | = 2,205 pounds |
| 1 kilogram | = 2.205 pounds |
Frequently used acronyms and abbreviations:
| AFA | acre feet per annum |
| Ag | silver |
| Au | gold |
| BLM | Bureau of Land Management |
| BMRR | Bureau of Mining Regulation and Reclamation |
| cfs | cubic feet per second |
| CE | Categorical Exemption |
| cm | centimetres |
| Cu | copper |
| div | diversion |
| oC | degrees centigrade |
| °F | degrees Fahrenheit |
| ft | foot or feet |
| g/t | grams per tonne |
| kg | kilograms |
| km | kilometres |
| lb | pound |
| m | metres |
| Ma | million years old |
| mm | millimetres |
| MM | Mining and Milling |
| MMD | Mining, Milling, and Dewatering |
| NDEP | Nevada Division of Environmental Protection |
| opt | ounces per ton |
| oz | ounce |
| PBU | Proof of Beneficial Use |
| POC | Proof of Completion |
| Manhattan Mineral Resource – Amended April 23, 2026 | 16 |
| |
| POD | Point of Diversion |
| ppm | parts per million |
| ppb | parts per billion |
| RC | reverse-circulation drilling method |
| RIB | Rapid Infiltration Basin |
| RMGC | Round Mountain Gold Corporation |
| ROW | Right-of-Way |
| ton | Imperial short ton (2,000 lbs) |
| USFS | U.S. Forest Service |
| Manhattan Mineral Resource – Amended April 23, 2026 | 17 |
| |
| 3.0 | RELIANCE ON OTHER EXPERTS |
The Qualified Persons are not qualified to provide an opinion or comment on issues related to legal agreements, royalties, permitting, or environmental matters. Accordingly, the Authors of this technical report disclaim portions of Section 4 of this Report pertaining to Property Description and Location, and underlying royalty agreements.
The QP has relied, in respect to legal aspects pertaining to Property ownership, agreements, and royalties, upon Sales Agreements provided by Harrison Pokrandt, Vice President of Exploration of Scorpio Gold Corporation, via Sharepoint on May 15, 2025. Full reliance following a review of the information provided pertains to agreements and obligations summarized in Section 4.4.
| Manhattan Mineral Resource – Amended April 23, 2026 | 18 |
| |
| 4.0 | PROPERTY DESCRIPTION AND LOCATION |
| 4.1 | PROJECT LOCATION AND OVERVIEW |
The Project is located in Nye County in south-central Nevada, approximately 34 air miles north of Tonopah and 1 mile west of the unincorporated town of Manhattan (Figure 4-1). The Project is accessible via State Route 377, which connects the town of Manhattan to State Route 376 in the Big Smoky Valley.
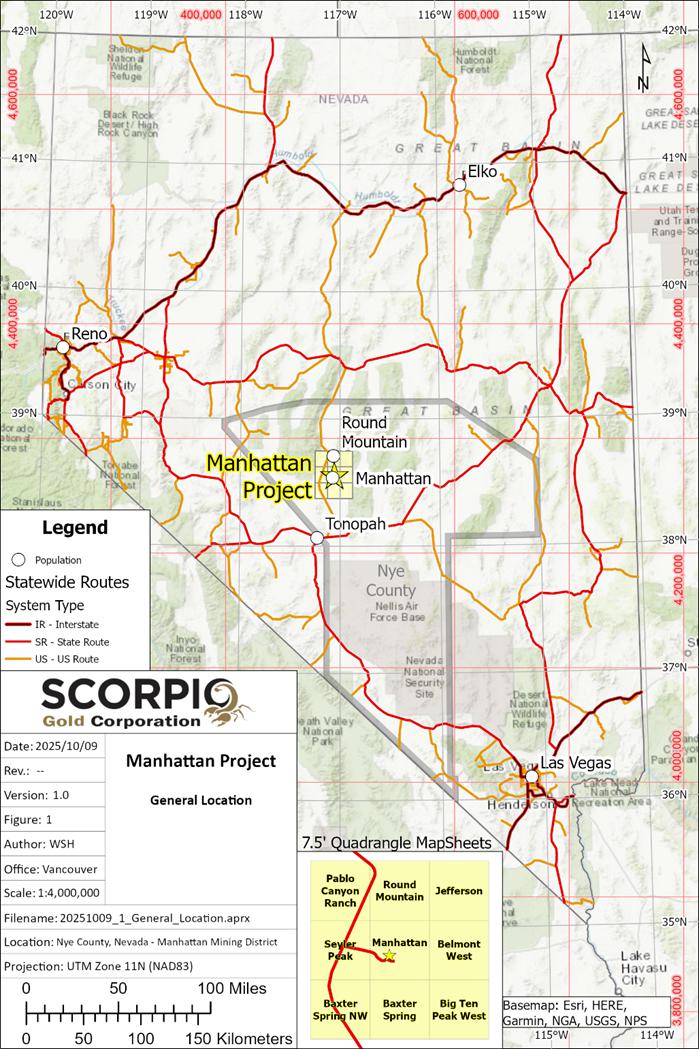
Figure 4-1: General Location
| Manhattan Mineral Resource – Amended April 23, 2026 | 19 |
| |
The Project, which focuses on the maiden resource (including Scorpio holdings as of June 4, 2025) includes approximately 11,514 acres of patented and unpatented mining claims on both Bureau of Land Management (BLM) and US Forest Service (USFS) land, as further detailed in the following sections and in Appendix I: Claim Locations.
| 4.2 | CLAIMS SUMMARY, FEES, AND TAXES |
As of June 4, 2025, the project mineral tenure holdings consist of 28 patented lode claims, 652 unpatented lode claims, and three unpatented placer claims, all in Nye County. The majority of unpatented lode claims are 20.66 acres in size though claim size varies for both patented and unpatented claims. The total area of Project claims is approximately 11,514 acres. Project claims are summarized in Table 4-1 and a geographic overview of claims blocks is provided below in Figure 4-2. A detailed map and list of project claims currently held by Scorpio (i.e., transferred to Scorpio via a legal document from the prior owner) are provided in Appendix I: Claim Locations and Appendix II: Claim List .
In some cases, the previous owner is still named as the owner on the claim on the BLM’s Mineral & Land Records System (MLRS), pending Scorpio’s application to officially transfer ownership and/or per the terms of the agreement. Property acquisitions are discussed in Section 4.4. Individual contract terms have not been reviewed for this report.
Table 4-1: Summary of Claims
| Title | Type | Number of Claims |
| Patented | Lode | 28 |
| Unpatented | Lode | 652 |
| Unpatented | Placer | 3 |
All unpatented claims are subject to an annual BLM maintenance fee (currently $200) due September 1 of each year. Patented claims are subject to Nye County tax payments, as assessed annually, with no known current outstanding balances1.
1 Property tax payments and outstanding balances are available to view by Survey Number via the Advanced Parcel Search on the Nye County Assessor website: https://nyenv-assessor.devnetwedge.com/. Note: tax records for some parcels may include claims that were not included as part of the transaction to Scorpio.
| Manhattan Mineral Resource – Amended April 23, 2026 | 20 |
| |
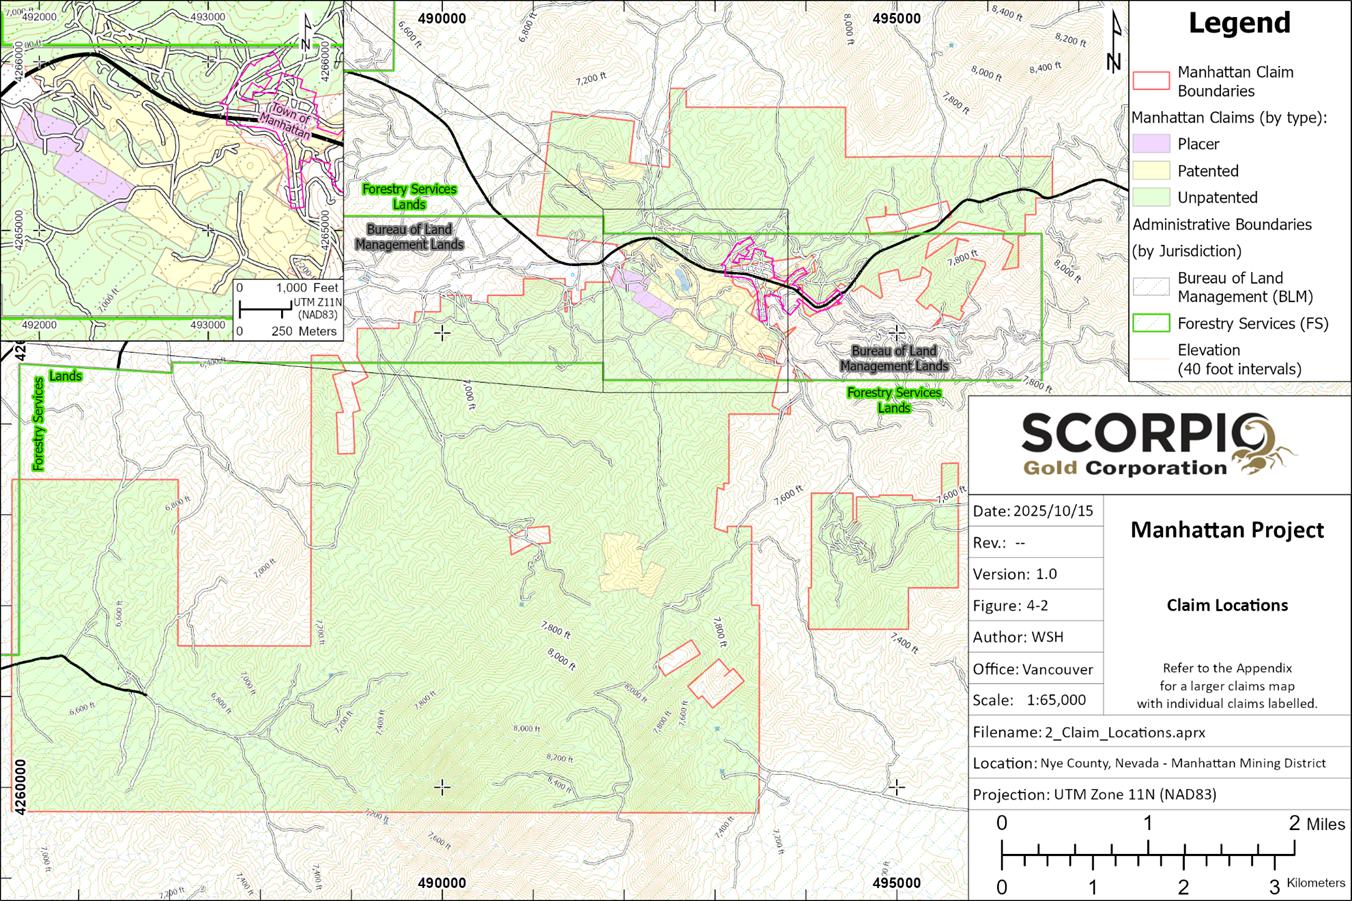
Figure 4-2: Claim Locations
| Manhattan Mineral Resource – Amended April 23, 2026 | 21 |
| |
| 4.3 | PROPERTY OVERVIEW AND LEGAL ACCESS |
Project holdings include several properties and claim blocks with previous mining and exploration history that have been acquired by Scorpio Gold, including the Goldwedge Mine, Manhattan Mine, Keystone-Jumbo Mine, and other miscellaneous claim blocks. The individual properties are briefly discussed in the following subsections with respect to their historical/current land use status and legal access. Royalties associated with the various transactions are discussed in Section 4.4. Access considerations are further discussed in Section 5.
| 4.3.1 | GOLDWEDGE PROPERTY |
The Goldwedge property includes the Goldwedge Mine and additional associated patented and unpatented lode claims. As discussed in Sections 5 and 6, the Goldwedge Mine consists of a single-decline underground mine and various surface facilities located north of State Route 377 and two rapid infiltration basins (RIBs) located south of the highway. Surface facilities are located on patented claims bordering USFS land (to the north) and BLM land (to the south). The mineral processing circuit has been in temporary closure status with the Nevada Division of Environmental Protection (NDEP) since 2015. An overview of historical mine features is provided in Figure 5-1.
All active Goldwedge Mine facilities are accessible from the highway via constructed roads and mine roads. Currently permitted exploration activities on Manhattan claims in the Goldwedge vicinity, north of State Route 377 and adjacent to the Goldwedge Mine, are discussed in Sections 4.3.2 and 4.5.
| 4.3.2 | MANHATTAN PROPERTY |
The Manhattan property includes the closed Manhattan Mine and additional associated patented lode and unpatented lode and placer claims. The closed mine property includes an unreclaimed pit lake (West Pit Lake) and various reclaimed mine facilities including a tailings impoundment, waste rock dump, heap leach facilities, and other smaller pits. The majority of Manhattan facilities are located on BLM land and several patented claims, though the far southern portion of the property extends onto USFS land (Figure 4-2). The pit lake dewatering pumps were reportedly turned off in 1992 (SRK, 2019), and reclamation of the mine site occurred from 1994 through 2001.
All historic Manhattan Mine features are located south of State Route 377 (Figure 6-1). The West Pit Lake and other active monitoring facilities are accessible via constructed roads which are assumed to be included in the active reclamation bond. Scorpio maintains an active exploration bond with BLM for drilling and access roads on portions of this property, as further discussed in Section 4.5. Access considerations are further discussed in Section 5.
| 4.3.3 | KEYSTONE-JUMBO MINE AND ASSOCIATED CLAIMS |
The Keystone-Jumbo property includes the historical Keystone-Jumbo Mine (which includes two surface pits, the Keystone Pit, and Jumbo Pit) and additional associated unpatented lode claims. The claim block is located on USFS land approximately 2 miles southeast of the town of Manhattan and is generally accessible via the Spanish Springs Road and existing mine access roads (as further discussed in Section 5).
| Manhattan Mineral Resource – Amended April 23, 2026 | 22 |
| |
Reclamation of this property has not yet occurred due to the potential for further exploration and/or resource extraction, and Scorpio maintains an active exploration bond for drilling and access roads on this property with USFS, as further discussed in Section 4.5.
| Manhattan Mineral Resource – Amended April 23, 2026 | 23 |
| |
| 4.3.4 | OTHER CLAIM BLOCKS |
As shown on Figure 4-2, Scorpio holds several large blocks of (primarily unpatented) lode claims outside of the core historical mining/exploration areas discussed above, including the Big Apple claim block to the south and southwest of the Manhattan Mine (see figure in Appendix I: Claim Locations). The majority of these claims are located on USFS land, though some claims also include portions of BLM land. Aerial photography and maps indicate the presence of numerous existing roads throughout the area but access and terrain conditions are expected to vary, as further discussed in Section 5.
| 4.4 | ACQUISITIONS AND ROYALTIES |
Collectively, the Manhattan Property consists of several claim blocks acquired by Scorpio with varying royalty percentages, as summarized herein. An overview of Project royalties, as described in legal claims transfer documents, is shown below in Figure 4-3.
Scorpio Gold completed its acquisition of the Goldwedge & Keystone Jumbo Properties, comprising 78 BLM lode claims and seven patented claims, from Royal Standard Minerals Inc. (“Royal Standard” or “RSM”) in December 2012. In connection with the acquisition, the Company entered into a royalty agreement with Waterton. Under the terms of the New Royalty Agreement, the Company granted Waterton a 2% net smelter return (“NSR”) royalty on the Goldwedge Property. Scorpio has the ability to buy back the first 1% of the NSR for $1 million, and the final 1% NSR for an additional $2 million. In 2021 Sandstorm Gold Royalties acquired the Waterton 2% NSR from Waterton (Figure 4-3). The Orphant claim, included in the RSM agreement, is subject to a further 1% royalty payable to Anglogold and a 3% royalty payable to a private individual.
In March 2021, Scorpio completed the acquisition of the Manhattan Property from affiliates of Kinross Gold Corporation (“Kinross”). The property comprised 121 BLM load claims and 21 patented claims, subject to a 2% NSR royalty.
| Manhattan Mineral Resource – Amended April 23, 2026 | 24 |
| |
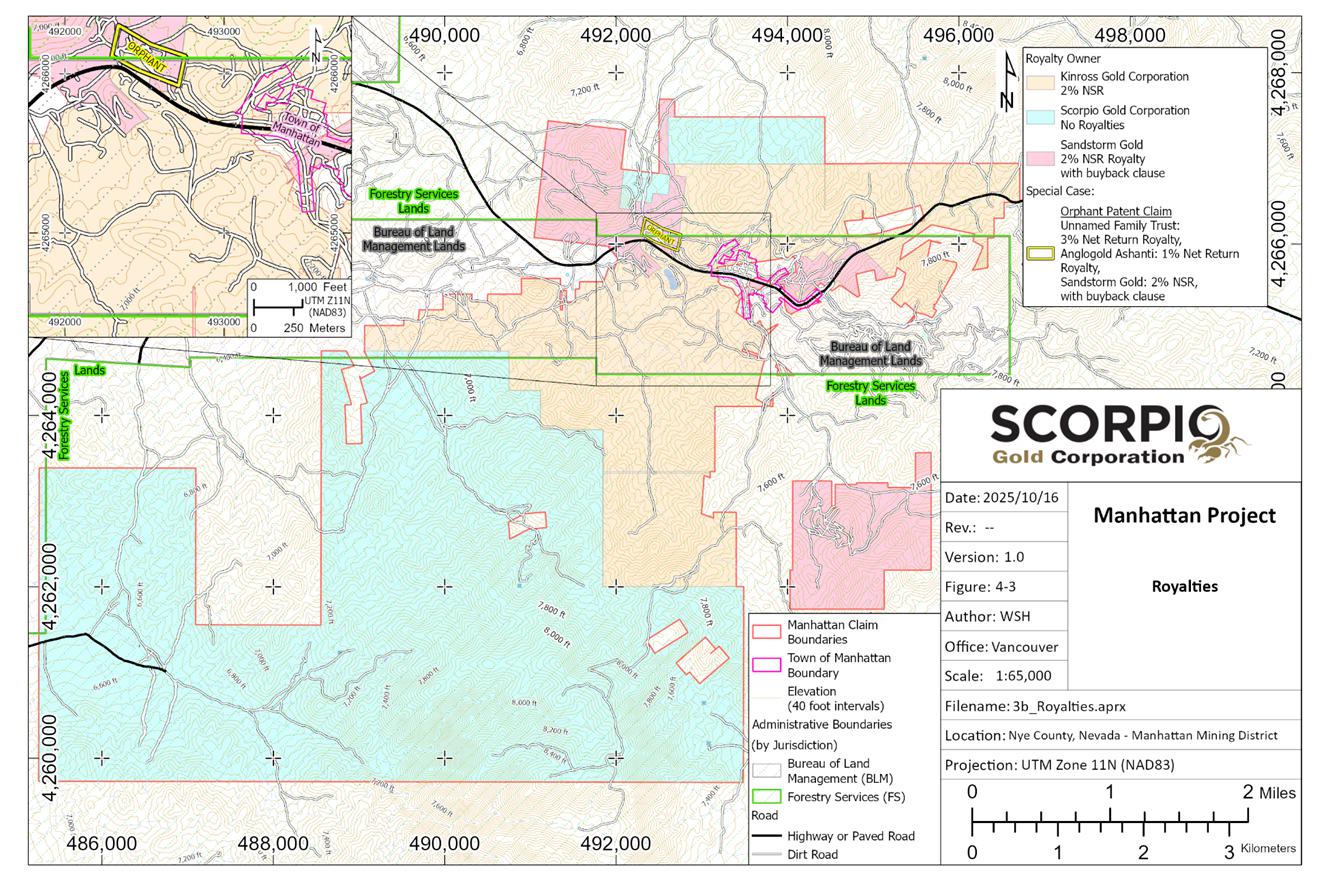
Figure 4-3: Project Royalties
| Manhattan Mineral Resource – Amended April 23, 2026 | 25 |
| |
| 4.5 | EXPLORATION AUTHORIZATIONS |
Numerous previous exploration programs have been completed for various components of the Project. Recent exploration activities have been permitted by Notices of Operations (Notices) on BLM and USFS land (Goldwedge, Manhattan, and Keystone-Jumbo properties) and a Categorical Exemption (CE) under a Plan of Operations (PoO) for drilling at the Keystone-Jumbo property on USFS land. Scorpio indicates that all previous exploration activity and/or bonding is currently reflected in these two authorizations, as discussed in the following paragraph and further detailed in Sections 20.2 and 20.5, though this has not been independently verified based on provided records.
The current ongoing exploration plan for the Manhattan/Goldwedge vicinity was authorized by the BLM under Notice (N100427; unknown date), as subsequently amended in 2022. Notice N100427 currently authorizes drilling on eight unpatented mineral lode claims on BLM land with a maximum disturbance limit of 4.32 acres. The Keystone-Jumbo CE authorizes an additional 1.44 acres of disturbance on unpatented claims on USFS land. Some of the authorized drilling on the 4.32 and 1.44 acres has been completed but the actual disturbance acreage to date has not been verified. Drilling on the approximately 1 acre of patented land is also currently occurring.
Beyond the active Notice/CE, additional disturbance could potentially be permitted under a subsequent Notice amendment, up to the 5-acre limit allowed by BLM, if approved. As disturbed areas are successfully reclaimed and released, additional subsequent drilling could potentially subsequently be authorized (up to the 5-acre Notice maximum), and additional drilling on patented lode claims could also potentially occur without additional federal authorization. Beyond this, any further project-related exploration drilling on federal lands would likely require separate authorization under the National Environmental Protection Act (NEPA) under a Plan of Operations and completion of an Environmental Impact Analysis (EIS), Environmental Assessment (EA), or CE.
| 4.6 | PERMITS AND ENVIRONMENTAL LIABILITIES |
Proposed or future exploration activities on unpatented federal lands must be permitted by the federal authority(ies), as discussed above. As further discussed in Section 20, maintenance of historic facilities must comply with existing permitting obligations, and any potential future mining, milling, or exploration activities must comply with applicable federal, state, and local permits and regulations.
Water rights associated with drilling and other potential uses are available for project use, within the permit terms, as discussed in more detail in Section 20. The project is currently subject to four reclamation bonds, as further discussed in Section 20.5, including for the Goldwedge Mine facilities, the Manhattan Mine West Pit Lake, and two exploration projects. No additional environmental liabilities that may affect access, title, or the right or ability to perform work on the property have been identified with respect to the maiden resource; however, additional due diligence is recommended due to the varied history and previous ownership of claims associated with the project.
| Manhattan Mineral Resource – Amended April 23, 2026 | 26 |
| |
| 5.0 | ACCESSIBILITY, CLIMATE, LOCAL RESOURCES, INFRASTRUCTURE, AND PHYSIOGRAPHY |
| 5.1 | ACCESS AND INFRASTRUCTURE |
The Property is located 55 km (34 miles) north-northeast of Tonopah and can be accessed year-round from Nevada State Route 377, which is accessible from Nevada State Route 376. State Route 377 is a paved road that bisects the property. Unpaved roads, and numerous unmaintained 4x4 trails provide access to most areas on the Property. A 2,000 m long paved airstrip, is located at the town of Round Mountain, 17 km to the northwest.
The town of Manhattan is located immediately west of the property, and has few year-round residents. Electrical power is available at the Property, supplied by Sierra Pacific Power Company, a subsidiary of NV Energy.
In the early 2000s, Royal Standard Minerals constructed a mill and other support facilities at the Goldwedge mine. These include an office, maintenance shop, and 400 tpd mill. This existing infrastructure is used to support Scorpio’s exploration activities.
The Goldwedge Mine surface facilities include waste rock disposal facilities (“WRDFs”), a concrete-lined ore stockpile pad (“OSP”), a crushing and screening circuit and gravity separation plant, two double-lined and leak-detected ponds (which also serve as storm event ponds), a fines/oversize tailings storage facility (“TSF”), conveyors, maintenance shop, process laboratory, and haul/access roads. The locations of these facilities and other infrastructure are shown on Figure 5-1. Several upgrades and modifications have occurred over the years, including repair/maintenance to the TSF following an independent integrity evaluation of the TSF performed in 2013. Underground infrastructure includes ventilation, electrical, and telephone communication systems.
| Manhattan Mineral Resource – Amended April 23, 2026 | 27 |
| |
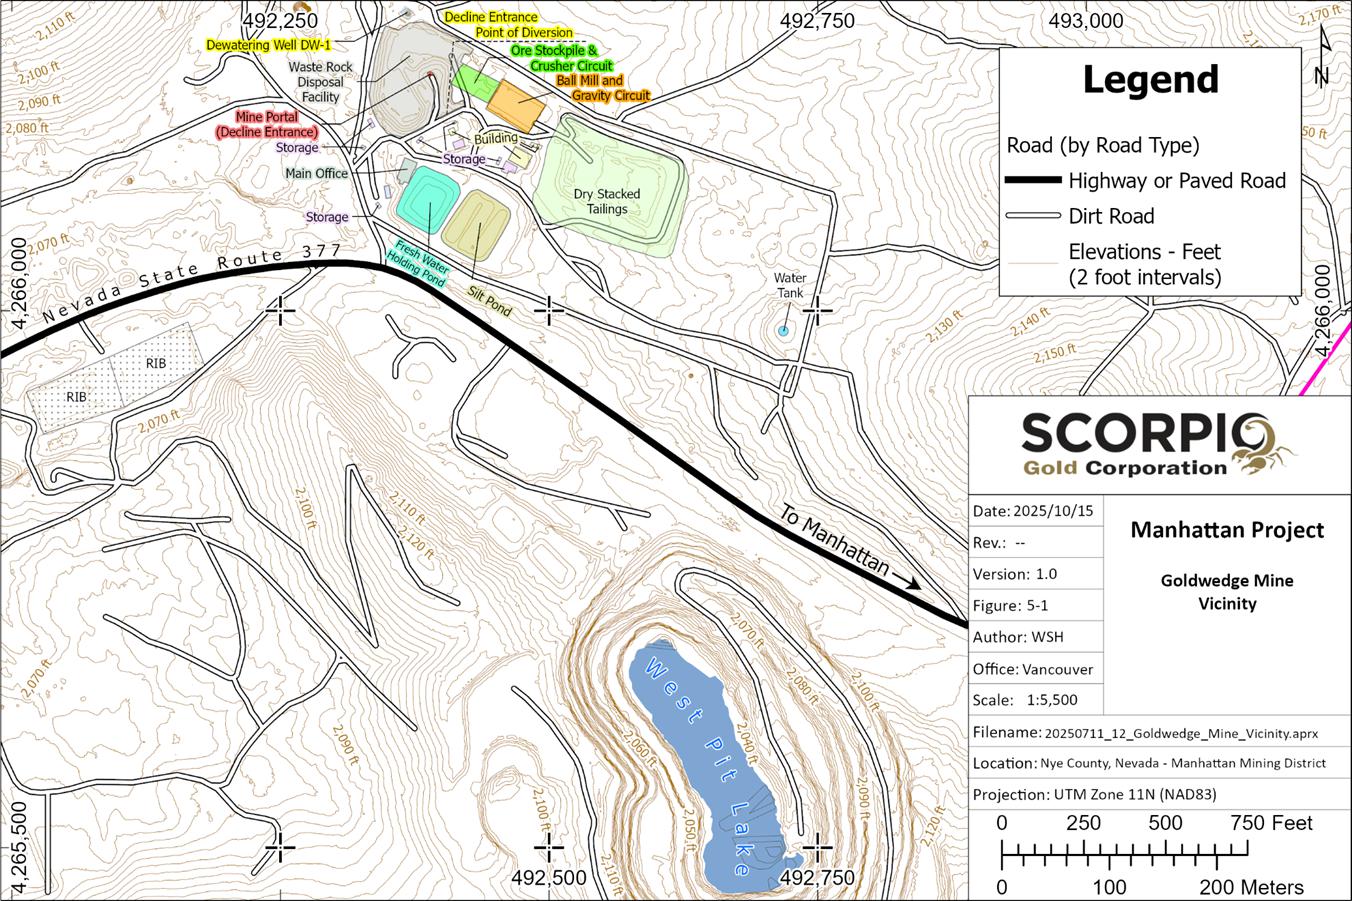
Figure 5-1: Goldwedge Mine Infrastructure
| Manhattan Mineral Resource – Amended April 23, 2026 | 28 |
| |
| 5.2 | WATER RESOURCES |
Goldwedge LLC (Goldwedge), an affiliate company of Scorpio Gold Corporation, holds five active groundwater permits (Table 20-2) within Nevada Division of Water Resources (“NDWR”) Hydrographic Basin 137A, Big Smoky Valley-Tonopah Flat. The five Goldwedge water rights comprise a total combined duty (“TCD”) of 3,272.74 AFA, of which 134.74 AFA is authorized for consumptive use (i.e., not required to be returned to the basin via the RIBs). The five Goldwedge permits have two authorized points of diversion (“PODs”) – one at dewatering well DW-1 and one at the decline portal entrance.
The Goldwedge mine presently extends below the water table. Intermittent dewatering has occurred since 2003 (SRK, 2019) to allow for mining below the groundwater table. Water not used for consumptive purposes is discharged back into the groundwater system via the two RIBs. According to SRK (2019), Goldwedge well MW-1 was used as a dewatering well from 2003 to 2011 until DW-1 was constructed. The overall pumping volume has been reduced since 2017 due to pump failures and temporary closure status. Minimal dewatering has reportedly taken place in 2024 or 2025.
| 5.3 | CLIMATE |
The Property has a typical dry desert climate with hot summers and cold winters. There is no public weather station at Manhattan. The nearest station is at the Tonopah airport, located 53 km to the south. Approximate monthly daytime average temperatures range from 7°C in December to 34°C in July. In the evening, temperatures regularly drop below freezing during the winter months.
Precipitation is limited to an average of 20 cm to 30 cm per year, generally coming as snow or rain during the winter months or as rain in the summer. February is typically the wettest month. Strong winds are common in the area and peak in April.
| 5.4 | TOPOGRAPHY, ELEVATION, AND VEGETATION |
The Property is located at the southern end of the Toquima Range, approximately 5 km southwest of Bald Mountain. Bald Mountain has a peak elevation of 2,829 m (9,274’).
The topography is gently rising to rolling and ruggedly steep along the north-south trending mountain crest. Elevations range from about 2,075 m (6,800’) on the pediment facing Smokey Valley to approximately 2,425 m (7,950’) in the central portion of the district. Above elevations of 2,135 m (7,000’), slopes are forested with juniper and pinon pine.
The property lies within the Southern Nevada Basin and Range Major Land Resource Area 28B (“MLRA”). The area consists of nearly level, aggraded desert basins and valleys between a series of mountain ranges trending north to south (USDA NRCS, 2025).
Manhattan is located within the Austin Ranger District of the Humboldt-Toiyabe National Forest. The Humboldt-Toiyabe National forest is a 6.3 million acre forest administered bye The U.S. Department of Agriculture, Forest Service. It comprises numerous fairly large but non-contiguous sections scattered across most of the state of Nevada and a portion of eastern California.
| Manhattan Mineral Resource – Amended April 23, 2026 | 29 |
| |
The habitat zone for the project area is classified as Lower Montane Woodlands and Chaparral by NDOW for Nevada’s State Wildlife Action Plan. Vegetation in this zone comprises a diverse ecosystem characterized by a mix of trees, shrubs and grasses. The diverse range of terrain in the area of the property is home to elk, mule deer, desert bighorn sheep, and antelope.
| Manhattan Mineral Resource – Amended April 23, 2026 | 30 |
| |
| 6.0 | HISTORY |
The Manhattan mining district has had a long and productive mining history. The area was first prospected for silver and copper in the 1860s. A gold-rich outcrop was discovered in April 1905 and the first claims staked on what is known as the April Fool Mine. By the following year, numerous prospectors were working numerous claims in the area. The majority of production from the Reliance Mine occurred between 1932 and 1941, with an estimated production of 59,108 tons at a recovered grade of 0.435 oz/ton (Kral, 1951). While the bulk of the early production occurred before World War II, both lode and placer mining continued until the early 1950's.
Production was not always recorded, but the records available indicate the Manhattan district produced more than 194,000 ounces of lode and placer gold between 1907 and 1921 (Ferguson, 1924). Total historical production for the Manhattan district through 1959 is estimated at 486,340 ounces (The Booktable, 1988)
The discussion below focuses on work completed after 1955 in the Manhattan, Goldwedge, and Keystone Jumbo areas (Figure 6-1).
| Manhattan Mineral Resource – Amended April 23, 2026 | 31 |
| |
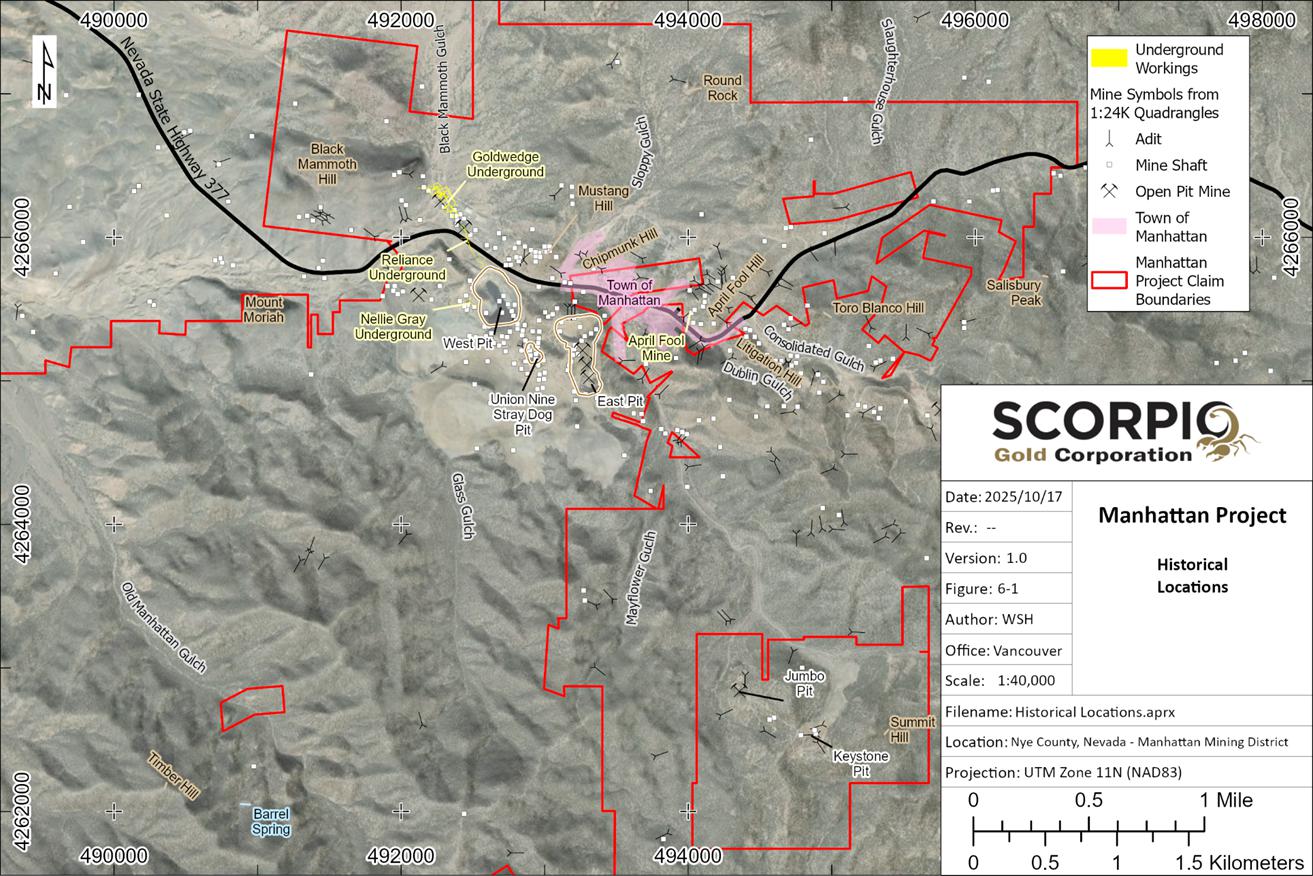
Figure 6-1: Historical Locations
| Manhattan Mineral Resource – Amended April 23, 2026 | 32 |
| |
| 6.1 | MANHATTAN |
The Summa Corporation (“Summa”) acquired property in the Manhattan mining district in 1967. They pursued exploration activities and conducted limited mining operations until 1977, when Huston Oil and Minerals Corporation (“Houston Oil”), subsequently Tenneco Minerals Co. purchased the property. Summa reported processed 66,400 tons of ore, producing approximately 1,545 oz of gold.
Huston Oil Production began in May 1980, but was suspended in January 1982 due to high production costs and falling gold prices.
Tenneco resumed production during the fall of 1983 and Echo Bay Mines purchased the property in September 1986. Mineable reserves were exhausted in March 1988. In January 1989 Echo Bay Mines and its partners at Round Mountain merged their independently held properties in the vicinity of Round Mountain.
The Manhattan mill comprised a batch cyanide leach circuit followed by Merrill-Crowe precipitation. Between 1980 and 1982 it operated at 750 tons per day and was increased to 3,000 tons per day in 1983. Heap leaching of low-grade stockpiles and mill rejects was conducted between 1989 and 1990.
The stacking of heap leach ore from low-grade stockpiles at Manhattan was completed in October 1990; however, leaching of the existing heaps continued. Milling of high-grade ores from Round Mountain was suspended in December 1990, when the capacity of the tailings pond was reached. Leaching of the existing heaps was completed during 1993. Currently three pits and two smaller adjacent shallow pits (scrapings) remain.
A summary of production at Manhattan is shown below in Table 6-1.
Table 6-1: Manhattan Production 1984-1983 (Nevada Department of Taxation)
| Ore Processed (tons) | Gold Grade (oz/t) | Produced | |||
| Year | Milled | Heap Leach | Milled | Heap Leach |
(oz gold) |
| 1984 | 1,013,000 | - | - | - | 19,625 |
| 1985 | 961,000 | - | - | - | 28,304 |
| 1986 | 979,400 | - | 0.045 | - | 26,315 |
| 1987 | 965,000 | - | 0.040 | - | 24,855 |
| 1988 | 72,766 | - | 0.039 | - | 4,752 |
| 1989 | - | 2,738,000 | - | 0.019 | 13,730 |
| 1990 | 69,000 | 1,945,000 | 0.100 | 0.019 | 35,092 |
| 1991 | - | - | - | - | 17,628 |
| 1992 | - | - | - | - | 6,864 |
| 1993 | - | - | - | - | 2,166 |
| TOTAL: | 4,060,166 | 4,683,000 | 0.044 | 0.019 | 152,673 |
| Manhattan Mineral Resource – Amended April 23, 2026 | 33 |
| |
Production records were compiled from the Nevada Department of Taxation for the years 1984 thru 1993. These records were publicly available until March 2025, at which point the department determined that these records “contained confidential taxpayer information that identified tax information for the respective mines” and so “has been deemed confidential”. As of the effective date of this report, an Assembly Bill (AB277) was in consideration that would explicitly exempt this data from the state’s confidentiality statue and once again make it public.
Reclamation of the Manhattan mine site from 1994 through 2001 earned Round Mountain Gold Corporation the BLM Hardrock Mineral Environmental award in 2004 for its innovative reclamation designs and new technique for treating water used in the mining process.
Scorpio obtained the Manhattan Property from Kinross Gold Corporation in 2021.
| 6.2 | GOLDWEDGE |
The Goldwedge area has a history of being mined by both underground and placer methods. The underground potential has been considered for development by such companies as Freeport Exploration (1983-1985), Echo Bay Mines, Sunshine Mining (1986), Crown Resources (1990-1992), and New Concepts Mining (1995-1997). In 1997, the project was sublet to Royal Gold who continued drilling widely spaced holes to test for a larger tonnage deposit. In 2001, Royal Standard Minerals (“RSM”) acquired the property and consolidated the area.
In 2003, RSM began construction of a 689’ exploration decline to collect a bulk sample. A 150 tpd gravity wash plant installed 2005 (Strachan and Master, 2005) while development continued. By 2012, there was a total of 600 m of mine development, reaching a vertical depth of 150 m, and the mill upgrade to achieve a throughput of 400 tpd.
Scorpio obtained the Goldwedge Property from Royal Standard Minerals in 2012.
| 6.3 | KEYSTONE JUMBO |
The Keystone Jumbo property is located approximately 1 km southeast of the Manhattan Property. The property comprises two deposits, the Keystone and the Jumbo. Both are geologically similar. Limited historical references were available to the Author regarding this property at the time of this report.
Historical references found in a 1951 report cites glory hole mining and some production from the Jumbo from 1937 to 1940, continuing to 1950. Nevada Goldfields, Inc. conducted limited open pit mining at the Keystone Jumbo mine in 1990, resulting in the recovery of 5,750 ounces of gold (Berry and Willard, 1997).
Nevada Goldfields, Inc. and Freeport Mining Company conducted reverse circulation drilling on the property in the 1980’s. In the 1990’s New Concept Mining, Inc. continued exploration.
Scorpio obtained the Keystone Jumbo Property along with the Goldwedge Property from Royal Standard Metals in 2012.
| Manhattan Mineral Resource – Amended April 23, 2026 | 34 |
| |
| 6.4 | HISTORICAL RESOURCES |
New Concept Mining completed initial mineral resource estimates for five satellite deposits in 1997 (Berry and Willard, 1997). These include the Hooligan, Black Mammoth, April Fool, Keystone, and Jumbo. Figure 6-2 shows the locations of each of these resources. The Hooligan resource is located outside of the claim boundary as of the effective date of this report; however, subsequent actions by Scorpio have further consolidated the district.
Mineral resources were estimated with a polygonal method using uncapped fire assay gold grades. , while Table 6-3 summarizes the geology of each area and data used in the estimates.
Table 6-2 summarizes these resources, while Table 6-3 summarizes the geology of each area and data used in the estimates.
Table 6-2: Keystone Jumbo Historical Resources
| Proven-Probable | Possible | |||||||
| Gold Grade | Gold | Gold Grade | Gold | |||||
| tons | oz/ton | g/t | oz | tons | oz/ton | g/t | oz | |
| Black Mammoth | 12,000 | 0.125 | 4.29 | 1,500 | 250,000 | 0.200 | 6.86 | 50,000 |
| Hooligan | 220,265 | 0.063 | 2.16 | 13,794 | 190,947 | 0.187 | 6.41 | 35,722 |
| Keystone | 132,226 | 0.112 | 3.84 | 14,867 | 283,685 | 0.352 | 12.07 | 99,707 |
| Jumbo | 16,304 | 0.099 | 3.39 | 1,606 | 204,348 | 0.201 | 6.89 | 40,978 |
| April Fool | 361,602 | 0.044 | 1.51 | 15,775 | 150,000 | 0.200 | 6.86 | 30,000 |
| TOTAL | 742,397 | 0.064 | 2.20 | 47,542 | 1,078,980 | 0.238 | 8.15 | 256,407 |
Although the Qualified Person believes these estimates met industry best practices at the time, they are considered historical in nature and not considered a current mineral resource or mineral reserve. The Qualified Person has not done sufficient work to classify the historical estimate as current mineral resources or mineral reserves. Significant data compilation, re-drilling, re-sampling and data verification may be required by a qualified person before the historical estimate on the t can be classified as a current resource. There can be no assurance that any of the Historical MRE, in whole or in part, will ever become economically viable. In addition, mineral resources are not mineral reserves and do not have demonstrated economic viability. Even if classified as a current resource, there is no certainty as to whether further exploration will result in any mineral resources being upgraded to another category.
| Manhattan Mineral Resource – Amended April 23, 2026 | 35 |
| |
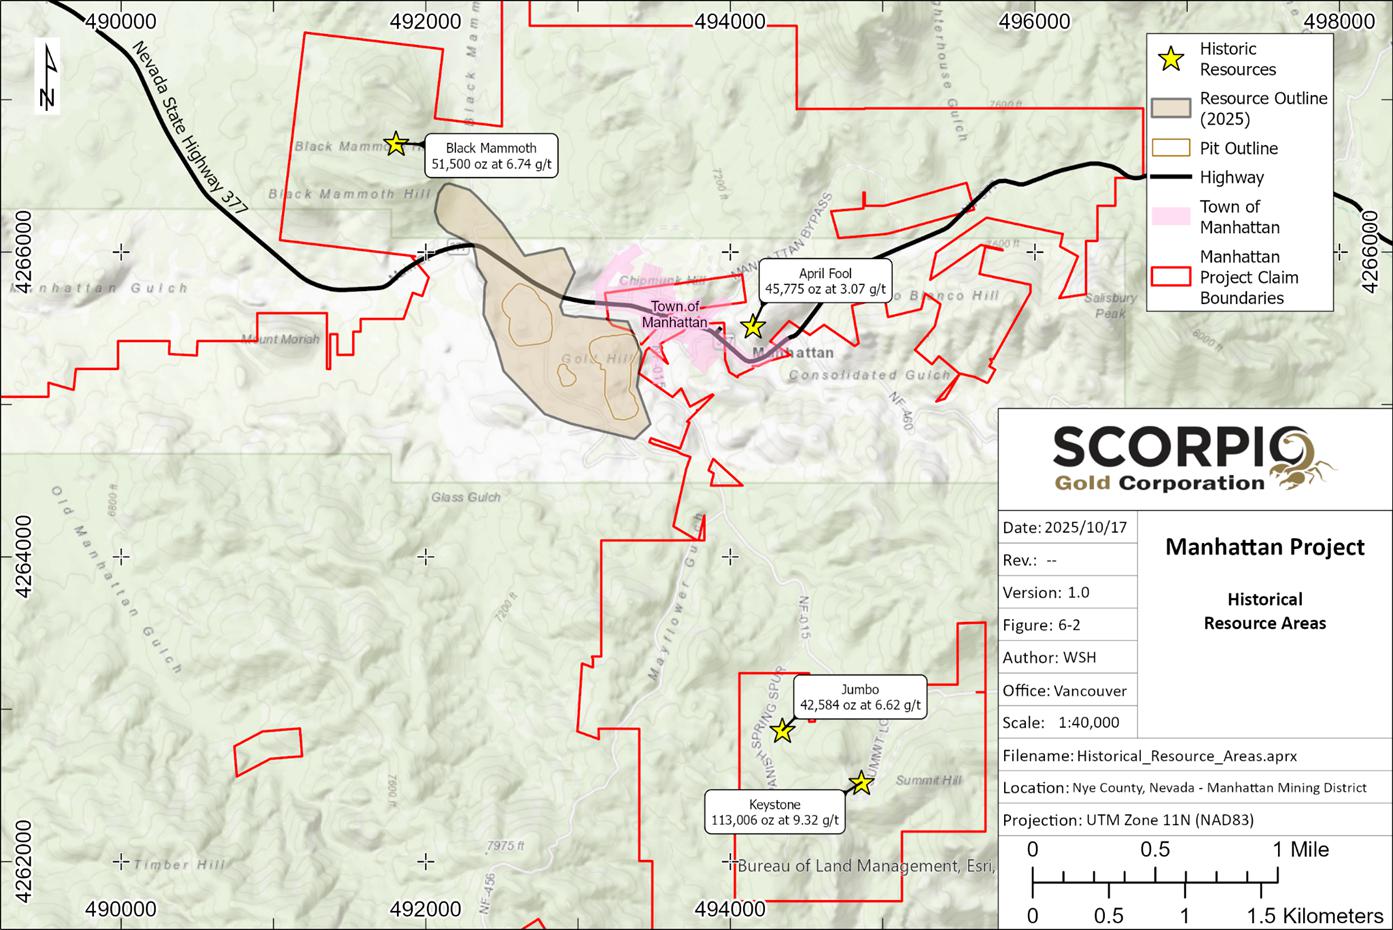
Figure 6-2: Historical Resource Areas
| Manhattan Mineral Resource – Amended April 23, 2026 | 36 |
| |
Table 6-3: Basis of Historical Resource Estimate
| Area | Geological Description | Data Used |
| Keystone and Jumbo | Hosted in fine grained clastic sediments, breccias, and a felsic stock complex with extensive brecciation. Mineralization is classic low-sulphidation epithermal type, with extensive drusy quartz and carbonate textures in veins and breccia fill with pyrite and its oxidation products and associated clays. Mineralization appears to be focussed along a north-west trending fault system. Keystone and Jumbo’s fault systems strike towards each other over 600 m. | Exploration and mine development drilling by Nevada Goldfields Inc. Significant historical open pit and underground mining exists at the Keystone deposit. Keystone and Jumbo have a combined 41 drillholes totalling 4,880 m. |
| Black Mammoth | Hosted in near vertical zones of calcite dominant veining and blossom into the receptive Zanzibar limestone, and argillite beds that comprise the Black Mammoth hill. This zone represents the north-west extension of the Gold Wedge area. Historical production up to the 1930's. | Surface sampling and sampling of the extensive underground historical working on the Black Mammoth hill. |
| Hooligan | Hosted within two outcropping mantos of mineralised limestone of 9.7ft thickness and 13.8ft thickness. Hooligan is comprised of the historical Cabin, Manto, Blanket, and Hooligan Manto. | 17 RC drill holes totalling 3,890 ft drilled by New Concept Mining. Additional data from samples from historical shafts, 16 historical rotary holes drilled in a 25 ft spaced grid of 200 ft x 500 ft. |
| April Fool | Low-sulphidation mineralization hosted in Cambrian sediments and limestones. The geologic understanding at the time of the Historical MRE was poor. | Historical underground mining and “widely spaced” drill holes. At least ten holes have been drilled on this prospect. |
New Concept categorized mineral resources as proven, probable, and possible as was recommended by the worldwide Society of Economic Geologists in 1956 and standard practice of the U.S. Securities Exchange Commission at the time (Cowdery, 1991). The approximate search ranges for each category are shown in Table 6-4.
Table 6-4: Historical Resources Estimation Ranges
| Category | Up-Dip | Along-Strike |
| Proven | 15 feet | 25 feet |
| Probable | 75-90 feet | 90-150 feet |
| Possible | 50 feet beyond Probable | 90-150 feet |
The following definitions were used to classify the mineral resources.
Proven for which tonnage is computed from dimensions revealed in outcrops, trenches, workings, and drill holes and for which the grade is computed from the results of detailed sampling. The sites for inspection, sampling, and measurement are so closely spaced and the geologic character is so well-defined that the size, shape, and mineral content are well-established. The computed tonnage and grade are judged to be accurate within limits which are stated, and no such limit is judged to differ from the computed tonnage or grade by more than 20%.
| Manhattan Mineral Resource – Amended April 23, 2026 | 37 |
| |
Probable for which tonnage and grade are computed partly from specific measurements, samples, or production data and partly from projection for a reasonable distance on geologic evidence. The sites available for inspection, measurement, and sampling are too widely or otherwise inappropriately spaced to outline the ore completely or to establish its grade throughout.
Possible for which quantitative estimates are based largely on broad knowledge of the geologic character of the deposit and for which there are few, if any, samples or measurements. The estimates are based on an assumed continuity or repetition for which there is geologic evidence; this evidence may include comparison with deposits of similar type. Bodies that are completely concealed may be included if there is specific geologic evidence of their presence. Estimates of inferred ore should include a statement of the spatial limits within which the inferred ore may lie.
| Manhattan Mineral Resource – Amended April 23, 2026 | 38 |
| 7.0 | GEOLOGICAL SETTING AND MINERALIZATION |
| 7.1 | Regional Geology |
The
Manhattan mining district lies on the western flank of the southern Toquima Range. Highly folded and faulted Paleozoic sedimentary
and metamorphic rocks are widespread in this region
(Figure 7-1).
The district is located along the margin of the Manhattan Caldera, a part of a much larger scale north-south alignment of nested calderas, intrusive and volcanic centers starting at Northumberland to the north and trending south through Round Mountain, Manhattan and to Tonopah. The district is characterized by a broad swath of folded, faulted and much-deformed Paleozoic marine metasediments. The sediments crop out at surface between Tertiary volcanics, part of a collapse caldera complex to the north, and a Cretaceous pluton to the south. It is believed that the Tertiary Age Caldera formation and volcanic centers indirectly control all of the deposits in the north-south trend.
Pre-Tertiary country rocks consist of latest Precambrian (?) through Ordovician sedimentary strata. From oldest to youngest, these rocks include the Lower Cambrian Harkless Formation (Ch), Cambrian (?) Mayflower Schist (Cms), Lower Cambrian Gold Hill Formation (Cg), Middle Ordovician Zanzibar Formation (Oz), and Middle to Upper Ordovician Toquima Formation (Ot). Detailed descriptions of these units are presented in Section 7.1.1.
The oldest rocks exposed in the Manhattan area are of the Cambrian Gold Hill formation, a thick series of quartz-mica schist, quartzite, marble, limestone, sandstone and grayish-green to light brown sandy phyllite. Sandy phyllite has been major gold-ore host at Manhattan. It contains abundant silt to sand-sized detrital quartz grains in a mica-chlorite matrix.
The Gold Hill formation is unconformably overlain by the Ordovician Mayflower schist, a less quartzose, "knotty", more chloritic schist than that of the Gold Hill, and the Ordovician Zanzibar formation, an assemblage of blue-gray limestones that may be tightly folded locally, interbedded jasperoidal chert, argillite and black carbonaceous shale (Ferguson, 1924). In some locations, folded Zanzibar limestones appear intercalated in the Mayflower schist. Basal quartzites and argillites of the Ordovician Toquima formation occur stratigraphically above the Zanzibar limestones in the district.
South of Manhattan, the Paleozoic rocks have been intruded by the granite of Pipe Springs (Kp). The Paleozoic rocks are conformable with the intrusive contact and dip away, rendering the unroofed granite and skirt of metasediments domed in appearance (Shawe, 1986). The granite is porphyritic, with feldspar phenocrysts up to an inch or more in diameter. A contact metamorphic rind of skarn containing diopside, epidote and garnet bas formed where limestone bas been intruded, while other units of argillite and phyllite have been altered to biotite schist.
On the north side of the district, flanking Black Mammoth Hill and the Gold Wedge property and forming a roughly arcuate contact zone extending east and west, the Paleozoic rocks are truncated and overlain by Tertiary volcanic and volcaniclastic rocks of the Manhattan caldera (Tr). They consist predominately of rhyolite, tuffaceous flows and heterolitic pyroclastic megabreccia.
Within a few square miles of the town of Manhattan the metasediments show evidence of early folding, high angle faulting, and low angle thrusting and imbrication. Major deformation probably occurred during the Antler and Nevadan orogenies that preceded platonic activity in the Cretaceous, and extensional activity and volcanism in the Tertiary.
| Manhattan Mineral Resource – Amended April 23, 2026 | 39 |
| 7.1.1 | Lithological Descriptions |
The following descriptions are taken from the U.S. Geological Survey’s geological map of the Manhattan Quadrangle (Shawe, 1999).
Harkless Formation (Lower Cambrian)-Phyllitic schist and silicified argillite, with minor siltstone, sandstone, limestone, and dolostone deposited as marine sediments and subsequently metamorphosed. Forms a thrust plate overlying thrust plates of the Toquima and Zanzibar Formations in southwest part of map area.
Mayflower Schist (Cambrian?)-Mostly knotted schist (Cms) with minor interlayered quartzite (Cmq), and limestone (Cml). Extremely deformed by shearing and isoclinal folding. Underlies other thrust plates at thrust fault contacts in south part of quadrangle.
Gold Hill Formation (Lower Cambrian)-Phyllitic schist and quartzite deposited as shale and sandstone in a marine environment and subsequently metamorphosed. Forms a thrust plate overlying the Mayflower Schist and underlying thrust plates of the Toquima and Zanzibar Formations and probably a thrust plate of Cambrian(?) siltite. The Gold Hill Formation has been subdivided into: schist (Cgs), interlayered schist and quartzite (Cgsq), interlayered quartzite and schist (Cgqs), quartzite (Cgq), limestone (Cgl), calc-silicate mineralized limestone (Cglc), and dolostone (Cgd)
Zanzibar Formation (Middle Ordovician)-Generally thin- to medium-bedded, interlay ered marine limestone, cherty limestone, argillaceous limestone, argillite, limy argillite, siliceous argillite, and siltstone. Near granite contacts, limestone has been metamorphosed to marble and calc-silicate-mineralized limestone. Locally else where, limestone has been jasperized and argillite has been metamorphosed to schist. Locally strongly sheared, folded, and brecciated as a result of thrust faulting, and quartz veined and iron mineralized as a result of hydrothermal alteration. Forms a thrust plate overlain by a thrust plate of the Toquima Formation and underlain by a thrust plate of Cambrian(?) siltite, a thrust plate of the Cambrian Gold Hill Formation, and the Mayflower Schist. The Zanzibar Formation has been subdivided into: limestone (Ozl), jasperized limestone (Ozlj), dolostone (Ozd), and argillite (Oza)
Toquima Formation (Upper and Middle Ordovician)-Generally thin-bedded, interlayered marine argillite, siliceous argillite, limy argillite, argillaceous limestone, lime stone, siltstone (or siltite), and quartzite (mostly massive), as well as jasperized and (or) metamorphosed equivalents. Strongly deformed, probably in several episodes from late Paleozoic to Late Cretaceous time. Commonly sheared, tightly folded, and brecciated; quartz is veined, silicified, and iron stained as a result of hydrothermal alteration. Exposed in south part of quadrangle. Forms a thrust plate overlain by thrust plate of the Cambrian Harkless Formation and underlain by a thrust plate of the Ordovician Zanzibar Formation.
| Manhattan Mineral Resource – Amended April 23, 2026 | 40 |
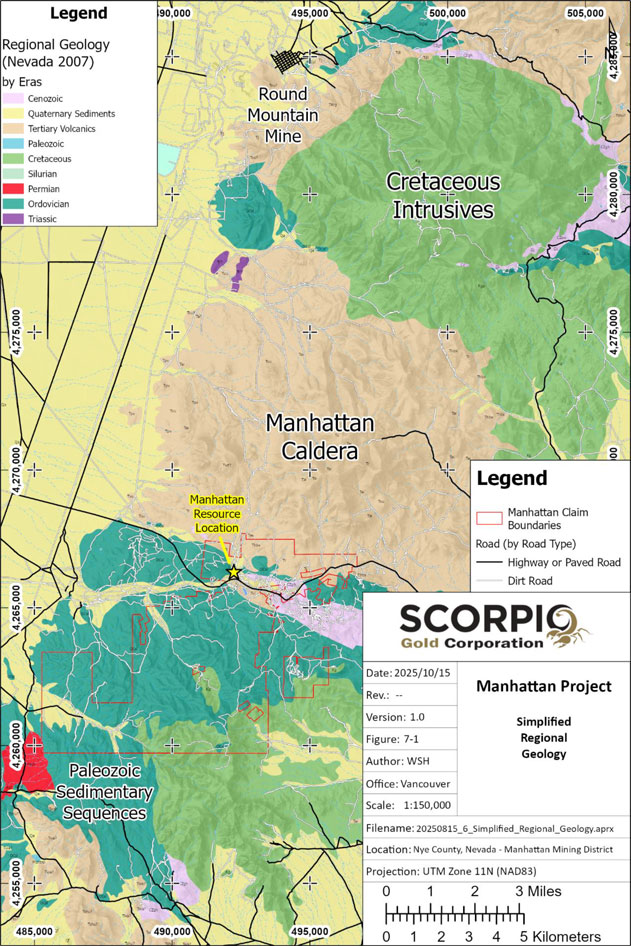
Figure 7-1: Simplified Regional Geology
| Manhattan Mineral Resource – Amended April 23, 2026 | 41 |
| 7.2 | Property Geology |
Mappable rock units on the Property can be grouped into two main lithologic assemblages (Figure 7-2). The older quartzite-siltite-phyllite-argillite assemblage assigned to the Cambrian age Gold Hill Formation hosts the mineralization in the southern end of the Goldwedge deposit and extends south into the open pits. The overlying thin-bedded limestone assemblage, assigned to the Ordovician Age Zanzibar Limestone, hosts the majority of the deposit to the north. The Zanzibar Limestone assemblage grades upward into an interbedded sequence of micritic limestone-laminated calcareous siltstone-black chert-argillite which is characteristic of a restricted basin type deposition. To the northeast, these sedimentary rocks abruptly cut by Tertiary volcanic rocks forming the Manhattan Caldera.
The Gold Hill and Zanzibar Formations form a broad anticline plunging northwest with the north limb of the fold dipping 40-45 degrees north. The limb of the anticline is also folded into a secondary anticline plunging north and is crosscut along the axis by a steeply dipping fault zone called the Reliance Fault. A generalized cross section through the Property is shown on Figure 7-3 while Figure 10-2 to Figure 10-5 show a series of cross sections through the deposit area from north to south. From these sections, it can be seen how the southern part of the deposit area is deeper in the stratigraphic sequence and entirely Gold Hill Formation.
Mineralization crosscuts through the Gold Hill Formation into the overlying Zanzibar Limestone along a steeply dipping fault zone and exhibits partial stratigraphic control by becoming more disseminated and higher grade in the limestone sequence. Evidence of this dissemination in the limestone is the massive jasperoid replacement at the surface on Black Mammoth Ridge, west and adjacent to the known deposit. This dissemination progresses upward through the Zanzibar Limestone into the overlying Ordovician age Toquima Limestone-Argillite and Quartzite.
Drilling to date has restricted the high-grade mineralization (>0.15 opt) to within 20 feet of the fault margins. Lower grade mineralization is disseminated along bedding up to 200 feet from known mineralized faults.
The Reliance Fault Zone is the most continuous mineralized fault zone in the Manhattan District and is mapped by drilling and mining along more than 1,000 m of strike length, starting at the north end of Goldwedge and continuing south through the pits. At the Goldwedge, the fault trends N30 degrees west and dips 75-80 degrees west and east. The overall dip of the fault zone is determined to be west, based on cross sections constructed through the deposit; however, Sunshine Mining, based on less drill control, interpreted the fault zone to be dipping approximately 80 degrees east. The Reliance Fault Zone contains more than one mineralized shear. Vertical displacement in any one fault is small to moderate (3 to 30 metres) based on correlation of the Zanzibar/Gold Hill contact across the deposit.
| Manhattan Mineral Resource – Amended April 23, 2026 | 42 |
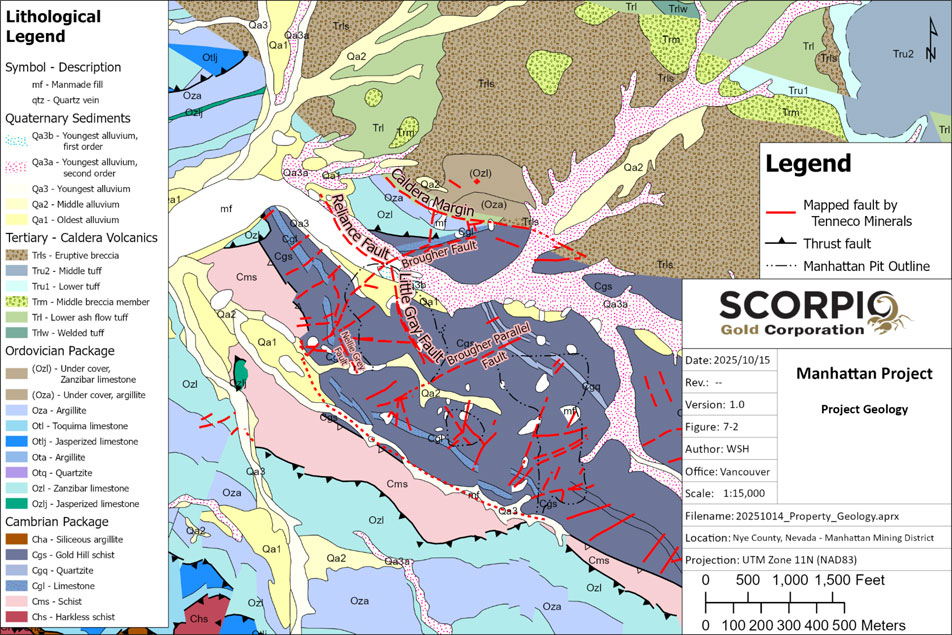
Figure 7-2: Property Geology
| Manhattan Mineral Resource – Amended April 23, 2026 | 43 |
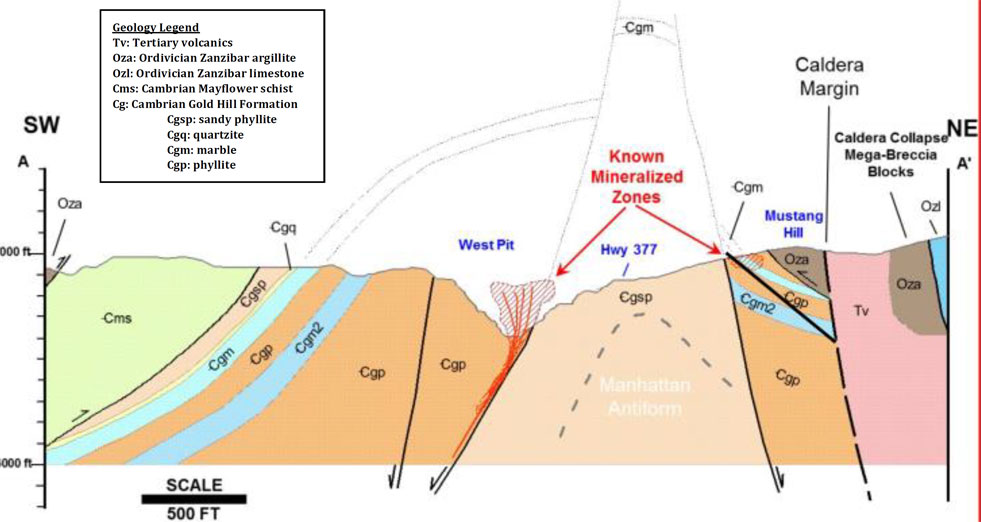
Figure 7-3: Generalized Cross Section
| Manhattan Mineral Resource – Amended April 23, 2026 | 44 |
| 7.2.1 | Alteration |
Alteration in the Goldwedge area is similar to alteration seen in the pits. The one primary difference is that late calcite flooding of open fractures has occurred in the Goldwedge area. This late calcite occurs with the highest-grade gold mineralization and also occurs in barren structures. This flooding has cemented many open fractures, improving the rock competency in the mineralized zone. Clay gouge is common in the shear zones and is also mineralized. There is little alteration of the wall rock.
Adularia has been identified in the pits but has not been noted in drill core from Goldwedge, although it is likely present.
Oxidation is present at all levels drilled in the Goldwedge Deposit. Silicification is veined and the higher gold values are not commonly found in the more intensely silicified zones. Quartz veining is white to gray and more abundant in the deeper mineralized zones.
| 7.2.2 | Property Mineralization |
Mineralization in the Manhattan district represents the superposition of a 25 to 15Ma epithermal gold-silver system over a complex architecture of Oligocene volcanic cover and strongly deformed Paleozoic basement. The mineralization appears dominated by fault zones that cut the basement (and also the volcanics), some of which are clearly ‘standard’ normal faults with surrounding steeper-dipping vein arrays. Many of which are exploiting and reactivating both Paleozoic and Oligocene structures that were initially developed before the main mineralization event (Oliver, 2025).
Because of the complex pre-existing architecture, the epithermal mineralization does not appear to have focussed into thick siliceous high-grade veins. Instead, mineralization is dominated by breccia-bearing fault networks with adjacent altered fracture-veinlet-dominated damage and stockwork zones, such that most known resources to date tend to have only local high-grade pockets amongst broader lower grade zones. Moderate grade (0.3 to 4g/t Au typically, rarely 10-20g/t) fault-fracture-breccia zones are flanked or overprinted by irregular sided centimetre-wide veins with local internal breccia and common bladed calcite with low sulphide abundance. The specific spatial relationship of the boiling textures to the high grade is not yet clear.
In a targeting sense, two main orientations of fault zones are prominent, moderate to steeply dipping and generally striking NNW and ENE. These steeply dipping faults and fault zones, are exposed in the East and West Pits. The well documented “Little Grey” fault in the West Pit is part a major Northwest trending fracture zone which corresponds to the Reliance fault zone north of the highway at the Goldwedge deposit.
Intersections of faults with each other, carbonate and quartzite parts of the Cambro-Ordovician metasediments, and with surrounding phyllites near such junctions, are considered particularly prospective.
| Manhattan Mineral Resource – Amended April 23, 2026 | 45 |
The basement rocks also contain pyrite-bearing orogenic-style veins, inferred to be emplaced and deformed in the Devonian-Carboniferous Antler Orogeny, and some Paleozoic host metasediments (although not specified at Manhattan) are thought by some previous workers to have contained elevated syngenetic gold. There are also small possibilities of some gold pre-enrichment during Cretaceous intrusive activity and ~40Ma Carlin-aged hydrothermal activity. There has not been any work to date assessing these early events regarding their gold potential. Irrespective of the potential for pre-enrichment of gold prior to epithermal mineralization, the Paleozoic to Mesozoic structural evolution involved tight recumbent folding, thrusting and later upright open folding and faulting creating the complex architecture that the later epithermal gold system has interacted with.
Scorpio gold has identified 17 targets for follow up work, listed in below. Scoprio’s main exploration focus while delineating this mineral resource has been over an area 1.8 km long and 650 m wide, to a depth of approximately 200 m.
| Manhattan Mineral Resource – Amended April 23, 2026 | 46 |
Table 7-1: Mineralized Zones
| Target | Stage | Description |
| Black Mammoth | Drill targeting | Ordovician limestones (partially Jasperoid - Zanzibar) wrapping around Manhattan fold hinge to the north of Goldwedge. Historical resource (New Concept, 1997). Work done to date includes pre-Scorpio Gold drilling, rock grabs, and geophysics. The historic Black Mammoth mine is situated on the target |
| Moriah | Early exploration | Ordovician limestones (Zanzibar) on left (west) limb of Manhattan Anticline. Historic underground shafts are along the contact between the Zanzibar limestone, and Cambrian phyllites. |
| Mayflower Trend | Drill targeting | Cambrian marbles on left (west) limb of Manhattan Anticline, west of the West Pit. Historic shafts operated by Reliance mining along the marble ridge above the Reliance trend. |
| Stray Dog | Drill targeting | Historically mined USD pit area, intersection of multiple structures within both Cambrian phyllites, and the mayflower marbles. |
| Mustang Hill | Drill targeting | Ordovician limestones (Zanzibar) and Cambrian limestones and phyllites (Gold Hill and Mayflower) extending to the NE of the West Pit on the right (east) limb of the Manhattan Anticline. Historic Thanksgiving and other mines. |
| April Fool | Advanced exploration | Drag folding and breccias to the east of the town of Manhattan on the right (east) limb of the Manhattan Anticline. Historical resource (New Concept, 1997). First historic gold mining in the Manhattan district started on this area. |
| Barrel Springs | Advanced exploration | Fold hinge Thrust Faulting, large soil anomaly of Arsenic, Antimony, and Gold extending to the south. |
| Keystone Jumbo | Drill targeting | Previously mined (1970's) pits. Boundaries between Thrust faulting /Cretaceous/Manhattan Anticline. Historical Resource (New Concept, 1997). |
| West Pit Deep | Drill targeting | Below the West Pit, looking at deeper underground targets along the Little Grey Fault. |
| East Pit Deep | Drill targeting | Below the East Pit, looking at deeper underground potential targets. |
| Goldwedge Deep | Drill targeting | Below Goldwedge, looking at deeper underground potential targets along the Reliance Fault. |
| Gap Zone | Drill targeting | Area between the West Pit and Goldwedge along the Reliance Fault. |
| East Pit | Resource expansion | Historic East Pit area. Pending inferred resource. |
| West Pit | Resource expansion | Historic West Pit area, Little Grey Fault. Pending Inferred resource. |
| Goldwedge | Resource expansion | Historic Goldwedge Underground area, Reliance Fault. Pending Inferred Resource. |
| Hooligan | Advanced exploration | Previously mined underground. Historical resource (New Concept, 1997). |
| Iron Queen | Early exploration | Southern extension of the Mayflower Trend. Multiple connected historic adits extend towards the South-east targeting the mayflower marble. |
| Manhattan Mineral Resource – Amended April 23, 2026 | 47 |
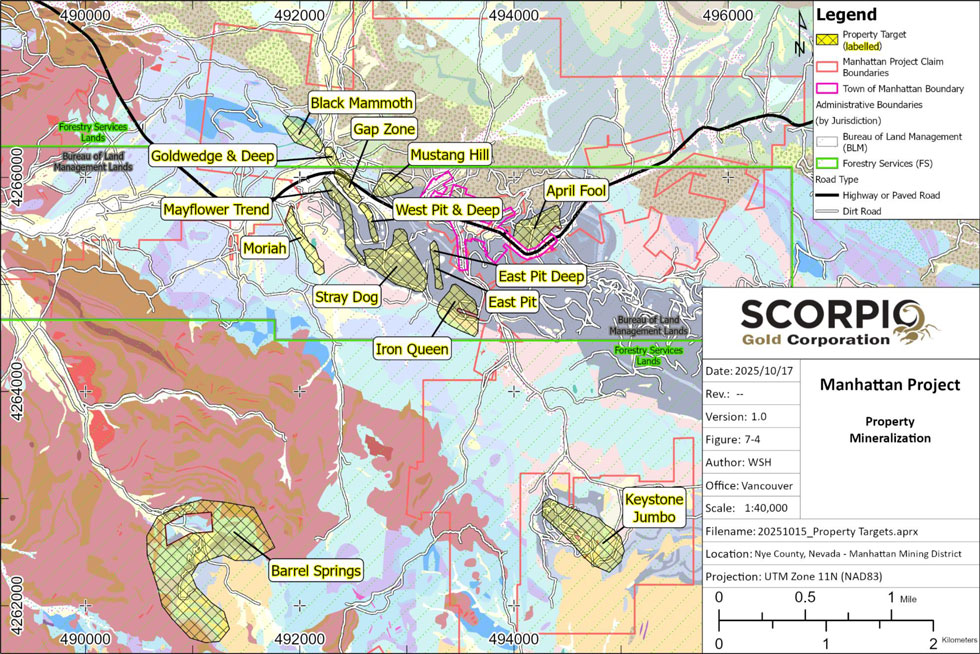
Figure 7-4: Property Targets
| Manhattan Mineral Resource – Amended April 23, 2026 | 48 |
| 8.0 | DEPOSIT TYPES |
The geological setting, mineralization, and alteration found on the Property are typical of low-sulphidation epithermal deposits. These are hydrothermal systems emplaced at shallow depths, generally <1 km, in the earth’s crust. A brief review of this deposit type is provided here, but the reader is referred to Buchanan (1981), Hedenquist et al (2000), and Simmons et al (2005) for a more in-depth review. Figure 8-1from Buchanan (1981) shows a conceptual model of a low-sulphidation deposit.
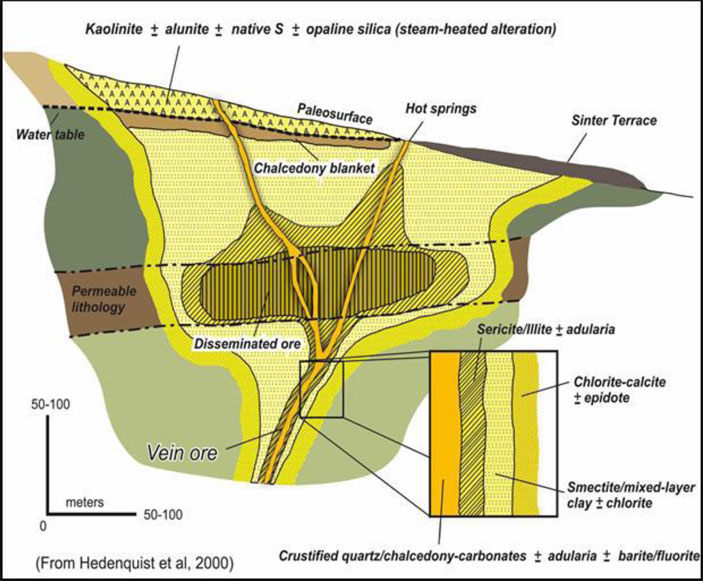
Figure 8-1: Epithermal Deposit Model (Hedenquist et al, 2000)
Low-sulphidation deposits are developed in a geothermal or hot springs environment versus “high-sulphidation” epithermal systems which are formed in a volcanic hydrothermal environment. Gold and silver mineralization in low-sulphidation vein deposits are found in veins, vein stockworks and as minor disseminations. Major deposit examples in the region include: the Round Mountain mine, the Aurora – Bodie District, and the Tonopah and Rawhide Districts. The Paradise Peak deposit and Goldfield District are classic examples of high-sulphidation mineralization, while the Santa Fe and Isabella Pearl deposits exhibit high or intermediate sulphidation (Albino and Boyer, 1992).
| Manhattan Mineral Resource – Amended April 23, 2026 | 49 |
Structural controls are most important in the formation of low-sulphidation deposits, as they provide channels for fluid ingress and open spaces for ore deposition. Low-sulphidation deposits are typically found in districts where regional sub-parallel and intersecting structures define stress fields related to shallow crustal movement resulting in opening and reopening of the structures. These districts can me multiple 100s of km in length. At a deposit- or deposit-cluster-scale that is on the order of several kilometres in length, the local structural regime controls the rupturing of strata and deposition of subsequent mineralization. Ore shoots typically develop within dilatant zones where veins bend or structures intersect and are best developed in local extensional settings. In a vertical view, many vein structures horsetail or split near surface and commonly have stockwork zones developed in the hanging wall side.
The metals component of the vein filling material is zoned with respect to the boiling level. Base metals (Pb, Zn, Cu) tend to be deposited below it, while gold and silver are mostly deposited above the boiling level. Boiling may occur at different elevations for different mineralizing episodes. A broad zone, or entirely separate zones, may be developed. The result may be composite veins, repetitions of the zoning, and/or barren zones in stacked veins.
Veining is typically banded where Au<Ag with gold pathfinder (Zn, Pb, Cu, As, Hg) signatures. Alteration mineralogy shows lateral zoning from proximal quartz-chalcedony-adulara in mineralized veins to illite-pyrite to distal propylitic alteration assemblages. Vertical zoning in clay minerals varies from shallow, low-temperature kaolinite-smectite assemblages to deeper, higher-temperature illite.
Like mineralization, alteration is also zoned with respect to the boiling level and the paleosurface. Alteration tends to be confined to a “neck” with depth and spreads out laterally and upwards from the primary fluid conduits. Towards the paleosurface, structural horse-tailing and stockwork zones are common. The overall lateral alteration extends outwards from a central vein zone towards areas of propylitic alteration, while the vertical zonation progresses from silicification to advanced argillic alteration to siliceous residue. Near-paleosurface alteration may generate advanced argillic alteration minerals such as kaolinite, alunite and buddingtonite. A cap of fine-grained silica (silica sinter) deposited on or directly below the surface is common in preserved systems. This surficial silicification is much finer grained than the deeper silica vein (zones) and is often colloidal or opaline, occurring with cinnabar and very fine-grained pyrite.
| Manhattan Mineral Resource – Amended April 23, 2026 | 50 |
| 9.0 | EXPLORATION |
Since Scorpio acquired the Property in 2012, most of its exploration activities have comprised historical data compilation, and drilling. Surface and underground drilling is discussed in Section 10.0.
A small soil sample program was conducted over the Keystone Jumbo area by Scorpio 2016. At Goldwedge, Scorpio conducted an underground channel sampling program in 2020 in preparation to collect a bulk sample for metallurgical purposes.
| 9.1 | Soil Sampling |
Scorpio has collected a total of 205 soil samples from the Keystone Jumbo area. A 100 m by 100 m soil grid was placed over the entirety of Property, excluding areas within the existing pit and waste piles. Along the main northwest trending mineralized fault, the grid density was increased to 60 m by 60 m.
Figure 9-1 shows the locations of Scorpio’s soil sampling at Keystone Jumbo, while Table 9-1 summarizes the results from the soil sampling program over Keystone Jumbo area.
Table 9-1: Keystone Jumbo soil sample statistics
| Gold | Silver | Arsenic | Copper | Mercury | Antimony | |
| (ppb) | (ppm) | (ppm) | (ppm) | (ppm) | (ppm) | |
| Maximum | 191.5 | 2.687 | 519.9 | 242.34 | 2.788 | 17.73 |
| 95th percentile | 63.1 | 0.500 | 94.1 | 45.24 | 0.374 | 5.01 |
| 80th percentile | 20.1 | 0.186 | 44.9 | 25.38 | 0.119 | 2.43 |
| 50th percentile | 6.4 | 0.079 | 21.7 | 17.60 | 0.044 | 1.36 |
| Average | 15.3 | 0.161 | 38.2 | 23.50 | 0.111 | 1.98 |
No soil sampling has been completed over the Manhattan Property by Scorpio. Historical grid soil sampling has been completed by various operators over the Manhattan Property between 1981 and 2009. A total of 2,783 soil samples are included in the historical database. The Qualified Person has not verified the historic soil samples; however, they are believed to be adequate to demonstrate the expected tenor of soil geochemical values across the Property and highlight trends at Keystone Jumbo. Elevated gold values are visible (Figure 9-1) along a north-west trend, similar to the known trend within the main part of the Manhattan property.
Table 9-2: Historical gold soil sample statistics
| Gold | Silver | Arsenic | Copper | Mercury | Antimony | |
| (ppb) | (ppm) | (ppm) | (ppm) | (ppm) | (ppm) | |
| Maximum | 1280 | 12 | 3800 | 930 | 3000 | 178 |
| 95th percentile | 35 | 0.9 | 162 | 83 | 70 | 10 |
| 80th percentile | 10 | 0.3 | 60 | 42 | 0.7 | 4 |
| 50th percentile | 4 | 0.1 | 19 | 25 | 0.1 | 1 |
| Average | 12 | 0.3 | 48 | 32 | 13 | 4 |
| Manhattan Mineral Resource – Amended April 23, 2026 | 51 |
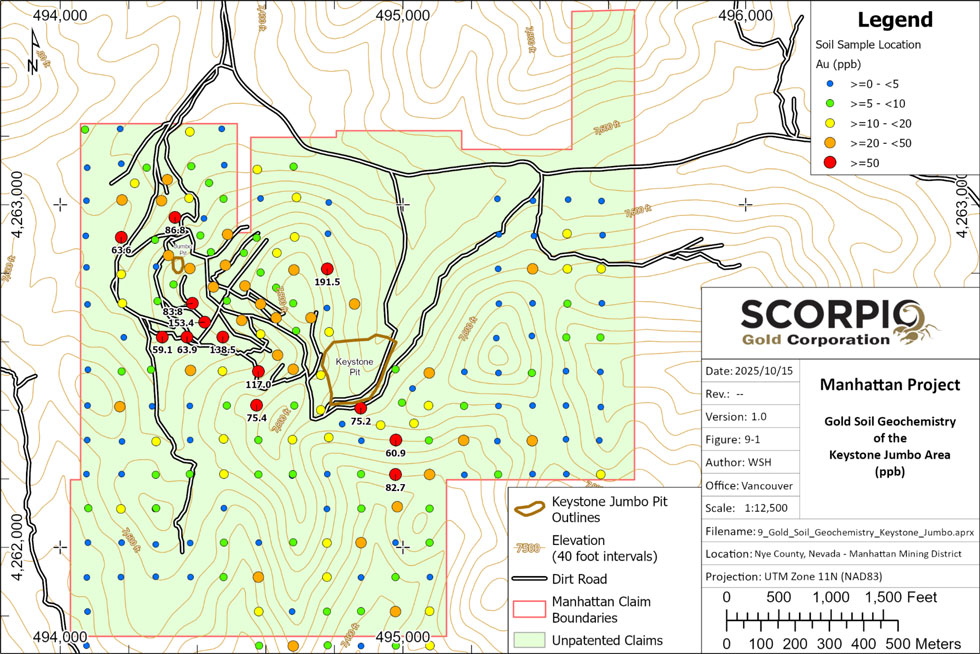
Figure 9-1: Keystone Jumbo Gold Soil Geochemistry
| Manhattan Mineral Resource – Amended April 23, 2026 | 52 |
| 9.2 | Underground Sampling |
Scorpio completed an underground chip sampling program in late 2020 in the Goldwedge Mine. Chanel samples were collected along ribs at 1.5 m intervals, along a 2.7 m by 2.7 m drift driven for bulk sampling purposes. A total of 53 samples were collected during this program. Significant intervals are listed in Table 9-3 and shown on Figure 9-2.
Table 9-3: Underground Channel Sampling - Significant Results
| Sample | From (m) | To (m) | Interval (m) | Gold (g/t) |
| 114326 | 9.2 | 10.7 | 1.5 | 86.81 |
| 114340 | 21.3 | 22.7 | 1.5 | 8.03 |
| 114341 | 22.7 | 24.4 | 1.5 | 4.47 |
| 114346 | 9.2 | 10.7 | 1.5 | 29.97 |
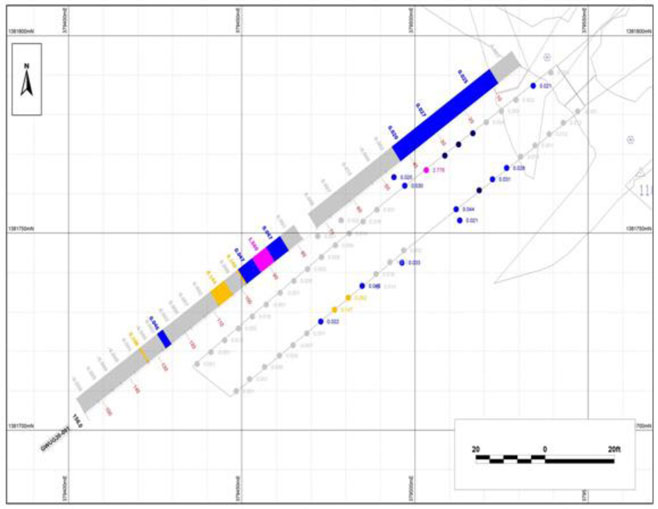
Figure 9-2: Channel Sample Locations – AxCut (Scorpio, 2020)
| Manhattan Mineral Resource – Amended April 23, 2026 | 53 |
| 10.0 | DRILLING |
The following section describes drilling completed by Scorpio Gold and all historical drill hole information that has been validated by the Qualified Person. The drill hole database includes 1,556 holes, drilled between 1973 and 2024, totaling 118,096.77 metres.
| 10.1 | Drilling Summary |
Since acquiring the property in 2012, Scorpio has drilled 121 holes, totaling 15,820.39 metres on the property (Table 10-1). This includes 31 diamond drill holes from surface, 39 diamond drill holes from underground, and 51 reverse circulation (“RC”) holes from surface. Locations of these drill holes are shown on Figure 10-1. In 2024, Scorpio conducted a surface diamond drilling program and completed 10 drill holes totaling 1,785.91 m. This program tested targets on both the Goldwedge and Manhattan sides of the property. Significant highlights from Scorpio’s drilling are presented in Table 10-2.
Table 10-1: Scorpio Gold drill hole summary
| Year | Surface | Underground | TOTAL | |||||
| Diamond | RC | Diamond | ||||||
| Count | Metres | Count | Metres | Count | Metres | Count | Metres | |
| 2015 | 21 | 1,431.03 | - | - | - | - | 21 | 1,431.03 |
| 2020 | - | - | - | - | 15 | 720.56 | 15 | 720.56 |
| 2021 | - | - | 31 | 6917.43 | 24 | 1033.56 | 55 | 7,950.99 |
| 2022 | - | - | 20 | 3,931.90 | - | - | 20 | 3,931.90 |
| 2024 | 10 | 1,785.91 | - | - | - | - | 10 | 1,785.91 |
| TOTAL | 31 | 3,216.94 | 51 | 10,849.33 | 39 | 1,754.12 | 121 | 15,820.39 |
| Manhattan Mineral Resource – Amended April 23, 2026 | 54 |
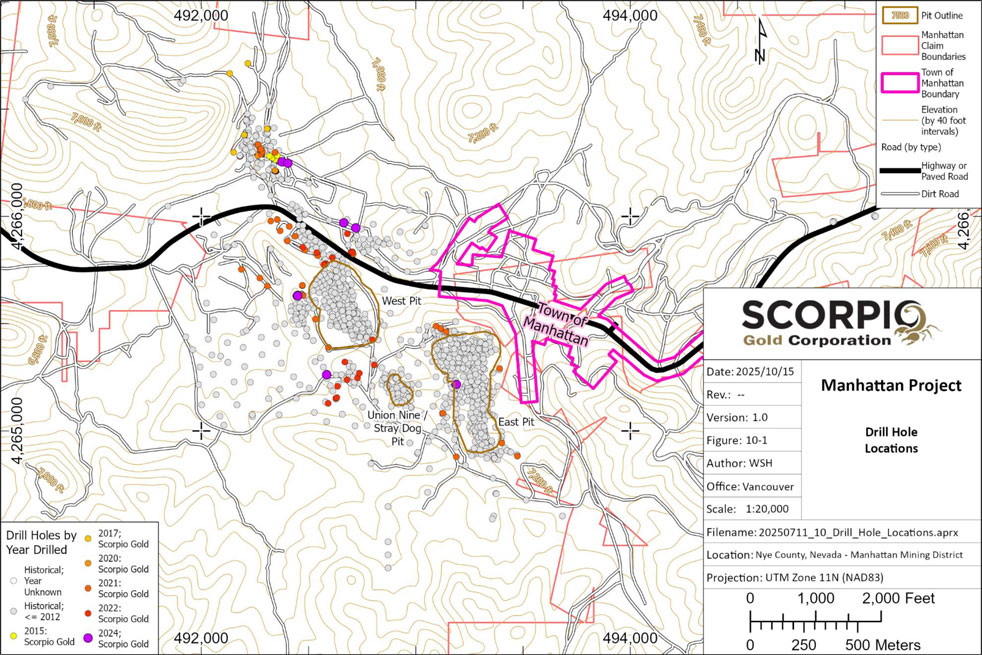
Figure 10-1: Drill Hole Locations
| Manhattan Mineral Resource – Amended April 23, 2026 | 55 |
Table 10-2: Scorpio Gold drill hole highlights
| Hole | From (m) | To (m) | Interval (m) | Gold (g/t) |
| GWUG20-001 | 25.3 | 32.9 | 7.6 | 12.47 |
| including | 26.8 | 28.4 | 1.5 | 53.49 |
| MWRC22-003 | 59.5 | 76.3 | 16.8 | 27.16 |
| including | 59.5 | 62.5 | 3.1 | 145.74 |
| MWRC22-010 | 134.2 | 147.9 | 13.7 | 11.98 |
| MWRC22-012 | 27.5 | 35.1 | 7.6 | 3.85 |
| MWRC22-014 | 16.8 | 19.8 | 3.1 | 4.03 |
| and | 79.3 | 86.9 | 7.6 | 3.53 |
| including | 79.3 | 80.8 | 1.5 | 14.58 |
| MWRC22-018 | 62.5 | 85.4 | 22.9 | 4.90 |
| including | 70.2 | 71.7 | 1.5 | 38.76 |
| and | 112.9 | 112.0 | 9.2 | 5.19 |
| including | 14.4 | 115.9 | 1.5 | 20.17 |
| and | 212.0 | 242.5 | 30.5 | 1.22 |
| and | 259.3 | 285.2 | 25.9 | 1.28 |
| MWRC22-021 | 24.4 | 65.6 | 41.2 | 3.98 |
| including | 35.1 | 42.7 | 7.6 | 15.41 |
| and | 266.9 | 280.6 | 13.7 | 1.75 |
| 24MN-003 | 41.1 | 55.1 | 14.0 | 0.64 |
| and | 199.3 | 206.0 | 6.7 | 2.45 |
| including | 202.4 | 204.2 | 1.8 | 8.36 |
| 24MN-004 | 2.1 | 5.5 | 3.4 | 2.10 |
| and | 157.6 | 159.0 | 1.4 | 1.08 |
| 24MN-005 | 71.9 | 90.2 | 18.3 | 0.50 |
| 24MN-006 | 56.5 | 58.1 | 1.5 | 5.50 |
| and | 100.9 | 103.9 | 3.0 | 2.86 |
| and | 141.7 | 146.1 | 4.4 | 2.78 |
| 24MN-007 | 167.9 | 177.4 | 9.4 | 6.08 |
| including | 167.9 | 171.3 | 3.4 | 15.62 |
| and | 221.3 | 222.4 | 1.0 | 63.70 |
| 24MN-009 | 118.9 | 174.7 | 55.6 | 1.69 |
| 10.2 | Drilling Methods |
The following section describes drilling and core logging procedures performed by Scorpio Gold. Detailed descriptions of methods and procedures are available for historical drilling, which has been summarized in Section 11.1.
| Manhattan Mineral Resource – Amended April 23, 2026 | 56 |
| 10.2.1 | Reverse Circulation Drilling |
The RC chips travel up the drill string to a cyclone, producing 20-30 lbs of sample which is then split at the rig to produce two separate 10-15 lb samples. Samples are collected on 5 ft intervals from a rotating wet splitter assembly attached to the drill rig. The rotary splitter discharges through two ports, one of which empties into the primary sample bag (“A” sample, which is sent for analysis) and the other discharges into the reject sample bag (“B” sample, which is kept on site).
Chip tray samples are collected from the reject B material. Each A sample bag has a sample identification tag stapled to it along with a duplicate sample tag placed inside the bag. The sample ID is also written on the outside of each bag. The samples are then placed in separate lockable containers to be submitted for analysis.
A minimum of one duplicate sample per 20-25 samples is coded and submitted for assay along with the rest of the submission as a blind check of the laboratory. These duplicate samples are collected from the reject B sample and checked against the original A sample when the assays are received. For quality assurance, one standard and one blank is inserted for every 20-25 samples and checked upon receipt of assay data. Scorpio Gold uses standards representing typical waste, low-grade, mid-grade and high-grade ore prepared from certified reference material by RockLabs laboratories of Australia.
| 10.2.2 | Diamond Drilling |
Diamond drilling in 2024 was conducted with a skid mounted drill using HQ-size equipment. Core samples were placed in a cardboard box and transported to a central processing area on the Property where the core is photographed, and geotechnical and geological logging were performed. All logging data has been entered directly into a GeoSpark digital database.
Drill core was processed using the following procedures:
| 1. | Core is washed and pieced together |
| 2. | Run recovery is calculated and marker blocks checked |
| 3. | Depth marks are made every on foot along the core |
| 4. | Geotechnical logging is performed |
| 5. | Magnetic susceptibility is measured for each core box |
| 6. | Geological logging is performed |
| 7. | Specific Gravity samples are taken once every 50 feet or where lithology changes |
| 8. | Core is photographed wet and dry |
| 9. | Cut lines are drawn on the core |
| 10. | Lids are placed on the boxes, and the boxes moved to the cutting facility |
Sample intervals are determined by the site geologist and are typically between 1.5 and 5 ft (0.46 and 1.5 m) in length within homogeneous zones or less as dictated by lithology. Sample intervals are marked and the core is sawn into symmetrical halves. One half is sampled and the other half retained in the core box for future reference. For quality assurance, one standard is inserted for every 15 to 20 samples; one blank for every 30 to 50 samples; and one duplicate for every 30 to 50 samples.
| Manhattan Mineral Resource – Amended April 23, 2026 | 57 |
The results of the assaying of the QA/QC material included in each batch are tracked to ensure the integrity of the assay data. In practice, Scorpio Gold uses certified reference materials approximating expected high grade, run of mine grade and low grade from underground mining which have been obtained from commercial suppliers.
Once processed, core boxes are placed on pallets and stored on the Property.
| Manhattan Mineral Resource – Amended April 23, 2026 | 58 |
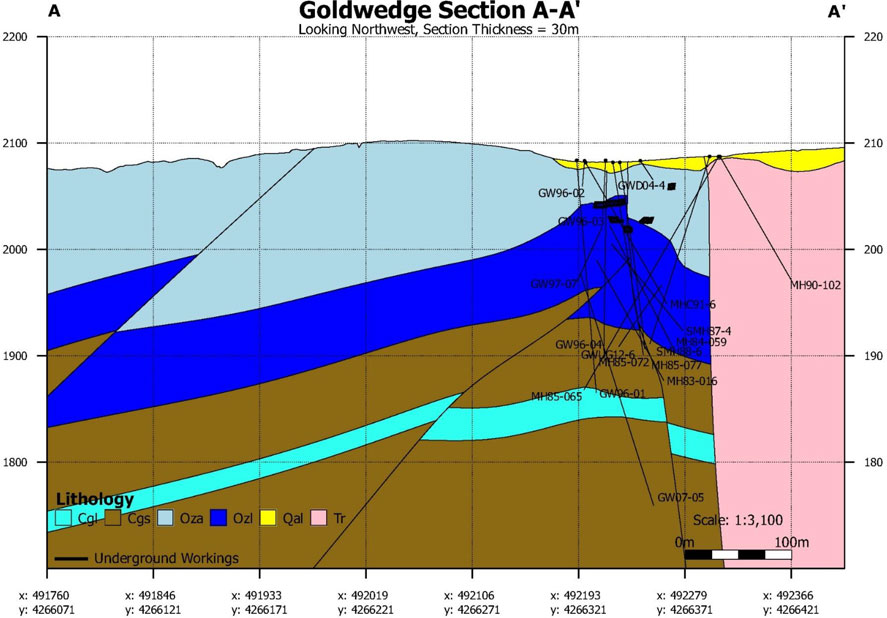
Figure 10-2: Goldwedge Section A-A' (Loury, 2025)
| Manhattan Mineral Resource – Amended April 23, 2026 | 59 |
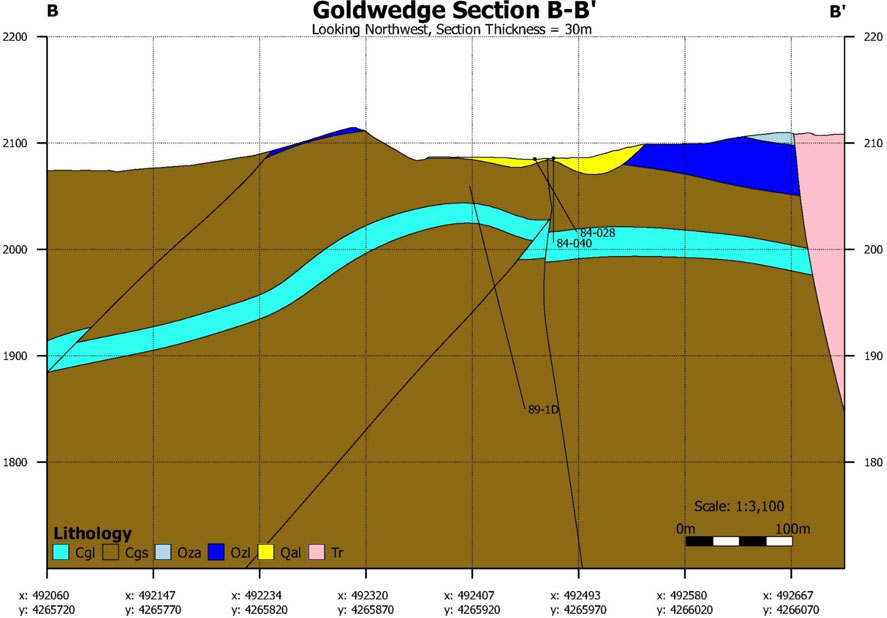
Figure 10-3: Goldwedge Section B-B' (Loury, 2025)
| Manhattan Mineral Resource – Amended April 23, 2026 | 60 |
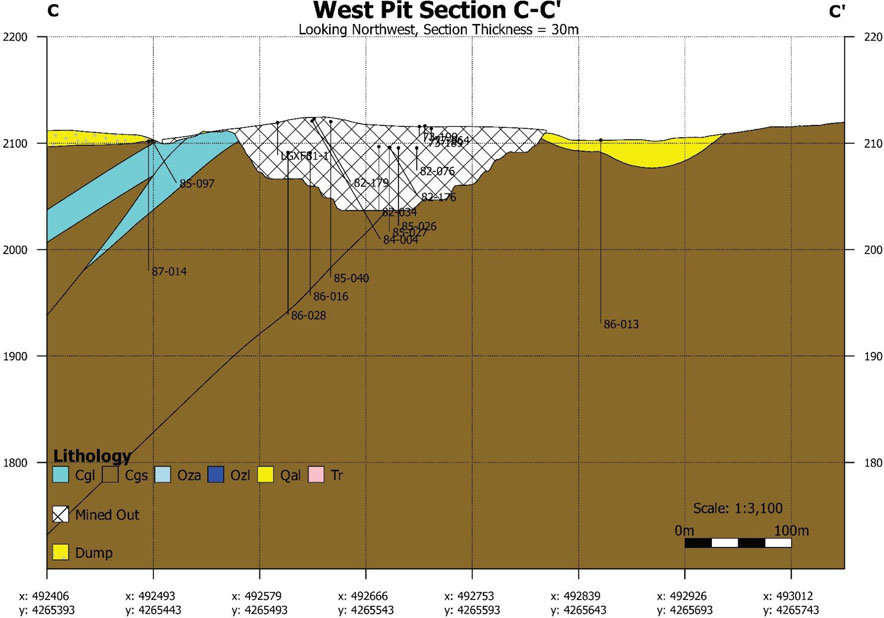
Figure 10-4:West Pit Section C-C' (Loury, 2025)
| Manhattan Mineral Resource – Amended April 23, 2026 | 61 |
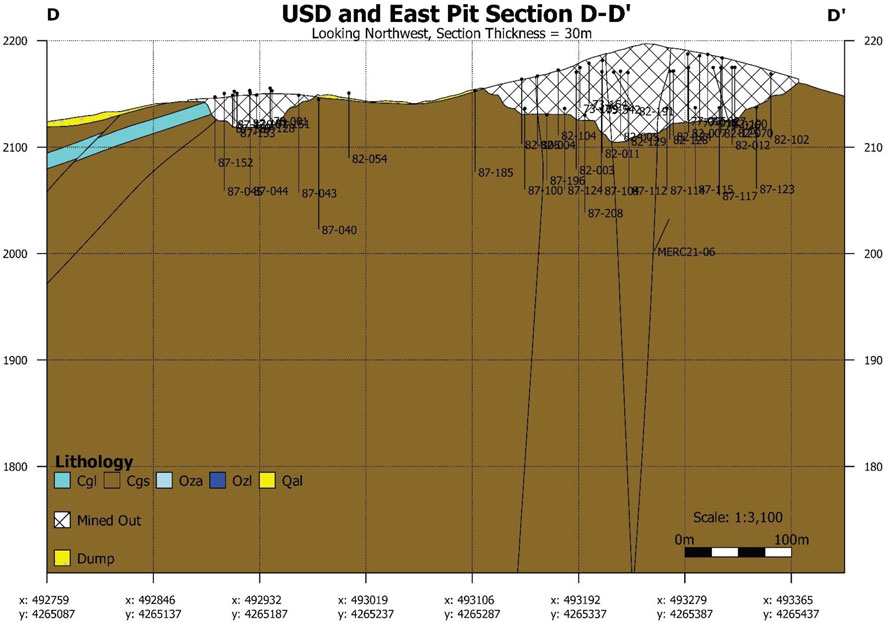
Figure 10-5: USD and East Pit Section D-D' (Loury, 2025)
| Manhattan Mineral Resource – Amended April 23, 2026 | 62 |
| 10.3 | Historical Drilling |
In addition to drilling completed by Scorpio, there has been more than 2,000 drill holes completed on the Property by previous operators since 1973. At the time of this report Scorpio has compiled and validated 1,435 of these drill holes, totaling 102,254.20 metres of drilling (Figure 10-1). The majority of these are vertical reverse circulation or rotary drill holes, with only a limited amount of diamond drilling. Some of the drill holes with assay data are blastholes completed during mining operations.
| 10.3.1 | Historical Drilling Methods |
All but 30 of the historical drill holes were drilled from surface, many of which pre-date mining. Between 1973 and 1988, 1,246 of these holes (69,597.26m) were drilled by Summa Corporation, Huston Oil, Tenneco, and Echo Bay. These holes were used to guide the development of the open pit mines.
Of the 1,435 of historical drill holes validated, 1,258 were considered reliable for use in the mineral resource estimate (Table 10-3). All other were excluded either due to uncertainty in assay, survey, or collar information for historical holes, or due to the drillhole location falling outside the resource model extents.
Of the subset used, 6.8% are diamond drillholes (DD), 11.9% are reverse circulation drillholes (“RC”), 39% are rotary drillholes (“RD”), 1.6% are top hammer percussion drillholes (“TH”), and 33.4% of drillholes are of an unknown drill type. Blastholes (“BH”) and rotary air blast (“RAB”) drillholes were also included in the dataset but were used only for validation purposes and are not used in the final block model estimation.
Except for diamond drilling, samples were collected on 5 foot intervals by the driller. Diamond drill samples were split based on geological and mineralogical changes identified by the geological staff.
Validation efforts are ongoing and may add additional drill holes that could be used in future resource estimations. Data compilation efforts to date have focused on the areas to be included in the mineral resource estimate.
| 10.3.2 | Historical Drilling Results |
Results from this drilling were used to guide the geological model shown in Figure 10-2 to Figure 10-5 and are consistent with more recent drilling completed by Scorpio Gold. Highlights from this historical drilling include 70.1 m of 12.22 g/t gold in MH83-016 and 10.7 m of 4.38 g/t gold in 86-038. Both of these holes are from steeply inclined holes targeting fault structures, the true thickness is believed to be 60-70% of the true thickness.
This drilling has shown that widespread gold mineralization occurs on the property, and that nuggety high-grade intervals exist throughout. Future drilling and sampling methods should account for the nuggety nature of the mineralization.
Drilling
by past and present operators has delineated a 1.8 km long by 650 m wide corridor of gold bearing low-sulphidation epithermal
veins, which are the subject of this mineral resource estimate. Results from the drilling demonstrate consistent mineralization
within this target area.
| Manhattan Mineral Resource – Amended April 23, 2026 | 63 |
Table 10-3: Historical Drilling Methods
| Drill Type/Company | Drillhole Count |
| Blasthole | 97 |
| Summa Corporation | 53 |
| Tenneco Minerals Company | 44 |
| Diamond | 18 |
| Houston Oil & Minerals Corporation | 9 |
| Round Mountain Gold Corp. | 7 |
| Royal Standard Minerals INC | 2 |
| Rotary Air Blast | 8 |
| Houston Oil & Minerals Corporation | 8 |
| Reverse Circulation | 159 |
| CanAm Minerals Company (subsidary of Echo Bay Mines, Ltd.) | 1 |
| Echo Bay Mines, Ltd. | 12 |
| Freeport Exploration Company | 5 |
| Freeport-McMoRan | 26 |
| Round Mountain Gold Corp. | 15 |
| Scorpio Gold Corp. | 51 |
| Tenneco Minerals Company | 49 |
| Rotary | 520 |
| CanAm Minerals Company | 203 |
| Freeport Exploration Company | 1 |
| Houston International Minerals Corporation | 197 |
| Houston Oil & Minerals Corporation | 112 |
| Summa Corporation | 7 |
| Top Hammer Percussion | 21 |
| Summa Corporation | 21 |
| Unknown | 435 |
| Houston International Minerals Corporation | 5 |
| Round Mountain Gold Corp. | 6 |
| Summa Corporation | 314 |
| Tenneco Minerals Company | 110 |
| Grand Total | 1,258 |
| Manhattan Mineral Resource – Amended April 23, 2026 | 64 |
| 11.0 | SAMPLE PREPARATION, ANALYSIS, AND SECURITY |
This section describes the principles and procedures used in the collection, security, preparation, and chemical analysis of samples collected during Scorpio’s work programs. Sampling methods and procedures for work programs conducted by other operators are summarized from historical reports and other company documents where available.
Routine gold analysis in all years was performed by Fire Assay, with over limits by gravimetric method. Multi-element and silver analysis were often not performed. Table 11-1 lists the laboratories known to have been used, where laboratory certificates of analysis have been reviewed by the QP.
Table 11-1: List of Laboratories
| Company | Year(s) | Laboratory | Location |
| Huston Oil | 1977-1983 | HIMCO (Company Lab) | Tonopah, Nevada |
| Freeport | 1983-1984 | Monitor Geochemical Laboratory, Inc.. | Elko, Nevada |
| Freeport | 1984-1985 | Shasta Analytical Geochemistry Laboratory | Redwood, California |
| Tenneco | 1985 | Tenneco Minerals | Tonopah, Nevada |
| Echo Bay | 1987 | Chemex Labs Inc. | Sparks, Nevada |
| Echo Bay | 1988 | Legend Metallurgical Laboratory, Inc. | Reno, Nevada |
| Round Mountain | 1989-1991 | Legend Metallurgical Laboratory, Inc. | Reno, Nevada |
| Round Mountain | 1992 | Chemex Labs Inc. | Sparks, Nevada |
| Royal Gold Inc. | 1998 | American Assay Laboratories | Reno, Nevada |
| Kinross | 2003-2010 | ALS Chemex | Sparks, Nevada |
| Royal Standard | 2004 | BSi Inspectorate | Sparks, Nevada |
| Royal Standard | 2004-2005 | American Assay Laboratories | Reno, Nevada |
| Royal Standard | 2005-2009 | Royal Standard (Company Lab) | Manhattan, Nevada |
| Royal Standard | 2012 | ALS Minerals | Reno, Nevada |
| Scorpio Gold | 2010-2021 | American Assay Laboratories | Reno, Nevada |
| Scorpio Gold | 2014-2022 | Scorpio Gold (Company Lab) | Mineral Ridge, Nevada |
| Scorpio Gold | 2017-2024 | ALS Minerals | Reno and Elko, Nevada |
| 11.1 | Historical Drilling |
The following descriptions are taken from available reports and outline methods utilized by historical operators and believed to reflect standard acceptable industry practices at the time. Detailed descriptions are not available for all of the historical work and inferred to be similar to the methods described below.
| 11.1.1.1 | Huston Oil/Tenneco |
A detailed writeup describing Huston Oil’s 1982 drilling program (Patton et all, 1982). Reports describing other years of drilling by Huston Oil are not available. The QP has been able to discuss drilling operations with the original project manager and other geologists for Huston Oil present during operations and confirmed that procedures outlined in the 1982 report adequately reflect all other year’s operations by Huston Oil and its successor, Tenneco.
| Manhattan Mineral Resource – Amended April 23, 2026 | 65 |
Drilling in 1982 utilized an Ingersoll-Rand T-4-W 6.75 inch down-the-hole hammer drill rig. Each hole was cased to a minimum depth of 7.5 feet. After casing was, sampling began at 2.5 foot intervals. The hole was blown after each 2.5 foot advance. All material recovered was channeled into an 8 to 1 splitter. The smaller sample, approximately 10 pounds, was combined on 5 foot intervals and sent for assay. A 1.5 pound sample was removed from the larger split for geological logging.
Assays were completed at the Huston Oils Tonopah Lab for fire assay. Samples were crushed to -10 mesh and three separate splits created. Split A was analyzed routinely. For each interval that was considered mineralized based either on favorable geology or assay results, splits B and C were also analyzed.
| 11.1.1.2 | New Concepts Mining and Freeport Exploration |
Sampling for the reverse circulation holes was to split the drill cuttings from each five-foot interval as the cuttings are recovered from the drill hole. Approximately 88 pounds of cuttings were recovered from each five-foot interval of drilling and are passed through different types of splitters based on whether the sample was wet or dry. A dry splitter, called a Jones Splitter, was used for dry samples and a rotary "pie splitter" was used for the wet samples. Both splitters contain dividers that reduce the sample size to a representative fifteen pounds for transport and analysis.
Samples were bagged by the contract driller under the supervision of a company employee. The samples were either transported to the lab by company or lab personnel. A standard chain of custody form was delivered to the lab along with the samples. Once at the lab, the samples were dried, split, pulverized and analyzed. The labs used were well known for quality analytical work and utilize duplicate, blank and check assays.
| 11.1.1.3 | Royal Standard Minerals |
The following description of drilling and sampling by Royal Standard Metals was taken from the 2005 technical report authored by Strachan and Master.
During the 2004 drilling, the entire sample from the mineralized interval was collected. Normally, the sample recovery was not good in the mineralized zone. There is potential for significant mineralization to not have been recovered in the drilling where lost circulation was encountered.
Drill samples were bagged by the contract driller and picked up at the drill site by the lab. After drying, samples were crushed in a primary jaw crusher and then a secondary cone crusher to reduce the sample to roughly I 0-mesh. The sample was then split to I00 grams using a riffle splitter and pulverized with a ring pulverizer to -150 mesh. The sample was then split to 30 grams or a I assay ton and fire assayed. Many of the gold samples were analyzed by atomic absorption spectroscopy (AAS) with sample decomposition by fire assay fusion, which is a routine analytical procedure for gold analyses.
| 11.1.2 | Historical QAQC |
Prior to 1992, QA/QC was limited to duplicate sampling. Many of the mineralized intervals were run in duplicate or triplicate. The variance between the original and duplicate samples is within an expected range given the nature of the deposit and support the original analysis. The use of duplicates and triplicate samples reduces the impact of nuggety gold, which is common at Manhattan.
Starting in 1992, samples processed at external laboratories were subject to the laboratory QA/QC program, results of which are presented on assay certificates. With the exception of drilling by Round Mountain Gold, companies relied upon laboratory QA/QC and duplicate sampling, no additional standards or blanks were inserted.
| Manhattan Mineral Resource – Amended April 23, 2026 | 66 |
Round Mountain Gold routinely inserted standards, blanks, and duplicates into their sample stream. No anomalies were observed within their QA/QC program.
Much of the historical drilling was used to successfully guide mining operations and was done to a high standard.
The QP is of the opinion that the sample collection, security, and analytical procedures met or exceeded industry best practices at the time and are reliable for use in the mineral resource estimate. Given the nuggety nature of the mineralization, it is recommended that additional drilling be completed in proximity to some historical high-grade intervals within the resource model prior to upgrading parts of the model to the indicated category. This will further validate past drilling and analytical procedures.
| Manhattan Mineral Resource – Amended April 23, 2026 | 67 |
| 11.2 | Scorpio Gold |
| 11.2.1 | Geochemical Soil Sampling |
| 11.2.1.1 | Soil - Sample Collection |
Soil samples for gold and associated trace elements were taken in a grid pattern of ~100m x 100m except along a structurally prospective corridor where grid spacing was reduced to ~50m x 50m. Samples were not taken from disturbed ground, including existing roadways, dumps or dry creek beds. In the case of a planned sample station falling in one of these areas, the sample location was moved at least 2m uphill away from any disturbance. Actual sample locations were recorded as waypoints using a handheld GPS unit with an accuracy of +3m.
All samples were taken from a depth of at least 15cm below the ground surface to a maximum of 40cm below the surface. The samples were sieved in the field during collection using a stack of two certified test sieves. Plus 2mm material was kept as the “A” split. Minus 2mm to +80mesh material was kept as the “B” split. Minus 80mesh material was kept as the “C” split. Soil was collected and sieved until the “C” sample reached a weight of 1-2kg. All samples were collected in spun polypropylene sample bags. One out of every 12 sample stations is a randomly located field duplicate. At these locations, two sets of “A”, “B”, and “C” samples were taken from the same sample pit and labelled with consecutive sample numbers. Each time the sieve stack was emptied, the respective fraction was split evenly between the routine and duplicate sample to avoid any depth bias between the two. A minority of the Phase III samples were collected as bulk samples and sieved using the same stack on a mechanical shaker at the Goldwedge mill due to ground moisture at the time of collection. The same sample classification and retention procedure was used.
| 11.2.1.2 | Soil - Sample Preparation and Security |
Samples were removed from the field each day and stored in a locked outbuilding at the Goldwedge facility. “B” and “C” samples were transported by Scorpio Gold personnel directly to the Bureau Veritas (BV) lab in Reno, NV. Upon receipt, the assay lab logs in the samples and checks against the submittal form. Un-submitted “A” samples are stored at the Goldwedge facility for future use.
Each sample shipment was accompanied by both blanks and certified reference materials (CRMs) at a density of one blank and one CRM for every 10 field samples. The blanks used are in-house blanks prepared from the same material used during Scorpio drill programs at the Mineral Ridge property. Two CRMs, OREAS 45d and OREAS 25a, were used alternately as both a high-grade and
a low-grade standard certified for Au, Ag, As, Hg and a number of other elements of interest. All of the QA/QC samples were inserted blind, with any identifying differences between the QA/QC samples and the routine samples obliterated as thoroughly as possible.
Upon arrival at the lab, the “B” and blank QA/QC samples were pulverized to at least -80mesh and riffle split to 100g aliquots for analysis. The “C” and CRM samples were already fine enough for the analytical method and so were only riffle split into 100g aliquots for analysis. The analytical splits were then sent to the BV Vancouver lab for analysis while the reject material was retained at the Reno facility
| Manhattan Mineral Resource – Amended April 23, 2026 | 68 |
| 11.2.1.3 | Soil - Sample Analysis |
Both the “B” and “C” sample aliquots were analyzed using BV’s AQ254 protocol. A 100g sample was leached using concentrated aqua regia and the resulting liquor diluted and analyzed for a suite of elements using an ICP-MS instrument. Bureau Veritas Vancouver and Bureau Veritas Reno are ISO/IEC 17025:2005 accredited testing laboratories. Each facility incorporates its own in-house quality management and control systems to ensure reliability, accuracy and consistency of its analytical results. Scorpio Gold geologists also evaluated the analyses returned for the blind QA/QC samples to validate the efficacy of the lab’s handling and analysis of the soil samples.
| 11.2.2 | Drilling – Sample Preparation |
| 11.2.2.1 | Reverse Circulation (RC) Drilling |
The RC chips travel up the drill string to a cyclone, producing 20-30 lbs of sample which is then split at the rig to produce two separate 10-15 lb samples. Samples are collected on 5 ft intervals from a rotating wet splitter assembly attached to the drill rig. The rotary splitter discharges through two ports, one of which empties into the primary sample bag (“A” sample, which is sent for analysis) and the other discharges into the reject sample bag (“B” sample, which is kept on site). Chip tray samples are collected from the reject B material. Each A sample bag has a sample identification tag stapled to it along with a duplicate sample tag placed inside the bag. The sample ID is also written on the outside of each bag.
The samples are then placed in separate lockable containers to be submitted for analysis. A minimum of one duplicate sample per 20-25 samples is coded and submitted for assay along with the rest of the submission as a blind check of the laboratory. These duplicate samples are collected from the reject B sample and checked against the original A sample when the assays are received. For quality assurance, one standard and one blank is inserted for every 20-25 samples and checked upon receipt of assay data. Scorpio Gold uses standards representing typical waste, low-grade, mid-grade and high-grade ore prepared from certified reference material by RockLabs laboratories of Australia.
| 11.2.2.2 | Diamond Drilling |
Sample intervals are determined by the site geologist and are typically between 1.5 and 5 ft (0.46 and 1.5 m) in length within homogeneous zones or less as dictated by lithology. Sample intervals are marked and the core is sawn into symmetrical halves. One half is sampled and the other half retained in the core box for future reference. For quality assurance, one standard is inserted for every 15 to 20 samples; one blank for every 30 to 50 samples; and one duplicate for every 30 to 50 samples. The results of the assaying of the QA/QC material included in each batch are tracked to ensure the integrity of the assay data.
In practice, Scorpio Gold uses certified reference materials approximating expected high grade, run of mine grade and low grade from underground mining which are prepared by RockLabs Laboratories of Australia.
| Manhattan Mineral Resource – Amended April 23, 2026 | 69 |
| 11.2.3 | Drilling - Sample Security |
All core logging and sample collection is performed at the GoldWedge mine site, within a gated compound. Core logging takes place in the mill building and is secured each evening.
Collection and packaging of samples for shipping is undertaken by Scorpio Gold personnel under the supervision of the site geologist. Sample preparation and analytical work is conducted either by ALS Minerals (“ALS”) in Reno, Nevada or American Assay Laboratories (“AAL”) in Sparks, Nevada.
Upon receipt, the assay lab logs in the samples. This sample list is checked against the submittal and discrepancies, if any, are noted.
| 11.2.4 | Drilling - Sample Analysis |
The assay labs perform fire assays on 50-g aliquots of sample pulps. The sample is mixed with 100 g to 180 g of flux (the assayer determines the flux composition). The fused sample is poured while an assayer makes notes on the quality of each fusion. The lead button is separated and an assayer reports any low weights or slag composition problems. The button is cupelled and an assayer records any cupellation problems. For gravimetric finish analysis, the bead is weighed and parted and the analyst reports any parting problems. For instrument finish analysis, the bead is dissolved and the solution is examined for any undissolved prill. The solution is read by AAS/ICP.
When requested, the assay labs re-assay samples returning >10 ppm (0.073 troy oz/st) Au utilizing fire assay with gravimetric finish.
Both AAL and ALS are ISO/IEC 17025:2005 accredited testing laboratories, and are independent of Scorpio Gold. Each facility incorporates its own in-house quality management and control systems to ensure reliability, accuracy and consistency of its analytical results.
| 11.2.5 | Quality Assurance and Quality Control |
During the 2024 drill program, a total of 1,287 core samples were collected. Samples were divided into 12 batches for analysis and QA/QC samples inserted into each batch. A total of 18 coarse blanks, 23 fine blanks, 18 field duplicates, 39 laboratory duplicates, and 41 certified reference material (“CRM”) samples were inserted into the sample stream. Results from the QA/QC program were reviewed by the Company’s QP as they became available and any concerns investigated and addressed.
Duplicate samples generally compared well to the original samples. Field duplicate samples showed the greatest variability when compared to the original analysis, averaging a variance of 34%. Laboratory duplicates performed much better, with an average variance of 6%. There does not appear to be any bias in the duplicate samples.
All of the blank samples returned gold values below the analytical detection limit.
All of the CRMs were obtained from a commercial supplier in 2.5 kg jars. A list of CRMs used by Scorpio in 2024 is shown in Table 11-2. Scorpio personnel divided the jars into 50 g sachets, in a clean environment. When inserted into the sample stream, two sachets (100 g total) were submitted. The variance for each CRM analyzed by Scorpio is greater than the expected variance; however, for each CRM the results are relatively consistent. Results show a bias towards under-reporting gold values for the CRMs by approximately 1.5% of the certified value.
| Manhattan Mineral Resource – Amended April 23, 2026 | 70 |
Table 11-2: 2024 Certified Reference Material
| Gold Value (g/t) | ||||
| Source | Certified Value | Uncertainty | Count | |
| OxN117 | Rocklabs | 7.679 | 0.06 | 2 |
| KO74107 | Klen | 8.20 | 0.21 | 12 |
| OxG104 | Rocklabs | 0.925 | 0.006 | 4 |
| OxH122 | Rocklabs | 1.247 | 0.009 | 3 |
| OxC129 | Rocklabs | 0.205 | 0.002 | 2 |
| OxJ120 | Rocklabs | 2.365 | 0.017 | 18 |
The QP recommends Scorpio source new, prepackaged CRM material to avoid any potential contamination. Packages should contain enough material to for the laboratory to perform multiple analysis on without the need to combine multiple CRMs.
| Manhattan Mineral Resource – Amended April 23, 2026 | 71 |
| |
| 12.0 | DATA VERIFICATION |
The Authors have reviewed the information provided by the Company and publicly available historical documents. Original downhole survey files were made available to the Author, for Scorpio’s 2024 diamond drill program. Certificates of analysis from all of Scorpio’s exploration activities were made available to the QP directly from the external laboratories.
The Author also reviewed Scorpio’s drill core logging, sampling, and QA/QC procedures.
| 12.1 | Historical Drill Hole Data |
All of the available historical data dating back to the early 1970s was made available to the QPs for validation purposes. The QP reviewed these historical reports, drill logs, assay certificates, company reports and any other applicable documents and databases.
Scorpio Gold is actively reviewing and digitizing historical drill hole and other data from all available data. The Mineral Resource Estimate reported in this report uses only data that has been digitized as of the reports effective date. Historical mine and exploration records should continue to be searched for any additional documentation that would support collar coordinate, down-hole survey, assay, and other drill-hole data.
| 12.1.1 | Drill Hole Collars |
Drill hole locations were historically reported in a variety of coordinate systems, including a local mine grid. All locations were converted to UTM NAD83, Zone 11. A transformation was derived, by Scorpio Gold, to convert the mine grid by using known survey monuments. The monuments were physically located and surveyed using a differential GPS. Once converted, the transformations were validated by obtaining a GPS position of physical collars and cross checking this against the transformed locations.
Many of the historical drill hole collar locations pre-date mining and no exist or are inaccessible. GPS locations of historical collars that were re-visited are located less than 3 m from the transformed coordinates. It is the QP’s opinion that the collar locations are suitable for the purposes of this report.
| 12.1.2 | Drill Hole Assays |
Original certificates or drill hole logs with the compiled digital database, which comprises a total of 103,701 samples collected from 2221 holes drilled prior to 2024. This database includes holes drilled outside of the resource area. Collar locations and survey information has not yet been located for all of the holes included in this initial database.
The QP manually cross-checked 88,064 of the pre-2024 samples stored within the database with original logs or certificates. Original certificates from the Scorpio Gold drilling were made available to the QP directly from the original external laboratories.
Collar locations for many of the holes in the assay database are not currently available in the current collar database. These assays were also validated for the possibility that locations may at some point become available.
| Manhattan Mineral Resource – Amended April 23, 2026 | 72 |
| |
Within the database, 55,574 samples were cross-checked against original laboratory certificates. Assay results for 39,165 samples were only available from original drill hole logs. These were mostly limited to drilling prior to 1989, the majority from Round Mountain Gold Corp. and Echo Bay Minerals between 1984 and 1988. Some certificates of analysis are available for these years and were able to be cross-checked against drill hole logs. No discrepancies were identified during this review.
During the QPs review, each sample was assigned a confidence value ranging from zero to ten. With zero being low-confidence where assay values could not be confirmed and ten being high-confidence where assay values were confirmed by comparing original certificates obtained directly from a laboratory with the database. All samples with a confidence of four or greater were visually validated against historical documentation. Samples with original certificates were assigned a confidence of eight, while samples processed at an internal company or unknown laboratory were assigned a confidence of seven.
The existing digital assay database accurately reflects the original data. Few errors were identified during the review and were immediately corrected. The most common issue identified was inconsistencies with denoting missing samples or samples below detection limit. This was corrected such that no assay values are present for missing samples and below detection limit is indicated using negative values.
No independent check assaying has been completed by the QP for any of the historical drilling. However, considering many of the drill holes were completed for the purposes of production and at a very close spacing, the QP believes the data in the database is reliable.
Prior to 1992, QA/QC was limited to duplicate sampling. Many of the mineralized intervals were run in duplicate or triplicate. The variance between the original and duplicate samples is within an expected range given the nature of the deposit and support the original analysis. Starting in 1992, samples processed at external laboratories were subject to the laboratory QA/QC program, results of which are presented on assay certificates.
It is the opinion of the QP that the existing database is suitable for use for exploration planning and interpretation. Samples with a confidence value of five or greater are considered suitable for use for mineral resource estimation.
| 12.2 | Historical Metallurgical Data |
The author has reviewed all available historical metallurgical reports. Tests were conducted on samples whose origins are difficult to track and may not satisfy current sampling standards. Although no current metallurgical testing has been performed to validate these results, historical production methods and records support the testwork.
The existing data is adequate for the current project stage and suggests that a conventional path to metallurgical recovery exists. The QP believes further testing is required prior to refining the mineral resource estimate or advancing towards a preliminary economic assessment or pre-feasibility study.
| 12.3 | Scorpio Data |
Data collected by Scorpio Gold prior to 2024 was included with the historical data for validation. Original assay certificates from all external laboratories was obtained and cross checked against the database.
For work conducted in 2024, in addition to cross checking original assay data against the database, site visits were conducted by the QP at which time logging procedures and QA/QC protocols were examined.
| Manhattan Mineral Resource – Amended April 23, 2026 | 73 |
| |
To evaluate the reproducibility of results in a known nuggety gold system, Scorpio submitted seven samples from three holes, for analysis by a screened metallic method. Table 12-1 shows results of this analysis against the original results from a standard gravimetric analysis.
Table 12-1: Screen metallics results
| Hole ID | From (m) | To (m) | Au_GRA (g/t) | Au_SCR (g/t) |
| 24MN-002 | 0.12 | 1.10 | 13.55 | 12.05 |
| 24MN-007 | 167.95 | 169.12 | 12.3 | 12.15 |
| 24MN-007 | 169.12 | 170.16 | 24.3 | 22.9 |
| 24MN-007 | 170.16 | 171.30 | 11.1 | 12.05 |
| 24MN-007 | 221.34 | 222.37 | 63.7 | 140 |
| 24MN-009 | 171.60 | 172.98 | 19.4 | 20.2 |
| 24MN-009 | 171.60 | 172.98 | 14.9 | 16.2 |
The screen metallic results typically align well with the original analysis, with only one significant deviation of from a high-grade sample. Overall, the results are consistent with a nuggety gold system. The QP recommends Scorpio continue with its practice of submitting high-grade samples for reanalysis and that an appropriate top-cut is employed for mineral resource estimation.
During Mr. Loury’s site visit, 14 intervals were selected from four holes for check analysis. Check samples were prepared by collecting half of the remaining intervals, resulting in ¼ core samples. These samples were submitted to ALS for analysis. Results from the check samples are shown in Table 12-2 along with the results from the original analysis.
Table 12-2: Check sample results
| Hole ID | From (m) | To (m) | Au_ORIG (g/t) | Au_CHK (g/t) |
| 24MN-003 | 199.34 | 201.17 | 0.309 | 1.28 |
| 24MN-003 | 201.17 | 202.39 | 0.05 | 0.054 |
| 24MN-003 | 202.39 | 204.22 | 8.36 | 0.546 |
| 24MN-004 | 14.33 | 16.09 | 0.235 | 0.112 |
| 24MN-004 | 16.09 | 17.89 | 0.159 | 0.113 |
| 24MN-004 | 17.89 | 19.20 | 0.261 | 0.125 |
| 24MN-005 | 83.82 | 85.65 | 3.34 | 0.133 |
| 24MN-005 | 85.65 | 87.48 | 0.511 | 2.12 |
| 24MN-005 | 87.48 | 88.39 | 0.068 | 0.227 |
| 24MN-005 | 88.39 | 90.22 | 0.231 | 0.437 |
| 24MN-009 | 168.86 | 170.39 | 1.33 | 1.03 |
| 24MN-009 | 170.39 | 171.60 | 2.49 | 3.96 |
| 24MN-009 | 171.60 | 172.98 | 19.4 | 14.9 |
| 24MN-009 | 172.98 | 174.65 | 4.17 | 3.63 |
| Manhattan Mineral Resource – Amended April 23, 2026 | 74 |
| |
Although there is some significant variation in some of the results, a direct comparison of ½ core to ¼ core samples is not possible. In general the results indicate higher-grade samples will show greater variability. One sample with visible gold along a fine structure originally yielded 8.36 g/t gold, the check assay returned a result significantly lower. This result is not unexpected given the nature of the visible gold and possible sampling bias. The QP recommends Scorpio conduct regular duplicate analysis of high-grade samples.
It is the opinion of the QP that data collected by Scorpio meets or exceeds industry best practices and is suitable for use.
| 12.4 | Site Visits |
Mr. Dumala visited the property on August 5, 2024, and again on April 10, 2025. During both visits he was accompanied by Harrison Pokrandt, Vice President of Exploration for Scorpio Gold. On his first visit, Mr. Dumala reviewed the Company’s logging and sampling procedures, reviewed core from 24MN-006, and visited the drill at 24MN-009. During the second visit, Mr. Dumala attempted to relocate and validate some of the historical drill sites from 1990 and 2014. Several drill sites from the 1990 and 2014 were located and align well with the database. Many of the drill sites for drilling prior to 1980 are located within the mine area and now are either buried beneath waste piles or mined out, making further validation difficult.
| 12.5 | Summary Statement |
The QPs verified that data summarized in this, and other sections of this report is acceptable as used in this report, specifically for project description, to exploration guidance and to support resource estimation. Collar, survey and assay data from drilling was evaluated and verified with respect to the most original documentation available.
A manual audit was performed on approximately 84% of the drill hole database against scans of original assay certificates. The audit yielded an acceptable error rate. All of Scorpio’s 2024 data was compared to original assay certificates downloaded directly from the laboratories. No significant errors were identified.
| Manhattan Mineral Resource – Amended April 23, 2026 | 75 |
| |
| 13.0 | MINERAL PROCESSING AND METALLURGICAL TESTING |
At this stage of the study, no current metallurgical testing has been performed on any samples from the mineral deposit. However, the Manhattan area has a long history of mining and production, including a few metallurgical tests that have been performed. These tests were conducted on samples whose origins are difficult to track and may not satisfy current sampling standards. Nevertheless, these historical records indicate a mineral deposit that appear to have a conventional path to metallurgical recovery.
| 13.1 | Historical Operations and Production |
Early mining was reported in the Manhattan area after the discovery of silver in the 1800s until the 1890s. The discovery of gold in the 1900s brought back mining leading to the establishment of the town of Manhattan in 1905. Despite the presence of gold in lode outcrops, initial mining comprised placer mining, which was then considered as the second largest placer gold production in Nevada. Subsequently, a 75-ton per day mill was built in the 1910s to process gold from lode deposits. Mining slowed down in the 1920s until the Manhattan Gold Dredging Company operated at the site from 1938 to 1946 (Western Mining History, cited Dec 2024).
The Summa Corporation acquired the property in 1967, further explored the area and conducted some mining. A consultant’s correspondence in 1975 suggests that a heap leaching operation and carbon adsorption-electrowinning plant was operated. In 1977, Houston Oil and Minerals Company (which was later acquired by Tenneco Minerals Co.) purchased the property. Houston began operations in May 1980 until January 1982 when falling gold prices forced them to shut down. Production resumed in the fall of 1983.
In September 1986, Echo Bay Mines purchased the property and operated the mine until the reserves were exhausted in March 1988. In January 1989, Echo Bay Mines and Round Mountain merged their properties around Round Mountain and started processing high-grade Round Mountain ores at the Manhattan Mill by March of the same year. This continued until December 1990, when the capacity of the tailing storage facility was exhausted.
Heap leach production from low-grade stockpiles at Manhattan began in August 1989 with feed coming from the low-grade stockpiles at Manhattan. Stacking ended in October 1990, but leaching continued until 1993. Final reclamation of the Manhattan mill site and dedicated leach pad began in 1994.
| 13.1.1 | Historical Processing at Manhattan Mill |
The historical descriptions of the Manhattan Mill are rather vague. It involved at least one crushing stage, followed by a wet scrubber to remove gold from surfaces by attrition. From the scrubber, the ore was screened at ¾”, where the +¾-inch fraction was rejected and not processed. The -¾-inch fraction underwent a combination of screening, grinding in a ball mill, classification by hydrocyclones, flotation of the hydrocyclone overflow, and gravity separation of the hydrocyclone underflow consisting of jigs and Wilfley shaking tables. Tailing from the gravity circuit were recycled to the ball mill.
Flotation consisted of rougher, rougher scavenger and cleaning stages. Cleaner tailing was returned to the rougher cells, while the cleaner concentrate was thickened and pumped to a disc filter for dewatering. The dewatered concentrates were leached in 48-hour batches with cyanide solution in three agitated tanks. Gold from the pregnant solutions was recovered by Merrill-Crowe precipitation. A 1,000 ton/day leach agitation circuit was added to the facility in 1988.
| Manhattan Mineral Resource – Amended April 23, 2026 | 76 |
| |
Heap leaching of low-grade stockpiles and mill rejects began in August 1989, using a dedicated leach pad. The precious metals were recovered by a carbon adsorption plant.
Table 13-1 below summarizes available metal production at the Manhattan from 1980 through 1990. While mill the capacities were reported, no production numbers could be found from 1980 through 1985.
Table 13-1: History of Production at Manhattan.
| Year | Design Capacity, st/d | Actual Process Rate, st/d | Remarks |
| MILL | |||
| 1980 | 750 | Houston Oils and Minerals Company, later Tenneco Minerals Co.; Manhattan Ore; no production numbers available. | |
| 1981 | |||
| 1982 | |||
| 1983 | 3,000 | ||
| 1984 | |||
| 1985 | |||
| 1986 | 2,562 | Echo Bay, Manhattan Ore | |
| 1987 | 2,562 | ||
| 1988 | 1,494 | ||
| 1989 | 1,000 | 480 | Round Mountain High-Grade Ore |
| 1990 | 616 | ||
| HEAP LEACH | |||
| 1989 | 8,637 | Manhattan Low-Grade Stockpile | |
| 1990 | 7,175 | ||
Echo Bay operated the mine starting in the last quarter of 1986. Ore was mined from two open pits using what was then referred to as “conventional milling,” which differs slightly from the previous description. The process started by crushing the ore and segregating the smaller pieces that contained majority of the gold. This fraction was sent to the mill where gold was first recovered by gravity separation, then by flotation followed by cyanide leaching.
The coarse fraction was tumbled in water to scrub off gold to produce a gold-rich attrition product that was combined with the finer-sized fraction for milling. The scrubbed coarse fraction, deemed uneconomic, was rejected.
The Echo Bay Annual Reports from 1986 through 1988 do not mention the use of grinding or cyanidation. However, historical reports, including the reference used in the previous subsection, mention a conventional cyanide mill from 1986 through 1990 in addition to the use of cyanide for heap leaching from 1990 through 1993.
Table 13-2 below shows Echo Bay’s production from the last three months of 1986 through the first three months of 1988 based on their annual reports. The recoveries obtained were in the 70% range, which is low probably due to the rejection of the coarse fraction during the washing/attrition process.
| Manhattan Mineral Resource – Amended April 23, 2026 | 77 |
| |
Table 13-2: Echo Bay Operating Data from 1986 through 1988.
| Operating data | 1986 (3 mos) | 1987 | 1988, Q1 | 1989 | 1990 |
| Gold produced, ounces | 6,876 | 28,855 | 4,752 | ||
| Ore processed, stpd | 2,562 | 2,652 | 1,494 | 480 | 616 |
| Grade, oz/st | 0.045 | 0.040 | 0.039 | ||
| Recovery Rate, percent | 68.9 | 68.0 | 72.0 | 92.0 | 93.2 |
| Cash Production Cost, $/oz | $244 | $320 | $414 |
| 13.2 | Metallurgical Testing |
| 13.2.1 | Summa Corporation – 1975 |
The time of Summa’s operation of Manhattan was in the early days of heap leaching and carbon adsorption technologies. Correspondence in 1975 from Summa’s metallurgical consultant discusses the use of sodium hydroxide to control heap leach pH and sodium sulphide to strip loaded carbon, neither one of which is in current use.
| 13.2.1.1 | August 1975 Bottle-Roll Tests on Manhattan Ore (Baker, 1975a) |
A sample of Manhattan ore was crushed to 10 mesh and panned. The panned concentrate contained 28.7% of the original gold, 80.73% of which were recovered by bottle-roll cyanidation as shown in Table 13-3 below.
Table 13-3: Results of Bottle-Roll Cyanidation of Panned Concentrate.
| Days | Cum Au Dissolved, % |
| 1 | 14.97 |
| 2 | 77.84 |
| 4 | 80.73 |
The panned tailing gave a gold extraction of 61.73% after 24 hours of bottle-roll cyanidation. Overall, the recovery was 67.18%.
| 13.2.2 | Tenneco - Houston International Minerals Corporation Testing – 1983 Feasibility Study |
Tenneco’s Houston International Minerals Corporation (HIMCO) conducted metallurgical tests for Manhattan deposit for an economic study in 1983. Thet tests were performed at both the Colorado School of Mines Research Institute (CSMRI) and the HIMCO’s Tonopah Laboratory.
Bulk samples for testing were collected from the blasted face of the pit walls from both the Big Four and Little Grey pits. The Big Four sample contained quartzite, wacke, quartz-mica-schist, sandy phyllite and clean phyllite. Numerous drusy quartz veins and veinlets cut through these rock types. The Little Grey sample contained numerous rock types consistent with the common lithologies found in the Big Four (i.e., quartzite, wacke, quartz mica schist, sandy phyllite, clean phyllite). Drusy quartz and quartz pseudomorphs after calcite line the fracture surfaces.
| Manhattan Mineral Resource – Amended April 23, 2026 | 78 |
| |
Testing consisted of (a) crushing and scrubbing to reject a large fraction of coarse materials that contained up to a quarter of the gold, (b) gravity concentration, (c) flotation, and (d) cyanide leaching.
| 13.2.2.1 | Crushing and Scrubbing |
Large-scale tests were performed on Big Four Samples. Approximately 25 tons were crushed to minus 4-inch, scrubbed and screened at CSMRI. The Tonopah Laboratory treated about 10 tons of minus 4-inch material by scrubbing and screening also. The Little Grey crushing and scrubbing tests were performed at laboratory scale only. The results are shown in Table 13-4 below. The full screen assays may be found in the feasibility study report listed in the Section 27 (Houston International Mineral Corporation, 1983).
Table 13-4: Results of Scrubbing Tests.
| Size Fraction | Big Four - CSMRI | Big Four – Tonopah Lab | Little Grey – Tonopah Lab | |||
| Mass % | % of Au | Mass % | % of Au | Mass % | % of Au | |
| +¾” | 49.7 | 10.5 | 66.4 | 14.18 | 62.9 | 27.4 |
| -¾” | 50.3 | 89.5 | 33.6 | 85.98 | 37.1 | 72.6 |
| Head Grade, oz/st Au | 0.047 | 0.047 | Not reported | |||
| Head Grade, g/t Au | 1.61 | 1.61 | ||||
The scrubbing and screening procedure did remove 50% or more of the material with a smaller percentage of gold lost. This may have made sense at the time, but at current metal prices, this scheme would not maximize revenue at it automatically limits the recoveries to the amount left in the – ¾-inch materials.
| 13.2.2.2 | Gravity Concentration |
Results of gravity concentration tests conducted at CSMRI on minus 10 mesh feed is summarized in Table 13-5.
The results indicate that 50% of the gold was recovered in the gravity concentration. The loss of gold was in the coarse fractions where gold had not been fully liberated. An examination of the gravity tailing assays shows that the recovery could be improved if the material were ground to – 65 mesh, as both the +200 mesh and -200 mesh fraction assays were essentially the same, 0.018 and 0.019 oz/st, and about 4.5 times less than the +65-mesh assay of 0.083. The gravity feed probably came from Big Four, but the report was not clear about it.
| Manhattan Mineral Resource – Amended April 23, 2026 | 79 |
| |
Table 13-5: Results of Gravity Concentration Tests
| Product | Mass % | oz/st Au | Au Distribution, % |
| -10 mesh feed | 100 | 0.095 | 100 |
| Gravity concentrate | 0.8 | 5.91 | 49.8 |
| Tailing | 99.2 | 0.048 | 50.2 |
| TAILING ASSAYS | |||
| + 28 mesh | 12.6 | 0.177 | 45.8 |
| + 65 mesh | 14.0 | 0.083 | 25.0 |
| + 200 mesh | 27.5 | 0.018 | 10.4 |
| - 200 mesh | 45.9 | 0.019 | 18.8 |
| TOTAL | 100 | 0.048 | 100 |
Actual plant results for the gravity concentration during Manhattan operations in late 1981 indicate that 55-60% of the gold was recovered in the gravity concentrate.
| 13.2.2.3 | Flotation |
A summary of flotation results is presented in Table 13-6. The results indicate that flotation should produce final concentrates in the range of 25 oz/ton gold at overall recoveries of approximately 70%. Again, it is not clear where this sample came from. The conditions of the flotation tests, namely grind size, reagents used, and pH, were not included in the report.
Table 13-6: Results of Flotation Tests
ROUGHER FLOTATION
| Feed, oz/st Au | Concentrate, oz/st Au | Tailing, oz/st Au | Recovery, % | |
| 0.020 | 17.919 | 0.004 | 80.0 | |
| 0.017 | 5.399 | 0.005 | 70.7 | |
| 0.017 | 3.824 | 0.005 | 70.7 | |
| 0.020 | 3.819 | 0.007 | 65.1 | |
| Average | 0.019 | 7.74 | 0.005 | 71.6 |
CLEANER FLOTATION
| Feed, oz/st Au | Concentrate, oz/st Au | Tailing, oz/st Au | Recovery, % | |
| 5.024 | 28.64 | 0.0547 | 99.1 | |
| 4.387 | 26.80 | 0.0889 | 98.3 | |
| 4.762 | 23.96 | 0.0711 | 98.8 | |
| Average | 4.724 | 26.46 | 0.0716 | 98.7 |
| Manhattan Mineral Resource – Amended April 23, 2026 | 80 |
| |
| 13.2.2.4 | Cyanide Leaching |
Eleven cyanide leach tests were performed at different cyanide dosages and leach times, presumably on Big Four samples. Other than pH 11, no other test parameters were provided, such as grind size, % solids, temperature, mode of agitation (bottle rolls?), and leach kinetics. The report suggests a 48-h leach at 1 g/L NaCN to attain 98% recovery (Figure 13-1).
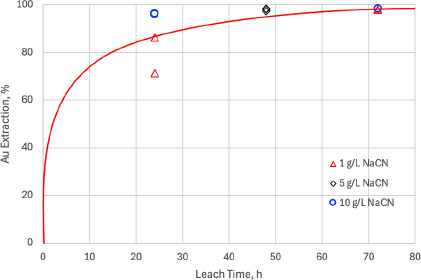
Figure 13-1: Results of Cyanide Leach Tests, Fort Lowell Consulting 2025, using Tenneco data 1983
| 13.2.3 | Metallurgical Tests on Goldwedge Composite for FMC in 1986 by Heinen-Lindstrom Consultants |
In 1986, Freeport McMoran Corporation submitted 47 samples from the Goldwedge deposit for testing by Heinen-Lindstrom Consultants. The samples were composited and blended and tested by gravity concentration and cyanide leaching.
The gravity concentration tests were rudimentary, using a hand panner for the rougher stage and a D.A.M. bowl concentrator (a.k.a. “the Blue Bowl”) for the cleaning stage, at a grind of 35 mesh. The gold concentration in the cleaner concentrate was upgraded 10 times from a head grade of 0.092 oz/st (3.15 g/t) to 0.901 oz/st (30.9 g/t) at a recovery of 11.7%.
Microscopic examination revealed visible gold, 150 microns or finer, in the cleaner concentrate and two cleaner tail products. The gold particles were about 150 microns or finer and looked flattened. Some sulphide particles, mostly pyrite, were present in the cleaner concentrate, but silica comprised over 90 percent of the concentrate. Some silica encapsulation of gold was apparent, which is expected with the coarse grind of the material. The report suggested the possibility of gold trapped in sulphide minerals as a solid solution with no evidence offered.
| Manhattan Mineral Resource – Amended April 23, 2026 | 81 |
| |
Amenability of the sample to cyanide leaching was tested using the bottle-roll procedure at 40 weight percent solids, pH 10.5 with lime addition, 2.0 pounds NaCN per ton of solution at a grind of 8 mesh and a head grade of 0.108 oz/st (3.7 g/t) Au. The results of the tests are plotted in Figure 13-2 below, which shows that leaching was essentially complete after 24 hours. The maximum recovery was 57.4% attained after 120 hours of leaching time.
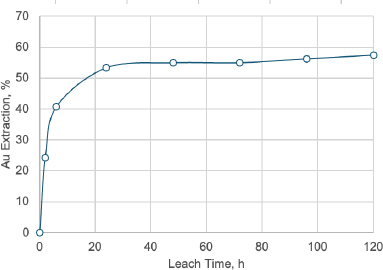
Figure 13-2: Cyanide Leaching Kinetics of 8-mesh Goldwedge Composite, Fort Lowell Consulting 2025 using data from Heinen-Lindstrom Consultants, 1986.
Clearly, the low recovery obtained was due to the coarseness of the material being leached. Table 13-7 below are the screen assays of the leach tails showing that 93% of gold lost was in the plus 35-mesh fraction. Looking at the individual assays, a relatively large decrease in assays can be seen from +100-mesh fraction to the -100-mesh fraction, which indicates that this material should have been ground to at least 100 mesh.
Table 13-7: Screen Analysis of Cyanide Leach Residue
| Size Fraction | Weight % | Assays | Au Distribution | |
| oz/st Au | % | Cumulative % | ||
| +10 mesh | 46.2 | 0.071 | 71.1 | 71.1 |
| -10 + 20 mesh | 16.1 | 0.044 | 15.4 | 86.5 |
| -20 + 35 mesh | 5.7 | 0.055 | 6.7 | 93.2 |
| -35 + 65 mesh | 4.5 | 0.039 | 3.9 | 97.1 |
| -65 + 100 mesh | 0.8 | 0.031 | 0.4 | 97.5 |
| -100 mesh | 26.7 | 0.004 | 2.5 | 100 |
| Composite | 100 | 0.046 | ||
| Manhattan Mineral Resource – Amended April 23, 2026 | 82 |
| |
| 13.2.4 | Gravity Concentration Tests at Minerals Processing Laboratory (Sparks, NV, 1986) |
Three samples, designated MH 72-56, MH 72-77, and MH 72-79, were submitted for testing by Freeport McMoran Gold Company to Minerals Processing in Sparks, Nevada in 1986. These samples were collected from Goldwedge.
The samples were ground to 75% finer than 150 microns and concentrated with a spiral concentrator (“Gold Hound”). The concentrates were amalgamated to determine the percentage of gold liberated. The results of the tests are presented in Table 13-8.
The samples were high-grade, particularly MH 72-79, which assayed more than 10 times MH 72-77. Consequently, these results may not be representative of the behavior of average-grade materials expected to be mined during operations. The recoveries obtained were good, ranging from 45% to 91%. The gravity concentration tailing had good grades, ranged from 0.177 to 0.811 oz/s, and future processing methods should include leaching of the gravity tailing.
Table 13-8: Gravity Concentration Test Results – 1986.
| Test Functions | MH 72-56 | MH 72-77 | MH 72-79 |
| Sample Mass, g | 4,346.9 | 4,538.2 | 4,320.4 |
| Gravity Concentrate Mass, g | 1.20 | 7.53 | 3.11 |
| Au Recovered by Amalgamation, mg | 38.13 | 104.56 | 1,170.0 |
| Au Remaining in Amalgamation Tailing, mg | 0.43 | 0.76 | 4.60 |
| Au Remaining in Gravity Concentration Tailing, mg | 46.67 | 27.53 | 120.05 |
| Au Remaining in Gravity Concentration Tailing, oz/st | 0.320 | 0.177 | 0.811 |
| Total Au (Calculated) in Sample.mg | 85.23 | 132.85 | 1,294.65 |
| Au Recovery by Concentration, % | 45.1 | 79.8 | 90.7 |
| Calculated Head Assay | |||
| oz/st Au (g/t) | 0.572 | 0.854 | 8.739 |
| Assayed Heads, Average of Triplicates | |||
| oz/st Au | 0.552 | 0.883 | 6.291 |
| oz/st Ag | 0.25 | 0.390 | 1.677 |
| Manhattan Mineral Resource – Amended April 23, 2026 | 83 |
| |
| 13.2.5 | Metallurgical Tests on Goldwedge Composite for FMC in 1988 by McClelland Laboratories |
Agitated leach tests were performed by McClelland Laboratories in 1988 on Goldwedge Composite 5B+5C, averaging 0.224 oz/st (7.68 g/t) Au and 0.17 oz/st (5.83 g/t) Ag. This time, the samples were ground to 80% passing 200 mesh (74 microns). Duplicate tests were performed at 4 levels of cyanide addition, namely, 2, 4, 7 and 10 lb/st of solution. The results are shown for one set of tests in Figure 13-3 below.
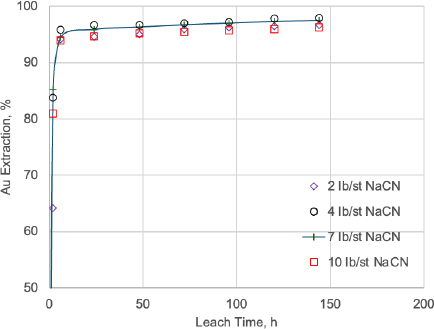
Figure 13-3: Cyanide Leaching Kinetics of 200-mesh Goldwedge Composite, McClelland Laboratories, 1988.
The leach kinetics were fast at all levels of cyanide addition, with recoveries levelling off after 6 hours and attaining 98% maximum recovery. These results show that the Goldwedge material tested was free milling, that there were no issues with pyrite or silica encapsulation or gold solid solution in pyrite as previously hypothesized. It is possible that high recoveries can be attained at a coarser primary grind, which should be investigated in the next set of metallurgical tests.
| 13.2.6 | January 2007 METCON Tests for Royal Standard Minerals Inc. |
Two samples from the Goldwedge deposit were submitted for testing at the METCON laboratory in 2007 by Royal Standard Minerals Inc. The samples were labeled A-1 and B-1. They were ground to P80 = 149 microns (100 mesh) for the tests. Assays of the +150 mesh and -150 mesh fractions are summarized in Table 13-9 below.
Table 13-9. Assay Results of Goldwedge A-1 and B-1 Samples (2007).
| Sample | Size | Mass | Assays, g/t | Distribution, % | |||
| Fraction | g | % | Au | Ag | Au | Ag | |
| A-1 | +150 mesh | 11.65 | 1.83% | 31.65 | 39.70 | 7.02% | 22.12% |
| -150 mesh | 626.14 | 98.17% | 7.80 | 2.60 | 92.98% | 77.88% | |
| Calc Head | 8.24 | 3.28 | |||||
| B-1 | +150 mesh | 20.02 | 2.67% | 10.09 | 10.40 | 8.12% | 16.91% |
| -150 mesh | 730.54 | 97.33% | 3.13 | 1.40 | 91.88% | 83.09% | |
| Calc Head | 3.32 | 1.64 | |||||
| Manhattan Mineral Resource – Amended April 23, 2026 | 84 |
| |
Sample A-1 had gold and silver calculated heads of 8.24 g/t and 3.28 g/t, respectively, while Sample B-1 had gold and silver calculated heads of 3.32 g/t and 1.64 g/t, respectively. For Sample A-1, 7% of the gold reported to the +150-mesh fraction, which represented only 1.8% of the mass. For Sampe B-1, 8% of the gold reported to the +150-mesh fraction, which represented only 2.7% of the mass. These show uneven distributions of gold and silver between the two size fractions, with the discrepancies larger for silver. In this QP’s opinion, the disproportionate distribution of gold and silver in the coarser fraction indicates the presence of large gold and silver particles, contrary to METCON’s interpretation for gold.
METCOM subjected the two samples to gravity concentration testing using an Archimedes Wheel concentrator followed by flotation of the gravity concentration tailing. The results of the tests are shown in Table 13-10.
Table 13-10. Results of METCON’s Gravity and Flotation Tests on Goldwedge Samples A-1 and B-1 (2007).
| Sample ID | Test Description | PRODUCTS | Mass | Assays, g/t | Distribution, % | ||
| % | Au | Ag | Au | Ag | |||
| A-1 | Gravity Conc & Flotation of Gravity Tailing | (1) Gravity Concentrate | 3.78 | 105.27 | 59.90 | 39.45 | 46.16 |
| (2) Rougher Flotation Concentrate | 65.64 | 8.66 | 3.70 | 56.31 | 49.48 | ||
| (3) Rougher Tail | 30.58 | 1.40 | 0.70 | 4.24 | 4.36 | ||
| Calculated Head | 100 | 9.70 | 4.72 | 100 | 100 | ||
| Assayed Head | 8.34 | 3.28 | |||||
| (2+3) Gravity & Rougher Tails | 96.22 | 6.35 | 2.75 | 60.55 | 53.84 | ||
| (1+2) Total Concentrate | 69.42 | 13.92 | 6.76 | 95.76 | 95.64 | ||
| B-1 | Gravity Conc & Flotation of Gravity Tailing | Gravity Concentrate | 4.28 | 19.70 | 7.10 | 19.57 | 25.47 |
| Rougher Flotation Concentrate | 61.94 | 5.35 | 1.30 | 76.90 | 67.46 | ||
| Rougher Tail | 33.78 | 0.45 | 0.25 | 3.53 | 7.08 | ||
| Calculated Head | 100 | 4.11 | 1.14 | 100 | 100 | ||
| Assayed Head | 3.31 | 1.64 | |||||
| (2+3) Gravity & Rougher Tails | 95.72 | 3.62 | 0.93 | 80.43 | 74.53 | ||
| (1+2) Total Concentrate | 66.22 | 6.28 | 1.68 | 96.47 | 92.92 | ||
Recoveries of gold and silver into the gravity concentrate were good for A-1 but less so for B-1, probably due to the lower grade. Both gravity concentrates had mass pulls below 5% and upgraded the assays from 4.8 times to 12.7 times. These gravity concentration results support the idea that a gravity circuit is called for as part of the mill to process this material.
The flotation results were not as good as the gravity concentration results. The mass pulls were over 60% (in red) and the gold and silver assays were not upgraded much at all. The reason seems to be the use of too much and too many reagents, as shown in Table 13-11 below, such that more than half of the solids were activated and floated. It is probable that there were not enough floatable solids in the samples, for example sulphides, to create a stable froth, which prompted the laboratory to hit them with so much reagents. While these results are unusable, they still provide an important guidance to the processing behavior of this material to be considered in future testing as well as in mill design.
| Manhattan Mineral Resource – Amended April 23, 2026 | 85 |
| |
Table 13-11. Reagent Scheme Used in METCON Flotation Tests (2007).
| Reagent | Purpose | Dosage, g/t |
| PAX | Collector | 48 |
| A-3894 | Collector | 18 |
| A-3477 | Collector | 26 |
| A-407 | Collector | 25 |
| AF-25 | Frother | 24 |
| AF-65 | Frother | 41 |
| CuSO4 | Activator | 900 |
| 13.2.7 | March 2012 McClelland Tests for Manhattan Mining Company |
The last known metallurgical tests were done at McClelland Laboratories in 2012 on material identified as “Sample #6” from the Goldwedge deposit. The material assayed around 0.2 oz Au/st was tested for direct cyanidation, gravity concentration, flotation of gravity concentration tailing, and cyanidation of gravity concentration tailing. All tests were conducted at a grind of P80 = 200 mesh.
The gravity concentration test was performed on a laboratory Knelson concentrator for the rougher stage and by hand panning for the cleaner stage (McPartland, Dec 2024). Table 13-15 below presents the results of the gravity concentration test, showing that about 50% of the gold can be recovered into the gravity cleaner concentrate at a grade of 60.1 oz/st (2,060 g/t) – a significant upgrade from 0.1824 oz/st (6.25 g/t).
Table 13-12: Gravity Concentration Test Results, Goldwedge Sample #6, P80 = 200 Mesh Feed Size
| Product | Weight | Cumulative | Assays | Au Distribution |
| % | Wt % | oz Au/st | % | |
| Gravity Rougher Concentrate | 0.73 | 15.405 | 60.4 | |
| Gravity Cleaner Concentrate | 0.15 | 0.15 | 60.085 | 49.4 |
| Gravity Cleaner Tailing | 0.58 | 0.73 | 3.456 | 11.0 |
| Gravity Rougher Tailing | 99.27 | 100.00 | 0.0728 | 39.6 |
| Composite | 100.00 | 0.1824 | 100.0 |
| Manhattan Mineral Resource – Amended April 23, 2026 | 86 |
| |
Another composite sample was tested through a series of gravity concentration followed by flotation of the gravity concentration tailing. The flotation results in Table 13-13 shows 81.8% of gold can be recovered in a flotation cleaner concentrate and 15% of the gold was lost to the rougher tailing. The overall mass pull was 9.67% into the cleaner concentrate, resulting in a concentrate grade of 0.59 oz/st.
It is not clear what the conceptual processing scheme was for the gravity cleaner tailing, which was not included in the flotation test, and for the flotation cleaner tailing. Considering only the cleaner concentrates from the two processes, the overall recovery would be 81.8% (50.1% + 31.7% in Table 13-14). To improve that recovery, (a) the gravity cleaner tailing should be included in the flotation feed, and (b) the flotation cleaner stage should be followed by a cleaner scavenger stage.
Table 13-13: Flotation of Rougher Tailing from Gravity Concentration Test on Goldwedge Sample #6.
| Product | Weight | Cumulative | Assays, | Au Distribution | |
| % | Wt % | oz Au/ton | % | Cum % | |
| Flotation Cleaner Concentrate. | 9.67 | 9.67 | 0.5892 | 81.8 | 81.8 |
| Flotation Cleaner Tailing | 15.31 | 24.98 | 0.0143 | 3.1 | 84.9 |
| Rougher Tailing | 75.02 | 100.00 | 0.0140 | 15.1 | 100.0 |
| Composite | 100.00 | 0.0697 | 100.0 | ||
Table 13-14: Overall Mass Balance - Gravity/Flotation Test Series
| Product | Au Unit | Au Distribution | Cumulative |
| % | % | ||
| Gravity Cleaner Concentrate | 0.09013 | 50.1 | 50.1 |
| Gravity Cleaner Tailing | 0.02004 | 11.2 | 61.3 |
| Flotation of Rougher Tailing | |||
| Float Cleaner Concentrate | 0.05698 | 31.7 | 93.0 |
| Float Cleaner Tailing | 0.00219 | 1.2 | 94.2 |
| Final Tail | 0.01050 | 5.8 | 100.0 |
| Composite | 0.17984 | 100.0 |
| Manhattan Mineral Resource – Amended April 23, 2026 | 87 |
| |
A third composite sample was subjected to gravity concentration followed by cyanidation of the gravity concentration rougher tailing. The results of these tests are presented in Figure 13-4 and Table 13-15. Also shown are the results of a whole-ore cyanidation test.
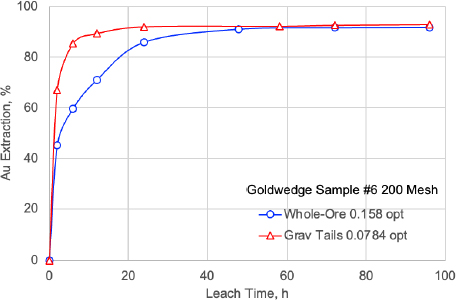
Figure 13-4: Cyanide Leaching Kinetics of 200-mesh Goldwedge Sample #6, McClelland Laboratories, 2012.
The extraction of gold from the gravity tailing happens fast, levelling off at around 10 hours and essentially complete after 24 hours. The recovery achieved was 93%. The aggregate gold recovery to the gravity concentrate and pregnant leach solution was 47.9% + 38.4% or 86.3% (see Table 13-15). However, if the gravity cleaner tailing were added to the leach feed and applying the same leach recovery, the aggregate Au recovery would have been approximately 96%.
The kinetics of the whole-ore leach was slower compared to the gravity tailing leach (also in Figure 13-4). The extraction essentially reached its target around 60 hours. The final recovery of 91.7% is good but probably on the low side due to the poor accountability of gold in the test. The calculated head of 0.158 oz/st is more than 25% lower than the assayed head of 0.1993 oz/st. Based on solids assays, the leach recovery would have been 93.4.
The slower leach kinetics for whole-ore leach may be due to the presence of large gold particles that were not removed by gravity concentration. The micrographs in Figure 13-5 show large, flattened gold particles in the gravity concentrate, one of which is almost a millimeter long. These large particles may take longer to leach depending on the test conditions. The results indicate that a gravity concentration stage with intensive cyanidation may be an important component of the mill that will process Goldwedge material.
| Manhattan Mineral Resource – Amended April 23, 2026 | 88 |
| |
Table 13-15: Overall Mass Balance - Gravity/Cyanidation Test Series and Whole-Ore Leach.
| Product | Au Unit | Au Distribution | Cumulative |
| % | % | ||
| Gravity Cleaner Concentrate | 0.09013 | 47.9 | 47.9 |
| Gravity Cleaner Tailing | 0.02004 | 10.7 | 58.6 |
| Extracted, CN of Grav Ro. Tailing | 0.07227 | 38.4 | 97.0 |
| Cyanidation Tailing | 0.00556 | 3.0 | 100.0 |
| Composite | 0.188 | 100.0 | |
| Whole-Ore Leach | 0.1444 | 91.7 | 91.7 |
| Whole-Ore Leach Tailing | 0.0131 | 8.3 | 100.0 |
| Composite | 0.1575 | 100.0 |
| Manhattan Mineral Resource – Amended April 23, 2026 | 89 |
| |
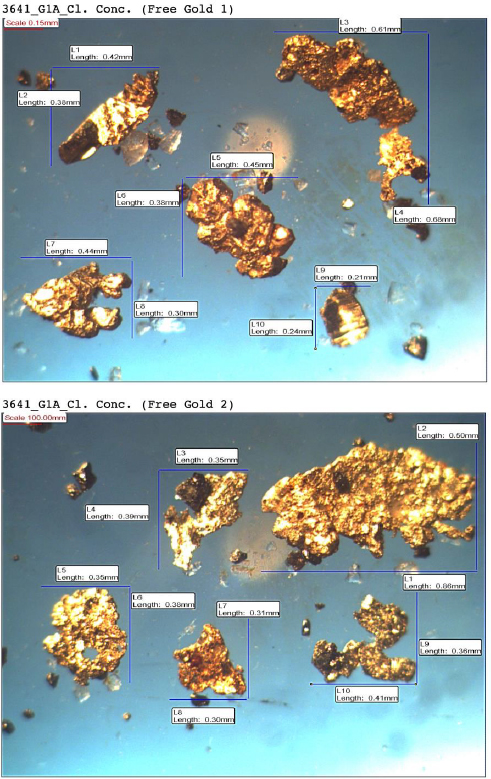
Figure 13-5: Micrographs of large free gold particles seen in the gravity concentrate, McClelland Laboratories 2012.
| Manhattan Mineral Resource – Amended April 23, 2026 | 90 |
| |
| 14.0 | MINERAL RESOURCE ESTIMATE |
| 14.1 | Mineral Resource Statement |
The Mineral Resource statement for the Project includes estimates for the Goldwedge, Mustang Hill, West Pit, USD Pit, and East Pit areas (Figure 14-1) All stated Resource estimates are expressed in contained ounces.
The Mineral Resources are stated in accordance with CIM Definition Standards in NI 43-101 and have an effective date of June 4th, 2025. The Mineral Resources presented here were prepared to support continued exploration and project work on the Property.
Mineral Resources were reported below the current LiDAR topographic surface and are contained within economically constrained pit shells generated using the Hochbaum Pseudoflow algorithm implemented in Datamine’s Studio NPVS. Open pit Mineral Resources are reported using a 0.3 g/t gold-only cutoff grade. The Mineral Resources are classified as Inferred based on drill spacing and geological continuity; Measured and Indicated Resources are not reported. Table 14-1 shows the classified Mineral Resources for the Property.
Table 14-1: Mineral Resource Statement
| Zone | Classification | Tonnage | Gold Grade | Gold Contained |
| kt | g/t | koz | ||
| East Pit | Inferred | 3,552 | 0.81 | 93 |
| Goldwedge | Inferred | 2,981 | 1.48 | 142 |
| Mustang Hill | Inferred | 884 | 1.00 | 28 |
| USD Pit | Inferred | 770 | 1.14 | 28 |
| West Pit | Inferred | 10,115 | 1.37 | 448 |
| Total | Inferred | 18,342 | 1.26 | 740 |
Notes for Table 14-1:
| 5. | Open Pit Resource estimates are based on economically constrained open pits generated using the Hochbaum Pseudoflow algorithm in Datamine’s Studio NPVS and the following optimization parameters (all dollar values are in US dollars): |
| ● | Inferred Resource classification only. |
| ● | $2,500/ounce gold price. |
| ● | Mill recoveries of 90% for gold. |
| ● | 50 degree pit slope angle for in-situ rock, 30 degree pit slope angle for overburden. |
| ● | Mining costs of $3.00 per tonne for both ore and waste. |
| ● | Milling costs of $15.00 per tonne processed. |
| ● | G&A cost of $3.50 per tonne processed. |
| ● | 2% royalty costs. |
| ● | A 0.3 g/t gold only cutoff was applied for Resource reporting. |
| ● | Ore loss and dilution not applied. |
| 6. | Mineral Resources are not Mineral Reserves (as that term is defined in the CIM Definition Standards) and do not have demonstrated economic viability. |
| Manhattan Mineral Resource – Amended April 23, 2026 | 91 |
| |
Figure 14-1: Plan view showing 2025 Block Model, Resource pit, and Resource reporting zone (Loury, 2025)
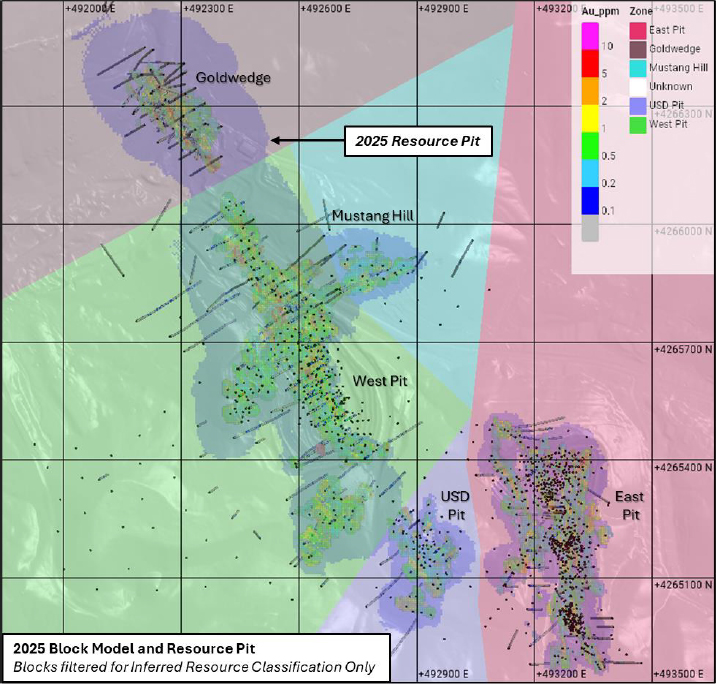
Notes:
See Table 14-1 notes for optimization parameters.
| 14.2 | Database |
The Project database is maintained in a Microsoft Access database, which contains collar locations, downhole survey data, qualitative logging information, and assay and multielement geochemical data, among other items. Data for geologic modelling and resource estimation purposes were exported as .csv files and then imported into Leapfrog Geo v.2024.1.3 and ioGAS v.8.3 for analysis. The database used for this report includes drillholes completed on or before December, 2024. Drilling was completed by a variety of operators between 1973 and 2024, including CanAm Minerals Company, Echo Bay Mines, Freeport-McMoran, Houston International/Houston Oil and Minerals Corporation, Round Mountain Gold Corporation, Royal Standard Minerals Inc., Scorpio Gold Corporation, Summa Corporation, and Tenneco Minerals Company.
| Manhattan Mineral Resource – Amended April 23, 2026 | 92 |
| |
The database export covering the main Project area contains 1,568 drillholes, of which 1,341 were included in the final resource estimation dataset (Figure 14-2). Of this subset, 6.8% are diamond drillholes (DD), 11.9% are reverse circulation drillholes (“RC”), 39% are rotary drillholes (“RD”), 1.6% are top hammer percussion drillholes (“TH”), and 33.4% of drillholes are of an unknown drill type. Blastholes (“BH”) and rotary air blast (“RAB”) drillholes were also included in the dataset but were used only for validation purposes and are not used in the final block model estimation. 227 holes, or 14.5% of drillholes in the total database export, were excluded from the MRE dataset either due to uncertainty in assay, survey, or collar information for historical holes, or due to the drillhole location falling outside the resource model extents. The final, filtered database for use in resource estimation contains a total of 42,500 accepted gold assay records, with a total of 14,452 records excluded. Drilling statistics for the final estimation dataset are presented in Table 14-2.
| Manhattan Mineral Resource – Amended April 23, 2026 | 93 |
| |
Figure 14-2: Drill collar locations and Resource Pit Outline (Loury, 2025)
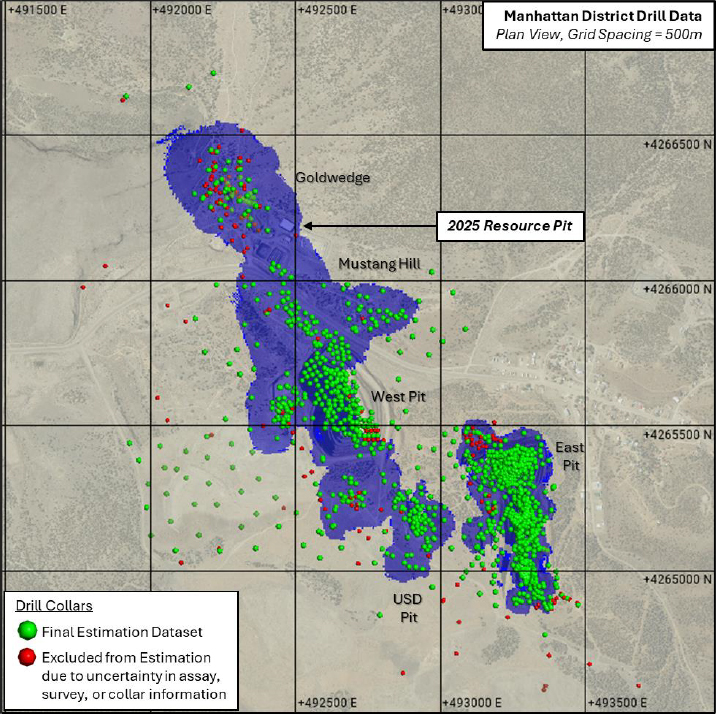
| Manhattan Mineral Resource – Amended April 23, 2026 | 94 |
| |
Table 14-2: Drillhole database summary statistics
| Drill Type/Company | Drillhole Count |
| Blasthole | 97 |
| Summa Corporation | 53 |
| Tenneco Minerals Company | 44 |
| Diamond | 91 |
| Houston Oil & Minerals Corporation | 9 |
| Round Mountain Gold Corp. | 7 |
| Royal Standard Minerals INC | 2 |
| Scorpio Gold Corp. | 73 |
| Rotary Air Blast | 8 |
| Houston Oil & Minerals Corporation | 8 |
| Reverse Circulation | 159 |
| CanAm Minerals Company (subsidary of Echo Bay Mines, Ltd.) | 1 |
| Echo Bay Mines, Ltd. | 12 |
| Freeport Exploration Company | 5 |
| Freeport-McMoRan | 26 |
| Round Mountain Gold Corp. | 15 |
| Scorpio Gold Corp. | 51 |
| Tenneco Minerals Company | 49 |
| Rotary | 520 |
| CanAm Minerals Company | 203 |
| Freeport Exploration Company | 1 |
| Houston International Minerals Corporation | 197 |
| Houston Oil & Minerals Corporation | 112 |
| Summa Corporation | 7 |
| Top Hammer Percussion | 21 |
| Summa Corporation | 21 |
| Unknown | 445 |
| Houston International Minerals Corporation | 5 |
| Round Mountain Gold Corp. | 6 |
| Scorpio Gold Corp. | 10 |
| Summa Corporation | 314 |
| Tenneco Minerals Company | 110 |
| Grand Total | 1,341 |
Notes:
| 1. | Company was inferred by the year in which drilling was completed for drillholes in the Scorpio database which did not have the Company name recorded directly on drill logs. |
| Manhattan Mineral Resource – Amended April 23, 2026 | 95 |
| |
| 14.3 | Mineral Resource Estimate |
The MRE block model was prepared by Patrick Loury of Loury Geoscience Consulting LLC and Matthew Dumala, with input and review by Scorpio staff. Mr. Dumala is a qualified person with respect to mineral resource estimation under NI 43-101 and is independent of Scorpio Gold Corporation, as there is no affiliation between Mr. Dumala and Scorpio except that of an independent consultant/client relationship. Mr. Dumala is not aware of any unusual environmental, permitting, legal, title, taxation, socio-economic, marketing, or political factors that may materially affect the mineral resources as of the date of this report.
This report presents gold resources for the Manhattan property that have an effective date of June 4th, 2025, the date which the completed drillhole database was delivered by the Company. Geologic and estimation domains were constructed using Leapfrog Geo v. 2024.1.3, including input from analyses completed in ioGAS v.8.3. Geostatistical evaluations and EDA, including topcut selection, declustering, and variography, were completed using Snowden Supervisor v.9.0. Resource estimation was prepared using Leapfrog EDGE v.2024.1.3. Pit optimization was completed by Fuse Advisors using Datamine NPVS software.
A single 5x5x5m block model was generated for use in open pit optimization. Estimation parameters are described in detail below.
| 14.3.1 | Data Preparation |
Data provided by Scorpio for the estimation includes various exploration data related to the Project, including summary reports, geologic maps, current and pre-mine topography surfaces, underground workings wireframes, and drillhole data which includes collar locations, downhole surveys, lithology logs, and gold assay data. The information provided spans a variety of operators from 1973 to 2024, including CanAm Minerals Company, Echo Bay Mines, Freeport-McMoran, Houston International/Houston Oil and Minerals Corporation, Round Mountain Gold Corporation, Royal Standard Minerals Inc., Scorpio Gold Corporation, Summa Corporation, and Tennaco Minerals Company.
| 14.3.1.1 | Drilling |
Drillhole data used in the MRE were checked for overlapping sample intervals, negative or invalid values, and irregular downhole survey deviation in Leapfrog Geo. All errors were assessed and corrected prior to completing statistical analysis and estimation.
Drillhole collars were also visually checked against the most current topographic surface or pre-mine topography, depending on the date which the drilling was completed. Most collars are set to these topographic surfaces, with minor deviations in some collars attributed to local variations in the topography. Collar elevations were not adjusted for drillholes which fall within the extents of existing open pits and that were completed during active mining operations.
Gold assay values less than the detection limit were assigned a value equal to half of the detection limit value, which, depending on the analysis date and laboratory, was 0.003 ppm, 0.005 ppm, 0.034ppm, 0.069 ppm, 0.086 ppm, or 0.171 ppm. Null values for Au were assigned for all intervals with no recovery or where historical mine workings, voids, or backfill material were encountered.
| Manhattan Mineral Resource – Amended April 23, 2026 | 96 |
| |
| 14.3.2 | Wireframes |
| 14.3.2.1 | Topography |
Topography data for the Project was gathered by Pioneer Exploration in July, 2024. No significant disturbance (mining) has occurred in the Project area since. Data were collected by airborne LiDAR survey and the resulting bare earth surface was used to define the topographic limits for the Project geologic model and MRE block model discussed below.
A pre-mine topographic surface was also provided by Scorpio to flag overburden/dump material to the block model and to estimate historically mined out volumes. The pre-mine topography surface was reviewed in 3D and is generally consistent with the LiDAR topography surface in areas which have not been disturbed by mining activity. While lower resolution than the LiDAR topography, it was therefore deemed to be sufficiently accurate for generating dump volumes.
| 14.3.2.2 | Historical Underground Workings |
Historical mine workings solids were provided by Rangefront Geological Services and were generated based on digitized and georeferenced historical maps of the underground workings (Figure 14-3). A detailed survey using LiDAR or other methods has not been completed for historical underground workings on the Property and should be completed prior to future resource estimates.
The proportion of a block which lies within the historical workings wireframes was calculated for model depletion and reporting purposes and is recorded in the UG_Workings_Pct block model variable. Blocks with UG_Workings_Pct values greater than 0 were then flagged as ‘mined out’ and were assigned a density of 0.0 g/cm3 and a gold grade of 0.0 g/t.
Sensitivity work assuming a mined-out halo around the workings solid was also performed. The overall resource was not materially sensitive to these estimates.
Figure 14-3: Underground workings wireframes and block model flag (variable: UG_Workings_Pct) (Loury, 2025)
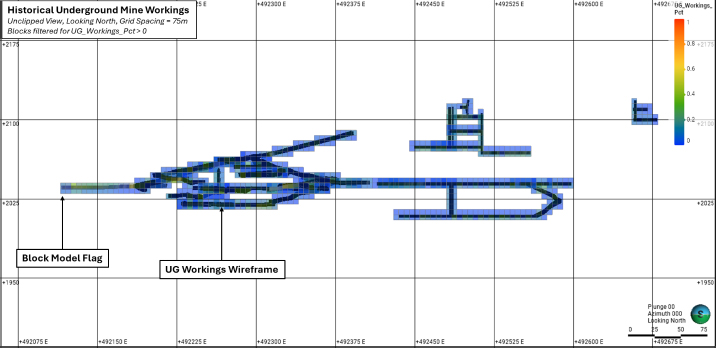
Notes:
All blocks with UG Workings_Pct values greater than 0 (all blocks visible in the image above) were assigned a density of of 0.0 g/cm3 and a gold grade of 0.0 g/t.
| Manhattan Mineral Resource – Amended April 23, 2026 | 97 |
| |
| 14.3.2.3 | Lithology and Faults |
Lithology and fault wireframes were generated in Leapfrog Geo using interval selection based on a merged table containing all available qualitative logging data (lithology, oxidation, structure) and Au assays. Where available, multi-element geochemistry was also used to inform lithology modeling. Geographic Information Systems (GIS) data from USGS geologic mapping (Shawe, 1999) and previous operators, including lithologic contacts and structural point data, were also applied as direct inputs to the modeled surfaces. All lithology and fault wireframes were manually edited based on geologic interpretations by Scorpio geologists and were validated against digitized cross sections completed by previous operators in key areas before use in mineral resource estimation.
Six faults were activated in the geologic model where major offsets in lithology are apparent and can be grouped into three sets, from oldest to youngest; (1) the moderately west-dipping Little Gray and Nellie Gray faults repeat Cambrian-Ordovician stratigraphic contacts in multiple drillholes and in surface mapping across the district. The West Pit and USD Pit are both centered on mineralization associated with this fault set. (2) the Northwest-striking, near-vertical Reliance fault appears to truncate the Little Gray fault to the west. Underground workings at the Goldwedge deposit and the historical Reliance mine are centered primarily on this fault. (3) the northeast-striking, steeply dipping Brougher and Brougher-Parallel normal faults appear to offset faults from groups 1 and 2. The Brougher fault appears to control the majority of mineralization at Mustang Hill. (4) the steeply northeast-dipping Caldera Margin fault places Cambrian and Ordovician sediments in its footwall against Tertiary volcanics of the Manhattan Caldera in its hanging wall and appears to truncate faults from groups 1-3 (Figure 14-4). Faults in groups 1, 2, and 3 appear to be pre-syn mineral and are key district-scale controlling structures for Au mineralization. Several north- to northwest-striking, steeply dipping faults which control mineralization in the East pit were also built and were used to guide estimation domain construction but were not activated in the model because they do not show appreciable offset. All fault and lithology (Figure 14-5) wireframes were snapped to drillhole data and were checked for closure and consistency prior to resource estimation. Seven major lithologies were modeled and are outlined in Table 14-3.
| Manhattan Mineral Resource – Amended April 23, 2026 | 98 |
| |
Figure 14-4: Manhattan-Goldwedge Fault Model (Loury, 2025)
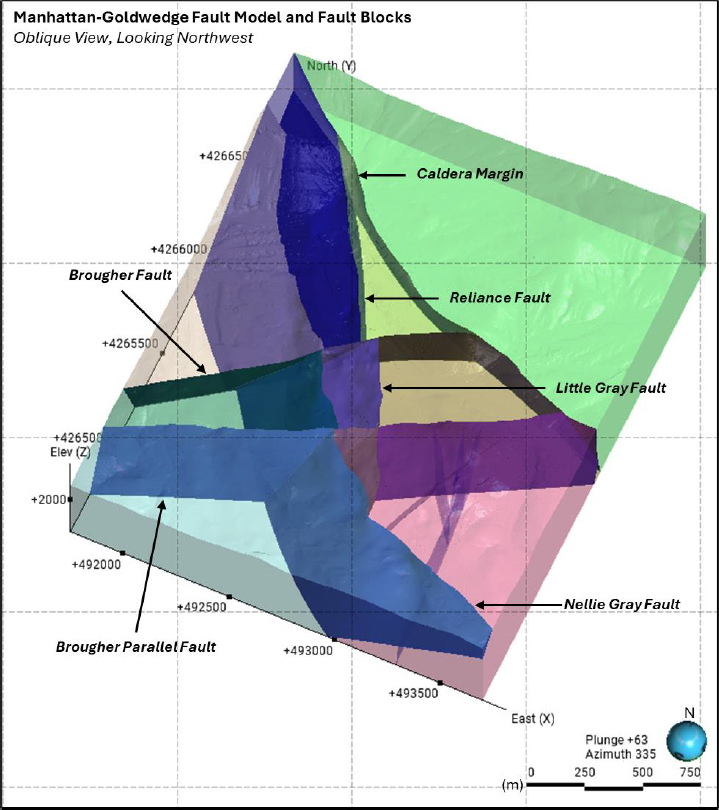
| Manhattan Mineral Resource – Amended April 23, 2026 | 99 |
| |
Table 14-3: Lithology Codes
| Code | Lithology | Description |
| 1 | Cgs | Cambrian Goldhill Formation sediments |
| 2 | Cgl | Cambrian Goldhill Formation limestone |
| 3 | Ozl | Ordovician Zanzibar Formation limestone |
| 4 | Oza | Ordovician Zanzibar Formation argillites |
| 5 | Tr | Tertiary rhyolite |
| 6 | Qal | Quaternary alluvium |
| 7 | Dump | Overburden/dump material |
Figure 14-5: Manhattan-Goldwedge Lithology model, excluding overburden/dump material (Loury, 2025)
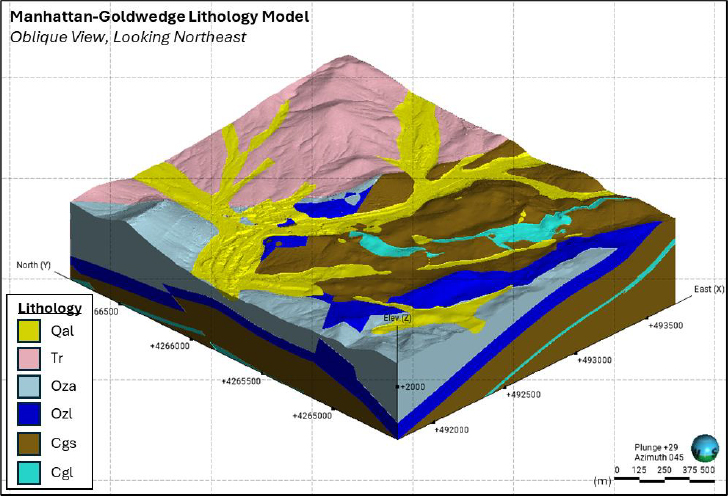
| 14.3.2.4 | Overburden |
An overburden solid was generated for the Manhattan-Goldwedge area in Leapfrog Geo by calculating the volume between the current LiDAR topography surface and the pre-mine topography surface delivered by Scorpio (Figure 14-6). The resulting solid was flagged to the block model under the Rock variable and was assigned a grade of 0.0 g/t Au and a density of 1.99 g/cm3.
| Manhattan Mineral Resource – Amended April 23, 2026 | 100 |
| |
Figure 14-6: Manhattan-Goldwedge Overburden Model (Loury, 2025)
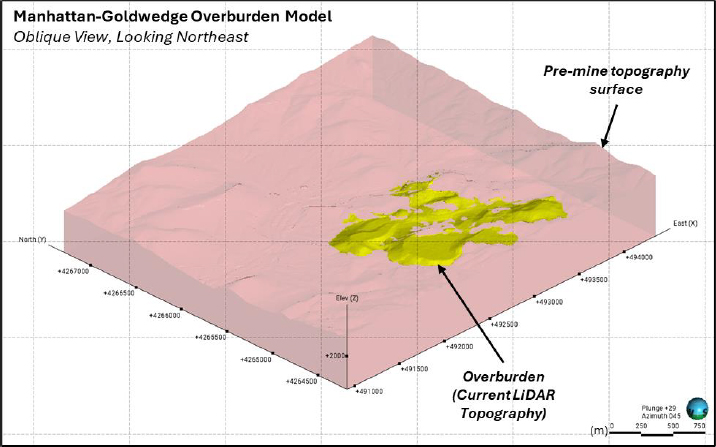
| 14.3.2.5 | Mineralization |
After testing several thresholds, a cutoff grade of 0.2 g/t Au was selected for the construction of mineralized estimation domains in the block model. Grade shells were generated using the Indicator Interpolant tool and spherical interpolant function in Leapfrog Geo, with geometry and continuity controlled by a structural trend generated from mineralized structures built in the fault model (Figure 14-4). Manual edits to the grade shell volumes were also completed where necessary to reflect the interpreted continuity of mineralization as determined by Company geologists. Grade shell volumes were subsequently divided based on parent structure and major changes in orientation to generate the final mineralized domains for estimation (Figure 14-7 through Figure 14-10; and Table 14-4). In addition to the mineralized domains (those with ‘MIN’ prefix), a ‘Background’ domain was also generated to estimate gold grades outside the 0.2 g/t Au grade shells. This domain was built using a 150m distance buffer to drill traces within the block model extents.
| Manhattan Mineral Resource – Amended April 23, 2026 | 101 |
| |
Figure 14-7: Mineralized domains used to constrain grade estimation in the Manhattan-Goldwedge block model (Loury, 2025)
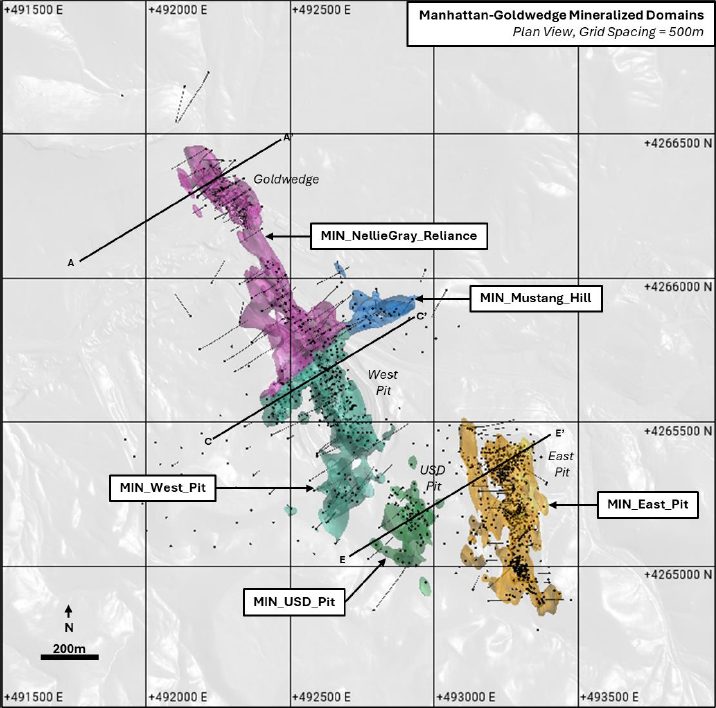
| Manhattan Mineral Resource – Amended April 23, 2026 | 102 |
| |
Figure 14-8: Section A-A’ showing the MIN_NellieGray_Reliance domain (Loury, 2025)
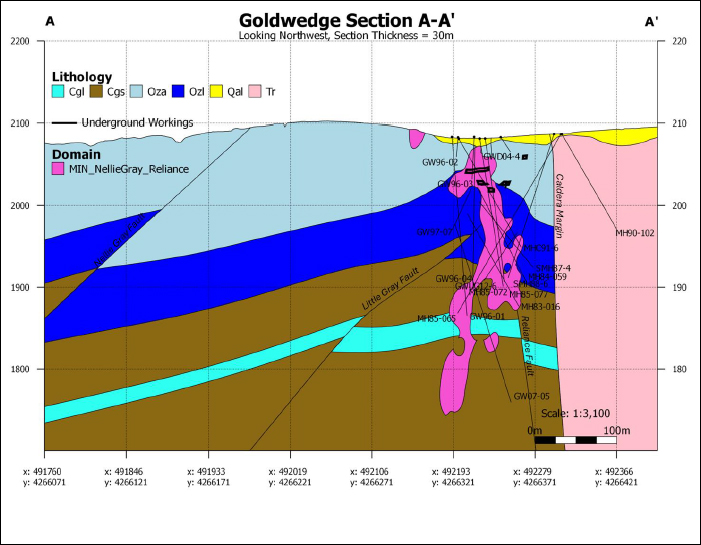
| Manhattan Mineral Resource – Amended April 23, 2026 | 103 |
| |
Figure 14-9: Section C-C’ showing the MIN_West_Pit estimation domain (Loury, 2025)
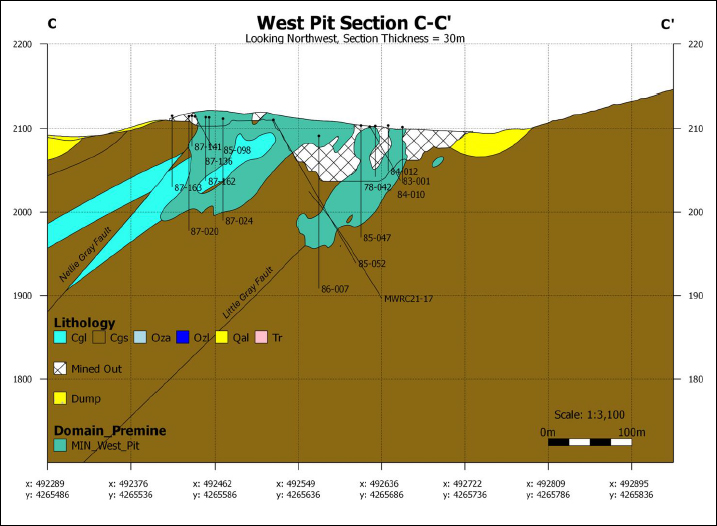
| Manhattan Mineral Resource – Amended April 23, 2026 | 104 |
| |
Figure 14-10: Section D-D’ showing the MIN_East_Pit and MIN_USD_Pit estimation domains (Loury, 2025)
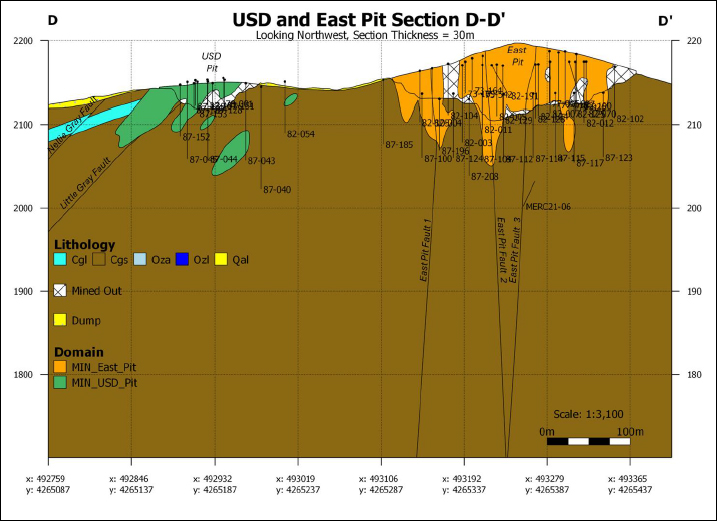
Table 14-4: Estimation domains
| Domain | Description |
| MIN_East_Pit | >0.2 g/t Au indicator grade shell, controlled by NNW-striking high-angle structures previously mined in the Manhattan East Pit. |
| MIN_Mustang_Hill | >0.2 g/t Au indicator grade shell, controlled by the Brougher fault. |
| MIN_NellieGray_Reliance | >0.2 g/t Au indicator grade shell, controlled by the Nellie Gray fault and Reliance fault. Comprises bulk of mineralization mined in the Reliance and Goldwedge underground mines. Separated from MIN_West_Pit by Brougher fault. |
| MIN_West_Pit | >0.2 g/t Au indicator grade shell, controlled by the Little Gray fault and Nellie Gray fault. Comprises bulk of mineralization mined in the Manhattan West Pit. Separated from MIN_NellieGray_Reliance by Brougher fault. |
| MIN_USD_Pit | >0.2 g/t Au indicator grade shell, controlled by the the Little Gray fault and Nellie Gray fault. Comprises bulk of mineralization mined in the USD Pit. |
| BACKGROUND | Non-mineralized background, outside >0.2 g/t Au indicator grade shell. |
| Manhattan Mineral Resource – Amended April 23, 2026 | 105 |
| |
| 14.3.3 | Exploratory Data Analysis |
| 14.3.3.1 | Composites |
The most frequent sample interval in the assay data Table is 1.524 meter, corresponding to the standard 5 ft sampling length used in reverse circulation drilling completed across the Project. This value corresponds to the Q1, Q2, and Q3 interval lengths in the raw assay data Table, and as such was selected as the compositing length for estimation.
Composites were generated to respect the domain boundaries presented in Table 14-4. Figure 14-11shows a global comparison between raw assay interval lengths and composited data used for estimation.
Figure 14-11: Global compositing interval length statistics for composites used in estimation (Loury, 2025)
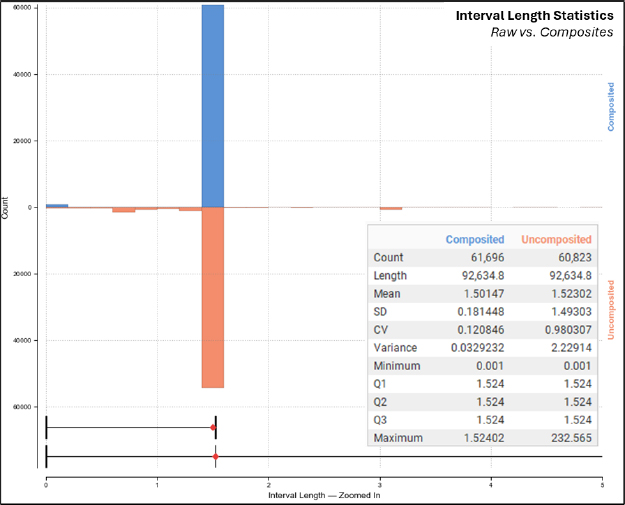
| 14.3.3.2 | Contact Analysis |
Contact profiles were generated for Au across all estimation domains to assess grade interpolation limits between adjacent domains (Figure 14-12). Based on the analysis of composited data, all contacts between mineralized domains (MIN prefix) and the Background domain were treated as hard. Soft boundaries were applied between contacting mineralized domains, with a maximum soft boundary search distance set to the direction 1 search distance of the primary domain. Contact analysis results for all domains are shown in Table 14-5.
| Manhattan Mineral Resource – Amended April 23, 2026 | 106 |
| |
Figure 14-12: Contact plot examples from the MIN_West_Pit domain (Loury, 2025)
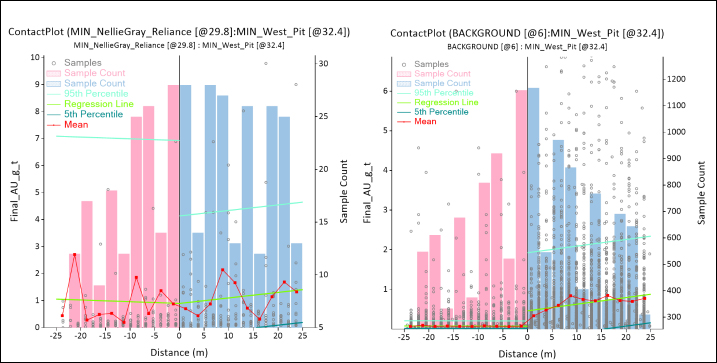
Table 14-5: Contact analysis summary
| Domain | Soft Boundary | Soft Boundary search max. (m) |
| MIN_East_Pit | - | - |
| MIN_Mustang_Hill | MIN_West_Pit, MIN_NellieGray_Reliance | 80 |
| MIN_NellieGray_Reliance | MIN_West_Pit, MIN_Mustang_Hill | 80 |
| MIN_West_Pit | MIN_NellieGray_Reliance, MIN_Mustang_Hill | 80 |
| MIN_USD_Pit | - | - |
| BACKGROUND | - | - |
| 14.3.3.3 | Outlier Management and Topcut Strategy |
Capping analysis was completed on composited data for Au across all estimation domains using histograms, mean-variance plots, cumulative metal plots, and disintegration analysis considering step changes of 10% and 15% between the assay values of adjacent data points on log-probability plots (Figure 14-13 and Figure 14-14). Capped samples were then evaluated in 3D within each domain to ensure that the samples were not clustered and represented true outliers. Inverse distance cubed (ID3) estimates were also completed within each mineralized domain (MIN prefix), using both the capped and uncapped datasets to assess the impact to average grade and contained metal (Table 14-6). Metal loss due to capping is less than 10% for all domains aside from MIN_USD_Pit, in which the metal loss is due to one extremely high-grade outlier in the uncapped dataset.
| Manhattan Mineral Resource – Amended April 23, 2026 | 107 |
| |
Figure 14-13: Topcut analysis for the MIN_West_Pit estimation domain (Loury, 2025)
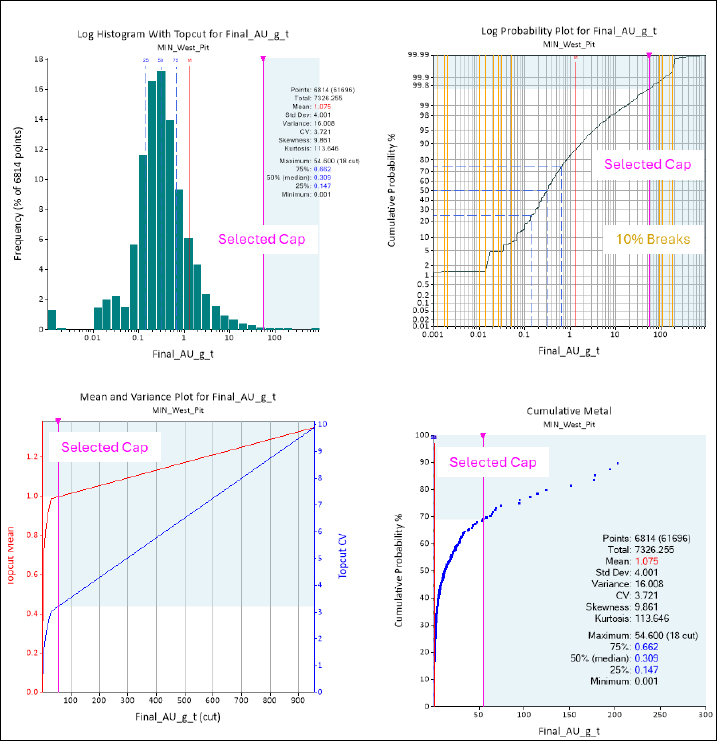
| Manhattan Mineral Resource – Amended April 23, 2026 | 108 |
| |
Figure 14-14: Topcut analysis for the MIN_NellieGray_Reliance estimation domain (Loury, 2025)
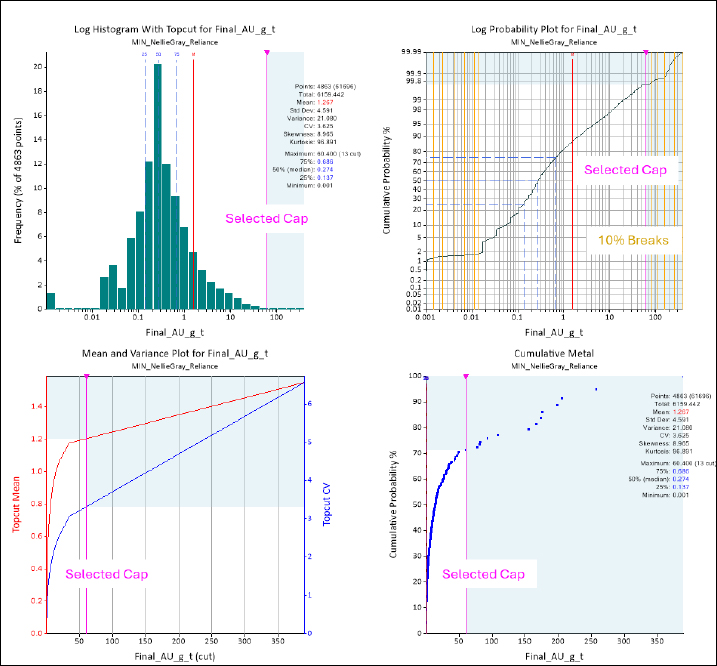
| Manhattan Mineral Resource – Amended April 23, 2026 | 109 |
| |
Table 14-6: Topcut statistics for domains used in estimation
| Domain | Composited Data | Capped vs. Uncapped Estimate Comparison | ||||||||||||
| Max Uncapped (gpt) | Cap (g/t) | Percentile | Total samples | Capped samples | Mean Uncapped (Au_g/t) | Mean Capped (Au_g/t) | CV Uncapped | CV Capped | Lost (%) | Au_ID3_ UNCAPPED (Au_g/t) | Au_ID3_ CAPPED (Au_g/t) | Lost (%) | Total Domain Tonnes | |
| MIN_East_Pit | 529.7 | 22.6 | 99.7% | 12583 | 43 | 0.97 | 0.83 | 6.58 | 2.45 | 14.4% | 0.62 | 0.55 | 9.9% | 9,766,408 |
| MIN_Mustang_ Hill | 33.91 | 16.4 | 99.6% | 506 | 2 | 0.86 | 0.83 | 2.49 | 2.07 | 3.5% | 0.72 | 0.71 | 1.3% | 3,364,550 |
| MIN_NellieGray_ Reliance | 389.32 | 60.4 | 99.7% | 4863 | 13 | 1.55 | 1.27 | 6.56 | 3.62 | 18.1% | 1.00 | 0.95 | 4.8% | 26,226,873 |
| MIN_West_Pit | 955.08 | 54.6 | 99.8% | 6814 | 18 | 1.35 | 1.08 | 10.68 | 3.36 | 20.0% | 0.93 | 0.85 | 8.3% | 13,365,541 |
| MIN_USD_Pit | 89.45 | 21.4 | 99.5% | 903 | 3 | 0.68 | 0.57 | 5.26 | 2.95 | 16.2% | 0.69 | 0.60 | 12.9% | 3,173,344 |
| BACKGROUND | 94.44 | 6 | 99.9% | 35189 | 32 | 0.09 | 0.08 | 6.85 | 3.37 | 11.1% | 0.08 | 0.08 | 1.3% | 39,402,620 |
| Manhattan Mineral Resource – Amended April 23, 2026 | 110 |
| |
| 14.3.4 | Variography |
Variography was completed for Au within mineralized estimation domains using Snowden Supervisor v.9.0. Variogram modelling was completed on normal scores-transformed data and variograms were modeled using as few structures as possible, with a nugget obtained from down hole variograms and generally 2 spherical structures used. The back-transformation of normal scores variograms to original units was then completed for variograms in each domain using 90 Hermite polynomials, and the orientation of the variograms were checked against the mineralization orientation for each domain in 3D prior to use in estimation. Search orientations determined from variography were used in both the OK estimates and in the final ID3 estimates used for resource reporting. Examples from several domains are shown in Figure 14-15 and Figure 14-16, with results for all domains presented in Table 14-7.
| Manhattan Mineral Resource – Amended April 23, 2026 | 111 |
Figure 14-15: Normal scores variography and backtransform model for gold estimation in the MIN_West_Pit domain (Loury, 2025)
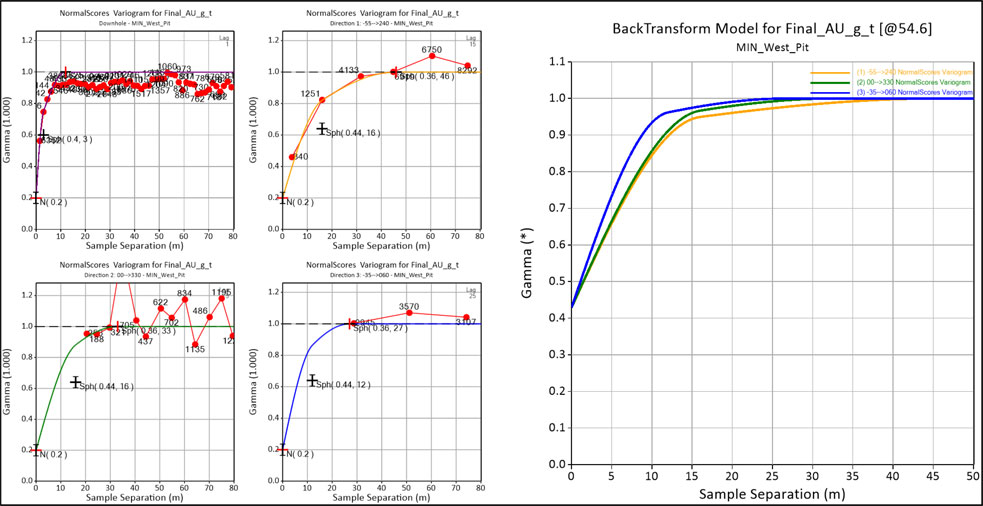
| Manhattan Mineral Resource – Amended April 23, 2026 | 112 |
Figure 14-16: Normal scores variography and backtransform model for gold estimation in the MIN_NellieGray_Reliance domain (Loury, 2025)
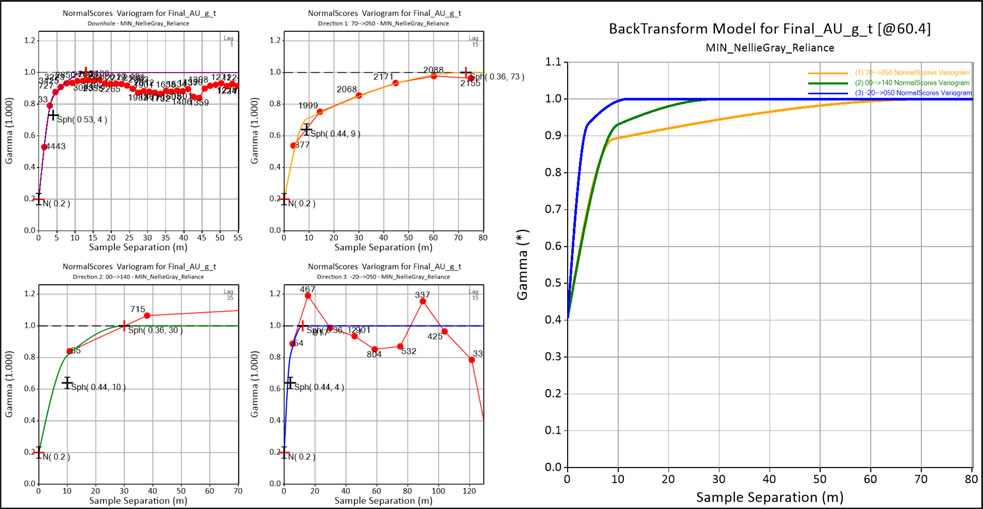
| Manhattan Mineral Resource – Amended April 23, 2026 | 113 |
Table 14-7: Variogram parameters for mineralized domains used in estimation
| Rotation – Snowden Supervisor | Structure 1 | Structure 2 | ||||||||||||
| Domain | Horizontal | Across Strike | Dip Plane | Nugget | Type | Normalized Sill | Major (m) | Semi-Major (m) | Minor (m) | Type | Normalized Sill | Major (m) | Semi-Major (m) | Minor (m) |
| MIN_East_Pit | 165 | 185 | 0 | 0.363 | Spherical | 0.512 | 7 | 9 | 3 | Spherical | 0.125 | 53 | 21 | 10 |
| MIN_Mustang Hill | 230 | 230 | 0 | 0.312 | Spherical | 0.688 | 42 | 42 | 20 | - | - | - | - | - |
| MIN_NellieGray_ Reliance | 320 | 340 | 0 | 0.405 | Spherical | 0.461 | 8 | 10 | 4 | Spherical | 0.134 | 72 | 30 | 12 |
| MIN_West_Pit | 150 | 215 | 0 | 0.429 | Spherical | 0.47 | 16 | 23 | 12 | Spherical | 0.102 | 46 | 35 | 27 |
| MIN_USD_Pit | 150 | 215 | 0 | 0.429 | Spherical | 0.47 | 16 | 23 | 12 | Spherical | 0.102 | 43 | 35 | 27 |
Notes:
| 1. | Nugget and normalized sill values from back-transformed normal scores variograms. The MIN_USD_Pit domain does not have sufficient sample coverage for variography. As a result, variograms from MIN_West_Pit were applied to the MIN_USD_Pit domain given their similar mineralization controls. |
| 2. | Discretization of 2x2x2 (x/y/z) was selected for all ordinary kriging (OK) estimates |
| Manhattan Mineral Resource – Amended April 23, 2026 | 114 |
| 14.3.5 | Block Model Set Up |
| 14.3.5.1 | 5x5x5m Block Model |
A single, non-rotated 5x5x5m block model was constructed in Leapfrog EDGE v.2024.1.3 in the WGS84 / UTM Zone 11 N coordinate system (Figure 14-17). The model extents cover the Goldwedge, West Pit, USD Pit, and East Pit areas. Table 14-8shows the block model definition.
Figure 14-17: Model extents for the Manhattan-Goldwedge 5x5x5m Block Model (Loury, 2025)
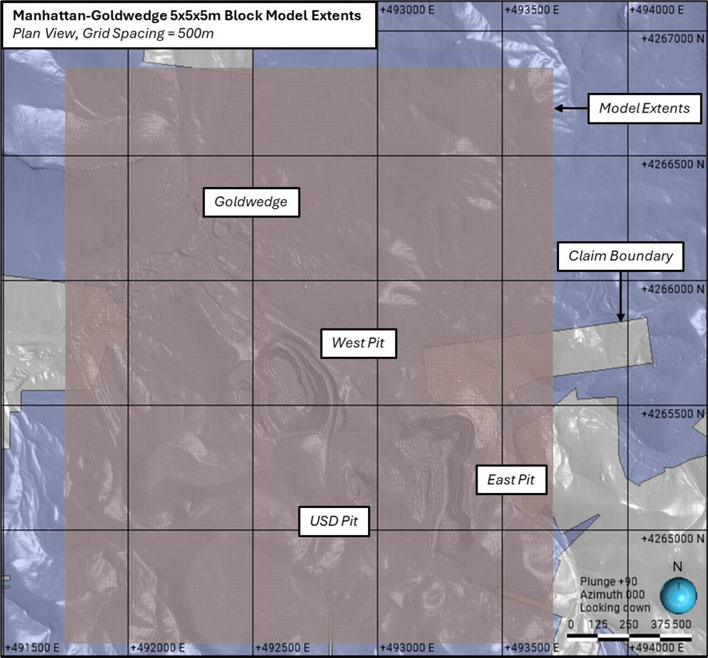
| Manhattan Mineral Resource – Amended April 23, 2026 | 115 |
Table 14-8: Block model parameters
| Model Build: | Leapfrog EDGE v.2024.1.3 | ||
| Coordinate System: | WGS84 / UTM Zone 11 N | ||
| Model: | MHGW_MRE_June2025_ENG | ||
| Rotation (azi/dip/pitch): | 0/0/0 | ||
| Coordinate: | Easting (X) | Northing (Y) | Elevation (Z) |
| Block Size (m) | 5 | 5 | 5 |
| Min. Corner (m) | 491,750 | 4,264,550 | 1700 |
| Min. Centroid (m) | 491,752.5 | 4,264,552.5 | 1702.5 |
| Number of Blocks | 390 | 460 | 110 |
| 14.3.6 | Grade Interpolation |
Gold grades were estimated by Inverse distance cubed (“ID3”), Ordinary Kriging (“OK”), and nearest neighbor (“NN”) in all mineralized domains. Search ellipse orientation and radii were selected based on variogram models for each individual estimation domain, with variable search orientation (“VO”) applied according to the nearest mineralized wireframe surface. Initial search parameters for each domain were selected using Kriging Neighborhood Analysis and were then refined based on results from preliminary model validation checks. A two-pass search strategy was applied for mineralized domains, with search ellipse distances doubled in the second estimation pass. A single pass was applied for the Background domain. Estimation parameters for all domains estimated in the 5x5x5m block model are summarized in Table 14-9.
ID3 was selected as the final estimation method because it reconciles well with NN estimates and generally falls within grade-tonnage envelopes generated from Sequential Gaussian Simulation (SGS; see ‘Model Validation’ section below). The OK estimate was used for comparison purposes but was not selected as the final estimation method because it tends to show a higher degree of smoothing relative to the NN estimate in Swath plots for most domains, in addition to generally higher tonnes and lower grade than limits defined by SGS grade-tonnage envelopes.
| Manhattan Mineral Resource – Amended April 23, 2026 | 116 |
Table 14-9: Estimation parameters
| Domain | Leapfrog Search Orientation | Pass 1 Data Search | Pass 2 Data Search | High-Grade Restriction | |||||||||||||||
| Dip | Dip Azi. | Pitch | Major | Semi-Maj. | Minor | Min. Samples | Max. Samples | Max Samples/ Hole | Major | Semi-Maj. | Minor | Min. Samples | Max. Samples | Max Samples/ Hole | Threshold (g/t) | Major | Semi-Maj. | Minor | |
| MIN_East_Pit | 85 | 255 | 90 | 40 | 40 | 10 | 9 | 20 | 4 | 80 | 80 | 20 | 1 | 8 | 4 | - | - | - | - |
| MIN_Mustang_ Hill | 40 | 320 | 90 | 40 | 40 | 10 | 9 | 20 | 4 | 80 | 80 | 20 | 1 | 8 | 4 | - | - | - | - |
| MIN_NellieGray_ Reliance | 70 | 230 | 90 | 40 | 40 | 10 | 9 | 20 | 4 | 80 | 80 | 20 | 1 | 8 | 4 | 20.0 | 20 | 20 | 5 |
| MIN_West_Pit | 55 | 240 | 90 | 40 | 40 | 10 | 9 | 20 | 4 | 80 | 80 | 20 | 1 | 8 | 4 | 20.0 | 20 | 20 | 5 |
| MIN_USD_Pit | 55 | 240 | 90 | 40 | 40 | 10 | 9 | 20 | 4 | 80 | 80 | 20 | 1 | 8 | 4 | - | - | - | - |
| BACKGROUND | - | - | - | 40 | 40 | 10 | 9 | 16 | 4 | - | - | - | - | - | - | 1.00 | 20 | 20 | 5 |
Notes:
| 1. | The search ellipse orientations shown above are the global plunge direction for each domain. Local search orientation is determined from variable orientation models. |
| 2. | All search distances in meters. |
| Manhattan Mineral Resource – Amended April 23, 2026 | 117 |
| 14.3.7 | Bulk Density Modelling |
Given that core drilling comprises a very small percentage of drilling completed at the Project to date, a total of only 256 density measurements are available from drill core, all of which were collected during the 2024 drilling campaign. These data were assessed according to logged lithology and alteration, modeled lithology, and by estimation domain. However, given the small number of measurements available, average values from historical reports were relied upon to determine the final densities for estimation. These values were then subsequently adjusted based on the 2024 measurements (Table 14-10), which generally returned lower values than those noted in historical reports. A value of 0.0 g/cm3 is assigned to any block which touches historical underground workings wireframes. Density data collection is ongoing as new drilling is completed, and additional measurements should be incorporated into future resource estimates.
Table 14-10: Density values assigned to block model
| Logged Lithology - 2024 Core Drilling Measurements | Lithology | n | Median (g/cm3) | Mean (g/cm3) |
| BX | 6 | 2.588 | 2.607 | |
| Limestone | 49 | 2.718 | 2.655 | |
| Quartzite | 8 | 2.708 | 2.713 | |
| Rhyolite | 6 | 2.742 | 2.714 | |
| Andesite | 26 | 2.725 | 2.717 | |
| CNG | 2 | 2.742 | 2.742 | |
| Phyllite | 10 | 2.723 | 2.743 | |
| CSC | 10 | 2.789 | 2.788 | |
| Argillite | 116 | 2.827 | 2.807 | |
| INT | 10 | 2.813 | 2.848 | |
| Marble | 6 | 2.859 | 2.857 | |
| Siltstone | 7 | 2.975 | 2.917 | |
| Modeled Lithology - 2024 Core Drilling Measurements | Cgl | 35 | 2.778 | 2.699 |
| Cgs | 185 | 2.776 | 2.784 | |
| Oza | 8 | 2.701 | 2.649 | |
| Ozl | 26 | 2.713 | 2.718 | |
| Historical Reports | Company | Lithology | Value (g/cm3) | |
| RSM | Ore | 2.76-2.99 | ||
| Kinross | Rock | 2.87 | ||
| Overburden | 1.99 | |||
| Final Densities Applied to Block Model | Value (g/cm3) | Lithology | Source | |
| 2.800 | Rock | Adjusted from historical reports to reflect data from 2024. | ||
| 1.990 | Overburden | Kinross historical reports. | ||
| 0.000 | Underground Workings | Underground workings wireframes provided by Rangefront | ||
| Manhattan Mineral Resource – Amended April 23, 2026 | 118 |
| 14.3.8 | Mineral Resource Classification |
Mineral Resources for the Project are classified under the Inferred category, in accordance with CIM Definition Standards. The Measured and Indicated resource categories were not classified. The CIM definition of an Inferred Mineral Resource is stated below:
An Inferred Mineral Resource is that part of a Mineral Resource for which quantity and grade or quality are estimated on the basis of limited geological evidence and sampling. Geological evidence is sufficient to imply but not verify geological and grade or quality continuity. An Inferred Mineral Resource has a lower level of confidence than that applying to an Indicated Mineral Resource and must not be converted to a Mineral Reserve. It is reasonably expected that the majority of Inferred Mineral Resources could be upgraded to Indicated Mineral Resources with continued exploration. An Inferred Mineral Resource is based on limited information and sampling gathered through appropriate sampling techniques from locations such as outcrops, trenches, pits, workings and drill holes. Inferred Mineral Resources must not be included in the economic analysis, production schedules, or estimated mine life in publicly disclosed pre- feasibility or feasibility studies, or in the life of mine plans and cash flow models of CIM Definition Standards for Mineral Resources & Mineral Reserves May 10, 2014 5 developed mines. Inferred Mineral Resources can only be used in economic studies as provided under NI 43101. There may be circumstances, where appropriate sampling, testing, and other measurements are sufficient to demonstrate data integrity, geological and grade/quality continuity of a measured or Indicated Mineral Resource, however, quality assurance and quality control, or other information may not meet all industry norms for the disclosure of an indicated or Measured Mineral Resource. Under these circumstances, it may be reasonable for the Qualified Person to report an Inferred Mineral Resource if the Qualified Person has taken steps to verify the information meets the requirements of an Inferred Mineral Resource.
Data spacing sufficient for Inferred Resources was determined by calculating the weighted average distance at which the direction 1 variogram models reach 100% of the normalized sill (Gamma = 1.0), determined graphically from back transformed variograms for the mineralized domains (MIN prefix). Weights for each domain were assigned according to their total Au Oz inventory, reported from the 5x5x5m block model. As a result of this analysis, Inferred resources were categorized based on a drill spacing of 50 meters or less (25m to the closest sample), with a minimum of two drillholes used in estimation. Figure 14-18 shows classified blocks for the 5x5x5m block model.
| Manhattan Mineral Resource – Amended April 23, 2026 | 119 |
Figure 14-18: Manhattan-Goldwedge Resource Classification (Loury, 2025)
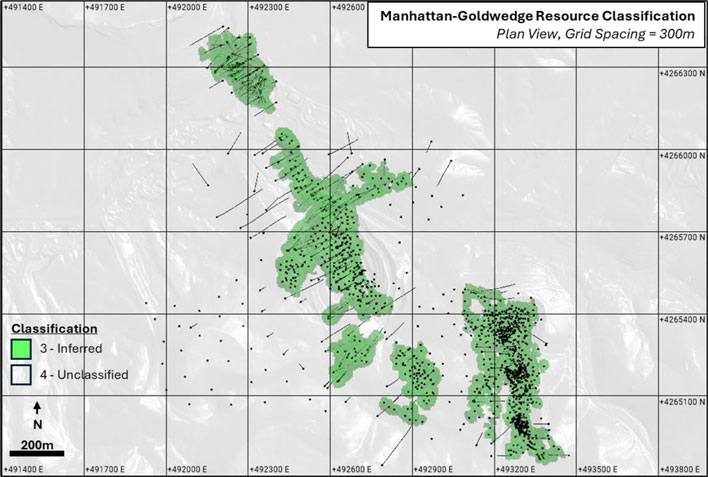
| 14.3.9 | Model Validation |
Validation checks are focused on mineralized domains (MIN prefix), which contain >98% of the reported pit-constrained Au inventory. The model was validated using the following methods:
| ● | Statistical comparison (ID3 vs. Uncapped ID3, NN, and OK). |
| ● | Sectional validation – visual comparison between block grades and composite grades. |
| ● | Swath plots. |
| ● | Comparison to grade-tonnage envelopes from Sequential Gaussian Simulation (SGS). |
| 14.3.9.1 | Estimate Comparison (ID3 vs Uncapped ID3, NN, and OK) |
Statistics for the final ID3 estimates were compared to the NN and OK estimates, globally and domain by domain. The difference in average estimated grade between the ID3 and NN estimates is less than 5% for all mineralized domains, and the difference in average estimated grade between the ID3 and OK estimates is less than 5% in all mineralized domains aside from MIN_West_Pit, which shows a variance of 5.1%.
The final ID3 estimates were also compared against estimates prepared using the uncapped composite dataset (“ID3 Uncapped”), to evaluate metal loss. The search parameters for the uncapped estimate were otherwise kept identical to the final ID3 estimates. Metal loss due to capping is less than 10% for all domains aside from MIN_USD_Pit, in which the metal loss is due to one extremely high-grade outlier in the uncapped dataset. Table 14-11 shows the comparison between the various estimation methods for Au, domain by domain.
| Manhattan Mineral Resource – Amended April 23, 2026 | 120 |
Table 14-11: Estimate mean comparison between Au_ID3, Au_ID3 Uncapped, Au_NN, and Au_OK
| Domain | Capped Comp. Mean (g/t) | Comp. Count | Au_ID3 Capped (g/t) | Au_ID3 Uncapped (g/t) | ID3 Capped vs. ID3 Uncapped | Au_NN Capped (g/t) | ID3 Capped vs. NN Capped | Au_OK Capped (g/t) | ID3 Capped vs. OK Capped | Domain
Tonnes |
| MIN_East_Pit | 0.833 | 12,583 | 0.554 | 0.615 | -9.9% | 0.558 | -0.7% | 0.544 | 1.8% | 9,766,408 |
| MIN_Mustang_Hill | 0.829 | 506 | 0.712 | 0.718 | -1.3% | 0.703 | 1.3% | 0.746 | -4.6% | 3,364,550 |
| MIN_NellieGray_ Reliance | 1.267 | 4,863 | 0.934 | 1.000 | -4.8% | 0.946 | -1.3% | 0.892 | 4.7% | 26,226,873 |
| MIN_West_Pit | 0.844 | 6,814 | 0.907 | 0.929 | -8.3% | 0.920 | -1.4% | 0.863 | 5.1% | 13,365,541 |
| MIN_USD_Pit | 0.572 | 903 | 0.602 | 0.688 | -1.3% | 0.577 | 4.3% | 0.624 | -3.5% | 3,173,344 |
Notes:
| 1. | Au_ID3, Au_NN, and Au_OK values are estimated using the capped composite dataset. |
| 2. | Au_ID3 Uncapped is estimated using uncapped composites, with the same search parameters as for Au_ID3. |
| 3. | Numbers are global values, no Resource classification constraint or pit constraint applied. |
| Manhattan Mineral Resource – Amended April 23, 2026 | 121 |
| 14.3.9.2 | Sectional Validation – Blocks versus Composites |
Estimated gold block grades, resource classification, lithology model and underground workings wireframe assignment to blocks, and drill hole composite data were compared visually in plan and cross section for all domains. Visual validation demonstrates that ID3-estimated 5x5x5m block grades reproduce the composite grades well. Figure 14-19 through Figure 14-22 show several examples comparing estimated block grades to the composited dataset.
Figure 14-19: Section locations for Figure 14-20 through Figure 14-22 (Loury, 2025)
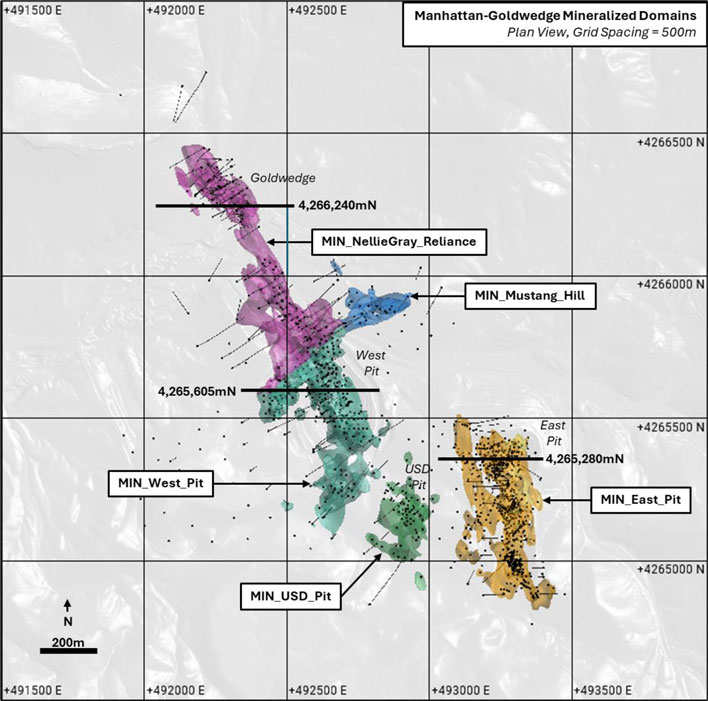
| Manhattan Mineral Resource – Amended April 23, 2026 | 122 |
Figure 14-20: West Pit validation section 4,265,605mN (Loury, 2025)
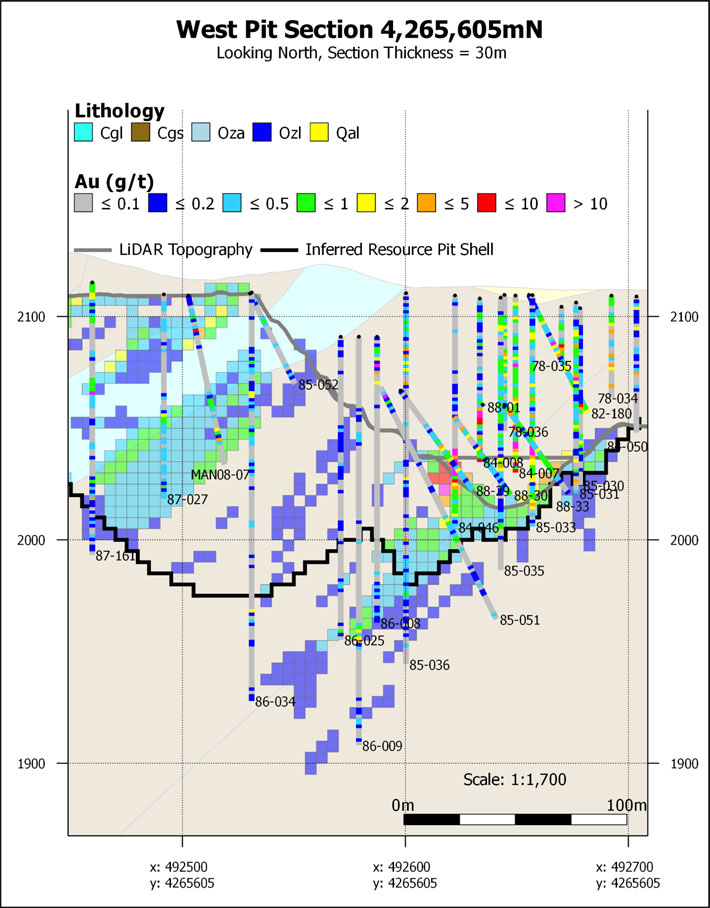
| Manhattan Mineral Resource – Amended April 23, 2026 | 123 |
Figure 14-21: East Pit validation section 4,265,280mN (Loury, 2025)
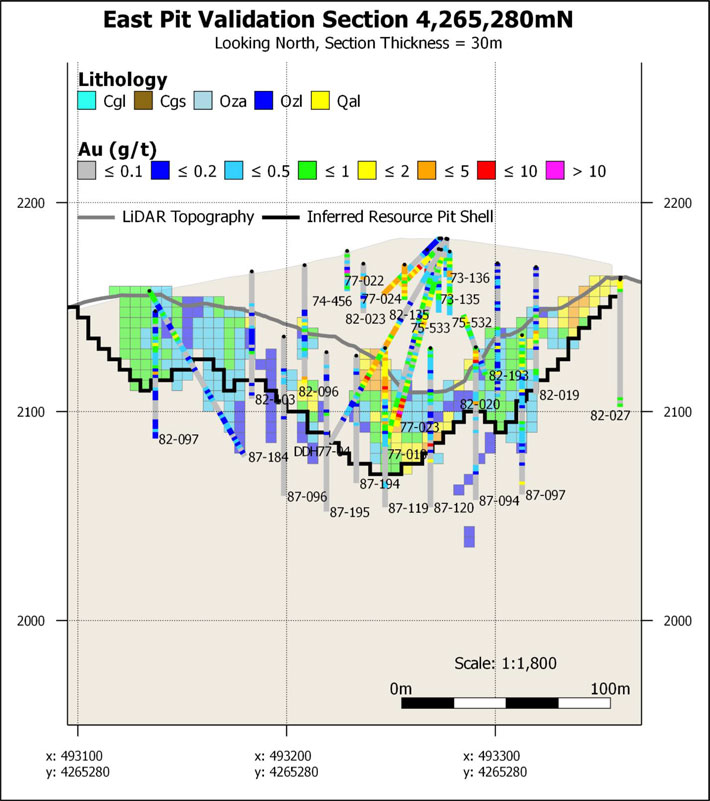
| Manhattan Mineral Resource – Amended April 23, 2026 | 124 |
Figure 14-22: Goldwedge validation section 4,266,240mN (Loury, 2025)
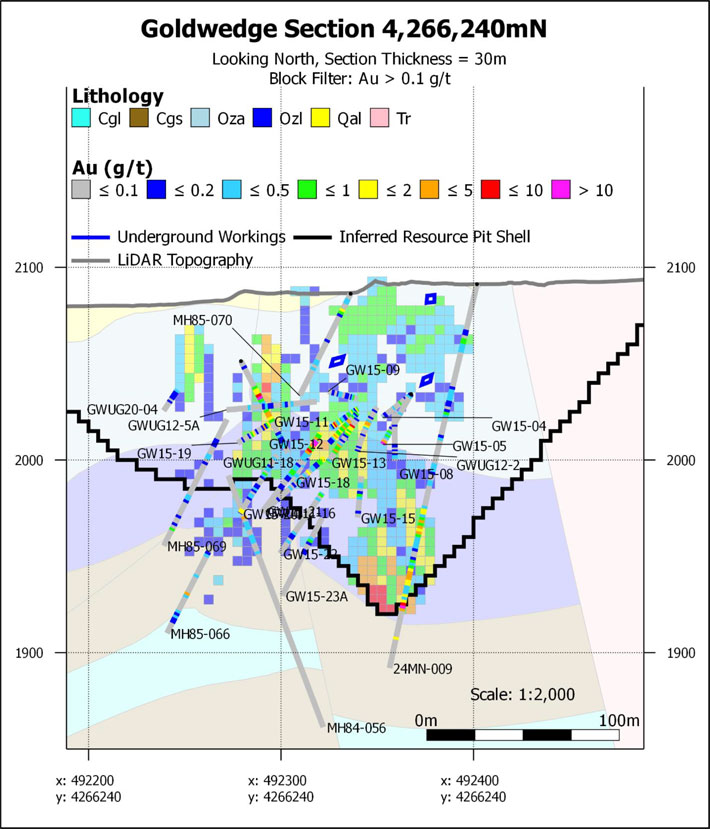
| Manhattan Mineral Resource – Amended April 23, 2026 | 125 |
| 14.3.9.3 | Swath Plots |
Swath
plots were generated for each mineralized estimation domain to compare the ID3, NN, and OK estimates against one another and against
composite grades. Results demonstrate that the ID3 estimates for Au in mineralized domains (MIN prefix) in the 5x5x5m block model
do not show a systematic high or low bias against the NN estimate or composites, and that the estimated grades for all three methods
match the composite grades well in easting, northing, and elevation. The OK estimates tend to show a higher degree of smoothing
relative to ID3, hence the selection of ID3 as the final estimation method. Figure 14-23 through Figure 14-25 show examples from
several mineralized domains.
| Manhattan Mineral Resource – Amended April 23, 2026 | 126 |
Figure 14-23: Swath plots from the MIN_East_Pit domain (Loury, 2025)
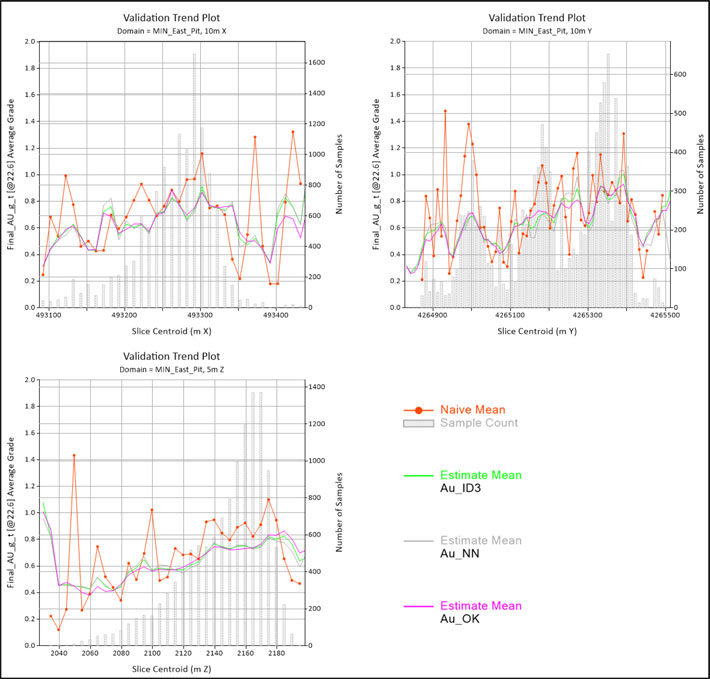
| Manhattan Mineral Resource – Amended April 23, 2026 | 127 |
Figure 14-24: Swath plots from the MIN_NellieGray_Reliance domain (Loury, 2025)
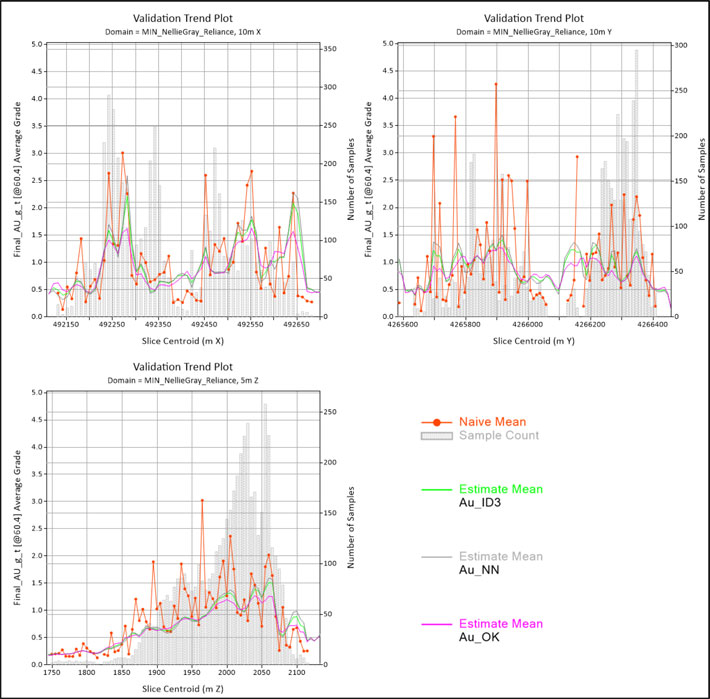
| Manhattan Mineral Resource – Amended April 23, 2026 | 128 |
Figure 14-25: Swath plots from the MIN_West_Pit domain (Loury, 2025)
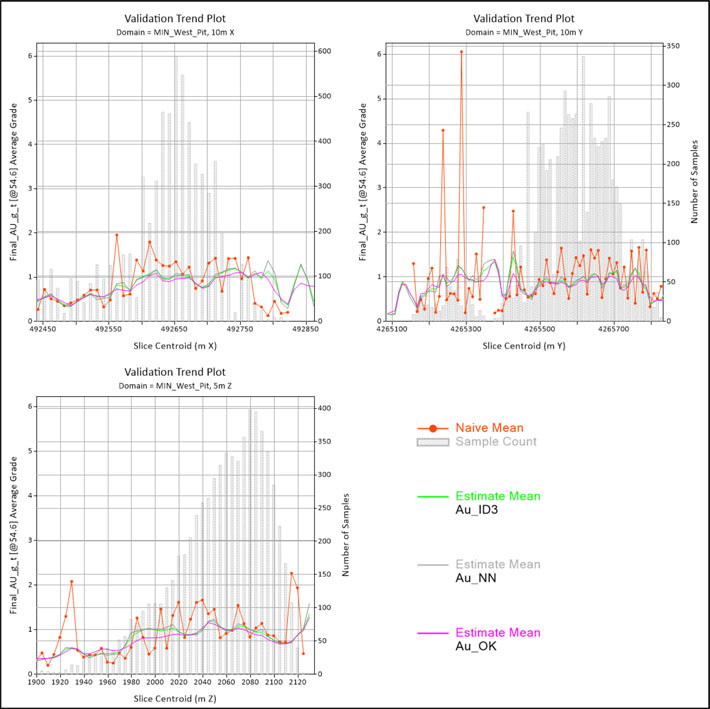
| Manhattan Mineral Resource – Amended April 23, 2026 | 129 |
| 14.3.9.4 | Sequential Gaussian Simulation |
Sequential Gaussian Simulation (“SGS”) was completed for several mineralized estimation domains in the 5x5x5m block model to provide a range of possible grade-tonnage scenarios, to refine estimation parameters, and to aid in selecting the final estimation method for resource reporting. The simulations were completed using declustered, normal scores transformed data and normal scores variograms for each domain, with simple kriging selected as the estimator. An example showing cell size selection for declustering is shown in Figure 14-26, and the full set of simulation parameters are presented in Table 14-12. Simulation results were checked to ensure a mean estimated normal score value close to 0 and a variance close to 1 were achieved in each domain prior to use in validation.
Figure 14-26: Cell declustering and weights for the MIN_West_Pit estimation domain (Loury, 2025)
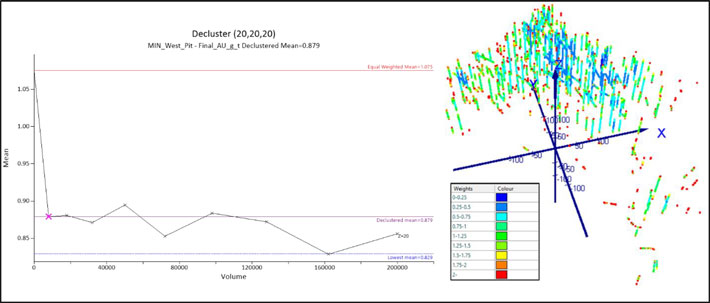
Comparison of the ID3 and OK estimates to SGS grade-tonnage envelopes demonstrates that the ID3 estimate tends to fall between the 5th and 95th ranked simulations (p5-p95) for both grade and tonnes (Figure 14-27). The OK estimates, however, tend to show lower grades than the p5 simulations and higher tonnes than the p95 simulations. This suggests that OK produces an over-smoothed result, and ID3 was therefore selected as the grade variable for final reporting purposes.
| Manhattan Mineral Resource – Amended April 23, 2026 | 130 |
Table 14-12: Sequential Gaussian Simulation parameters for Au in mineralized estimation domains
| Block Size | Points Per Block | Search (m)1 | |||||||||||||
| Domain2 | Kriging Type | Number of Simulations | X | Y | Z | X | Y | Z | Major | Semi-Major | Minor | Assign Data to Node? | Min. Samples | Max. Samples | Max. previously simulated nodes |
| MIN_East_Pit | Simple | 100 | 5 | 5 | 5 | 2 | 2 | 2 | 80 | 80 | 20 | N | 1 | 40 | 20 |
| MIN_Mustang_ Hill | — | — | — | — | — | — | — | — | — | — | — | — | — | — | — |
| MIN_NellieGray_ Reliance | Simple | 100 | 5 | 5 | 5 | 2 | 2 | 2 | 80 | 80 | 20 | N | 1 | 40 | 20 |
| MIN_West_Pit | Simple | 100 | 5 | 5 | 5 | 2 | 2 | 2 | 80 | 80 | 20 | N | 1 | 40 | 20 |
| MIN_USD_Pit | — | — | — | — | — | — | — | — | — | — | — | — | — | — | — |
Notes:
| 1. | Search directions for each domain are taken from Table 14-7, with search dimensions set equal to that of the second search pass used in estimation. |
| 2. | Simulations were only completed in domains with significant tonnage. |
| Manhattan Mineral Resource – Amended April 23, 2026 | 131 |
Figure 14-27: Grade-tonnage curve comparison between ID3, OK, and SGS for Au in select mineralized domains (Loury, 2025)
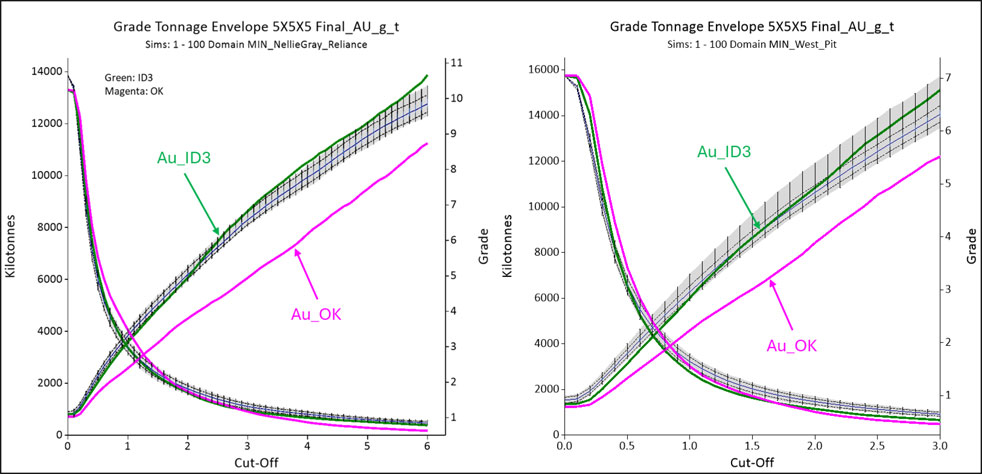
Notes:
The median (p50) simulation is represented by the solid blue line in the center of the grade-tonnage envelope. Dashed lines represent the p5 and p95 simulations.
| Manhattan Mineral Resource – Amended April 23, 2026 | 132 |
| 14.3.10 | Assessment of Reasonable Prospects for Eventual Economic Extraction |
Fuse Advisors was commissioned to assist the Company in support of the MRE presented in this report. Open pit optimization was prepared using Datamine Studio NPVS, a strategic mine planning software package that generates an optimized pit shell based on economic input parameters and overall slope angles using the Hochbaum Pseudoflow algorithm. The optimization considers blocks of Inferred assurance category only. Historically mined blocks were assigned a density of 0.0 g/cm3 and a grade of 0.0 g/t Au prior to optimization, and overburden blocks were assigned a density of 1.99 g/cm3 and a grade of 0.001 g/t Au. The selected pit was computed using a 0.3 g/t Au cutoff, which was determined by rounding up from the calculated breakeven cutoff grade of 0.262 g/t. This cutoff grade was calculated using the following formula below, with input values listed in Table 14-13.

Optimization parameters such as mining costs, mill recoveries, and General and Administration (G&A) costs were assigned by benchmarking against open pit operations of similar deposit style across Nevada. The 50-degree overall slope angle used for in-situ material was determined by measuring the inter-ramp slope angle in the previously mined pits on the Property from the LiDAR topography surface in 3D. Table 14-14 and Figure 14-28 through Figure 14-33 show the resulting pit-constrained Inferred Resources for the Manhattan property.
Table 14-13: Pit optimization parameters
| Parameter | Unit | Value | |
| Mining | Waste mining cost | $/tonne | 3.00 |
| Ore mining cost | $/tonne | 3.00 | |
| Mining loss | % | 0 | |
| Mining dilution | % | 0 | |
| Slope angle | degrees | 50 (in-situ rock) 30 (overburden) | |
| Processing | Mill recovery | % | 90 |
| Mill cost | $/tonne (ore) | 15.00 | |
| General and administration (G&A) | $/tonne (ore) | 3.50 | |
| Selling | Price | $/oz Au | 2,500 |
| Selling cost | % | 0 | |
| Royalty3 | % | 2.00 | |
Notes:
| 1. | Royalty is based on percent of revenue. |
| 2. | All costs in United States Dollars (USD). |
| 3. | Unless otherwise stated, resources declared in this Technical Report are reported at a cutoff grade of greater than or equal to 0.3 g/t Au. |
| Manhattan Mineral Resource – Amended April 23, 2026 | 133 |
Table 14-14: Mineral Resource Statement
| Zone | Classification | Tonnage | Gold Grade | Gold Contained |
| kt | g/t | koz | ||
| East Pit | Inferred | 3,552 | 0.81 | 93 |
| Goldwedge | Inferred | 2,981 | 1.48 | 142 |
| Mustang Hill | Inferred | 884 | 1.00 | 28 |
| USD Pit | Inferred | 770 | 1.14 | 28 |
| West Pit | Inferred | 10,115 | 1.37 | 448 |
| Total | Inferred | 18,342 | 1.26 | 740 |
Notes for Table 14-14:
| 1. | Open Pit Resource estimates are based on economically constrained open pits generated using the Hochbaum Pseudoflow algorithm in Datamine’s Studio NPVS and the following optimization parameters (all dollar values are in US dollars): |
| ● | Inferred Resource classification only. |
| ● | $2,500/ounce gold price. |
| ● | Mill recoveries of 90% for gold. |
| ● | 50 degree pit slope angle for in-situ rock, 30 degree pit slope angle for overburden. |
| ● | Mining costs of $3.00 per tonne for both ore and waste. |
| ● | Milling costs of $15.00 per tonne processed. |
| ● | G&A cost of $3.50 per tonne processed. |
| ● | 2% royalty costs. |
| ● | A 0.3 g/t gold only cutoff was applied for Resource reporting. |
| ● | Ore loss and dilution not applied. |
| 2. | Mineral Resources are not Mineral Reserves (as that term is defined in the CIM Definition Standards) and do not have demonstrated economic viability. |
| Manhattan Mineral Resource – Amended April 23, 2026 | 134 |
Figure 14-28: Plan view showing 2025 Block Model, Resource pit, Resource reporting zone, and section lines for Figure 14-29 through Figure 14-32 (Loury, 2025)
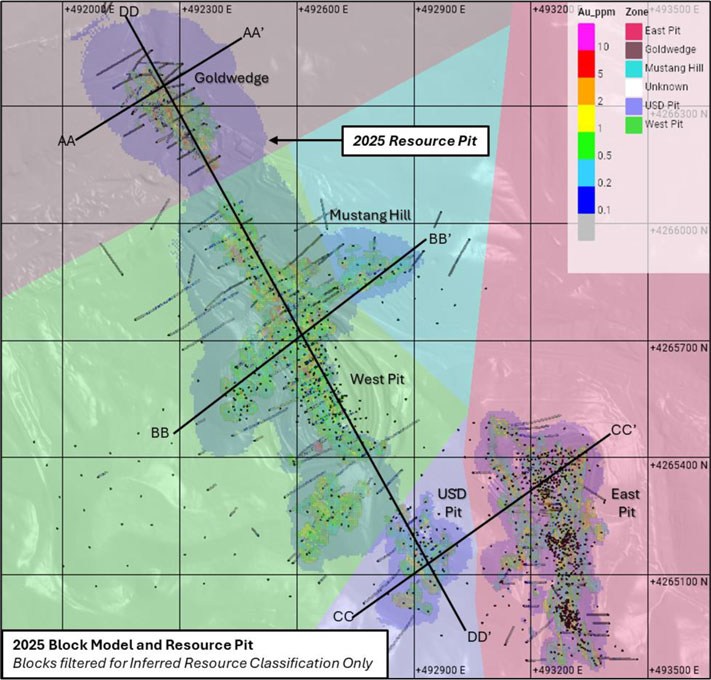
Notes:
See Table 14-3 for optimization parameters.
| Manhattan Mineral Resource – Amended April 23, 2026 | 135 |
Figure 14-29: Section AA-AA’ showing pit-constrained Inferred Resources in the Goldwedge area (Loury, 2025)
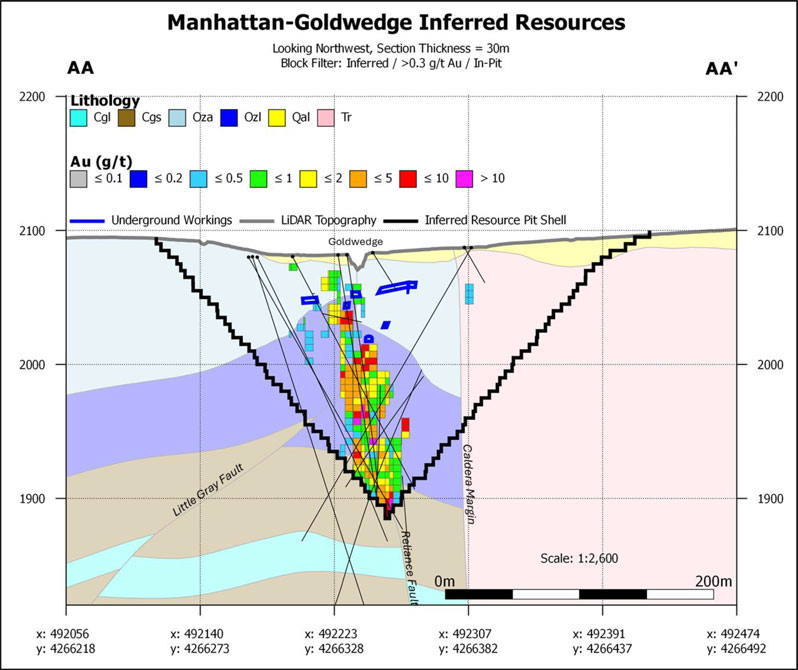
| Manhattan Mineral Resource – Amended April 23, 2026 | 136 |
Figure 14-30: Section BB-BB’ showing pit-constrained Inferred Resources in the Mustang Hill and West Pit areas (Loury, 2025)
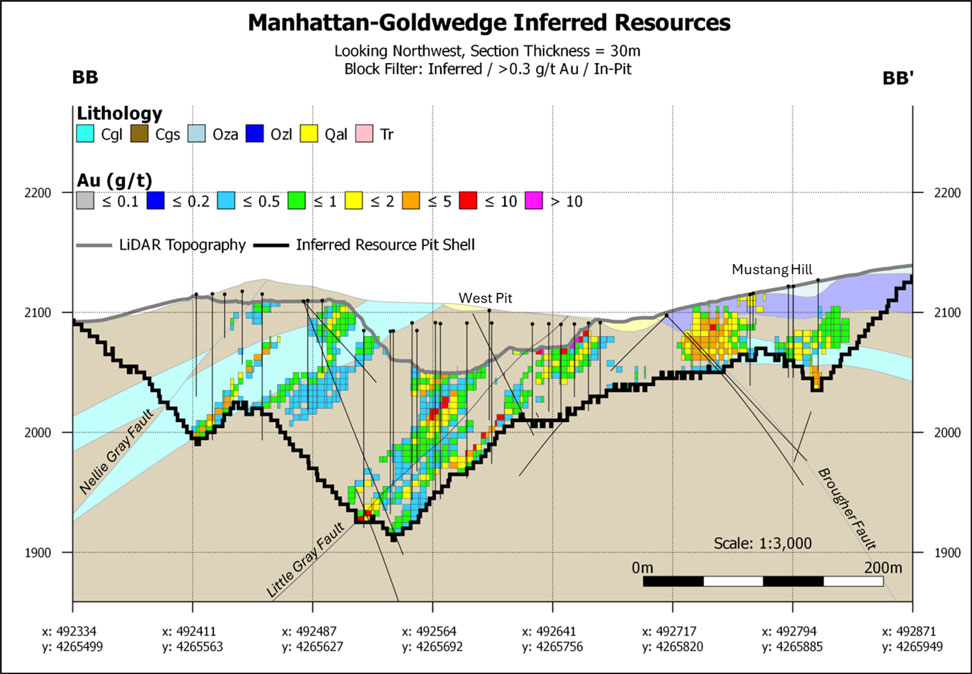
| Manhattan Mineral Resource – Amended April 23, 2026 | 137 |
Figure 14-31: Section CC-CC’ showing pit-constrained Inferred Resources in the East Pit and USD Pit areas (Loury, 2025)
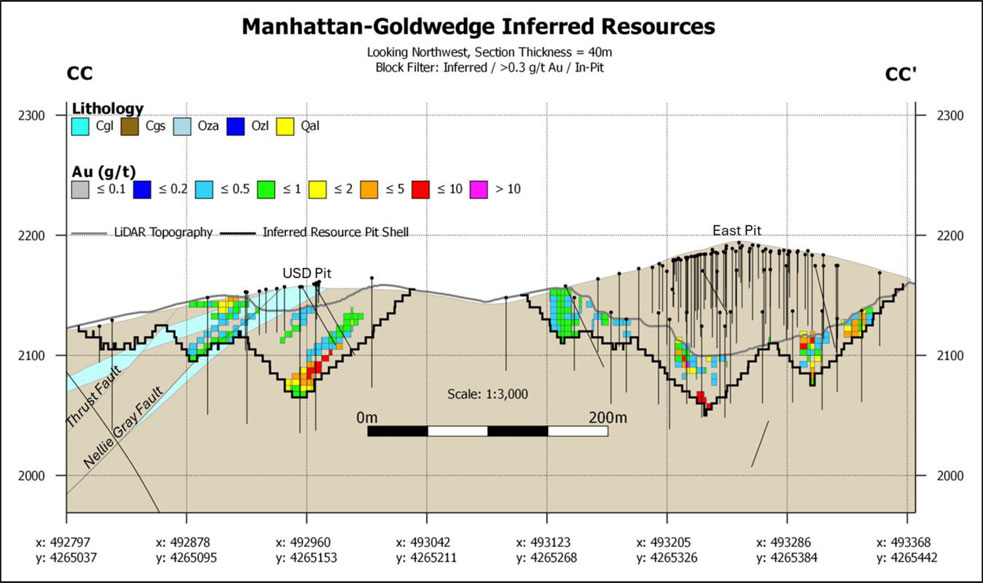
| Manhattan Mineral Resource – Amended April 23, 2026 | 138 |
Figure 14-32: Section DD-DD’ showing pit-constrained Inferred Resources in the Goldwedge, West Pit, and USD Pit areas (Loury, 2025)
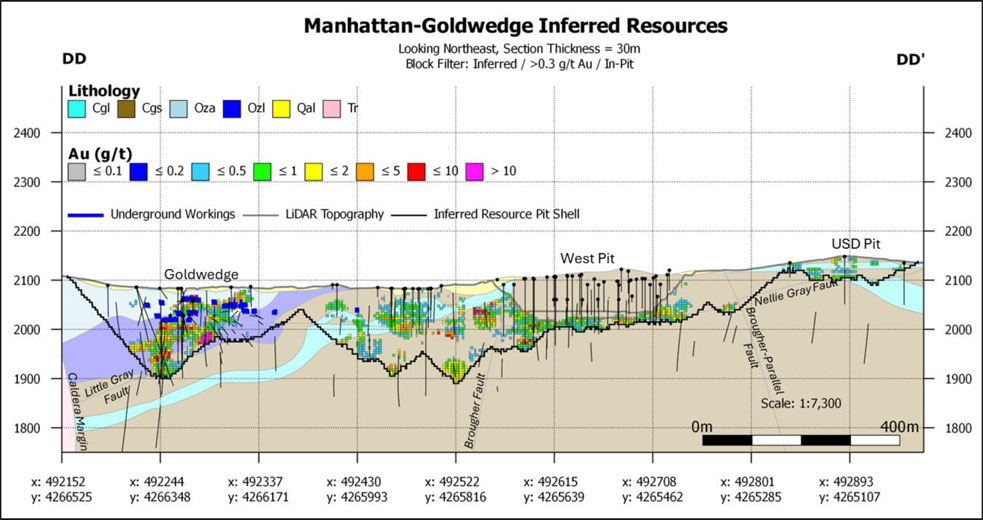
| Manhattan Mineral Resource – Amended April 23, 2026 | 139 |
Figure 14-33: Grade-tonnage curves for pit-constrained Inferred Resources at various gold cutoff grades (Loury, 2025)
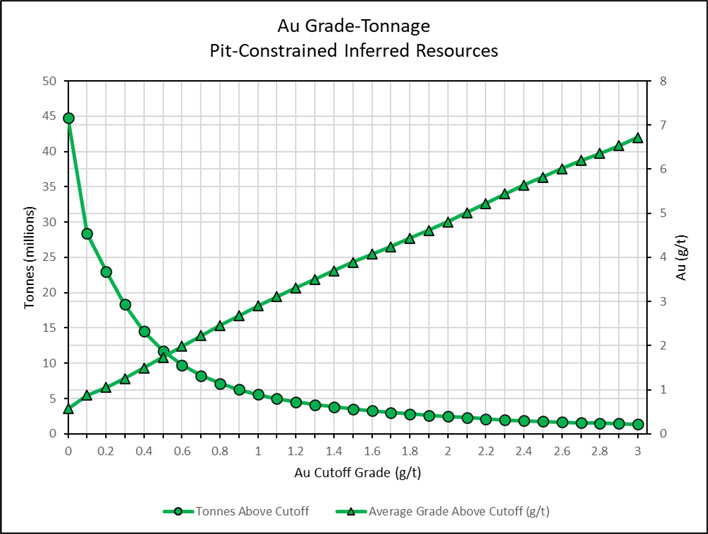
| Manhattan Mineral Resource – Amended April 23, 2026 | 140 |
Table 14-15: Average pit-constrained gold grade and contained ounces at various cut-off grades
| Cut-off grade | Tonnes ≥ cut-off | Average
gold grade ≥ cut-off |
Gold Contained |
| g/t | kt | g/t | koz |
| 0.1 | 28,378 | 0.88 | 802 |
| 0.2 | 23,006 | 1.05 | 777 |
| 0.3 (Selected) | 18,342 | 1.26 | 740 |
| 0.4 | 14,496 | 1.49 | 696 |
| 0.5 | 11,762 | 1.74 | 657 |
| 0.6 | 9,754 | 1.98 | 622 |
| 0.7 | 8,232 | 2.23 | 590 |
| 0.8 | 7,124 | 2.46 | 563 |
| 0.9 | 6,280 | 2.68 | 540 |
| 1.0 | 5,561 | 2.90 | 518 |
| 1.1 | 4,999 | 3.11 | 500 |
| 1.2 | 4,531 | 3.31 | 482 |
| 1.3 | 4,137 | 3.51 | 466 |
| 1.4 | 3,798 | 3.70 | 452 |
| 1.5 | 3,503 | 3.89 | 438 |
| 1.6 | 3,248 | 4.07 | 425 |
| 1.7 | 3,033 | 4.24 | 414 |
| 1.8 | 2,817 | 4.44 | 402 |
| 1.9 | 2,637 | 4.61 | 391 |
| 2.0 | 2,461 | 4.80 | 380 |
| 2.1 | 2,288 | 5.01 | 369 |
| 2.2 | 2,133 | 5.22 | 358 |
| 2.3 | 1,986 | 5.44 | 347 |
| 2.4 | 1,866 | 5.64 | 338 |
| 2.5 | 1,765 | 5.82 | 330 |
| 2.6 | 1,667 | 6.01 | 322 |
| 2.7 | 1,580 | 6.20 | 315 |
| 2.8 | 1,511 | 6.36 | 309 |
| 2.9 | 1,437 | 6.54 | 302 |
| 3.0 | 1,367 | 6.72 | 295 |
| 14.4 | Discussion of Mineral Resources, Risks, and Recommendations |
Matthew Dumala, P.Eng. has certified that, to the best of his professional judgment as a Qualified Person (as defined under NI 43-101), the MRE has been prepared in compliance with NI 43-101, including the CIM Definition Standards incorporated by reference, and conform to generally accepted mining industry best practices. Mineral Resources are not Mineral Reserves and there is no assurance that Mineral Resources will ultimately be classified as Proven or Probable (as those terms are defined in CIM Definition Standards) Mineral Reserves.
| Manhattan Mineral Resource – Amended April 23, 2026 | 141 |
The Mineral Resources presented here should be accepted with the understanding that additional data and analysis available after the date of the estimates may necessitate revision. Potential risks that may impact the accuracy of the MRE include the following:
Currently, Nevada State Route 377 crosses through the mineral resource area. Future development would require the roadway and other infrastructure to be relocated. Any potential realignment of State Route 377 road would require consultation with all local stakeholders and government officials. The QP believes this could be possible as there is existing precedence for moving infrastructure in the state of Nevada. In 2019, Gemfield Resources, LLC which was managed by Waterton Global Resource Management, moved part of Highway 95 to accommodate the development of its Gemfield Deposit (now Centerra Gold Inc.), located approximately 90 km south of Manhattan (Esmeralda County, 2019). This was done in partnership with the Nevada Department of Transportation and involved moving 4 km (2.5 miles) of the existing highway, along with power lines, water lines, fiber-optic lines, and other infrastructure. A permit (DOI-BLM-NV-B020-2018-0052-EIS) was issued by the BLM on July 26, 2019, covering all of the proposed Gemfield operations, including the realignment. All documents pertaining to this permit are available from the BLM on the BLM National NEPA Register (https://eplanning.blm.gov/).
Scorpio Gold is actively reviewing and digitizing historical drill hole and other data from all available sources. The geologic interpretation, modelling of attributes such as lithology, faults, and mineralization controls, and the resulting resource estimates were prepared using only data that had been digitized as of the report’s effective date. Additional drilling, data collection, and further digitization of historical data may require revisions to wireframes, interpolation methodologies, density modelling, or other attributes which may impact future mineral resource estimates. Historical mine and exploration records should continue to be searched for any additional documentation that would support collar coordinate, down-hole survey, assay, and other drill-hole data. Any additional data found should be incorporated in future MREs.
Original certificates were available for all Scorpio drillhole assays, and for most of the drilling completed by previous operators. Data verification checks comparing original certificates against assay values in the database yielded very few discrepancies, all of which were corrected prior to resource estimation (see section 12). Further, drillholes with a low confidence score were not permitted for use in estimation. However, QA/QC data are limited to duplicates for all campaigns prior to 1992. This risk is partially mitigated by the very high drill data density (locally 10m or less) applied in the main deposit areas, in which spatial continuity is generally observed in ore-waste contacts, high-grade mineralization, and other geological attributes.
Drill spacing in the previously mined East, West, and USD pits is generally less than 20m and appears to have been sufficient to guide past open pit mining activities. While many areas of the current in-situ resource are drilled to a similarly dense spacing, they were not considered for Measured or Indicated resource classification due to the lack of available QA/QC data for pre-1992 drilling, and because collar locations for drillholes which have been partially or completely mined out cannot be directly verified in the field. It is therefore recommended that several historical drillholes in key areas within the 2025 MRE pit shell be twinned with diamond and/or reverse circulation to assess variability and potential bias between current and historical drilling and sampling methodologies, and that additional confirmation drilling be completed prior to estimating Measured or Indicated resources.
| Manhattan Mineral Resource – Amended April 23, 2026 | 142 |
The accuracy of modeled historical mine workings has not been verified using modern methods, such as underground LiDAR surveys. Construction of the current depletion solids therefore relied on digitized and georeferenced historical production maps. While the work was completed to the highest level of accuracy possible with the current available dataset, the position and dimensions of modeled underground workings may be inaccurate. Other historical mine workings may also be present which have not yet been documented. It is therefore recommended that a LiDAR survey of existing underground workings be completed prior to future MREs.
Density measurements are only available from drill core collected during Scorpio’s 2024 diamond drilling campaign and are not present in sufficient number or spatial distribution to accurately model density according to key geological attributes. As such, global densities were applied based primarily on values found in historical production reports. While application of a global density is a reasonable approach in the absence of other data, significant variation may exist between different lithologies, oxidation states, or alteration styles. It is therefore recommended that density data be continuously collected from drill core, pit wall samples, or other sources prior to future MREs. The density data should be spatially representative, and sufficiently distinguish the various lithologic, alteration, and oxidation types.
The potential effects of oxidation state and other geological attributes on metallurgical recoveries are not yet fully understood. Detailed geotechnical studies also have not been completed for the Project. Future technical studies, including geotechnical and metallurgical, could result in revisions to pit slope angles, process recovery assumptions, and other items which may materially impact future resource estimates.
Commodity price changes and capital and operating cost estimates could impact revenue and cost inputs used in the MRE, and overall economic interpretation of the viability of Project study and development.
The
QP is not an expert regarding environmental, permitting, legal, title, taxation, socioeconomic, marketing, or political factors.
As of the date of this report, the QP is not aware of any issues related to these factors that may materially affect the mineral
resources that are not otherwise discussed in this report.
| Manhattan Mineral Resource – Amended April 23, 2026 | 143 |
| 15.0 | MINERAL RESERVE ESTIMATES |
This section is not applicable to this report.
| 16.0 | MINING METHODS |
This section is not applicable to this report.
| 17.0 | RECOVERY METHODS |
This section is not applicable to this report.
| 18.0 | PROJECT INFRASTRUCTURE |
This section is not applicable to this report.
| 19.0 | MARKET STUDIES AND CONTRACTS |
This section is not applicable to this report.
| 20.0 | ENVIRONMENTAL STUDIES, PERMITTING AND SOCIAL OR COMMUNITY IMPACT |
This section is not applicable to this report.
| 20.0 | CAPITAL AND OPERATING COSTS |
This section is not applicable to this report.
| 21.0 | ECONOMIC ANALYSIS |
This
section is not applicable to this report.
| Manhattan Mineral Resource – Amended April 23, 2026 | 144 |
| 23.0 | ADJACENT PROPERTIES |
The Round Mountain Mine is an open pit mine operated by Kinross Gold Corporation. It is located approximately 14 km north of the Manhattan Property. As of December 31, 2024, the mine has reported proven and probable gold reserves of 1,883 koz (www.kinross.com). Mining operations are expected to continue until 2027.
The Round Mountain Gold deposit is a very large, epithermal, low-sulfidation, volcanic-hosted, hot-springs type, precious metal deposit. Gold mineralization within the Round Mountain deposit occurs as electrum in association with quartz, adularia, pyrite and iron oxides. Shear zone fractures, veins and disseminations within the more permeable units host the mineralization. Primary sulphide mineralization consists of electrum associated with or internal to pyrite grains. In oxidized zones, gold occurs as electrum associated with iron oxides, or as disseminations along fractures (Handson, W., 2006).
The Qualified Person has been unable to verify the information pertaining to Round Mountain, and the reader is cautioned that mineralization may not be reflective of mineralization on the Manhattan Property.
| Manhattan Mineral Resource – Amended April 23, 2026 | 145 |
| 24.0 | OTHER RELEVANT DATA AND INFORMATION |
On April 29, 2025, Scorpio commenced it’s 3,400m phase One 2025 diamond drill program. This program was ongoing as of the signing date of this report and no data was available as of the reports effective date.
Phase One drilling is focused on three target areas: (1) the Gap Zone, located between the historic Goldwedge and West Pit mines; (2) the Zanzibar Trend, connecting the Goldwedge to the third target zone; and (3) at Mustang Hill’s historic underground mines. Drilling aims to follow up on the intercepted Zanzibar Trend in hole 24MN-009, with an interval of 1.69 grams per ton (“g/t”) Au over 55.6 m, and Mustang Hill which was intercepted with an interval of 3.89 g/t Au over 41.2 m.
Results from this program will be used to validate the geological model and included in future mineral resource estimates.
The Author is not aware of any other relevant data or information that would have an impact on the Property.
| Manhattan Mineral Resource – Amended April 23, 2026 | 146 |
| 25.0 | INTERPRETATION AND CONCLUSIONS |
At Manhattan, most high-grade gold mineralization occurs in high-angle structures that range in thickness from metres to tens of metres wide. Where these structures intersect adjacent zones of fracture induced permeability it can form breccias or strongly veined mineralised bodies. Similarly, where they intersect receptive, often flat-lying carbonate beds, the gold mineralization can “blow-out” to form breccias or along the beds forming stacked mantos. Surrounding the high-grade structures, there is an envelope of progressively lower gold grades that can extend up to hundreds of metres of the central structural “feeder” zone.
Historical underground mines in the district targeted the high-grade structures and proximal zones, but not the surrounding lower-grade mineralized envelope. By focussing on this broader zone of mineralization which encompasses the high-grade zones, Scorpio believes it can define near surface resources that could be suitable for open pit operations. Historical mining at Manhattan has demonstrated this is feasible with the West, East, USD, ISP, Keystone and Jumbo open pits all having enveloped older small underground mines.
Historical drilling does not extend beyond a vertical depth of approximately 300 m. The Company believes that there are numerous exploration targets at depth that will be the subject of future exploration. Deeper drill holes will explore for high-grade targets where feeders intersect structural intersections, down-dip projections of receptive beds and fold closures.
| Manhattan Mineral Resource – Amended April 23, 2026 | 147 |
| 26.0 | RECOMMENDATIONS |
| 26.1 | Recommendations for Future Exploration Programs |
Mr. Dumala recommends the following:
| 26.1.1 | Mapping and Sampling |
Much of the available data at Manhattan is restricted to drilling and historical mining. Surface mapping and sampling has not been prioritized. It is recommended that in conjunction with future drill programs Scorpio completes a detailed geological mapping program of the entire property. Where safe to access, historical workings can provide excellent exposure. Systematic soil and rock sampling should be completed at the same time.
| 26.1.2 | Data Compilation |
Scorpio is actively reviewing and digitizing historical drill hole and other data from all available sources. The geologic interpretation, modelling of attributes such as lithology, faults, and mineralization controls, and the resulting resource estimates were prepared using only data that had been digitized as of the report’s effective date. Additional drilling, data collection, and further digitization of historical data may require revisions to wireframes, interpolation methodologies, density modelling, or other attributes which may impact future mineral resource estimates. Historical mine and exploration records should continue to be reviewed for any additional documentation that would support collar coordinate, down-hole survey, assay, and other drill-hole data. Any additional data found should be incorporated in future MREs.
| 26.1.3 | QA/QC Program |
Scorpio’s 2024 drill program used CRMs obtained from a commercial supplier in 2.5 kg jars. Personnel divided the jars into 50 g sachets, in a clean environment. When inserted into the sample stream, two sachets (100 g total) were submitted. It is recommended that Scorpio source new, prepackaged CRM material to avoid any potential contamination. Packages should contain enough material to for the laboratory to perform multiple analysis on without the need to combine multiple CRMs.
| 26.2 | Recommended Metallurgical Tests for Future Studies |
Depending on the level of drilling and resource estimation, Dr. Ibrado recommends that Scorpio Gold embark on a metallurgical testing program that will fulfill the requirements of a preliminary feasibility study. The following outlines a testing program that may be employed:
| 26.2.1 | Composites for Testing |
For a preliminary feasibility study, composites from the deposit can be assembled to represent material types or rock types that may influence processing and recovery. The composites need to be assembled from drill intervals that will represent a projected orebody. Based on previous reports of the deposit, the following rock types may be used to create composites that will represent the entire mineral deposit that will be potentially mined:
| 1. | Quartz-mica-schist: This rock type has been identified as controlling gold mineralization. |
| 2. | Quartzite: Also known to control gold mineralization. |
| Manhattan Mineral Resource – Amended April 23, 2026 | 148 |
| 3. | Siliceous limestone. |
| 4. | Phyllite: Observed to contain only minor gold. |
The composites may be assembled from existing core, ensuring that the intervals chosen were from parts of the deposit that have not been mined. Additional drilling may have to be performed to make up enough material for the composite after taking core for assays. Coarse rejects (~10 mesh) may be used for metallurgical testing if rejects are preserved and stored properly with their original identifying information.
| 26.2.2 | Mineral Characterization |
For a gold-silver deposit, cores samples are submitted to a third-party assay laboratory for gold and silver assays. Oftentimes, other elements are included in the assays that may affect processing, for example, copper, which increases cyanide consumption, cyanide soluble gold and silver for heap leach-grade ores, sulphide sulfur analysis to map the occurrence of sulphides in the deposit, mineralogical analyses by QEMSCAN or TIMA to identify gold mineralization and associations, gold liberation size, preg-robbing or organic carbon analyses if preg-robbing is suspected in the deposit, arsenic, and mercury. For mineral materials that are suspected to be refractory or preg-robbing, a diagnostic leach may be performed. These analyses may be performed on the composites or on core intervals, depending on the short-range and long-range plans for characterizing the deposit.
| 26.2.3 | Metallurgical Tests |
Subject each composite to a testing program to develop an optimized process to recover gold. The following tests are recommended:
| a. | Measurement of comminution parameters including Bond crushing work index (CWi), Bond rod mill work index (RWi), Bond ball mill work index (BWi), and Bond abrasion index (Ai). Comminution parameter measurement (JK drop weight tests/SMC, crushing index, rod mill and ball mill indices, and abrasion index). SAG mill indices will only be required if the tonnage planned would justify the use of a SAG mill. |
| b. | Enhanced Gravity Recoverable Gold (eGRG) tests to establish parameters that vendors need to size gravity concentrators and estimate gravity circuit recoveries. |
| c. | Bottle-roll or agitated cyanidation tests to determine grind size, leach kinetics (residence time), leach recoveries and reagent consumptions. |
| d. | If required or warranted, flotation tests followed by cyanidation if sulphide is abundant and if mineralogy and diagnostic leach warrant them. The post-flotation leach may be done with and without regrind. Determine float grind size, reagent scheme, and flow sheet. |
| e. | If a low-grade composite is collected with a view of heap leaching, perform column leach tests, mainly exploring different crush sizes and agglomeration schemes (if needed). |
| f. | Develop standard procedures to be applied to variability samples for future variability testing. |
| g. | Ancillary tests, including thickening tests, filtration tests (if dry-stacking is contemplated), and cyanide detoxification tests. |
| Manhattan Mineral Resource – Amended April 23, 2026 | 149 |
| 26.3 | Recommendations for Future Resource Estimations |
In preparation for future mineral resource estimates, Mr. Dumala recommends the following:
| 26.3.1 | Additional Drilling |
Drill spacing in the previously mined East, West, and USD pits is generally less than 20m and appears to have been sufficient to guide past open pit mining activities. While many areas of the current in-situ resource are drilled to a similarly dense spacing, they were not considered for Measured or Indicated resource classification due to the lack of available QA/QC data for pre-1992 drilling, and because collar locations for drillholes which have been partially or completely mined out cannot be directly verified in the field. It is therefore recommended that several historical drillholes in key areas within the 2025 MRE pit shell be twinned with diamond and/or reverse circulation to assess variability and potential bias between current and historical drilling and sampling methodologies, and that additional confirmation drilling be completed prior to estimating Measured or Indicated resources.
| 26.3.2 | Historical Mine Surveys |
The accuracy of modeled historical mine workings has not been verified using modern methods, such as underground LiDAR surveys. Construction of the current depletion solids therefore relied on digitized and georeferenced historical production maps. While the work was completed to the highest level of accuracy possible with the current available dataset, the position and dimensions of modeled underground workings may be inaccurate. Other historical mine workings may also be present which have not yet been documented. It is therefore recommended that a LiDAR survey of existing underground workings be completed prior to future MREs.
| 26.3.3 | Density Data Collection |
Density measurements are only available from drill core collected during Scorpio’s 2024 diamond drilling campaign and are not present in sufficient number or spatial distribution to accurately model density according to key geological attributes. As such, global densities were applied based primarily on values found in historical production reports. While application of a global density is a reasonable approach in the absence of other data, significant variation may exist between different lithologies, oxidation states, or alteration styles. It is therefore recommended that density data be continuously collected from drill core, pit wall samples, or other sources prior to future MREs. The density data should be spatially representative, and sufficiently distinguish the various lithologic, alteration, and oxidation types.
| 26.4 | Permitting Recommendations |
Mr. Dumala recommends the following:
| 26.4.1 | Permits and Authorizations |
Given the extent of recent transactions associated with this Project, Scorpio should communicate with applicable agencies to verify that all permits and authorizations are current and have been officially transferred to Scorpio's name. All required Project water quality data should be collected on a timely basis and all quarterly and annual reporting and WPCP renewals should be regularly filed with NDEP. An updated pit lake study, ecological risk assessment, and/or update to the RIB evaluation and predictive model are required to be completed in the near future in accordance with permit terms. We recommend close monitoring of pit lake water levels and water quality parameters, in coordination with an updated pit lake evaluation, to confirm whether the pit lake is progressing toward equilibrium conditions as previously predicted.
| Manhattan Mineral Resource – Amended April 23, 2026 | 150 |
| 26.4.2 | Water Rights |
To limit the potential risk of water right permit cancellation, all required monitoring and quarterly and annual reporting to NDWR should be completed on a timely basis, and the submitted reports should reference the complete subset of relevant water right permits. Furthermore, some or all water rights are at risk of cancellation until POC/PBU have been filed with DWR. We recommend that Scorpio rectify the POC administrative issue discussed herein to indicate the correct POD location and file POC for all five permits. Any future Plan of Operations should detail proposed water usage, thereby further demonstrating intended use of existing water rights.
| 26.4.3 | Permit Considerations with Respect to Potential Future Activities |
The status and adequacy of existing permits should be reviewed and evaluated with respect to any future potential activities, including future exploration projects or mining/milling operations. Additional baseline and/or impact evaluations (biological, cultural, hydrological, climate, etc.) and/or additional groundwater/surface water monitoring may be required. If increased mine dewatering or other major non-consumptive water usage (up to the current authorized total combined duty and/or via additional authorized or transferred water rights) is required for future project activities, additional/expanded RIB permitting, a potential modification to the applicable WPCP (which authorizes a maximum continuous pumping rate of 600 gpm), and/or other long-term water management solutions may be required to accommodate the total required dewatering rate/volume.
| 26.4.4 | Water Right Considerations with Respect to Potential Future Activities |
The required volume, manner of use, PODs, place of use (POU), etc. of existing water rights should be considered with respect to any planned or potential future project activities beyond the current scope. Depending on the details and extent of proposed project activities, additional consumptive duty and/or changes to existing water rights may be required. If changes to current water rights are required (e.g., transfer of additional water rights or change in POD from elsewhere), NDWR may require an evaluation of potential impacts on other vicinity water users (e.g., Manhattan water supply wells, other vicinity wells, and/or any vicinity surface water resources) to ensure that no other water users would be affected.
| Manhattan Mineral Resource – Amended April 23, 2026 | 151 |
| 26.5 | Proposed Budget |
An initial exploration program, including diamond drilling and metallurgic testing is estimated at $2,782,991. All prices are expressed in $US.
| Drilling | ||||
| Diamond Drilling (6,300 m) | $1,264,650 | |||
| Equipment Rentals | $80,820 | |||
| Geological Support | $311,870 | |||
| Consumables | $279,777 | |||
| Assays | $286,800 | |||
| Downhole geophysical survesy | $44,471 | |||
| SUB TOTAL: Drilling | $2,268,388 | |||
| Field Exploration | ||||
| Expert Mapping Program | $30,000 | |||
| Colorado School of mines partnership (Pit Mapping, age dating & thin sections) | $50,000 | |||
| Field Mapping Program | $53,220 | |||
| Rock Sample Geochemistry | $9,000 | |||
| Airborne geophysics - Magnetic survey | $78,000 | |||
| SUB TOTAL: Field Exploration | $220,220 | |||
| Site maintenance and General Supplies | $142,383 | |||
| Metallurgical testwork | $152,000 | |||
| TOTAL | $2,782,991 | |||
| Manhattan Mineral Resource – Amended April 23, 2026 | 152 |
| 27.0 | REFERENCES |
Albino, G.V. and C.I. Boyer, 1992: Lithologic and structural controls of gold deposits of the Santa Fe district, Mineral County, Nevada. In: Craig, S.D. (editor) Structure, tectonics and mineralization of the Walker Lane; Geological Society of Nevada Walker Lane Symposium Proceedings. Pp 187-211.
Baker, R. E., 1975a: Letter Report to Summa Corporation, August 29, 1975.
Baker, R. E., 1975b: Metallurgical Report, submitted to Summa Corporation, November 10, 1975.
Berry, A., and Willard, P., 1997: Exploration and Pre-Production Mine Development: New Concept Mining, Inc.
Buchanan, L.J., 1981: Precious metal Deposits Associated with Volcanic Environments in the Southwest; Dickinson, W.R. and Payne, W.D., (editors) Relations of Tectonics to Ore Deposits in the Southern Cordillera; Arizona Geological Society Digest Volume XIV, Pp 237-262.
Carneiro, R.R., 2007: METCON Research, Beneficiation Testing, METCON Project No. M-691-01 for Royal Standard Mineral Inc., January 31, 2007.Echo Bay Mines Ltd., March 31, 1987: Annual Report 1986.
Cowdery, P.H., 1991: A Systematic Approach to Ore Reserve Estimation, Vancouver, B.C., 31 p.
Echo Bay Mines Ltd., March 19, 1988: Annual Report 1987.
Echo Bay Mines Ltd., March 17, 1989: Annual Report 1988.
Esmeralda County, 2019: Minutes from the June 4, 2019 Commission Meeting: Esmeralda County, Nevada
Ferguson, H.G., 1924: Geology and Ore Deposits of the Manhattan District, Nevada; U.S. Geological Survey Bulletin 723, Pp 163
Hanson, W., 2006: Round Mountain Mine Technical Report; Kinross Gold Corporation.
Hedenquist, J.W., Arribas, A., and Gonzalez-Urien, E., 2000: Exploration for Epithermal Gold Deposits; SEG Reviews Volume 13, Pp 245-277.
Heinen-Lindstrom Consultants, 1986: Preliminary Gravity Concentration and Cyanidation of Composite Drill Cuttings Sample from Gold Wedge Property, HLC Job No. 1128, for FMC Corporation Minerals Division, February 6, 1986.
Houston International Minerals Corporation (HIMCO), 1983: Manhattan Feasibility Study
| Manhattan Mineral Resource – Amended April 23, 2026 | 153 |
Kautz Environmental Consultants, Inc. (Kautz), 2017: A Class III Cultural Resource Inventory of 190 Acres for the Keystone-Jumbo Exploration Project, Nye County, Nevada. Forest Service Report No: R2017041702649. August 17. Prepared for: U.S. Forest Service, Austin Ranger District, on behalf of: Scorpio Gold Corp.
Kral, V. 1951: Gold Production of the Gold Metals Mine, Bull. 45; Nevada Bureau of Mines, Pp 119-120.
McClelland, G., 1988: Gold Wedge Test Data, for FMC Gold Company, May 31, 1988.
McClelland Laboratories Inc., 2012: Gold Wedge Test Data, for Manhattan Mining Company, MLI Job No. 3641, March 6, 2012.
Oliver, N., 2025: Structural and field assessment of the Manhattan District, Nevada: Internal report prepared for Scorpio Gold Corporation by HCOV Global.
NAS, 2018: Goldwedge LLC, Keystone-Jumbo Exploration Project DRAFT Biological Evaluation/ Specialist’s Report, Plants. Prepared for: U.S. Forest Service, Austin Ranger District, on behalf of: Goldwedge LLC. August.
NDWR, 2016: Re: Pit Lake Evaporation. Letter from Nevada State Engineer (Jason King, P.E.) Nevada Mining Association President (Dana Bennett, PhD). 1 November.
Patton, T.C., Eliopulos, G.J., and Martin, L.G., 1982: Manhattan Project, Nye County, Nevada, 1982 Final Report; Huston International Minerals Corporation.
Schlumberger Water Services (Schlumberger), 2013: Hydrogeologic Characterization, Goldwedge Project, Manhattan, Nevada. Prepared for Goldwedge, LLC. March 25.
Shawe, D.R., 1986: Geological Document on the Manhattan Properties; Nevada Manhattan Mining, Inc., Unpublished company documents.
Shawe, D.R., 1999: Geological Map of the Manhattan Quadrangle, Nye County, Nevada: United States Geological Survey.
Simmons, S.F., White, N.C. and John, D.A., 2005: Geological Characteristics of Epithermal Precious and Base Metal Deposits; Economic Geology, One Hundredth Anniversary Volume 1905-2005. Pp. 485-522.
SRK Consulting, Inc. (SRK), 2016: Goldwedge Exploration Project, Biological Evaluation/Specialist’s Report. Prepared for: U.S. Forest Service, Austin Ranger District, on behalf of: Goldwedge LLC. June.
SRK, 2019: Manhattan Pit Lake Study Update, Water Pollution Control Permit NEV22013 [sic; assumed to correctly reference NEV0088013]. Prepared for: Nevada Division of Environmental Protection – Bureau of Mining Regulation and Reclamation. July 15.
| Manhattan Mineral Resource – Amended April 23, 2026 | 154 |
Strachan, D. G., and Master, T. D., 2005: Update and Revision of the Gold Wedge Project Development, Nye County, Nevada; Royal Standard Minerals, Inc.
Todd Engineers, 2013: Evaluation of Dewatering and Infiltration Impacts, Goldwedge Mine, Manhattan Nevada. Prepared for: Goldwedge LLC, managed by: Scorpio Gold (US) Corporation. December 23.
USDA NRCS, 2025: United States Department of Agriculture, Natural Resources Conservation Service. Issued May 2022, Revised April 2025. Land resource regions and major land resource areas of the United States, the Caribbean, and the Pacific Basin; U.S. Department of Agriculture, Agriculture Handbook 296.
| Manhattan Mineral Resource – Amended April 23, 2026 | 155 |
| 28.0 | CERTIFICATES OF QUALIFIED PERSONS |
| Manhattan Mineral Resource – Amended April 23, 2026 | 156 |
CERTIFICATE OF QUALIFIED PERSON
I, Matthew R. Dumala, P.Eng., of Vancouver, British Columbia, do hereby certify that:
| 1 | I am a consulting Geological Engineer and President of Archer Cathro Geological (US) Ltd., with a mailing address at #335 1285 Baring Blvd, Sparks, NV, 89434. |
| 2 | This certificate applies to the technical report titled “Mineral Resource Estimate and NI 43-101 Technical Report, Manhattan Property, Nye County, Nevada, U.S.A.” with an effective date of 4th June 2025 (the “Technical Report”) prepared for Scorpio Gold Corporation (“the Issuer”). |
| 3 | I am a graduate of the University of British Columbia in Vancouver, Canada (Bachelor of Science in Geological Engineering in 2002), and received an Applied Geostatistics Citation from the University of Alberta in 2021. I am a Professional Engineer in good standing with the Engineers and Geoscientists British Columbia (Reg. #32783). |
| 4 | I have practiced my profession continuously since 2003 and have experience in epithermal and intrusion related precious metal systems in Nevada, Yukon, and Mexico. My experience has focused on developing deposit models through drilling and interpretation to prepare for resource estimations and engineering studies. I have designed, implemented, and evaluated QA/QC programs for public companies since 2009. |
| 5 | I have read the definition of "qualified person" set out in National Instrument 43-101 (“NI 43-101”) and certify that by reason of my education, affiliation with a professional association (as defined in NI 43-101) and past relevant work experience, I fulfill the requirements to be a "qualified person" for the purposes of NI 43-101. |
| 6 | I last visited the Manhattan Property on April 10th, 2025. |
| 7 | I am responsible for Sections 1.0 (except 1.5), 2.0 thru 12.0, 14.0, 23.0 thru 25.0, 26.0 (except 26.2), and 27.0 of the Technical Report. |
| 8 | I am independent of the Issuer applying all of the tests in Section 1.5 of NI 43-101. |
| 9 | I have had no prior involvement with the property that is the subject of the Technical Report. |
| 10 | I have read NI 43-101, and the Technical Report has been prepared in compliance with NI 43-101 and Form 43-101F1. |
| 11 | As of the effective date of the Technical Report and the date of this certificate, to the best of my knowledge, information and belief, this Technical Report contains all scientific and technical information that is required to be disclosed to make the Technical Report not misleading. |
Effective Date: 4 June 2025
Signing Date: April 23, 2026
“Signed by Matthew Dumala”
Matthew R. Dumala, P.Eng.(BC)
| Manhattan Mineral Resource – Amended April 23, 2026 | 157 |
CERTIFICATE OF QUALIFIED PERSON
I, Art S. Ibrado, PhD, PE, do hereby certify that:
| 1. | I am an independent metallurgical consultant with Fort Lowell Consulting PLLC, 1700 E River Rd #64833, Tucson, AZ 85728, USA. |
| 2. | I hold the following degrees: |
Bachelor
of Science in Metallurgical Engineering, cum laude, University of the Philippines, 1980
Master of Science (Metallurgy), University of California, Berkeley, 1986
Doctor of Philosophy (Metallurgy), University of California, Berkeley, 1993
| 3. | I am a registered professional engineer in the State of Arizona (No. 58140), the State of Idaho (No. 22492), and the State of Nevada (No. 031704). |
| 4. | I have worked as a metallurgist in academic and research settings for fifteen years, including research on the mechanism of adsorption of gold cyanide on activated carbon (graduate research) and the oxidation of refractory gold ores (AJ Parker Centre for Hydrometallurgy, Perth, Australia). My industrial experience includes copper flotation for 8.5 years at Philex Mining (Philippines) and Phoenix Mine (Battle Mountain, NV); carbon-in-pulp (CIP) and carbon-in-leach (CIL) processes for gold recovery for a combined 9 years at Philex Mining, Barrick Goldstrike and Newmont’s Twin Creeks and Phoenix operations; pressure oxidation (POX) of refractory gold ores at Barrick Goldstrike and Newmont’s Twin Creeks operations; carbon elution using the Zadra and modified AARL processes; and gold smelting. I worked as project manager or lead process engineer at M3 Engineering for 12 years, on several projects, plant commissioning, HAZOPS workshops. As an independent consultant, I have worked on the commissioning of the old Sutter Creek mine process plant, the Pumpkin Hollow plant (Nevada), and supported the restart of the adsorption, desorption and regeneration (ADR) plant at Çöpler Mine’s heap leach operation in Türkiye. |
| 5. | I have read the definition of “Qualified Person” set out in National Instrument 43-101 (“NI 43-101”) and certify that, by reason of my education, professional engineer registration, and relevant experience, I fulfill the requirements to be a “Qualified Person” for the purposes of NI 43-101. |
| 6. | I am responsible for Sections 1.5, 13, and 26.2 of the “Technical Report titled Mineral Resources Estimate and NI 43-101 Technical Report, Manhattan Property, Nye County, Nevada (the “Technical Report”), with an effective date of June 4, 2025 and prepared for Scorpio Gold Corporation. |
| 7. | I have not visited the property. |
| 8. | As of the effective date of the Technical Report, to the best of my knowledge, information and belief, the parts of the Technical Report for which I am responsible contain all scientific and technical information that is required to be disclosed to make the Technical Report not misleading. |
| 9. | I am independent of Scorpio Gold Corporation as independence is described in Section 1.5 of NI 43-101. I do not own any Scorpio Gold Corporation stocks or shares. |
| 10. | I have no prior involvement with the Manhattan Project. |
| 11. | I have read National Instrument 43-101 and Form 43-101F1, and the Technical Report has been prepared in compliance with that instrument and form. |
| Manhattan Mineral Resource – Amended April 23, 2026 | 158 |
| 12. | I consent to the filing of the Technical Report with any stock exchange and other regulatory authority and any publication by them for regulatory purposes, including electronic publication in the public company files on their website accessible by the public, of the Technical Report. |
Effective Date: 4 June 2025.
Dated this 23rd Day of April 2026.
“Signed by Art Ibrado”
Art S. Ibrado, PhD, PE
| Manhattan Mineral Resource – Amended April 23, 2026 | 159 |
Appendix I: Claim Locations
| Manhattan Mineral Resource – Amended April 23, 2026 | 160 |
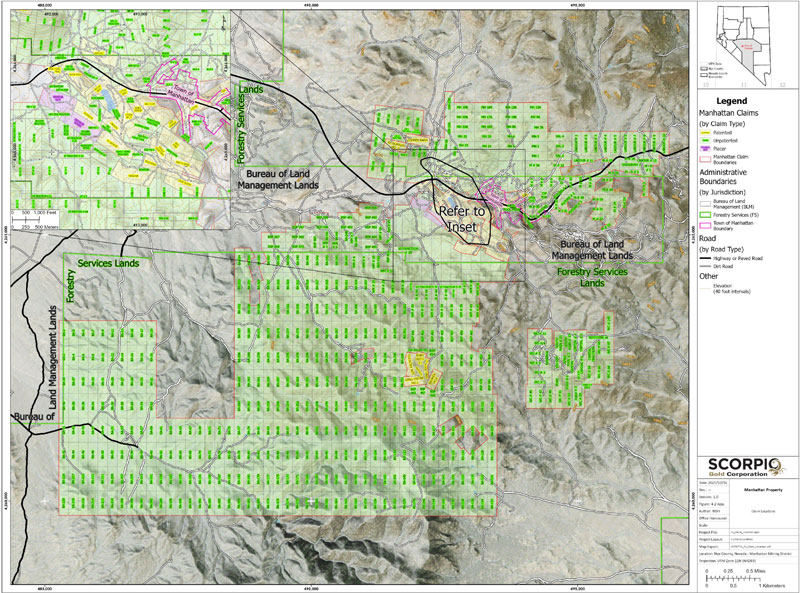
| Manhattan Mineral Resource – Amended April 23, 2026 | 161 |
Appendix II: Claim List
| Manhattan Mineral Resource – Amended April 23, 2026 | 162 |
Patented Claims
| Claim Name | Serial Number | Parcel ID | Owner | Date of Location | Survey # |
| BABY RUTH | NVNVAA 001646 | 000-006-59 | KG Mining (Round Mountain) Inc. (50%); Round Mountain Gold Corporation (50%) | 2/27/1908 | 2973 |
| BABY RUTH NO.1 | NVNVAA 001647 | 000-006-59 | KG Mining (Round Mountain) Inc. (50%); Round Mountain Gold Corporation (50%) | 2/27/1908 | 2975 |
| BABY RUTH NO.2 | NVNVAA 001648 | 000-006-59 | KG Mining (Round Mountain) Inc. (50%); Round Mountain Gold Corporation (50%) | 3/2/1908 | 2975 |
| BIG FOUR | NVNVAA 001657 | 000-006-59 | KG Mining (Round Mountain) Inc. (50%); Round Mountain Gold Corporation (50%) | 10/8/1908 | 2696 |
| BIG PINE | NVNVAA 001640 | 000-006-59 | KG Mining (Round Mountain) Inc. (50%); Round Mountain Gold Corporation (50%) | 1/20/1908 | 2759 |
| BROKEN PICK | NVNVAA 001649 | 000-006-59 | KG Mining (Round Mountain) Inc. (50%); Round Mountain Gold Corporation (50%) | 3/2/1908 | 2976 |
| COUNTRY BOY | NVNVAA 001655 | 000-006-59 | KG Mining (Round Mountain) Inc. (50%); Round Mountain Gold Corporation (50%) | 7/27/1908 | 2986 |
| CRESENT | NVCC 0000532 | 000-006-59 | KG Mining (Round Mountain) Inc. (50%); Round Mountain Gold Corporation (50%) | 12/27/1909 | 2845 |
| GOLD WEDGE | NVCC 0000529 | 000-006-59 | KG Mining (Round Mountain) Inc. (50%); Round Mountain Gold Corporation (50%) | 11/1/1909 | 2847 |
| IRON KING | NVCC 0001403 | 000-006-62 | KG Mining (Round Mountain) Inc. (50%); Round Mountain Gold Corporation (50%) | 2/1/1912 | 2879 amended |
| IRON QUEEN | NVCC 0001403 | 000-006-62 | KG Mining (Round Mountain) Inc. (50%); Round Mountain Gold Corporation (50%) | 2/1/1912 | 2879 amended |
| KING OSCAR NO.1 | NVNVAA 001645 | 000-006-59 | KG Mining (Round Mountain) Inc. (50%); Round Mountain Gold Corporation (50%) | 2/27/1908 | 2977 |
| LAST CHANCE | NVNVAA 001657 | 000-006-59 | KG Mining (Round Mountain) Inc. (50%); Round Mountain Gold Corporation (50%) | 10/8/1908 | 2696 |
| LITTLE GREY | NVNVAA 001650 | 000-006-59 | KG Mining (Round Mountain) Inc. (50%); Round Mountain Gold Corporation (50%) | 3/9/1908 | 2743 |
| MAY FLOWER | NVNVAA 001640 | 000-006-59 | KG Mining (Round Mountain) Inc. (50%); Round Mountain Gold Corporation (50%) | 1/20/1908 | 2759 |
| Manhattan Mineral Resource – Amended April 23, 2026 | 163 |
| Claim Name | Serial Number | Parcel ID | Owner | Date of Location | Survey # |
| NELLIE GRAY | NVCC 0000530 | 000-007-07 | KG Mining (Round Mountain) Inc. (50%); Round Mountain Gold Corporation (50%) | 11/1/1909 | 2848 |
| REILLY FRACTION | NVCC 0000531 | 000-006-59 | KG Mining (Round Mountain) Inc. (50%); Round Mountain Gold Corporation (50%) | 12/27/1909 | 2846 |
| SKOOKUM | NVNVAA 001653 | 000-006-59 | KG Mining (Round Mountain) Inc. (50%); Round Mountain Gold Corporation (50%) | 3/26/1908 | 2822 |
| ST GEORGE | NVNVAA 001641 | 000-006-59 | KG Mining (Round Mountain) Inc. (50%); Round Mountain Gold Corporation (50%) | 1/23/1908 | 2729 |
| UNION NO.9 | NVCC 0000456 | 000-006-59 | KG Mining (Round Mountain) Inc. (50%); Round Mountain Gold Corporation (50%) | 4/23/1909 | 2556 |
| VIRGINIA | NVNVAA 001654 | 000-006-59 | KG Mining (Round Mountain) Inc. (50%); Round Mountain Gold Corporation (50%) | 4/9/1908 | 2965 |
| ELDORADO #2 | NVCC 0001401 | 000-158-59 | Goldwedge, LLC c/o Scorpio Gold (US) Corporation | 4/11/1912 | 2876 |
| COPPER FARM | NVCC 0001401 | 000-158-59 | Goldwedge, LLC c/o Scorpio Gold (US) Corporation | 4/11/1912 | 2876 |
| ORPHANT | NVCC 0007577 | 000-007-34 | Goldwedge, LLC c/o Scorpio Gold (US) Corporation | 5/28/1914 | 4095 |
| WOLFTONE | NVCC 0003355 | 000-156-75 | Goldwedge, LLC c/o Scorpio Gold (US) Corporation | 2/19/1916 | 2831 amended |
| WOLFTONE FRACTION | NVCC 0003355 | 000-156-75 | Goldwedge, LLC c/o Scorpio Gold (US) Corporation | 2/19/1916 | 2831 amended |
| LOTTIE | NVCC 0009798 | 000-006-74 | Goldwedge, LLC c/o Scorpio Gold (US) Corporation | 4/8/1914 | 4299 |
| IDA | NVCC 0009798 | 000-006-74 | Goldwedge, LLC c/o Scorpio Gold (US) Corporation | 4/8/1914 | 4299 |
| Manhattan Mineral Resource – Amended April 23, 2026 | 164 |
Unpatented Federal Claims
| Claim Name | Serial Number | Owner | Date of Location | Case Type |
| ABB NO 23 | NV101477907 | NEW CONCEPT MNG INC | 6/21/1996 | Lode |
| ABB NO 24 | NV101300102 | NEW CONCEPT MNG INC | 6/21/1996 | Lode |
| ADJACENT WITCH JR. | NV101509208 | ROUND MOUNTAIN GOLD CORP | 3/8/1980 | Lode |
| ADJACIENT WITCH | NV101347408 | ROUND MOUNTAIN GOLD CORP | 7/12/1979 | Lode |
| APRIL FOOL | NV101480207 | GOLDWEDGE LLC | 4/1/1912 | Lode |
| APRIL FOOL # 1 | NV101502148 | GOLDWEDGE LLC | 9/1/1969 | Lode |
| APRIL FOOL FRAC | NV101731393 | GOLDWEDGE LLC | 4/1/1912 | Lode |
| AUCTION FRACTION | NV101540949 | ROUND MOUNTAIN GOLD CORP | 1/12/1987 | Lode |
| BA-1 | NV106730076 | SCORPIO GOLD CORP | 4/4/2025 | Lode |
| BA-10 | NV106730085 | SCORPIO GOLD CORP | 4/4/2025 | Lode |
| BA-100 | NV106730175 | SCORPIO GOLD CORP | 4/4/2025 | Lode |
| BA-101 | NV106730176 | SCORPIO GOLD CORP | 4/4/2025 | Lode |
| BA-102 | NV106730177 | SCORPIO GOLD CORP | 4/4/2025 | Lode |
| BA-103 | NV106730178 | SCORPIO GOLD CORP | 4/4/2025 | Lode |
| BA-104 | NV106730179 | SCORPIO GOLD CORP | 4/4/2025 | Lode |
| BA-105 | NV106730180 | SCORPIO GOLD CORP | 4/4/2025 | Lode |
| BA-106 | NV106730181 | SCORPIO GOLD CORP | 4/4/2025 | Lode |
| BA-107 | NV106730182 | SCORPIO GOLD CORP | 4/4/2025 | Lode |
| BA-108 | NV106730183 | SCORPIO GOLD CORP | 4/4/2025 | Lode |
| BA-109 | NV106730184 | SCORPIO GOLD CORP | 4/4/2025 | Lode |
| BA-11 | NV106730086 | SCORPIO GOLD CORP | 4/4/2025 | Lode |
| BA-110 | NV106730185 | SCORPIO GOLD CORP | 4/4/2025 | Lode |
| BA-111 | NV106730186 | SCORPIO GOLD CORP | 4/4/2025 | Lode |
| BA-112 | NV106730187 | SCORPIO GOLD CORP | 4/4/2025 | Lode |
| BA-113 | NV106730188 | SCORPIO GOLD CORP | 4/4/2025 | Lode |
| BA-114 | NV106730189 | SCORPIO GOLD CORP | 4/4/2025 | Lode |
| BA-115 | NV106730190 | SCORPIO GOLD CORP | 4/4/2025 | Lode |
| BA-116 | NV106730191 | SCORPIO GOLD CORP | 4/4/2025 | Lode |
| BA-117 | NV106730192 | SCORPIO GOLD CORP | 4/4/2025 | Lode |
| BA-118 | NV106730193 | SCORPIO GOLD CORP | 4/4/2025 | Lode |
| BA-119 | NV106730194 | SCORPIO GOLD CORP | 4/4/2025 | Lode |
| BA-12 | NV106730087 | SCORPIO GOLD CORP | 4/4/2025 | Lode |
| BA-120 | NV106730195 | SCORPIO GOLD CORP | 4/4/2025 | Lode |
| BA-121 | NV106730196 | SCORPIO GOLD CORP | 4/5/2025 | Lode |
| BA-122 | NV106730197 | SCORPIO GOLD CORP | 4/5/2025 | Lode |
| BA-123 | NV106730198 | SCORPIO GOLD CORP | 4/5/2025 | Lode |
| BA-124 | NV106730199 | SCORPIO GOLD CORP | 4/5/2025 | Lode |
| BA-125 | NV106730200 | SCORPIO GOLD CORP | 4/5/2025 | Lode |
| Manhattan Mineral Resource – Amended April 23, 2026 | 165 |
| Claim Name | Serial Number | Owner | Date of Location | Case Type |
| BA-126 | NV106730201 | SCORPIO GOLD CORP | 4/5/2025 | Lode |
| BA-127 | NV106730202 | SCORPIO GOLD CORP | 4/5/2025 | Lode |
| BA-128 | NV106730203 | SCORPIO GOLD CORP | 4/5/2025 | Lode |
| BA-129 | NV106730204 | SCORPIO GOLD CORP | 4/5/2025 | Lode |
| BA-13 | NV106730088 | SCORPIO GOLD CORP | 4/4/2025 | Lode |
| BA-130 | NV106730205 | SCORPIO GOLD CORP | 4/5/2025 | Lode |
| BA-131 | NV106730206 | SCORPIO GOLD CORP | 4/5/2025 | Lode |
| BA-132 | NV106730207 | SCORPIO GOLD CORP | 4/5/2025 | Lode |
| BA-133 | NV106730208 | SCORPIO GOLD CORP | 4/5/2025 | Lode |
| BA-134 | NV106730209 | SCORPIO GOLD CORP | 4/5/2025 | Lode |
| BA-135 | NV106730210 | SCORPIO GOLD CORP | 4/5/2025 | Lode |
| BA-136 | NV106730211 | SCORPIO GOLD CORP | 4/5/2025 | Lode |
| BA-137 | NV106730212 | SCORPIO GOLD CORP | 4/5/2025 | Lode |
| BA-138 | NV106730213 | SCORPIO GOLD CORP | 4/5/2025 | Lode |
| BA-139 | NV106730214 | SCORPIO GOLD CORP | 4/5/2025 | Lode |
| BA-14 | NV106730089 | SCORPIO GOLD CORP | 4/4/2025 | Lode |
| BA-140 | NV106730215 | SCORPIO GOLD CORP | 4/5/2025 | Lode |
| BA-141 | NV106730216 | SCORPIO GOLD CORP | 4/5/2025 | Lode |
| BA-142 | NV106730217 | SCORPIO GOLD CORP | 4/5/2025 | Lode |
| BA-143 | NV106730218 | SCORPIO GOLD CORP | 4/5/2025 | Lode |
| BA-144 | NV106730219 | SCORPIO GOLD CORP | 4/5/2025 | Lode |
| BA-145 | NV106730220 | SCORPIO GOLD CORP | 4/5/2025 | Lode |
| BA-146 | NV106730221 | SCORPIO GOLD CORP | 4/5/2025 | Lode |
| BA-147 | NV106730222 | SCORPIO GOLD CORP | 4/5/2025 | Lode |
| BA-148 | NV106730223 | SCORPIO GOLD CORP | 4/5/2025 | Lode |
| BA-149 | NV106730224 | SCORPIO GOLD CORP | 4/5/2025 | Lode |
| BA-15 | NV106730090 | SCORPIO GOLD CORP | 4/4/2025 | Lode |
| BA-150 | NV106730225 | SCORPIO GOLD CORP | 4/5/2025 | Lode |
| BA-151 | NV106730226 | SCORPIO GOLD CORP | 4/5/2025 | Lode |
| BA-152 | NV106730227 | SCORPIO GOLD CORP | 4/5/2025 | Lode |
| BA-153 | NV106730228 | SCORPIO GOLD CORP | 4/5/2025 | Lode |
| BA-154 | NV106730229 | SCORPIO GOLD CORP | 4/5/2025 | Lode |
| BA-155 | NV106730230 | SCORPIO GOLD CORP | 4/5/2025 | Lode |
| BA-156 | NV106730231 | SCORPIO GOLD CORP | 4/5/2025 | Lode |
| BA-157 | NV106730232 | SCORPIO GOLD CORP | 4/5/2025 | Lode |
| BA-158 | NV106730233 | SCORPIO GOLD CORP | 4/5/2025 | Lode |
| BA-159 | NV106730234 | SCORPIO GOLD CORP | 4/5/2025 | Lode |
| BA-16 | NV106730091 | SCORPIO GOLD CORP | 4/4/2025 | Lode |
| BA-160 | NV106730235 | SCORPIO GOLD CORP | 4/5/2025 | Lode |
| BA-161 | NV106730236 | SCORPIO GOLD CORP | 4/5/2025 | Lode |
| Manhattan Mineral Resource – Amended April 23, 2026 | 166 |
| Claim Name | Serial Number | Owner | Date of Location | Case Type |
| BA-162 | NV106730237 | SCORPIO GOLD CORP | 4/5/2025 | Lode |
| BA-163 | NV106730238 | SCORPIO GOLD CORP | 4/5/2025 | Lode |
| BA-164 | NV106730239 | SCORPIO GOLD CORP | 4/5/2025 | Lode |
| BA-165 | NV106730240 | SCORPIO GOLD CORP | 4/5/2025 | Lode |
| BA-166 | NV106730241 | SCORPIO GOLD CORP | 4/5/2025 | Lode |
| BA-168 | NV106730243 | SCORPIO GOLD CORP | 4/5/2025 | Lode |
| BA-169 | NV106730244 | SCORPIO GOLD CORP | 4/5/2025 | Lode |
| BA-17 | NV106730092 | SCORPIO GOLD CORP | 4/4/2025 | Lode |
| BA-170 | NV106730245 | SCORPIO GOLD CORP | 4/5/2025 | Lode |
| BA-171 | NV106730246 | SCORPIO GOLD CORP | 4/5/2025 | Lode |
| BA-172 | NV106730247 | SCORPIO GOLD CORP | 4/5/2025 | Lode |
| BA-173 | NV106730248 | SCORPIO GOLD CORP | 4/5/2025 | Lode |
| BA-174 | NV106730249 | SCORPIO GOLD CORP | 4/5/2025 | Lode |
| BA-175 | NV106730250 | SCORPIO GOLD CORP | 4/5/2025 | Lode |
| BA-176 | NV106730251 | SCORPIO GOLD CORP | 4/5/2025 | Lode |
| BA-177 | NV106730252 | SCORPIO GOLD CORP | 4/5/2025 | Lode |
| BA-178 | NV106730253 | SCORPIO GOLD CORP | 4/5/2025 | Lode |
| BA-179 | NV106730254 | SCORPIO GOLD CORP | 4/5/2025 | Lode |
| BA-18 | NV106730093 | SCORPIO GOLD CORP | 4/4/2025 | Lode |
| BA-180 | NV106730255 | SCORPIO GOLD CORP | 4/5/2025 | Lode |
| BA-181 | NV106730256 | SCORPIO GOLD CORP | 4/5/2025 | Lode |
| BA-182 | NV106730257 | SCORPIO GOLD CORP | 4/5/2025 | Lode |
| BA-183 | NV106730258 | SCORPIO GOLD CORP | 4/5/2025 | Lode |
| BA-184 | NV106730259 | SCORPIO GOLD CORP | 4/5/2025 | Lode |
| BA-185 | NV106730260 | SCORPIO GOLD CORP | 4/5/2025 | Lode |
| BA-186 | NV106730261 | SCORPIO GOLD CORP | 4/5/2025 | Lode |
| BA-187 | NV106730262 | SCORPIO GOLD CORP | 4/5/2025 | Lode |
| BA-188 | NV106730263 | SCORPIO GOLD CORP | 4/5/2025 | Lode |
| BA-189 | NV106730264 | SCORPIO GOLD CORP | 4/5/2025 | Lode |
| BA-19 | NV106730094 | SCORPIO GOLD CORP | 4/4/2025 | Lode |
| BA-190 | NV106730265 | SCORPIO GOLD CORP | 4/5/2025 | Lode |
| BA-191 | NV106730266 | SCORPIO GOLD CORP | 4/5/2025 | Lode |
| BA-192 | NV106730267 | SCORPIO GOLD CORP | 4/5/2025 | Lode |
| BA-193 | NV106730268 | SCORPIO GOLD CORP | 4/5/2025 | Lode |
| BA-194 | NV106730269 | SCORPIO GOLD CORP | 4/5/2025 | Lode |
| BA-195 | NV106730270 | SCORPIO GOLD CORP | 4/5/2025 | Lode |
| BA-196 | NV106730271 | SCORPIO GOLD CORP | 4/5/2025 | Lode |
| BA-197 | NV106730272 | SCORPIO GOLD CORP | 4/5/2025 | Lode |
| BA-198 | NV106730273 | SCORPIO GOLD CORP | 4/5/2025 | Lode |
| BA-199 | NV106730274 | SCORPIO GOLD CORP | 4/5/2025 | Lode |
| Manhattan Mineral Resource – Amended April 23, 2026 | 167 |
| Claim Name | Serial Number | Owner | Date of Location | Case Type |
| BA-2 | NV106730077 | SCORPIO GOLD CORP | 4/4/2025 | Lode |
| BA-20 | NV106730095 | SCORPIO GOLD CORP | 4/4/2025 | Lode |
| BA-200 | NV106730275 | SCORPIO GOLD CORP | 4/5/2025 | Lode |
| BA-201 | NV106730276 | SCORPIO GOLD CORP | 4/5/2025 | Lode |
| BA-202 | NV106730277 | SCORPIO GOLD CORP | 4/5/2025 | Lode |
| BA-203 | NV106730278 | SCORPIO GOLD CORP | 4/5/2025 | Lode |
| BA-204 | NV106730279 | SCORPIO GOLD CORP | 4/5/2025 | Lode |
| BA-205 | NV106730280 | SCORPIO GOLD CORP | 4/5/2025 | Lode |
| BA-206 | NV106730281 | SCORPIO GOLD CORP | 4/5/2025 | Lode |
| BA-207 | NV106730282 | SCORPIO GOLD CORP | 4/5/2025 | Lode |
| BA-208 | NV106730283 | SCORPIO GOLD CORP | 4/5/2025 | Lode |
| BA-209 | NV106730284 | SCORPIO GOLD CORP | 4/5/2025 | Lode |
| BA-21 | NV106730096 | SCORPIO GOLD CORP | 4/4/2025 | Lode |
| BA-210 | NV106730285 | SCORPIO GOLD CORP | 4/5/2025 | Lode |
| BA-211 | NV106730286 | SCORPIO GOLD CORP | 4/5/2025 | Lode |
| BA-212 | NV106730287 | SCORPIO GOLD CORP | 4/5/2025 | Lode |
| BA-213 | NV106730288 | SCORPIO GOLD CORP | 4/5/2025 | Lode |
| BA-214 | NV106730289 | SCORPIO GOLD CORP | 4/5/2025 | Lode |
| BA-215 | NV106730290 | SCORPIO GOLD CORP | 4/5/2025 | Lode |
| BA-216 | NV106730291 | SCORPIO GOLD CORP | 4/5/2025 | Lode |
| BA-217 | NV106730292 | SCORPIO GOLD CORP | 4/5/2025 | Lode |
| BA-218 | NV106730293 | SCORPIO GOLD CORP | 4/5/2025 | Lode |
| BA-219 | NV106730294 | SCORPIO GOLD CORP | 4/5/2025 | Lode |
| BA-22 | NV106730097 | SCORPIO GOLD CORP | 4/4/2025 | Lode |
| BA-220 | NV106730295 | SCORPIO GOLD CORP | 4/5/2025 | Lode |
| BA-221 | NV106730296 | SCORPIO GOLD CORP | 4/5/2025 | Lode |
| BA-222 | NV106730297 | SCORPIO GOLD CORP | 4/5/2025 | Lode |
| BA-223 | NV106730298 | SCORPIO GOLD CORP | 4/5/2025 | Lode |
| BA-224 | NV106730299 | SCORPIO GOLD CORP | 4/5/2025 | Lode |
| BA-225 | NV106730300 | SCORPIO GOLD CORP | 4/5/2025 | Lode |
| BA-226 | NV106730301 | SCORPIO GOLD CORP | 4/5/2025 | Lode |
| BA-227 | NV106730302 | SCORPIO GOLD CORP | 4/5/2025 | Lode |
| BA-228 | NV106730303 | SCORPIO GOLD CORP | 4/5/2025 | Lode |
| BA-229 | NV106730304 | SCORPIO GOLD CORP | 4/5/2025 | Lode |
| BA-23 | NV106730098 | SCORPIO GOLD CORP | 4/4/2025 | Lode |
| BA-230 | NV106730305 | SCORPIO GOLD CORP | 4/5/2025 | Lode |
| BA-231 | NV106730306 | SCORPIO GOLD CORP | 4/5/2025 | Lode |
| BA-232 | NV106730307 | SCORPIO GOLD CORP | 4/5/2025 | Lode |
| BA-233 | NV106730308 | SCORPIO GOLD CORP | 4/5/2025 | Lode |
| BA-234 | NV106730309 | SCORPIO GOLD CORP | 4/5/2025 | Lode |
| Manhattan Mineral Resource – Amended April 23, 2026 | 168 |
| Claim Name | Serial Number | Owner | Date of Location | Case Type |
| BA-235 | NV106730310 | SCORPIO GOLD CORP | 4/5/2025 | Lode |
| BA-236 | NV106730311 | SCORPIO GOLD CORP | 4/5/2025 | Lode |
| BA-237 | NV106730312 | SCORPIO GOLD CORP | 4/5/2025 | Lode |
| BA-238 | NV106730313 | SCORPIO GOLD CORP | 4/5/2025 | Lode |
| BA-239 | NV106730314 | SCORPIO GOLD CORP | 4/5/2025 | Lode |
| BA-24 | NV106730099 | SCORPIO GOLD CORP | 4/4/2025 | Lode |
| BA-240 | NV106730315 | SCORPIO GOLD CORP | 4/5/2025 | Lode |
| BA-241 | NV106730316 | SCORPIO GOLD CORP | 4/6/2025 | Lode |
| BA-242 | NV106730317 | SCORPIO GOLD CORP | 4/6/2025 | Lode |
| BA-243 | NV106730318 | SCORPIO GOLD CORP | 4/6/2025 | Lode |
| BA-244 | NV106730319 | SCORPIO GOLD CORP | 4/6/2025 | Lode |
| BA-245 | NV106730320 | SCORPIO GOLD CORP | 4/6/2025 | Lode |
| BA-246 | NV106730321 | SCORPIO GOLD CORP | 4/6/2025 | Lode |
| BA-247 | NV106730322 | SCORPIO GOLD CORP | 4/6/2025 | Lode |
| BA-248 | NV106730323 | SCORPIO GOLD CORP | 4/6/2025 | Lode |
| BA-249 | NV106730324 | SCORPIO GOLD CORP | 4/6/2025 | Lode |
| BA-25 | NV106730100 | SCORPIO GOLD CORP | 4/4/2025 | Lode |
| BA-250 | NV106730325 | SCORPIO GOLD CORP | 4/6/2025 | Lode |
| BA-251 | NV106730326 | SCORPIO GOLD CORP | 4/6/2025 | Lode |
| BA-252 | NV106730327 | SCORPIO GOLD CORP | 4/6/2025 | Lode |
| BA-253 | NV106730328 | SCORPIO GOLD CORP | 4/6/2025 | Lode |
| BA-254 | NV106730329 | SCORPIO GOLD CORP | 4/6/2025 | Lode |
| BA-255 | NV106730330 | SCORPIO GOLD CORP | 4/6/2025 | Lode |
| BA-256 | NV106730331 | SCORPIO GOLD CORP | 4/6/2025 | Lode |
| BA-257 | NV106730332 | SCORPIO GOLD CORP | 4/6/2025 | Lode |
| BA-258 | NV106730333 | SCORPIO GOLD CORP | 4/6/2025 | Lode |
| BA-259 | NV106730334 | SCORPIO GOLD CORP | 4/6/2025 | Lode |
| BA-26 | NV106730101 | SCORPIO GOLD CORP | 4/4/2025 | Lode |
| BA-260 | NV106730335 | SCORPIO GOLD CORP | 4/6/2025 | Lode |
| BA-261 | NV106730336 | SCORPIO GOLD CORP | 4/6/2025 | Lode |
| BA-262 | NV106730337 | SCORPIO GOLD CORP | 4/6/2025 | Lode |
| BA-263 | NV106730338 | SCORPIO GOLD CORP | 4/6/2025 | Lode |
| BA-264 | NV106730339 | SCORPIO GOLD CORP | 4/6/2025 | Lode |
| BA-265 | NV106730340 | SCORPIO GOLD CORP | 4/6/2025 | Lode |
| BA-266 | NV106730341 | SCORPIO GOLD CORP | 4/6/2025 | Lode |
| BA-267 | NV106730342 | SCORPIO GOLD CORP | 4/6/2025 | Lode |
| BA-268 | NV106730343 | SCORPIO GOLD CORP | 4/6/2025 | Lode |
| BA-269 | NV106730344 | SCORPIO GOLD CORP | 4/6/2025 | Lode |
| BA-27 | NV106730102 | SCORPIO GOLD CORP | 4/4/2025 | Lode |
| BA-270 | NV106730345 | SCORPIO GOLD CORP | 4/6/2025 | Lode |
| Manhattan Mineral Resource – Amended April 23, 2026 | 169 |
| Claim Name | Serial Number | Owner | Date of Location | Case Type |
| BA-271 | NV106730346 | SCORPIO GOLD CORP | 4/6/2025 | Lode |
| BA-272 | NV106730347 | SCORPIO GOLD CORP | 4/6/2025 | Lode |
| BA-273 | NV106730348 | SCORPIO GOLD CORP | 4/6/2025 | Lode |
| BA-274 | NV106730349 | SCORPIO GOLD CORP | 4/6/2025 | Lode |
| BA-275 | NV106730350 | SCORPIO GOLD CORP | 4/6/2025 | Lode |
| BA-276 | NV106730351 | SCORPIO GOLD CORP | 4/6/2025 | Lode |
| BA-277 | NV106730352 | SCORPIO GOLD CORP | 4/6/2025 | Lode |
| BA-278 | NV106730353 | SCORPIO GOLD CORP | 4/6/2025 | Lode |
| BA-279 | NV106730354 | SCORPIO GOLD CORP | 4/6/2025 | Lode |
| BA-28 | NV106730103 | SCORPIO GOLD CORP | 4/4/2025 | Lode |
| BA-280 | NV106730355 | SCORPIO GOLD CORP | 4/6/2025 | Lode |
| BA-281 | NV106730356 | SCORPIO GOLD CORP | 4/6/2025 | Lode |
| BA-282 | NV106730357 | SCORPIO GOLD CORP | 4/6/2025 | Lode |
| BA-283 | NV106730358 | SCORPIO GOLD CORP | 4/6/2025 | Lode |
| BA-284 | NV106730359 | SCORPIO GOLD CORP | 4/6/2025 | Lode |
| BA-285 | NV106730360 | SCORPIO GOLD CORP | 4/6/2025 | Lode |
| BA-286 | NV106730361 | SCORPIO GOLD CORP | 4/6/2025 | Lode |
| BA-287 | NV106730362 | SCORPIO GOLD CORP | 4/6/2025 | Lode |
| BA-288 | NV106730363 | SCORPIO GOLD CORP | 4/6/2025 | Lode |
| BA-289 | NV106730364 | SCORPIO GOLD CORP | 4/6/2025 | Lode |
| BA-29 | NV106730104 | SCORPIO GOLD CORP | 4/4/2025 | Lode |
| BA-290 | NV106730365 | SCORPIO GOLD CORP | 4/6/2025 | Lode |
| BA-291 | NV106730366 | SCORPIO GOLD CORP | 4/6/2025 | Lode |
| BA-292 | NV106730367 | SCORPIO GOLD CORP | 4/6/2025 | Lode |
| BA-293 | NV106730368 | SCORPIO GOLD CORP | 4/6/2025 | Lode |
| BA-294 | NV106730369 | SCORPIO GOLD CORP | 4/6/2025 | Lode |
| BA-295 | NV106730370 | SCORPIO GOLD CORP | 4/6/2025 | Lode |
| BA-296 | NV106730371 | SCORPIO GOLD CORP | 4/6/2025 | Lode |
| BA-297 | NV106730372 | SCORPIO GOLD CORP | 4/6/2025 | Lode |
| BA-298 | NV106730373 | SCORPIO GOLD CORP | 4/6/2025 | Lode |
| BA-299 | NV106730374 | SCORPIO GOLD CORP | 4/6/2025 | Lode |
| BA-3 | NV106730078 | SCORPIO GOLD CORP | 4/4/2025 | Lode |
| BA-30 | NV106730105 | SCORPIO GOLD CORP | 4/4/2025 | Lode |
| BA-300 | NV106730375 | SCORPIO GOLD CORP | 4/6/2025 | Lode |
| BA-301 | NV106730376 | SCORPIO GOLD CORP | 4/6/2025 | Lode |
| BA-302 | NV106730377 | SCORPIO GOLD CORP | 4/6/2025 | Lode |
| BA-303 | NV106730378 | SCORPIO GOLD CORP | 4/6/2025 | Lode |
| BA-304 | NV106730379 | SCORPIO GOLD CORP | 4/6/2025 | Lode |
| BA-305 | NV106730380 | SCORPIO GOLD CORP | 4/6/2025 | Lode |
| BA-306 | NV106730381 | SCORPIO GOLD CORP | 4/6/2025 | Lode |
| Manhattan Mineral Resource – Amended April 23, 2026 | 170 |
| Claim Name | Serial Number | Owner | Date of Location | Case Type |
| BA-307 | NV106730382 | SCORPIO GOLD CORP | 4/6/2025 | Lode |
| BA-308 | NV106730383 | SCORPIO GOLD CORP | 4/6/2025 | Lode |
| BA-309 | NV106730384 | SCORPIO GOLD CORP | 4/6/2025 | Lode |
| BA-31 | NV106730106 | SCORPIO GOLD CORP | 4/4/2025 | Lode |
| BA-310 | NV106730385 | SCORPIO GOLD CORP | 4/6/2024 | Lode |
| BA-311 | NV106730386 | SCORPIO GOLD CORP | 4/6/2025 | Lode |
| BA-312 | NV106730387 | SCORPIO GOLD CORP | 4/6/2025 | Lode |
| BA-313 | NV106730388 | SCORPIO GOLD CORP | 4/6/2025 | Lode |
| BA-314 | NV106730389 | SCORPIO GOLD CORP | 4/6/2025 | Lode |
| BA-315 | NV106730390 | SCORPIO GOLD CORP | 4/6/2025 | Lode |
| BA-316 | NV106730391 | SCORPIO GOLD CORP | 4/6/2025 | Lode |
| BA-317 | NV106730392 | SCORPIO GOLD CORP | 4/6/2025 | Lode |
| BA-318 | NV106730393 | SCORPIO GOLD CORP | 4/6/2025 | Lode |
| BA-319 | NV106730394 | SCORPIO GOLD CORP | 4/6/2025 | Lode |
| BA-32 | NV106730107 | SCORPIO GOLD CORP | 4/4/2025 | Lode |
| BA-320 | NV106730395 | SCORPIO GOLD CORP | 4/6/2025 | Lode |
| BA-321 | NV106730396 | SCORPIO GOLD CORP | 4/6/2025 | Lode |
| BA-322 | NV106730397 | SCORPIO GOLD CORP | 4/6/2025 | Lode |
| BA-323 | NV106730398 | SCORPIO GOLD CORP | 4/6/2025 | Lode |
| BA-324 | NV106730399 | SCORPIO GOLD CORP | 4/6/2025 | Lode |
| BA-325 | NV106730400 | SCORPIO GOLD CORP | 4/6/2025 | Lode |
| BA-326 | NV106730401 | SCORPIO GOLD CORP | 4/6/2025 | Lode |
| BA-327 | NV106730402 | SCORPIO GOLD CORP | 4/6/2025 | Lode |
| BA-328 | NV106730403 | SCORPIO GOLD CORP | 4/6/2025 | Lode |
| BA-329 | NV106730404 | SCORPIO GOLD CORP | 4/6/2025 | Lode |
| BA-33 | NV106730108 | SCORPIO GOLD CORP | 4/4/2025 | Lode |
| BA-330 | NV106730405 | SCORPIO GOLD CORP | 4/6/2025 | Lode |
| BA-331 | NV106730406 | SCORPIO GOLD CORP | 4/6/2025 | Lode |
| BA-332 | NV106730407 | SCORPIO GOLD CORP | 4/6/2025 | Lode |
| BA-333 | NV106730408 | SCORPIO GOLD CORP | 4/6/2025 | Lode |
| BA-334 | NV106730409 | SCORPIO GOLD CORP | 4/6/2025 | Lode |
| BA-335 | NV106730410 | SCORPIO GOLD CORP | 4/6/2025 | Lode |
| BA-336 | NV106730411 | SCORPIO GOLD CORP | 4/6/2025 | Lode |
| BA-337 | NV106730412 | SCORPIO GOLD CORP | 4/6/2025 | Lode |
| BA-338 | NV106730413 | SCORPIO GOLD CORP | 4/6/2025 | Lode |
| BA-339 | NV106730414 | SCORPIO GOLD CORP | 4/6/2025 | Lode |
| BA-34 | NV106730109 | SCORPIO GOLD CORP | 4/4/2025 | Lode |
| BA-340 | NV106730415 | SCORPIO GOLD CORP | 4/6/2025 | Lode |
| BA-341 | NV106730416 | SCORPIO GOLD CORP | 4/6/2025 | Lode |
| BA-342 | NV106730417 | SCORPIO GOLD CORP | 4/6/2025 | Lode |
| Manhattan Mineral Resource – Amended April 23, 2026 | 171 |
| Claim Name | Serial Number | Owner | Date of Location | Case Type |
| BA-343 | NV106730418 | SCORPIO GOLD CORP | 4/6/2025 | Lode |
| BA-344 | NV106730419 | SCORPIO GOLD CORP | 4/6/2025 | Lode |
| BA-345 | NV106730420 | SCORPIO GOLD CORP | 4/6/2025 | Lode |
| BA-346 | NV106730421 | SCORPIO GOLD CORP | 4/6/2025 | Lode |
| BA-347 | NV106730422 | SCORPIO GOLD CORP | 4/6/2025 | Lode |
| BA-348 | NV106730423 | SCORPIO GOLD CORP | 4/6/2025 | Lode |
| BA-349 | NV106730424 | SCORPIO GOLD CORP | 4/6/2025 | Lode |
| BA-35 | NV106730110 | SCORPIO GOLD CORP | 4/4/2025 | Lode |
| BA-36 | NV106730111 | SCORPIO GOLD CORP | 4/4/2025 | Lode |
| BA-37 | NV106730112 | SCORPIO GOLD CORP | 4/4/2025 | Lode |
| BA-38 | NV106730113 | SCORPIO GOLD CORP | 4/4/2025 | Lode |
| BA-39 | NV106730114 | SCORPIO GOLD CORP | 4/4/2025 | Lode |
| BA-4 | NV106730079 | SCORPIO GOLD CORP | 4/4/2025 | Lode |
| BA-40 | NV106730115 | SCORPIO GOLD CORP | 4/4/2025 | Lode |
| BA-41 | NV106730116 | SCORPIO GOLD CORP | 4/4/2025 | Lode |
| BA-42 | NV106730117 | SCORPIO GOLD CORP | 4/4/2025 | Lode |
| BA-43 | NV106730118 | SCORPIO GOLD CORP | 4/4/2025 | Lode |
| BA-44 | NV106730119 | SCORPIO GOLD CORP | 4/4/2025 | Lode |
| BA-45 | NV106730120 | SCORPIO GOLD CORP | 4/4/2025 | Lode |
| BA-46 | NV106730121 | SCORPIO GOLD CORP | 4/4/2025 | Lode |
| BA-47 | NV106730122 | SCORPIO GOLD CORP | 4/4/2025 | Lode |
| BA-48 | NV106730123 | SCORPIO GOLD CORP | 4/4/2025 | Lode |
| BA-49 | NV106730124 | SCORPIO GOLD CORP | 4/4/2025 | Lode |
| BA-5 | NV106730080 | SCORPIO GOLD CORP | 4/4/2025 | Lode |
| BA-50 | NV106730125 | SCORPIO GOLD CORP | 4/4/2025 | Lode |
| BA-51 | NV106730126 | SCORPIO GOLD CORP | 4/4/2025 | Lode |
| BA-52 | NV106730127 | SCORPIO GOLD CORP | 4/4/2025 | Lode |
| BA-53 | NV106730128 | SCORPIO GOLD CORP | 4/4/2025 | Lode |
| BA-54 | NV106730129 | SCORPIO GOLD CORP | 4/4/2025 | Lode |
| BA-55 | NV106730130 | SCORPIO GOLD CORP | 4/4/2025 | Lode |
| BA-56 | NV106730131 | SCORPIO GOLD CORP | 4/4/2025 | Lode |
| BA-57 | NV106730132 | SCORPIO GOLD CORP | 4/4/2025 | Lode |
| BA-58 | NV106730133 | SCORPIO GOLD CORP | 4/4/2025 | Lode |
| BA-59 | NV106730134 | SCORPIO GOLD CORP | 4/4/2025 | Lode |
| BA-6 | NV106730081 | SCORPIO GOLD CORP | 4/4/2025 | Lode |
| BA-60 | NV106730135 | SCORPIO GOLD CORP | 4/4/2025 | Lode |
| BA-61 | NV106730136 | SCORPIO GOLD CORP | 4/4/2025 | Lode |
| BA-62 | NV106730137 | SCORPIO GOLD CORP | 4/4/2025 | Lode |
| BA-63 | NV106730138 | SCORPIO GOLD CORP | 4/4/2025 | Lode |
| BA-64 | NV106730139 | SCORPIO GOLD CORP | 4/4/2025 | Lode |
| Manhattan Mineral Resource – Amended April 23, 2026 | 172 |
| Claim Name | Serial Number | Owner | Date of Location | Case Type |
| BA-65 | NV106730140 | SCORPIO GOLD CORP | 4/4/2025 | Lode |
| BA-66 | NV106730141 | SCORPIO GOLD CORP | 4/4/2025 | Lode |
| BA-67 | NV106730142 | SCORPIO GOLD CORP | 4/4/2025 | Lode |
| BA-68 | NV106730143 | SCORPIO GOLD CORP | 4/4/2025 | Lode |
| BA-69 | NV106730144 | SCORPIO GOLD CORP | 4/4/2025 | Lode |
| BA-7 | NV106730082 | SCORPIO GOLD CORP | 4/4/2025 | Lode |
| BA-70 | NV106730145 | SCORPIO GOLD CORP | 4/4/2025 | Lode |
| BA-71 | NV106730146 | SCORPIO GOLD CORP | 4/4/2025 | Lode |
| BA-72 | NV106730147 | SCORPIO GOLD CORP | 4/4/2025 | Lode |
| BA-73 | NV106730148 | SCORPIO GOLD CORP | 4/4/2025 | Lode |
| BA-74 | NV106730149 | SCORPIO GOLD CORP | 4/4/2025 | Lode |
| BA-75 | NV106730150 | SCORPIO GOLD CORP | 4/4/2025 | Lode |
| BA-76 | NV106730151 | SCORPIO GOLD CORP | 4/4/2025 | Lode |
| BA-77 | NV106730152 | SCORPIO GOLD CORP | 4/4/2025 | Lode |
| BA-78 | NV106730153 | SCORPIO GOLD CORP | 4/4/2025 | Lode |
| BA-79 | NV106730154 | SCORPIO GOLD CORP | 4/4/2025 | Lode |
| BA-8 | NV106730083 | SCORPIO GOLD CORP | 4/4/2025 | Lode |
| BA-80 | NV106730155 | SCORPIO GOLD CORP | 4/4/2025 | Lode |
| BA-81 | NV106730156 | SCORPIO GOLD CORP | 4/4/2025 | Lode |
| BA-82 | NV106730157 | SCORPIO GOLD CORP | 4/4/2025 | Lode |
| BA-83 | NV106730158 | SCORPIO GOLD CORP | 4/4/2025 | Lode |
| BA-84 | NV106730159 | SCORPIO GOLD CORP | 4/4/2025 | Lode |
| BA-85 | NV106730160 | SCORPIO GOLD CORP | 4/4/2025 | Lode |
| BA-86 | NV106730161 | SCORPIO GOLD CORP | 4/4/2025 | Lode |
| BA-87 | NV106730162 | SCORPIO GOLD CORP | 4/4/2025 | Lode |
| BA-88 | NV106730163 | SCORPIO GOLD CORP | 4/4/2025 | Lode |
| BA-89 | NV106730164 | SCORPIO GOLD CORP | 4/4/2025 | Lode |
| BA-9 | NV106730084 | SCORPIO GOLD CORP | 4/4/2025 | Lode |
| BA-90 | NV106730165 | SCORPIO GOLD CORP | 4/4/2025 | Lode |
| BA-91 | NV106730166 | SCORPIO GOLD CORP | 4/4/2025 | Lode |
| BA-92 | NV106730167 | SCORPIO GOLD CORP | 4/4/2025 | Lode |
| BA-93 | NV106730168 | SCORPIO GOLD CORP | 4/4/2025 | Lode |
| BA-94 | NV106730169 | SCORPIO GOLD CORP | 4/4/2025 | Lode |
| BA-95 | NV106730170 | SCORPIO GOLD CORP | 4/4/2025 | Lode |
| BA-96 | NV106730171 | SCORPIO GOLD CORP | 4/4/2025 | Lode |
| BA-97 | NV106730172 | SCORPIO GOLD CORP | 4/4/2025 | Lode |
| BA-98 | NV106730173 | SCORPIO GOLD CORP | 4/4/2025 | Lode |
| BA-99 | NV106730174 | SCORPIO GOLD CORP | 4/4/2025 | Lode |
| BIG SAM | NV101402742 | GOLDWEDGE LLC | 9/1/1969 | Lode |
| BLACK JACK # 2 | NV101477630 | ROUND MOUNTAIN GOLD CORP | 6/29/1971 | Lode |
| Manhattan Mineral Resource – Amended April 23, 2026 | 173 |
| Claim Name | Serial Number | Owner | Date of Location | Case Type |
| BLUE JAY | NV101525299 | ROUND MOUNTAIN GOLD CORP | 6/30/1971 | Lode |
| BOATSAN | NV101453542 | ROUND MOUNTAIN GOLD CORP | 7/14/1971 | Lode |
| BONANZA | NV101302839 | GOLDWEDGE LLC | 9/1/1969 | Lode |
| BOSTON FRACTION | NV101780998 | ROUND MOUNTAIN GOLD CORP | 1/12/1987 | Lode |
| BSP 367 | NV101626686 | ROUND MOUNTAIN GOLD CORP | 12/17/2008 | Lode |
| BSP 368 | NV101626687 | ROUND MOUNTAIN GOLD CORP | 12/17/2008 | Lode |
| BSP 369 | NV101626688 | ROUND MOUNTAIN GOLD CORP | 12/17/2008 | Lode |
| BSP 370 | NV101626689 | ROUND MOUNTAIN GOLD CORP | 12/17/2008 | Lode |
| BSP 397 | NV101626690 | ROUND MOUNTAIN GOLD CORP | 12/17/2008 | Lode |
| BSP 398 | NV101626691 | ROUND MOUNTAIN GOLD CORP | 12/17/2008 | Lode |
| BSP 399 | NV101626692 | ROUND MOUNTAIN GOLD CORP | 12/17/2008 | Lode |
| BSP 400 | NV101626693 | ROUND MOUNTAIN GOLD CORP | 12/17/2008 | Lode |
| BSP 401 | NV101626694 | ROUND MOUNTAIN GOLD CORP | 12/17/2008 | Lode |
| BSP 402 | NV101627323 | ROUND MOUNTAIN GOLD CORP | 12/17/2008 | Lode |
| BSP 403 | NV101627324 | ROUND MOUNTAIN GOLD CORP | 12/17/2008 | Lode |
| BSP 404 | NV101627325 | ROUND MOUNTAIN GOLD CORP | 12/17/2008 | Lode |
| BSP 405 | NV101627326 | ROUND MOUNTAIN GOLD CORP | 12/17/2008 | Lode |
| BSP 406 | NV101627327 | ROUND MOUNTAIN GOLD CORP | 12/17/2008 | Lode |
| BSP 407 | NV101627328 | ROUND MOUNTAIN GOLD CORP | 12/18/2008 | Lode |
| BSP 410 | NV101627331 | ROUND MOUNTAIN GOLD CORP | 12/17/2008 | Lode |
| BSP 411 | NV101627330 | ROUND MOUNTAIN GOLD CORP | 12/17/2008 | Lode |
| BSP 449 | NV101381032 | ROUND MOUNTAIN GOLD CORP | 11/19/2009 | Lode |
| BSP 450 | NV101381033 | ROUND MOUNTAIN GOLD CORP | 11/19/2009 | Lode |
| BSP 451 | NV101381034 | ROUND MOUNTAIN GOLD CORP | 11/19/2009 | Lode |
| BSP 452 | NV101381035 | ROUND MOUNTAIN GOLD CORP | 11/19/2009 | Lode |
| BSP 453 | NV101381036 | ROUND MOUNTAIN GOLD CORP | 11/19/2009 | Lode |
| BSP 454 | NV101381037 | ROUND MOUNTAIN GOLD CORP | 11/19/2009 | Lode |
| BSP 455 | NV101381038 | ROUND MOUNTAIN GOLD CORP | 11/19/2009 | Lode |
| BSP 456 | NV101381039 | ROUND MOUNTAIN GOLD CORP | 11/19/2009 | Lode |
| BSP 457 | NV101381040 | ROUND MOUNTAIN GOLD CORP | 11/19/2009 | Lode |
| BSP 458 | NV101381041 | ROUND MOUNTAIN GOLD CORP | 11/19/2009 | Lode |
| BSP 459 | NV101381042 | ROUND MOUNTAIN GOLD CORP | 11/19/2009 | Lode |
| BSP 460 | NV101381043 | ROUND MOUNTAIN GOLD CORP | 11/19/2009 | Lode |
| BSP 461 | NV101382167 | ROUND MOUNTAIN GOLD CORP | 11/19/2009 | Lode |
| BSP 462 | NV101382168 | ROUND MOUNTAIN GOLD CORP | 11/19/2009 | Lode |
| BSP 463 | NV101382169 | ROUND MOUNTAIN GOLD CORP | 11/17/2009 | Lode |
| BSP 464 | NV101382170 | ROUND MOUNTAIN GOLD CORP | 11/17/2009 | Lode |
| BSP 465 | NV101382171 | ROUND MOUNTAIN GOLD CORP | 11/17/2009 | Lode |
| BSP 467 | NV101382172 | ROUND MOUNTAIN GOLD CORP | 11/17/2009 | Lode |
| BSP 469 | NV101382173 | ROUND MOUNTAIN GOLD CORP | 11/17/2009 | Lode |
| Manhattan Mineral Resource – Amended April 23, 2026 | 174 |
| Claim Name | Serial Number | Owner | Date of Location | Case Type |
| BSP 471 | NV101382174 | ROUND MOUNTAIN GOLD CORP | 11/17/2009 | Lode |
| BSP 473 | NV101382175 | ROUND MOUNTAIN GOLD CORP | 11/17/2009 | Lode |
| BSP 475 | NV101382176 | ROUND MOUNTAIN GOLD CORP | 11/17/2009 | Lode |
| BSP 477 | NV101382177 | ROUND MOUNTAIN GOLD CORP | 11/17/2009 | Lode |
| BSP 479 | NV101382178 | ROUND MOUNTAIN GOLD CORP | 11/17/2009 | Lode |
| BSP 481 | NV101382179 | ROUND MOUNTAIN GOLD CORP | 11/17/2009 | Lode |
| CAPITAL | NV101543478 | GOLDWEDGE LLC | 7/1/1931 | Lode |
| CAPITAL # 1 | NV101494482 | GOLDWEDGE LLC | 7/1/1931 | Lode |
| CAPITAL # 2 | NV101543577 | GOLDWEDGE LLC | 7/1/1931 | Lode |
| CAPITAL # 3 | NV101607297 | GOLDWEDGE LLC | 7/1/1931 | Lode |
| CAPITAL FRACTION | NV101540909 | GOLDWEDGE LLC | 6/29/1935 | Lode |
| FOLLOWING | NV101606579 | ROUND MOUNTAIN GOLD CORP | 5/22/1979 | Lode |
| FORD | NV101453917 | GOLDWEDGE LLC | 9/1/1969 | Lode |
| FORD # 2 | NV101478931 | GOLDWEDGE LLC | 9/1/1969 | Lode |
| FORD # 3 | NV101458099 | GOLDWEDGE LLC | 9/1/1969 | Lode |
| FORD #4 FRAC | NV101567862 | GOLDWEDGE LLC | 11/1/2016 | Lode |
| FUTURE | NV101478088 | GOLDWEDGE LLC | 4/16/1953 | Lode |
| FUTURE # 1 | NV101343290 | GOLDWEDGE LLC | 4/16/1953 | Lode |
| FUTURE # 2 | NV101500848 | GOLDWEDGE LLC | 4/16/1953 | Lode |
| FUTURE # 3 | NV101406578 | GOLDWEDGE LLC | 4/16/1953 | Lode |
| GOLDEN TRIANGLE | NV101409267 | ROUND MOUNTAIN GOLD CORP | 9/2/1982 | Lode |
| GT # 1 | NV101497071 | ROUND MOUNTAIN GOLD CORP | 1/25/1978 | Lode |
| GT # 2 | NV101480267 | ROUND MOUNTAIN GOLD CORP | 1/25/1978 | Lode |
| GT # 3 | NV101455429 | ROUND MOUNTAIN GOLD CORP | 1/25/1978 | Lode |
| GT # 4 | NV102521237 | ROUND MOUNTAIN GOLD CORP | 1/25/1978 | Lode |
| GT # 5 | NV101759543 | ROUND MOUNTAIN GOLD CORP | 5/6/1980 | Lode |
| GT # 6 | NV101480150 | ROUND MOUNTAIN GOLD CORP | 5/5/1980 | Lode |
| GT # 7 | NV101550249 | ROUND MOUNTAIN GOLD CORP | 5/5/1980 | Lode |
| GT # 8 | NV101300882 | ROUND MOUNTAIN GOLD CORP | 5/5/1980 | Lode |
| GT # 9 | NV101451998 | ROUND MOUNTAIN GOLD CORP | 5/5/1980 | Lode |
| GT # 10 | NV101349638 | ROUND MOUNTAIN GOLD CORP | 5/5/1980 | Lode |
| GT # 11 | NV101453382 | ROUND MOUNTAIN GOLD CORP | 5/5/1980 | Lode |
| GT # 12 | NV101348417 | ROUND MOUNTAIN GOLD CORP | 5/5/1980 | Lode |
| GT # 13 | NV101479258 | ROUND MOUNTAIN GOLD CORP | 5/5/1980 | Lode |
| GT # 14 | NV101347411 | ROUND MOUNTAIN GOLD CORP | 5/5/1980 | Lode |
| GT # 15 | NV101477836 | ROUND MOUNTAIN GOLD CORP | 5/5/1980 | Lode |
| GT # 16 | NV101302538 | ROUND MOUNTAIN GOLD CORP | 5/5/1980 | Lode |
| GT # 17 | NV101601363 | ROUND MOUNTAIN GOLD CORP | 5/5/1980 | Lode |
| GT FRACTION # 18 | NV101609564 | ROUND MOUNTAIN GOLD CORP | 5/14/1987 | Lode |
| GT FRACTION # 19 | NV101497813 | ROUND MOUNTAIN GOLD CORP | 5/15/1987 | Lode |
| Manhattan Mineral Resource – Amended April 23, 2026 | 175 |
| Claim Name | Serial Number | Owner | Date of Location | Case Type |
| GT FRACTION # 20 | NV101781033 | ROUND MOUNTAIN GOLD CORP | 5/15/1987 | Lode |
| GT FRACTION # 21 | NV101343057 | ROUND MOUNTAIN GOLD CORP | 5/15/1987 | Lode |
| GT FRACTION # 22 | NV101456616 | ROUND MOUNTAIN GOLD CORP | 5/15/1987 | Lode |
| GT FRACTION # 23 | NV101344446 | ROUND MOUNTAIN GOLD CORP | 5/15/1987 | Lode |
| GT FRACTION # 24 | NV101604181 | ROUND MOUNTAIN GOLD CORP | 5/17/1987 | Lode |
| GT FRACTION # 25 | NV101494955 | ROUND MOUNTAIN GOLD CORP | 5/17/1987 | Lode |
| GT FRACTION # 26 | NV101407351 | ROUND MOUNTAIN GOLD CORP | 5/17/1987 | Lode |
| GW 10 | NV101476020 | GOLDWEDGE LLC | 7/12/2001 | Lode |
| GW 28 | NV101381816 | GOLDWEDGE LLC | 5/23/2002 | Lode |
| GW 29 | NV101381817 | GOLDWEDGE LLC | 5/23/2002 | Lode |
| GW 30 | NV101382943 | GOLDWEDGE LLC | 5/23/2002 | Lode |
| GW 31 | NV101382944 | GOLDWEDGE LLC | 5/23/2002 | Lode |
| GW 32 | NV101382945 | GOLDWEDGE LLC | 5/23/2002 | Lode |
| GW 7 | NV101475075 | GOLDWEDGE LLC | 6/22/2001 | Lode |
| GW 8 | NV101475076 | GOLDWEDGE LLC | 6/22/2001 | Lode |
| GW 9 | NV101476019 | GOLDWEDGE LLC | 6/22/2001 | Lode |
| GW-11R | NV101756037 | GOLDWEDGE LLC | 5/20/2015 | Lode |
| GW-12 FRACTION | NV101756038 | GOLDWEDGE LLC | 5/20/2015 | Lode |
| GW-18 | NV101387490 | GOLDWEDGE LLC | 10/31/2001 | Lode |
| GW-19 | NV101387491 | GOLDWEDGE LLC | 10/31/2001 | Lode |
| GW-20 | NV101387492 | GOLDWEDGE LLC | 10/31/2001 | Lode |
| GW-21 | NV101387493 | GOLDWEDGE LLC | 10/31/2001 | Lode |
| GW-22 | NV101388699 | GOLDWEDGE LLC | 10/31/2001 | Lode |
| GW-22 FRACTION | NV101756034 | GOLDWEDGE LLC | 5/20/2015 | Lode |
| GW-23 | NV101388700 | GOLDWEDGE LLC | 10/31/2001 | Lode |
| GW-23R | NV101756035 | GOLDWEDGE LLC | 6/17/2015 | Lode |
| GW-24R | NV101756036 | GOLDWEDGE LLC | 6/17/2015 | Lode |
| GW-24RR | NV101570667 | GOLDWEDGE LLC | 7/18/2016 | Lode |
| GW-25RR | NV101570668 | GOLDWEDGE LLC | 7/18/2016 | Lode |
| GW-26RR | NV101570669 | GOLDWEDGE LLC | 7/18/2016 | Lode |
| GW-27RR | NV101570670 | GOLDWEDGE LLC | 7/18/2016 | Lode |
| GW-33RR | NV101570671 | GOLDWEDGE LLC | 7/18/2016 | Lode |
| GW-34 | NV101517826 | GOLDWEDGE LLC | 11/1/2002 | Lode |
| GW-35 FRACTION | NV101570665 | GOLDWEDGE LLC | 6/2/2016 | Lode |
| GW-36 FRACTION | NV101570666 | GOLDWEDGE LLC | 6/2/2016 | Lode |
| GW-4R | NV101387487 | GOLDWEDGE LLC | 11/12/2001 | Lode |
| GW-5R | NV101387488 | GOLDWEDGE LLC | 11/12/2001 | Lode |
| GW-6R | NV101387489 | GOLDWEDGE LLC | 11/12/2001 | Lode |
| GW-8 FRACTION | NV101756032 | GOLDWEDGE LLC | 5/20/2015 | Lode |
| GW-9 FRACTION | NV101756033 | GOLDWEDGE LLC | 5/20/2015 | Lode |
| Manhattan Mineral Resource – Amended April 23, 2026 | 176 |
| Claim Name | Serial Number | Owner | Date of Location | Case Type |
| HARD ROCK | NV101493687 | ROUND MOUNTAIN GOLD CORP | 6/29/1971 | Lode |
| JUMBO | NV101502067 | ROUND MOUNTAIN GOLD CORP | 7/7/1923 | Lode |
| JUMPING JACK | NV101732066 | ROUND MOUNTAIN GOLD CORP | 5/10/1905 | Lode |
| JUNE # 1 | NV101451325 | ROUND MOUNTAIN GOLD CORP | 6/28/1973 | Lode |
| JUNE # 2 | NV101524650 | ROUND MOUNTAIN GOLD CORP | 6/28/1973 | Lode |
| JUNE # 3 | NV101477561 | ROUND MOUNTAIN GOLD CORP | 6/28/1973 | Lode |
| JUNE # 4 | NV102520765 | ROUND MOUNTAIN GOLD CORP | 6/28/1973 | Lode |
| JUNE # 5 | NV101730533 | ROUND MOUNTAIN GOLD CORP | 6/28/1973 | Lode |
| JUNE # 6 FRAC | NV101494702 | ROUND MOUNTAIN GOLD CORP | 6/29/1973 | Lode |
| KEYSTONE JR | NV101609666 | GOLDWEDGE LLC | 4/24/1961 | Lode |
| LABOUR # 1 | NV101478193 | ROUND MOUNTAIN GOLD CORP | 9/2/1981 | Lode |
| LABOUR # 2 | NV101492532 | ROUND MOUNTAIN GOLD CORP | 9/2/1981 | Lode |
| LABOUR # 3 | NV101350013 | ROUND MOUNTAIN GOLD CORP | 9/2/1981 | Lode |
| LABOUR # 4 | NV101477006 | ROUND MOUNTAIN GOLD CORP | 9/2/1981 | Lode |
| LABOUR # 5 | NV101300267 | ROUND MOUNTAIN GOLD CORP | 9/2/1981 | Lode |
| LABOUR # 6 | NV101479737 | ROUND MOUNTAIN GOLD CORP | 9/2/1981 | Lode |
| LABOUR # 7 | NV101303446 | ROUND MOUNTAIN GOLD CORP | 9/2/1981 | Lode |
| LABOUR # 8 | NV101477468 | ROUND MOUNTAIN GOLD CORP | 9/2/1981 | Lode |
| LABOUR # 9 | NV101303483 | ROUND MOUNTAIN GOLD CORP | 9/2/1981 | Lode |
| LABOUR # 10 | NV101548608 | ROUND MOUNTAIN GOLD CORP | 9/2/1981 | Lode |
| LABOUR # 11 | NV101302849 | ROUND MOUNTAIN GOLD CORP | 9/2/1981 | Lode |
| LABOUR # 12 | NV101540645 | ROUND MOUNTAIN GOLD CORP | 4/22/1982 | Lode |
| LB FRACTION | NV101302002 | ROUND MOUNTAIN GOLD CORP | 1/12/2023 | Lode |
| LILLIAN FRACTION | NV101759598 | ROUND MOUNTAIN GOLD CORP | 7/14/1971 | Lode |
| LITTLE BOB | NV101755240 | ROUND MOUNTAIN GOLD CORP | 1/28/1982 | Lode |
| M - D # 1 | NV101606625 | ROUND MOUNTAIN GOLD CORP | 9/27/1989 | Lode |
| M - D # 2 | NV101458409 | ROUND MOUNTAIN GOLD CORP | 9/27/1989 | Lode |
| M - D # 3 | NV101609324 | ROUND MOUNTAIN GOLD CORP | 9/27/1989 | Lode |
| M # 1 | NV102521493 | ROUND MOUNTAIN GOLD CORP | 4/19/1982 | Lode |
| M # 2 | NV101759635 | ROUND MOUNTAIN GOLD CORP | 4/19/1982 | Lode |
| M # 3 | NV101304518 | ROUND MOUNTAIN GOLD CORP | 4/19/1982 | Lode |
| M # 4 | NV101456553 | ROUND MOUNTAIN GOLD CORP | 4/19/1982 | Lode |
| M # 5 | NV101400873 | ROUND MOUNTAIN GOLD CORP | 4/19/1982 | Lode |
| M # 6 | NV101492759 | ROUND MOUNTAIN GOLD CORP | 4/19/1982 | Lode |
| M # 7 | NV101406087 | ROUND MOUNTAIN GOLD CORP | 4/19/1982 | Lode |
| M # 8 | NV101496927 | ROUND MOUNTAIN GOLD CORP | 4/19/1982 | Lode |
| M # 9 | NV101525603 | ROUND MOUNTAIN GOLD CORP | 4/19/1982 | Lode |
| M # 10 | NV101457149 | KG MINING (ROUND MTN) INC | 4/19/1982 | Lode |
| M # 11 | NV101526270 | ROUND MOUNTAIN GOLD CORP | 4/19/1982 | Lode |
| M # 12 | NV101456359 | ROUND MOUNTAIN GOLD CORP | 4/19/1982 | Lode |
| Manhattan Mineral Resource – Amended April 23, 2026 | 177 |
| Claim Name | Serial Number | Owner | Date of Location | Case Type |
| M # 13 | NV101406663 | ROUND MOUNTAIN GOLD CORP | 4/20/1982 | Lode |
| M # 14 | NV101540936 | ROUND MOUNTAIN GOLD CORP | 4/20/1982 | Lode |
| M # 15 | NV101527103 | KG MINING (ROUND MTN) INC | 4/20/1982 | Lode |
| M # 16 | NV101609521 | ROUND MOUNTAIN GOLD CORP | 4/20/1982 | Lode |
| M # 17 | NV101523482 | ROUND MOUNTAIN GOLD CORP | 4/22/1982 | Lode |
| M # 18 | NV101506807 | ROUND MOUNTAIN GOLD CORP | 4/20/1982 | Lode |
| M # 19 | NV101491120 | ROUND MOUNTAIN GOLD CORP | 4/20/1982 | Lode |
| M # 20 | NV101751454 | ROUND MOUNTAIN GOLD CORP | 4/20/1982 | Lode |
| M # 21 | NV101451530 | ROUND MOUNTAIN GOLD CORP | 4/22/1982 | Lode |
| M # 22 | NV101751561 | ROUND MOUNTAIN GOLD CORP | 4/22/1982 | Lode |
| M # 23 | NV101527034 | ROUND MOUNTAIN GOLD CORP | 4/22/1982 | Lode |
| M # 24 | NV101602177 | ROUND MOUNTAIN GOLD CORP | 4/21/1982 | Lode |
| M # 25 | NV101548841 | ROUND MOUNTAIN GOLD CORP | 4/21/1982 | Lode |
| M # 28 | NV101604290 | ROUND MOUNTAIN GOLD CORP | 4/22/1982 | Lode |
| M # 31 | NV101303452 | ROUND MOUNTAIN GOLD CORP | 4/29/1982 | Lode |
| M # 32 | NV101477476 | ROUND MOUNTAIN GOLD CORP | 4/29/1982 | Lode |
| M # 33 | NV102520625 | ROUND MOUNTAIN GOLD CORP | 4/29/1982 | Lode |
| M # 34 | NV101490664 | ROUND MOUNTAIN GOLD CORP | 4/29/1982 | Lode |
| M # 35 | NV101348677 | ROUND MOUNTAIN GOLD CORP | 4/29/1982 | Lode |
| M # 36 | NV101758142 | ROUND MOUNTAIN GOLD CORP | 4/29/1982 | Lode |
| M # 37 | NV101303077 | ROUND MOUNTAIN GOLD CORP | 4/29/1982 | Lode |
| M # 38 | NV101550201 | ROUND MOUNTAIN GOLD CORP | 4/29/1982 | Lode |
| M # 39 | NV101347560 | ROUND MOUNTAIN GOLD CORP | 4/29/1982 | Lode |
| M # 40 | NV101477104 | ROUND MOUNTAIN GOLD CORP | 4/29/1982 | Lode |
| M # 41 | NV101349880 | ROUND MOUNTAIN GOLD CORP | 4/29/1982 | Lode |
| M # 42 | NV101349805 | ROUND MOUNTAIN GOLD CORP | 9/13/1984 | Lode |
| M # 43 | NV101501823 | ROUND MOUNTAIN GOLD CORP | 7/1/1986 | Lode |
| M # 44 | NV101521105 | ROUND MOUNTAIN GOLD CORP | 7/1/1986 | Lode |
| M # 45 | NV101755522 | ROUND MOUNTAIN GOLD CORP | 7/1/1986 | Lode |
| M # 46 | NV101451682 | ROUND MOUNTAIN GOLD CORP | 7/1/1986 | Lode |
| MAD DOG # | NV101303712 | ROUND MOUNTAIN GOLD CORP | 12/3/1987 | Lode |
| MG # 23 | NV101404403 | ROUND MOUNTAIN GOLD CORP | 11/21/1982 | Lode |
| MH 1 | NV101627332 | ROUND MOUNTAIN GOLD CORP | 12/18/2008 | Lode |
| MH 10R | NV101568237 | GOLDWEDGE LLC | 10/28/2014 | Lode |
| MH 11R | NV101568238 | GOLDWEDGE LLC | 10/28/2014 | Lode |
| MH 12R | NV101568239 | GOLDWEDGE LLC | 10/28/2014 | Lode |
| MH 13 | NV101627729 | ROUND MOUNTAIN GOLD CORP | 12/18/2008 | Lode |
| MH 14 | NV101627338 | ROUND MOUNTAIN GOLD CORP | 12/18/2008 | Lode |
| MH 15 | NV101627339 | ROUND MOUNTAIN GOLD CORP | 12/18/2008 | Lode |
| MH 16R | NV101568240 | GOLDWEDGE LLC | 10/28/2014 | Lode |
| Manhattan Mineral Resource – Amended April 23, 2026 | 178 |
| Claim Name | Serial Number | Owner | Date of Location | Case Type |
| MH 17R | NV101568241 | GOLDWEDGE LLC | 10/28/2014 | Lode |
| MH 18R | NV101568242 | GOLDWEDGE LLC | 10/28/2014 | Lode |
| MH 19R | NV101569443 | GOLDWEDGE LLC | 10/28/2014 | Lode |
| MH 2 | NV101627333 | ROUND MOUNTAIN GOLD CORP | 12/18/2008 | Lode |
| MH 20R | NV101569444 | GOLDWEDGE LLC | 10/28/2014 | Lode |
| MH 21R | NV101569445 | GOLDWEDGE LLC | 10/28/2014 | Lode |
| MH 22 | NV101627340 | ROUND MOUNTAIN GOLD CORP | 12/18/2008 | Lode |
| MH 23 | NV101627341 | ROUND MOUNTAIN GOLD CORP | 12/18/2008 | Lode |
| MH 24 | NV101627342 | ROUND MOUNTAIN GOLD CORP | 12/18/2008 | Lode |
| MH 25 | NV101627343 | ROUND MOUNTAIN GOLD CORP | 12/18/2008 | Lode |
| MH 26 | NV101627726 | ROUND MOUNTAIN GOLD CORP | 12/18/2008 | Lode |
| MH 27 | NV101627727 | ROUND MOUNTAIN GOLD CORP | 1/24/2009 | Lode |
| MH 28 | NV101627728 | ROUND MOUNTAIN GOLD CORP | 1/24/2009 | Lode |
| MH 3 | NV101627334 | ROUND MOUNTAIN GOLD CORP | 12/18/2008 | Lode |
| MH 4 | NV101627335 | ROUND MOUNTAIN GOLD CORP | 12/18/2008 | Lode |
| MH 5 | NV101627336 | ROUND MOUNTAIN GOLD CORP | 12/18/2008 | Lode |
| MH 6 | NV101627337 | ROUND MOUNTAIN GOLD CORP | 12/18/2008 | Lode |
| MH 7R | NV101568234 | GOLDWEDGE LLC | 10/28/2014 | Lode |
| MH 8R | NV101568235 | GOLDWEDGE LLC | 10/28/2014 | Lode |
| MH 9R | NV101568236 | GOLDWEDGE LLC | 10/28/2014 | Lode |
| MIDAS | NV101492100 | ROUND MOUNTAIN GOLD CORP | 9/9/1924 | Lode |
| MIDAS NO. 1 | NV102520477 | ROUND MOUNTAIN GOLD CORP | 9/9/1924 | Lode |
| MIDAS NO. 2 | NV101341912 | ROUND MOUNTAIN GOLD CORP | 9/9/1924 | Lode |
| MONTELINER FRACTION | NV101300992 | ROUND MOUNTAIN GOLD CORP | 11/15/1971 | Lode |
| NEW RHINO | NV101543242 | ROUND MOUNTAIN GOLD CORP | 9/2/1982 | Lode |
| NEW SLIP UP | NV101731903 | ROUND MOUNTAIN GOLD CORP | 9/2/1982 | Lode |
| RED NO 1 | NV101356420 | ROUND MOUNTAIN GOLD CORP | 8/23/2006 | Lode |
| RED NO 2 | NV101356421 | ROUND MOUNTAIN GOLD CORP | 8/2/2006 | Lode |
| RED NO 3 | NV101357401 | ROUND MOUNTAIN GOLD CORP | 8/2/2006 | Lode |
| SAL 2 | NV101858677 | ROUND MOUNTAIN GOLD CORP | 4/11/2006 | Lode |
| SAL 3 | NV101858678 | ROUND MOUNTAIN GOLD CORP | 4/11/2006 | Lode |
| SAL 4 | NV101858679 | ROUND MOUNTAIN GOLD CORP | 4/11/2006 | Lode |
| SALISBURY 1 | NV101856798 | ROUND MOUNTAIN GOLD CORP | 10/15/2005 | Lode |
| SKOOKUM PLACER | NV101491374 | ROUND MOUNTAIN GOLD CORP | 5/15/1974 | Placer |
| SOUTH MAIN # 11 | NV101520558 | GOLDWEDGE LLC | 8/17/1987 | Lode |
| SOUTH MAIN # 13 | NV101497895 | GOLDWEDGE LLC | 4/22/1982 | Lode |
| SQUIRREL | NV101408638 | ROUND MOUNTAIN GOLD CORP | 9/1/1959 | Lode |
| STRAY DOG | NV101755441 | KG MINING (ROUND MTN) INC | 7/26/1905 | Lode |
| SWEET HOME FRACTION | NV101341923 | ROUND MOUNTAIN GOLD CORP | 6/28/1973 | Lode |
| Manhattan Mineral Resource – Amended April 23, 2026 | 179 |
| Claim Name | Serial Number | Owner | Date of Location | Case Type |
| TEX FRACTION | NV101460001 | ROUND MOUNTAIN GOLD CORP | 1/8/1987 | Lode |
| TIP TOP | NV101478703 | GOLDWEDGE LLC | 4/1/1912 | Lode |
| VERDEN | NV101451487 | ROUND MOUNTAIN GOLD CORP | 7/20/1925 | Lode |
| VERDEN NO. 1 | NV101496432 | ROUND MOUNTAIN GOLD CORP | 7/20/1925 | Lode |
| VIRGINIA CITY | NV101496165 | ROUND MOUNTAIN GOLD CORP | 10/8/1950 | Placer |
| VIRGINIA CITY | NV101608469 | ROUND MOUNTAIN GOLD CORP | 10/8/1950 | Placer |
| WAR EAGLE | NV101609943 | GOLDWEDGE LLC | 4/1/1912 | Lode |
| WC # 1 | NV101601800 | GOLDWEDGE LLC | 11/14/2005 | Lode |
| WC # 11 | NV101529706 | GOLDWEDGE LLC | 8/15/1987 | Lode |
| WC # 145 | NV101525335 | GOLDWEDGE LLC | 8/16/1987 | Lode |
| WC # 3 | NV101304680 | GOLDWEDGE LLC | 8/15/1987 | Lode |
| WC # 45 | NV102521566 | GOLDWEDGE LLC | 8/15/1987 | Lode |
| WC # 47 | NV101731767 | GOLDWEDGE LLC | 8/15/1987 | Lode |
| WC # 49 | NV101350393 | GOLDWEDGE LLC | 8/15/1987 | Lode |
| WC # 5 | NV101752706 | GOLDWEDGE LLC | 8/15/1987 | Lode |
| WC # 51 | NV101343230 | GOLDWEDGE LLC | 11/24/1982 | Lode |
| WC # 53 | NV101452044 | GOLDWEDGE LLC | 11/24/1982 | Lode |
| WC # 55 | NV101459641 | GOLDWEDGE LLC | 8/15/1987 | Lode |
| WC # 63 | NV101402287 | GOLDWEDGE LLC | 8/15/1987 | Lode |
| WC # 64 | NV101731028 | GOLDWEDGE LLC | 8/15/1987 | Lode |
| WC # 65 | NV101405692 | GOLDWEDGE LLC | 8/15/1987 | Lode |
| WC # 66 | NV101730645 | GOLDWEDGE LLC | 8/15/1987 | Lode |
| WC # 67 | NV101403359 | GOLDWEDGE LLC | 8/15/1987 | Lode |
| WC # 68 | NV101343217 | GOLDWEDGE LLC | 8/15/1987 | Lode |
| WC # 7 | NV101347091 | GOLDWEDGE LLC | 8/15/1987 | Lode |
| WC # 9 | NV101502153 | GOLDWEDGE LLC | 8/15/1987 | Lode |
| WILD GOOSE | NV101303118 | ROUND MOUNTAIN GOLD CORP | 4/29/1982 | Lode |
| WM # 1 | NV101605021 | ROUND MOUNTAIN GOLD CORP | 5/1/1987 | Lode |
| WM # 7 | NV101541831 | ROUND MOUNTAIN GOLD CORP | 5/1/1987 | Lode |
| WM # 8 | NV101302447 | ROUND MOUNTAIN GOLD CORP | 5/2/1987 | Lode |
| WM # 9 | NV101459773 | ROUND MOUNTAIN GOLD CORP | 5/2/1987 | Lode |
| WM # 10 | NV102521135 | ROUND MOUNTAIN GOLD CORP | 5/2/1987 | Lode |
| WM # 11 | NV101526258 | ROUND MOUNTAIN GOLD CORP | 5/2/1987 | Lode |
| WM # 23 | NV101457369 | ROUND MOUNTAIN GOLD CORP | 5/1/1987 | Lode |
| WM # 25 | NV101548961 | ROUND MOUNTAIN GOLD CORP | 5/1/1987 | Lode |
| WM # 27 | NV101458617 | ROUND MOUNTAIN GOLD CORP | 5/1/1987 | Lode |
| WM # 29 | NV101602383 | ROUND MOUNTAIN GOLD CORP | 5/1/1987 | Lode |
| WM # 3 | NV101609800 | GOLDWEDGE LLC | 5/1/1987 | Lode |
| WM # 30 | NV101451432 | ROUND MOUNTAIN GOLD CORP | 5/2/1987 | Lode |
| WM # 31 | NV101544889 | ROUND MOUNTAIN GOLD CORP | 5/1/1987 | Lode |
| Manhattan Mineral Resource – Amended April 23, 2026 | 180 |
| Claim Name | Serial Number | Owner | Date of Location | Case Type | |||||
| WM # 32 | NV101451959 | ROUND MOUNTAIN GOLD CORP | 5/2/1987 | Lode | |||||
| WM # 33 | NV101550285 | ROUND MOUNTAIN GOLD CORP | 5/2/1987 | Lode | |||||
| WM # 34 | NV101402680 | ROUND MOUNTAIN GOLD CORP | 5/2/1987 | Lode | |||||
| WM # 35 | NV101452411 | ROUND MOUNTAIN GOLD CORP | 5/2/1987 | Lode | |||||
| WM # 36 | NV101600816 | ROUND MOUNTAIN GOLD CORP | 5/2/1987 | Lode | |||||
| WM # 37 | NV101451358 | ROUND MOUNTAIN GOLD CORP | 5/2/1987 | Lode | |||||
| WM # 38 | NV101494666 | ROUND MOUNTAIN GOLD CORP | 5/2/1987 | Lode | |||||
| WM # 39 | NV101756966 | ROUND MOUNTAIN GOLD CORP | 5/2/1987 | Lode | |||||
| WM # 40 | NV101302249 | ROUND MOUNTAIN GOLD CORP | 5/2/1987 | Lode | |||||
| WM # 41 | NV101479294 | ROUND MOUNTAIN GOLD CORP | 5/2/1987 | Lode | |||||
| WM # 42 | NV101302281 | ROUND MOUNTAIN GOLD CORP | 5/2/1987 | Lode | |||||
| WM # 60 | NV101495575 | ROUND MOUNTAIN GOLD CORP | 5/3/1987 | Lode | |||||
| WM # 61 | NV101752959 | ROUND MOUNTAIN GOLD CORP | 5/3/1987 | Lode | |||||
| WM # 62 | NV101521421 | ROUND MOUNTAIN GOLD CORP | 5/3/1987 | Lode | |||||
| WM # 63 | NV101453556 | ROUND MOUNTAIN GOLD CORP | 5/3/1987 | Lode | |||||
| WM # 64 | NV101609932 | ROUND MOUNTAIN GOLD CORP | 5/1/1987 | Lode | |||||
| WM # 65 | NV101453779 | ROUND MOUNTAIN GOLD CORP | 5/1/1987 | Lode | |||||
| WM # 66 | NV101346825 | ROUND MOUNTAIN GOLD CORP | 5/1/1987 | Lode | |||||
| Manhattan Mineral Resource – Amended April 23, 2026 | 181 |