Shareholder Report
Apr. 30, 2026
USD ($)
shares
What Were the Portfolio Costs for the Last Six Months?
(based on a hypothetical $10,000 investment)
| Portfolio Name | Costs of a $10,000 Investment | Annualized Costs Paid as a Percentage of a $10,000 Investment |
|---|---|---|
| Nicholas Equity Income Fund | $35 | 0.69% |
Key Fund Statistics
As of April 30, 2026
| Net Assets | $468,070,827 |
|---|---|
| Number of Portfolio Holdings | |
| Portfolio Turnover Rate | 38.20% |
Top Ten Equity Holdings
As of April 30, 2026
| Name | Percentage of Net Assets |
|---|---|
| Microsoft Corporation | |
| Union Pacific Corporation | |
| JPMorgan Chase & Co. | |
| PNC Financial Services Group, Inc. | |
| Johnson & Johnson | |
| U.S. Bancorp | |
| Texas Instruments Incorporated | |
| Charles Schwab Corporation | |
| Mircochip Technology Incorporated | |
| NextEra Energy, Inc. | |
| Total of top ten |
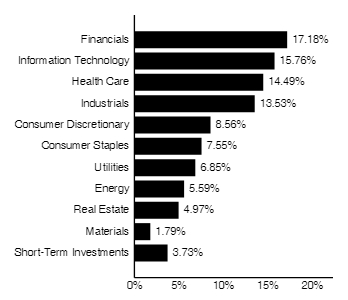
Sector Diversification (As a Percentage of Total Investments)
As of April 30, 2026
Top Ten Equity Holdings
As of April 30, 2026
| Name | Percentage of Net Assets |
|---|---|
| Microsoft Corporation | |
| Union Pacific Corporation | |
| JPMorgan Chase & Co. | |
| PNC Financial Services Group, Inc. | |
| Johnson & Johnson | |
| U.S. Bancorp | |
| Texas Instruments Incorporated | |
| Charles Schwab Corporation | |
| Mircochip Technology Incorporated | |
| NextEra Energy, Inc. | |
| Total of top ten |