Shareholder Report
Apr. 30, 2026
USD ($)
$ / shares
WHAT WERE THE FUND COSTS FOR THE PAST YEAR? (based on a hypothetical $10,000 investment)
|
Fund Name
|
Costs of a $10,000 investment
|
Costs paid as a percentage of a $10,000 investment
|
|
Pacer Aristotle Pacific Floating Rate High Income ETF
|
$62
|
0.60%
|
WHAT FACTORS INFLUENCED PERFORMANCE
Between May 1, 2025 and April 30, 2026, the Pacer Aristotle Pacific Floating Rate High Income ETF (FLRT) returned 7.1%, while its Strategy Benchmark, the Morningstar LSTA U.S Leveraged Loan 100 Index, returned 6.6% over the same period. This represents an outperformance of 0.5 percentage points for FLRT. While the Fund’s Broad-Based Benchmark, the Bloomberg U.S. Aggregate Bond Index, returned 4.1% over the same period.
What contributed to performance
The Fund’s performance was supported by its exposure to senior secured floating-rate loans, which benefited from persistently elevated short-term interest rates that kept coupon income attractive throughout the period. Even as broader rate expectations shifted, the floating-rate structure allowed the portfolio to maintain strong yield generation with limited duration risk. Credit conditions in the leveraged loan market remained generally orderly, helping support steady cash flows and limiting widespread deterioration in underlying issuers. In periods when wider market sentiment was cautiously optimistic, demand for income-oriented credit helped stabilize pricing and reinforce carry-driven returns.
The Fund’s performance was supported by its exposure to senior secured floating-rate loans, which benefited from persistently elevated short-term interest rates that kept coupon income attractive throughout the period. Even as broader rate expectations shifted, the floating-rate structure allowed the portfolio to maintain strong yield generation with limited duration risk. Credit conditions in the leveraged loan market remained generally orderly, helping support steady cash flows and limiting widespread deterioration in underlying issuers. In periods when wider market sentiment was cautiously optimistic, demand for income-oriented credit helped stabilize pricing and reinforce carry-driven returns.
What detracted from performance
Performance was constrained by limited price appreciation in floating-rate loans, which are more income-focused and less responsive to improving market conditions. Broader market sentiment fluctuated between risk-on optimism and periodic risk-off caution, leading to bouts of volatility in leveraged credit pricing. During risk-off episodes, investors tended to reduce exposure to lower-rated credit, temporarily pressuring loan and CLO valuations despite stable fundamentals. At the same time, tightening credit spreads and shifting expectations around monetary policy reduced the potential upside from spread compression, muting total return beyond coupon income.
Performance was constrained by limited price appreciation in floating-rate loans, which are more income-focused and less responsive to improving market conditions. Broader market sentiment fluctuated between risk-on optimism and periodic risk-off caution, leading to bouts of volatility in leveraged credit pricing. During risk-off episodes, investors tended to reduce exposure to lower-rated credit, temporarily pressuring loan and CLO valuations despite stable fundamentals. At the same time, tightening credit spreads and shifting expectations around monetary policy reduced the potential upside from spread compression, muting total return beyond coupon income.
The Fund’s performance information included above is compared with a regulatory required index that represents an overall securities market (Broad-Based Benchmark) and may include one or more indexes that more closely align to the Fund’s investment strategy (Strategy Benchmark(s)) or provide a secondary point of comparison.
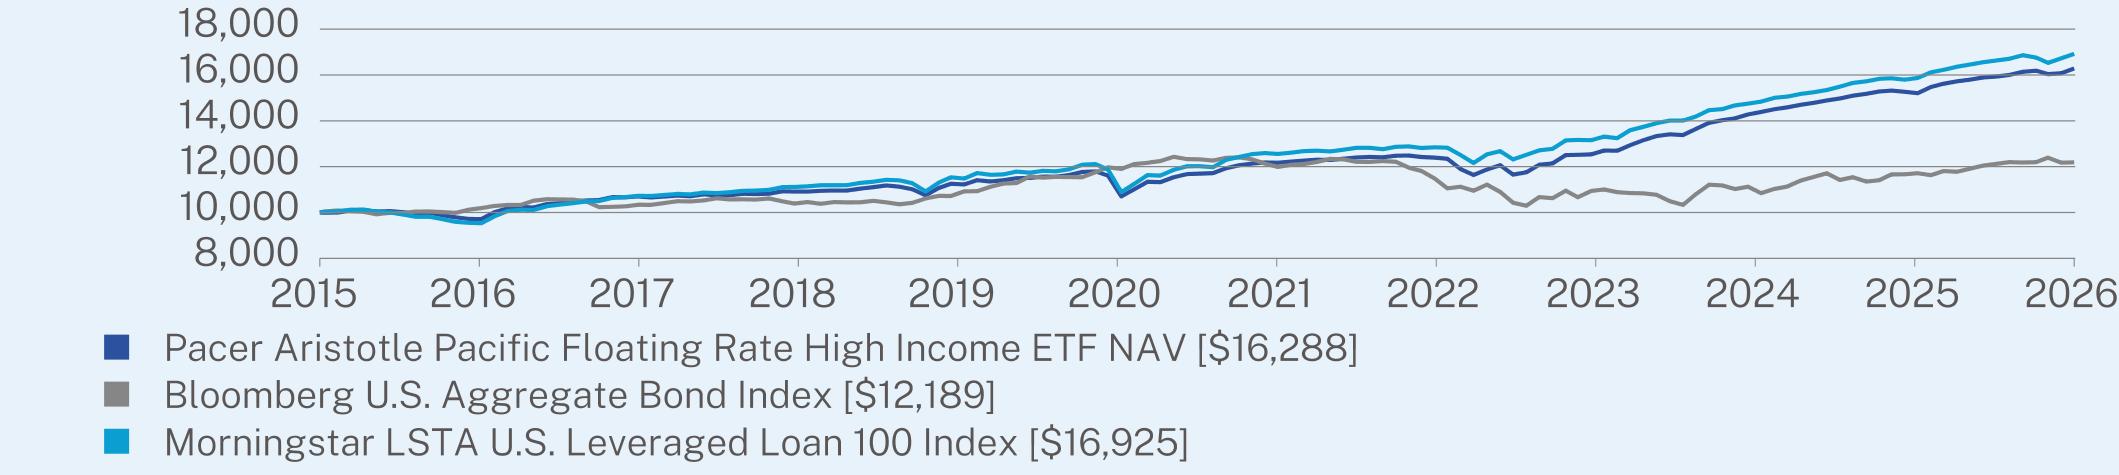
ANNUAL AVERAGE TOTAL RETURN (%)
|
|
1 Year
|
5 Year
|
10 Year
|
|
Pacer Aristotle Pacific Floating Rate High Income ETF NAV
|
7.13
|
5.91
|
4.81
|
|
Bloomberg U.S. Aggregate Bond Index
|
4.06
|
0.18
|
1.67
|
|
Morningstar LSTA U.S. Leveraged Loan 100 Index
|
6.64
|
6.06
|
5.34
|
Visit https://www.paceretfs.com/ for more recent performance information.
KEY FUND STATISTICS (as of April 30, 2026)
|
Net Assets
|
$603,802,426
|
Portfolio Turnover
|
38%
|
|
|
Number of Holdings
|
290
|
|||
|
Net Advisory Fee
|
$3,374,780
|
WHAT DID THE FUND INVEST IN? (as of April 30, 2026)*
|
Top 10 Issuers
|
(%)
|
|
Elmwood CLO Ltd.
|
3.8%
|
|
Magnetite CLO Ltd.
|
3.0%
|
|
Neuberger Berman CLO Ltd.
|
3.0%
|
|
Benefit Street Partners CLO Ltd.
|
2.3%
|
|
OHA Credit Funding
|
2.0%
|
|
Aimco CDO
|
1.4%
|
|
Mount Vernon Liquid Assets Portfolio, LLC
|
1.3%
|
|
SeaWorld Parks & Entertainment, Inc.
|
1.2%
|
|
Rad CLO
|
1.2%
|
|
Apple Bidco LLC
|
1.1%
|
|
Top Sectors
|
(%)
|
|
Collateralized Loan Obligations
|
31.7%
|
|
Industrials
|
20.5%
|
|
Consumer Discretionary
|
15.2%
|
|
Information Technology
|
8.0%
|
|
Financials
|
6.2%
|
|
Materials
|
4.2%
|
|
Energy
|
3.1%
|
|
Consumer Staples
|
2.8%
|
|
Communication Services
|
1.9%
|
|
Cash & Other
|
6.4%
|
WHAT WERE THE FUND COSTS FOR THE PAST YEAR? (based on a hypothetical $10,000 investment)
|
Fund Name
|
Costs of a $10,000 investment
|
Costs paid as a percentage of a $10,000 investment
|
|
Pacer Cash Cows Fund of Funds ETF
|
$17
|
0.15%
|
WHAT FACTORS INFLUENCED PERFORMANCE
Between May 1, 2025 and April 30, 2026, the Pacer Cash Cows Fund of Funds ETF (HERD) returned 33.1% while its underlying index, the Pacer Cash Cows Fund of Funds Index, also returned 33.1% over the same period. The Fund’s Broad-Based Benchmark, the MSCI World Index, returned 29.2% over the same period. This represents outperformance of roughly 4 percentage points for HERD relative to its benchmark.
What contributed to performance
The Fund’s performance was supported by its diversified exposure to the Pacer “Cash Cows” family of funds, which collectively emphasize companies with strong free cash flow generation and disciplined capital return profiles. During the period, broad market sentiment was generally constructive toward equities, particularly quality and value-oriented segments, which benefited the underlying Cash Cows strategies. The portfolio’s mix of U.S. and international exposure helped it participate in multiple regional equity uptrends, while its systematic focus on profitable, cash-generating companies provided resilience during intermittent volatility. Additionally, a relatively stable risk appetite for dividend and free cash flow–focused equities helped sustain demand for the underlying holdings.
The Fund’s performance was supported by its diversified exposure to the Pacer “Cash Cows” family of funds, which collectively emphasize companies with strong free cash flow generation and disciplined capital return profiles. During the period, broad market sentiment was generally constructive toward equities, particularly quality and value-oriented segments, which benefited the underlying Cash Cows strategies. The portfolio’s mix of U.S. and international exposure helped it participate in multiple regional equity uptrends, while its systematic focus on profitable, cash-generating companies provided resilience during intermittent volatility. Additionally, a relatively stable risk appetite for dividend and free cash flow–focused equities helped sustain demand for the underlying holdings.
What detracted from performance
Performance was periodically weighed down by shifts in broader market sentiment, particularly during episodes when investors rotated aggressively into high-growth or momentum-driven equities at the expense of value-oriented strategies. In risk-off environments, sentiment toward global equities softened at times, leading to temporary underperformance in the more cyclically exposed portions of the portfolio. Currency and regional divergence within international holdings also introduced variability that occasionally lagged stronger U.S.-centric growth leadership. Finally, changing expectations around monetary policy created uneven factor leadership, which reduced consistency in returns from the fund’s multi-strategy “fund-of-funds” structure.
Performance was periodically weighed down by shifts in broader market sentiment, particularly during episodes when investors rotated aggressively into high-growth or momentum-driven equities at the expense of value-oriented strategies. In risk-off environments, sentiment toward global equities softened at times, leading to temporary underperformance in the more cyclically exposed portions of the portfolio. Currency and regional divergence within international holdings also introduced variability that occasionally lagged stronger U.S.-centric growth leadership. Finally, changing expectations around monetary policy created uneven factor leadership, which reduced consistency in returns from the fund’s multi-strategy “fund-of-funds” structure.
The Fund’s performance information included above is compared with a regulatory required index that represents an overall securities market (Broad-Based Benchmark) and may include one or more indexes that more closely align to the Fund’s investment strategy (Strategy Benchmark(s)) or provide a secondary point of comparison.
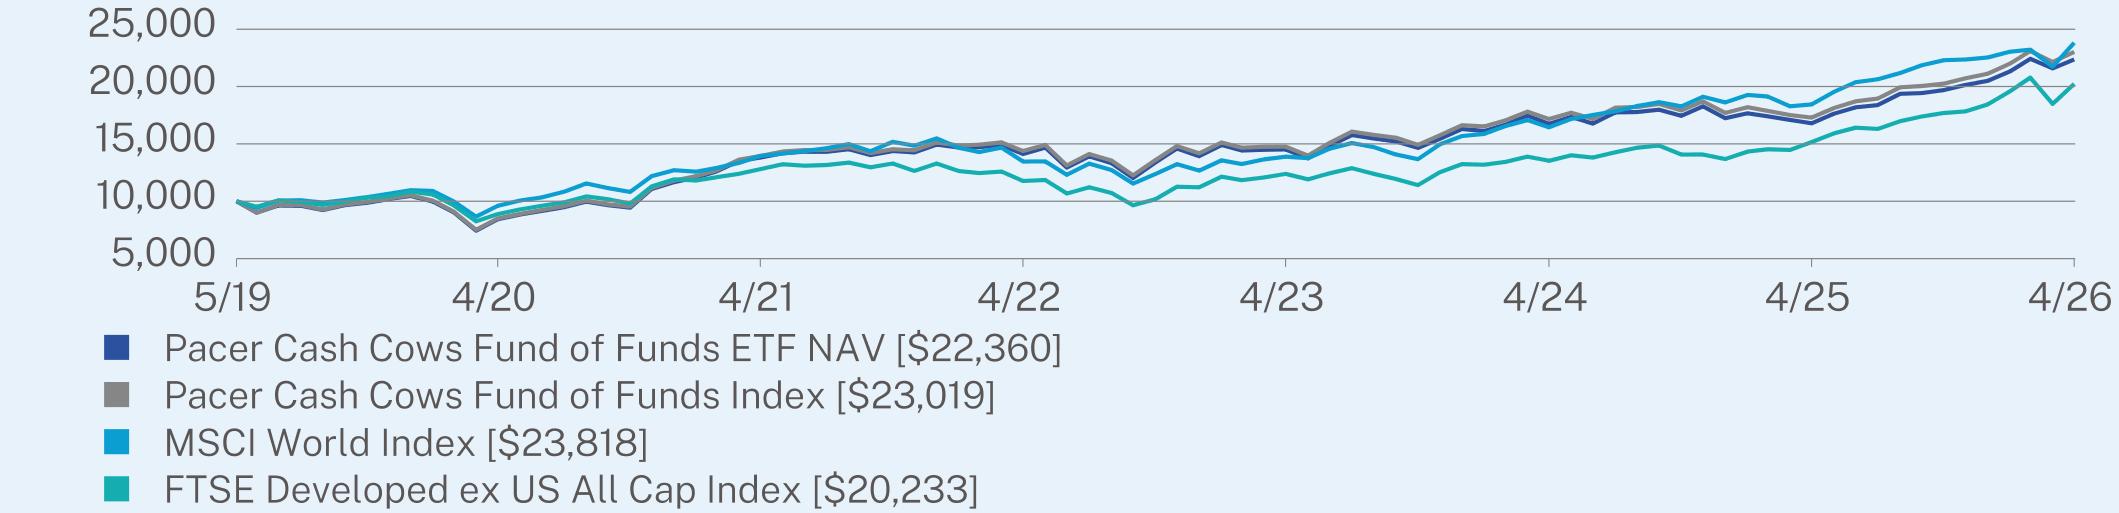
ANNUAL AVERAGE TOTAL RETURN (%)
|
|
1 Year
|
5 Year
|
Since Inception
(05/03/2019) |
|
Pacer Cash Cows Fund of Funds ETF NAV
|
33.13
|
10.13
|
12.19
|
|
Pacer Cash Cows Fund of Funds Index
|
33.10
|
10.54
|
12.66
|
|
MSCI World Index
|
29.16
|
11.29
|
13.21
|
|
FTSE Developed ex US All Cap Index
|
33.46
|
9.59
|
10.60
|
Visit https://www.paceretfs.com/ for more recent performance information.
KEY FUND STATISTICS (as of April 30, 2026)
|
Net Assets
|
$94,728,961
|
Portfolio Turnover
|
6%
|
|
|
Number of Holdings
|
5
|
30-Day SEC Yield
|
1.86%
|
|
|
Net Advisory Fee
|
$131,287
|
30-Day SEC Yield Unsubsidized
|
1.86%
|
WHAT DID THE FUND INVEST IN? (as of April 30, 2026)*
|
Security Type
|
(%)
|
|
Affiliated Exchange Traded Funds
|
100.0%
|
|
Cash & Other
|
0.0%
|
|
Top Holdings
|
(%)
|
|
Pacer US Small Cap Cash Cows ETF
|
20.6%
|
|
Pacer US Cash Cows Growth ETF
|
20.4%
|
|
Pacer Developed Markets International Cash Cows 100 ETF
|
20.2%
|
|
Pacer US Cash Cows 100 ETF
|
19.5%
|
|
Pacer Global Cash Cows Dividend ETF
|
19.3%
|
WHAT WERE THE FUND COSTS FOR THE PAST YEAR? (based on a hypothetical $10,000 investment)
|
Fund Name
|
Costs of a $10,000 investment
|
Costs paid as a percentage of a $10,000 investment
|
|
Pacer CFRA-Stovall Equal Weight Seasonal Rotation ETF
|
$64
|
0.60%
|
WHAT FACTORS INFLUENCED PERFORMANCE
The Fund liquidated on 5/15/2026 please call 877-337-0500 for further questions.
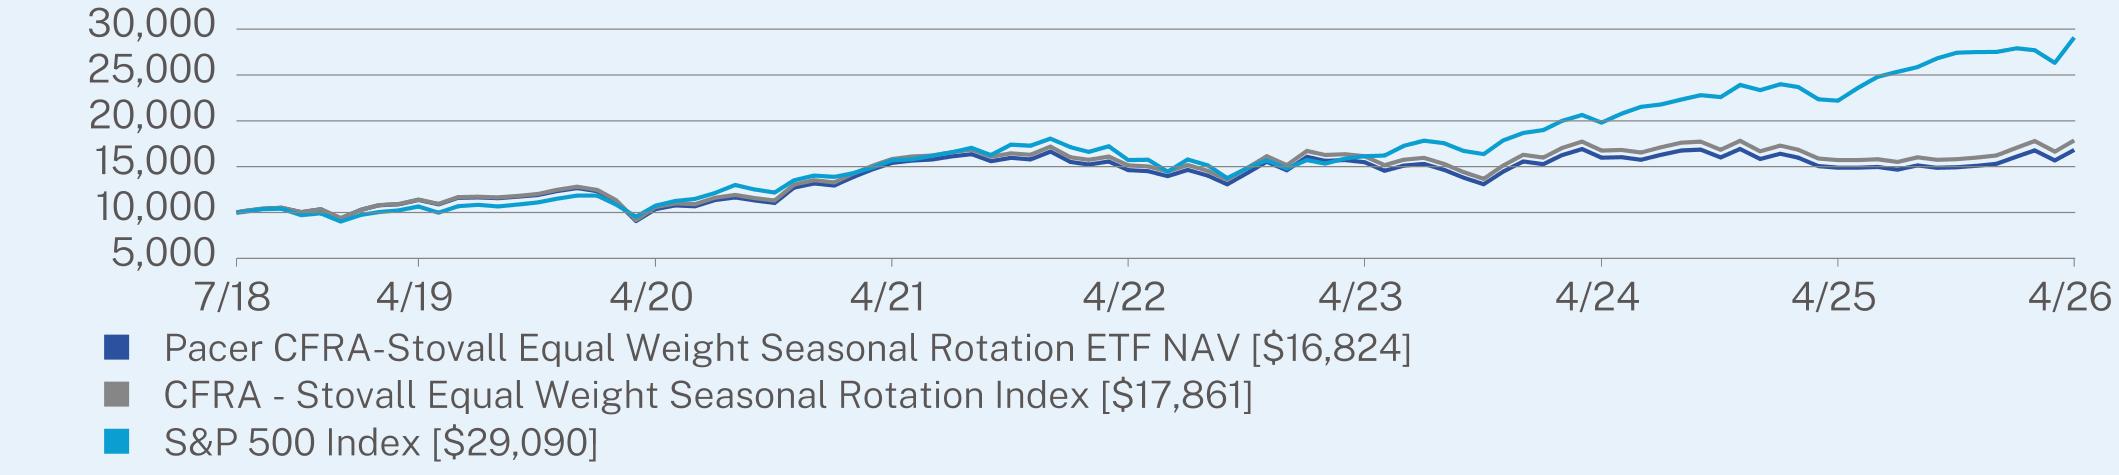
ANNUAL AVERAGE TOTAL RETURN (%)
|
|
1 Year
|
5 Year
|
Since Inception
(07/23/2018) |
|
Pacer CFRA-Stovall Equal Weight Seasonal Rotation ETF NAV
|
12.98
|
1.77
|
6.92
|
|
CFRA - Stovall Equal Weight Seasonal Rotation Index
|
13.63
|
2.44
|
7.75
|
|
S&P 500 Index
|
31.05
|
13.14
|
14.73
|
Visit https://www.paceretfs.com/ for more recent performance information.
KEY FUND STATISTICS (as of April 30, 2026)
|
Net Assets
|
$13,393,666
|
Portfolio Turnover
|
110%
|
|
|
Number of Holdings
|
228
|
30-Day SEC Yield
|
0.81%
|
|
|
Net Advisory Fee
|
$88,783
|
30-Day SEC Yield Unsubsidized
|
0.81%
|
WHAT DID THE FUND INVEST IN? (as of April 30, 2026)*
|
Top 10 Issuers
|
(%)
|
|
Mount Vernon Liquid Assets Portfolio, LLC
|
13.0%
|
|
Nucor Corp.
|
1.3%
|
|
Steel Dynamics, Inc.
|
1.3%
|
|
Dow, Inc.
|
1.2%
|
|
Albemarle Corp.
|
1.2%
|
|
CRH PLC
|
1.2%
|
|
Vulcan Materials Co.
|
1.2%
|
|
LyondellBasell Industries NV
|
1.1%
|
|
Air Products & Chemicals, Inc.
|
1.1%
|
|
PPG Industries, Inc.
|
1.1%
|
|
Top Sectors
|
(%)
|
|
Materials
|
27.2%
|
|
Information Technology
|
25.9%
|
|
Industrials
|
24.7%
|
|
Consumer Discretionary
|
22.2%
|
|
Cash & Other
|
0.0%
|
WHAT WERE THE FUND COSTS FOR THE PAST YEAR? (based on a hypothetical $10,000 investment)
|
Fund Name
|
Costs of a $10,000 investment
|
Costs paid as a percentage of a $10,000 investment
|
|
Pacer Data & Infrastructure Real Estate ETF
|
$55
|
0.51%
|
WHAT FACTORS INFLUENCED PERFORMANCE
Between May 1, 2025 and April 30, 2026, the Pacer Data & Infrastructure Real Estate ETF (SRVR) returned 17.6%, while its underlying index, the Solactive GPR Data & Infrastructure Real Estate Index, returned 18.3% over the same period. This represents an underperformance of 0.7 percentage points for SRVR. For the one-year period ended April 30, 2026, SRVR’s Broad-Based Benchmark, the S&P 500 Index, returned 31.1% while the Fund’s Strategy Benchmark, the FTSE NAREIT All Equity REITS Total Return Index, returned 14.9%.
What contributed to performance
The Pacer Data & Infrastructure Real Estate ETF benefited from continued investor demand for data center and digital infrastructure REITs, which remained supported by long-term secular growth themes such as cloud computing, artificial intelligence, and global data consumption. During the period, broader market sentiment toward real assets improved as investors sought defensive equity exposure with inflation-linked revenue streams, which helped stabilize valuation multiples for key holdings like data center and tower REITs. The portfolio’s concentration in high-quality operators with strong contractual cash flows also helped sustain income generation even during periods of equity volatility. Additionally, relatively resilient operating fundamentals across digital infrastructure names supported steady earnings growth and helped anchor performance.
The Pacer Data & Infrastructure Real Estate ETF benefited from continued investor demand for data center and digital infrastructure REITs, which remained supported by long-term secular growth themes such as cloud computing, artificial intelligence, and global data consumption. During the period, broader market sentiment toward real assets improved as investors sought defensive equity exposure with inflation-linked revenue streams, which helped stabilize valuation multiples for key holdings like data center and tower REITs. The portfolio’s concentration in high-quality operators with strong contractual cash flows also helped sustain income generation even during periods of equity volatility. Additionally, relatively resilient operating fundamentals across digital infrastructure names supported steady earnings growth and helped anchor performance.
What detracted from performance
Performance was periodically pressured by shifts in broader market sentiment toward interest rates, as higher or “higher-for-longer” rate expectations weighed on REIT valuations by increasing discount rates applied to long-duration cash flows. When equity markets rotated into higher-growth or cyclical leadership, data infrastructure REITs sometimes lagged due to their perceived sensitivity to rates and slower near-term growth profiles. Episodes of risk-off sentiment also led to temporary multiple compression, even though underlying fundamentals remained stable. Finally, investor uncertainty around monetary policy timing created intermittent volatility in rate-sensitive real estate sectors, which dampened total return potential despite solid operational performance in the underlying assets.
Performance was periodically pressured by shifts in broader market sentiment toward interest rates, as higher or “higher-for-longer” rate expectations weighed on REIT valuations by increasing discount rates applied to long-duration cash flows. When equity markets rotated into higher-growth or cyclical leadership, data infrastructure REITs sometimes lagged due to their perceived sensitivity to rates and slower near-term growth profiles. Episodes of risk-off sentiment also led to temporary multiple compression, even though underlying fundamentals remained stable. Finally, investor uncertainty around monetary policy timing created intermittent volatility in rate-sensitive real estate sectors, which dampened total return potential despite solid operational performance in the underlying assets.
The Fund’s performance information included above is compared with a regulatory required index that represents an overall securities market (Broad-Based Benchmark) and may include one or more indexes that more closely align to the Fund’s investment strategy (Strategy Benchmark(s)) or provide a secondary point of comparison.
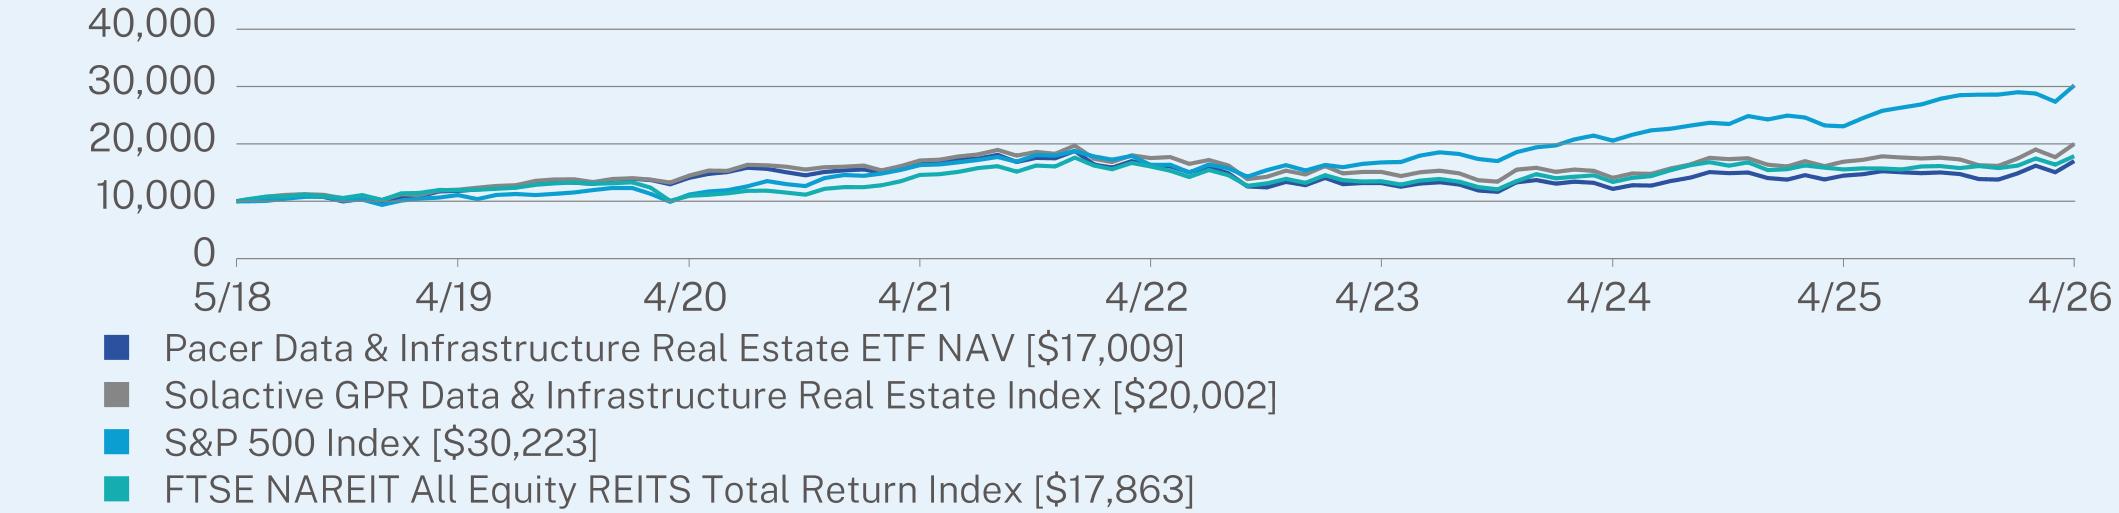
ANNUAL AVERAGE TOTAL RETURN (%)
|
|
1 Year
|
5 Year
|
Since Inception
(05/15/2018) |
|
Pacer Data & Infrastructure Real Estate ETF NAV
|
17.60
|
0.55
|
6.90
|
|
Solactive GPR Data & Infrastructure Real Estate Index
|
18.34
|
3.17
|
9.10
|
|
S&P 500 Index
|
31.05
|
13.14
|
14.91
|
|
FTSE NAREIT All Equity REITS Total Return Index
|
14.89
|
4.13
|
7.56
|
Visit https://www.paceretfs.com/ for more recent performance information.
KEY FUND STATISTICS (as of April 30, 2026)
|
Net Assets
|
$395,144,721
|
Portfolio Turnover
|
44%
|
|
|
Number of Holdings
|
66
|
30-Day SEC Yield
|
1.93%
|
|
|
Net Advisory Fee
|
$2,100,115
|
30-Day SEC Yield Unsubsidized
|
1.93%
|
WHAT DID THE FUND INVEST IN? (as of April 30, 2026)*
|
Top 10 Issuers
|
(%)
|
|
Digital Realty Trust, Inc.
|
15.4%
|
|
Equinix, Inc.
|
15.4%
|
|
American Tower Corp.
|
13.7%
|
|
Mount Vernon Liquid Assets Portfolio, LLC
|
9.7%
|
|
Iron Mountain, Inc.
|
4.9%
|
|
SBA Communications Corp.
|
4.9%
|
|
Crown Castle, Inc.
|
4.2%
|
|
Cellnex Telecom SA
|
4.1%
|
|
NEXTDC Ltd.
|
2.8%
|
|
China Tower Corp. Ltd.
|
2.4%
|
|
Top Sectors
|
(%)
|
|
Real Estate
|
60.0%
|
|
Communication Services
|
13.6%
|
|
Industrials
|
11.3%
|
|
Information Technology
|
6.8%
|
|
Energy
|
4.4%
|
|
Utilities
|
2.2%
|
|
Financials
|
0.9%
|
|
Materials
|
0.7%
|
|
Cash & Other
|
0.1%
|
WHAT WERE THE FUND COSTS FOR THE PAST YEAR? (based on a hypothetical $10,000 investment)
|
Fund Name
|
Costs of a $10,000 investment
|
Costs paid as a percentage of a $10,000 investment
|
|
Pacer Data and Digital Revolution ETF
|
$69
|
0.50%
|
WHAT FACTORS INFLUENCED PERFORMANCE
Between May 1, 2025 and April 30, 2026, the Pacer Data and Digital Revolution ETF (TRFK) returned 75.5%, while its underlying index, the Pacer Data Transmission and Communication Revolution Index, gained 76.5% over the same period. This represents an underperformance of 1.0 percentage points for the Fund. For the one-year period ended April 30, 2026, TRFK’s Broad-Based Benchmark, the S&P Global 1200 Index, returned 32.5%.
What contributed to performance
The Pacer Data & Digital Revolution ETF benefited from sustained investor enthusiasm for AI, semiconductors, and digital infrastructure, which remained central drivers of global equity leadership during the period. Strong earnings momentum from large-cap technology holdings such as semiconductors, cloud infrastructure, and networking companies helped propel index-level returns, with AI-related capital spending acting as a key tailwind. Broader market sentiment toward growth equities was generally positive, especially during risk-on phases when investors favored high-quality, cash-generative tech leaders. The Fund’s diversified exposure across the digital ecosystem also allowed it to participate in multiple thematic growth streams rather than relying on a single segment.
The Pacer Data & Digital Revolution ETF benefited from sustained investor enthusiasm for AI, semiconductors, and digital infrastructure, which remained central drivers of global equity leadership during the period. Strong earnings momentum from large-cap technology holdings such as semiconductors, cloud infrastructure, and networking companies helped propel index-level returns, with AI-related capital spending acting as a key tailwind. Broader market sentiment toward growth equities was generally positive, especially during risk-on phases when investors favored high-quality, cash-generative tech leaders. The Fund’s diversified exposure across the digital ecosystem also allowed it to participate in multiple thematic growth streams rather than relying on a single segment.
What detracted from performance
Performance was periodically pressured by sharp swings in broader market sentiment toward interest rates and high-multiple growth stocks, which tend to drive volatility in technology-heavy portfolios. When investors rotated into defensives or value equities during risk-off episodes, the Fund’s high beta exposure led to meaningful drawdowns as tech valuations compressed. Concerns around the pace of monetary easing and higher discount rates at times reduced willingness to pay for long-duration growth cash flows, weighing on sentiment despite strong fundamentals. Additionally, episodic profit-taking after strong AI-driven rallies created short-term reversals that temporarily offset underlying earnings strength
Performance was periodically pressured by sharp swings in broader market sentiment toward interest rates and high-multiple growth stocks, which tend to drive volatility in technology-heavy portfolios. When investors rotated into defensives or value equities during risk-off episodes, the Fund’s high beta exposure led to meaningful drawdowns as tech valuations compressed. Concerns around the pace of monetary easing and higher discount rates at times reduced willingness to pay for long-duration growth cash flows, weighing on sentiment despite strong fundamentals. Additionally, episodic profit-taking after strong AI-driven rallies created short-term reversals that temporarily offset underlying earnings strength
The Fund’s performance information included above is compared with a regulatory required index that represents an overall securities market (Broad-Based Benchmark) and may include one or more indexes that more closely align to the Fund’s investment strategy (Strategy Benchmark(s)) or provide a secondary point of comparison.
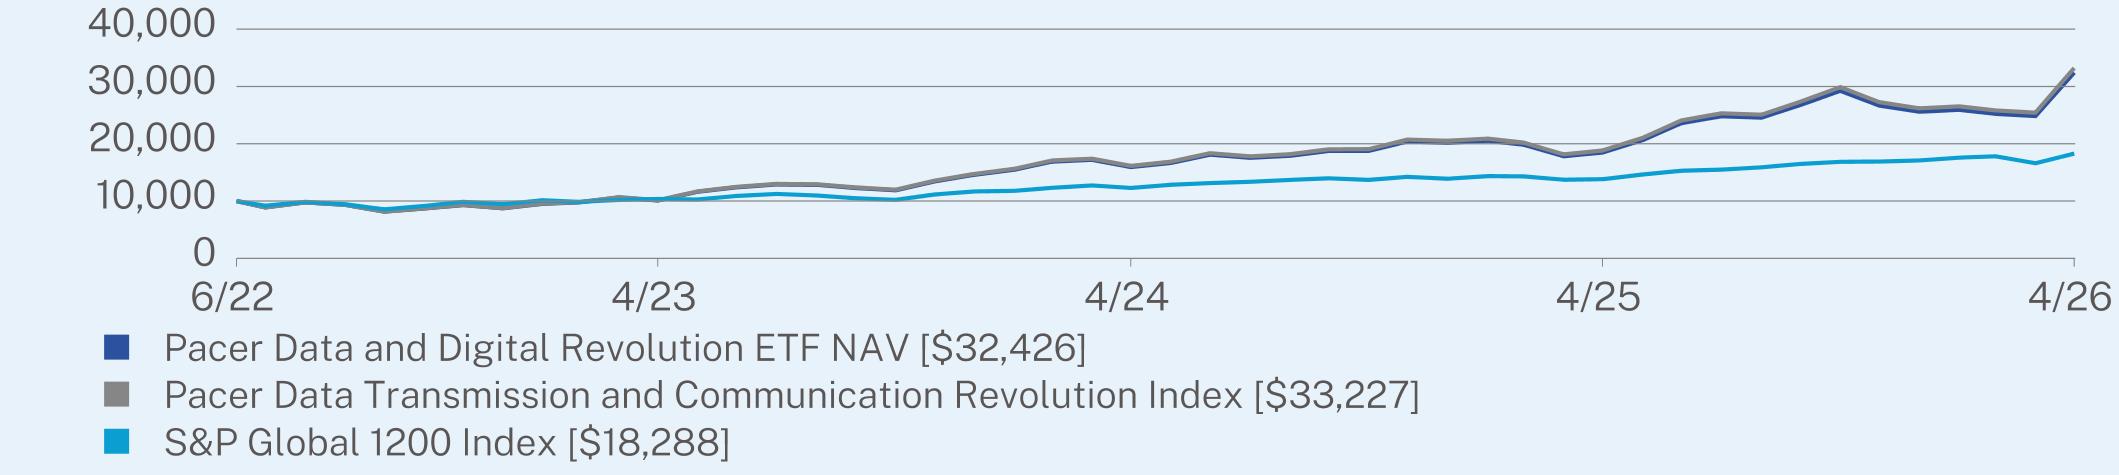
ANNUAL AVERAGE TOTAL RETURN (%)
|
|
1 Year
|
Since Inception
(06/08/2022) |
|
Pacer Data and Digital Revolution ETF NAV
|
75.53
|
35.28
|
|
Pacer Data Transmission and Communication Revolution Index
|
76.52
|
36.13
|
|
S&P Global 1200 Index
|
32.45
|
16.77
|
Visit https://www.paceretfs.com/ for more recent performance information.
KEY FUND STATISTICS (as of April 30, 2026)
|
Net Assets
|
$614,323,706
|
Portfolio Turnover
|
19%
|
|
|
Number of Holdings
|
81
|
30-Day SEC Yield
|
0.05%
|
|
|
Net Advisory Fee
|
$1,336,043
|
30-Day SEC Yield Unsubsidized
|
0.05%
|
WHAT DID THE FUND INVEST IN? (as of April 30, 2026)*
|
Top 10 Issuers
|
(%)
|
|
Broadcom, Inc.
|
10.3%
|
|
NVIDIA Corp.
|
8.8%
|
|
Advanced Micro Devices, Inc.
|
8.6%
|
|
Intel Corp.
|
7.2%
|
|
Oracle Corp.
|
6.9%
|
|
Cisco Systems, Inc.
|
5.4%
|
|
Mount Vernon Liquid Assets Portfolio, LLC
|
5.0%
|
|
ARM Holdings PLC
|
4.9%
|
|
Arista Networks, Inc.
|
4.6%
|
|
Western Digital Corp.
|
3.2%
|
|
Top Sectors
|
(%)
|
|
Information Technology
|
91.7%
|
|
Industrials
|
8.3%
|
|
Cash & Other
|
0.0%
|
WHAT WERE THE FUND COSTS FOR THE PAST YEAR? (based on a hypothetical $10,000 investment)
|
Fund Name
|
Costs of a $10,000 investment
|
Costs paid as a percentage of a $10,000 investment
|
|
Pacer Developed Markets International Cash Cows 100 ETF
|
$79
|
0.65%
|
WHAT FACTORS INFLUENCED PERFORMANCE
Between May 1, 2025 and April 30, 2026, the Pacer Developed Markets International Cash Cows 100 ETF (ICOW) returned 42.9%, while its underlying index, the Pacer Developed Markets International Cash Cows 100 Index, returned 43.5% over the same period. This represents an underperformance of 0.6 percentage points for the Fund. For the one-year period ended April 30, 2026, ICOW’s Broad-Based Benchmark, the MSCI World Index returned 29.2% while its secondary index, the FTSE All-World ex US Index, returned 30.1%.
What contributed to performance
The Pacer Developed Markets International Cash Cows 100 ETF benefited from sustained strength in international value and free-cash-flow–rich equities, particularly in Europe and developed Asia, where many holdings continued to generate solid earnings and shareholder distributions. During the period, broader market sentiment toward non-U.S. equities improved, supported by relative valuation discounts versus U.S. markets and renewed interest in global diversification. A generally favorable environment for industrials, energy, and other cash-flow-heavy sectors—key weights in the portfolio—helped support returns. The strategy’s emphasis on high free cash flow also provided resilience, as investors rewarded companies with strong balance sheets and consistent capital return policies.
The Pacer Developed Markets International Cash Cows 100 ETF benefited from sustained strength in international value and free-cash-flow–rich equities, particularly in Europe and developed Asia, where many holdings continued to generate solid earnings and shareholder distributions. During the period, broader market sentiment toward non-U.S. equities improved, supported by relative valuation discounts versus U.S. markets and renewed interest in global diversification. A generally favorable environment for industrials, energy, and other cash-flow-heavy sectors—key weights in the portfolio—helped support returns. The strategy’s emphasis on high free cash flow also provided resilience, as investors rewarded companies with strong balance sheets and consistent capital return policies.
What detracted from performance
Performance was periodically held back by shifting global risk sentiment, particularly during episodes when investors favored U.S. growth and AI-driven technology leadership over international value exposure. Currency volatility also acted as a headwind at times, as fluctuations in the yen, euro, and other developed-market currencies influenced U.S.-dollar returns. In addition, concerns around global economic growth—especially in export-oriented economies in Europe and parts of Asia—created intermittent pressure on cyclically exposed holdings. Finally, when risk-off sentiment spiked, international equities often saw faster de-risking than U.S. markets, leading to temporary underperformance despite stable underlying cash flow fundamentals.
Performance was periodically held back by shifting global risk sentiment, particularly during episodes when investors favored U.S. growth and AI-driven technology leadership over international value exposure. Currency volatility also acted as a headwind at times, as fluctuations in the yen, euro, and other developed-market currencies influenced U.S.-dollar returns. In addition, concerns around global economic growth—especially in export-oriented economies in Europe and parts of Asia—created intermittent pressure on cyclically exposed holdings. Finally, when risk-off sentiment spiked, international equities often saw faster de-risking than U.S. markets, leading to temporary underperformance despite stable underlying cash flow fundamentals.
The Fund’s performance information included above is compared with a regulatory required index that represents an overall securities market (Broad-Based Benchmark) and may include one or more indexes that more closely align to the Fund’s investment strategy (Strategy Benchmark(s)) or provide a secondary point of comparison.
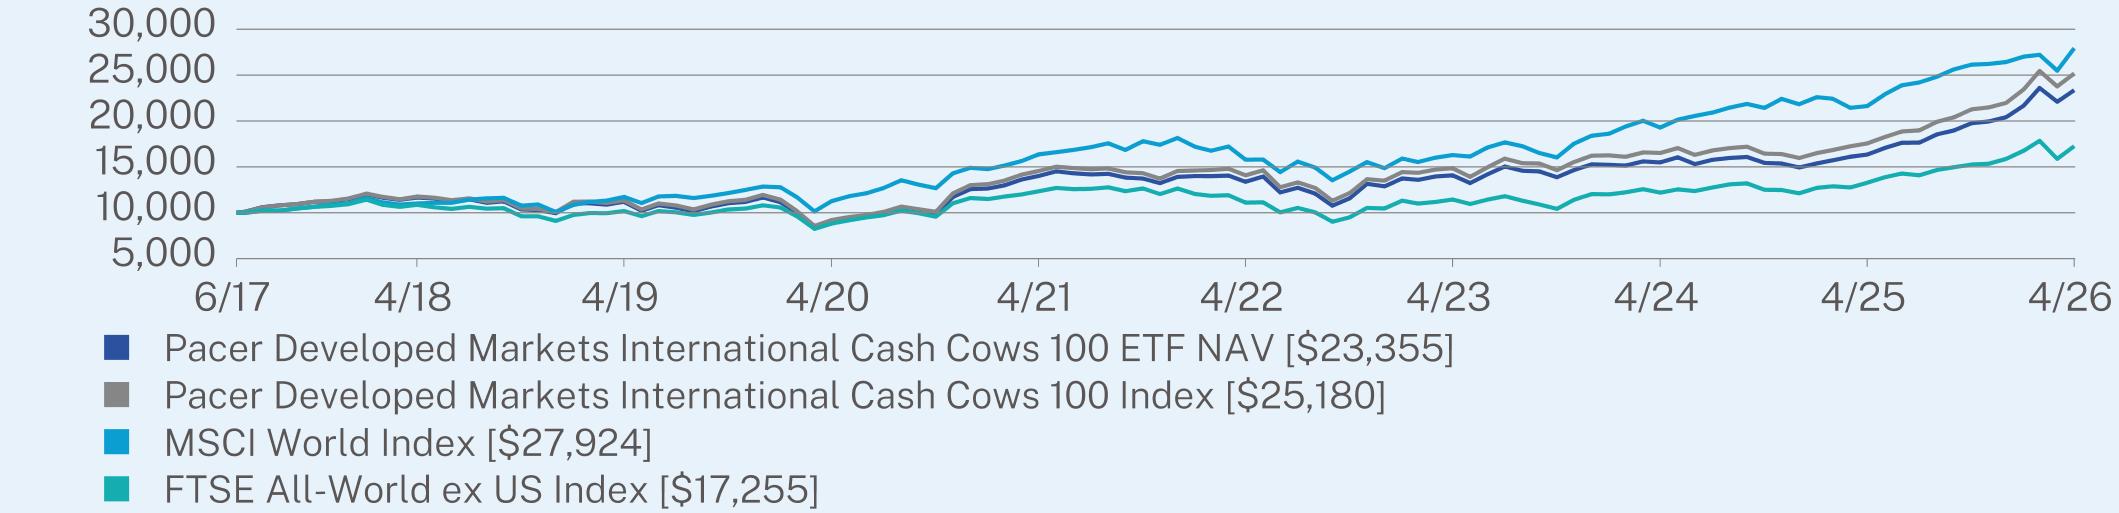
ANNUAL AVERAGE TOTAL RETURN (%)
|
|
1 Year
|
5 Year
|
Since Inception
(06/16/2017) |
|
Pacer Developed Markets International Cash Cows 100 ETF NAV
|
42.96
|
10.78
|
10.03
|
|
Pacer Developed Markets International Cash Cows 100 Index
|
43.49
|
11.60
|
10.97
|
|
MSCI World Index
|
29.16
|
11.29
|
12.27
|
|
FTSE All-World ex US Index
|
30.05
|
6.95
|
6.37
|
Visit https://www.paceretfs.com/ for more recent performance information.
KEY FUND STATISTICS (as of April 30, 2026)
|
Net Assets
|
$1,787,847,420
|
Portfolio Turnover
|
74%
|
|
|
Number of Holdings
|
100
|
30-Day SEC Yield
|
2.15%
|
|
|
Net Advisory Fee
|
$8,871,142
|
30-Day SEC Yield Unsubsidized
|
2.15%
|
WHAT DID THE FUND INVEST IN? (as of April 30, 2026)*
|
Top 10 Issuers
|
(%)
|
|
Equinor ASA
|
3.0%
|
|
Suncor Energy, Inc.
|
2.7%
|
|
Prysmian SpA
|
2.6%
|
|
HD Hyundai Co. Ltd.
|
2.5%
|
|
TotalEnergies SE
|
2.4%
|
|
Canadian Natural Resources Ltd.
|
2.4%
|
|
BP PLC
|
2.3%
|
|
Vodafone Group PLC
|
2.2%
|
|
Anheuser-Busch InBev SA
|
2.1%
|
|
Shell PLC
|
2.1%
|
|
Top Sectors
|
(%)
|
|
Industrials
|
29.1%
|
|
Energy
|
23.6%
|
|
Consumer Discretionary
|
12.8%
|
|
Communication Services
|
9.4%
|
|
Consumer Staples
|
7.9%
|
|
Health Care
|
6.9%
|
|
Materials
|
6.4%
|
|
Information Technology
|
3.2%
|
|
Cash & Other
|
0.7%
|
|
Top Countries
|
(%)
|
|
Japan
|
17.6%
|
|
South Korea
|
12.2%
|
|
France
|
11.4%
|
|
United Kingdom
|
10.5%
|
|
Canada
|
9.6%
|
|
Germany
|
8.2%
|
|
Hong Kong
|
3.9%
|
|
Denmark
|
3.5%
|
|
Norway
|
3.5%
|
|
Cash & Other
|
19.6%
|
WHAT WERE THE FUND COSTS FOR THE PAST YEAR? (based on a hypothetical $10,000 investment)
|
Fund Name
|
Costs of a $10,000 investment
|
Costs paid as a percentage of a $10,000 investment
|
|
Pacer Emerging Markets Cash Cows 100 ETF
|
$85
|
0.70%
|
WHAT FACTORS INFLUENCED PERFORMANCE
Between May 1, 2025 and April 30, 2026, the Pacer Emerging Markets Cash Cows 100 ETF (ECOW) returned 41.5%, while its underlying index, the Pacer Emerging Markets Cash Cows 100 Index, returned 43.7% over the same period. This represents an underperformance of 2.2 percentage points for the Fund. For the one-year period ended April 30, 2026, the Fund’s Broad-Based Benchmark, the MSCI World Index returned 29.2%, while its Strategy Benchmark, the FTSE Emerging Markets Index, returned 31.1%.
What contributed to performance
The Pacer Emerging Markets Cash Cows 100 ETF benefited from strong emerging markets equity performance driven by value and free cash flow–oriented stocks, as investors increasingly favored fundamentally solid companies with strong balance sheets. During the period, broader market sentiment toward emerging markets was generally constructive, supported by a weaker U.S. dollar, improving global risk appetite, and renewed capital flows into international equities. Many holdings in commodity-linked and industrial sectors also benefited from resilient global demand and stable earnings trends, reinforcing the Fund’s cash-flow-focused strategy. In addition, sustained interest in diversification away from U.S. mega-cap growth leadership helped support relative performance.
What detracted from performance
Performance was periodically constrained by shifts in global risk sentiment, particularly during episodes when investors rotated back into U.S. growth and AI-driven equities, which reduced demand for emerging market exposure. Emerging markets also experienced bouts of volatility tied to geopolitical uncertainty and uneven economic growth across regions, which weighed on valuations even when underlying fundamentals remained stable. Currency fluctuations—especially weakness or volatility in local emerging market currencies versus the U.S. dollar—created additional headwinds for USD-based returns. At times, tightening global liquidity expectations and interest rate uncertainty also pressured higher-beta emerging market equities, leading to drawdowns during risk-off phases.
The Fund’s performance information included above is compared with a regulatory required index that represents an overall securities market (Broad-Based Benchmark) and may include one or more indexes that more closely align to the Fund’s investment strategy (Strategy Benchmark(s)) or provide a secondary point of comparison.
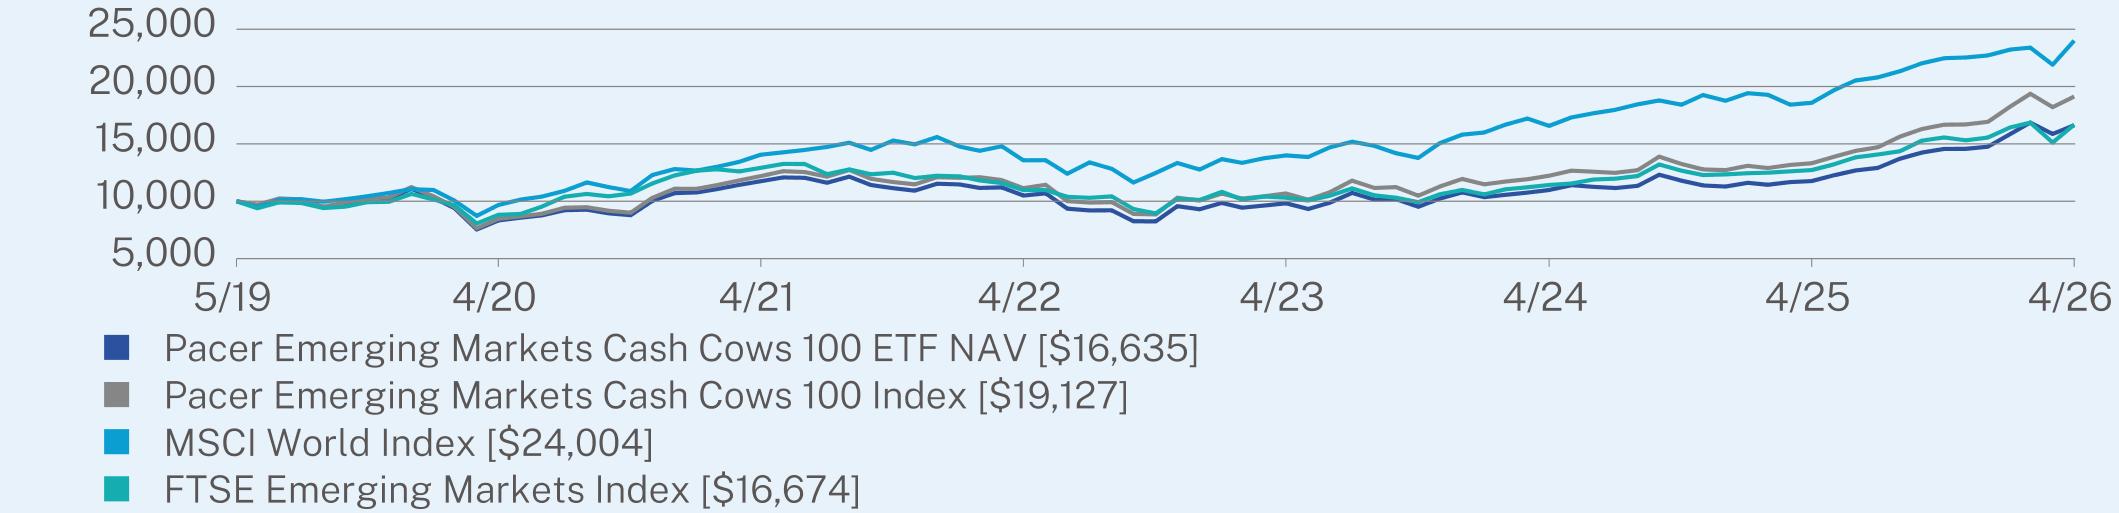
ANNUAL AVERAGE TOTAL RETURN (%)
|
|
1 Year
|
5 Year
|
Since Inception
(05/02/2019) |
|
Pacer Emerging Markets Cash Cows 100 ETF NAV
|
41.46
|
7.20
|
7.54
|
|
Pacer Emerging Markets Cash Cows 100 Index
|
43.68
|
9.42
|
9.71
|
|
MSCI World Index
|
29.16
|
11.29
|
13.33
|
|
FTSE Emerging Markets Index
|
31.10
|
5.25
|
7.58
|
Visit https://www.paceretfs.com/ for more recent performance information.
KEY FUND STATISTICS (as of April 30, 2026)
|
Net Assets
|
$204,368,396
|
Portfolio Turnover
|
80%
|
|
|
Number of Holdings
|
112
|
30-Day SEC Yield
|
3.12%
|
|
|
Net Advisory Fee
|
$907,717
|
30-Day SEC Yield Unsubsidized
|
3.12%
|
WHAT DID THE FUND INVEST IN? (as of April 30, 2026)*
|
Top 10 Issuers
|
(%)
|
|
Weichai Power Co. Ltd.
|
3.4%
|
|
Petroleo Brasileiro SA - Petrobras
|
3.0%
|
|
Axia Energia
|
2.4%
|
|
America Movil SAB de CV
|
2.2%
|
|
China International Marine Containers Group Co. Ltd.
|
2.1%
|
|
Ambev SA
|
2.1%
|
|
Telefonica Brasil SA
|
2.1%
|
|
United Microelectronics Corp.
|
2.0%
|
|
PTT PCL
|
1.9%
|
|
JD Logistics, Inc.
|
1.9%
|
|
Top Sectors
|
(%)
|
|
Communication Services
|
18.2%
|
|
Industrials
|
17.4%
|
|
Energy
|
15.2%
|
|
Materials
|
10.3%
|
|
Information Technology
|
9.7%
|
|
Consumer Discretionary
|
9.4%
|
|
Utilities
|
9.4%
|
|
Consumer Staples
|
8.2%
|
|
Health Care
|
1.4%
|
|
Cash & Other
|
0.8%
|
|
Top Countries
|
(%)
|
|
China
|
20.9%
|
|
Brazil
|
14.7%
|
|
Taiwan
|
13.0%
|
|
Turkey
|
9.0%
|
|
Thailand
|
8.6%
|
|
United Arab Emirates
|
8.5%
|
|
South Africa
|
7.1%
|
|
Mexico
|
5.9%
|
|
Indonesia
|
3.9%
|
|
Cash & Other
|
8.4%
|
WHAT WERE THE FUND COSTS FOR THE PAST YEAR? (based on a hypothetical $10,000 investment)
|
Fund Name
|
Costs of a $10,000 investment
|
Costs paid as a percentage of a $10,000 investment
|
|
Pacer Global Cash Cows Dividend ETF
|
$70
|
0.60%
|
WHAT FACTORS INFLUENCED PERFORMANCE
Between May 1, 2025 and April 30, 2026, the Pacer Global Cash Cows Dividend ETF (GCOW) returned 32.3%, while its underlying index, the Pacer Global Cash Cows Dividend Index, returned 33.1% over the same period. This represents an underperformance of 0.8 percentage points for the Fund. For the one-year period ended April 30, 2026, GCOW’s Broad-Based Benchmark, the MSCI World Index returned 29.2%, while the Fund’s Strategy Benchmark, the MSCI World Value Index returned 26.7%.
What contributed to performance
The Fund was supported by steady demand for internationally diversified companies with strong cash generation and attractive dividend policies, particularly in sectors like energy, industrials, and global financials. Investor interest in value-oriented global equities improved at various points during the period, as market leadership broadened beyond concentrated U.S. growth names. A softer U.S. dollar at times also boosted returns by enhancing the value of overseas earnings and dividend streams when translated back into dollars. In addition, many holdings continued to demonstrate resilient profitability, which helped anchor income-driven performance even during uneven macro conditions.
The Fund was supported by steady demand for internationally diversified companies with strong cash generation and attractive dividend policies, particularly in sectors like energy, industrials, and global financials. Investor interest in value-oriented global equities improved at various points during the period, as market leadership broadened beyond concentrated U.S. growth names. A softer U.S. dollar at times also boosted returns by enhancing the value of overseas earnings and dividend streams when translated back into dollars. In addition, many holdings continued to demonstrate resilient profitability, which helped anchor income-driven performance even during uneven macro conditions.
What detracted from performance
Performance was periodically held back when global investors rotated aggressively into U.S. technology and AI leaders, reducing appetite for non-U.S. dividend-focused equities. Economic growth outside the United States was uneven, particularly in parts of Europe and Japan, which weighed on cyclical exposure within the portfolio. Currency swings occasionally reduced U.S.-dollar returns, especially when the dollar strengthened and offset local-market gains. At times of heightened market stress, international equities also saw faster selling pressure than domestic counterparts, leading to short-term valuation declines despite stable underlying business fundamentals.
Performance was periodically held back when global investors rotated aggressively into U.S. technology and AI leaders, reducing appetite for non-U.S. dividend-focused equities. Economic growth outside the United States was uneven, particularly in parts of Europe and Japan, which weighed on cyclical exposure within the portfolio. Currency swings occasionally reduced U.S.-dollar returns, especially when the dollar strengthened and offset local-market gains. At times of heightened market stress, international equities also saw faster selling pressure than domestic counterparts, leading to short-term valuation declines despite stable underlying business fundamentals.
The Fund’s performance information included above is compared with a regulatory required index that represents an overall securities market (Broad-Based Benchmark) and may include one or more indexes that more closely align to the Fund’s investment strategy (Strategy Benchmark(s)) or provide a secondary point of comparison.
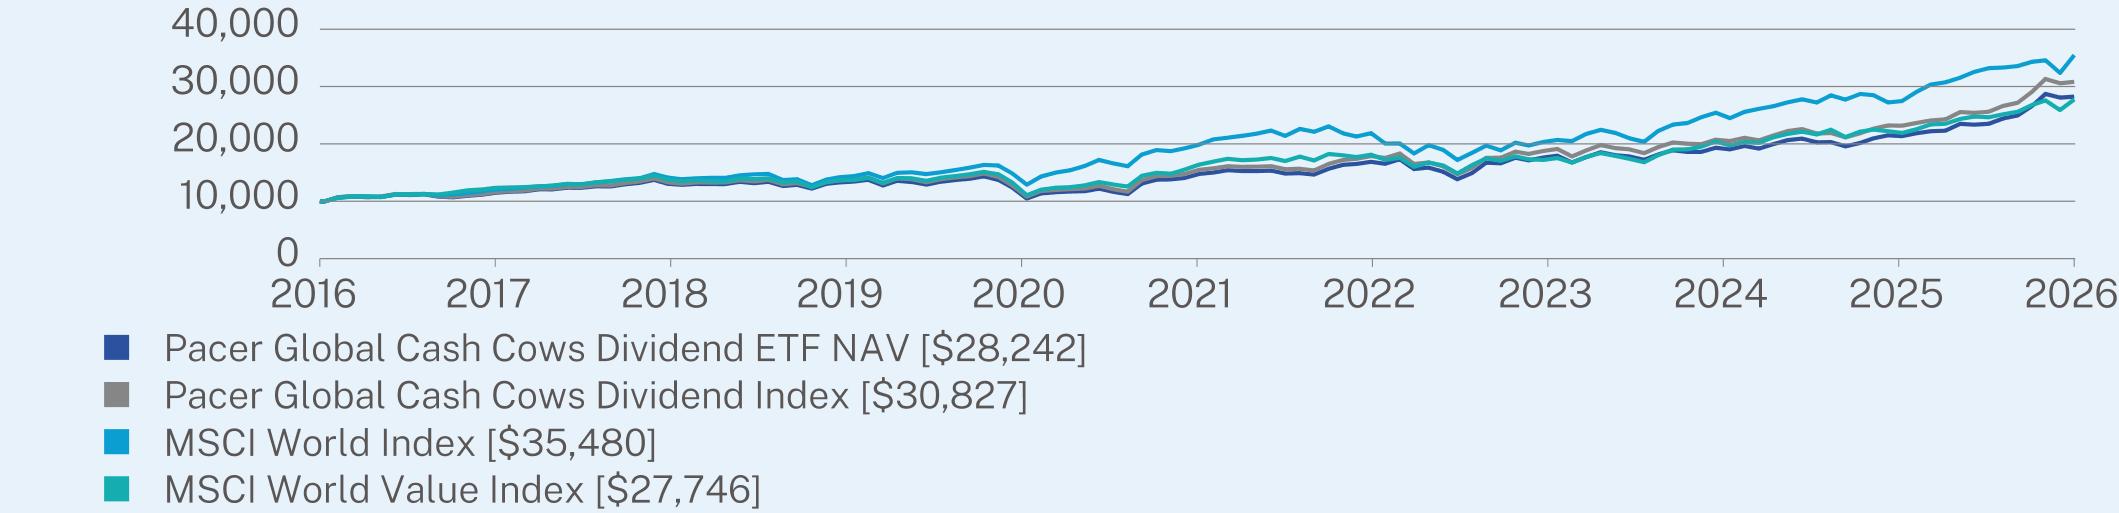
ANNUAL AVERAGE TOTAL RETURN (%)
|
|
1 Year
|
5 Year
|
10 Year
|
|
Pacer Global Cash Cows Dividend ETF NAV
|
32.26
|
13.50
|
10.02
|
|
Pacer Global Cash Cows Dividend Index
|
33.05
|
14.40
|
10.95
|
|
MSCI World Index
|
29.16
|
11.29
|
12.65
|
|
MSCI World Value Index
|
26.66
|
10.42
|
9.84
|
Visit https://www.paceretfs.com/ for more recent performance information.
KEY FUND STATISTICS (as of April 30, 2026)
|
Net Assets
|
$3,349,667,834
|
Portfolio Turnover
|
64%
|
|
|
Number of Holdings
|
102
|
30-Day SEC Yield
|
3.46%
|
|
|
Net Advisory Fee
|
$15,872,395
|
30-Day SEC Yield Unsubsidized
|
3.46%
|
WHAT DID THE FUND INVEST IN? (as of April 30, 2026)*
|
Top 10 Issuers
|
(%)
|
|
Equinor ASA
|
2.6%
|
|
TotalEnergies SE
|
2.5%
|
|
Rio Tinto PLC
|
2.4%
|
|
Exxon Mobil Corp.
|
2.3%
|
|
BP PLC
|
2.3%
|
|
BHP Group Ltd.
|
2.3%
|
|
Chevron Corp.
|
2.3%
|
|
Altria Group, Inc.
|
2.2%
|
|
ConocoPhillips
|
2.2%
|
|
Shell PLC
|
2.2%
|
|
Top Sectors
|
(%)
|
|
Energy
|
24.0%
|
|
Consumer Staples
|
17.5%
|
|
Communication Services
|
14.4%
|
|
Health Care
|
14.1%
|
|
Industrials
|
11.8%
|
|
Materials
|
7.5%
|
|
Consumer Discretionary
|
4.7%
|
|
Utilities
|
4.6%
|
|
Information Technology
|
0.7%
|
|
Cash & Other
|
0.7%
|
|
Top Countries
|
(%)
|
|
United States
|
26.3%
|
|
United Kingdom
|
15.3%
|
|
France
|
8.5%
|
|
Japan
|
7.5%
|
|
Canada
|
6.5%
|
|
Switzerland
|
6.0%
|
|
Germany
|
5.0%
|
|
Australia
|
4.5%
|
|
Hong Kong
|
4.5%
|
|
Cash & Other
|
15.9%
|
WHAT WERE THE FUND COSTS FOR THE PAST YEAR? (based on a hypothetical $10,000 investment)
|
Fund Name
|
Costs of a $10,000 investment
|
Costs paid as a percentage of a $10,000 investment
|
|
Pacer Industrial Real Estate ETF
|
$55
|
0.51%
|
WHAT FACTORS INFLUENCED PERFORMANCE
Between May 1, 2025 and April 30, 2026, the Pacer Industrial Real Estate ETF (INDS) returned 15.4%, while its underlying index, the Solactive GPR Industrial Real Estate Index, returned 16.2% over the same period. This represents an underperformance of 0.8 percentage points for the Fund. For the one-year period ended April 30, 2026, INDS’s Broad-Based Benchmark, the S&P 500 Index, returned 31.1%, while its Strategy Benchmark, the FTSE NAREIT All Equity REITs Total Return Index, returned 14.9%.
What contributed to performance
The Fund benefited from continued structural demand for industrial real estate tied to logistics, warehousing, and e-commerce distribution, which remained supported by long-term supply chain modernization trends. During the period, investor sentiment toward select REIT segments improved as industrial properties were still viewed as relatively resilient income generators, even in a higher-rate backdrop. Many underlying holdings maintained strong occupancy levels and steady rent escalations, helping preserve cash flow visibility. In addition, a stabilizing tone in broader equity markets at various points supported risk appetite for real asset income strategies.
The Fund benefited from continued structural demand for industrial real estate tied to logistics, warehousing, and e-commerce distribution, which remained supported by long-term supply chain modernization trends. During the period, investor sentiment toward select REIT segments improved as industrial properties were still viewed as relatively resilient income generators, even in a higher-rate backdrop. Many underlying holdings maintained strong occupancy levels and steady rent escalations, helping preserve cash flow visibility. In addition, a stabilizing tone in broader equity markets at various points supported risk appetite for real asset income strategies.
What detracted from performance
Performance was periodically constrained by interest-rate sensitivity, as shifting expectations around monetary policy kept pressure on REIT valuations through higher discount rates applied to long-duration cash flows. Broader market sentiment also tended to favor growth and technology leadership during key rallies, leaving real estate and other income-oriented sectors relatively out of favor. Cyclical concerns around economic growth introduced intermittent volatility, particularly for more rate-sensitive REIT segments despite solid property-level fundamentals. Finally, tighter financial conditions at times reduced investor willingness to pay premium valuations for yield-focused real estate strategies, limiting upside even when operating performance remained steady.
Performance was periodically constrained by interest-rate sensitivity, as shifting expectations around monetary policy kept pressure on REIT valuations through higher discount rates applied to long-duration cash flows. Broader market sentiment also tended to favor growth and technology leadership during key rallies, leaving real estate and other income-oriented sectors relatively out of favor. Cyclical concerns around economic growth introduced intermittent volatility, particularly for more rate-sensitive REIT segments despite solid property-level fundamentals. Finally, tighter financial conditions at times reduced investor willingness to pay premium valuations for yield-focused real estate strategies, limiting upside even when operating performance remained steady.
The Fund’s performance information included above is compared with a regulatory required index that represents an overall securities market (Broad-Based Benchmark) and may include one or more indexes that more closely align to the Fund’s investment strategy (Strategy Benchmark(s)) or provide a secondary point of comparison.
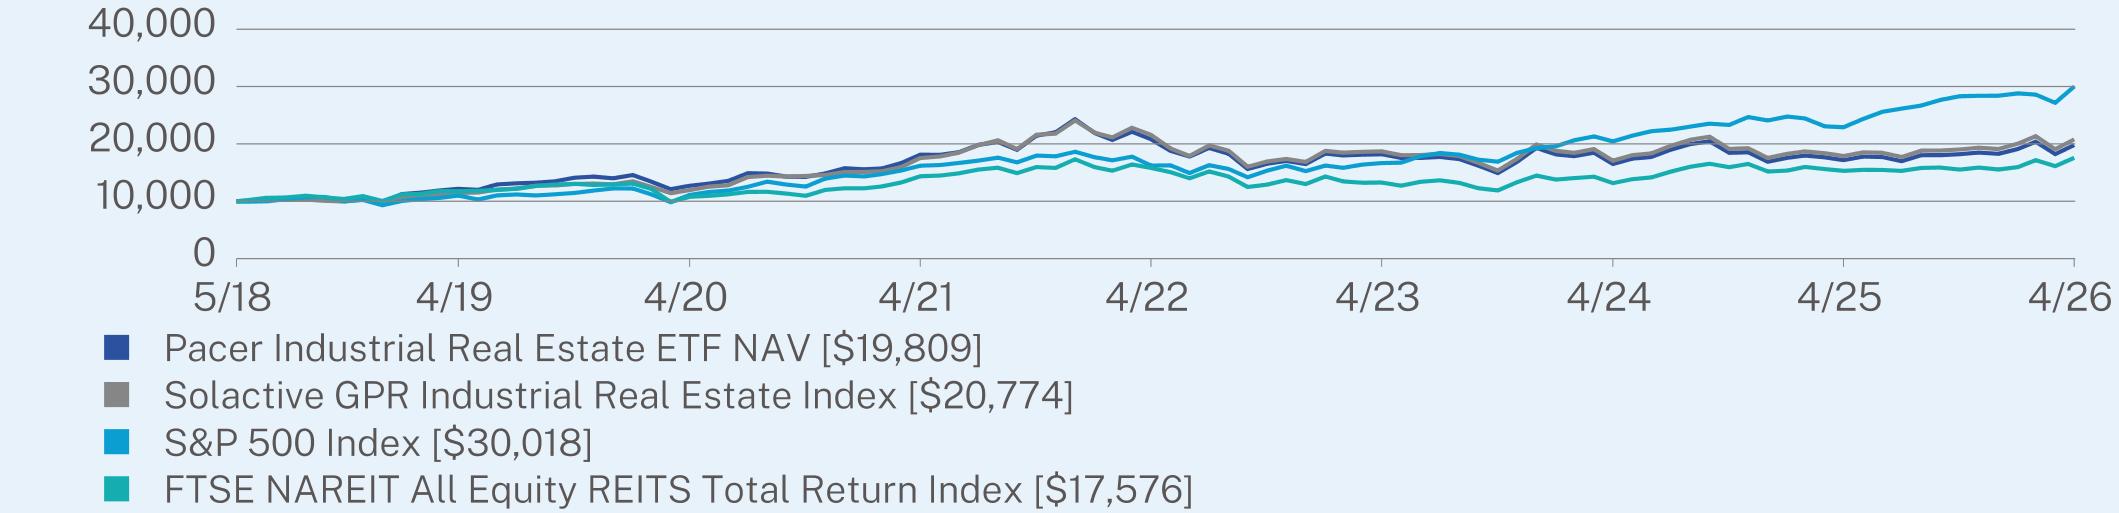
ANNUAL AVERAGE TOTAL RETURN (%)
|
|
1 Year
|
5 Year
|
Since Inception
(05/14/2018) |
|
Pacer Industrial Real Estate ETF NAV
|
15.37
|
1.80
|
8.96
|
|
Solactive GPR Industrial Real Estate Index
|
16.21
|
3.45
|
9.62
|
|
S&P 500 Index
|
31.05
|
13.14
|
14.80
|
|
FTSE NAREIT All Equity REITS Total Return Index
|
14.89
|
4.13
|
7.34
|
Visit https://www.paceretfs.com/ for more recent performance information.
KEY FUND STATISTICS (as of April 30, 2026)
|
Net Assets
|
$113,802,686
|
Portfolio Turnover
|
15%
|
|
|
Number of Holdings
|
32
|
30-Day SEC Yield
|
3.67%
|
|
|
Net Advisory Fee
|
$632,149
|
30-Day SEC Yield Unsubsidized
|
3.67%
|
WHAT DID THE FUND INVEST IN? (as of April 30, 2026)*
|
Top 10 Issuers
|
(%)
|
|
Mount Vernon Liquid Assets Portfolio, LLC
|
17.0%
|
|
Prologis, Inc.
|
15.5%
|
|
Public Storage
|
14.6%
|
|
Extra Space Storage, Inc.
|
14.6%
|
|
WP Carey, Inc.
|
4.4%
|
|
EastGroup Properties, Inc.
|
4.3%
|
|
Segro PLC
|
4.3%
|
|
CubeSmart
|
3.7%
|
|
Rexford Industrial Realty, Inc.
|
3.4%
|
|
First Industrial Realty Trust, Inc.
|
3.3%
|
|
Top Sectors
|
(%)
|
|
Real Estate
|
99.2%
|
|
Cash & Other
|
0.8%
|
WHAT WERE THE FUND COSTS FOR THE PAST YEAR? (based on a hypothetical $10,000 investment)
|
Fund Name
|
Costs of a $10,000 investment
|
Costs paid as a percentage of a $10,000 investment
|
|
Pacer Industrials and Logistics ETF
|
$70
|
0.60%
|
WHAT FACTORS INFLUENCED PERFORMANCE
Between May 1, 2025 and April 30, 2026, the Pacer Industrials and Logistics ETF (SHPP) returned 33.1%, while its underlying index, the Pacer Global Supply Chain Infrastructure Index, returned 34.6% over the same period. This represents an underperformance of roughly 1.5 percentage points for the Fund. For the one-year period ended April 30, 2026, SHPP’s Broad-Based Benchmark, the S&P Global 1200 Index, returned 32.5%, while its secondary index, the S&P 500 Index, returned 31.1%.
What contributed to performance
The Fund’s performance was supported by continued global investment in supply chain modernization, logistics automation, and industrial infrastructure, which kept demand strong for transportation, warehousing, and freight-related equities. Investor sentiment toward industrials remained generally constructive at various points, especially when markets broadened beyond mega-cap technology leadership into cyclical and real-economy sectors. Many underlying holdings benefited from resilient freight volumes, steady contract-based revenues, and ongoing efficiency gains tied to logistics technology adoption. Periodic risk-on environments also helped cyclical industrial names participate in equity rallies alongside improving global growth expectations.
The Fund’s performance was supported by continued global investment in supply chain modernization, logistics automation, and industrial infrastructure, which kept demand strong for transportation, warehousing, and freight-related equities. Investor sentiment toward industrials remained generally constructive at various points, especially when markets broadened beyond mega-cap technology leadership into cyclical and real-economy sectors. Many underlying holdings benefited from resilient freight volumes, steady contract-based revenues, and ongoing efficiency gains tied to logistics technology adoption. Periodic risk-on environments also helped cyclical industrial names participate in equity rallies alongside improving global growth expectations.
What detracted from performance
Performance was periodically pressured when broader market sentiment shifted back toward growth and AI-driven technology leadership, reducing relative interest in industrial and logistics equities. Rising or uncertain interest rate expectations also weighed on valuation multiples, as these businesses are sensitive to discount rate changes due to their capital-intensive nature. Cyclical concerns around global manufacturing activity and trade flows created intermittent volatility, particularly in transportation and freight-linked holdings. In risk-off phases, investors often rotated out of economically sensitive sectors first, leading to short-term underperformance despite generally stable underlying operating trends.
Performance was periodically pressured when broader market sentiment shifted back toward growth and AI-driven technology leadership, reducing relative interest in industrial and logistics equities. Rising or uncertain interest rate expectations also weighed on valuation multiples, as these businesses are sensitive to discount rate changes due to their capital-intensive nature. Cyclical concerns around global manufacturing activity and trade flows created intermittent volatility, particularly in transportation and freight-linked holdings. In risk-off phases, investors often rotated out of economically sensitive sectors first, leading to short-term underperformance despite generally stable underlying operating trends.
The Fund’s performance information included above is compared with a regulatory required index that represents an overall securities market (Broad-Based Benchmark) and may include one or more indexes that more closely align to the Fund’s investment strategy (Strategy Benchmark(s)) or provide a secondary point of comparison.
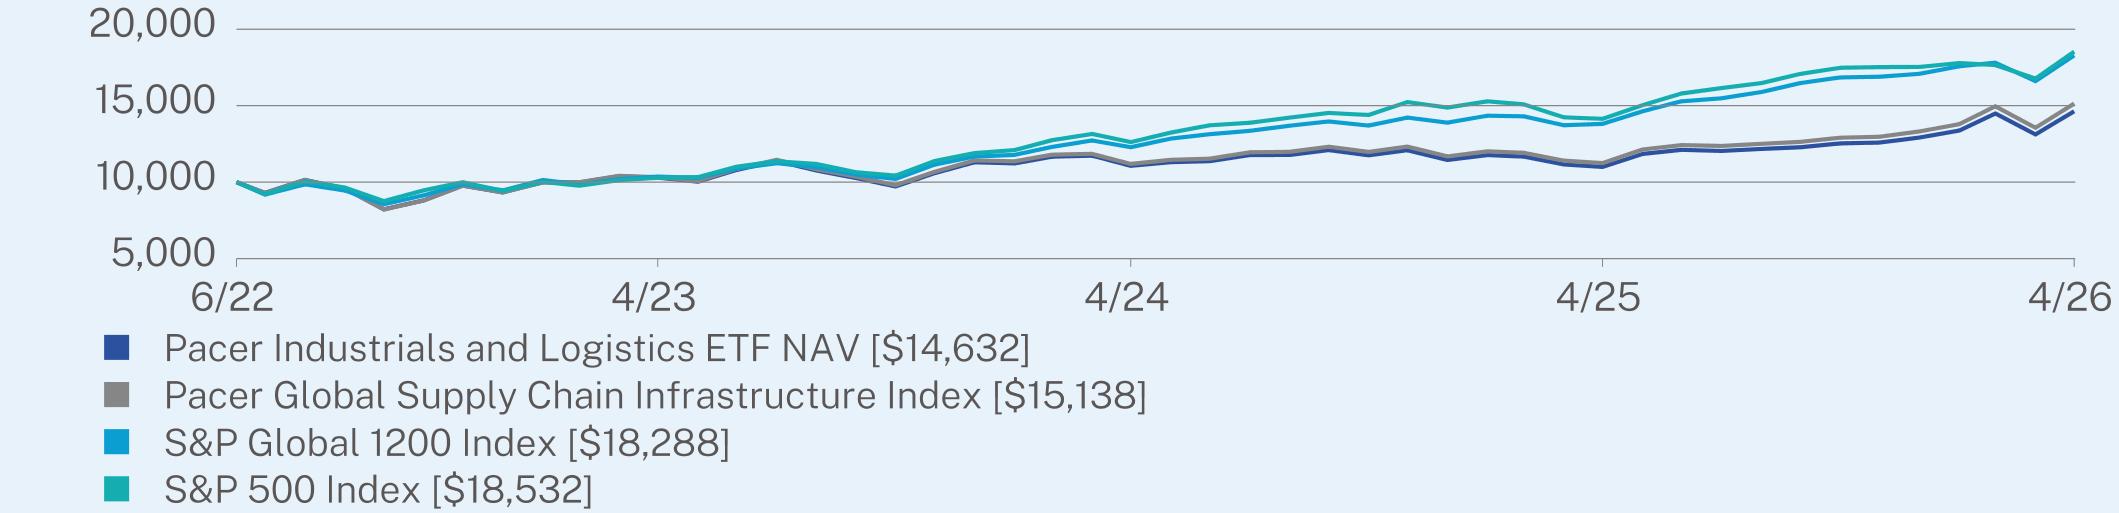
ANNUAL AVERAGE TOTAL RETURN (%)
|
|
1 Year
|
Since Inception
(06/08/2022) |
|
Pacer Industrials and Logistics ETF NAV
|
33.06
|
10.27
|
|
Pacer Global Supply Chain Infrastructure Index
|
34.62
|
11.24
|
|
S&P Global 1200 Index
|
32.45
|
16.77
|
|
S&P 500 Index
|
31.05
|
17.17
|
Visit https://www.paceretfs.com/ for more recent performance information.
KEY FUND STATISTICS (as of April 30, 2026)
|
Net Assets
|
$1,999,686
|
Portfolio Turnover
|
50%
|
|
|
Number of Holdings
|
99
|
30-Day SEC Yield
|
1.38%
|
|
|
Net Advisory Fee
|
$12,837
|
30-Day SEC Yield Unsubsidized
|
1.38%
|
WHAT DID THE FUND INVEST IN? (as of April 30, 2026)*
|
Top 10 Issuers
|
(%)
|
|
Mount Vernon Liquid Assets Portfolio, LLC
|
13.5%
|
|
ABB Ltd.
|
11.0%
|
|
Union Pacific Corp.
|
10.3%
|
|
SAP SE
|
8.3%
|
|
FedEx Corp.
|
6.9%
|
|
United Parcel Service, Inc.
|
5.8%
|
|
CSX Corp.
|
4.1%
|
|
Canadian Pacific Kansas City Ltd.
|
3.8%
|
|
Norfolk Southern Corp.
|
3.7%
|
|
Canadian National Railway Co.
|
3.3%
|
|
Top Sectors
|
(%)
|
|
Industrials
|
85.4%
|
|
Information Technology
|
13.6%
|
|
Energy
|
0.6%
|
|
Cash & Other
|
0.4%
|
WHAT WERE THE FUND COSTS FOR THE PAST YEAR? (based on a hypothetical $10,000 investment)
|
Fund Name
|
Costs of a $10,000 investment
|
Costs paid as a percentage of a $10,000 investment*,**
|
|
Pacer International Export Leaders ETF
|
$22
|
0.60%
|
WHAT FACTORS INFLUENCED PERFORMANCE
Since its inception on December 22, 2025 through April 30, 2026, the Pacer International Export Leaders ETF (PIEL) returned 3.2%, while its underlying index, the Pacer International Export Leaders Index, returned 3.9% over the same period. This represents an underperformance of 0.7 percentage points for the Fund. Over the same period, PIEL’s Broad-Based Benchmark, the FTSE Developed ex US Index, returned 9.6%, while its secondary index, the MSCI EAFE Index, returned 6.7%.
What contributed to performance
The Fund was supported by strong global exposure to large multinational exporters with durable free cash flow, particularly in semiconductors, pharmaceuticals, luxury goods, and industrial technology. During the period, global trade activity remained resilient enough to support earnings for many export-heavy companies, especially those with dominant market positions and pricing power. Investor sentiment also periodically favored internationally diversified “quality at a reasonable price” themes, which helped re-rate several European and Asian leaders. The portfolio’s tilt toward firms with strong global sales footprints allowed it to participate in multiple regional growth cycles rather than relying on a single geography.
The Fund was supported by strong global exposure to large multinational exporters with durable free cash flow, particularly in semiconductors, pharmaceuticals, luxury goods, and industrial technology. During the period, global trade activity remained resilient enough to support earnings for many export-heavy companies, especially those with dominant market positions and pricing power. Investor sentiment also periodically favored internationally diversified “quality at a reasonable price” themes, which helped re-rate several European and Asian leaders. The portfolio’s tilt toward firms with strong global sales footprints allowed it to participate in multiple regional growth cycles rather than relying on a single geography.
What detracted from performance
Performance was periodically limited when global market leadership concentrated in U.S. mega-cap AI and technology names, pulling capital away from international exporters and more cyclically exposed regions. Currency fluctuations also created intermittent headwinds, as strengthening of the U.S. dollar reduced translated earnings and dampened returns from overseas holdings. At times, concerns about slowing industrial activity in parts of Europe and uneven recovery in China weighed on sentiment toward export-oriented sectors. In risk-off environments, investors also tended to de-risk international equities more aggressively than U.S. markets, leading to temporary valuation compression despite generally stable company-level fundamentals.
Performance was periodically limited when global market leadership concentrated in U.S. mega-cap AI and technology names, pulling capital away from international exporters and more cyclically exposed regions. Currency fluctuations also created intermittent headwinds, as strengthening of the U.S. dollar reduced translated earnings and dampened returns from overseas holdings. At times, concerns about slowing industrial activity in parts of Europe and uneven recovery in China weighed on sentiment toward export-oriented sectors. In risk-off environments, investors also tended to de-risk international equities more aggressively than U.S. markets, leading to temporary valuation compression despite generally stable company-level fundamentals.
The Fund’s performance information included above is compared with a regulatory required index that represents an overall securities market (Broad-Based Benchmark) and may include one or more indexes that more closely align to the Fund’s investment strategy (Strategy Benchmark(s)) or provide a secondary point of comparison.
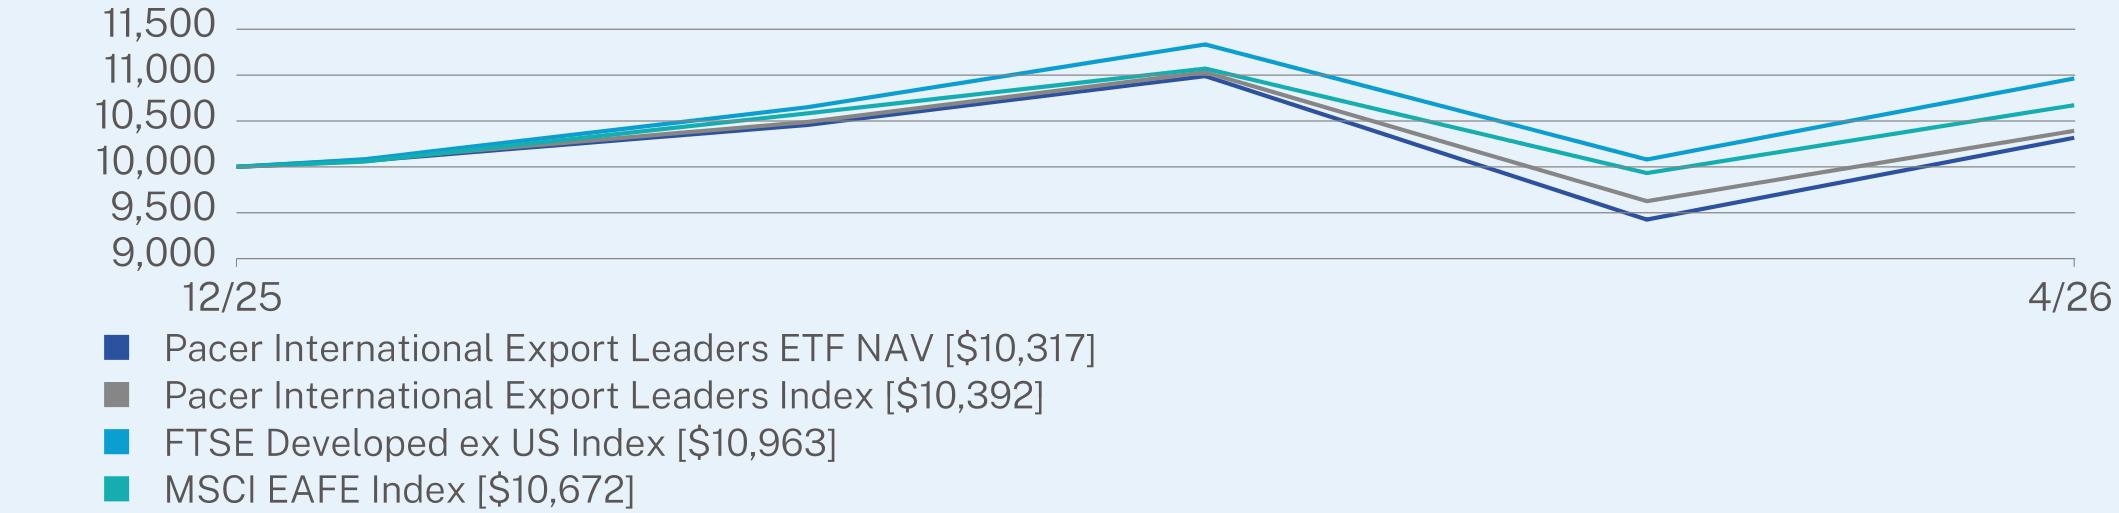
ANNUAL AVERAGE TOTAL RETURN (%)
|
|
Since Inception
(12/22/2025) |
|
Pacer International Export Leaders ETF NAV
|
3.17
|
|
Pacer International Export Leaders Index
|
3.92
|
|
FTSE Developed ex US Index
|
9.63
|
|
MSCI EAFE Index
|
6.72
|
Visit https://www.paceretfs.com/ for more recent performance information.
KEY FUND STATISTICS (as of April 30, 2026)
|
Net Assets
|
$1,038,723
|
|
Number of Holdings
|
100
|
|
Net Advisory Fee
|
$2,174
|
|
Portfolio Turnover
|
0%
|
|
30-Day SEC Yield
|
0.94%
|
|
30-Day SEC Yield Unsubsidized
|
0.94%
|
WHAT DID THE FUND INVEST IN? (as of April 30, 2026)*
|
Top 10 Issuers
|
(%)
|
|
SK Hynix, Inc.
|
9.8%
|
|
ASML Holding NV
|
6.1%
|
|
Novartis AG
|
4.9%
|
|
AstraZeneca PLC
|
4.6%
|
|
Roche Holding AG
|
4.5%
|
|
LVMH Moet Hennessy Louis Vuitton SE
|
3.5%
|
|
SAP SE
|
3.3%
|
|
Hermes International SCA
|
3.1%
|
|
BHP Group Ltd.
|
3.0%
|
|
Industria de Diseno Textil SA
|
2.9%
|
|
Top Sectors
|
(%)
|
|
Information Technology
|
29.8%
|
|
Health Care
|
23.8%
|
|
Consumer Discretionary
|
17.8%
|
|
Industrials
|
13.0%
|
|
Materials
|
9.8%
|
|
Consumer Staples
|
3.9%
|
|
Energy
|
1.1%
|
|
Communication Services
|
0.4%
|
|
Cash & Other
|
0.4%
|
|
Top Ten Countries
|
(%)
|
|
Switzerland
|
15.5%
|
|
United Kingdom
|
11.9%
|
|
South Korea
|
10.7%
|
|
Netherlands
|
10.0%
|
|
Japan
|
9.2%
|
|
France
|
9.0%
|
|
Canada
|
8.2%
|
|
Australia
|
5.6%
|
|
Sweden
|
4.0%
|
|
Cash & Other
|
15.9%
|
WHAT WERE THE FUND COSTS FOR THE PAST YEAR? (based on a hypothetical $10,000 investment)
|
Fund Name
|
Costs of a $10,000 investment
|
Costs paid as a percentage of a $10,000 investment
|
|
Pacer Lunt Large Cap Alternator ETF
|
$70
|
0.60%
|
WHAT FACTORS INFLUENCED PERFORMANCE
Between May 1, 2025 and April 30, 2026, the Pacer Lunt Large Cap Alternator ETF (ALTL) returned 33.2%, while its underlying index, the Lunt Capital U.S Large Cap Equity Rotation Index, returned 34.0% over the same period. This represents an underperformance of 0.8 percentage points for the Fund. For the one-year period ended April 30, 2026, ALTL’s Broad-Based Benchmark, the S&P 500 Index, returned 31.1%.
What contributed to performance
The Pacer Lunt Large Cap Alternator ETF benefited from its systematic rotation between low-volatility and high-beta large-cap U.S. equities, which allowed it to adapt to changing market leadership over the period. When equity markets were driven by momentum and strong risk appetite—particularly in cyclical and growth-led rallies—the strategy’s high-beta exposure helped capture upside participation. In contrast, during periods of heightened volatility or uneven macro signals, the allocation shifted toward lower-volatility names, which helped preserve capital and stabilize returns. Broader market sentiment that alternated between risk-on enthusiasm and defensive positioning generally aligned well with the fund’s adaptive, factor-rotation approach.
The Pacer Lunt Large Cap Alternator ETF benefited from its systematic rotation between low-volatility and high-beta large-cap U.S. equities, which allowed it to adapt to changing market leadership over the period. When equity markets were driven by momentum and strong risk appetite—particularly in cyclical and growth-led rallies—the strategy’s high-beta exposure helped capture upside participation. In contrast, during periods of heightened volatility or uneven macro signals, the allocation shifted toward lower-volatility names, which helped preserve capital and stabilize returns. Broader market sentiment that alternated between risk-on enthusiasm and defensive positioning generally aligned well with the fund’s adaptive, factor-rotation approach.
What detracted from performance
Performance was periodically limited by timing friction inherent in factor rotation, especially when market leadership shifted quickly and the strategy lagged rapid reversals between growth and defensive regimes. In environments where a single style dominated for extended stretches—such as sustained leadership from mega-cap growth equities—the Fund’s alternating exposure sometimes underperformed a more consistently concentrated approach. Shifts in investor sentiment driven by changing interest rate expectations also created whipsaw conditions, where neither low-volatility nor high-beta positioning held a clear advantage for long periods. Additionally, transitional market phases with choppy risk sentiment reduced the effectiveness of factor rotation, muting returns relative to more persistently positioned benchmarks.
Performance was periodically limited by timing friction inherent in factor rotation, especially when market leadership shifted quickly and the strategy lagged rapid reversals between growth and defensive regimes. In environments where a single style dominated for extended stretches—such as sustained leadership from mega-cap growth equities—the Fund’s alternating exposure sometimes underperformed a more consistently concentrated approach. Shifts in investor sentiment driven by changing interest rate expectations also created whipsaw conditions, where neither low-volatility nor high-beta positioning held a clear advantage for long periods. Additionally, transitional market phases with choppy risk sentiment reduced the effectiveness of factor rotation, muting returns relative to more persistently positioned benchmarks.
The Fund’s performance information included above is compared with a regulatory required index that represents an overall securities market (Broad-Based Benchmark) and may include one or more indexes that more closely align to the Fund’s investment strategy (Strategy Benchmark(s)) or provide a secondary point of comparison.
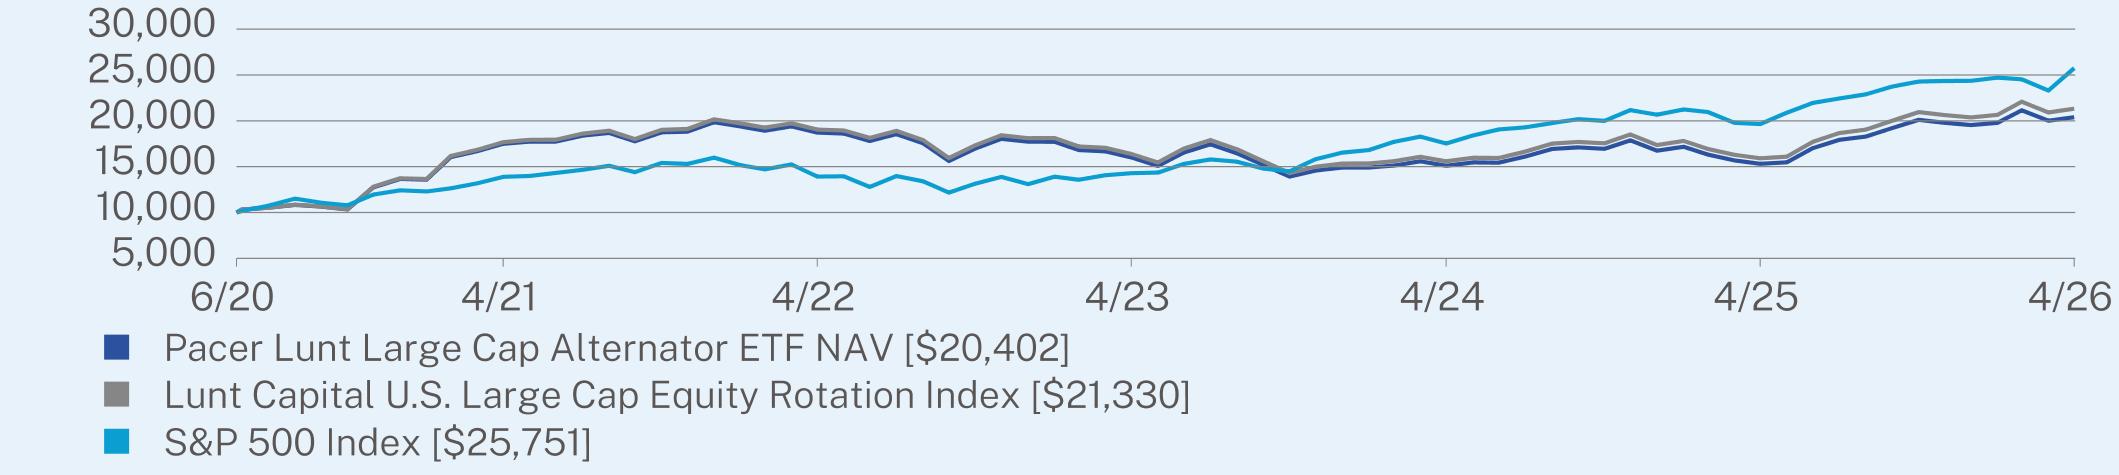
ANNUAL AVERAGE TOTAL RETURN (%)
|
|
1 Year
|
5 Year
|
Since Inception
(06/24/2020) |
|
Pacer Lunt Large Cap Alternator ETF NAV
|
33.21
|
3.12
|
12.96
|
|
Lunt Capital U.S. Large Cap Equity Rotation Index
|
34.02
|
3.83
|
13.83
|
|
S&P 500 Index
|
31.05
|
13.14
|
17.55
|
Visit https://www.paceretfs.com/ for more recent performance information.
KEY FUND STATISTICS (as of April 30, 2026)
|
Net Assets
|
$94,024,795
|
Portfolio Turnover
|
467%
|
|
|
Number of Holdings
|
101
|
30-Day SEC Yield
|
1.91%
|
|
|
Net Advisory Fee
|
$643,312
|
30-Day SEC Yield Unsubsidized
|
1.91%
|
WHAT DID THE FUND INVEST IN? (as of April 30, 2026)*
|
Top 10 Issuers
|
(%)
|
|
Mount Vernon Liquid Assets Portfolio, LLC
|
13.3%
|
|
CenterPoint Energy, Inc.
|
1.4%
|
|
Pinnacle West Capital Corp.
|
1.4%
|
|
Atmos Energy Corp.
|
1.3%
|
|
WEC Energy Group, Inc.
|
1.3%
|
|
Southern Co.
|
1.3%
|
|
Ameren Corp.
|
1.3%
|
|
DTE Energy Co.
|
1.3%
|
|
Alliant Energy Corp.
|
1.3%
|
|
Evergy, Inc.
|
1.3%
|
|
Top Sectors
|
(%)
|
|
Utilities
|
26.8%
|
|
Financials
|
17.5%
|
|
Real Estate
|
14.8%
|
|
Industrials
|
12.8%
|
|
Consumer Staples
|
10.8%
|
|
Health Care
|
6.7%
|
|
Consumer Discretionary
|
4.9%
|
|
Materials
|
2.0%
|
|
Information Technology
|
1.9%
|
|
Cash & Other
|
1.8%
|
WHAT WERE THE FUND COSTS FOR THE PAST YEAR? (based on a hypothetical $10,000 investment)
|
Fund Name
|
Costs of a $10,000 investment
|
Costs paid as a percentage of a $10,000 investment
|
|
Pacer Lunt Large Cap Multi-Factor Alternator ETF
|
$66
|
0.60%
|
WHAT FACTORS INFLUENCED PERFORMANCE
Between May 1, 2025 and April 30, 2026, the Pacer Lunt Large Cap Multi-Factor Alternator ETF (PALC) returned 18.6%, while its underlying index, the Lunt Capital U.S. Large Cap Multi-Factor Rotation Index, returned 19.5% over the same period. This represents an underperformance of 0.9 percentage points for the Fund. For the one-year period ended April 30, 2026, PALC’s Broad-Based Benchmark, the S&P 500 Index, returned 31.1%.
What contributed to performance
The Fund benefited from its systematic rotation across key equity factors—value, quality, momentum, and low volatility—within large-cap U.S. stocks, which allowed it to participate in whichever style environment was in favor at different points in the period. When market leadership broadened beyond a narrow set of mega-cap growth names, the strategy was able to capture returns from more cyclically and value-oriented segments of the S&P 500. Periods of improving investor risk appetite also helped higher-beta and momentum-tilted exposures perform well, while the quality and defensive allocations provided support when conditions turned more uncertain. Broader sentiment shifts between growth leadership and factor rotation created multiple opportunities for the model to adapt and stay engaged with prevailing trends.
The Fund benefited from its systematic rotation across key equity factors—value, quality, momentum, and low volatility—within large-cap U.S. stocks, which allowed it to participate in whichever style environment was in favor at different points in the period. When market leadership broadened beyond a narrow set of mega-cap growth names, the strategy was able to capture returns from more cyclically and value-oriented segments of the S&P 500. Periods of improving investor risk appetite also helped higher-beta and momentum-tilted exposures perform well, while the quality and defensive allocations provided support when conditions turned more uncertain. Broader sentiment shifts between growth leadership and factor rotation created multiple opportunities for the model to adapt and stay engaged with prevailing trends.
What detracted from performance
Performance was periodically held back when market leadership became highly concentrated in a small group of large-cap growth and AI-driven technology stocks, which reduced the benefit of broader factor diversification. In these environments, factor rotation lagged the momentum of dominant index constituents, especially when leadership persisted longer than expected. Rapid shifts in sentiment around interest rates and macro growth expectations also created choppier factor performance, making it harder for monthly rotation signals to fully capture inflection points. Additionally, transitional markets—where investors quickly oscillated between defensive and risk-seeking behavior—sometimes led to whipsaw effects that muted returns relative to a more persistently positioned index.
Performance was periodically held back when market leadership became highly concentrated in a small group of large-cap growth and AI-driven technology stocks, which reduced the benefit of broader factor diversification. In these environments, factor rotation lagged the momentum of dominant index constituents, especially when leadership persisted longer than expected. Rapid shifts in sentiment around interest rates and macro growth expectations also created choppier factor performance, making it harder for monthly rotation signals to fully capture inflection points. Additionally, transitional markets—where investors quickly oscillated between defensive and risk-seeking behavior—sometimes led to whipsaw effects that muted returns relative to a more persistently positioned index.
The Fund’s performance information included above is compared with a regulatory required index that represents an overall securities market (Broad-Based Benchmark) and may include one or more indexes that more closely align to the Fund’s investment strategy (Strategy Benchmark(s)) or provide a secondary point of comparison.
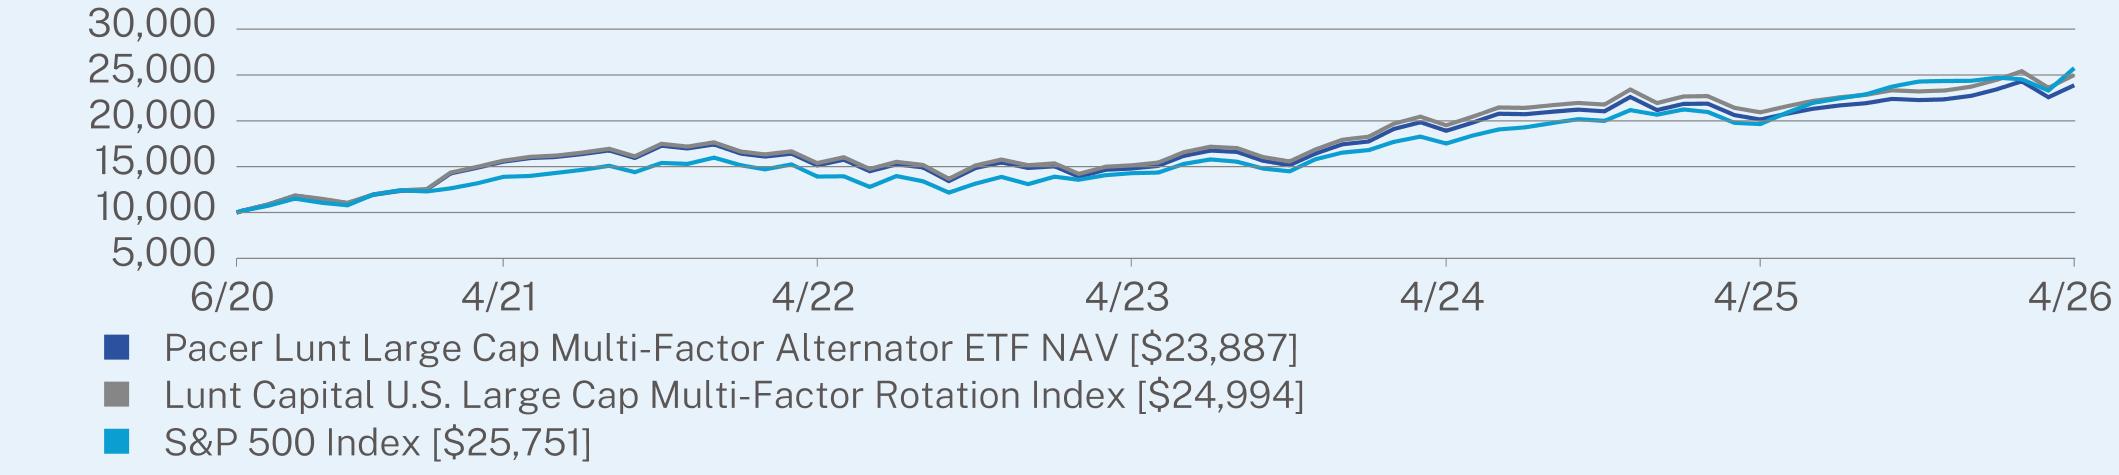
ANNUAL AVERAGE TOTAL RETURN (%)
|
|
1 Year
|
5 Year
|
Since Inception
(06/24/2020) |
|
Pacer Lunt Large Cap Multi-Factor Alternator ETF NAV
|
18.59
|
8.98
|
16.05
|
|
Lunt Capital U.S. Large Cap Multi-Factor Rotation Index
|
19.45
|
9.80
|
16.95
|
|
S&P 500 Index
|
31.05
|
13.14
|
17.55
|
Visit https://www.paceretfs.com/ for more recent performance information.
KEY FUND STATISTICS (as of April 30, 2026)
|
Net Assets
|
$230,353,946
|
Portfolio Turnover
|
451%
|
|
|
Number of Holdings
|
192
|
30-Day SEC Yield
|
1.21%
|
|
|
Net Advisory Fee
|
$1,612,445
|
30-Day SEC Yield Unsubsidized
|
1.21%
|
WHAT DID THE FUND INVEST IN? (as of April 30, 2026)*
|
Top 10 Issuers
|
(%)
|
|
Exxon Mobil Corp.
|
2.9%
|
|
Costco Wholesale Corp.
|
2.5%
|
|
Visa, Inc.
|
2.4%
|
|
UnitedHealth Group, Inc.
|
2.3%
|
|
Apple, Inc.
|
2.3%
|
|
Chevron Corp.
|
2.3%
|
|
Mastercard, Inc.
|
2.2%
|
|
Bank of America Corp.
|
2.2%
|
|
Berkshire Hathaway, Inc.
|
2.1%
|
|
General Electric Co.
|
2.1%
|
|
Top Sectors
|
(%)
|
|
Financials
|
23.0%
|
|
Information Technology
|
15.5%
|
|
Industrials
|
14.0%
|
|
Health Care
|
11.9%
|
|
Energy
|
10.6%
|
|
Consumer Staples
|
10.6%
|
|
Communication Services
|
5.3%
|
|
Consumer Discretionary
|
4.8%
|
|
Materials
|
2.4%
|
|
Cash & Other
|
1.9%
|
WHAT WERE THE FUND COSTS FOR THE PAST YEAR? (based on a hypothetical $10,000 investment)
|
Fund Name
|
Costs of a $10,000 investment
|
Costs paid as a percentage of a $10,000 investment
|
|
Pacer Lunt MidCap Multi-Factor Alternator ETF
|
$69
|
0.60%
|
WHAT FACTORS INFLUENCED PERFORMANCE
Between May 1, 2025 and April 30, 2026, the Pacer Lunt MidCap Multi-Factor Alternator ETF (PAMC) returned 29.9%, while its underlying index, the Lunt Capital U.S MidCap Multi-Factor Rotation Index, returned 30.6% over the same period. This represents an underperformance of 0.7 percentage points for the Fund. For the one-year period ended April 30, 2026, PAMC’s Broad-Based Benchmark, the S&P Composite 1500 Index, returned 31.2%, while its Strategy Benchmark, the S&P MidCap 400 Index returned 29.5%.
What contributed to performance
The Pacer Lunt MidCap Multi-Factor Alternator ETF benefited from its **dynamic rotation across mid-cap style factors—value, momentum, quality, and low volatility—**which allowed it to participate in shifting leadership within the U.S. mid-cap space. When markets broadened beyond mega-cap technology, mid-cap cyclicals, industrials, and select financials gained traction, supporting the strategy’s exposure. Periods of healthy risk appetite also helped momentum- and cyclical-leaning holdings contribute meaningfully to returns. At the same time, the Fund’s quality and defensive tilts provided stability during volatility spikes, helping smooth performance as sentiment oscillated between growth and value leadership regimes.
The Pacer Lunt MidCap Multi-Factor Alternator ETF benefited from its **dynamic rotation across mid-cap style factors—value, momentum, quality, and low volatility—**which allowed it to participate in shifting leadership within the U.S. mid-cap space. When markets broadened beyond mega-cap technology, mid-cap cyclicals, industrials, and select financials gained traction, supporting the strategy’s exposure. Periods of healthy risk appetite also helped momentum- and cyclical-leaning holdings contribute meaningfully to returns. At the same time, the Fund’s quality and defensive tilts provided stability during volatility spikes, helping smooth performance as sentiment oscillated between growth and value leadership regimes.
What detracted from performance
Performance was periodically constrained when market leadership became narrow and dominated by large-cap growth and AI-driven technology stocks, which are outside the mid-cap universe and reduced relative appeal for the strategy. Rapid shifts in investor sentiment around interest rates and economic growth created uneven factor leadership, making it harder for mid-cap rotations to consistently align with the prevailing regime. At times, quicker-than-expected reversals between risk-on and risk-off environments also led to whipsaw effects, where recently favored factors underperformed shortly after rotation. In addition, mid-cap equities as a group experienced higher volatility during uncertain macro periods, which occasionally weighed on returns despite underlying earnings resilience.
Performance was periodically constrained when market leadership became narrow and dominated by large-cap growth and AI-driven technology stocks, which are outside the mid-cap universe and reduced relative appeal for the strategy. Rapid shifts in investor sentiment around interest rates and economic growth created uneven factor leadership, making it harder for mid-cap rotations to consistently align with the prevailing regime. At times, quicker-than-expected reversals between risk-on and risk-off environments also led to whipsaw effects, where recently favored factors underperformed shortly after rotation. In addition, mid-cap equities as a group experienced higher volatility during uncertain macro periods, which occasionally weighed on returns despite underlying earnings resilience.
The Fund’s performance information included above is compared with a regulatory required index that represents an overall securities market (Broad-Based Benchmark) and may include one or more indexes that more closely align to the Fund’s investment strategy (Strategy Benchmark(s)) or provide a secondary point of comparison.
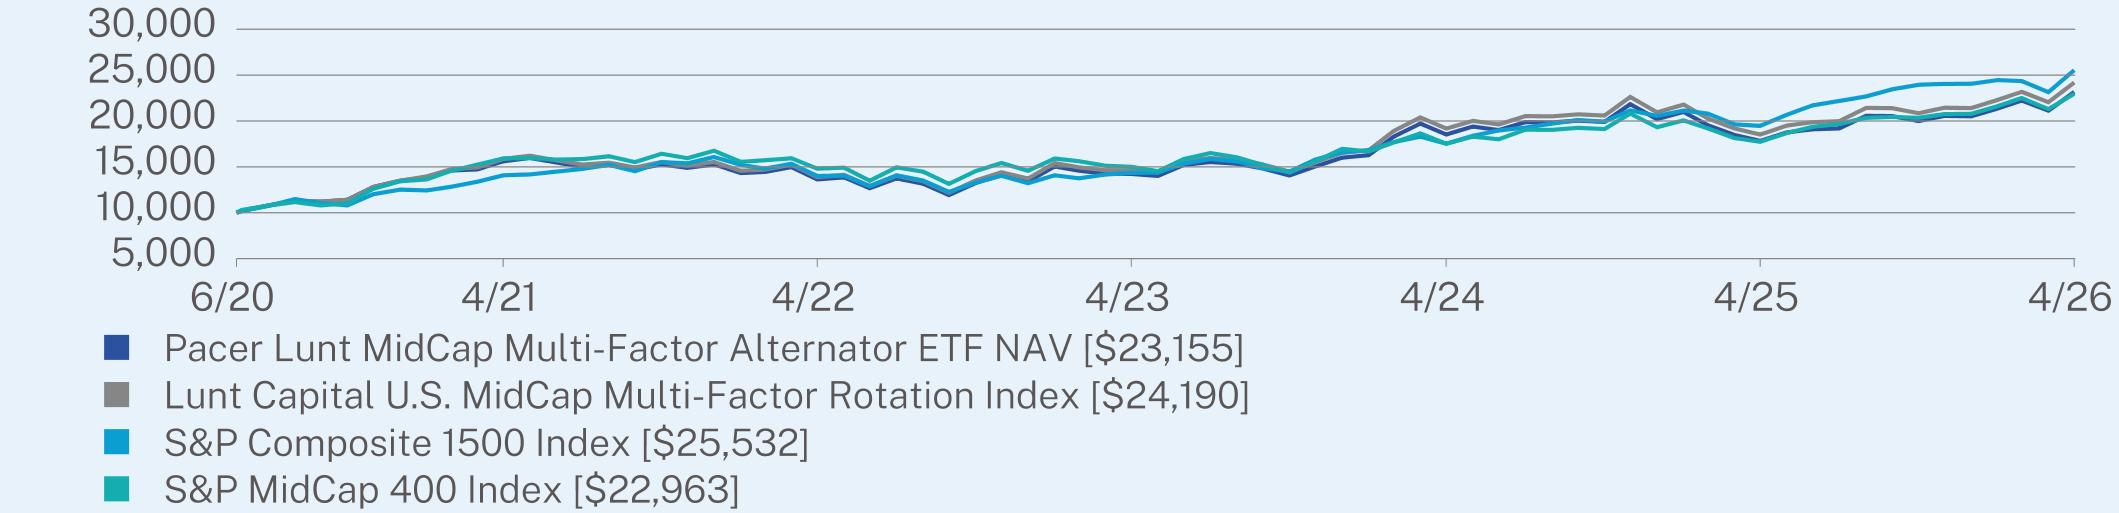
ANNUAL AVERAGE TOTAL RETURN (%)
|
|
1 Year
|
5 Year
|
Since Inception
(06/24/2020) |
|
Pacer Lunt MidCap Multi-Factor Alternator ETF NAV
|
29.92
|
8.21
|
15.44
|
|
Lunt Capital U.S. MidCap Multi-Factor Rotation Index
|
30.63
|
8.82
|
16.30
|
|
S&P Composite 1500 Index
|
31.17
|
12.65
|
17.38
|
|
S&P MidCap 400 Index
|
29.49
|
7.60
|
15.27
|
Visit https://www.paceretfs.com/ for more recent performance information.
KEY FUND STATISTICS (as of April 30, 2026)
|
Net Assets
|
$63,015,148
|
Portfolio Turnover
|
630%
|
|
|
Number of Holdings
|
152
|
30-Day SEC Yield
|
0.72%
|
|
|
Net Advisory Fee
|
$364,564
|
30-Day SEC Yield Unsubsidized
|
0.72%
|
WHAT DID THE FUND INVEST IN? (as of April 30, 2026)*
|
Top 10 Issuers
|
(%)
|
|
Mount Vernon Liquid Assets Portfolio, LLC
|
10.7%
|
|
TD Synnex Corp.
|
2.1%
|
|
Curtiss-Wright Corp.
|
2.1%
|
|
Alcoa Corp.
|
2.0%
|
|
TechnipFMC PLC
|
1.9%
|
|
HF Sinclair Corp.
|
1.7%
|
|
Fabrinet
|
1.5%
|
|
RenaissanceRe Holdings Ltd.
|
1.5%
|
|
ATI, Inc.
|
1.4%
|
|
TTM Technologies, Inc.
|
1.4%
|
|
Top Sectors
|
(%)
|
|
Industrials
|
26.5%
|
|
Financials
|
16.5%
|
|
Information Technology
|
12.7%
|
|
Consumer Discretionary
|
11.5%
|
|
Energy
|
10.5%
|
|
Materials
|
6.8%
|
|
Real Estate
|
4.1%
|
|
Consumer Staples
|
3.8%
|
|
Utilities
|
3.4%
|
|
Cash & Other
|
4.2%
|
WHAT WERE THE FUND COSTS FOR THE PAST YEAR? (based on a hypothetical $10,000 investment)
|
Fund Name
|
Costs of a $10,000 investment
|
Costs paid as a percentage of a $10,000 investment
|
|
Pacer MSCI World Industry Advantage ETF
|
$76
|
0.65%
|
WHAT FACTORS INFLUENCED PERFORMANCE
Between May 1, 2025 and April 30, 2026, the Pacer MSCI World Industry Advantage ETF (GLBL) returned 33.4%, while its underlying index, the MSCI World Ricardo Comparative Advantage Select Index, returned 34.0% over the same period. This represents an underperformance of 0.6 percentage points for the Fund. For the one-year period ended April 30, 2026, GLBL’s Broad-Based Benchmark, the MSCI World Index, returned 29.2%.
What contributed to performance
The Pacer MSCI World Industry Advantage ETF was supported by its exposure to global industry leaders with durable competitive advantages, particularly in technology, communication services, and select industrial segments. During the period, broad market sentiment toward developed-market equities was generally constructive at times, especially when investors favored high-quality multinational companies with strong earnings visibility and global revenue streams. The Fund also benefited from continued enthusiasm around innovation-driven sectors—especially semiconductors and large-cap tech platforms—that remained central to global equity leadership. Its diversified developed-market exposure helped it participate in multiple regional upswings rather than relying on a single country or sector cycle.
The Pacer MSCI World Industry Advantage ETF was supported by its exposure to global industry leaders with durable competitive advantages, particularly in technology, communication services, and select industrial segments. During the period, broad market sentiment toward developed-market equities was generally constructive at times, especially when investors favored high-quality multinational companies with strong earnings visibility and global revenue streams. The Fund also benefited from continued enthusiasm around innovation-driven sectors—especially semiconductors and large-cap tech platforms—that remained central to global equity leadership. Its diversified developed-market exposure helped it participate in multiple regional upswings rather than relying on a single country or sector cycle.
What detracted from performance
Performance was periodically limited when equity leadership became narrowly concentrated in a handful of mega-cap growth and AI-related U.S. stocks, which reduced relative breadth in global developed markets. Shifts in interest rate expectations also influenced sentiment, as higher discount-rate environments tend to compress valuations for longer-duration growth equities that feature prominently in the strategy. At times, global risk sentiment weakened outside the U.S., leading to underperformance in international developed markets compared with domestic benchmarks. Currency fluctuations and uneven regional growth trends further added noise, as strength in the U.S. dollar and slower economic momentum abroad temporarily weighed on translated returns from overseas holdings.
Performance was periodically limited when equity leadership became narrowly concentrated in a handful of mega-cap growth and AI-related U.S. stocks, which reduced relative breadth in global developed markets. Shifts in interest rate expectations also influenced sentiment, as higher discount-rate environments tend to compress valuations for longer-duration growth equities that feature prominently in the strategy. At times, global risk sentiment weakened outside the U.S., leading to underperformance in international developed markets compared with domestic benchmarks. Currency fluctuations and uneven regional growth trends further added noise, as strength in the U.S. dollar and slower economic momentum abroad temporarily weighed on translated returns from overseas holdings.
The Fund’s performance information included above is compared with a regulatory required index that represents an overall securities market (Broad-Based Benchmark) and may include one or more indexes that more closely align to the Fund’s investment strategy (Strategy Benchmark(s)) or provide a secondary point of comparison.
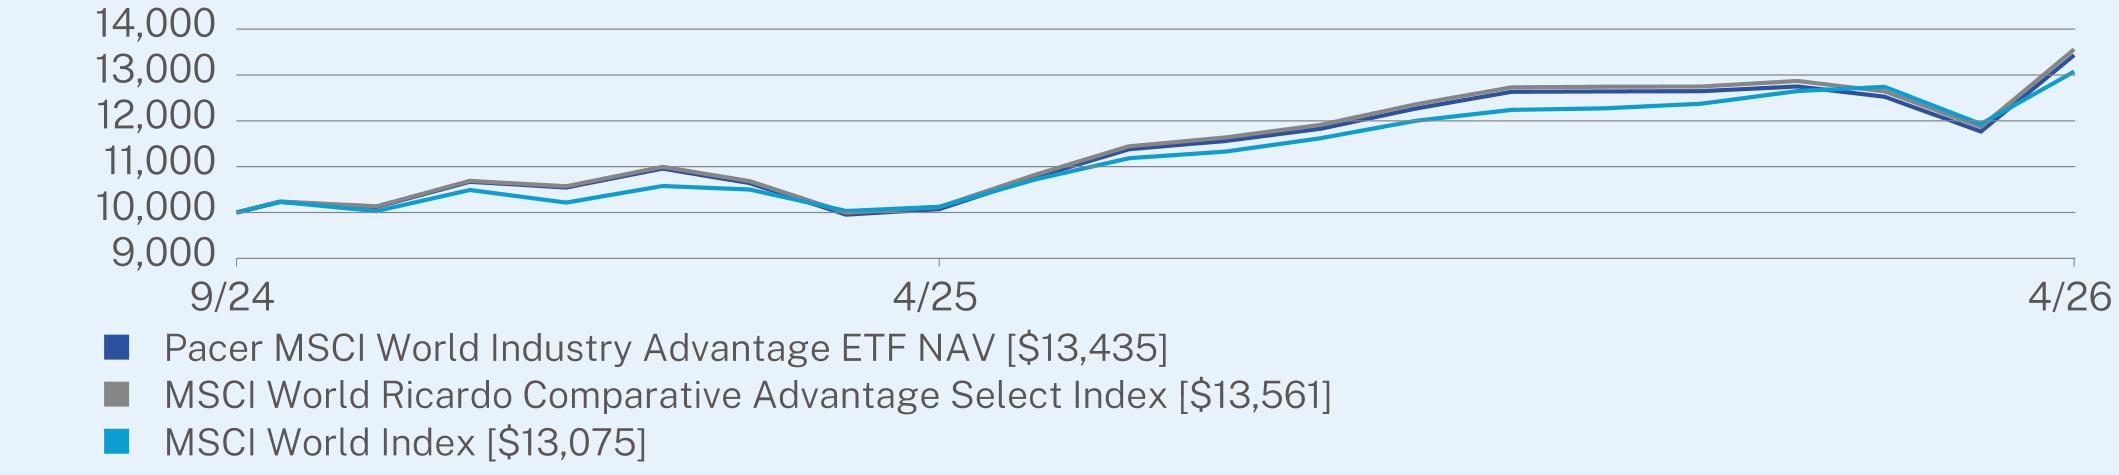
ANNUAL AVERAGE TOTAL RETURN (%)
|
|
1 Year
|
Since Inception
(09/16/2024) |
|
Pacer MSCI World Industry Advantage ETF NAV
|
33.38
|
20.00
|
|
MSCI World Ricardo Comparative Advantage Select Index
|
34.01
|
20.70
|
|
MSCI World Index
|
29.16
|
18.01
|
Visit https://www.paceretfs.com/ for more recent performance information.
KEY FUND STATISTICS (as of April 30, 2026)
|
Net Assets
|
$1,068,769
|
Portfolio Turnover
|
32%
|
|
|
Number of Holdings
|
371
|
30-Day SEC Yield
|
0.32%
|
|
|
Net Advisory Fee
|
$6,271
|
30-Day SEC Yield Unsubsidized
|
0.32%
|
WHAT DID THE FUND INVEST IN? (as of April 30, 2026)*
|
Top Holdings
|
(%)
|
|
Amazon.com, Inc.
|
6.1%
|
|
Alphabet, Inc. - Class A
|
5.4%
|
|
NVIDIA Corp.
|
5.0%
|
|
Apple, Inc.
|
4.7%
|
|
Microsoft Corp.
|
4.7%
|
|
Broadcom, Inc.
|
4.5%
|
|
Alphabet, Inc. - Class C
|
4.5%
|
|
Mount Vernon Liquid Assets Portfolio, LLC
|
3.2%
|
|
Meta Platforms, Inc. - Class A
|
3.2%
|
|
Berkshire Hathaway, Inc. - Class B
|
1.6%
|
|
Top Sectors
|
(%)
|
|
Information Technology
|
38.5%
|
|
Communication Services
|
15.9%
|
|
Financials
|
12.9%
|
|
Consumer Discretionary
|
12.7%
|
|
Health Care
|
6.3%
|
|
Consumer Staples
|
4.1%
|
|
Industrials
|
3.3%
|
|
Real Estate
|
3.2%
|
|
Energy
|
1.4%
|
|
Cash & Other
|
1.7%
|
WHAT WERE THE FUND COSTS FOR THE PAST YEAR? (based on a hypothetical $10,000 investment)
|
Fund Name
|
Costs of a $10,000 investment
|
Costs paid as a percentage of a $10,000 investment
|
|
Pacer Nasdaq 100 Top 50 Cash Cows Growth Leaders ETF
|
$57
|
0.49%
|
WHAT FACTORS INFLUENCED PERFORMANCE
Between May 1, 2025 and April 30, 2026, the Pacer Nasdaq 100 Top 50 Cash Cows Growth Leaders ETF (QQQG) returned 32.4%, while its underlying index, the Pacer Nasdaq 100 Top 50 Cash Cows Growth Leaders Index, returned 32.8% over the same period. This represents an underperformance of 0.4 percentage points for the Fund. For the one-year period ended April 30, 2026, QQQG’s Broad-Based Benchmark, the S&P 500 Index, returned 31.1%, while its Strategy Benchmark, the NASDAQ-100 Index, returned 41.2%.
What contributed to performance
The Fund was supported by strong participation in large-cap Nasdaq growth leaders with consistently high free cash flow, particularly across semiconductors, cloud infrastructure, and select platform technology names. During the period, investor sentiment toward AI-linked capital spending and digital infrastructure expansion remained a key tailwind, helping several core holdings benefit from durable revenue growth and margin strength. When equity markets broadened beyond a narrow leadership group, the strategy also captured upside from high-quality tech and communications companies with strong cash generation profiles. Periodic risk-on phases reinforced demand for profitable growth, which aligned well with the fund’s “cash cow growth” focus.
The Fund was supported by strong participation in large-cap Nasdaq growth leaders with consistently high free cash flow, particularly across semiconductors, cloud infrastructure, and select platform technology names. During the period, investor sentiment toward AI-linked capital spending and digital infrastructure expansion remained a key tailwind, helping several core holdings benefit from durable revenue growth and margin strength. When equity markets broadened beyond a narrow leadership group, the strategy also captured upside from high-quality tech and communications companies with strong cash generation profiles. Periodic risk-on phases reinforced demand for profitable growth, which aligned well with the fund’s “cash cow growth” focus.
What detracted from performance
Performance was periodically constrained when market leadership became heavily concentrated in a small group of mega-cap AI and momentum-driven stocks, limiting the benefit of the Fund’s more diversified selection of Nasdaq growth names. Shifts in interest rate expectations also influenced sentiment, as higher discount rates tend to compress valuations for long-duration growth equities despite solid fundamentals. At times, mixed performance among semiconductor and high-multiple software holdings created intra-sector drag even within otherwise strong technology cycles. Additionally, rapid rotations between risk-on and risk-off environments produced short bursts of volatility, which temporarily outweighed the strategy’s underlying cash flow stability.
Performance was periodically constrained when market leadership became heavily concentrated in a small group of mega-cap AI and momentum-driven stocks, limiting the benefit of the Fund’s more diversified selection of Nasdaq growth names. Shifts in interest rate expectations also influenced sentiment, as higher discount rates tend to compress valuations for long-duration growth equities despite solid fundamentals. At times, mixed performance among semiconductor and high-multiple software holdings created intra-sector drag even within otherwise strong technology cycles. Additionally, rapid rotations between risk-on and risk-off environments produced short bursts of volatility, which temporarily outweighed the strategy’s underlying cash flow stability.
The Fund’s performance information included above is compared with a regulatory required index that represents an overall securities market (Broad-Based Benchmark) and may include one or more indexes that more closely align to the Fund’s investment strategy (Strategy Benchmark(s)) or provide a secondary point of comparison.
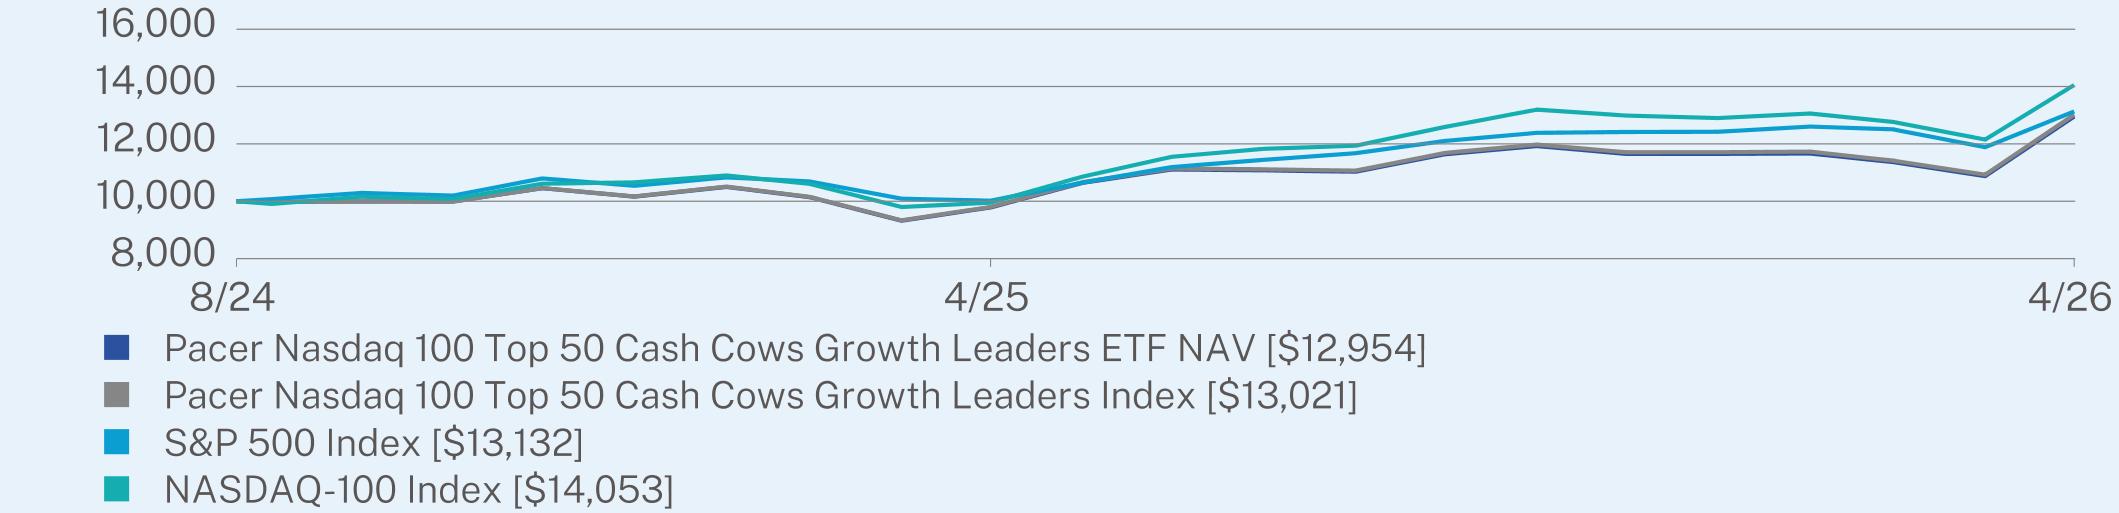
ANNUAL AVERAGE TOTAL RETURN (%)
|
|
1 Year
|
Since Inception
(08/19/2024) |
|
Pacer Nasdaq 100 Top 50 Cash Cows Growth Leaders ETF NAV
|
32.40
|
16.49
|
|
Pacer Nasdaq 100 Top 50 Cash Cows Growth Leaders Index
|
32.83
|
16.84
|
|
S&P 500 Index
|
31.05
|
17.43
|
|
NASDAQ-100 Index
|
41.22
|
22.22
|
Visit https://www.paceretfs.com/ for more recent performance information.
KEY FUND STATISTICS (as of April 30, 2026)
|
Net Assets
|
$11,286,620
|
Portfolio Turnover
|
77%
|
|
|
Number of Holdings
|
51
|
30-Day SEC Yield
|
0.12%
|
|
|
Net Advisory Fee
|
$37,528
|
30-Day SEC Yield Unsubsidized
|
0.12%
|
WHAT DID THE FUND INVEST IN? (as of April 30, 2026)*
|
Top Holdings
|
(%)
|
|
Seagate Technology Holdings PLC
|
6.9%
|
|
Western Digital Corp.
|
6.8%
|
|
Lam Research Corp.
|
4.9%
|
|
Applied Materials, Inc.
|
4.7%
|
|
Alphabet, Inc. - Class A
|
4.5%
|
|
Monolithic Power Systems, Inc.
|
4.1%
|
|
Advanced Micro Devices, Inc.
|
4.0%
|
|
KLA Corp.
|
4.0%
|
|
Analog Devices, Inc.
|
3.1%
|
|
Marvell Technology, Inc.
|
2.7%
|
|
Top Sectors
|
(%)
|
|
Information Technology
|
68.4%
|
|
Health Care
|
11.0%
|
|
Communication Services
|
9.0%
|
|
Industrials
|
3.7%
|
|
Consumer Discretionary
|
3.6%
|
|
Consumer Staples
|
2.3%
|
|
Energy
|
1.9%
|
|
Cash & Other
|
0.1%
|
WHAT WERE THE FUND COSTS FOR THE PAST YEAR? (based on a hypothetical $10,000 investment)
|
Fund Name
|
Costs of a $10,000 investment
|
Costs paid as a percentage of a $10,000 investment
|
|
Pacer Nasdaq International Patent Leaders ETF
|
$83
|
0.65%
|
WHAT FACTORS INFLUENCED PERFORMANCE
Between May 1, 2025 and April 30, 2026, the Pacer Nasdaq International Patent Leaders ETF (PATN) returned 54.4%, while its underlying index, the Nasdaq International Patent Leaders Index, returned 55.5% over the same period. This represents an underperformance of 1.1 percentage points for the Fund. For the one-year period ended April 30, 2026, PATN’s Broad-Based Benchmark, the MSCI World Index returned 32.2%.
What contributed to performance
The Fund benefited from exposure to international innovation leaders identified through patent-based metrics, which helped concentrate holdings in globally competitive companies with strong R&D pipelines and durable intellectual property advantages. During the period, investor sentiment toward innovation and growth outside the U.S. improved at various points, supporting multinational technology and healthcare leaders across Asia and Europe. Key semiconductor and digital ecosystem names also contributed meaningfully as demand for advanced chips, AI infrastructure, and industrial automation remained strong globally. The strategy’s tilt toward high-quality, patent-rich companies helped it participate in both cyclical rebounds and secular innovation-driven rallies.
The Fund benefited from exposure to international innovation leaders identified through patent-based metrics, which helped concentrate holdings in globally competitive companies with strong R&D pipelines and durable intellectual property advantages. During the period, investor sentiment toward innovation and growth outside the U.S. improved at various points, supporting multinational technology and healthcare leaders across Asia and Europe. Key semiconductor and digital ecosystem names also contributed meaningfully as demand for advanced chips, AI infrastructure, and industrial automation remained strong globally. The strategy’s tilt toward high-quality, patent-rich companies helped it participate in both cyclical rebounds and secular innovation-driven rallies.
What detracted from performance
Performance was periodically constrained when global equity leadership narrowed toward U.S.-centric mega-cap AI and technology stocks, reducing relative demand for international innovation themes. Currency fluctuations across Asian and European exposures created intermittent headwinds for USD-based returns, particularly when the dollar strengthened. At times, uneven global growth—especially in parts of Europe and China—tempered sentiment toward export-heavy and cyclical industrial holdings despite solid company-level fundamentals. Additionally, shifts in interest-rate expectations influenced valuations for longer-duration growth equities, leading to periodic multiple compression even as underlying patent-driven innovation trends remained intact.
Performance was periodically constrained when global equity leadership narrowed toward U.S.-centric mega-cap AI and technology stocks, reducing relative demand for international innovation themes. Currency fluctuations across Asian and European exposures created intermittent headwinds for USD-based returns, particularly when the dollar strengthened. At times, uneven global growth—especially in parts of Europe and China—tempered sentiment toward export-heavy and cyclical industrial holdings despite solid company-level fundamentals. Additionally, shifts in interest-rate expectations influenced valuations for longer-duration growth equities, leading to periodic multiple compression even as underlying patent-driven innovation trends remained intact.
The Fund’s performance information included above is compared with a regulatory required index that represents an overall securities market (Broad-Based Benchmark) and may include one or more indexes that more closely align to the Fund’s investment strategy (Strategy Benchmark(s)) or provide a secondary point of comparison.
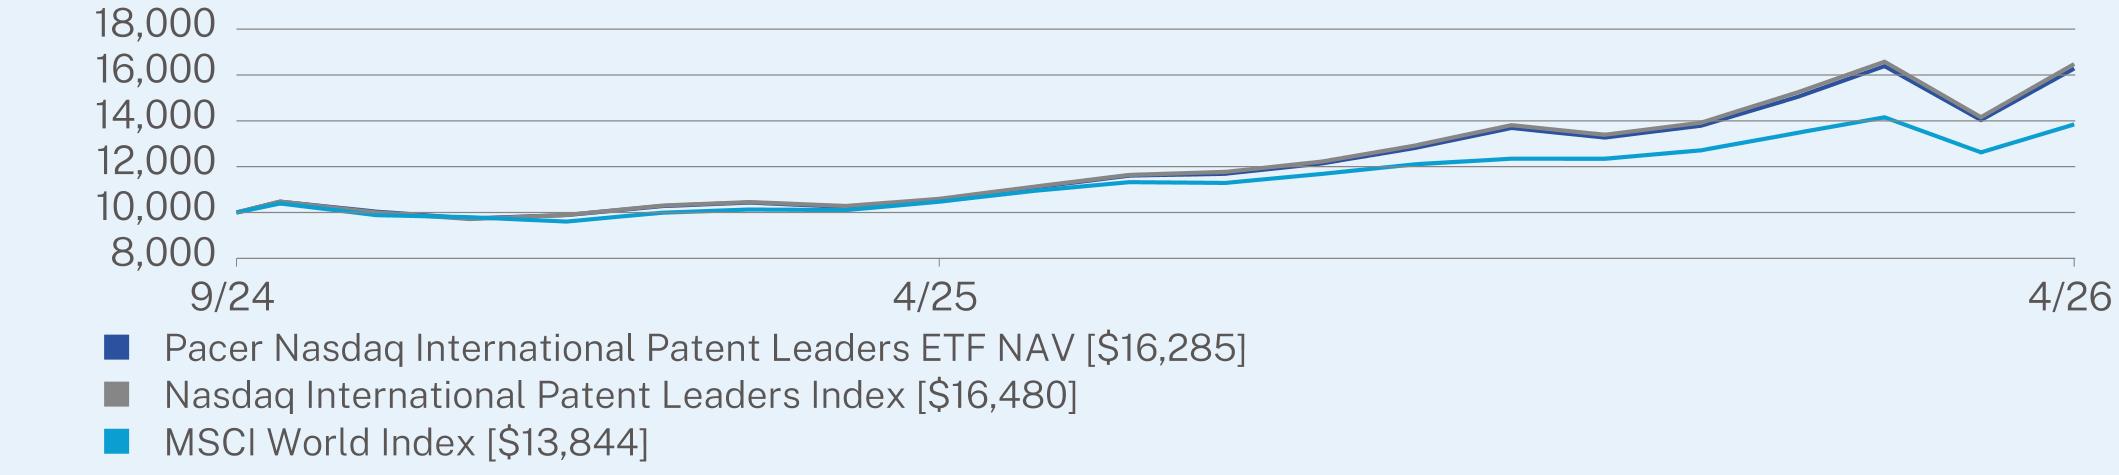
ANNUAL AVERAGE TOTAL RETURN (%)
|
|
1 Year
|
Since Inception
(09/16/2024) |
|
Pacer Nasdaq International Patent Leaders ETF NAV
|
54.43
|
35.14
|
|
Nasdaq International Patent Leaders Index
|
55.52
|
36.14
|
|
MSCI World Index
|
32.20
|
22.25
|
Visit https://www.paceretfs.com/ for more recent performance information.
KEY FUND STATISTICS (as of April 30, 2026)
|
Net Assets
|
$78,475,269
|
Portfolio Turnover
|
7%
|
|
|
Number of Holdings
|
100
|
30-Day SEC Yield
|
1.05%
|
|
|
Net Advisory Fee
|
$172,436
|
30-Day SEC Yield Unsubsidized
|
1.05%
|
WHAT DID THE FUND INVEST IN? (as of April 30, 2026)*
|
Top Holdings
|
(%)
|
|
Taiwan Semiconductor Manufacturing Co. Ltd.
|
12.0%
|
|
Samsung Electronics Co. Ltd.
|
7.0%
|
|
SK Hynix, Inc.
|
5.4%
|
|
ASML Holding NV
|
4.5%
|
|
Tencent Holdings Ltd.
|
4.0%
|
|
Novartis AG
|
2.7%
|
|
Toyota Motor Corp.
|
2.5%
|
|
AstraZeneca PLC
|
2.5%
|
|
Roche Holding AG
|
2.4%
|
|
Nestle SA
|
2.2%
|
|
Top Sectors
|
(%)
|
|
Information Technology
|
45.4%
|
|
Industrials
|
15.2%
|
|
Health Care
|
10.8%
|
|
Consumer Discretionary
|
9.4%
|
|
Communication Services
|
6.7%
|
|
Consumer Staples
|
5.8%
|
|
Materials
|
3.1%
|
|
Energy
|
2.6%
|
|
Financials
|
0.6%
|
|
Cash & Other
|
0.4%
|
|
Top Countries
|
(%)
|
|
Japan
|
23.7%
|
|
Taiwan
|
16.3%
|
|
South Korea
|
15.6%
|
|
Switzerland
|
9.8%
|
|
France
|
9.3%
|
|
Germany
|
7.0%
|
|
China
|
6.6%
|
|
Netherlands
|
6.2%
|
|
United Kingdom
|
3.7%
|
|
Cash & Other
|
1.8%
|
WHAT WERE THE FUND COSTS FOR THE PAST YEAR? (based on a hypothetical $10,000 investment)
|
Fund Name
|
Costs of a $10,000 investment
|
Costs paid as a percentage of a $10,000 investment
|
|
Pacer Trendpilot® 100 ETF
|
$72
|
0.65%
|
WHAT FACTORS INFLUENCED PERFORMANCE
Between May 1, 2025 and April 30, 2026, the Pacer Trendpilot® 100 ETF (PTNQ) returned 20.7%, while its underlying index, the Pacer NASDAQ-100 Trendpilot® Index, returned 21.5% over the same period. This represents an underperformance of 0.8 percentage points for the Fund. For the one-year period ended April 30, 2026, PTNQ’s Broad-Based Benchmark, the S&P 500 Index, returned 31.1%, while its Strategy Benchmark, the NASDAQ-100 Index, returned 41.2%.
What contributed to performance
The Pacer Trendpilot® 100 ETF benefited from its rules-based ability to remain fully or partially invested in the NASDAQ-100 during sustained uptrends, allowing it to capture gains from dominant large-cap technology and communications leaders. When equity markets were in strong risk-on phases—particularly those led by AI-related enthusiasm and resilient corporate earnings—the strategy’s full equity exposure helped drive returns alongside major index constituents. Periods of reduced volatility also supported the model’s ability to stay invested rather than rotate defensively, which enhanced participation in broad tech-led rallies. Overall, the Fund’s systematic approach allowed it to stay aligned with prevailing market momentum when conditions were favorable.
The Pacer Trendpilot® 100 ETF benefited from its rules-based ability to remain fully or partially invested in the NASDAQ-100 during sustained uptrends, allowing it to capture gains from dominant large-cap technology and communications leaders. When equity markets were in strong risk-on phases—particularly those led by AI-related enthusiasm and resilient corporate earnings—the strategy’s full equity exposure helped drive returns alongside major index constituents. Periods of reduced volatility also supported the model’s ability to stay invested rather than rotate defensively, which enhanced participation in broad tech-led rallies. Overall, the Fund’s systematic approach allowed it to stay aligned with prevailing market momentum when conditions were favorable.
What detracted from performance
Performance was periodically limited when market leadership became narrow and highly concentrated in a few mega-cap growth stocks, where timing and weighting differences could reduce relative capture versus a static NASDAQ-100 exposure. During choppy or sentiment-driven transitions, the strategy’s trend signal could lag sudden reversals, leading to periods of under- or over-exposure compared with the broader index. Shifts in interest rate expectations also created headwinds for growth equities, as higher discount rates pressured valuations even when earnings remained strong. In sideways or range-bound markets, the model’s rotation between equity and defensive positioning could also reduce upside participation, particularly when trends lacked persistence.
Performance was periodically limited when market leadership became narrow and highly concentrated in a few mega-cap growth stocks, where timing and weighting differences could reduce relative capture versus a static NASDAQ-100 exposure. During choppy or sentiment-driven transitions, the strategy’s trend signal could lag sudden reversals, leading to periods of under- or over-exposure compared with the broader index. Shifts in interest rate expectations also created headwinds for growth equities, as higher discount rates pressured valuations even when earnings remained strong. In sideways or range-bound markets, the model’s rotation between equity and defensive positioning could also reduce upside participation, particularly when trends lacked persistence.
The Fund’s performance information included above is compared with a regulatory required index that represents an overall securities market (Broad-Based Benchmark) and may include one or more indexes that more closely align to the Fund’s investment strategy (Strategy Benchmark(s)) or provide a secondary point of comparison.
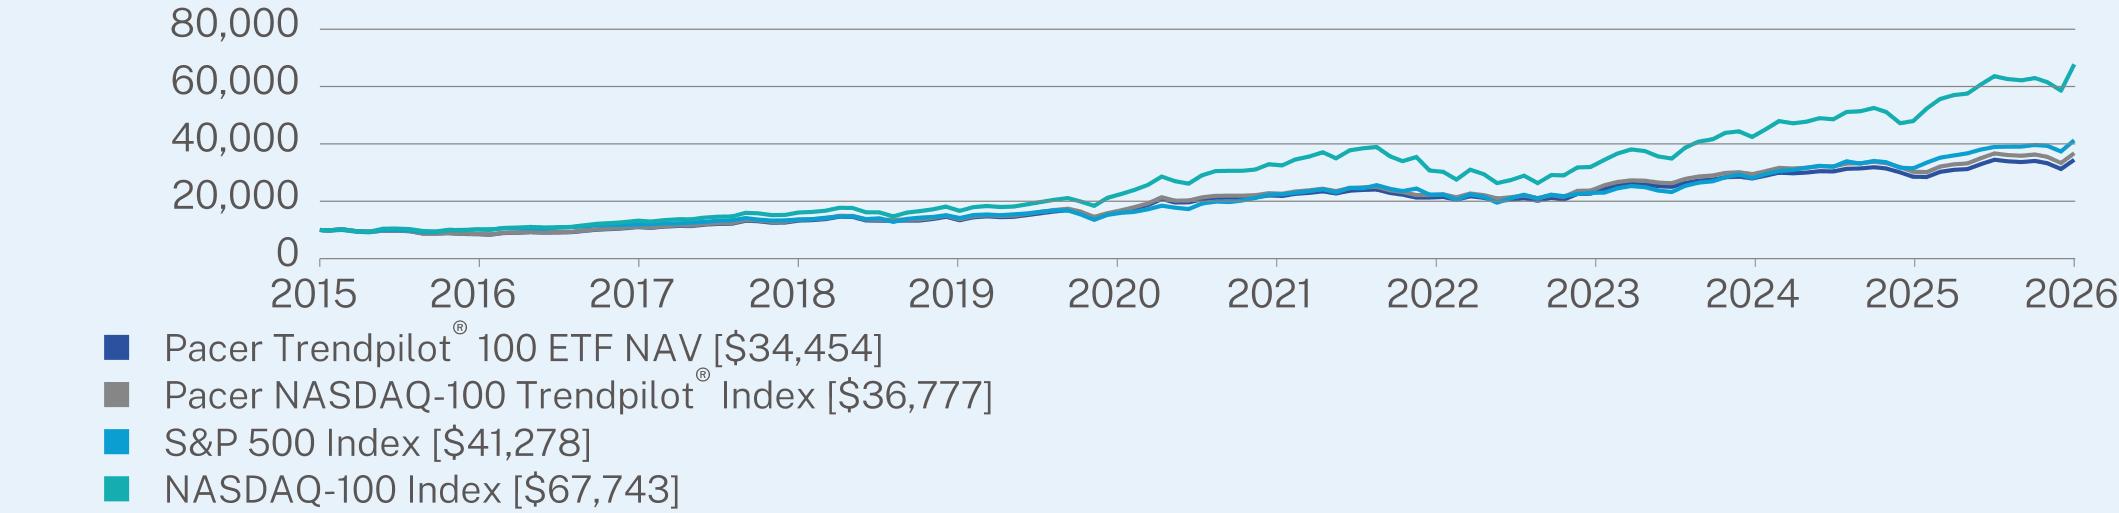
ANNUAL AVERAGE TOTAL RETURN (%)
|
|
1 Year
|
5 Year
|
10 Year
|
|
Pacer Trendpilot® 100 ETF NAV
|
20.70
|
9.37
|
14.89
|
|
Pacer NASDAQ-100 Trendpilot® Index
|
21.51
|
10.04
|
15.58
|
|
S&P 500 Index
|
31.05
|
13.14
|
15.26
|
|
NASDAQ-100 Index
|
41.22
|
15.54
|
21.36
|
Visit https://www.paceretfs.com/ for more recent performance information.
KEY FUND STATISTICS (as of April 30, 2026)
|
Net Assets
|
$1,243,967,415
|
Portfolio Turnover
|
66%
|
|
|
Number of Holdings
|
102
|
30-Day SEC Yield
|
0.64%
|
|
|
Net Advisory Fee
|
$8,135,916
|
30-Day SEC Yield Unsubsidized
|
0.64%
|
WHAT DID THE FUND INVEST IN? (as of April 30, 2026)*
|
Top 10 Issuers
|
(%)
|
|
NVIDIA Corp.
|
8.5%
|
|
Alphabet, Inc.
|
7.6%
|
|
Apple, Inc.
|
7.0%
|
|
Microsoft Corp.
|
5.3%
|
|
Amazon.com, Inc.
|
5.0%
|
|
Broadcom, Inc.
|
3.5%
|
|
Tesla Motors, Inc.
|
3.4%
|
|
Meta Platforms, Inc.
|
3.2%
|
|
Walmart, Inc.
|
3.1%
|
|
Micron Technology, Inc.
|
2.8%
|
|
Top Sectors
|
(%)
|
|
Information Technology
|
53.7%
|
|
Communication Services
|
15.1%
|
|
Consumer Discretionary
|
12.2%
|
|
Consumer Staples
|
7.7%
|
|
Health Care
|
4.2%
|
|
Industrials
|
3.7%
|
|
Utilities
|
1.4%
|
|
Materials
|
1.1%
|
|
Energy
|
0.6%
|
|
Cash & Other
|
0.3%
|
WHAT WERE THE FUND COSTS FOR THE PAST YEAR? (based on a hypothetical $10,000 investment)
|
Fund Name
|
Costs of a $10,000 investment
|
Costs paid as a percentage of a $10,000 investment
|
|
Pacer Trendpilot® European Index ETF
|
$72
|
0.65%
|
WHAT FACTORS INFLUENCED PERFORMANCE
Between May 1, 2025 and April 30, 2026, the Pacer Trendpilot® European Index ETF (PTEU) returned 22.7%, while its underlying index, the Pacer Trendpilot® European Index, returned 24.0% over the same period. This represents an underperformance of 1.3 percentage points for the Fund. For the one-year period ended April 30, 2026, PTEU’s Broad-Based Benchmark, the MSCI World Index returned 29.2%, while its Strategy Benchmark, the FTSE Eurozone Index returned 24.0%
What contributed to performance
The Pacer Trendpilot® European Index ETF benefited during periods when European equities were in sustained uptrends, allowing the strategy to maintain full or partial exposure to the FTSE Eurozone market rather than shifting into cash. When global risk appetite improved, especially during broader equity rallies led by easing inflation pressures and improving earnings expectations abroad, European large- and mid-cap stocks contributed positively to returns. The rules-based trend model helped the fund stay invested during extended bullish stretches, enabling participation in cyclical rebounds across financials, industrials, and select multinational exporters. A more stable tone in global markets at times also supported investor willingness to allocate to developed Europe.
The Pacer Trendpilot® European Index ETF benefited during periods when European equities were in sustained uptrends, allowing the strategy to maintain full or partial exposure to the FTSE Eurozone market rather than shifting into cash. When global risk appetite improved, especially during broader equity rallies led by easing inflation pressures and improving earnings expectations abroad, European large- and mid-cap stocks contributed positively to returns. The rules-based trend model helped the fund stay invested during extended bullish stretches, enabling participation in cyclical rebounds across financials, industrials, and select multinational exporters. A more stable tone in global markets at times also supported investor willingness to allocate to developed Europe.
What detracted from performance
Performance was periodically constrained when European equities lagged U.S. growth leadership, particularly during strong rallies in AI-driven technology stocks that dominated global index returns. The strategy’s trend-following design also introduced lag during turning points, where exposure adjustments occurred after market moves had already reversed, reducing responsiveness in choppy environments. Shifts in investor sentiment tied to interest rate uncertainty and uneven regional growth in Europe created intermittent volatility, which weighed on returns even when the fund remained partially invested. In addition, currency fluctuations—especially euro weakness versus the U.S. dollar—occasionally reduced translated gains for U.S.-based investors.
Performance was periodically constrained when European equities lagged U.S. growth leadership, particularly during strong rallies in AI-driven technology stocks that dominated global index returns. The strategy’s trend-following design also introduced lag during turning points, where exposure adjustments occurred after market moves had already reversed, reducing responsiveness in choppy environments. Shifts in investor sentiment tied to interest rate uncertainty and uneven regional growth in Europe created intermittent volatility, which weighed on returns even when the fund remained partially invested. In addition, currency fluctuations—especially euro weakness versus the U.S. dollar—occasionally reduced translated gains for U.S.-based investors.
The Fund’s performance information included above is compared with a regulatory required index that represents an overall securities market (Broad-Based Benchmark) and may include one or more indexes that more closely align to the Fund’s investment strategy (Strategy Benchmark(s)) or provide a secondary point of comparison.
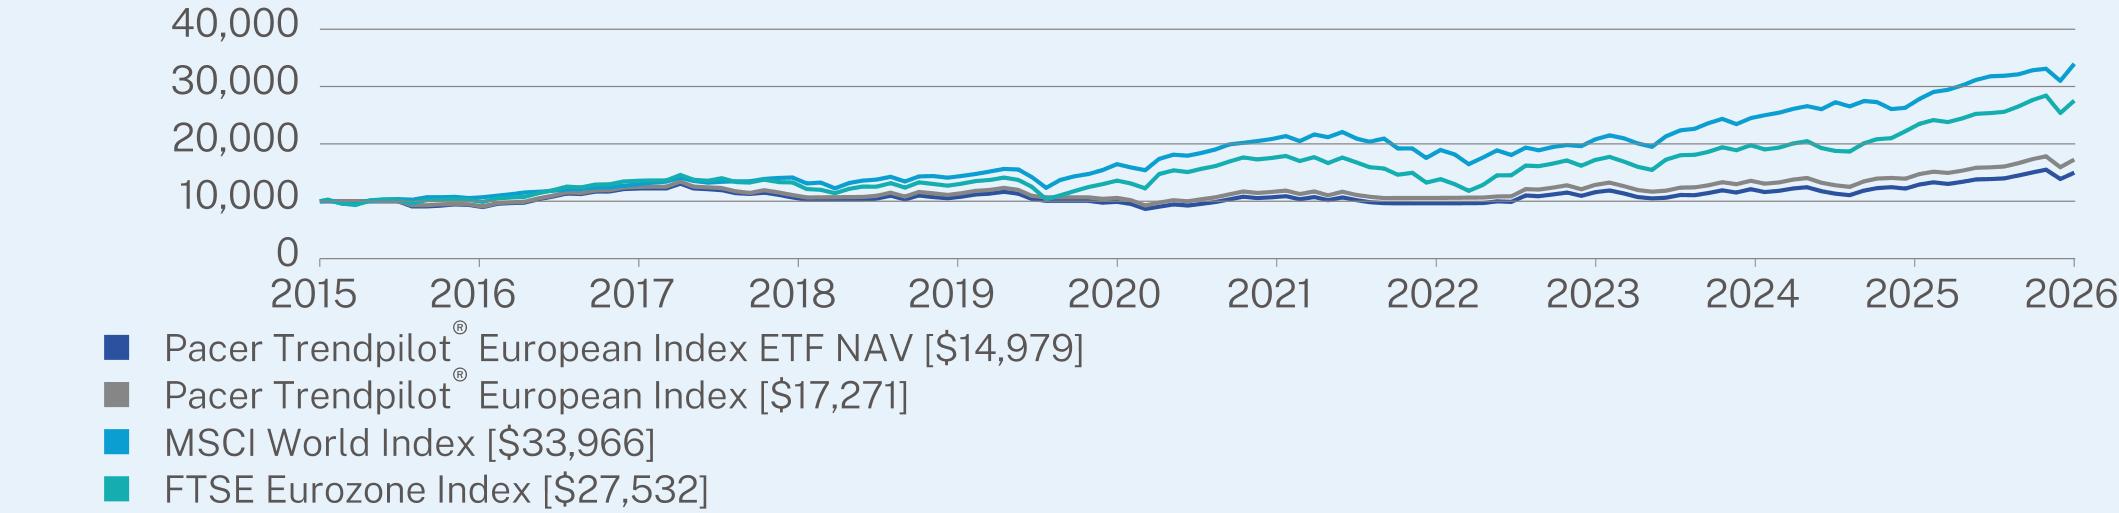
ANNUAL AVERAGE TOTAL RETURN (%)
|
|
1 Year
|
5 Year
|
10 Year
|
|
Pacer Trendpilot® European Index ETF NAV
|
22.73
|
7.74
|
4.14
|
|
Pacer Trendpilot® European Index
|
24.03
|
9.07
|
5.61
|
|
MSCI World Index
|
29.16
|
11.29
|
12.65
|
|
FTSE Eurozone Index
|
24.03
|
10.25
|
10.36
|
Visit https://www.paceretfs.com/ for more recent performance information.
KEY FUND STATISTICS (as of April 30, 2026)
|
Net Assets
|
$35,085,585
|
Portfolio Turnover
|
10%
|
|
|
Number of Holdings
|
289
|
30-Day SEC Yield
|
2.31%
|
|
|
Net Advisory Fee
|
$232,875
|
30-Day SEC Yield Unsubsidized
|
2.31%
|
WHAT DID THE FUND INVEST IN? (as of April 30, 2026)*
|
Top 10 Issuers
|
(%)
|
|
ASML Holding NV
|
7.3%
|
|
Siemens AG
|
2.9%
|
|
Banco Santander SA
|
2.3%
|
|
SAP SE
|
2.3%
|
|
Allianz SE
|
2.3%
|
|
Schneider Electric SE
|
2.2%
|
|
TotalEnergies SE
|
2.2%
|
|
Siemens Energy AG
|
2.1%
|
|
Iberdrola SA
|
2.0%
|
|
LVMH Moet Hennessy Louis Vuitton SE
|
1.8%
|
|
Top Sectors
|
(%)
|
|
Financials
|
25.2%
|
|
Industrials
|
20.3%
|
|
Information Technology
|
13.5%
|
|
Consumer Discretionary
|
8.5%
|
|
Utilities
|
7.4%
|
|
Health Care
|
5.6%
|
|
Consumer Staples
|
5.1%
|
|
Materials
|
4.2%
|
|
Energy
|
4.1%
|
|
Cash & Other
|
6.1%
|
|
Top Countries
|
(%)
|
|
France
|
25.6%
|
|
Germany
|
25.2%
|
|
Netherlands
|
16.8%
|
|
Spain
|
10.5%
|
|
Italy
|
9.6%
|
|
Finland
|
3.6%
|
|
Belgium
|
2.7%
|
|
Ireland
|
1.0%
|
|
Austria
|
1.0%
|
|
Cash & Other
|
4.0%
|
WHAT WERE THE FUND COSTS FOR THE PAST YEAR? (based on a hypothetical $10,000 investment)
|
Fund Name
|
Costs of a $10,000 investment
|
Costs paid as a percentage of a $10,000 investment
|
|
Pacer Trendpilot® Fund of Funds ETF
|
$16
|
0.15%
|
WHAT FACTORS INFLUENCED PERFORMANCE
Between May 1, 2025 and April 30, 2026, the Pacer Trendpilot® Fund of Funds ETF (TRND) returned 16.6%, while its underlying index, the Pacer Trendpilot® Fund of Funds Index, returned 17.3% over the same period. This represents an underperformance of 0.7 percentage points for the Fund. For the one-year period ended April 30, 2026, TRND’s Broad-Based Benchmark, the S&P Global 1200 Index returned 32.5%, while its secondary index, FTSE All-World Total Return Index returned 31.4%
What contributed to performance
The Pacer Trendpilot® Fund of Funds ETF benefited most during persistent, clearly defined equity uptrends, when its underlying Trendpilot®strategies remained fully invested in global and U.S. equities rather than shifting into defensive allocations. In those environments, exposure to large-cap growth leaders, cyclical mid-cap segments, and international equities allowed the fund to participate broadly in market advances rather than relying on a single region or factor. Periods of strong risk appetite—especially when earnings growth and macro conditions aligned—helped the strategy stay engaged with momentum across multiple equity sleeves. The diversified structure also meant it could capture different pockets of strength across domestic and international markets when trends were synchronized.
The Pacer Trendpilot® Fund of Funds ETF benefited most during persistent, clearly defined equity uptrends, when its underlying Trendpilot®strategies remained fully invested in global and U.S. equities rather than shifting into defensive allocations. In those environments, exposure to large-cap growth leaders, cyclical mid-cap segments, and international equities allowed the fund to participate broadly in market advances rather than relying on a single region or factor. Periods of strong risk appetite—especially when earnings growth and macro conditions aligned—helped the strategy stay engaged with momentum across multiple equity sleeves. The diversified structure also meant it could capture different pockets of strength across domestic and international markets when trends were synchronized.
What detracted from performance
Performance was most challenged during directionless or rapidly reversing markets, where trend signals struggled to remain aligned with shifting conditions. In these environments, the strategy’s rotation between equity exposure and defensive positioning in Treasury bills sometimes resulted in missed upside during early-stage rallies or partial exposure during extended advances. Market leadership that became heavily concentrated in a narrow set of mega-cap U.S. technology names also reduced relative capture, since the fund spreads exposure across multiple equity segments rather than concentrating in a single dominant theme. Additionally, abrupt changes in sentiment tied to interest rate expectations created whipsaw effects, where exposures adjusted after short-lived moves had already reversed, dampening consistency of returns.
Performance was most challenged during directionless or rapidly reversing markets, where trend signals struggled to remain aligned with shifting conditions. In these environments, the strategy’s rotation between equity exposure and defensive positioning in Treasury bills sometimes resulted in missed upside during early-stage rallies or partial exposure during extended advances. Market leadership that became heavily concentrated in a narrow set of mega-cap U.S. technology names also reduced relative capture, since the fund spreads exposure across multiple equity segments rather than concentrating in a single dominant theme. Additionally, abrupt changes in sentiment tied to interest rate expectations created whipsaw effects, where exposures adjusted after short-lived moves had already reversed, dampening consistency of returns.
The Fund’s performance information included above is compared with a regulatory required index that represents an overall securities market (Broad-Based Benchmark) and may include one or more indexes that more closely align to the Fund’s investment strategy (Strategy Benchmark(s)) or provide a secondary point of comparison.
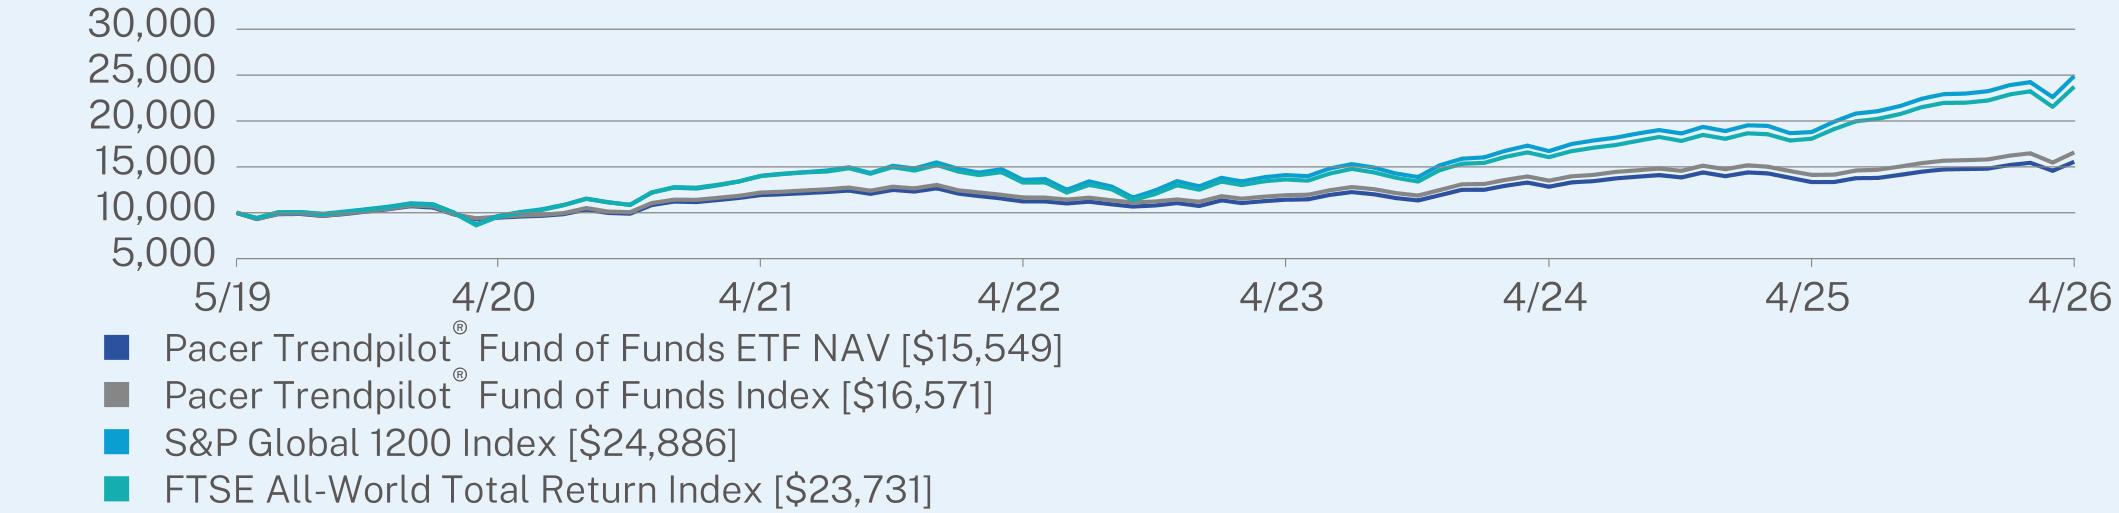
ANNUAL AVERAGE TOTAL RETURN (%)
|
|
1 Year
|
5 Year
|
Since Inception
(05/03/2019) |
|
Pacer Trendpilot® Fund of Funds ETF NAV
|
16.55
|
5.45
|
6.51
|
|
Pacer Trendpilot® Fund of Funds Index
|
17.33
|
6.33
|
7.49
|
|
S&P Global 1200 Index
|
32.45
|
12.17
|
13.92
|
|
FTSE All-World Total Return Index
|
31.40
|
11.16
|
13.15
|
Visit https://www.paceretfs.com/ for more recent performance information.
KEY FUND STATISTICS (as of April 30, 2026)
|
Net Assets
|
$56,452,710
|
Portfolio Turnover
|
6%
|
|
|
Number of Holdings
|
5
|
30-Day SEC Yield
|
2.10%
|
|
|
Net Advisory Fee
|
$84,233
|
30-Day SEC Yield Unsubsidized
|
2.10%
|
WHAT DID THE FUND INVEST IN? (as of April 30, 2026)*
|
Security Type
|
(%)
|
|
Affiliated Exchange Traded Funds
|
100.0%
|
|
Cash & Other
|
0.0%
|
|
Top Holdings
|
(%)
|
|
Pacer Trendpilot® US Mid Cap ETF
|
20.9%
|
|
Pacer Trendpilot® US Bond ETF
|
20.9%
|
|
Pacer Trendpilot® US Large Cap ETF
|
19.6%
|
|
Pacer Trendpilot® 100 ETF
|
19.5%
|
|
Pacer Trendpilot® International ETF
|
19.0%
|
|
Mount Vernon Liquid Assets Portfolio, LLC
|
5.3%
|
WHAT WERE THE FUND COSTS FOR THE PAST YEAR? (based on a hypothetical $10,000 investment)
|
Fund Name
|
Costs of a $10,000 investment
|
Costs paid as a percentage of a $10,000 investment
|
|
Pacer Trendpilot® International ETF
|
$75
|
0.65%
|
WHAT FACTORS INFLUENCED PERFORMANCE
Between May 1, 2025 and April 30, 2026, the Pacer Trendpilot® International ETF (PTIN) returned 30.3%, while its underlying index, the Pacer Trendpilot® International Index, returned 31.0% over the same period. This represents an underperformance of 0.7 percentage points for the Fund. For the one-year period ended April 30, 2026, PTIN’s Broad-Based Benchmark, the MSCI World Index returned 29.2%, while its secondary index, the S&P Developed ex-U.S. Large Cap Index returned 33.5%.
What contributed to performance
The Pacer Trendpilot® International ETF benefited most during sustained uptrends in developed non-U.S. equities, when its rules-based system maintained meaningful exposure to international stocks instead of shifting into Treasury bills. This allowed the Fund to participate in rallies across European and Asian developed markets, particularly in globally important sectors such as semiconductors, healthcare, and financials. Periods of improving global risk appetite and stronger-than-expected corporate earnings abroad helped support broad participation across its diversified holdings. When international equities moved in a steady direction rather than a choppy one, the strategy’s momentum framework generally kept it aligned with prevailing market direction, enhancing return capture.
The Pacer Trendpilot® International ETF benefited most during sustained uptrends in developed non-U.S. equities, when its rules-based system maintained meaningful exposure to international stocks instead of shifting into Treasury bills. This allowed the Fund to participate in rallies across European and Asian developed markets, particularly in globally important sectors such as semiconductors, healthcare, and financials. Periods of improving global risk appetite and stronger-than-expected corporate earnings abroad helped support broad participation across its diversified holdings. When international equities moved in a steady direction rather than a choppy one, the strategy’s momentum framework generally kept it aligned with prevailing market direction, enhancing return capture.
What detracted from performance
Performance was most challenged when global leadership concentrated heavily in U.S. mega-cap growth and AI-driven stocks, which are outside the Fund’s core focus and reduced relative appeal for international exposure. The trend-following mechanism can also lag during turning points, meaning the portfolio may remain invested after an uptrend weakens or stay cautious after a rebound begins, which can dilute returns in volatile phases. Currency movements added another layer of variability, as a stronger U.S. dollar periodically reduced translated gains from overseas equities. In addition, uneven economic conditions across Europe and parts of Asia created inconsistent sector performance, which made it harder for a single directional trend to persist long enough to fully benefit the strategy’s momentum approach.
Performance was most challenged when global leadership concentrated heavily in U.S. mega-cap growth and AI-driven stocks, which are outside the Fund’s core focus and reduced relative appeal for international exposure. The trend-following mechanism can also lag during turning points, meaning the portfolio may remain invested after an uptrend weakens or stay cautious after a rebound begins, which can dilute returns in volatile phases. Currency movements added another layer of variability, as a stronger U.S. dollar periodically reduced translated gains from overseas equities. In addition, uneven economic conditions across Europe and parts of Asia created inconsistent sector performance, which made it harder for a single directional trend to persist long enough to fully benefit the strategy’s momentum approach.
The Fund’s performance information included above is compared with a regulatory required index that represents an overall securities market (Broad-Based Benchmark) and may include one or more indexes that more closely align to the Fund’s investment strategy (Strategy Benchmark(s)) or provide a secondary point of comparison.
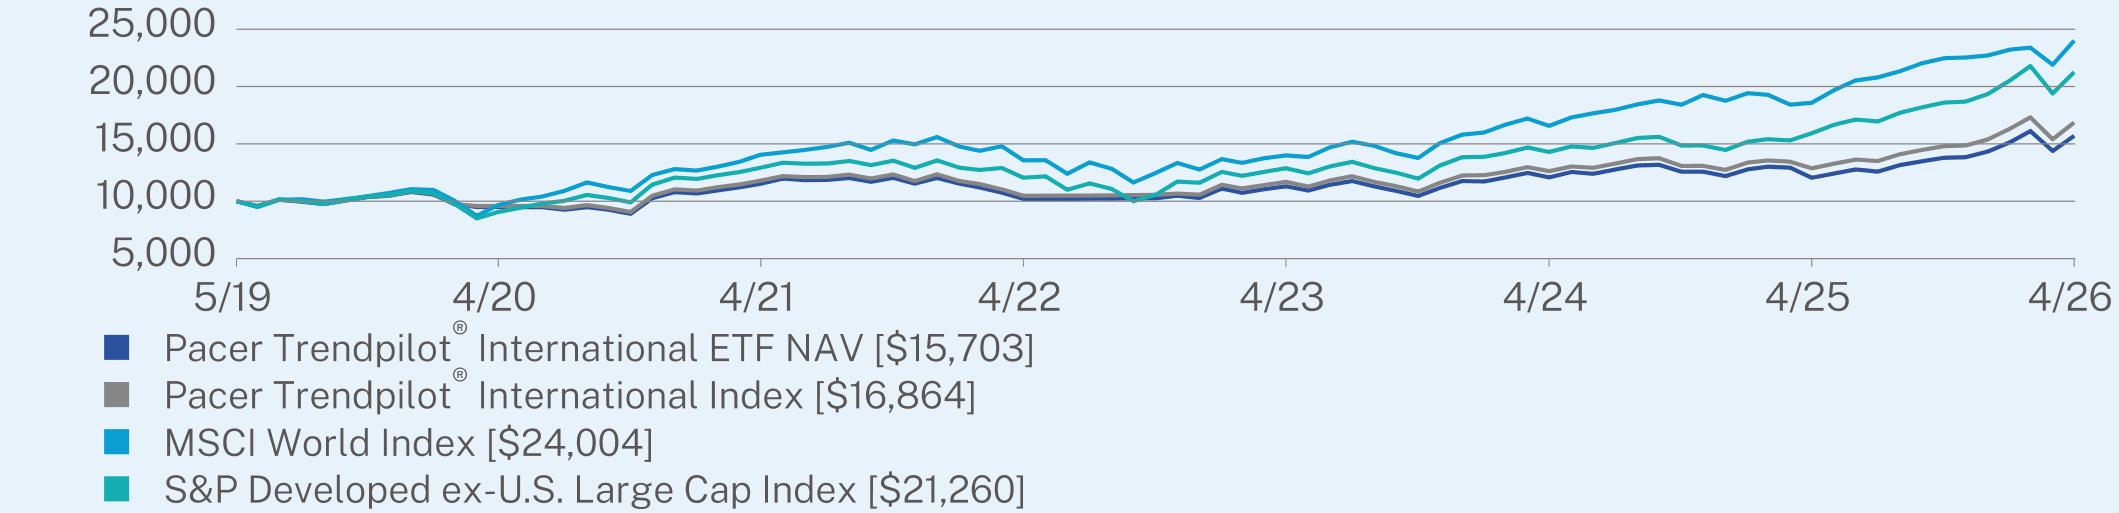
ANNUAL AVERAGE TOTAL RETURN (%)
|
|
1 Year
|
5 Year
|
Since Inception
(05/02/2019) |
|
Pacer Trendpilot® International ETF NAV
|
30.33
|
6.37
|
6.66
|
|
Pacer Trendpilot® International Index
|
31.01
|
7.39
|
7.75
|
|
MSCI Word Index
|
29.16
|
11.29
|
13.33
|
|
S&P Developed ex-U.S. Large Cap Index
|
33.47
|
10.45
|
11.38
|
Visit https://www.paceretfs.com/ for more recent performance information.
KEY FUND STATISTICS (as of April 30, 2026)
|
Net Assets
|
$182,641,432
|
Portfolio Turnover
|
13%
|
|
|
Number of Holdings
|
499
|
30-Day SEC Yield
|
1.70%
|
|
|
Net Advisory Fee
|
$1,069,991
|
30-Day SEC Yield Unsubsidized
|
1.70%
|
WHAT DID THE FUND INVEST IN? (as of April 30, 2026)*
|
Top 10 Issuers
|
(%)
|
|
Samsung Electronics Co. Ltd.
|
3.6%
|
|
ASML Holding NV
|
2.4%
|
|
SK Hynix, Inc.
|
2.1%
|
|
HSBC Holdings PLC
|
1.4%
|
|
Roche Holding AG
|
1.3%
|
|
AstraZeneca PLC
|
1.3%
|
|
Novartis AG
|
1.2%
|
|
Nestle SA
|
1.1%
|
|
Shell PLC
|
1.1%
|
|
Royal Bank of Canada
|
1.1%
|
|
Top Sectors
|
(%)
|
|
Financials
|
27.0%
|
|
Industrials
|
18.1%
|
|
Information Technology
|
14.8%
|
|
Health Care
|
8.6%
|
|
Consumer Discretionary
|
7.5%
|
|
Materials
|
6.0%
|
|
Consumer Staples
|
5.7%
|
|
Energy
|
5.7%
|
|
Communication Services
|
2.7%
|
|
Cash & Other
|
3.9%
|
WHAT WERE THE FUND COSTS FOR THE PAST YEAR? (based on a hypothetical $10,000 investment)
|
Fund Name
|
Costs of a $10,000 investment
|
Costs paid as a percentage of a $10,000 investment
|
|
Pacer Trendpilot® US Bond ETF
|
$61
|
0.60%
|
WHAT FACTORS INFLUENCED PERFORMANCE
Between May 1, 2025 and April 30, 2026, the Pacer Trendpilot® US Bond ETF (PTBD) returned 1.7%, while its underlying index, the Pacer Trendpilot® US Bond Index, returned 3.0% over the same period. This represents an underperformance of 1.3 percentage points for the Fund. For the one-year period ended April 30, 2026, PTBD’s Broad-Based Benchmark, the Bloomberg U.S. Aggregate Bond Index, returned 4.1%, while its secondary index the iBoxx USD Liquid High Yield Index returned 8.7%
What contributed to performance
The Pacer Trendpilot® US Bond ETF benefited when credit markets experienced sustained improvement in risk appetite, allowing its rules-based system to allocate more heavily toward high-yield corporate bonds during favorable trend periods. In those environments, elevated yields in the junk bond segment provided a meaningful income boost, which became the primary driver of total return. The strategy’s ability to shift into partial or full Treasury exposure also helped preserve stability when volatility picked up in broader fixed income markets, reducing drawdown severity compared with static high-yield allocations. Over the period, phases of steady credit spreads and generally resilient corporate fundamentals helped the fund capture carry while still managing downside transitions in risk sentiment.
The Pacer Trendpilot® US Bond ETF benefited when credit markets experienced sustained improvement in risk appetite, allowing its rules-based system to allocate more heavily toward high-yield corporate bonds during favorable trend periods. In those environments, elevated yields in the junk bond segment provided a meaningful income boost, which became the primary driver of total return. The strategy’s ability to shift into partial or full Treasury exposure also helped preserve stability when volatility picked up in broader fixed income markets, reducing drawdown severity compared with static high-yield allocations. Over the period, phases of steady credit spreads and generally resilient corporate fundamentals helped the fund capture carry while still managing downside transitions in risk sentiment.
What detracted from performance
Performance was most challenged during uneven or trendless bond market conditions, where the strategy’s signals frequently rotated between high yield, blended exposure, and Treasuries without a sustained directional advantage. In environments where interest rate expectations shifted rapidly, the timing of these switches sometimes lagged market moves, leading to missed upside in rallies or partial exposure during drawdowns. Periods of heightened macro uncertainty also caused credit spreads to widen temporarily, pressuring high-yield allocations before the system fully adjusted defensively. Additionally, because returns depend heavily on correctly identifying and maintaining trends, choppy conditions reduced the effectiveness of the model and limited consistency versus simpler static bond benchmarks.
Performance was most challenged during uneven or trendless bond market conditions, where the strategy’s signals frequently rotated between high yield, blended exposure, and Treasuries without a sustained directional advantage. In environments where interest rate expectations shifted rapidly, the timing of these switches sometimes lagged market moves, leading to missed upside in rallies or partial exposure during drawdowns. Periods of heightened macro uncertainty also caused credit spreads to widen temporarily, pressuring high-yield allocations before the system fully adjusted defensively. Additionally, because returns depend heavily on correctly identifying and maintaining trends, choppy conditions reduced the effectiveness of the model and limited consistency versus simpler static bond benchmarks.
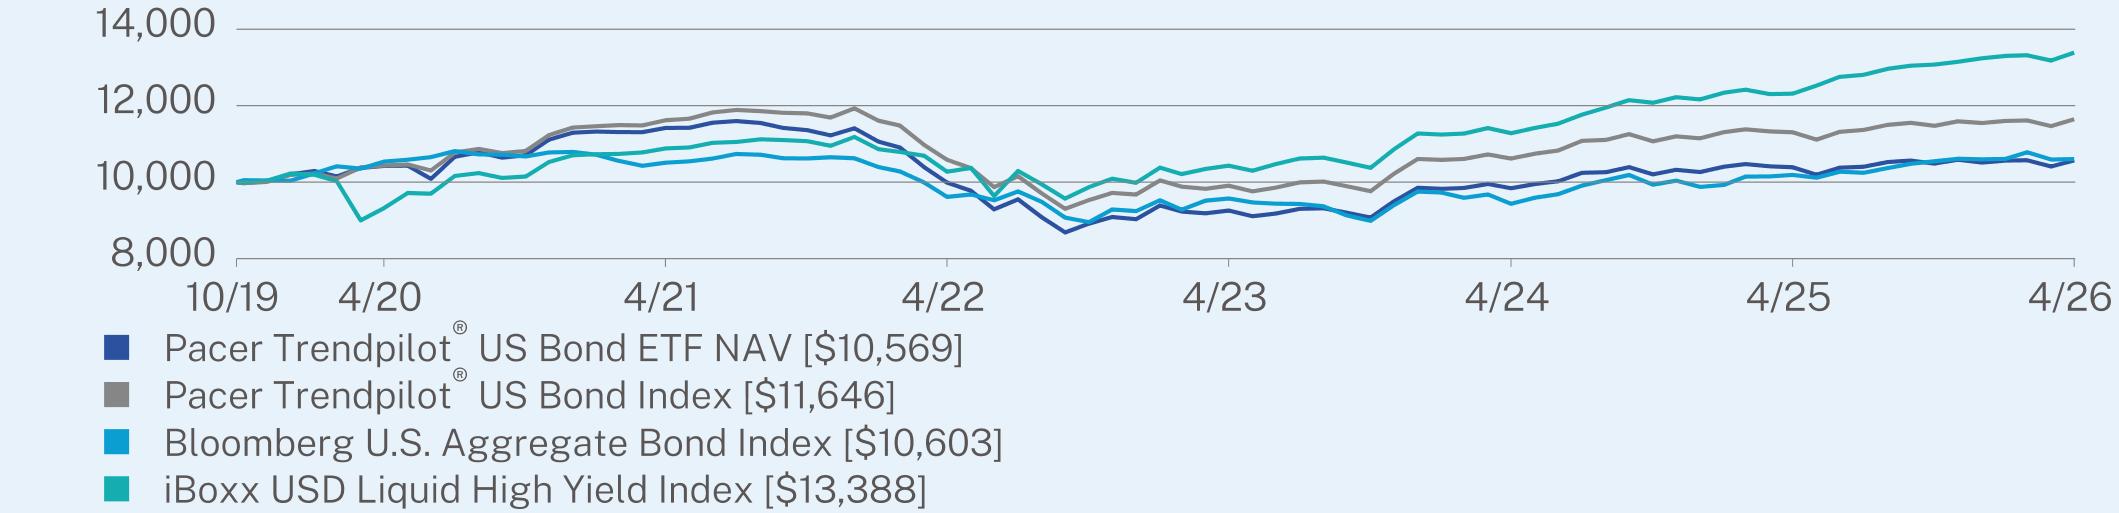
ANNUAL AVERAGE TOTAL RETURN (%)
|
|
1 Year
|
5 Year
|
Since Inception
(10/22/2019) |
|
Pacer Trendpilot® US Bond ETF NAV
|
1.73
|
-1.53
|
0.85
|
|
Pacer Trendpilot® US Bond Index
|
3.03
|
0.05
|
2.36
|
|
Bloomberg U.S. Aggregate Bond Index
|
4.06
|
0.18
|
0.90
|
|
iBoxx USD Liquid High Yield Index
|
8.73
|
4.23
|
4.57
|
Visit https://www.paceretfs.com/ for more recent performance information.
KEY FUND STATISTICS (as of April 30, 2026)
|
Net Assets
|
$93,968,144
|
Portfolio Turnover
|
623%
|
|
|
Number of Holdings
|
901
|
|||
|
Net Advisory Fee
|
$751,095
|
WHAT DID THE FUND INVEST IN? (as of April 30, 2026)*
|
Top 10 Issuers
|
(%)
|
|
Mount Vernon Liquid Assets Portfolio, LLC
|
2.8%
|
|
CCO Holdings LLC / CCO Holdings Capital Corp.
|
2.3%
|
|
TransDigm, Inc.
|
1.9%
|
|
Tenet Healthcare Corp.
|
1.2%
|
|
OneMain Finance Corp.
|
1.0%
|
|
Venture Global LNG, Inc.
|
1.0%
|
|
NRG Energy, Inc.
|
1.0%
|
|
Cloud Software Group, Inc.
|
0.9%
|
|
Venture Global Plaquemines LNG LLC
|
0.9%
|
|
CSC Holdings LLC
|
0.8%
|
|
Top Sectors
|
(%)
|
|
Consumer Discretionary
|
18.5%
|
|
Communication Services
|
18.3%
|
|
Financials
|
12.5%
|
|
Energy
|
10.7%
|
|
Health Care
|
8.4%
|
|
Materials
|
8.1%
|
|
Industrials
|
8.0%
|
|
Information Technology
|
5.1%
|
|
Utilities
|
4.2%
|
|
Cash & Other
|
6.2%
|
WHAT WERE THE FUND COSTS FOR THE PAST YEAR? (based on a hypothetical $10,000 investment)
|
Fund Name
|
Costs of a $10,000 investment
|
Costs paid as a percentage of a $10,000 investment
|
|
Pacer Trendpilot® US Large Cap ETF
|
$65
|
0.60%
|
WHAT FACTORS INFLUENCED PERFORMANCE
Between May 1, 2025 and April 30, 2026, the Pacer Trendpilot® US Large Cap ETF (PTLC) returned 16.2%, while its underlying index, the Pacer Trendpilot® US Large Cap Index, returned 16.9% over the same period. This represents an underperformance of 0.7 percentage points for the Fund. For the one-year period ended April 30, 2026, PTLC’s Broad-Based Benchmark, the S&P 500 Index, returned 31.1%.
What contributed to performance
Performance for PTLC during the period was primarily driven by strong gains in U.S. large-cap equities, particularly within technology and growth-oriented sectors. PTLC also benefited from its Trendpilot® methodology, which maintained meaningful equity exposure during favorable market conditions while seeking to reduce downside risk through tactical shifts into U.S. Treasury bills during periods of market weakness. Continued investor optimism surrounding artificial intelligence, resilient corporate earnings, and easing inflation expectations further supported equity market performance over the period.
Performance for PTLC during the period was primarily driven by strong gains in U.S. large-cap equities, particularly within technology and growth-oriented sectors. PTLC also benefited from its Trendpilot® methodology, which maintained meaningful equity exposure during favorable market conditions while seeking to reduce downside risk through tactical shifts into U.S. Treasury bills during periods of market weakness. Continued investor optimism surrounding artificial intelligence, resilient corporate earnings, and easing inflation expectations further supported equity market performance over the period.
What detracted from performance
Performance for PTLC was primarily detracted by its trend-following allocation process, which can result in periods of reduced equity exposure during rising markets. This can cause the Fund to lag broader equity benchmarks during strong, sustained uptrends in U.S. large-cap equities. In addition, short-term shifts between equity and Treasury bill exposure may create timing differences that lead to tracking deviation versus the underlying equity market, particularly during periods of rapid market reversals or extended momentum-driven rallies.
Performance for PTLC was primarily detracted by its trend-following allocation process, which can result in periods of reduced equity exposure during rising markets. This can cause the Fund to lag broader equity benchmarks during strong, sustained uptrends in U.S. large-cap equities. In addition, short-term shifts between equity and Treasury bill exposure may create timing differences that lead to tracking deviation versus the underlying equity market, particularly during periods of rapid market reversals or extended momentum-driven rallies.
The Fund’s performance information included above is compared with a regulatory required index that represents an overall securities market (Broad-Based Benchmark) and may include one or more indexes that more closely align to the Fund’s investment strategy (Strategy Benchmark(s)) or provide a secondary point of comparison.
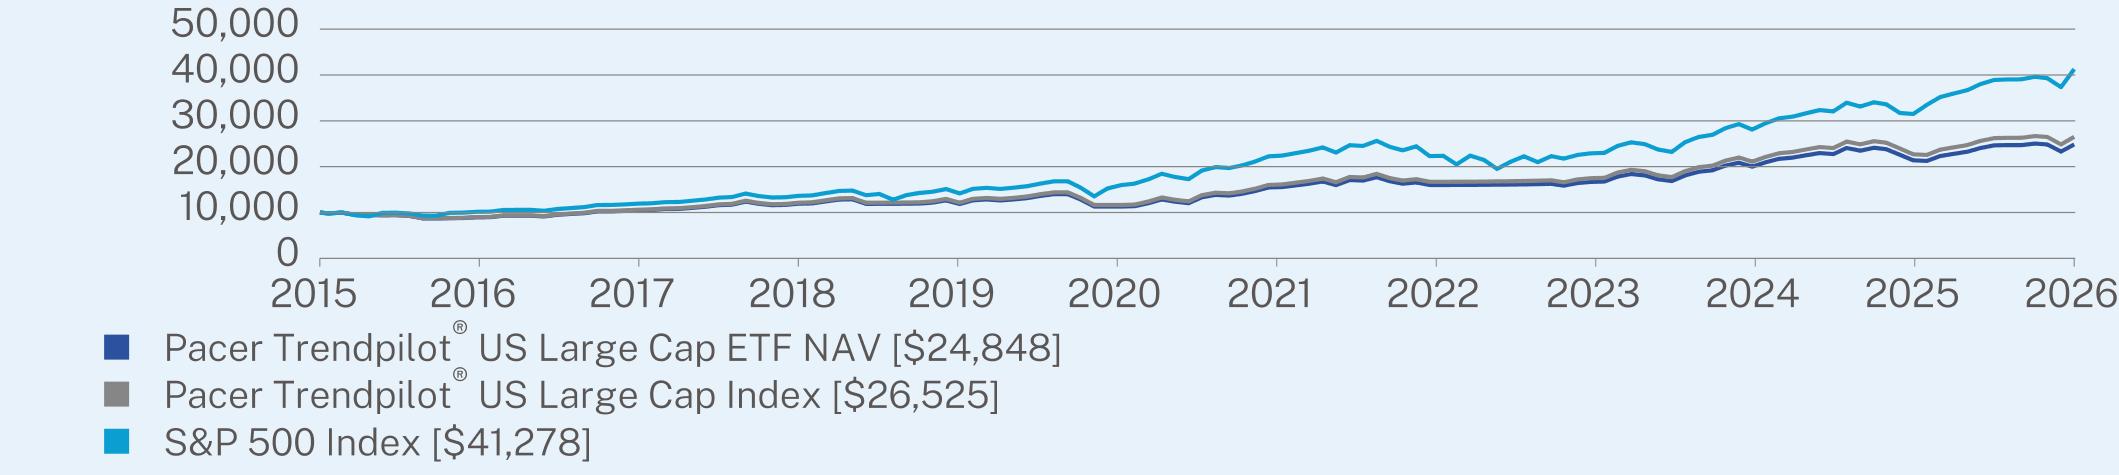
ANNUAL AVERAGE TOTAL RETURN (%)
|
|
1 Year
|
5 Year
|
10 Year
|
|
Pacer Trendpilot® US Large Cap ETF NAV
|
16.17
|
9.95
|
10.95
|
|
Pacer Trendpilot® US Large Cap Index
|
16.89
|
10.61
|
11.61
|
|
S&P 500 Index
|
31.05
|
13.14
|
15.26
|
Visit https://www.paceretfs.com/ for more recent performance information.
KEY FUND STATISTICS (as of April 30, 2026)
|
Net Assets
|
$3,207,646,972
|
Portfolio Turnover
|
55%
|
|
|
Number of Holdings
|
505
|
30-Day SEC Yield
|
1.08%
|
|
|
Net Advisory Fee
|
$19,856,616
|
30-Day SEC Yield Unsubsidized
|
1.08%
|
WHAT DID THE FUND INVEST IN? (as of April 30, 2026)*
|
Top 10 Issuers
|
(%)
|
|
NVIDIA Corp.
|
7.9%
|
|
Alphabet, Inc.
|
6.5%
|
|
Apple, Inc.
|
6.5%
|
|
Microsoft Corp.
|
4.9%
|
|
Amazon.com, Inc.
|
4.2%
|
|
Broadcom, Inc.
|
3.2%
|
|
Meta Platforms, Inc.
|
2.2%
|
|
Tesla Motors, Inc.
|
1.7%
|
|
Berkshire Hathaway, Inc.
|
1.4%
|
|
JPMorgan Chase & Co.
|
1.4%
|
|
Top Sectors
|
(%)
|
|
Information Technology
|
35.0%
|
|
Financials
|
12.0%
|
|
Communication Services
|
11.0%
|
|
Consumer Discretionary
|
10.0%
|
|
Industrials
|
8.8%
|
|
Health Care
|
8.5%
|
|
Consumer Staples
|
5.0%
|
|
Energy
|
3.5%
|
|
Utilities
|
2.4%
|
|
Cash & Other
|
3.8%
|
WHAT WERE THE FUND COSTS FOR THE PAST YEAR? (based on a hypothetical $10,000 investment)
|
Fund Name
|
Costs of a $10,000 investment
|
Costs paid as a percentage of a $10,000 investment
|
|
Pacer Trendpilot® US Mid Cap ETF
|
$65
|
0.60%
|
WHAT FACTORS INFLUENCED PERFORMANCE
Between May 1, 2025 and April 30, 2026, the Pacer Trendpilot® US Mid Cap ETF (PTMC) returned 15.8%, while its underlying index, the Pacer Trendpilot® US Mid Cap Index, returned 16.2% over the same period. This represents an underperformance of 0.4 percentage points for the Fund. For the one-year period ended April 30, 2026, PTMC’s Broad-Based Benchmark index, the S&P Composite 1500 Index returned 31.2%, while its Strategy Benchmark, the S&P MidCap 400 Index, returned 29.5%.
What contributed to performance
The Pacer Trendpilot® US Mid Cap ETF benefited during periods when mid-cap equities sustained clear upward trends, allowing the strategy to remain fully invested and participate in cyclical and earnings-driven rallies. When investor sentiment broadened beyond mega-cap technology leadership, mid-cap industrials, financials, and select healthcare names helped drive performance through improved earnings momentum and healthy economic sensitivity. The model’s ability to stay invested during persistent uptrends captured compounding gains, especially when volatility was low and trend signals remained aligned with market direction. In addition, occasional risk-on phases supported stronger performance in higher-beta mid-cap segments, reinforcing returns during favorable market regimes.
The Pacer Trendpilot® US Mid Cap ETF benefited during periods when mid-cap equities sustained clear upward trends, allowing the strategy to remain fully invested and participate in cyclical and earnings-driven rallies. When investor sentiment broadened beyond mega-cap technology leadership, mid-cap industrials, financials, and select healthcare names helped drive performance through improved earnings momentum and healthy economic sensitivity. The model’s ability to stay invested during persistent uptrends captured compounding gains, especially when volatility was low and trend signals remained aligned with market direction. In addition, occasional risk-on phases supported stronger performance in higher-beta mid-cap segments, reinforcing returns during favorable market regimes.
What detracted from performance
Performance was periodically constrained when market leadership became highly concentrated in large-cap growth and AI-driven stocks, which sit outside the fund’s mid-cap focus and reduced relative competitiveness. The strategy’s trend-following design also introduced lag during turning points, meaning exposure adjustments sometimes occurred after mid-cap rallies had already begun or ended. Choppy macro environments—driven by shifting interest rate expectations and uneven economic signals—created whipsaw conditions that limited the effectiveness of sustained trend exposure. In addition, when markets lacked a strong directional bias, the rotation between equity exposure and defensive positioning (including Treasury bills) reduced participation in upside moves, muting returns versus a fully invested benchmark.
Performance was periodically constrained when market leadership became highly concentrated in large-cap growth and AI-driven stocks, which sit outside the fund’s mid-cap focus and reduced relative competitiveness. The strategy’s trend-following design also introduced lag during turning points, meaning exposure adjustments sometimes occurred after mid-cap rallies had already begun or ended. Choppy macro environments—driven by shifting interest rate expectations and uneven economic signals—created whipsaw conditions that limited the effectiveness of sustained trend exposure. In addition, when markets lacked a strong directional bias, the rotation between equity exposure and defensive positioning (including Treasury bills) reduced participation in upside moves, muting returns versus a fully invested benchmark.
The Fund’s performance information included above is compared with a regulatory required index that represents an overall securities market (Broad-Based Benchmark) and may include one or more indexes that more closely align to the Fund’s investment strategy (Strategy Benchmark(s)) or provide a secondary point of comparison.
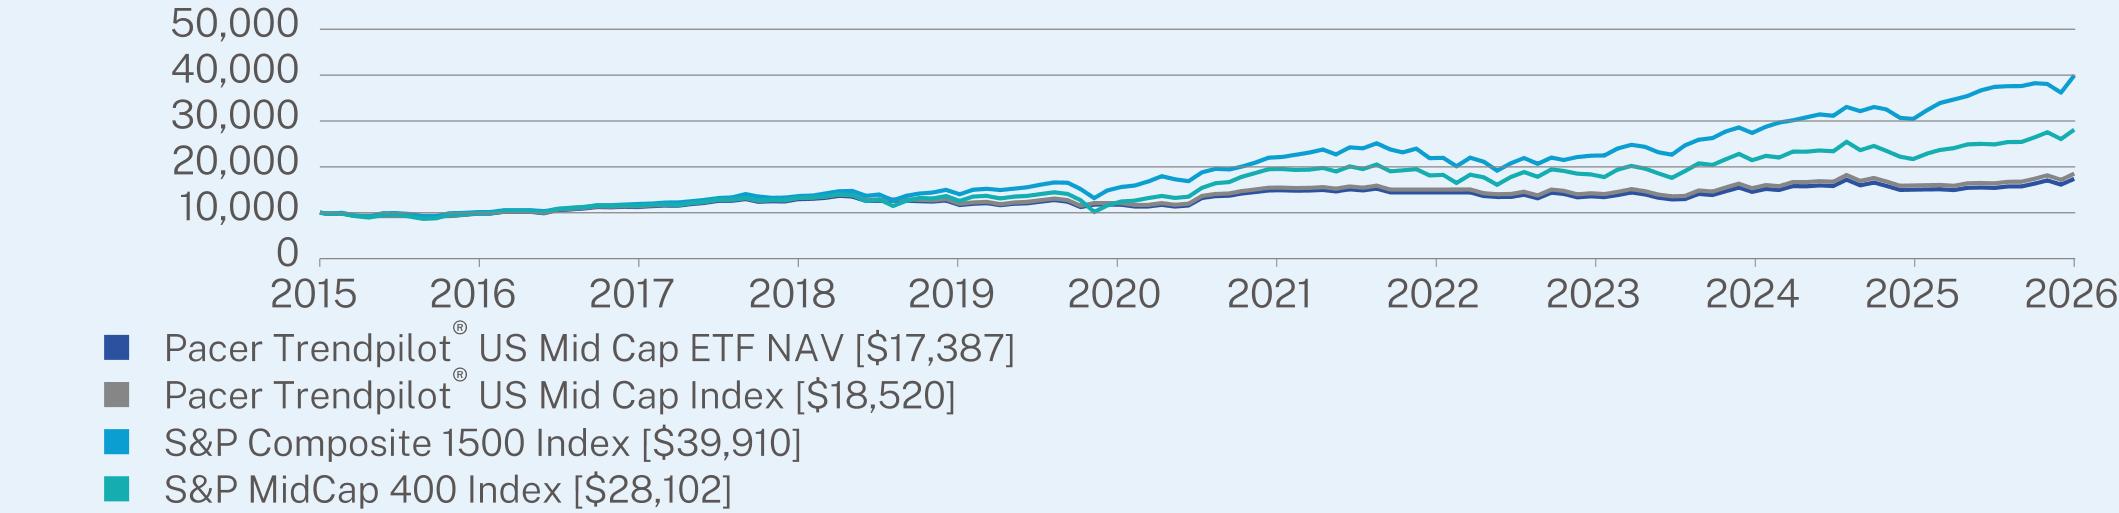
ANNUAL AVERAGE TOTAL RETURN (%)
|
|
1 Year
|
5 Year
|
10 Year
|
|
Pacer Trendpilot® US Mid Cap ETF NAV
|
15.78
|
3.19
|
6.21
|
|
Pacer Trendpilot® US Mid Cap Index
|
16.22
|
3.69
|
6.81
|
|
S&P Composite 1500 Index
|
31.17
|
12.65
|
14.91
|
|
S&P MidCap 400 Index
|
29.49
|
7.60
|
11.29
|
Visit https://www.paceretfs.com/ for more recent performance information.
KEY FUND STATISTICS (as of April 30, 2026)
|
Net Assets
|
$392,519,492
|
Portfolio Turnover
|
23%
|
|
|
Number of Holdings
|
401
|
30-Day SEC Yield
|
0.75%
|
|
|
Net Advisory Fee
|
$2,449,353
|
30-Day SEC Yield Unsubsidized
|
0.75%
|
WHAT DID THE FUND INVEST IN? (as of April 30, 2026)*
|
Top 10 Issuers
|
(%)
|
|
Mount Vernon Liquid Assets Portfolio, LLC
|
11.6%
|
|
Flex Ltd.
|
1.0%
|
|
TechnipFMC PLC
|
0.9%
|
|
Curtiss-Wright Corp.
|
0.8%
|
|
XPO Logistics, Inc.
|
0.8%
|
|
United Therapeutics Corp.
|
0.7%
|
|
Fabrinet
|
0.7%
|
|
MasTec, Inc.
|
0.7%
|
|
nVent Electric PLC
|
0.7%
|
|
Twilio, Inc.
|
0.7%
|
|
Top Sectors
|
(%)
|
|
Industrials
|
26.0%
|
|
Financials
|
14.5%
|
|
Information Technology
|
13.9%
|
|
Consumer Discretionary
|
11.0%
|
|
Health Care
|
8.4%
|
|
Real Estate
|
7.3%
|
|
Materials
|
5.7%
|
|
Energy
|
5.3%
|
|
Consumer Staples
|
3.6%
|
|
Cash & Other
|
4.3%
|
WHAT WERE THE FUND COSTS FOR THE PAST YEAR? (based on a hypothetical $10,000 investment)
|
Fund Name
|
Costs of a $10,000 investment
|
Costs paid as a percentage of a $10,000 investment
|
|
Pacer US Cash Cows 100 ETF
|
$55
|
0.49%
|
WHAT FACTORS INFLUENCED PERFORMANCE
Between May 1, 2025 and April 30, 2026, the Pacer US Cash Cows 100 ETF (COWZ) returned 24.9%, while its underlying index, the Pacer US Cash Cows 100 Index, returned 25.6% over the same period. This represents an underperformance of 0.7 percentage points for the Fund. For the one-year period ended April 30, 2026, COWZ’s Broad-Based Benchmark, the S&P Composite 1500 Index returned 31.2%, while its Strategy Benchmark, the Russell 1000 Value Index, returned 29.2%.
What contributed to performance
The Pacer US Cash Cows 100 ETF benefited from sustained investor preference for profitable, free cash flow–generating companies, which tended to hold up well across shifting market regimes. During the period, strong performance in sectors such as energy, healthcare, and select industrial and consumer names helped support returns, especially as these areas offered attractive cash yields and relatively stable earnings. The strategy’s emphasis on firms with durable balance sheets also aligned well with market phases that rewarded quality and value characteristics over more speculative growth. At various points, broader equity sentiment remained constructive enough to support mid- and large-cap cyclicals, which amplified gains from the Fund’s concentrated “cash cow” selection approach.
The Pacer US Cash Cows 100 ETF benefited from sustained investor preference for profitable, free cash flow–generating companies, which tended to hold up well across shifting market regimes. During the period, strong performance in sectors such as energy, healthcare, and select industrial and consumer names helped support returns, especially as these areas offered attractive cash yields and relatively stable earnings. The strategy’s emphasis on firms with durable balance sheets also aligned well with market phases that rewarded quality and value characteristics over more speculative growth. At various points, broader equity sentiment remained constructive enough to support mid- and large-cap cyclicals, which amplified gains from the Fund’s concentrated “cash cow” selection approach.
What detracted from performance
Performance was periodically restrained when market leadership became heavily concentrated in mega-cap technology and AI-driven growth stocks, which the Fund is structurally underweight given its cash-flow screen. In those environments, even solid fundamental performers in value-tilted sectors lagged as investors prioritized high-multiple growth narratives over free cash flow yield. Shifts in interest rate expectations also created headwinds, as higher discount rates tend to compress valuations for equity income strategies despite strong underlying earnings. In addition, cyclical pockets of weakness in global manufacturing and consumer demand at times weighed on energy and industrial holdings, creating intermittent drag even as company-level cash generation remained resilient.
Performance was periodically restrained when market leadership became heavily concentrated in mega-cap technology and AI-driven growth stocks, which the Fund is structurally underweight given its cash-flow screen. In those environments, even solid fundamental performers in value-tilted sectors lagged as investors prioritized high-multiple growth narratives over free cash flow yield. Shifts in interest rate expectations also created headwinds, as higher discount rates tend to compress valuations for equity income strategies despite strong underlying earnings. In addition, cyclical pockets of weakness in global manufacturing and consumer demand at times weighed on energy and industrial holdings, creating intermittent drag even as company-level cash generation remained resilient.
The Fund’s performance information included above is compared with a regulatory required index that represents an overall securities market (Broad-Based Benchmark) and may include one or more indexes that more closely align to the Fund’s investment strategy (Strategy Benchmark(s)) or provide a secondary point of comparison.
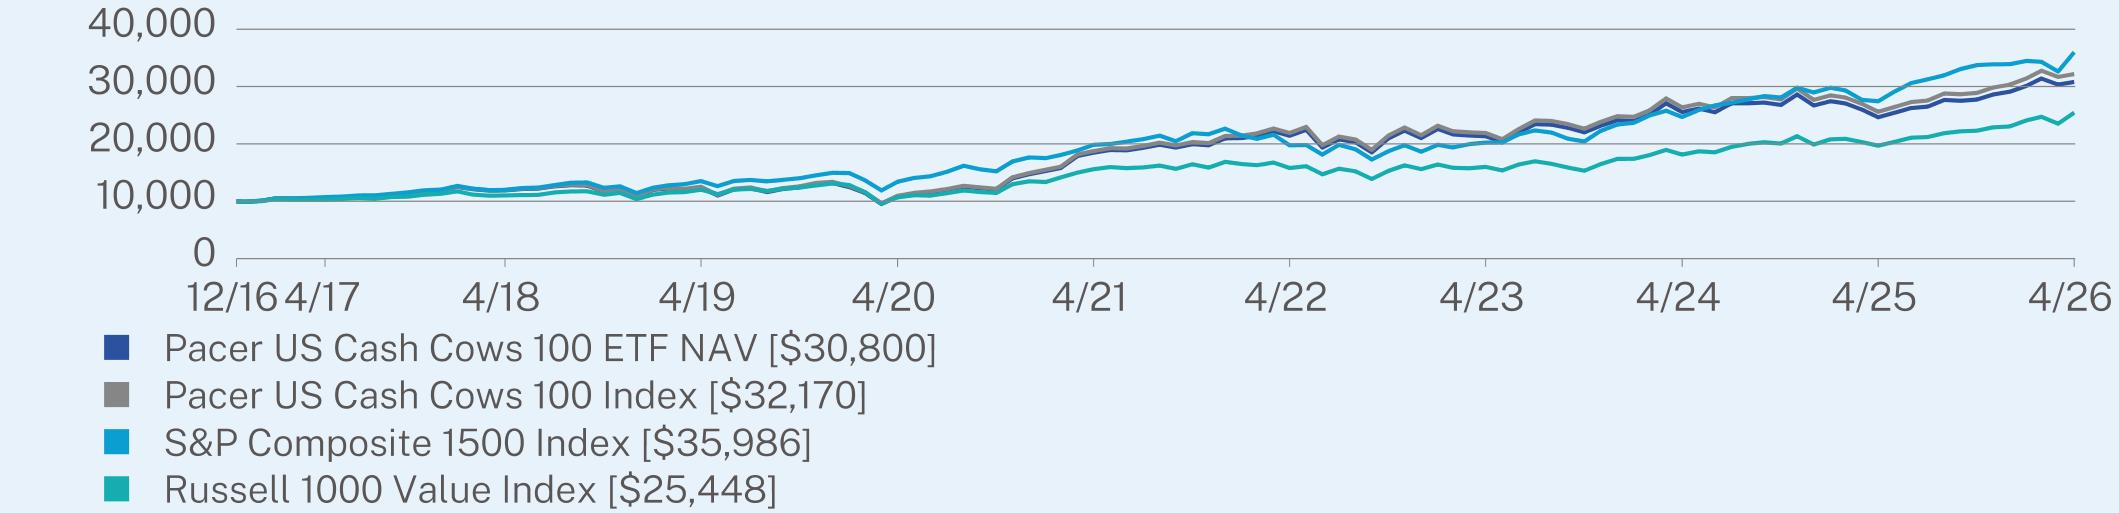
ANNUAL AVERAGE TOTAL RETURN (%)
|
|
1 Year
|
5 Year
|
Since Inception
(12/16/2016) |
|
Pacer US Cash Cows 100 ETF NAV
|
24.95
|
10.78
|
12.76
|
|
Pacer US Cash Cows 100 Index
|
25.64
|
11.39
|
13.28
|
|
S&P Composite 1500 Index
|
31.17
|
12.65
|
14.64
|
|
Russell 1000 Value Index
|
29.25
|
10.29
|
10.48
|
Visit https://www.paceretfs.com/ for more recent performance information.
KEY FUND STATISTICS (as of April 30, 2026)
|
Net Assets
|
$18,172,509,272
|
Portfolio Turnover
|
86%
|
|
|
Number of Holdings
|
101
|
30-Day SEC Yield
|
1.71%
|
|
|
Net Advisory Fee
|
$94,116,864
|
30-Day SEC Yield Unsubsidized
|
1.71%
|
WHAT DID THE FUND INVEST IN? (as of April 30, 2026)*
|
Top 10 Issuers
|
(%)
|
|
QUALCOMM, Inc.
|
2.7%
|
|
Altria Group, Inc.
|
2.2%
|
|
ConocoPhillips
|
2.2%
|
|
CVS Health Corp.
|
2.2%
|
|
Bristol-Myers Squibb Co.
|
2.0%
|
|
Ford Motor Co.
|
2.0%
|
|
Uber Technologies, Inc.
|
2.0%
|
|
Pfizer, Inc.
|
2.0%
|
|
Diamondback Energy, Inc.
|
2.0%
|
|
Newmont Goldcorp Corp.
|
1.9%
|
|
Top Sectors
|
(%)
|
|
Health Care
|
21.0%
|
|
Information Technology
|
18.9%
|
|
Energy
|
16.4%
|
|
Industrials
|
12.1%
|
|
Consumer Discretionary
|
9.8%
|
|
Consumer Staples
|
9.6%
|
|
Communication Services
|
8.1%
|
|
Materials
|
3.9%
|
|
Cash & Other
|
0.2%
|
WHAT WERE THE FUND COSTS FOR THE PAST YEAR? (based on a hypothetical $10,000 investment)
|
Fund Name
|
Costs of a $10,000 investment
|
Costs paid as a percentage of a $10,000 investment
|
|
Pacer US Cash Cows Growth ETF
|
$68
|
0.60%
|
WHAT FACTORS INFLUENCED PERFORMANCE
Between May 1, 2025 and April 30, 2026, the Pacer US Cash Cows Growth ETF (BUL) returned 27.3%, while its underlying index, the Pacer US Cash Cows Growth Index, returned 28.1% over the same period. This represents an underperformance of 0.8 percentage points for the Fund. For the one-year period ended April 30, 2026, BUL’s Broad-Based Benchmark, the S&P 500 Index, returned 31.1%, while its Strategy Benchmark, S&P 900 Pure Growth Index returned 37.5%
What contributed to performance
The Pacer US Cash Cows Growth ETF benefited from exposure to large-cap companies combining strong free cash flow generation with above-average earnings growth characteristics, which helped it participate in leadership within technology, industrial innovation, and select healthcare names. During the period, investor sentiment was generally supportive of profitable growth stories, especially in areas tied to semiconductors, automation, and industrial technology where cash-rich firms continued to reinvest effectively. When markets broadened beyond a narrow set of mega-cap leaders, the strategy captured upside from a wider set of fundamentally strong companies with durable cash generation. Its focus on financially robust growth firms also provided some resilience during volatility, as investors tended to favor balance-sheet strength when conditions were uncertain.
The Pacer US Cash Cows Growth ETF benefited from exposure to large-cap companies combining strong free cash flow generation with above-average earnings growth characteristics, which helped it participate in leadership within technology, industrial innovation, and select healthcare names. During the period, investor sentiment was generally supportive of profitable growth stories, especially in areas tied to semiconductors, automation, and industrial technology where cash-rich firms continued to reinvest effectively. When markets broadened beyond a narrow set of mega-cap leaders, the strategy captured upside from a wider set of fundamentally strong companies with durable cash generation. Its focus on financially robust growth firms also provided some resilience during volatility, as investors tended to favor balance-sheet strength when conditions were uncertain.
What detracted from performance
Performance was periodically constrained when market leadership became highly concentrated in a small group of mega-cap AI and momentum-driven stocks, which often outpaced the broader set of growth-and-cash-flow names in the portfolio. In those environments, even strong fundamentals were overshadowed by narrative-driven rallies in a handful of dominant technology names, reducing relative capture. Shifts in interest rate expectations also created headwinds, as higher discount rates tend to compress valuations for longer-duration growth equities despite solid earnings profiles. Additionally, when sentiment rotated toward either pure value or ultra-high-momentum leaders, the Fund’s blended “growth plus cash flow discipline” positioning sometimes lagged more narrowly defined factor exposures.
Performance was periodically constrained when market leadership became highly concentrated in a small group of mega-cap AI and momentum-driven stocks, which often outpaced the broader set of growth-and-cash-flow names in the portfolio. In those environments, even strong fundamentals were overshadowed by narrative-driven rallies in a handful of dominant technology names, reducing relative capture. Shifts in interest rate expectations also created headwinds, as higher discount rates tend to compress valuations for longer-duration growth equities despite solid earnings profiles. Additionally, when sentiment rotated toward either pure value or ultra-high-momentum leaders, the Fund’s blended “growth plus cash flow discipline” positioning sometimes lagged more narrowly defined factor exposures.
The Fund’s performance information included above is compared with a regulatory required index that represents an overall securities market (Broad-Based Benchmark) and may include one or more indexes that more closely align to the Fund’s investment strategy (Strategy Benchmark(s)) or provide a secondary point of comparison.
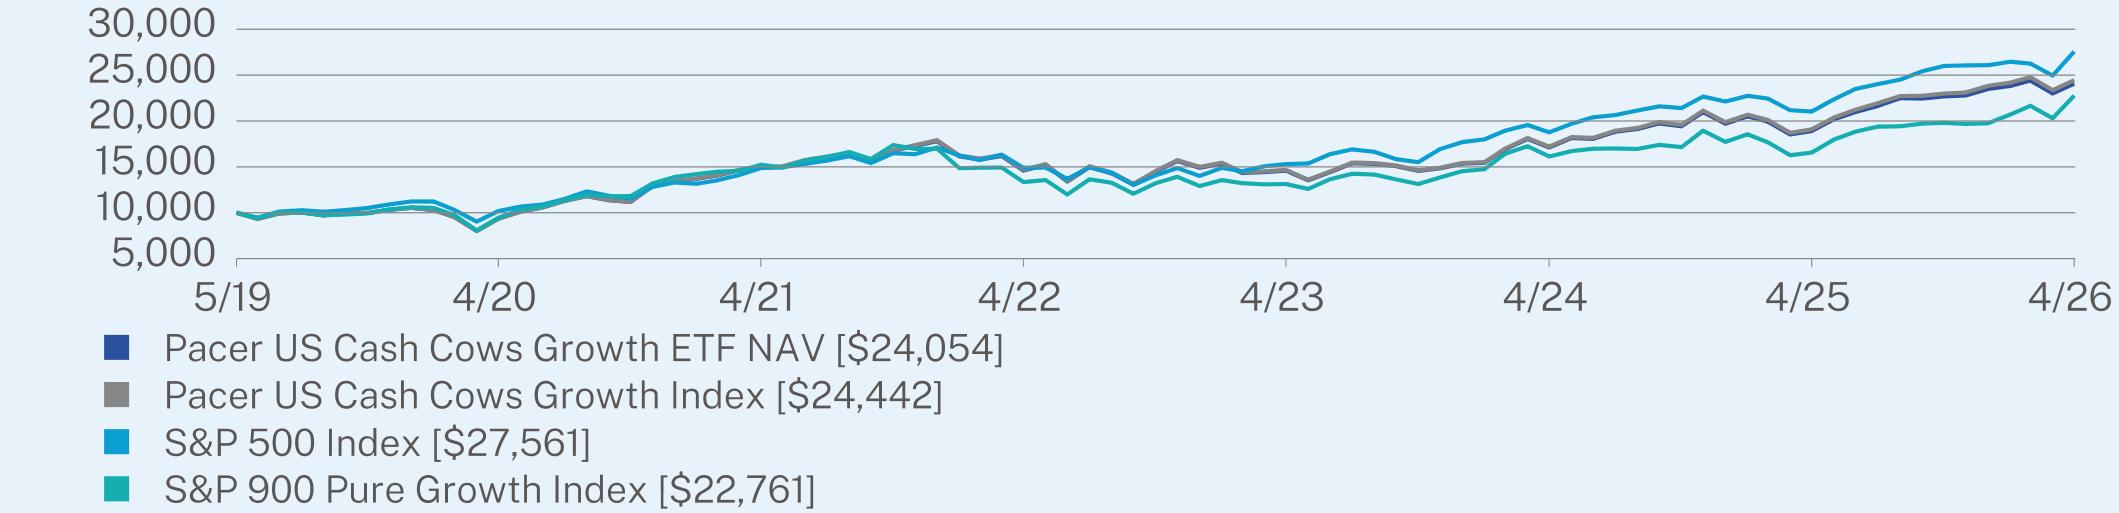
ANNUAL AVERAGE TOTAL RETURN (%)
|
|
1 Year
|
5 Year
|
Since Inception
(05/02/2019) |
|
Pacer US Cash Cows Growth ETF NAV
|
27.29
|
10.07
|
13.36
|
|
Pacer US Cash Cows Growth Index
|
28.10
|
10.33
|
13.62
|
|
S&P 500 Index
|
31.05
|
13.14
|
15.59
|
|
S&P 900 Pure Growth Index
|
37.46
|
8.37
|
12.47
|
Visit https://www.paceretfs.com/ for more recent performance information.
KEY FUND STATISTICS (as of April 30, 2026)
|
Net Assets
|
$127,032,676
|
Portfolio Turnover
|
105%
|
|
|
Number of Holdings
|
51
|
30-Day SEC Yield
|
0.00%
|
|
|
Net Advisory Fee
|
$590,890
|
30-Day SEC Yield Unsubsidized
|
0.00%
|
WHAT DID THE FUND INVEST IN? (as of April 30, 2026)*
|
Top 10 Issuers
|
(%)
|
|
EMCOR Group, Inc.
|
5.0%
|
|
Uber Technologies, Inc.
|
4.9%
|
|
Mount Vernon Liquid Assets Portfolio, LLC
|
4.9%
|
|
Newmont Goldcorp Corp.
|
4.9%
|
|
Carnival Corp.
|
4.8%
|
|
Booking Holdings, Inc.
|
4.8%
|
|
Flex Ltd.
|
4.2%
|
|
HCA Healthcare, Inc.
|
3.9%
|
|
Expedia Group, Inc.
|
3.8%
|
|
TechnipFMC PLC
|
3.8%
|
|
Top Sectors
|
(%)
|
|
Consumer Discretionary
|
24.4%
|
|
Health Care
|
21.4%
|
|
Information Technology
|
20.6%
|
|
Industrials
|
19.5%
|
|
Materials
|
5.7%
|
|
Energy
|
5.1%
|
|
Consumer Staples
|
1.7%
|
|
Communication Services
|
1.6%
|
|
Cash & Other
|
0.0%
|
WHAT WERE THE FUND COSTS FOR THE PAST YEAR? (based on a hypothetical $10,000 investment)
|
Fund Name
|
Costs of a $10,000 investment
|
Costs paid as a percentage of a $10,000 investment
|
|
Pacer US Export Leaders ETF
|
$75
|
0.60%
|
WHAT FACTORS INFLUENCED PERFORMANCE
Between May 1, 2025 and April 30, 2026, the Pacer US Export Leaders ETF (PEXL) returned 49.9%, while its underlying index, the Pacer US Export Leaders Index, returned 50.9% over the same period. This represents an underperformance of 1.0 percentage points for the Fund. For the one-year period ended April 30, 2026, PEXL’s Broad-Based Benchmark, the S&P 900 Index, returned 30.9%
What contributed to performance
Performance for PEXL was supported by gains in large-cap U.S. companies with significant international revenue exposure, alongside generally favorable global equity market conditions. Holdings tied to industrial, consumer, and other globally cyclical areas contributed to returns over the period. Relative performance was tempered as U.S.-centric growth and technology leaders outpaced more internationally oriented segments of the market. In addition, changes in market leadership and foreign currency effects on overseas earnings created mild headwinds versus the broader U.S. equity benchmark.
Performance for PEXL was supported by gains in large-cap U.S. companies with significant international revenue exposure, alongside generally favorable global equity market conditions. Holdings tied to industrial, consumer, and other globally cyclical areas contributed to returns over the period. Relative performance was tempered as U.S.-centric growth and technology leaders outpaced more internationally oriented segments of the market. In addition, changes in market leadership and foreign currency effects on overseas earnings created mild headwinds versus the broader U.S. equity benchmark.
What detracted from performance
Performance for PEXL was primarily held back by relative positioning away from the strongest-performing areas of the U.S. equity market, particularly large-cap technology and other high-growth domestic sectors. This limited participation in the most pronounced leadership trends over the period. In addition, exposure to internationally sensitive earnings streams introduced modest headwinds, as currency fluctuations and uneven regional growth dynamics weighed on translated U.S. dollar results for some holdings.
Performance for PEXL was primarily held back by relative positioning away from the strongest-performing areas of the U.S. equity market, particularly large-cap technology and other high-growth domestic sectors. This limited participation in the most pronounced leadership trends over the period. In addition, exposure to internationally sensitive earnings streams introduced modest headwinds, as currency fluctuations and uneven regional growth dynamics weighed on translated U.S. dollar results for some holdings.
The Fund’s performance information included above is compared with a regulatory required index that represents an overall securities market (Broad-Based Benchmark) and may include one or more indexes that more closely align to the Fund’s investment strategy (Strategy Benchmark(s)) or provide a secondary point of comparison.
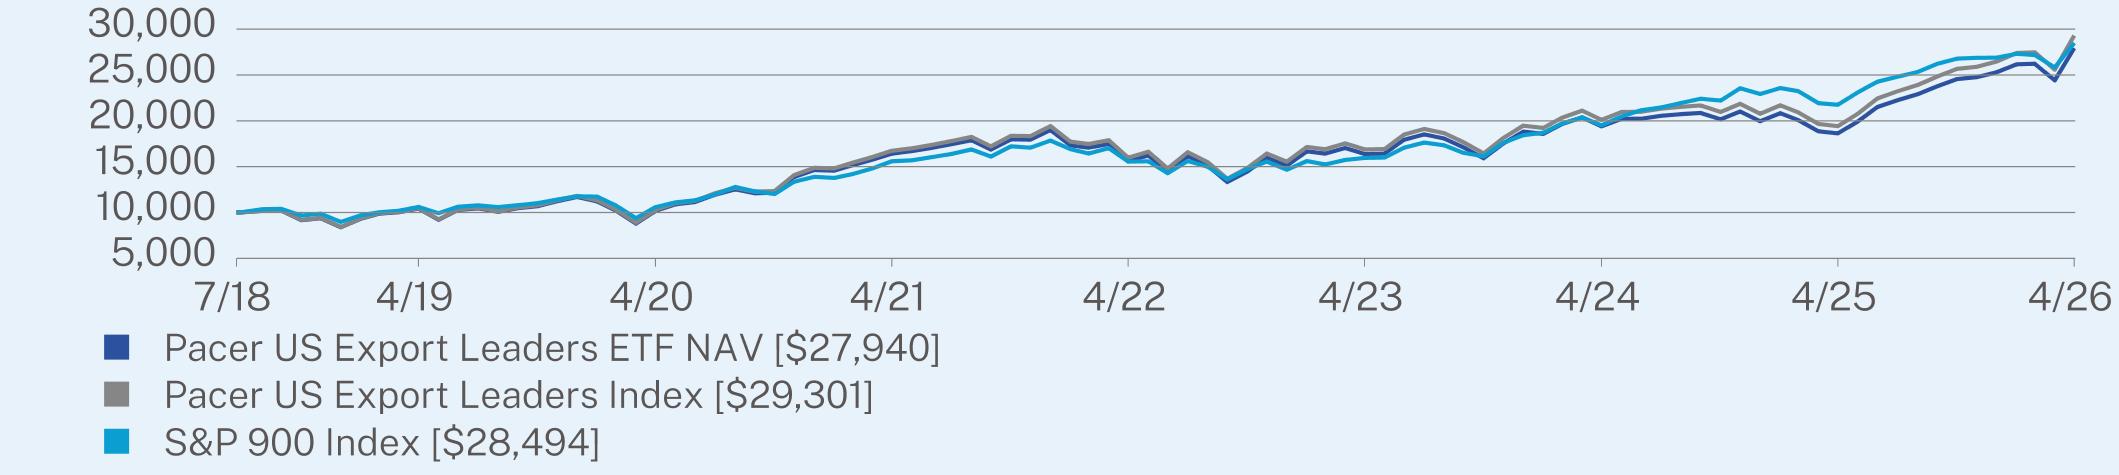
ANNUAL AVERAGE TOTAL RETURN (%)
|
|
1 Year
|
5 Year
|
Since Inception
(07/23/2018) |
|
Pacer US Export Leaders ETF NAV
|
49.94
|
11.22
|
14.14
|
|
Pacer US Export Leaders Index
|
50.89
|
11.86
|
14.84
|
|
S&P 900 Index
|
30.98
|
12.82
|
14.43
|
Visit https://www.paceretfs.com/ for more recent performance information.
KEY FUND STATISTICS (as of April 30, 2026)
|
Net Assets
|
$45,701,179
|
Portfolio Turnover
|
100%
|
|
|
Number of Holdings
|
101
|
30-Day SEC Yield
|
0.38%
|
|
|
Net Advisory Fee
|
$226,678
|
30-Day SEC Yield Unsubsidized
|
0.38%
|
WHAT DID THE FUND INVEST IN? (as of April 30, 2026)*
|
Top 10 Issuers
|
(%)
|
|
Broadcom, Inc.
|
5.7%
|
|
Alphabet, Inc.
|
5.6%
|
|
Advanced Micro Devices, Inc.
|
5.4%
|
|
Apple, Inc.
|
4.8%
|
|
Microsoft Corp.
|
4.6%
|
|
Meta Platforms, Inc.
|
4.4%
|
|
Netflix, Inc.
|
3.7%
|
|
Procter & Gamble Co.
|
3.2%
|
|
Lam Research Corp.
|
3.0%
|
|
Applied Materials, Inc.
|
2.9%
|
|
Top Sectors
|
(%)
|
|
Information Technology
|
54.1%
|
|
Communication Services
|
13.8%
|
|
Industrials
|
8.2%
|
|
Health Care
|
7.5%
|
|
Consumer Staples
|
6.3%
|
|
Consumer Discretionary
|
4.7%
|
|
Materials
|
4.2%
|
|
Energy
|
1.1%
|
|
Cash & Other
|
0.1%
|
WHAT WERE THE FUND COSTS FOR THE PAST YEAR? (based on a hypothetical $10,000 investment)
|
Fund Name
|
Costs of a $10,000 investment
|
Costs paid as a percentage of a $10,000 investment
|
|
Pacer US Large Cap Cash Cows Growth Leaders ETF
|
$53
|
0.49%
|
WHAT FACTORS INFLUENCED PERFORMANCE
Between May 1, 2025 and April 30, 2026, the Pacer US Large Cap Cash Cows Growth Leaders ETF (COWG) returned 14.9%, while its underlying index, the Pacer US Large Cap Cash Cows Growth Leaders Index, returned 15.5% over the same period. This represents an underperformance of 0.6 percentage points for the Fund. For the one-year period ended April 30, 2026, COWG’s Broad-Based Benchmark the Russell 1000 Index returned 30.4% while its Strategy Benchmark, the Russell 1000 Growth Index, returned 30.9%.
What contributed to performance
The Pacer US Large Cap Cash Cows Growth Leaders ETF benefited from exposure to profitable large-cap companies that combine strong free cash flow with above-average earnings expansion, which helped it participate in leadership across parts of the technology, healthcare, and energy sectors. During the period, investor sentiment was generally supportive of companies with durable fundamentals and visible long-term growth paths, especially those tied to semiconductors, software infrastructure, and industrial innovation. Several key holdings—particularly in chip equipment, advanced manufacturing, and select biotech names—contributed meaningfully as demand for AI infrastructure and high-end technology investment remained elevated. Broader equity risk appetite at various points also helped reinforce returns for high-quality growth companies with strong balance sheets.
The Pacer US Large Cap Cash Cows Growth Leaders ETF benefited from exposure to profitable large-cap companies that combine strong free cash flow with above-average earnings expansion, which helped it participate in leadership across parts of the technology, healthcare, and energy sectors. During the period, investor sentiment was generally supportive of companies with durable fundamentals and visible long-term growth paths, especially those tied to semiconductors, software infrastructure, and industrial innovation. Several key holdings—particularly in chip equipment, advanced manufacturing, and select biotech names—contributed meaningfully as demand for AI infrastructure and high-end technology investment remained elevated. Broader equity risk appetite at various points also helped reinforce returns for high-quality growth companies with strong balance sheets.
What detracted from performance
Performance was periodically held back when market leadership narrowed heavily toward a small cohort of mega-cap AI and momentum-driven stocks, which tended to outpace the broader set of cash-flow-screened growth names in the portfolio. Even within strong technology cycles, returns were uneven, as gains were often concentrated in a few dominant platforms rather than spread across the wider universe of profitable growers. Shifting interest rate expectations also created valuation pressure for growth equities, as higher discount rates reduced willingness to pay for longer-duration earnings streams. In addition, episodic rotations into more speculative or index-heavy growth segments reduced relative performance, since the strategy’s emphasis on cash flow discipline can lag more momentum-driven market phases.
Performance was periodically held back when market leadership narrowed heavily toward a small cohort of mega-cap AI and momentum-driven stocks, which tended to outpace the broader set of cash-flow-screened growth names in the portfolio. Even within strong technology cycles, returns were uneven, as gains were often concentrated in a few dominant platforms rather than spread across the wider universe of profitable growers. Shifting interest rate expectations also created valuation pressure for growth equities, as higher discount rates reduced willingness to pay for longer-duration earnings streams. In addition, episodic rotations into more speculative or index-heavy growth segments reduced relative performance, since the strategy’s emphasis on cash flow discipline can lag more momentum-driven market phases.
The Fund’s performance information included above is compared with a regulatory required index that represents an overall securities market (Broad-Based Benchmark) and may include one or more indexes that more closely align to the Fund’s investment strategy (Strategy Benchmark(s)) or provide a secondary point of comparison.
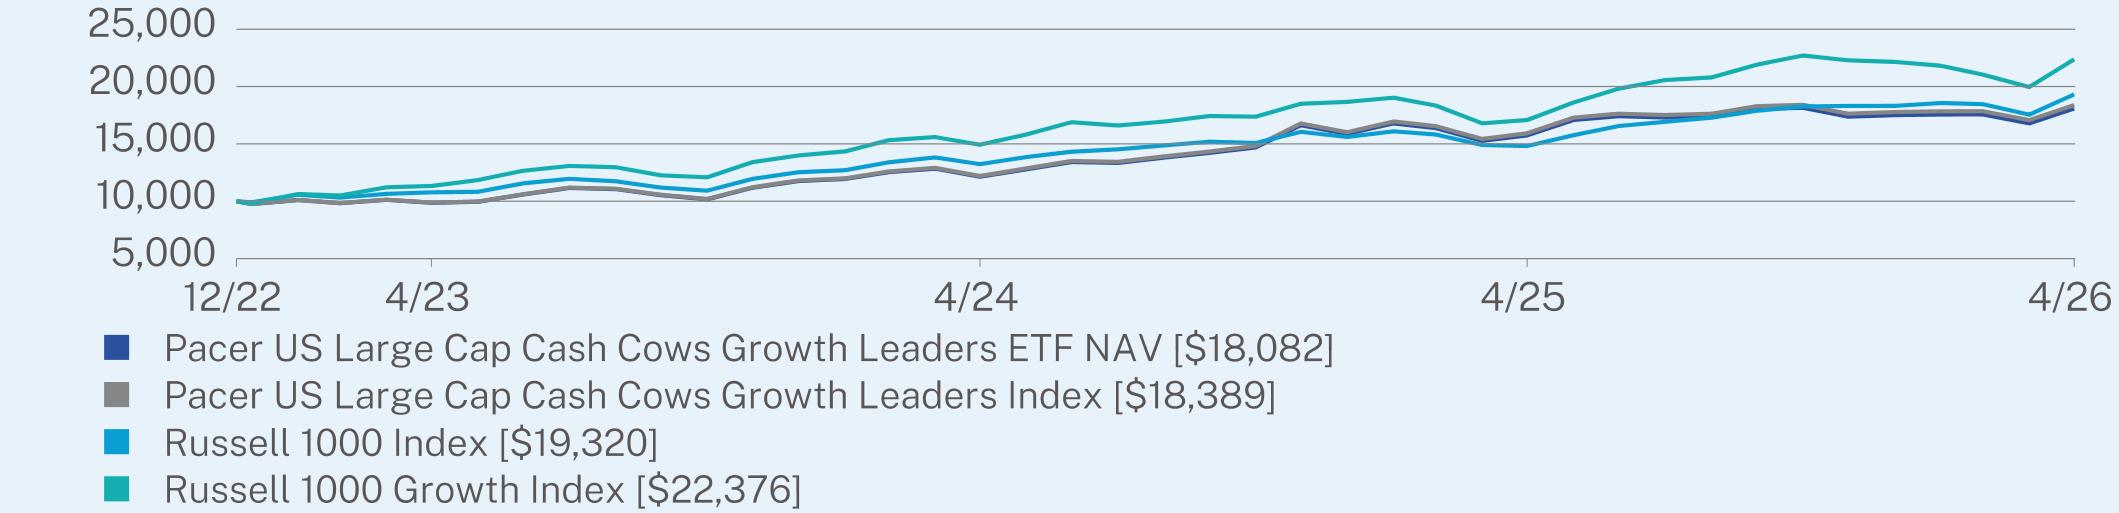
ANNUAL AVERAGE TOTAL RETURN (%)
|
|
1 Year
|
Since Inception
(12/21/2022) |
|
Pacer US Large Cap Cash Cows Growth Leaders ETF NAV
|
14.85
|
19.30
|
|
Pacer US Large Cap Cash Cows Growth Leaders Index
|
15.47
|
19.90
|
|
Russell 1000 Index
|
30.42
|
21.68
|
|
Russell 1000 Growth Index
|
30.99
|
27.12
|
Visit https://www.paceretfs.com/ for more recent performance information.
KEY FUND STATISTICS (as of April 30, 2026)
|
Net Assets
|
$2,174,849,135
|
Portfolio Turnover
|
110%
|
|
|
Number of Holdings
|
101
|
30-Day SEC Yield
|
0.54%
|
|
|
Net Advisory Fee
|
$11,128,962
|
30-Day SEC Yield Unsubsidized
|
0.54%
|
WHAT DID THE FUND INVEST IN? (as of April 30, 2026)*
|
Top 10 Issuers
|
(%)
|
|
Onto Innovation, Inc.
|
4.7%
|
|
Lam Research Corp.
|
4.4%
|
|
Southern Copper Corp.
|
3.1%
|
|
KLA Corp.
|
3.0%
|
|
United Therapeutics Corp.
|
2.5%
|
|
Monolithic Power Systems, Inc.
|
2.4%
|
|
Newmont Goldcorp Corp.
|
2.2%
|
|
Analog Devices, Inc.
|
2.1%
|
|
Jazz Pharmaceuticals PLC
|
2.0%
|
|
Texas Pacific Land Corp.
|
1.8%
|
|
Top Sectors
|
(%)
|
|
Information Technology
|
48.5%
|
|
Health Care
|
21.0%
|
|
Energy
|
8.4%
|
|
Materials
|
6.5%
|
|
Communication Services
|
5.0%
|
|
Consumer Discretionary
|
3.7%
|
|
Consumer Staples
|
2.8%
|
|
Industrials
|
2.5%
|
|
Utilities
|
1.5%
|
|
Cash & Other
|
0.1%
|
WHAT WERE THE FUND COSTS FOR THE PAST YEAR? (based on a hypothetical $10,000 investment)
|
Fund Name
|
Costs of a $10,000 investment
|
Costs paid as a percentage of a $10,000 investment
|
|
Pacer US Small Cap Cash Cows 100 ETF
|
$70
|
0.59%
|
WHAT FACTORS INFLUENCED PERFORMANCE
Between May 1, 2025 and April 30, 2026, the Pacer US Small Cap Cash Cows ETF (CALF) returned 36.5%, while its underlying index, the Pacer US Small Cap Cash Cows Index, returned 36.7% over the same period. This represents an underperformance of roughly 0.2 percentage points for the Fund. For the one-year period ended April 30, 2026, CALF’s Broad-Based Benchmark, the Russell 2000 Index, returned 44.4%, while its Strategy Benchmark, the S&P SmallCap 600 Index, returned 38.9%.
What contributed to performance
The Pacer US Small Cap Cash Cows ETF benefited from continued investor preference for profitable small-cap companies generating strong free cash flow, which helped support relative resilience versus broader small-cap benchmarks. During the period, certain cyclical sectors within the small-cap universe—such as energy, industrial services, and select technology and healthcare names—contributed positively as earnings stability improved in parts of the economy. The strategy’s emphasis on cash-generating businesses also helped differentiate it from more speculative small-cap segments, which tend to be more sensitive to funding conditions. When market sentiment broadened beyond mega-cap growth leadership, small-cap value and quality factors saw intermittent support that aided performance.
The Pacer US Small Cap Cash Cows ETF benefited from continued investor preference for profitable small-cap companies generating strong free cash flow, which helped support relative resilience versus broader small-cap benchmarks. During the period, certain cyclical sectors within the small-cap universe—such as energy, industrial services, and select technology and healthcare names—contributed positively as earnings stability improved in parts of the economy. The strategy’s emphasis on cash-generating businesses also helped differentiate it from more speculative small-cap segments, which tend to be more sensitive to funding conditions. When market sentiment broadened beyond mega-cap growth leadership, small-cap value and quality factors saw intermittent support that aided performance.
What detracted from performance
Performance was periodically constrained when interest rate expectations remained elevated or volatile, which tends to weigh more heavily on small-cap equities given their higher financing sensitivity and shorter duration cash flows. Broader market sentiment often favored large-cap technology and AI-driven leaders, leaving small caps relatively out of favor for extended stretches. In addition, risk-off phases in equity markets typically led to sharper de-risking in smaller companies, causing temporary valuation compression even when underlying fundamentals were stable. Uneven economic signals also created periodic uncertainty around demand outlooks, which limited sustained momentum in the small-cap segment compared with more dominant large-cap indexes.
Performance was periodically constrained when interest rate expectations remained elevated or volatile, which tends to weigh more heavily on small-cap equities given their higher financing sensitivity and shorter duration cash flows. Broader market sentiment often favored large-cap technology and AI-driven leaders, leaving small caps relatively out of favor for extended stretches. In addition, risk-off phases in equity markets typically led to sharper de-risking in smaller companies, causing temporary valuation compression even when underlying fundamentals were stable. Uneven economic signals also created periodic uncertainty around demand outlooks, which limited sustained momentum in the small-cap segment compared with more dominant large-cap indexes.
The Fund’s performance information included above is compared with a regulatory required index that represents an overall securities market (Broad-Based Benchmark) and may include one or more indexes that more closely align to the Fund’s investment strategy (Strategy Benchmark(s)) or provide a secondary point of comparison.
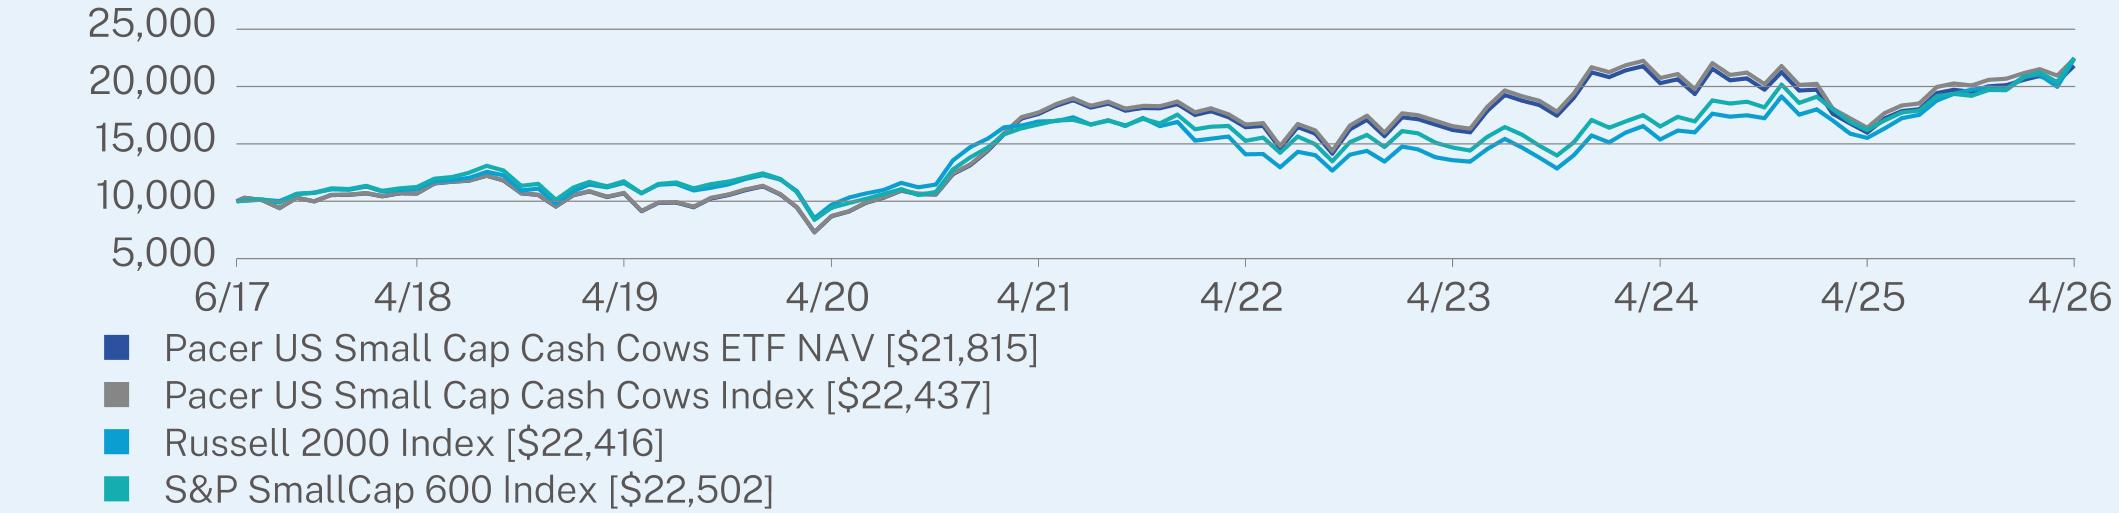
ANNUAL AVERAGE TOTAL RETURN (%)
|
|
1 Year
|
5 Year
|
Since Inception
(06/16/2017) |
|
Pacer US Small Cap Cash Cows ETF NAV
|
36.54
|
4.37
|
9.19
|
|
Pacer US Small Cap Cash Cows Index
|
36.71
|
4.81
|
9.54
|
|
Russell 2000 Index
|
44.41
|
5.75
|
9.53
|
|
S&P SmallCap 600 Index
|
38.86
|
6.15
|
9.57
|
Visit https://www.paceretfs.com/ for more recent performance information.
KEY FUND STATISTICS (as of April 30, 2026)
|
Net Assets
|
$3,439,307,494
|
Portfolio Turnover
|
130%
|
|
|
Number of Holdings
|
201
|
30-Day SEC Yield
|
0.93%
|
|
|
Net Advisory Fee
|
$22,650,703
|
30-Day SEC Yield Unsubsidized
|
0.93%
|
WHAT DID THE FUND INVEST IN? (as of April 30, 2026)*
|
Top 10 Issuers
|
(%)
|
|
Mount Vernon Liquid Assets Portfolio, LLC
|
6.0%
|
|
Zoom Communications, Inc.
|
2.4%
|
|
TD Synnex Corp.
|
2.3%
|
|
APA Corp.
|
2.2%
|
|
NetApp, Inc.
|
2.1%
|
|
Devon Energy Corp.
|
2.0%
|
|
Fox Corp.
|
2.0%
|
|
Expedia Group, Inc.
|
2.0%
|
|
GoDaddy, Inc.
|
1.9%
|
|
Omnicom Group, Inc.
|
1.8%
|
|
Top Sectors
|
(%)
|
|
Consumer Discretionary
|
29.2%
|
|
Information Technology
|
26.3%
|
|
Energy
|
10.3%
|
|
Communication Services
|
9.5%
|
|
Health Care
|
9.2%
|
|
Industrials
|
8.0%
|
|
Consumer Staples
|
4.3%
|
|
Real Estate
|
1.6%
|
|
Materials
|
1.5%
|
|
Cash & Other
|
0.1%
|
WHAT WERE THE FUND COSTS FOR THE PAST YEAR? (based on a hypothetical $10,000 investment)
|
Fund Name
|
Costs of a $10,000 investment
|
Costs paid as a percentage of a $10,000 investment
|
|
Pacer US Small Cap Cash Cows Growth Leaders ETF
|
$68
|
0.59%
|
WHAT FACTORS INFLUENCED PERFORMANCE
Between May 1, 2025 and April 30, 2026, the Pacer US Small Cap Cash Cows Growth Leaders ETF (CAFG) returned 31.5%. Over the same period, its underlying index, the Pacer US SmallCap Cash Cows Growth Leaders Index, returned 32.4%. This represents an underperformance of 0.09 percentage points for the Fund. For the one-year period ended April 30, 2026, CAFG’s Broad-Based Benchmark, the S&P Composite 1500 Index, returned 31.2%, while its Strategy Benchmark, the S&P SmallCap 600 Growth Index, returned 34.8%.
What contributed to performance
Performance for CAFG during the period was primarily driven by strong stock selection within the information technology, industrials, and consumer discretionary sectors, as companies with high free cash flow growth and improving earnings fundamentals outperformed broader small-cap growth markets. The Fund also benefited from exposure to momentum-driven small-cap equities during periods of improving investor sentiment toward risk assets. These gains were partially offset by periods of volatility in smaller capitalization growth stocks and weaker relative performance within certain healthcare holdings.
Performance for CAFG during the period was primarily driven by strong stock selection within the information technology, industrials, and consumer discretionary sectors, as companies with high free cash flow growth and improving earnings fundamentals outperformed broader small-cap growth markets. The Fund also benefited from exposure to momentum-driven small-cap equities during periods of improving investor sentiment toward risk assets. These gains were partially offset by periods of volatility in smaller capitalization growth stocks and weaker relative performance within certain healthcare holdings.
What detracted from performance
Detractors from performance for CAFG included periods of weakness in smaller capitalization growth equities amid elevated market volatility and changing interest rate expectations, which pressured valuations across portions of the small-cap growth universe. In addition, select holdings within the healthcare and consumer sectors underperformed due to earnings-related weakness and slower-than-expected growth trends, partially offsetting gains generated by the Fund’s stronger performing technology and industrial holdings.
Detractors from performance for CAFG included periods of weakness in smaller capitalization growth equities amid elevated market volatility and changing interest rate expectations, which pressured valuations across portions of the small-cap growth universe. In addition, select holdings within the healthcare and consumer sectors underperformed due to earnings-related weakness and slower-than-expected growth trends, partially offsetting gains generated by the Fund’s stronger performing technology and industrial holdings.
The Fund’s performance information included above is compared with a regulatory required index that represents an overall securities market (Broad-Based Benchmark) and may include one or more indexes that more closely align to the Fund’s investment strategy (Strategy Benchmark(s)) or provide a secondary point of comparison.
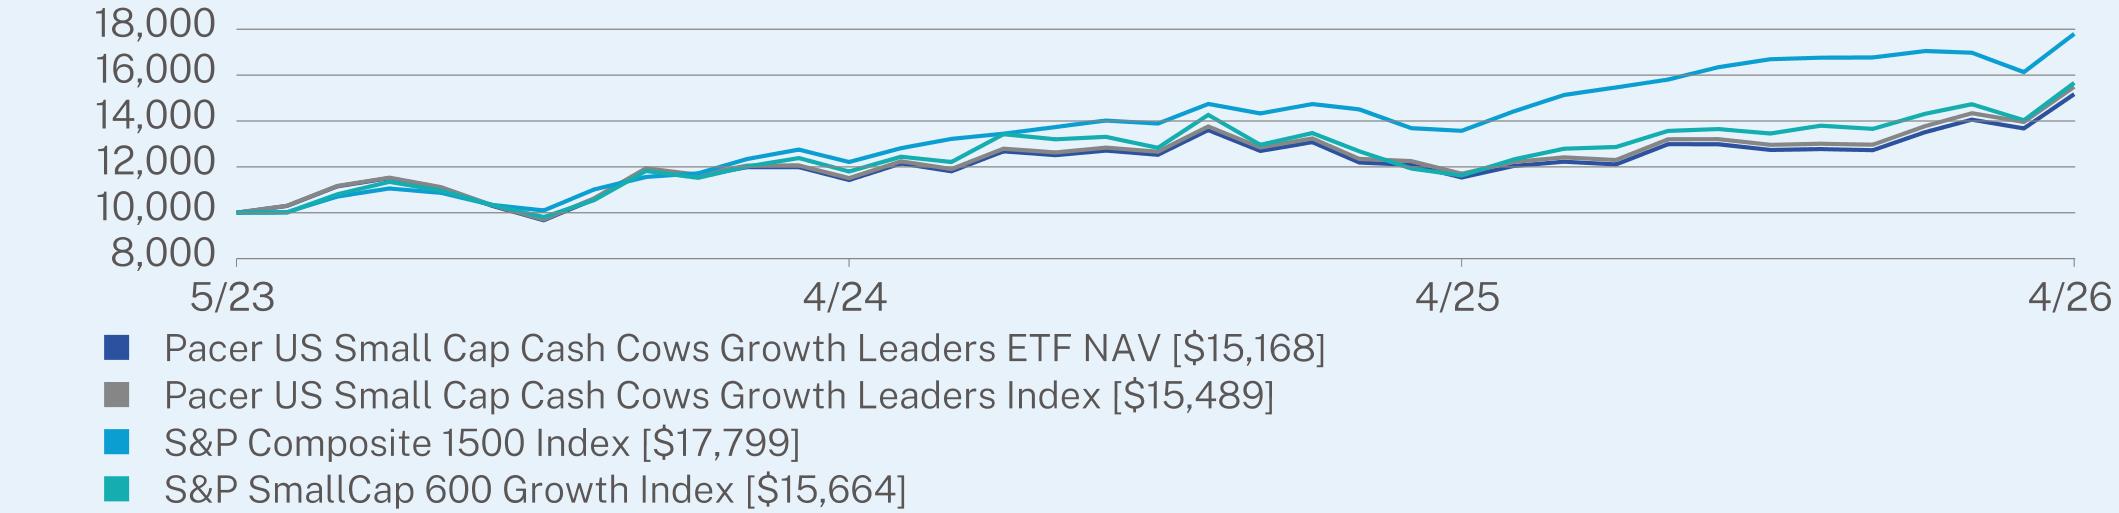
ANNUAL AVERAGE TOTAL RETURN (%)
|
|
1 Year
|
Since Inception
(05/01/2023) |
|
Pacer US Small Cap Cash Cows Growth Leaders ETF NAV
|
31.51
|
14.90
|
|
Pacer US SmallCap Cash Cows Growth Leaders Index
|
32.41
|
15.70
|
|
S&P Composite 1500 Index
|
31.17
|
21.19
|
|
S&P SmallCap 600 Growth Index
|
34.79
|
16.14
|
Visit https://www.paceretfs.com/ for more recent performance information.
KEY FUND STATISTICS (as of April 30, 2026)
|
Net Assets
|
$22,672,449
|
Portfolio Turnover
|
125%
|
|
|
Number of Holdings
|
102
|
30-Day SEC Yield
|
0.07%
|
|
|
Net Advisory Fee
|
$112,135
|
30-Day SEC Yield Unsubsidized
|
0.07%
|
WHAT DID THE FUND INVEST IN? (as of April 30, 2026)*
|
Top 10 Issuers
|
(%)
|
|
Mount Vernon Liquid Assets Portfolio, LLC
|
18.7%
|
|
Powell Industries, Inc.
|
5.0%
|
|
Argan, Inc.
|
4.4%
|
|
DigitalOcean Holdings, Inc.
|
3.4%
|
|
Krystal Biotech, Inc.
|
2.9%
|
|
Kodiak Gas Services, Inc.
|
2.4%
|
|
Innovex International, Inc.
|
2.2%
|
|
Adeia, Inc.
|
2.2%
|
|
Protagonist Therapeutics, Inc.
|
2.1%
|
|
ESCO Technologies, Inc.
|
1.9%
|
|
Top Sectors
|
(%)
|
|
Information Technology
|
28.5%
|
|
Industrials
|
23.1%
|
|
Health Care
|
18.8%
|
|
Energy
|
13.5%
|
|
Consumer Discretionary
|
7.2%
|
|
Communication Services
|
4.2%
|
|
Materials
|
2.4%
|
|
Utilities
|
1.4%
|
|
Consumer Staples
|
0.9%
|
|
Cash & Other
|
0.0%
|
WHAT WERE THE FUND COSTS FOR THE PAST YEAR? (based on a hypothetical $10,000 investment)
|
Fund Name
|
Costs of a $10,000 investment
|
Costs paid as a percentage of a $10,000 investment
|
|
Pacer WealthShield ETF
|
$62
|
0.60%
|
WHAT FACTORS INFLUENCED PERFORMANCE
Between May 1, 2025 and April 30, 2026, the Pacer WealthShield ETF (PWS) returned 5.6%, while its underlying index, the Pacer WealthShield Index, returned 5.8% over the same period. This represents an underperformance of 0.2 percentage points for the Fund. For the one-year period ended April 30, 2026, PWS’s Broad-Based Benchmark, the S&P 500 Index, returned 31.1%, while its secondary index, the, the S&P U.S. Treasury Bond 20+ Year Total Return Index returned 0.3%.
What contributed to performance
The Pacer WealthShield ETF benefited primarily during periods of sustained equity strength, when its rules-based model allocated more heavily toward U.S. stocks rather than defensive fixed income. In those environments, exposure to large-cap leaders—particularly technology and high-quality growth names—helped drive returns, as equities delivered the dominant share of risk-on gains. The strategy also added value when market trends were stable and credit conditions improved, allowing the model to remain invested in equities rather than frequently shifting into Treasuries. Its systematic approach helped it participate in upside phases while still targeting segments of the market with relatively strong momentum characteristics.
What detracted from performance
Performance was most challenged during volatile or directionless markets, when frequent shifts between equity exposure and defensive allocations reduced consistency. In these environments, the strategy’s monthly signal updates sometimes lagged rapid changes in sentiment, leading to whipsaw effects where exposure adjustments occurred after market moves had already reversed. Periods of elevated interest-rate uncertainty also weighed on returns, as transitions between stocks and Treasuries became less additive when both asset classes experienced sharp swings. Additionally, when equity leadership was narrowly concentrated in a handful of mega-cap growth names, the diversified, rule-based allocation could under-capture peak performance relative to more concentrated benchmarks
The Fund’s performance information included above is compared with a regulatory required index that represents an overall securities market (Broad-Based Benchmark) and may include one or more indexes that more closely align to the Fund’s investment strategy (Strategy Benchmark(s)) or provide a secondary point of comparison.
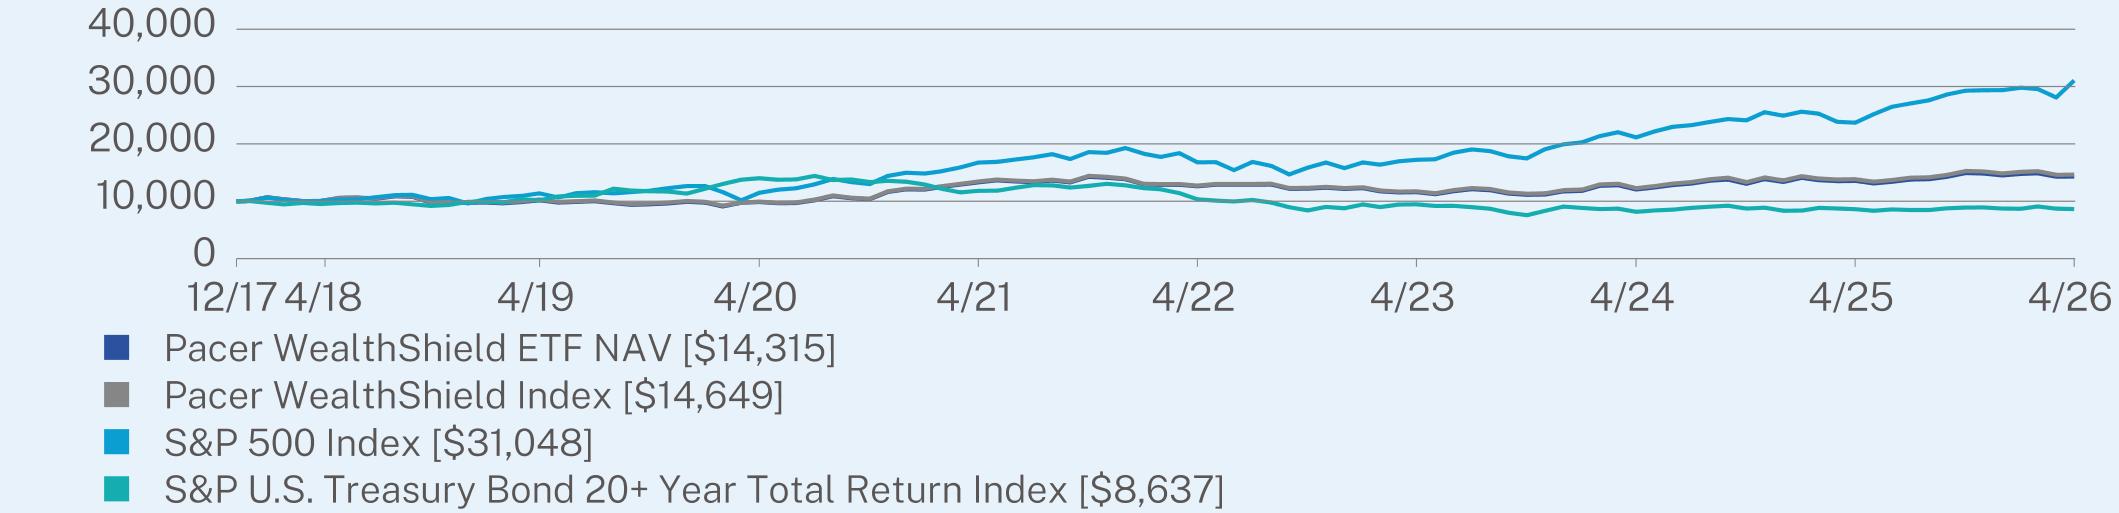
ANNUAL AVERAGE TOTAL RETURN (%)
|
|
1 Year
|
5 Year
|
Since Inception
(12/11/2017) |
|
Pacer WealthShield ETF NAV
|
5.63
|
1.47
|
4.37
|
|
Pacer WealthShield Index
|
5.83
|
1.72
|
4.66
|
|
S&P 500 Index
|
31.05
|
13.14
|
14.47
|
|
S&P U.S. Treasury Bond 20+ Year Total Return Index
|
0.31
|
-6.09
|
-1.73
|
Visit https://www.paceretfs.com/ for more recent performance information.
KEY FUND STATISTICS (as of April 30, 2026)
|
Net Assets
|
$30,455,788
|
Portfolio Turnover
|
664%
|
|
|
Number of Holdings
|
233
|
30-Day SEC Yield
|
2.93%
|
|
|
Net Advisory Fee
|
$172,767
|
30-Day SEC Yield Unsubsidized
|
2.93%
|
WHAT DID THE FUND INVEST IN? (as of April 30, 2026)*
|
Top 10 Issuers
|
(%)
|
|
United States Treasury Bill
|
15.9%
|
|
Exxon Mobil Corp.
|
6.1%
|
|
Linde PLC
|
3.9%
|
|
Walmart, Inc.
|
3.8%
|
|
Chevron Corp.
|
3.4%
|
|
Costco Wholesale Corp.
|
3.0%
|
|
Procter & Gamble Co.
|
2.3%
|
|
Coca-Cola Co.
|
2.0%
|
|
Newmont Goldcorp Corp.
|
2.0%
|
|
Philip Morris International, Inc.
|
1.7%
|
|
Top Sectors
|
(%)
|
|
Energy
|
20.5%
|
|
Consumer Staples
|
20.1%
|
|
Health Care
|
19.9%
|
|
Materials
|
19.9%
|
|
Cash & Other
|
19.6%
|
| [1] |
|
||
| [2] |
|
||
| [3] |
|
||
| [4] |
|
||
| [5] |
|
||
| [6] |
|
||
| [7] |
|
||
| [8] |
|
||
| [9] |
|
||
| [10] |
|
||
| [11] |
|
||
| [12] |
|
||
| [13] |
|
||
| [14] |
|
||
| [15] |
|
||
| [16] |
|
||
| [17] |
|
||
| [18] |
|
||
| [19] |
|
||
| [20] |
|
||
| [21] |
|
||
| [22] |
|
||
| [23] |
|
||
| [24] |
|
||
| [25] |
|
||
| [26] |
|
||
| [27] |
|
||
| [28] |
|
||
| [29] |
|
||
| [30] |
|
||
| [31] |
|
||
| [32] |
|
||
| [33] |
|