Pay Versus Performance Disclosure
The following table and supporting graphics present information relating to executive compensation and financial performance measures for the fiscal years ended March 31, 2026, 2025, 2024, 2023 and 2022 in satisfaction of Item 402(v) of Regulation S-K. Please see the “Compensation Discussion and Analysis” section for an overview of the Company’s compensation programs.
|
(2) |
||||||||||||||||||||||||||||||||
|
Average |
Average |
|||||||||||||||||||||||||||||||
|
Summary |
Summary |
|||||||||||||||||||||||||||||||
|
Compensation |
Compensation |
Value of Initial Fixed |
||||||||||||||||||||||||||||||
|
Table |
Actually |
$100 Investment Based On: |
||||||||||||||||||||||||||||||
|
Summary |
(2) |
Total for |
Paid to |
Peer |
||||||||||||||||||||||||||||
|
Compensation |
Compensation |
Non-PEO |
Non-PEO |
Company |
Group |
(4) |
(5) |
|||||||||||||||||||||||||
|
(1) |
Table |
Actually |
Named |
Named |
Total |
Total |
Net |
Return on |
||||||||||||||||||||||||
|
Fiscal |
Total for |
Paid to |
Executive |
Executive |
Shareholder |
Shareholder |
Income |
Invested |
||||||||||||||||||||||||
|
Year |
PEO |
PEO |
Officers |
Officers |
Return |
Return (3) |
($ in 000s) |
Capital % |
||||||||||||||||||||||||
|
2026 |
$ | 1,304,968 | $ | 1,225,475 | $ | 609,486 | $ | 603,267 | $ | 320.92 | $ | 93.21 | $ | 114,674 | 9.18 | % | ||||||||||||||||
|
2025 |
$ | 1,012,423 | $ | 950,033 | $ | 485,466 | $ | 474,495 | $ | 189.08 | $ | 108.97 | $ | 41,224 | 7.62 | % | ||||||||||||||||
|
2024 |
$ | 1,195,063 | $ | 1,135,160 | $ | 561,482 | $ | 534,022 | $ | 120.83 | $ | 112.76 | $ | 63,318 | 8.44 | % | ||||||||||||||||
|
2023 |
$ | 1,132,606 | $ | 1,171,347 | $ | 539,468 | $ | 555,777 | $ | 111.00 | $ | 121.15 | $ | 9,231 | 11.43 | % | ||||||||||||||||
|
2022 |
$ | 997,908 | $ | 1,016,603 | $ | 458,274 | $ | 460,107 | $ | 109.45 | $ | 110.25 | $ | 46,200 | 10.25 | % | ||||||||||||||||
|
(1) |
The named executive officers included in the pay versus performance disclosure were: |
|
Year |
Principal Executive Officer (PEO) |
Non-PEO Named Executive Officers |
||
|
2026 |
Paul L. Palmby |
Michael S. Wolcott, Timothy R. Nelson, Dean E. Erstad |
||
|
2025 |
Paul L. Palmby |
Michael S. Wolcott, Timothy R. Nelson, Dean E. Erstad |
||
|
2024 |
Paul L. Palmby |
Michael S. Wolcott, Timothy R. Nelson, Dean E. Erstad |
||
|
2023 |
Paul L. Palmby |
Timothy J. Benjamin, Timothy R. Nelson, Dean E. Erstad |
||
|
2022 |
Paul L. Palmby |
Timothy J. Benjamin, Timothy R. Nelson |
|
(2) |
The amounts shown for Compensation Actually Paid have been calculated in accordance with Item 402(v) of Regulation S-K and applicable SEC guidance, and do not reflect compensation actually earned, realized, or received by the Company’s NEOs. For fiscal year 2026, Compensation Actually Paid reflects the exclusions and inclusions of certain amounts for the PEO and the Non-PEO NEOs as set forth below. (Please note that, while similar adjustment information was provided in our 2025 proxy statement for fiscal year 2025, in our 2024 proxy statement for fiscal year 2024, and in our 2023 proxy statement for fiscal years 2023 and 2022, respectively, under applicable SEC guidance, repeating such adjustment information is not required in this proxy statement because it is not material to our stockholders' understanding of the information reported in the Pay Versus Performance table for fiscal year 2026 or the relationship disclosures provided below): |
|
2026 |
||||||||
|
Adjustments |
PEO |
Other NEOs |
||||||
|
Summary Compensation Table (SCT) Total |
$ | 1,304,968 | $ | 609,486 | ||||
|
(Deduct): Change in actuarial present value of pension benefits |
(81,139 | ) | (60,433 | ) | ||||
|
Add: Service cost of pension benefits (6) |
- | 20,454 | ||||||
|
(Deduct): SCT "Stock Awards" column value |
- | (25,000 | ) | |||||
|
Add: Covered Year-end fair value of outstanding equity awards granted in Covered Year |
- | 36,722 | ||||||
|
Add/(deduct): Change in fair value (from prior year-end to Covered Year-end) of equity awards outstanding at Covered Year-end that were granted in prior years |
- | 16,296 | ||||||
|
Add/(deduct): Change in fair value (from prior year-end to vest date in Covered Year) of prior year equity awards vested in Covered Year |
1,646 | 5,742 | ||||||
|
Compensation Actually Paid Total |
$ | 1,225,475 | $ | 603,267 | ||||
|
(3) |
The peer group used in this disclosure is the S&P Packaged Foods & Meats Index, which is the same peer group used in the stock performance graph contained within our 2026 Annual Report to Shareholders. |
|
(4) |
Net income as reported in our Consolidated Statements of Net Earnings in our 2026 Annual Report to Shareholders. |
|
(5) |
Return on Invested Capital was determined to be the most important financial performance measure linking “compensation actually paid” to our company’s performance for fiscal year 2026 and therefore was selected as the fiscal year 2026 “company selected measure” as defined in Item 402(v). Refer to the subsection “Executive Profit Sharing Bonus Plan” within the “Compensation Discussion and Analysis” section of this proxy statement for a full definition of Return on Invested Capital. Prior to fiscal year 2026, the “company selected measure” was Annual Adjusted Earnings. In accordance with applicable SEC rules, the Company has provided Return on Invested Capital within the disclosure table for fiscal years 2022 through 2025 for comparability purposes. |
|
(6) |
For fiscal year 2026, the PEO does not have a service cost of pension benefits because he has reached his maximum years of credited service under the Pension Plan. |
|
(2) |
The amounts shown for Compensation Actually Paid have been calculated in accordance with Item 402(v) of Regulation S-K and applicable SEC guidance, and do not reflect compensation actually earned, realized, or received by the Company’s NEOs. For fiscal year 2026, Compensation Actually Paid reflects the exclusions and inclusions of certain amounts for the PEO and the Non-PEO NEOs as set forth below. (Please note that, while similar adjustment information was provided in our 2025 proxy statement for fiscal year 2025, in our 2024 proxy statement for fiscal year 2024, and in our 2023 proxy statement for fiscal years 2023 and 2022, respectively, under applicable SEC guidance, repeating such adjustment information is not required in this proxy statement because it is not material to our stockholders' understanding of the information reported in the Pay Versus Performance table for fiscal year 2026 or the relationship disclosures provided below): |
|
2026 |
||||||||
|
Adjustments |
PEO |
Other NEOs |
||||||
|
Summary Compensation Table (SCT) Total |
$ | 1,304,968 | $ | 609,486 | ||||
|
(Deduct): Change in actuarial present value of pension benefits |
(81,139 | ) | (60,433 | ) | ||||
|
Add: Service cost of pension benefits (6) |
- | 20,454 | ||||||
|
(Deduct): SCT "Stock Awards" column value |
- | (25,000 | ) | |||||
|
Add: Covered Year-end fair value of outstanding equity awards granted in Covered Year |
- | 36,722 | ||||||
|
Add/(deduct): Change in fair value (from prior year-end to Covered Year-end) of equity awards outstanding at Covered Year-end that were granted in prior years |
- | 16,296 | ||||||
|
Add/(deduct): Change in fair value (from prior year-end to vest date in Covered Year) of prior year equity awards vested in Covered Year |
1,646 | 5,742 | ||||||
|
Compensation Actually Paid Total |
$ | 1,225,475 | $ | 603,267 | ||||
|
(3) |
The peer group used in this disclosure is the S&P Packaged Foods & Meats Index, which is the same peer group used in the stock performance graph contained within our 2026 Annual Report to Shareholders. |
|
(4) |
Net income as reported in our Consolidated Statements of Net Earnings in our 2026 Annual Report to Shareholders. |
|
(5) |
Return on Invested Capital was determined to be the most important financial performance measure linking “compensation actually paid” to our company’s performance for fiscal year 2026 and therefore was selected as the fiscal year 2026 “company selected measure” as defined in Item 402(v). Refer to the subsection “Executive Profit Sharing Bonus Plan” within the “Compensation Discussion and Analysis” section of this proxy statement for a full definition of Return on Invested Capital. Prior to fiscal year 2026, the “company selected measure” was Annual Adjusted Earnings. In accordance with applicable SEC rules, the Company has provided Return on Invested Capital within the disclosure table for fiscal years 2022 through 2025 for comparability purposes. |
|
(6) |
For fiscal year 2026, the PEO does not have a service cost of pension benefits because he has reached his maximum years of credited service under the Pension Plan. |
The following charts provide (1) a comparison between our cumulative total shareholder return and the cumulative total shareholder return of the Peer Group, and (2) illustrations of the relationships between (A) the executive compensation actually paid to the PEO and the average of the executive compensation actually paid to our non-PEO named executive officers (in each case as set forth in the pay for performance table above) and (B) each of the performance measures set forth in the pay versus performance table above (net income and return on invested capital).
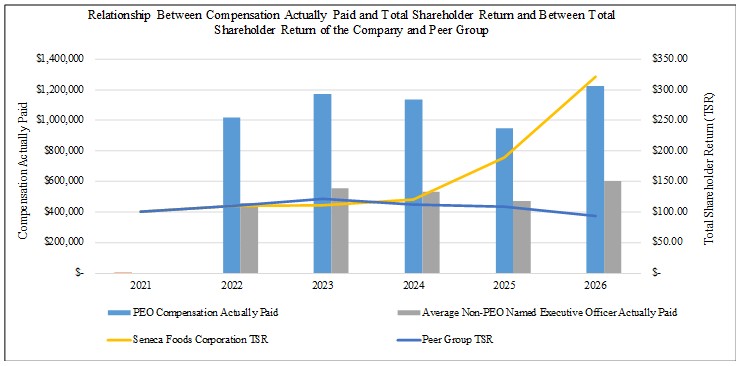
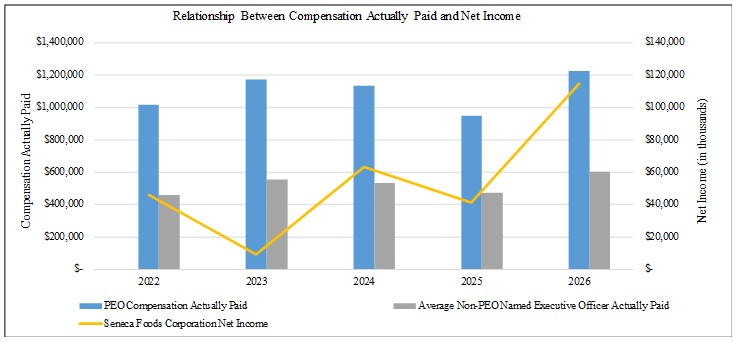
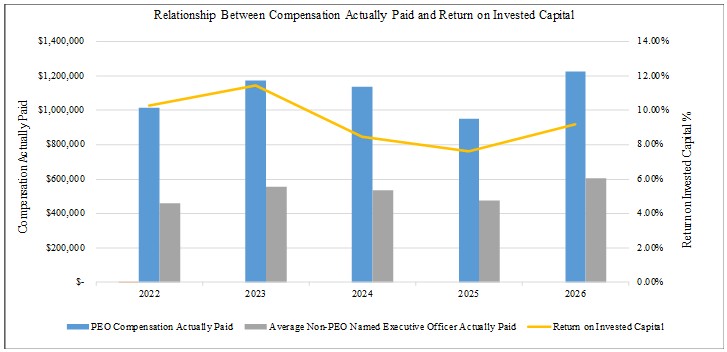
As shown above, the Company has selected Return on Invested Capital (“ROIC”) as the company-selected measure for the pay versus performance disclosure as we believe it represents the most important financial performance measure used to link compensation actually paid to the named executive officers in 2026 to the Company’s performance. ROIC is the performance measure used to determine 2026 annual cash incentive award payouts. The correlation between compensation actually paid and ROIC differs when comparing compensation actually paid and net income as reported on a GAAP basis primarily due to the large non-cash Last-In, First-Out (“LIFO”) credits and charges experienced by the Company in fiscal years 2026, 2025, 2024, 2023 and 2022 as a result of valuing inventory on a LIFO basis. The ROIC calculation excludes the LIFO impact and the associated LIFO reserve.