Pay vs Performance Disclosure - USD ($)
|
12 Months Ended |
Mar. 31, 2026 |
Mar. 31, 2025 |
Mar. 31, 2024 |
Mar. 31, 2023 |
| Pay vs Performance Disclosure |
|
|
|
|
| Pay vs Performance Disclosure, Table |
| | | | | | | | | | | | | | | | | | | | | | | | | | | | | | | | | | | | | | | | | | | | | | | | | | | | | | | | | | | | | | | | Value of Initial Fixed
$100 Investment Based On: | | | | | | | | | | | | | | | | | | | | | | | | | | | | | | | | | | Year | Summary Compensation Table Total for PEO(1)(2) ($) | Compensation Actually Paid to PEO(3) ($) | Average Summary Compensation Table Total for Non-PEO NEOs(1)(2) ($) | Average Compensation Actually Paid to Non-PEO NEOs(3) ($) | | | Total Stockholder Return(4) ($) | Peer Group Total Stockholder Return(5) ($) | | Net Income(6) ($) | Revenue(7)(8) ($) | | | | | | | | | | | | | | | | | (a) | (b) | (c) | (d) | (e) | | | (f) | (g) | | (h) | (i) | | | | | | | | | | | | | | | | | FY2026 | 22,204,244 | | 64,419,952 | | 9,011,785 | | 26,695,632 | | | | 396 | | 132 | | | 585,883,000 | | 3,559,390,000 | | | | FY2025 | 20,097,412 | | 34,592,657 | | 9,109,211 | | 14,300,511 | | | | 138 | | 100 | | | 517,246,000 | | 2,959,197,000 | | | | FY2024 | 20,725,590 | | 22,608,078 | | 8,207,944 | | 9,103,237 | | | | 185 | | 97 | | | 496,215,000 | | 2,499,841,000 | | | | FY2023 | 9,178,856 | | 12,042,936 | | 4,592,852 | | 5,630,395 | | | | 119 | | 99 | | | 121,333,000 | | 1,907,137,000 | | |
|
|
|
|
| Company Selected Measure Name |
Revenue
|
|
|
|
| Named Executive Officers, Footnote |
Our non-PEO NEOs in FY25 included Charles Boynton, Howard Wenger, Bruce Ledesma, Nicholas (Marco) Miller and David Bennett. Our non-PEO NEOs in FY24 included Charles Boynton, Howard Wenger, Bruce Ledesma, Nicholas (Marco) Miller, Léah Schlesinger and David Bennett.
|
|
|
|
| PEO Total Compensation Amount |
$ 22,204,244
|
$ 20,097,412
|
$ 20,725,590
|
$ 9,178,856
|
| PEO Actually Paid Compensation Amount |
$ 64,419,952
|
34,592,657
|
22,608,078
|
12,042,936
|
| Adjustment To PEO Compensation, Footnote |
Compensation for our PEO reflects the amounts reported in the “Summary Compensation Table” for the respective years. Our PEO for all fiscal years shown was Daniel Shugar.CAP for the PEO and average CAP for our non-PEO NEOs in FY26 reflects the respective amounts set forth in columns (b) and (d), adjusted as follows in the table below, as determined in accordance with SEC rules. These dollar amounts do not reflect the actual amount of compensation earned by or paid to the PEO and our other NEOs during the applicable year. The amounts reflected in the table below for the year-over-year change in fair value of equity awards granted to our NEOs in FY26. | | | | | | | | | | | | | | | | | | | | | | PEO
FY26
($) | Non-PEOs
FY26
($) | | | | | | | | Summary Compensation Table Total | 22,204,244 | | 9,011,785 | | | | Less Stock Award Value Reported in Summary Compensation Table for the Covered Year | (19,442,288) | | (7,746,922) | | | | Plus Fair Value for Awards Granted in the Covered Year | 16,879,470 | | 6,684,436 | | | | Change in Fair Value of Outstanding Unvested Awards from Prior Years | 18,318,201 | | 8,168,923 | | | | Change in Fair Value of Awards from Prior Years that Vested in the Covered Year | 26,460,325 | | 10,577,410 | | | | Less Fair Value of Awards Forfeited during the Covered Year | — | | — | | | | Plus Fair Value of Incremental Dividends or Earnings Paid on Stock Awards | — | | — | | | | Compensation Actually Paid | 64,419,952 | | 26,695,632 | | |
|
|
|
|
| Non-PEO NEO Average Total Compensation Amount |
$ 9,011,785
|
9,109,211
|
8,207,944
|
4,592,852
|
| Non-PEO NEO Average Compensation Actually Paid Amount |
$ 26,695,632
|
14,300,511
|
9,103,237
|
5,630,395
|
| Adjustment to Non-PEO NEO Compensation Footnote |
CAP for the PEO and average CAP for our non-PEO NEOs in FY26 reflects the respective amounts set forth in columns (b) and (d), adjusted as follows in the table below, as determined in accordance with SEC rules. These dollar amounts do not reflect the actual amount of compensation earned by or paid to the PEO and our other NEOs during the applicable year. The amounts reflected in the table below for the year-over-year change in fair value of equity awards granted to our NEOs in FY26. | | | | | | | | | | | | | | | | | | | | | | PEO
FY26
($) | Non-PEOs
FY26
($) | | | | | | | | Summary Compensation Table Total | 22,204,244 | | 9,011,785 | | | | Less Stock Award Value Reported in Summary Compensation Table for the Covered Year | (19,442,288) | | (7,746,922) | | | | Plus Fair Value for Awards Granted in the Covered Year | 16,879,470 | | 6,684,436 | | | | Change in Fair Value of Outstanding Unvested Awards from Prior Years | 18,318,201 | | 8,168,923 | | | | Change in Fair Value of Awards from Prior Years that Vested in the Covered Year | 26,460,325 | | 10,577,410 | | | | Less Fair Value of Awards Forfeited during the Covered Year | — | | — | | | | Plus Fair Value of Incremental Dividends or Earnings Paid on Stock Awards | — | | — | | | | Compensation Actually Paid | 64,419,952 | | 26,695,632 | | |
|
|
|
|
| Compensation Actually Paid vs. Total Shareholder Return |
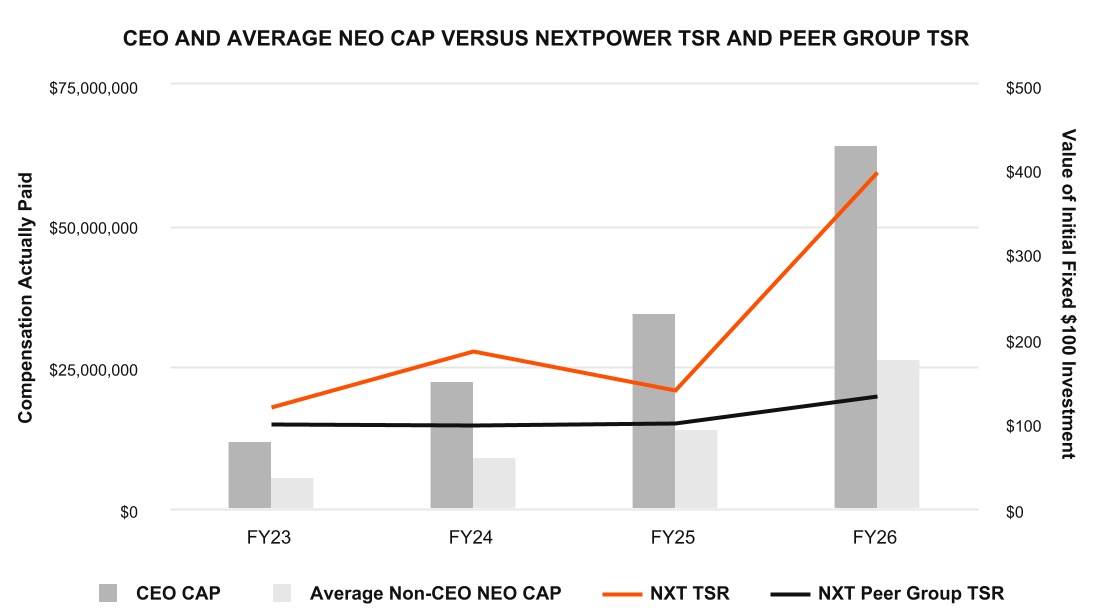
Compensation Actually Paid Versus TSR Versus Peer Group TSR The following graph shows how the amount of compensation actually paid to our PEO and the average amount of compensation actually paid to our other NEOs compared with our cumulative TSR and the cumulative TSR of our peer group over the covered fiscal years. For additional details regarding how TSR was utilized under our FY26 LTIP to link pay with performance, please refer to Compensation Discussion and Analysis—Compensation—Setting Process and FY26 Executive Compensation—Long-Term Incentive Plan of this Proxy Statement.
|
|
|
|
| Compensation Actually Paid vs. Net Income |
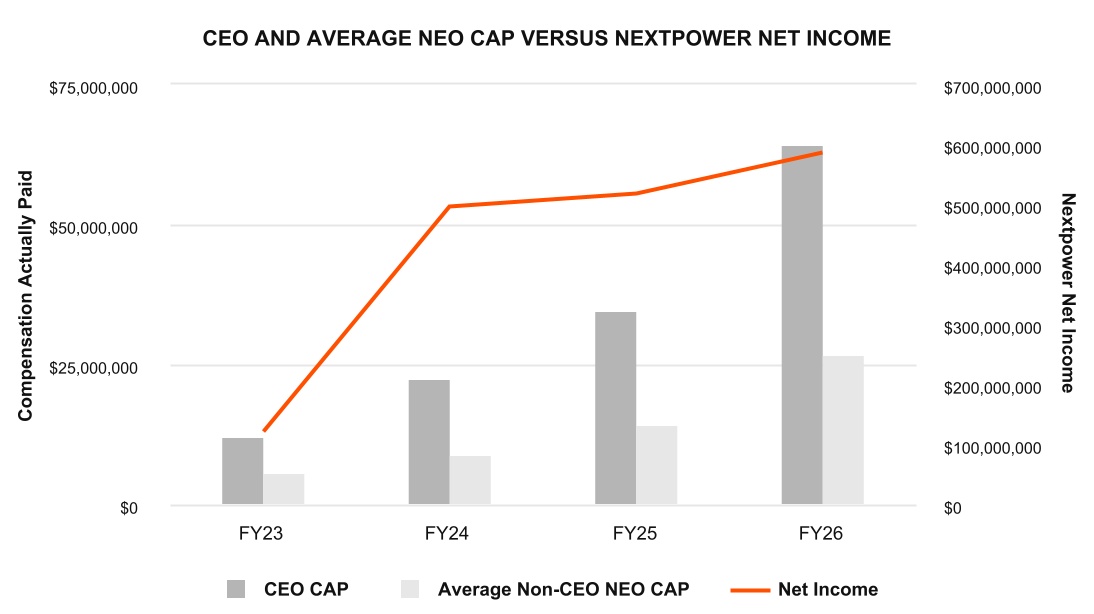
Compensation Actually Paid Versus Net Income The following graph shows how the amount of compensation actually paid to our PEO and the average amount of compensation actually paid to our other NEOs compared with our Net Income over the covered fiscal years.
|
|
|
|
| Compensation Actually Paid vs. Company Selected Measure |
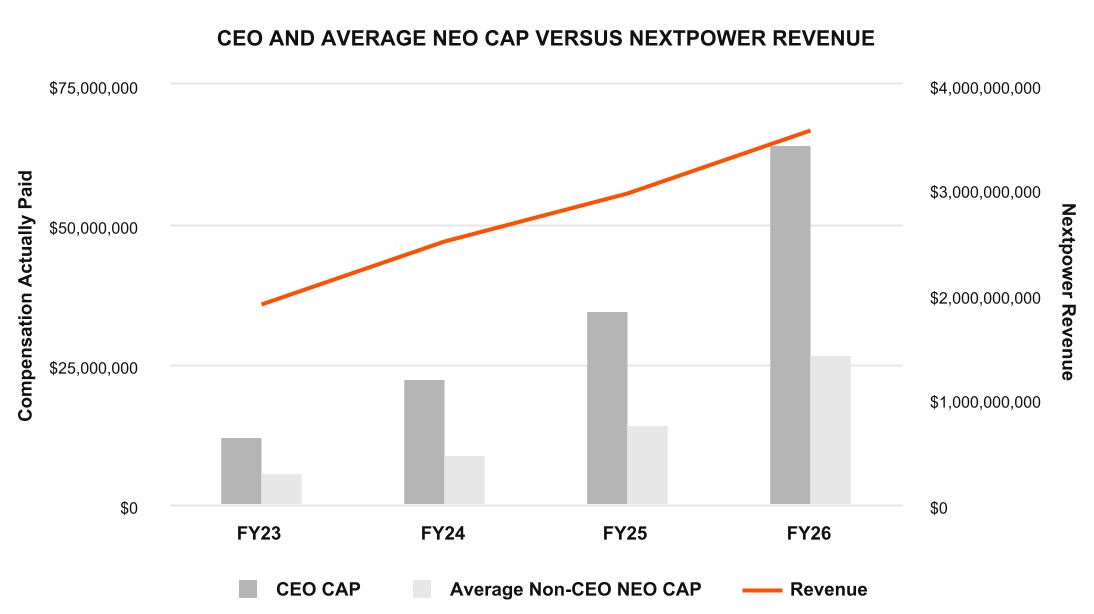
Compensation Actually Paid Versus Revenue The following graph shows how the amount of compensation actually paid to our PEO and the average amount of compensation actually paid to our other NEOs compared with our revenue over the covered fiscal years. For additional details regarding how revenue was utilized under our FY26 compensation program to link pay with performance, please refer to Compensation Discussion and Analysis—Compensation—Setting Process and FY26 Executive Compensation of this Proxy Statement.
|
|
|
|
| Tabular List, Table |
The following table sets forth an unranked list of the financial performance measures that we view as the “most important” measures for linking our NEOs’ compensation to performance. For more information on the financial performance metrics that are listed below and how they are utilized in our compensation program, please see the section titled “Compensation Discussion and Analysis”. | | | | Performance Measures | | Revenue | Adjusted EBITDA* | | Adjusted diluted EPS | Adjusted free cash flow* |
|
|
|
|
| Total Shareholder Return Amount |
$ 396
|
138
|
185
|
119
|
| Peer Group Total Shareholder Return Amount |
132
|
100
|
97
|
99
|
| Net Income (Loss) |
$ 585,883,000
|
$ 517,246,000
|
$ 496,215,000
|
$ 121,333,000
|
| Company Selected Measure Amount |
3,559,390,000
|
2,959,197,000
|
2,499,841,000
|
1,907,137,000
|
| Additional 402(v) Disclosure |
Total Stockholder Return (TSR) is cumulative for the measurement periods beginning on the effective date of our IPO on February 9, 2023 and ending on each of March 31, 2023, March 31, 2024, March 31, 2025 and March 31, 2026, respectively, calculated in accordance with Item 201(e) of Regulation S-K. The Peer Group for purposes of this table is the same as our Peer Group as determined under Item 201(e) of Regulation S-K and described in the section titled “Stock Performance Graph.”Based on the advice of Meridian, a thorough review of the benchmarking Peer Group was conducted in FY26. Based on that review, our Peer Group was updated to include the following companies: Array Technologies, Inc.; Dropbox, Inc.; EnerSys; Enphase Energy, Inc.; F5, Inc.; First Solar, Inc.; Fluence Energy, Inc.; Juniper Networks, Inc.; Keysight Technologies, Inc.; Logitech International, S.A.; NetApp, Inc.; nVent Electric plc; Okta, Inc.; Pure Storage, Inc.; Resideo Technologies, Inc.; Skyworks Solutions, Inc.; SolarEdge Technologies, Inc.; Sunnova Energy International Inc.; Sunrun Inc. and Trimble Inc. If no changes were made to the historical compensation benchmarking consisting of the following companies: Advanced Energy Industries, Inc.; Arcosa, Inc.; Array Technologies, Inc.; EnerSys; First Solar, Inc.; Generac Holdings Inc.; Gibraltar Industries, Inc.; Itron, Inc.; Littelfuse, Inc.; MKS Instruments, Inc.; Shoals Technologies Group, Inc.; SolarEdge Technologies, Inc.; SunPower Corporation; Sunrun Inc.; and Wolfspeed, Inc., the value of a $100 investment made on 2/9/2023 would be as follows: | | | | | | | | | | | | | | | | | | | | | Year End | Nextpower
($) | Historical
Compensation
Peer Group
($) | | | | | | | | 2026 | 396 | 141 | | | 2025 | 138 | 74 | | | 2024 | 185 | 81 | | | 2023 | 106 | 102 | |
* “Adjusted EBITDA,” “Adjusted diluted EPS” and “adjusted free cash flow” are non-GAAP metrics. See Appendix A of this Proxy Statement for definitions of adjusted EBITDA (with respect to the adjusted EBITDA performance metric), adjusted diluted EPS (with respect to the adjusted diluted EPS performance metric) and adjusted free cash flow (with respect to the adjusted free cash flow performance metric) and a reconciliation of these non-GAAP measures to the most comparable GAAP financial measures. Represents the Revenue of the Company, as measured by the Company in accordance with Accounting Standards Codification (“ASC”) Topic 606, Revenue from Contracts with Customers.
|
|
|
|
| PEO | Aggregate Grant Date Fair Value of Equity Award Amounts Reported in Summary Compensation Table |
|
|
|
|
| Pay vs Performance Disclosure |
|
|
|
|
| Adjustment to Compensation, Amount |
$ (19,442,288)
|
|
|
|
| PEO | Year-end Fair Value of Equity Awards Granted in Covered Year that are Outstanding and Unvested |
|
|
|
|
| Pay vs Performance Disclosure |
|
|
|
|
| Adjustment to Compensation, Amount |
16,879,470
|
|
|
|
| PEO | Year-over-Year Change in Fair Value of Equity Awards Granted in Prior Years That are Outstanding and Unvested |
|
|
|
|
| Pay vs Performance Disclosure |
|
|
|
|
| Adjustment to Compensation, Amount |
18,318,201
|
|
|
|
| PEO | Change in Fair Value as of Vesting Date of Prior Year Equity Awards Vested in Covered Year |
|
|
|
|
| Pay vs Performance Disclosure |
|
|
|
|
| Adjustment to Compensation, Amount |
26,460,325
|
|
|
|
| PEO | Prior Year End Fair Value of Equity Awards Granted in Any Prior Year that Fail to Meet Applicable Vesting Conditions During Covered Year |
|
|
|
|
| Pay vs Performance Disclosure |
|
|
|
|
| Adjustment to Compensation, Amount |
0
|
|
|
|
| PEO | Dividends or Other Earnings Paid on Equity Awards not Otherwise Reflected in Total Compensation for Covered Year |
|
|
|
|
| Pay vs Performance Disclosure |
|
|
|
|
| Adjustment to Compensation, Amount |
$ 0
|
|
|
|
| Non-PEO NEO | Measure:: 1 |
|
|
|
|
| Pay vs Performance Disclosure |
|
|
|
|
| Name |
Performance Measures
|
|
|
|
| Non-PEO NEO | Measure:: 2 |
|
|
|
|
| Pay vs Performance Disclosure |
|
|
|
|
| Name |
Revenue
|
|
|
|
| Non-PEO NEO | Measure:: 3 |
|
|
|
|
| Pay vs Performance Disclosure |
|
|
|
|
| Name |
Adjusted EBITDA*
|
|
|
|
| Non-PEO NEO | Measure:: 4 |
|
|
|
|
| Pay vs Performance Disclosure |
|
|
|
|
| Name |
Adjusted diluted EPS
|
|
|
|
| Non-PEO NEO | Measure:: 5 |
|
|
|
|
| Pay vs Performance Disclosure |
|
|
|
|
| Name |
Adjusted free cash flow*
|
|
|
|
| Non-PEO NEO | Aggregate Grant Date Fair Value of Equity Award Amounts Reported in Summary Compensation Table |
|
|
|
|
| Pay vs Performance Disclosure |
|
|
|
|
| Adjustment to Compensation, Amount |
$ (7,746,922)
|
|
|
|
| Non-PEO NEO | Year-end Fair Value of Equity Awards Granted in Covered Year that are Outstanding and Unvested |
|
|
|
|
| Pay vs Performance Disclosure |
|
|
|
|
| Adjustment to Compensation, Amount |
6,684,436
|
|
|
|
| Non-PEO NEO | Year-over-Year Change in Fair Value of Equity Awards Granted in Prior Years That are Outstanding and Unvested |
|
|
|
|
| Pay vs Performance Disclosure |
|
|
|
|
| Adjustment to Compensation, Amount |
8,168,923
|
|
|
|
| Non-PEO NEO | Change in Fair Value as of Vesting Date of Prior Year Equity Awards Vested in Covered Year |
|
|
|
|
| Pay vs Performance Disclosure |
|
|
|
|
| Adjustment to Compensation, Amount |
10,577,410
|
|
|
|
| Non-PEO NEO | Prior Year End Fair Value of Equity Awards Granted in Any Prior Year that Fail to Meet Applicable Vesting Conditions During Covered Year |
|
|
|
|
| Pay vs Performance Disclosure |
|
|
|
|
| Adjustment to Compensation, Amount |
0
|
|
|
|
| Non-PEO NEO | Dividends or Other Earnings Paid on Equity Awards not Otherwise Reflected in Total Compensation for Covered Year |
|
|
|
|
| Pay vs Performance Disclosure |
|
|
|
|
| Adjustment to Compensation, Amount |
$ 0
|
|
|
|