Exhibit 99.2
GX-03: Phase 2, Stage 2 Overview & Additional Interim Analysis Insights Investor Webcast Presentation July 7, 2026
2 Disclaimers & Safe Harbour Except for historical information set forth herein, the matters set forth in this presentation contain forward-looking statements within the meaning of the safe harbor provisions of the U.S. Private Securities Litigation Reform Act of 1995. Forward-looking statements may be identified by words such as “may,” “might,” “will,” “should,” “expects,” “plans,” “anticipates,” “believes,” “estimates,” “predicts,” “potential” or “continue,” the negative of these terms and other comparable terminology. We cannot guarantee future results, level of activity, performance or achievements. Moreover, neither we nor any other person assumes responsibility for the accuracy and completeness of any of these forward-looking statements. We are under no duty to update any of these forward-looking statements after the date of this presentation to conform our prior statements to actual results or revised expectations. These statements are based upon the current beliefs and expectations of Turn Therapeutics’ management and are subject to significant risks and uncertainties. By their nature, forward-looking statements involve risks and uncertainties because they depend on circumstances that may or may not occur in the future. If underlying assumptions prove inaccurate or risks or uncertainties materialize, actual results may differ materially. Risks include: industry competition; economic factors; regulatory challenges; uncertainties in clinical development and obtaining regulatory approvals; no guarantees that pipeline products will prove commercially successful; reliance on third-party partnerships and manufacturers; dependence on patent protections for PermaFusion®; and ability to access adequate capital. Although these statements are based on assumptions we believe are reasonable, we caution that forward-looking statements are not guarantees of future performance and you should not place undue reliance on them. Turn Therapeutics undertakes no obligation to publicly update any forward-looking statement, whether as a result of new information, future events or otherwise. Additional factors can be found in the company’s SEC filings available at www.sec.gov. This presentation includes market and industry data and forecasts that the Company has derived from independent consultant reports, publicly available information, various industry publications, other published industry sources, and its internal data and estimates. Independent consultant reports, industry publications and other published industry sources generally indicate that the information contained therein was obtained from sources believed to be reliable. Although the Company believes that these third-party sources are reliable, it does not guarantee the accuracy or completeness of this information, and the Company has not independently verified this information. The Company’s internal data and estimates are based upon information obtained from trade and business organizations and other contacts in the markets in which the Company operates and management’s understanding of industry conditions. Although the Company believes that such information is reliable, it has not had this information verified by any independent sources. In addition, the information contained in this presentation is as of the date hereof (except where otherwise indicated), and the Company has no obligation to update such information, including in the event that such information becomes inaccurate or if estimates change. Subsequent materials may be provided by or on behalf of the Company in its discretion and such information may supplement, modify or supersede the information in these materials. Neither the Company, nor any of its respective affiliates, advisors or representatives shall have any liability whatsoever (in negligence or otherwise) for any loss or damage howsoever arising from any use of these materials or their contents or otherwise arising in connection with these materials. This presentation may contain trademarks, service marks, trade names and copyrights of other companies, which are the property of their respective owners. Solely for convenience, some of the trademarks, service marks, trade names and copyrights referred to in this presentation may be listed without the TM, SM or symbols, but the Company will assert, to the fullest extent under applicable law, the rights of the applicable owners, if any, to these trademarks, service marks, trade names and copyrights.
3 Bradley Burnam Chief Executive Officer
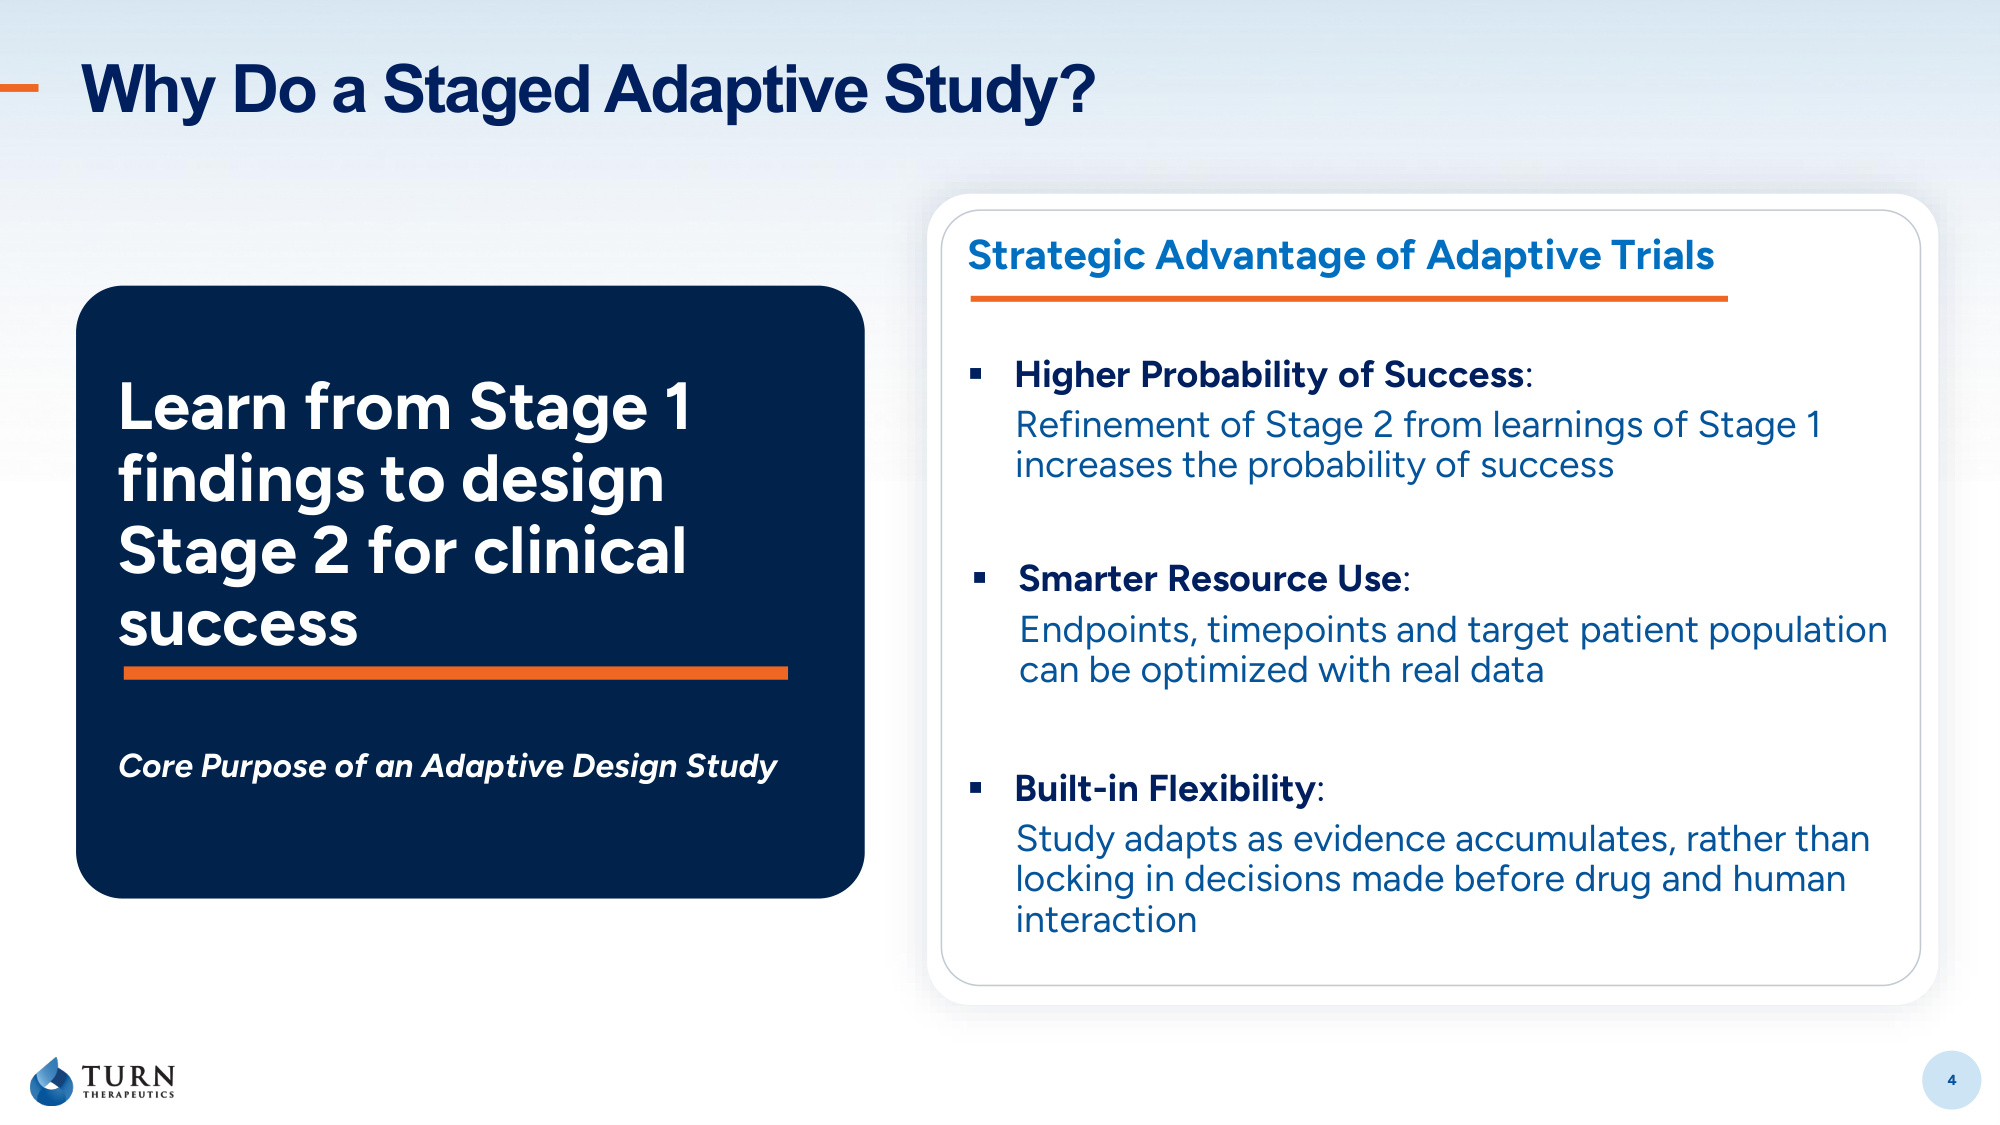
4 Why Do a Staged Adaptive Study? 4 Learn from Stage 1 findings to design Stage 2 for clinical success Core Purpose of an Adaptive Design Study Strategic Advantage of Adaptive Trials ▪Higher Probability of Success: Refinement of Stage 2 from learnings of Stage 1 increases the probability of success ▪Smarter Resource Use: Endpoints, timepoints and target patient population can be optimized with real data ▪Built-in Flexibility: Study adapts as evidence accumulates, rather than locking in decisions made before drug and human interaction
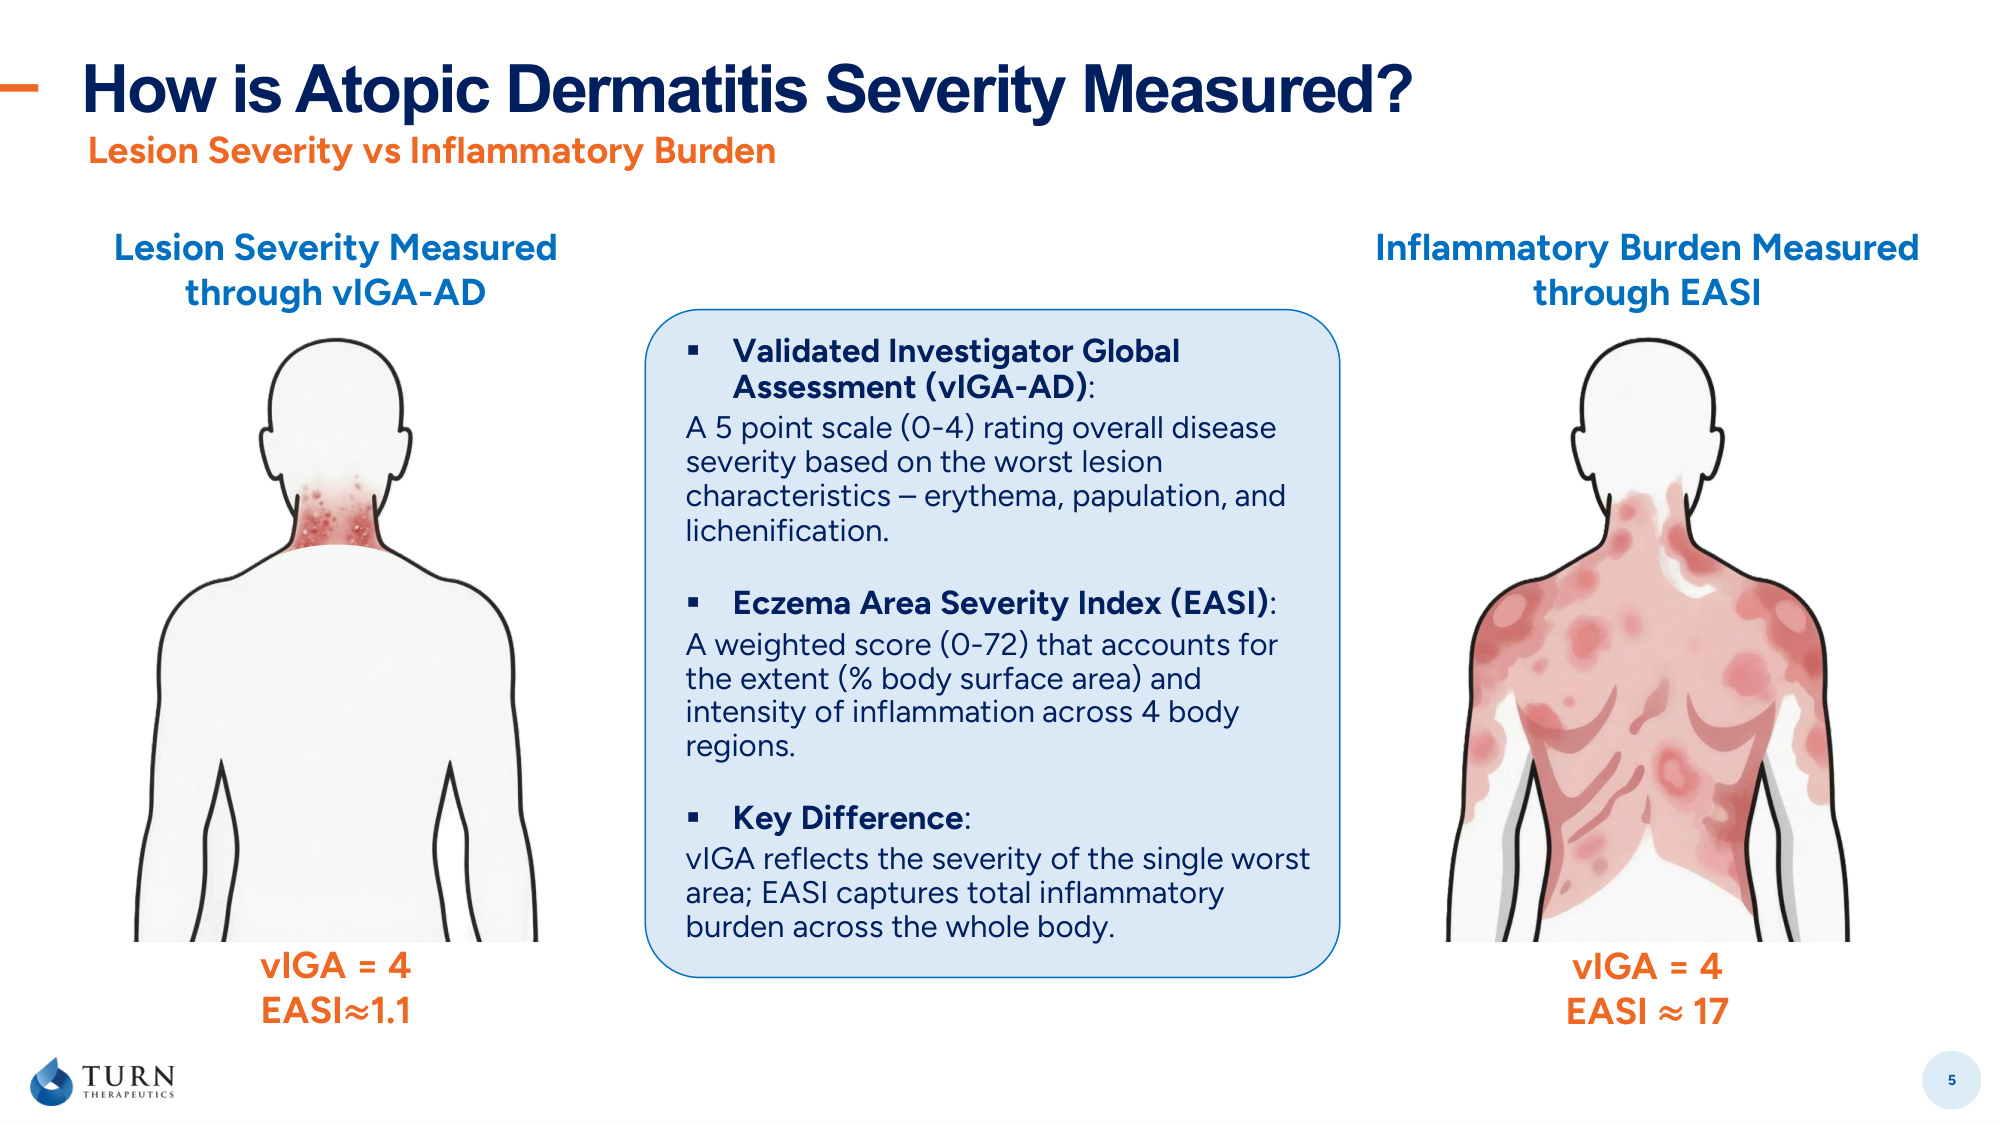
How is Atopic Dermatitis Severity Measured? 5 Lesion Severity vs Inflammatory Burden Lesion Severity Measured through vIGA-AD Inflammatory Burden Measured through EASI vIGA = 4 EASI≈1.1 vIGA = 4 EASI ≈ 17 ▪ Validated Investigator Global Assessment (vIGA-AD): A 5 point scale (0-4) rating overall disease severity based on the worst lesion characteristics – erythema, papulation, and lichenification. ▪ Eczema Area Severity Index (EASI): A weighted score (0-72) that accounts for the extent (% body surface area) and intensity of inflammation across 4 body regions. ▪ Key Difference: vIGA reflects the severity of the single worst area; EASI captures total inflammatory burden across the whole body.
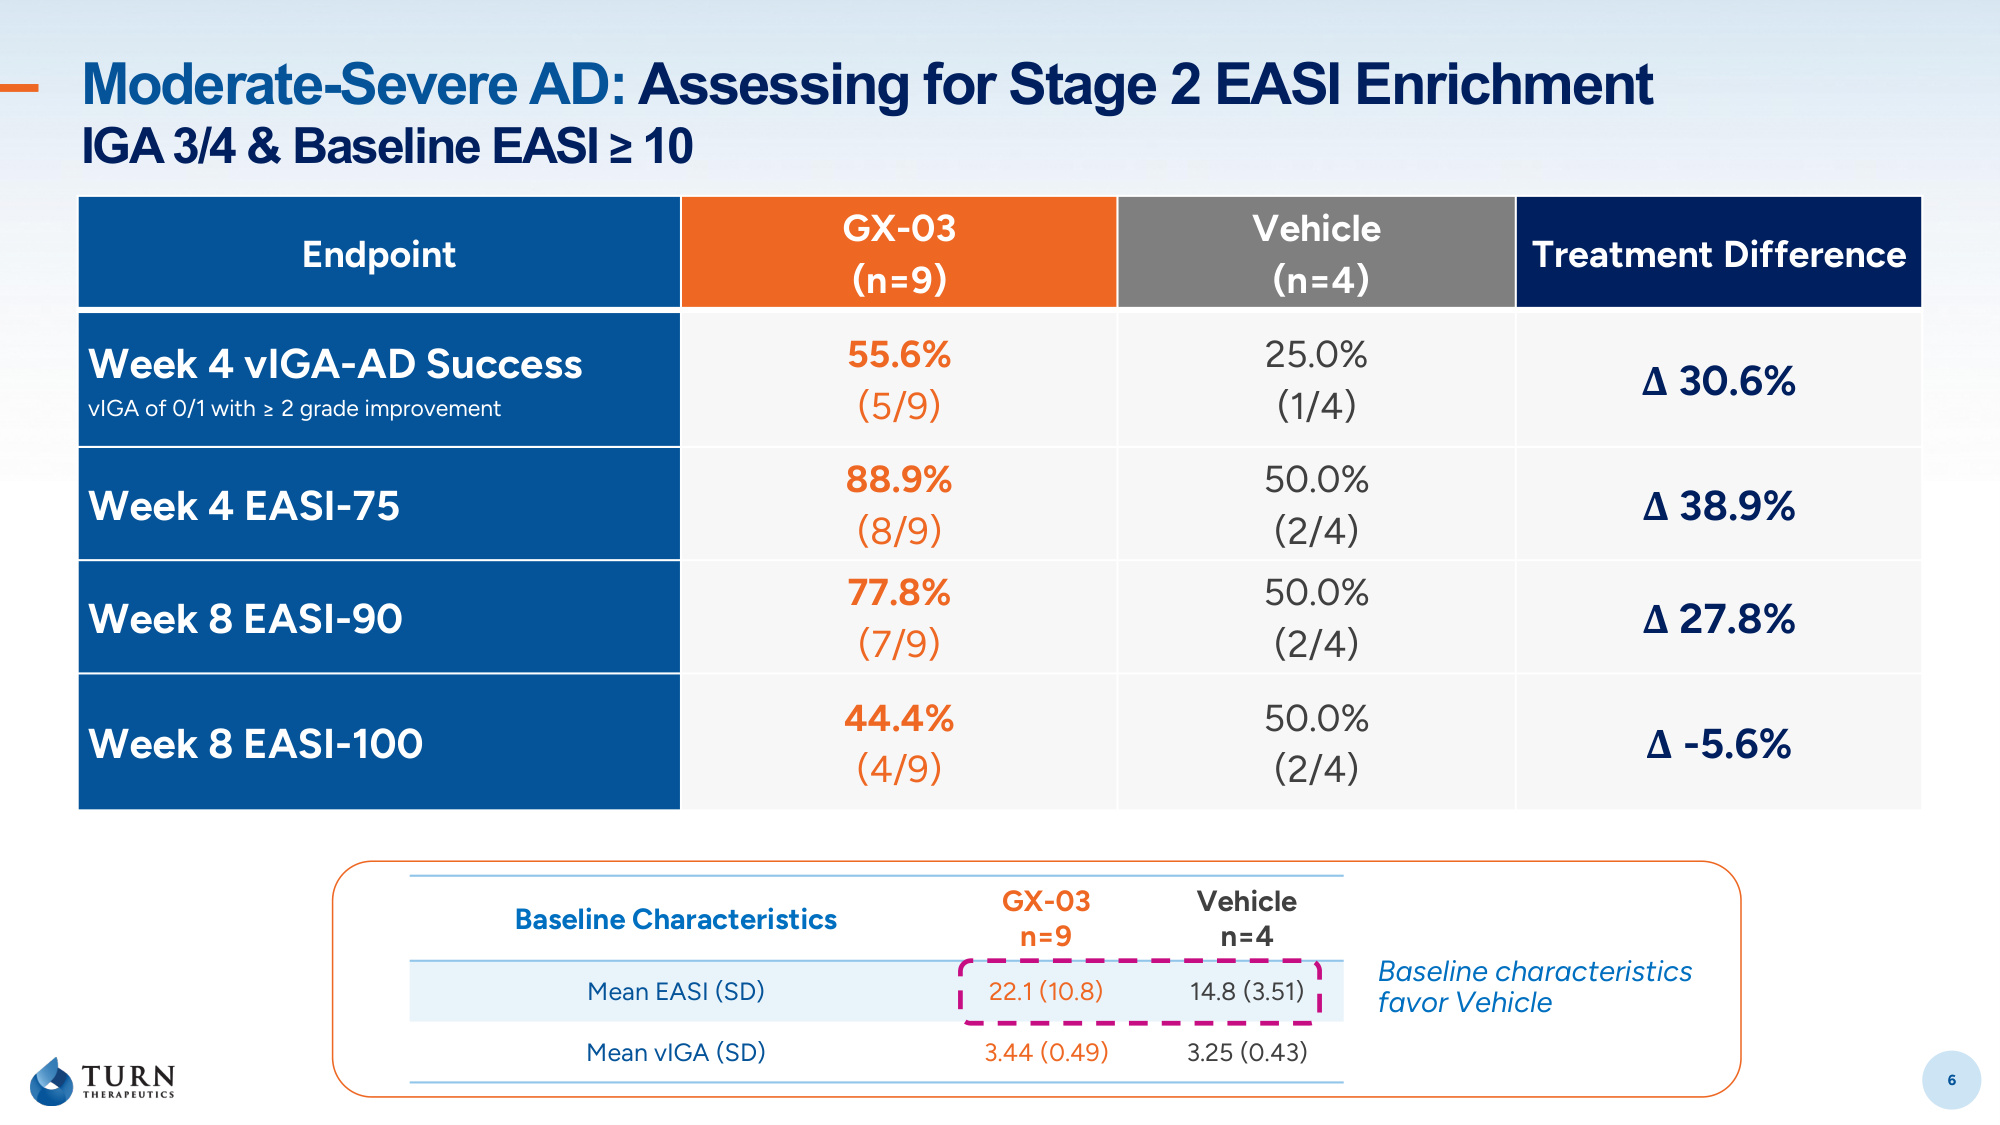
6 Moderate-Severe AD: Assessing for Stage 2 EASI Enrichment IGA 3/4 & Baseline EASI ≥ 10 6 Baseline Characteristics GX-03 n=9 Vehicle n=4 Mean EASI (SD) 22.1 (10.8) 14.8 (3.51) Mean vIGA (SD) 3.44 (0.49) 3.25 (0.43) Endpoint GX-03 (n=9) Vehicle (n=4) Treatment Difference Week 4 vIGA-AD Success vIGA of 0/1 with ≥ 2 grade improvement 55.6% (5/9) 25.0% (1/4) Δ 30.6% Week 4 EASI-75 88.9% (8/9) 50.0% (2/4) Δ 38.9% Week 8 EASI-90 77.8% (7/9) 50.0% (2/4) Δ 27.8% Week 8 EASI-100 44.4% (4/9) 50.0% (2/4) Δ -5.6% Baseline characteristics favor Vehicle
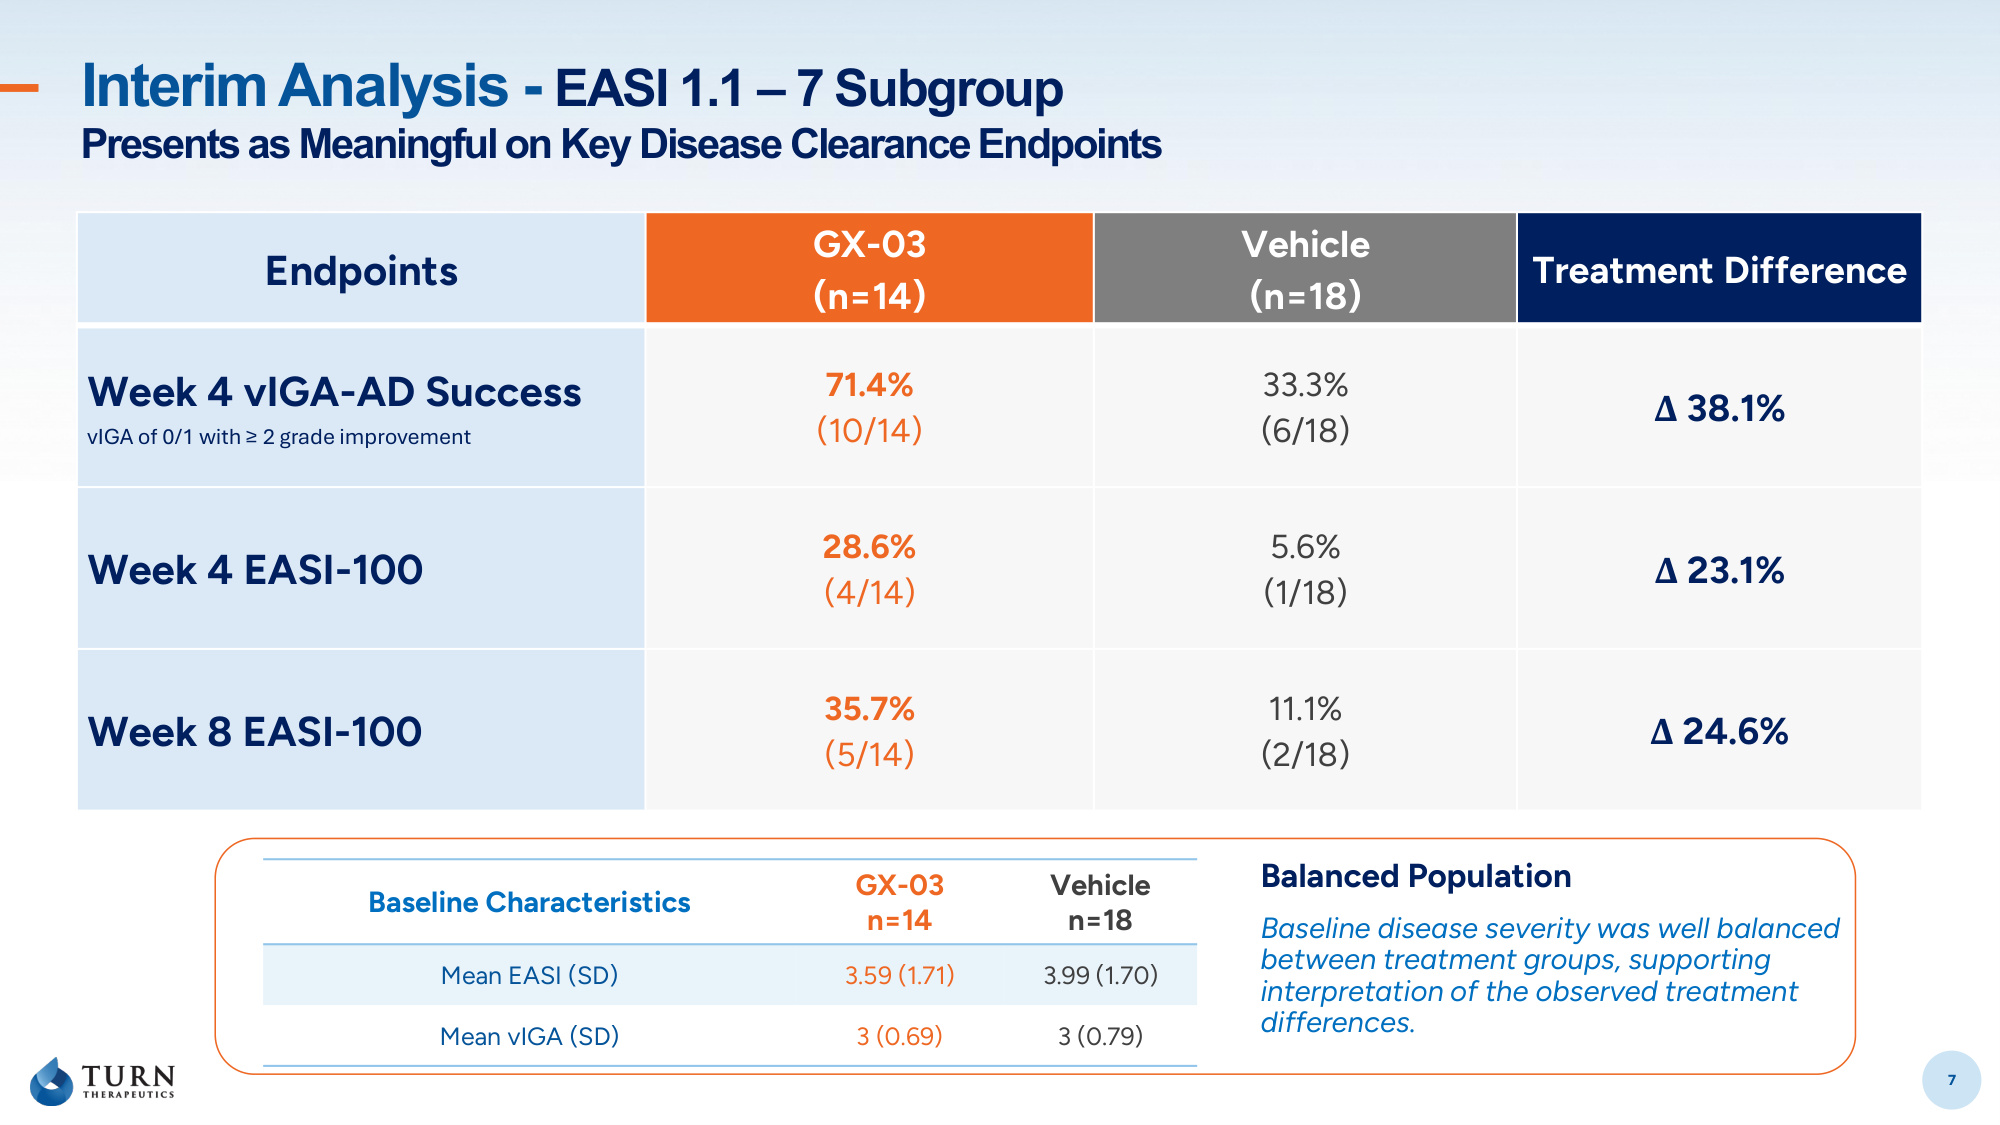
7 Interim Analysis - EASI 1.1 – 7 Subgroup Presents as Meaningful on Key Disease Clearance Endpoints 7 Endpoints GX-03 (n=14) Vehicle (n=18) Treatment Difference Week 4 vIGA-AD Success vIGA of 0/1 with ≥ 2 grade improvement 71.4% (10/14) 33.3% (6/18) Δ 38.1% Week 4 EASI-100 28.6% (4/14) 5.6% (1/18) Δ 23.1% Week 8 EASI-100 35.7% (5/14) 11.1% (2/18) Δ 24.6% Baseline Characteristics GX-03 n=14 Vehicle n=18 Mean EASI (SD) 3.59 (1.71) 3.99 (1.70) Mean vIGA (SD) 3 (0.69) 3 (0.79) Balanced Population Baseline disease severity was well balanced between treatment groups, supporting interpretation of the observed treatment differences.
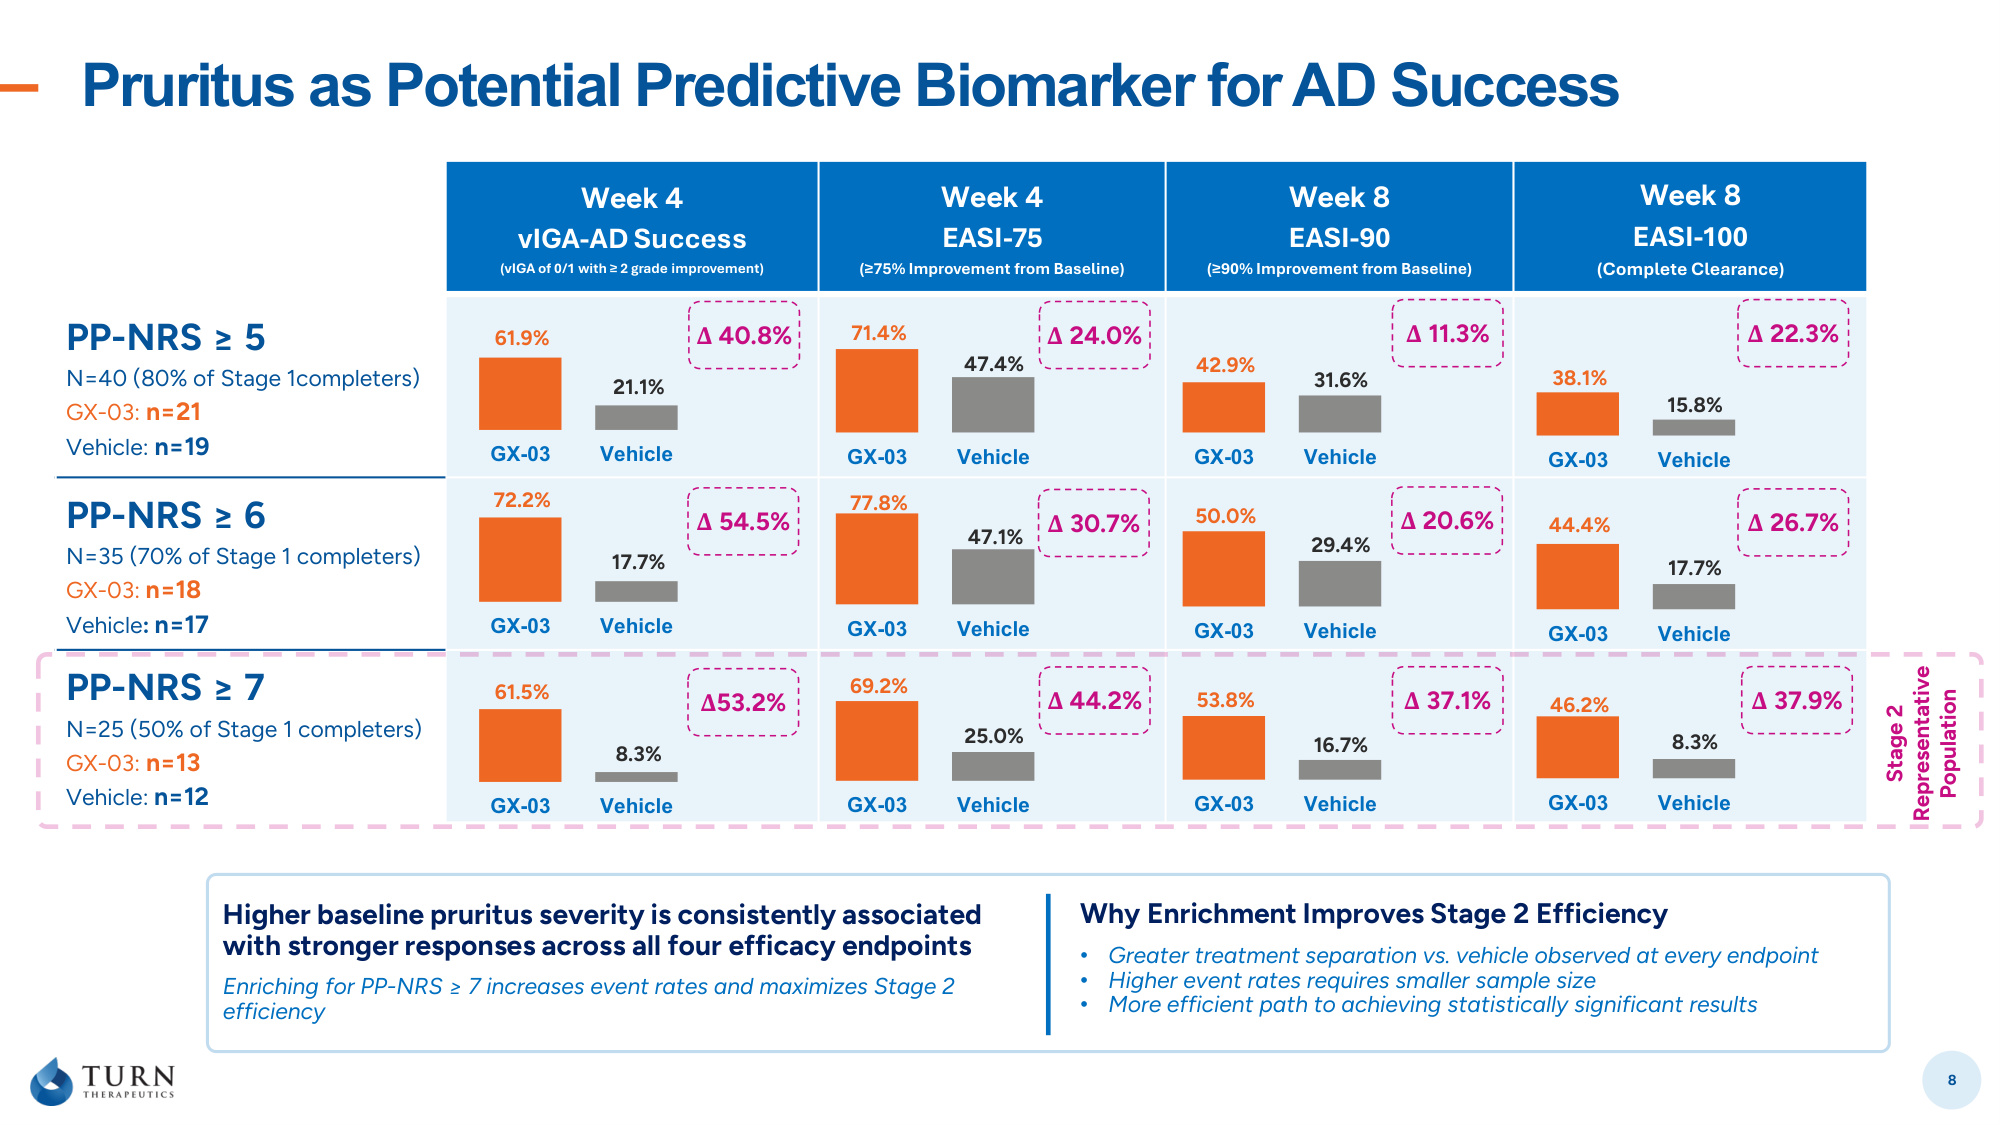
Pruritus as Potential Predictive Biomarker for AD Success 8 Week 4 vIGA-AD Success (vIGA of 0/1 with ≥ 2 grade improvement) Week 4 EASI-75 (≥75% Improvement from Baseline) Week 8 EASI-90 (≥90% Improvement from Baseline) Week 8 EASI-100 (Complete Clearance) PP-NRS ≥ 5 N=40 (80% of Stage 1completers) GX-03: n=21 Vehicle: n=19 PP-NRS ≥ 6 N=35 (70% of Stage 1 completers) GX-03: n=18 Vehicle: n=17 PP-NRS ≥ 7 N=25 (50% of Stage 1 completers) GX-03: n=13 Vehicle: n=12 GX-03 Vehicle Higher baseline pruritus severity is consistently associated with stronger responses across all four efficacy endpoints Enriching for PP-NRS ≥ 7 increases event rates and maximizes Stage 2 efficiency Why Enrichment Improves Stage 2 Efficiency • Greater treatment separation vs. vehicle observed at every endpoint • Higher event rates requires smaller sample size • More efficient path to achieving statistically significant results GX-03 Vehicle GX-03 Vehicle 61.9% 72.2% 61.5% 21.1% 17.7% 8.3% GX-03 Vehicle GX-03 Vehicle GX-03 Vehicle 71.4% 77.8% 69.2% 47.4% 47.1% 25.0% GX-03 Vehicle GX-03 Vehicle GX-03 Vehicle 42.9% 50.0% 53.8% 31.6% 29.4% 16.7% GX-03 Vehicle GX-03 Vehicle GX-03 Vehicle 38.1% 44.4% 46.2% 15.8% 17.7% 8.3% Stage 2 Representative Population Δ 40.8% Δ 54.5% Δ53.2% Δ 44.2% Δ 30.7% Δ 24.0% Δ 11.3% Δ 20.6% Δ 37.1% Δ 37.9% Δ 26.7% Δ 22.3%
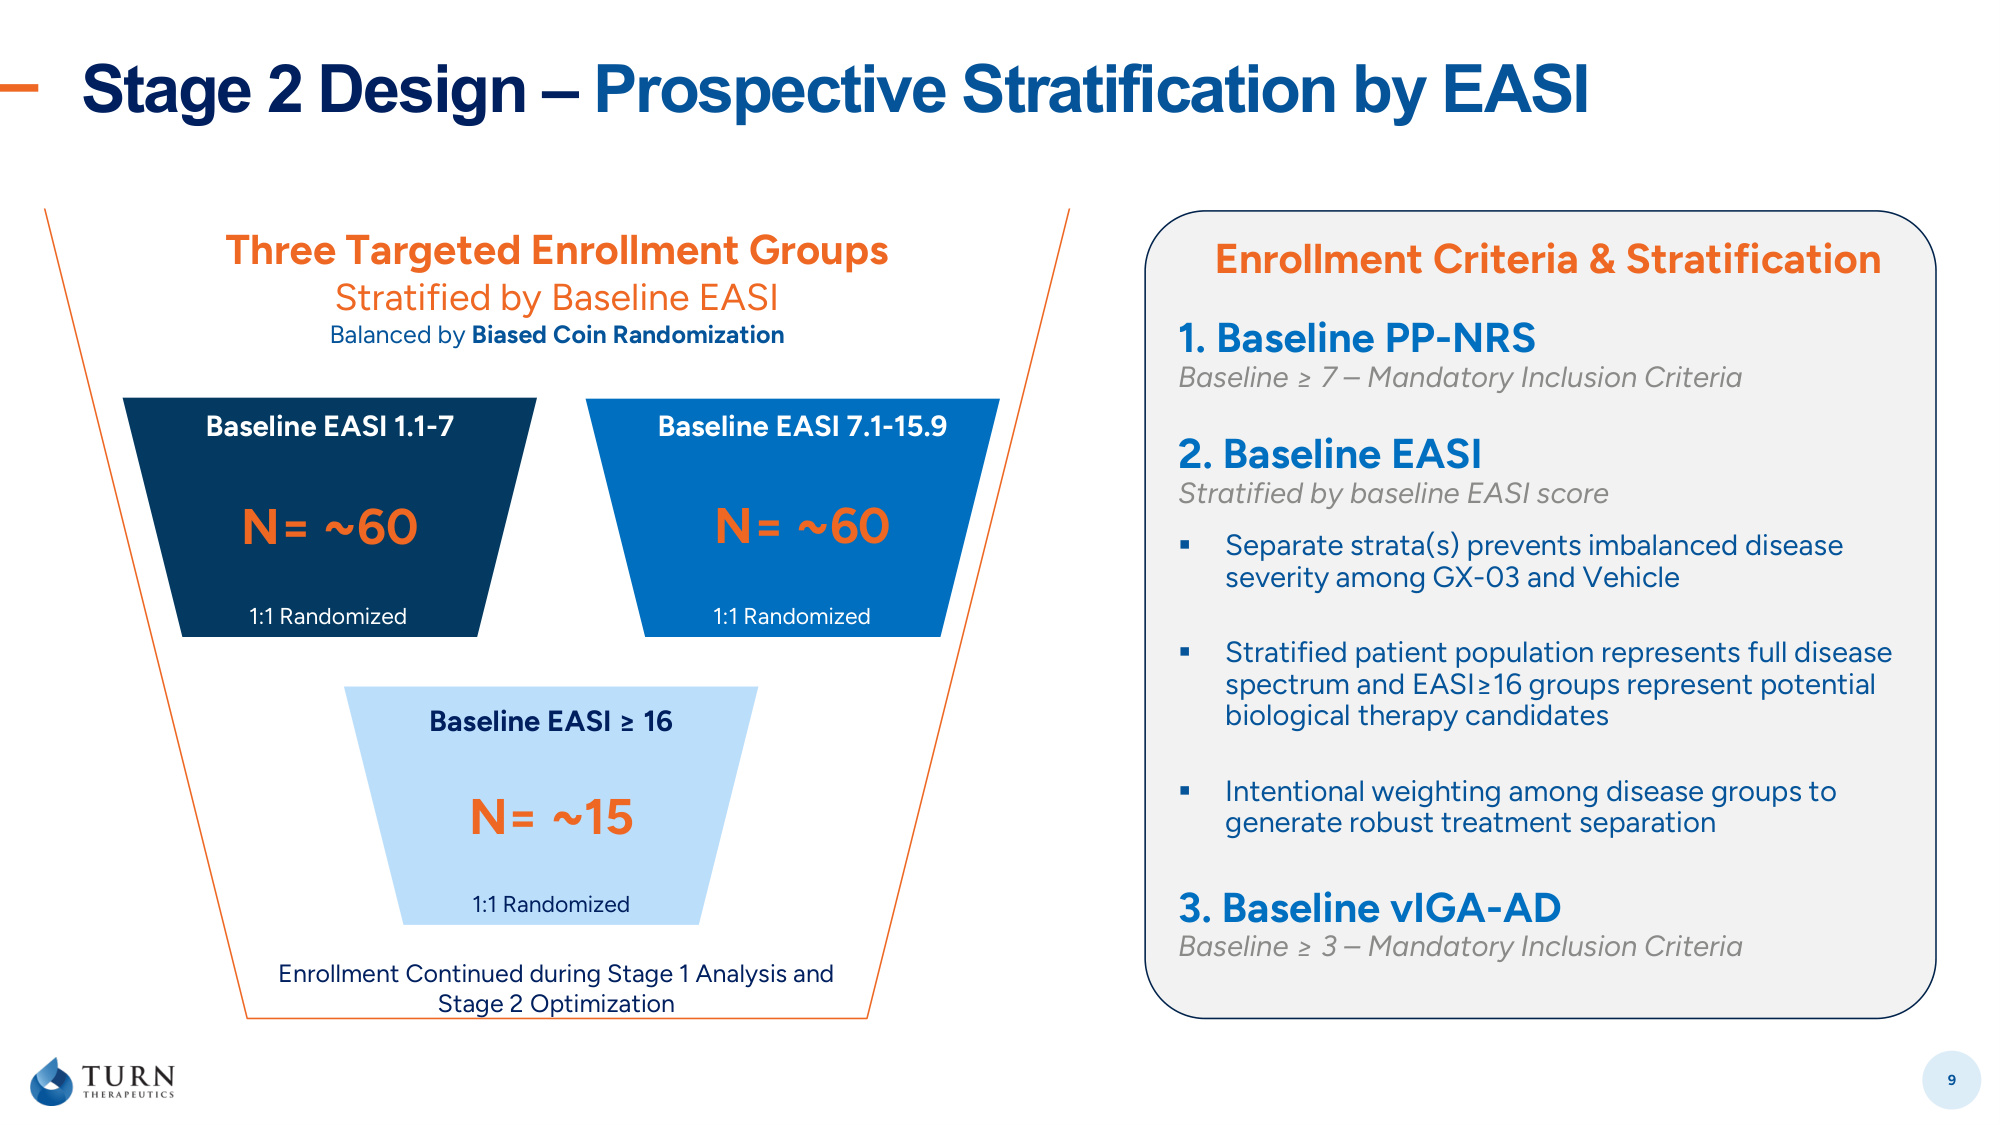
Stage 2 Design – Prospective Stratification by EASI 9 2. Baseline EASI Stratified by baseline EASI score ▪ Separate strata(s) prevents imbalanced disease severity among GX-03 and Vehicle ▪ Stratified patient population represents full disease spectrum and EASI≥16 groups represent potential biological therapy candidates ▪ Intentional weighting among disease groups to generate robust treatment separation 1. Baseline PP-NRS Baseline ≥ 7 – Mandatory Inclusion Criteria 3. Baseline vIGA-AD Baseline ≥ 3 – Mandatory Inclusion Criteria Enrollment Criteria & Stratification N= ~60 Baseline EASI 1.1-7 1:1 Randomized N= ~60 Baseline EASI 7.1-15.9 1:1 Randomized N= ~15 Baseline EASI ≥ 16 1:1 Randomized Three Targeted Enrollment Groups Stratified by Baseline EASI Balanced by Biased Coin Randomization Enrollment Continued during Stage 1 Analysis and Stage 2 Optimization
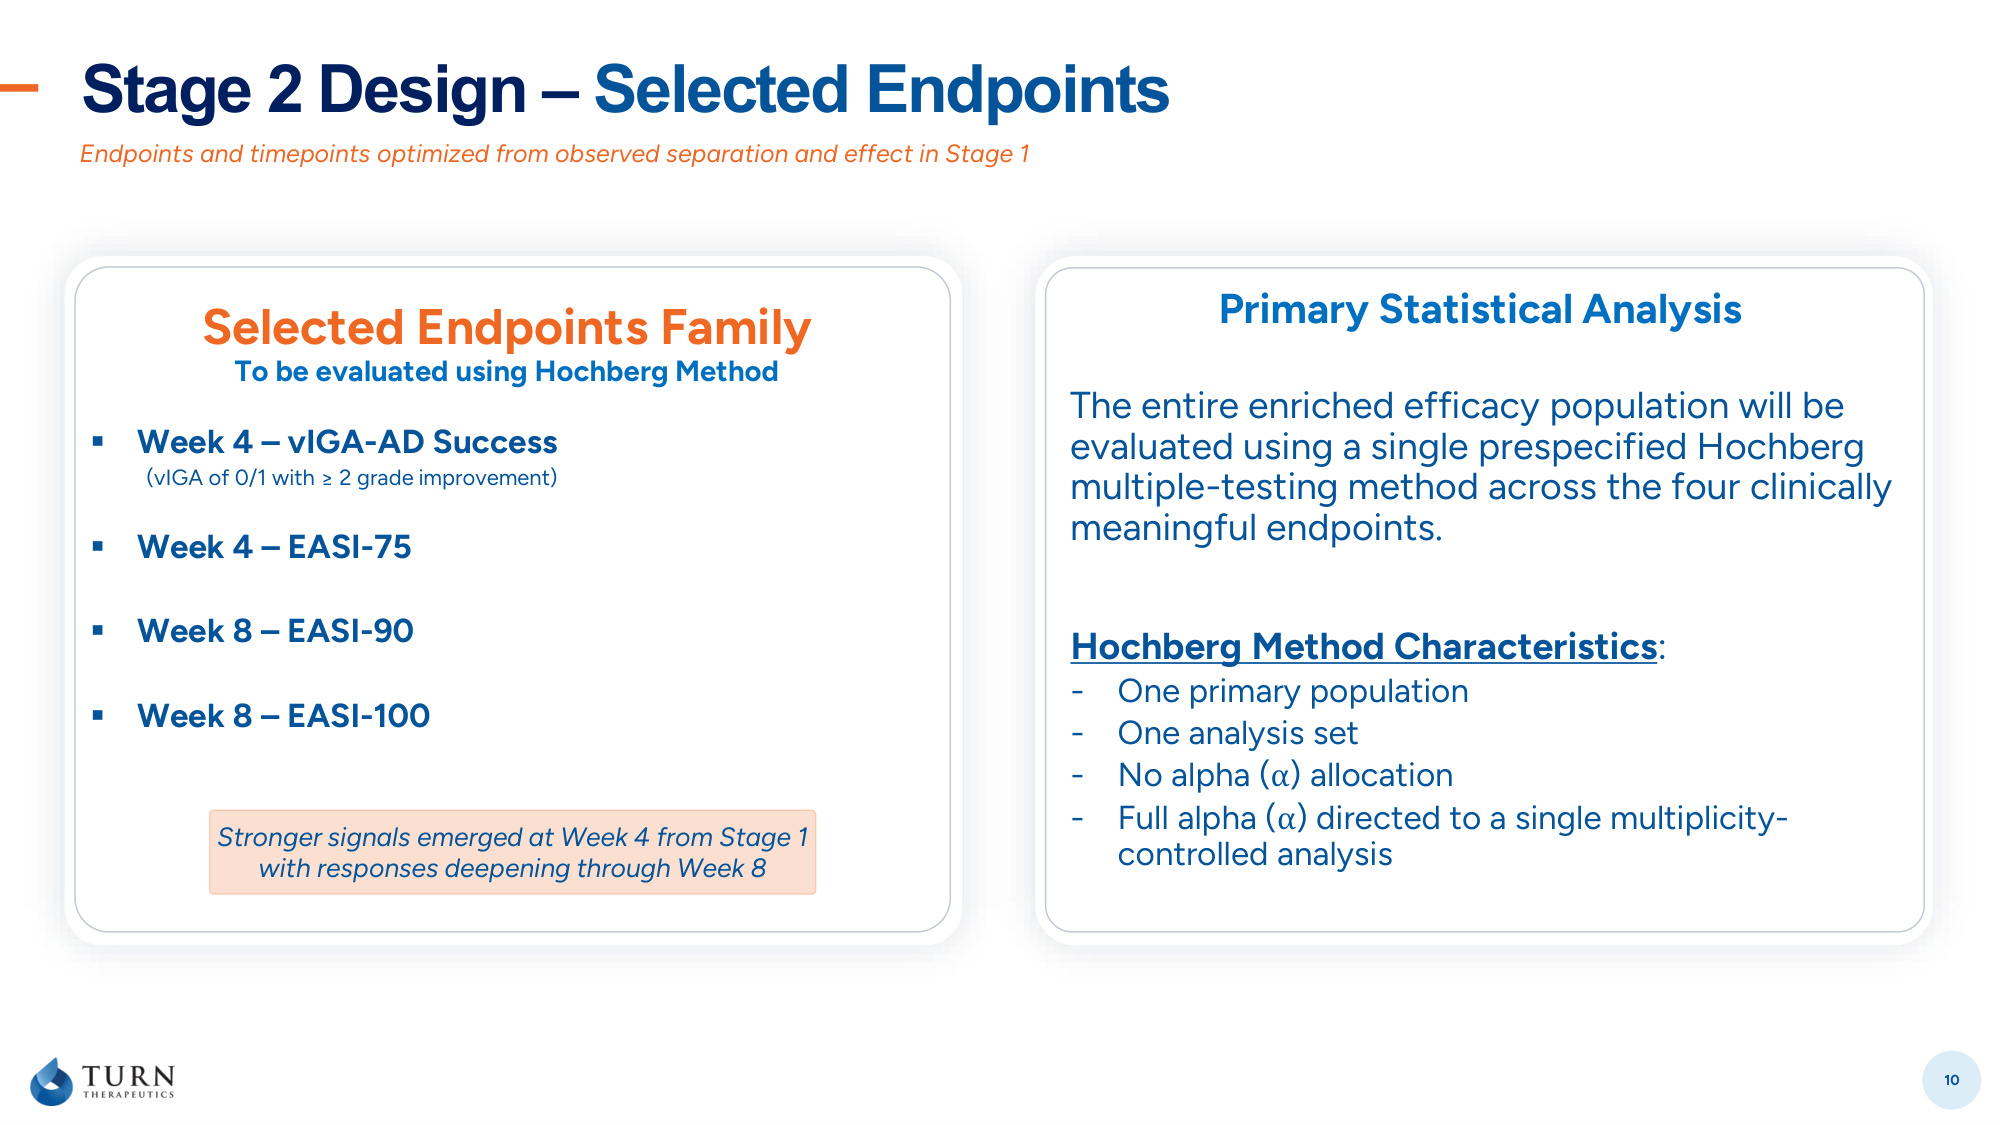
Stage 2 Design – Selected Endpoints 10 Endpoints and timepoints optimized from observed separation and effect in Stage 1 Selected Endpoints Family To be evaluated using Hochberg Method ▪ Week 4 – vIGA-AD Success (vIGA of 0/1 with ≥ 2 grade improvement) ▪ Week 4 – EASI-75 ▪ Week 8 – EASI-90 ▪ Week 8 – EASI-100 Primary Statistical Analysis The entire enriched efficacy population will be evaluated using a single prespecified Hochberg multiple-testing method across the four clinically meaningful endpoints. Stronger signals emerged at Week 4 from Stage 1 with responses deepening through Week 8 Hochberg Method Characteristics: - One primary population - One analysis set - No alpha (α) allocation - Full alpha (α) directed to a single multiplicity- controlled analysis
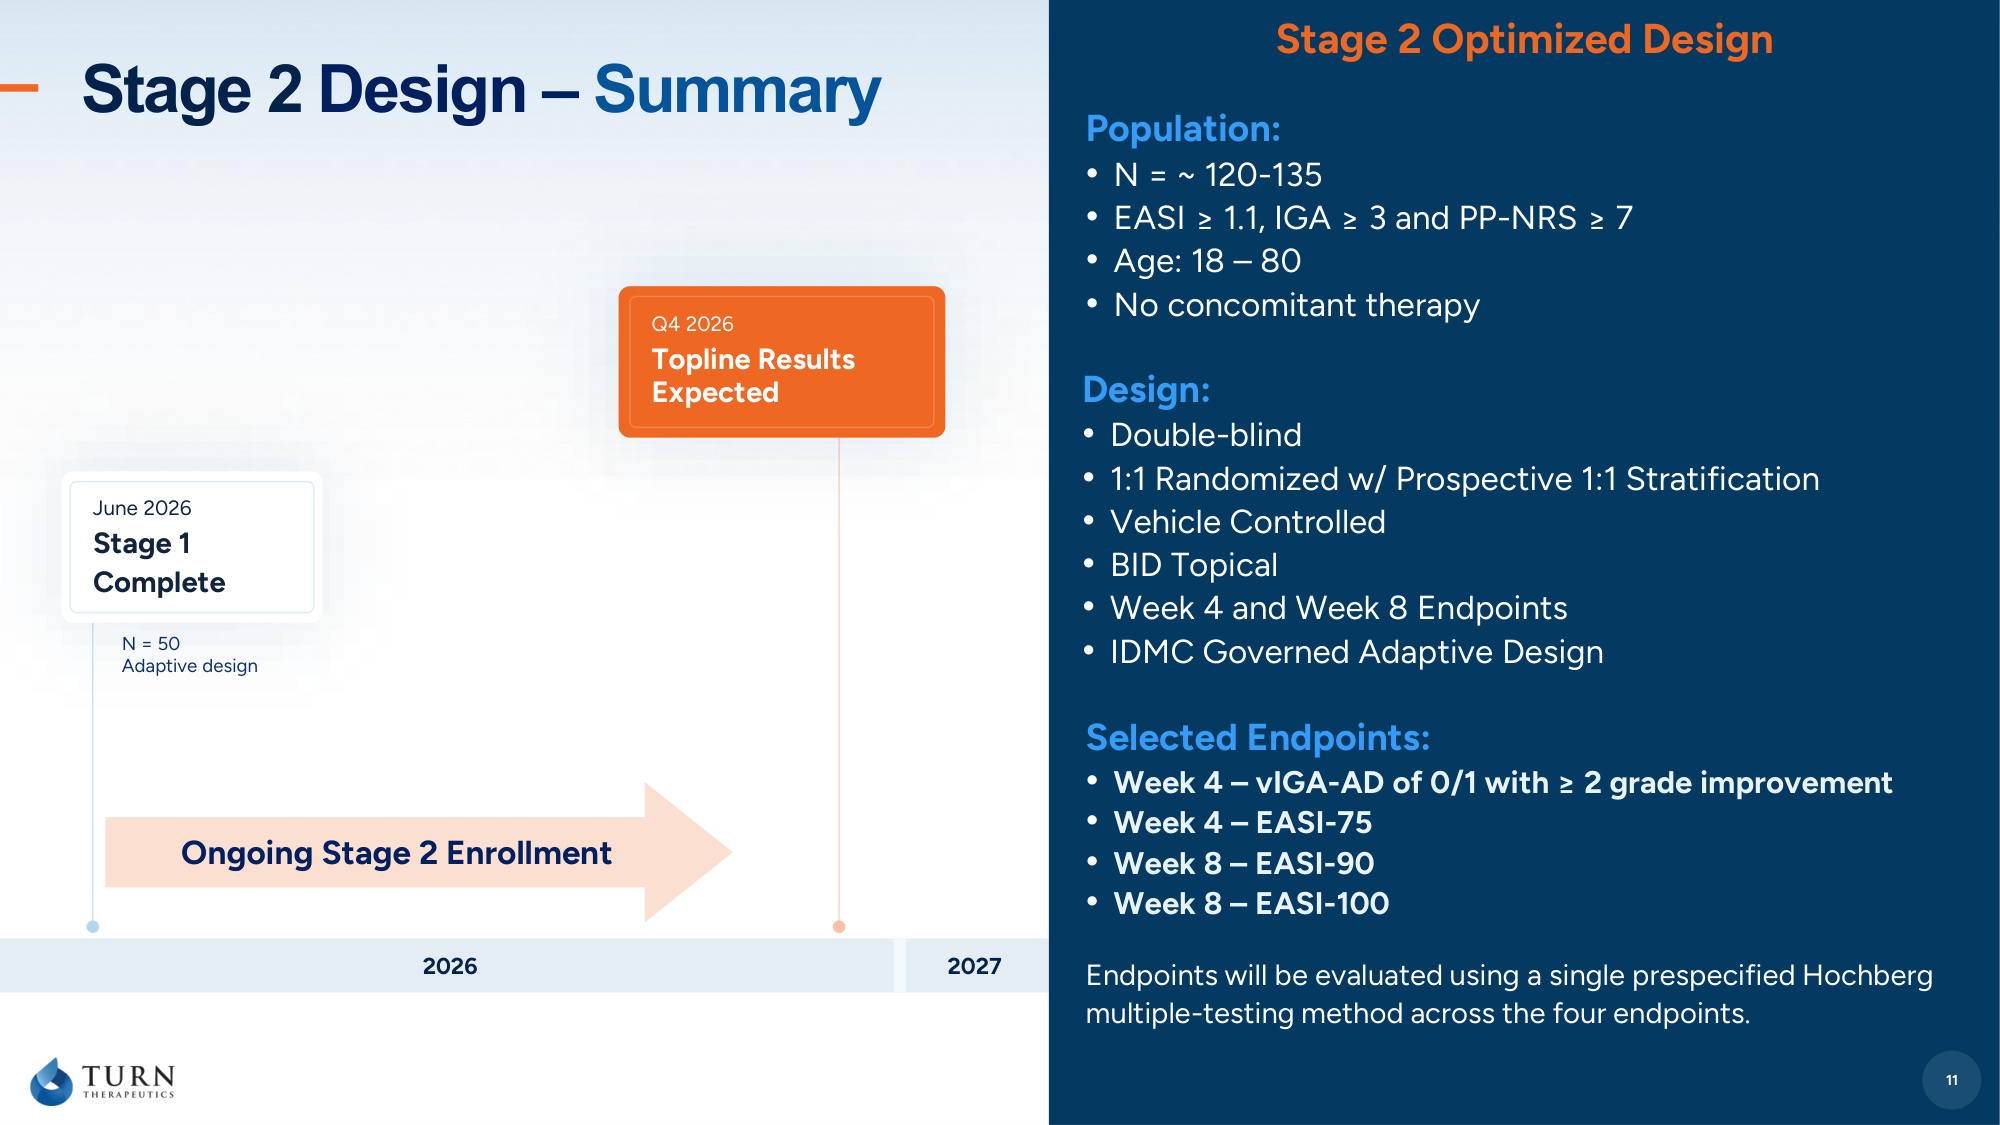
11 Stage 2 Design – Summary Design: • Double-blind • 1:1 Randomized w/ Prospective 1:1 Stratification • Vehicle Controlled • BID Topical • Week 4 and Week 8 Endpoints • IDMC Governed Adaptive Design 11 Stage 2 Optimized Design Selected Endpoints: • Week 4 – vIGA-AD of 0/1 with ≥ 2 grade improvement • Week 4 – EASI-75 • Week 8 – EASI-90 • Week 8 – EASI-100 Endpoints will be evaluated using a single prespecified Hochberg multiple-testing method across the four endpoints. Population: • N = ~ 120-135 • EASI ≥ 1.1, IGA ≥ 3 and PP-NRS ≥ 7 • Age: 18 – 80 • No concomitant therapy 2026 2027 June 2026 Stage 1 Complete Q4 2026 Topline Results Expected N = 50 Adaptive design Ongoing Stage 2 Enrollment
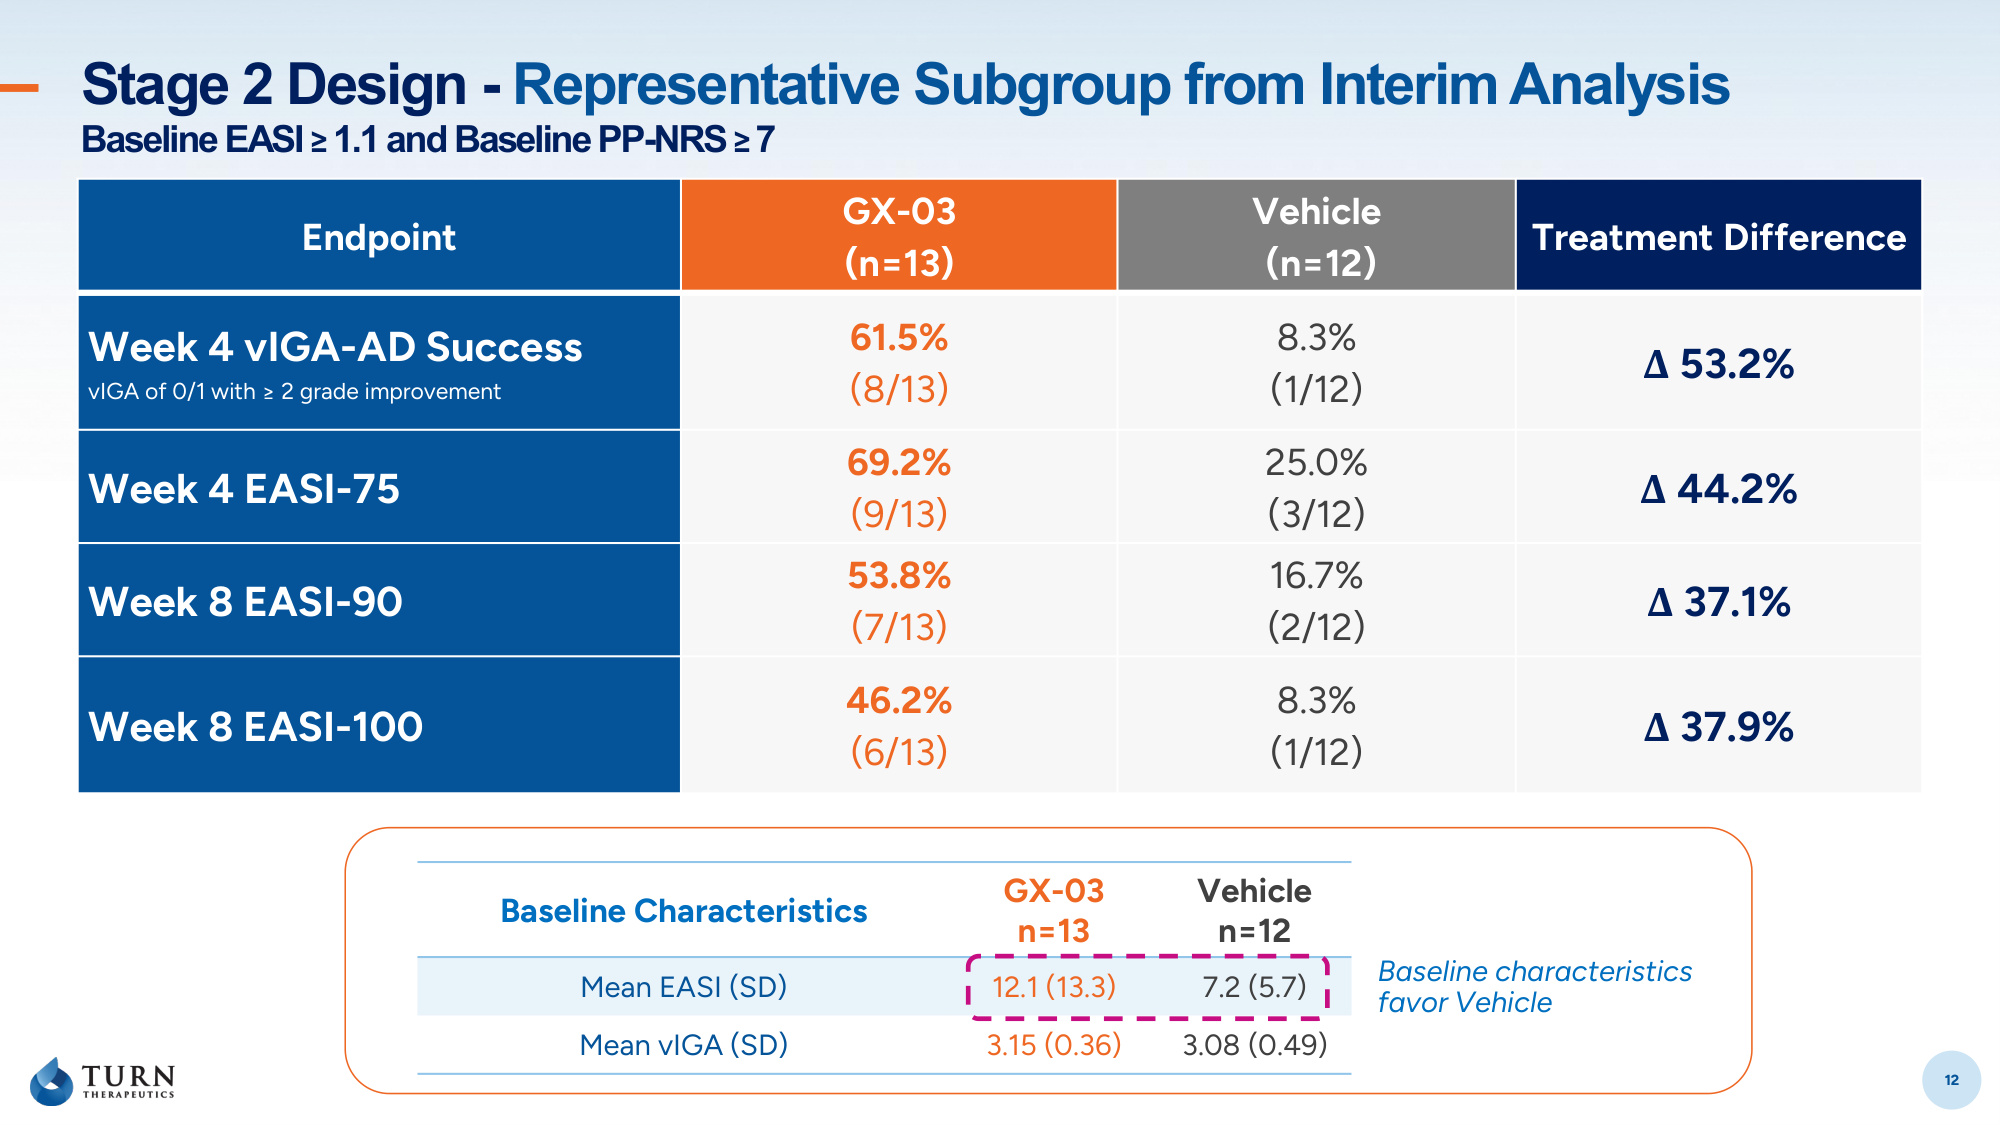
12 Stage 2 Design - Representative Subgroup from Interim Analysis Baseline EASI ≥ 1.1 and Baseline PP-NRS ≥ 7 12 Endpoint GX-03 (n=13) Vehicle (n=12) Treatment Difference Week 4 vIGA-AD Success vIGA of 0/1 with ≥ 2 grade improvement 61.5% (8/13) 8.3% (1/12) Δ 53.2% Week 4 EASI-75 69.2% (9/13) 25.0% (3/12) Δ 44.2% Week 8 EASI-90 53.8% (7/13) 16.7% (2/12) Δ 37.1% Week 8 EASI-100 46.2% (6/13) 8.3% (1/12) Δ 37.9% Baseline Characteristics GX-03 n=13 Vehicle n=12 Mean EASI (SD) 12.1 (13.3) 7.2 (5.7) Mean vIGA (SD) 3.15 (0.36) 3.08 (0.49) Baseline characteristics favor Vehicle
13 Dr. Stephen Hahn Clinical and Regulatory Lead
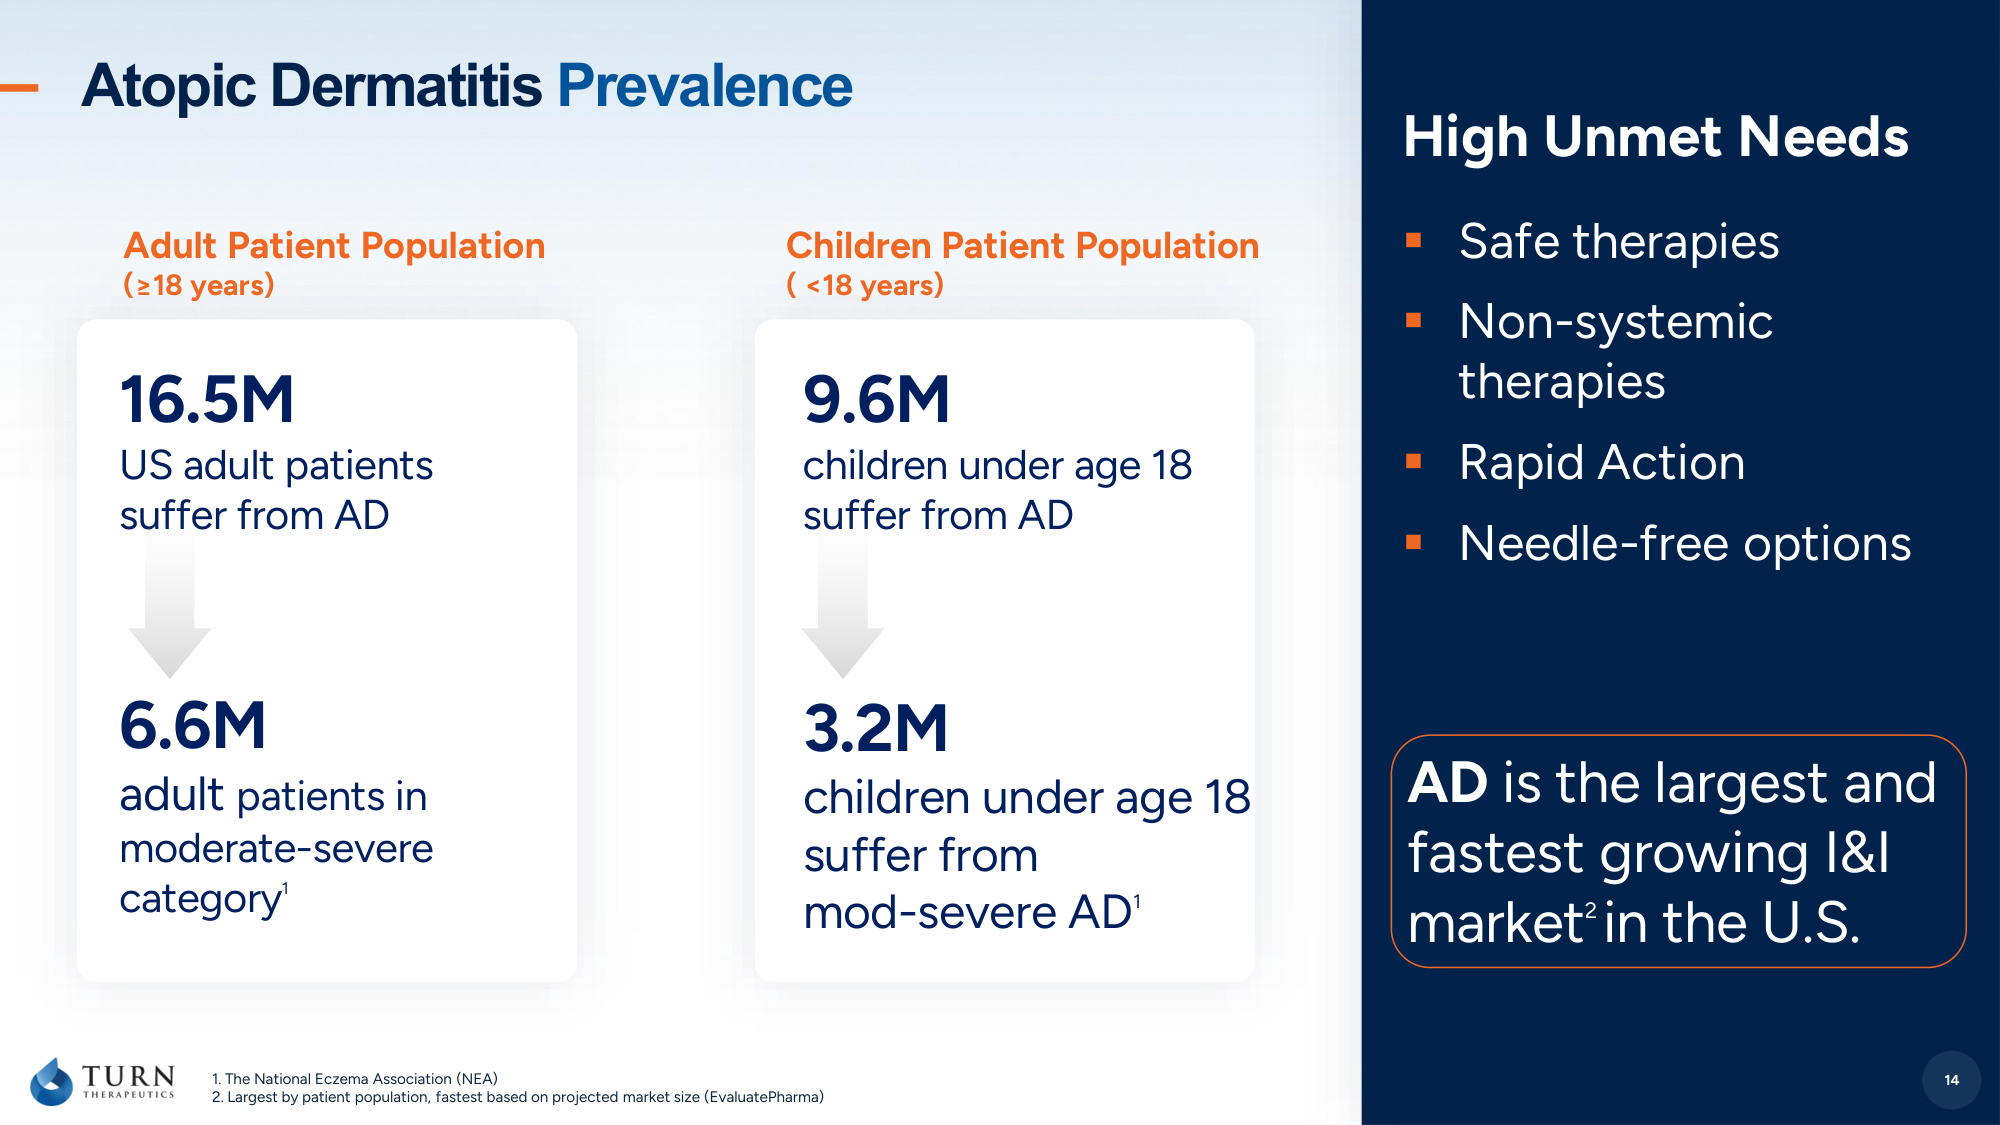
14 1. The National Eczema Association (NEA) 2. Largest by patient population, fastest based on projected market size (EvaluatePharma) 16.5M US adult patients suffer from AD 6.6M adult patients in moderate-severe category 1 High Unmet Needs ▪Safe therapies ▪Non-systemic therapies ▪Rapid Action ▪Needle-free options Atopic Dermatitis Prevalence 14 9.6M children under age 18 suffer from AD 3.2M children under age 18 suffer from mod-severe AD 1 AD is the largest and fastest growing I&I market 2 in the U.S. Adult Patient Population (≥18 years) Children Patient Population ( <18 years)
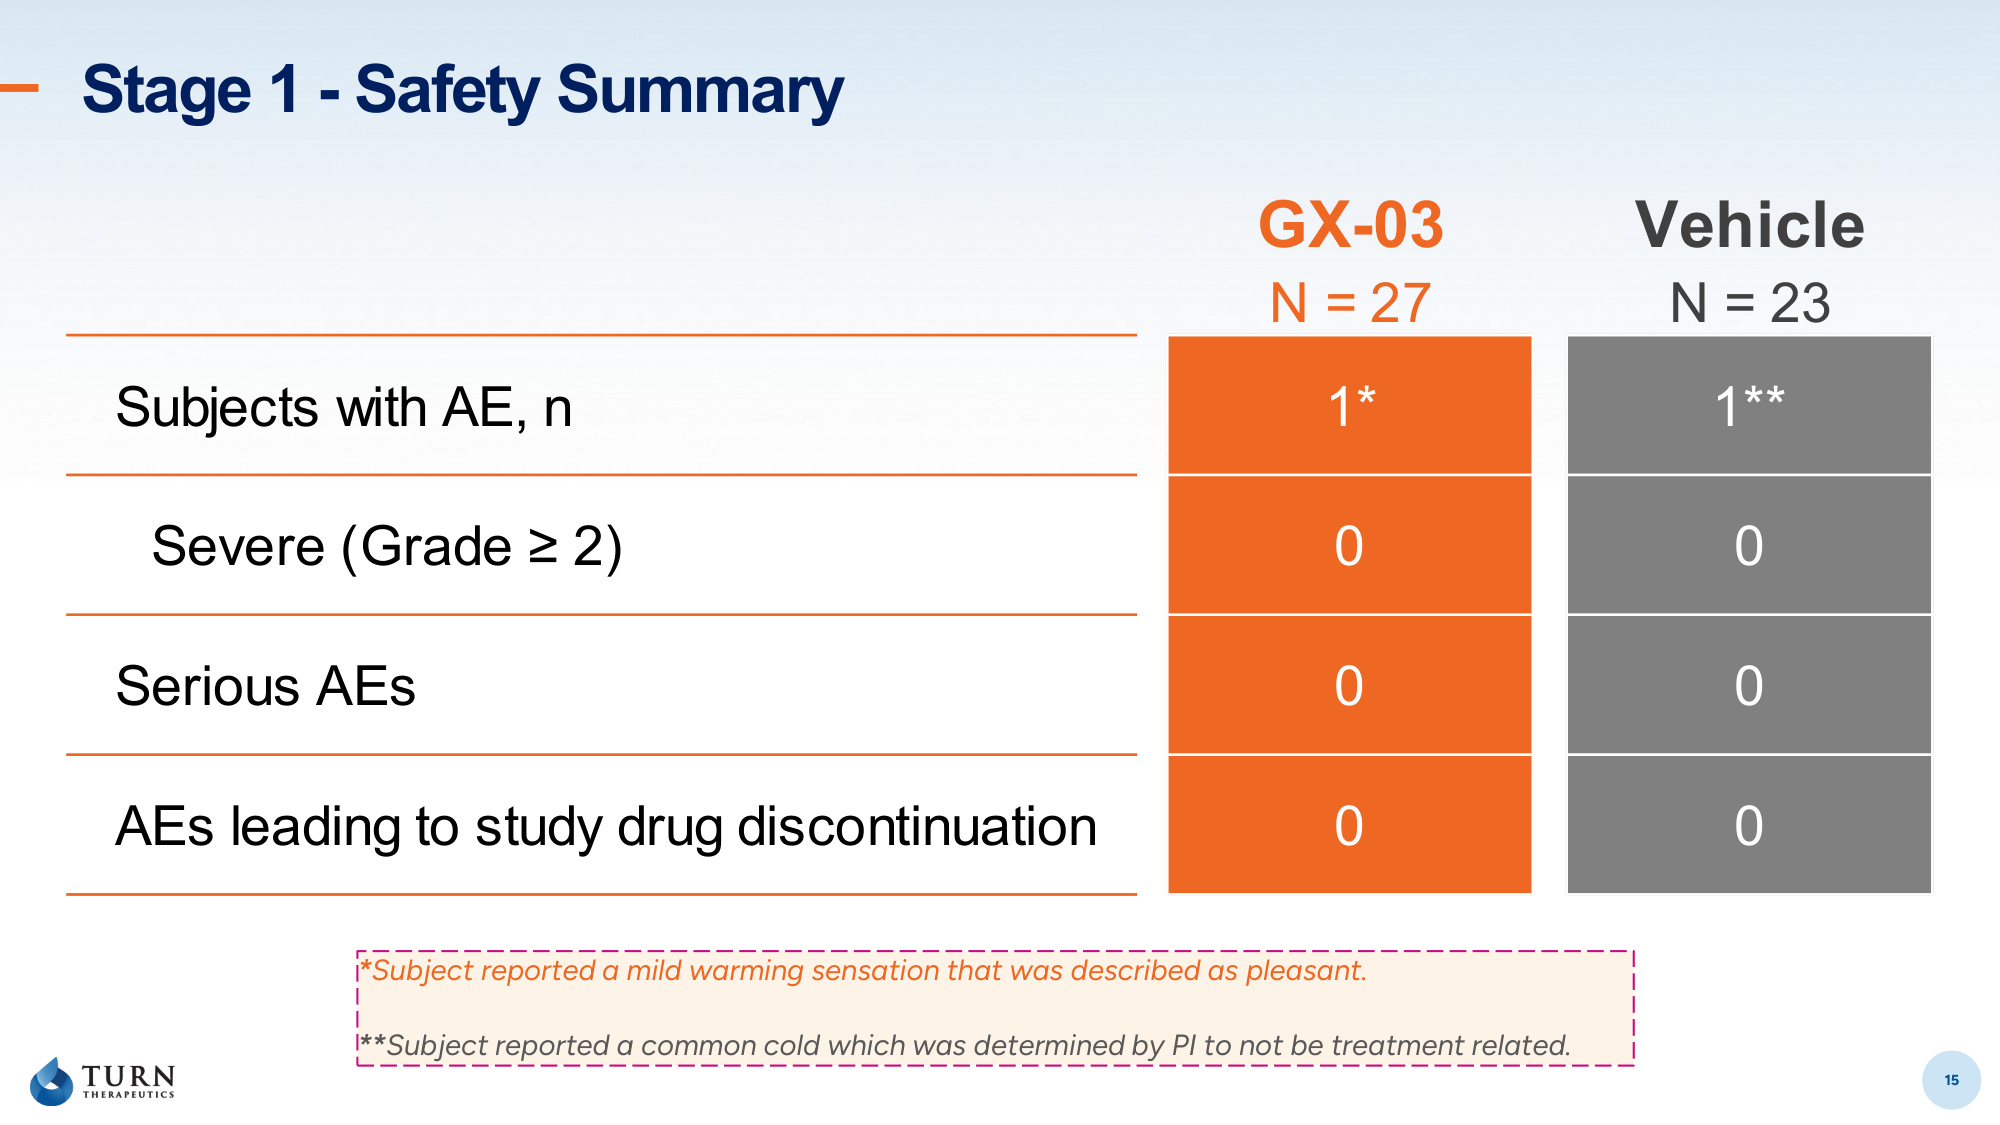
15 Stage 1 - Safety Summary 15 *Subject reported a mild warming sensation that was described as pleasant. **Subject reported a common cold which was determined by PI to not be treatment related. GX-03 Vehicle N = 27 N = 23 Subjects with AE, n 1* 1** Severe (Grade ≥ 2) 0 0 Serious AEs 0 0 AEs leading to study drug discontinuation 0 0
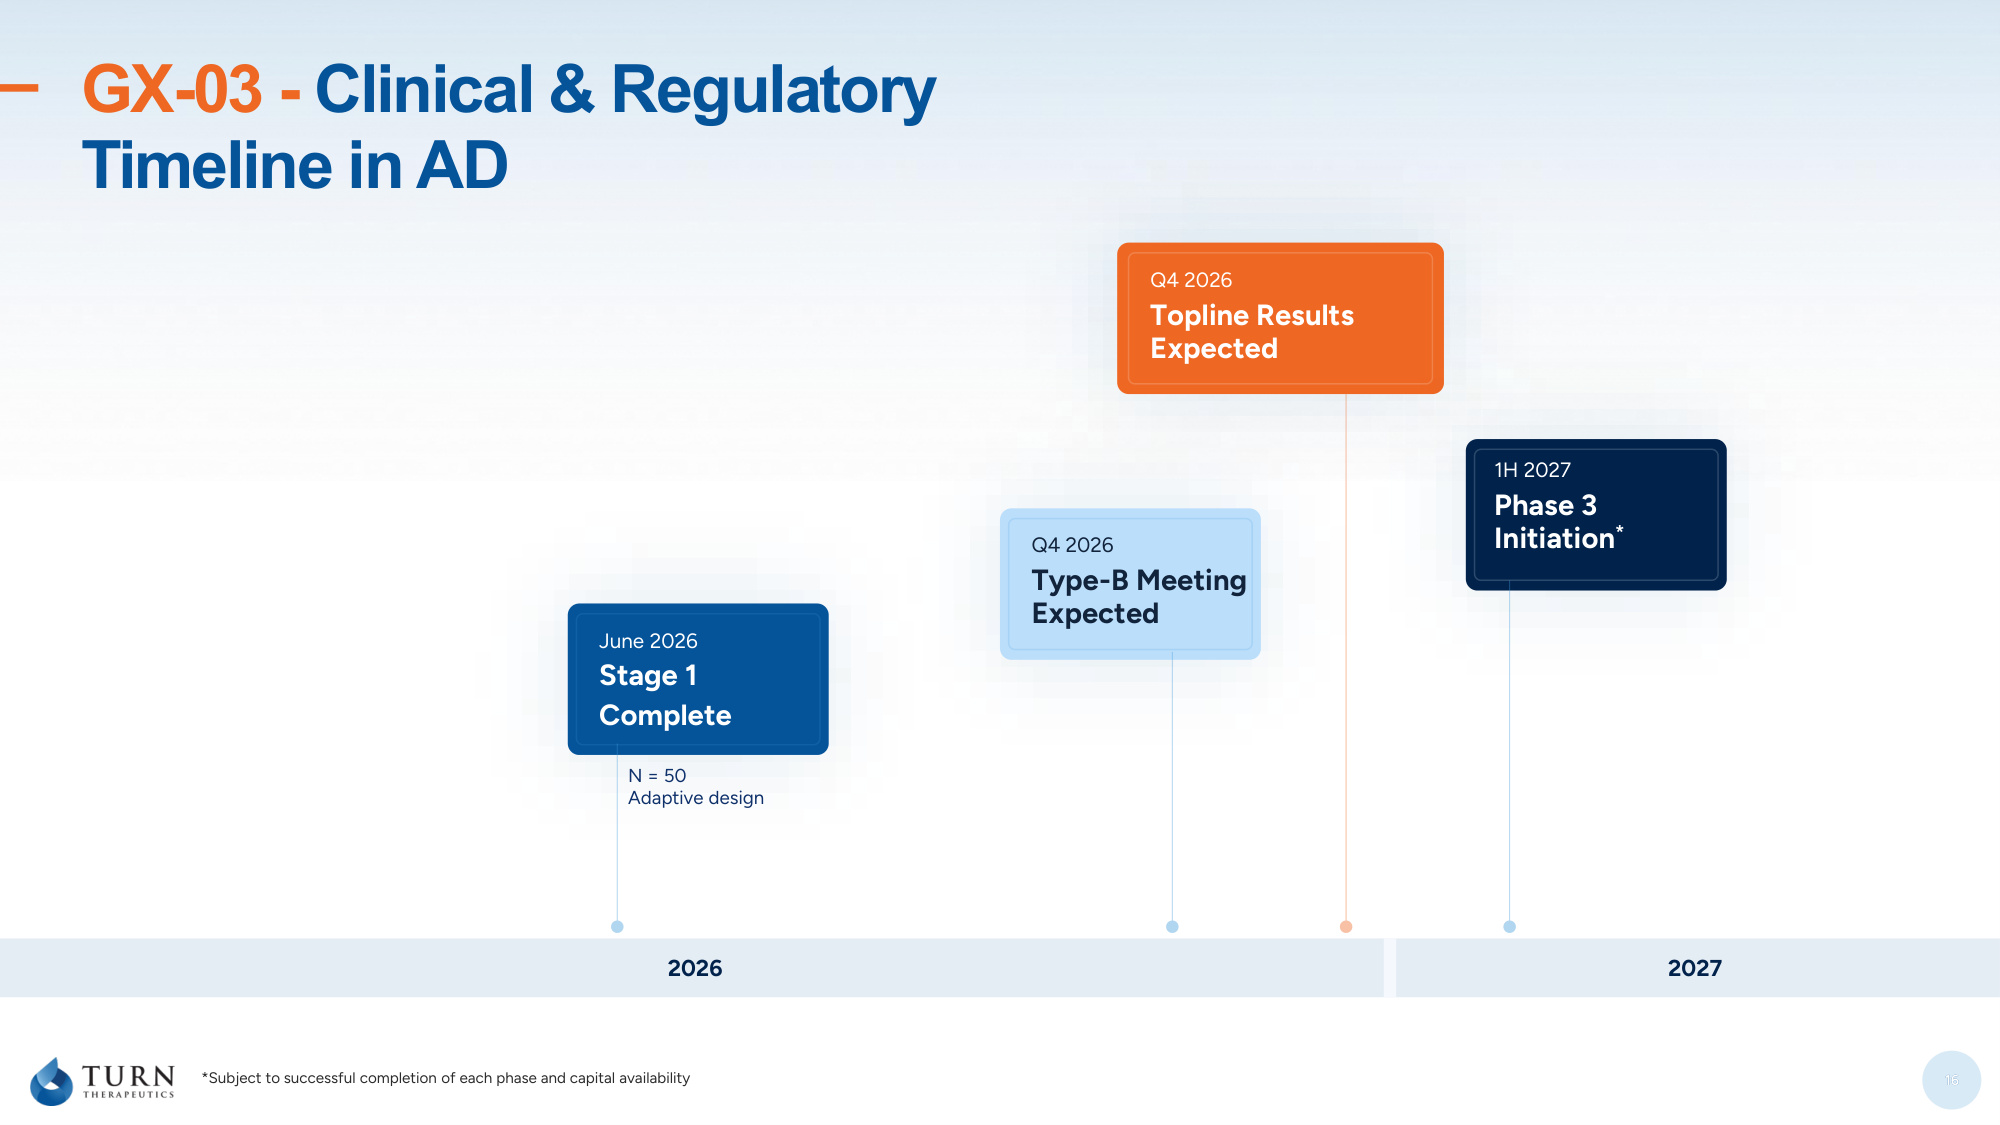
16 GX-03 - Clinical & Regulatory Timeline in AD 16 2026 2027 June 2026 Stage 1 Complete Q4 2026 Topline Results Expected N = 50 Adaptive design Q4 2026 Type-B Meeting Expected 1H 2027 Phase 3 Initiation* *Subject to successful completion of each phase and capital availability
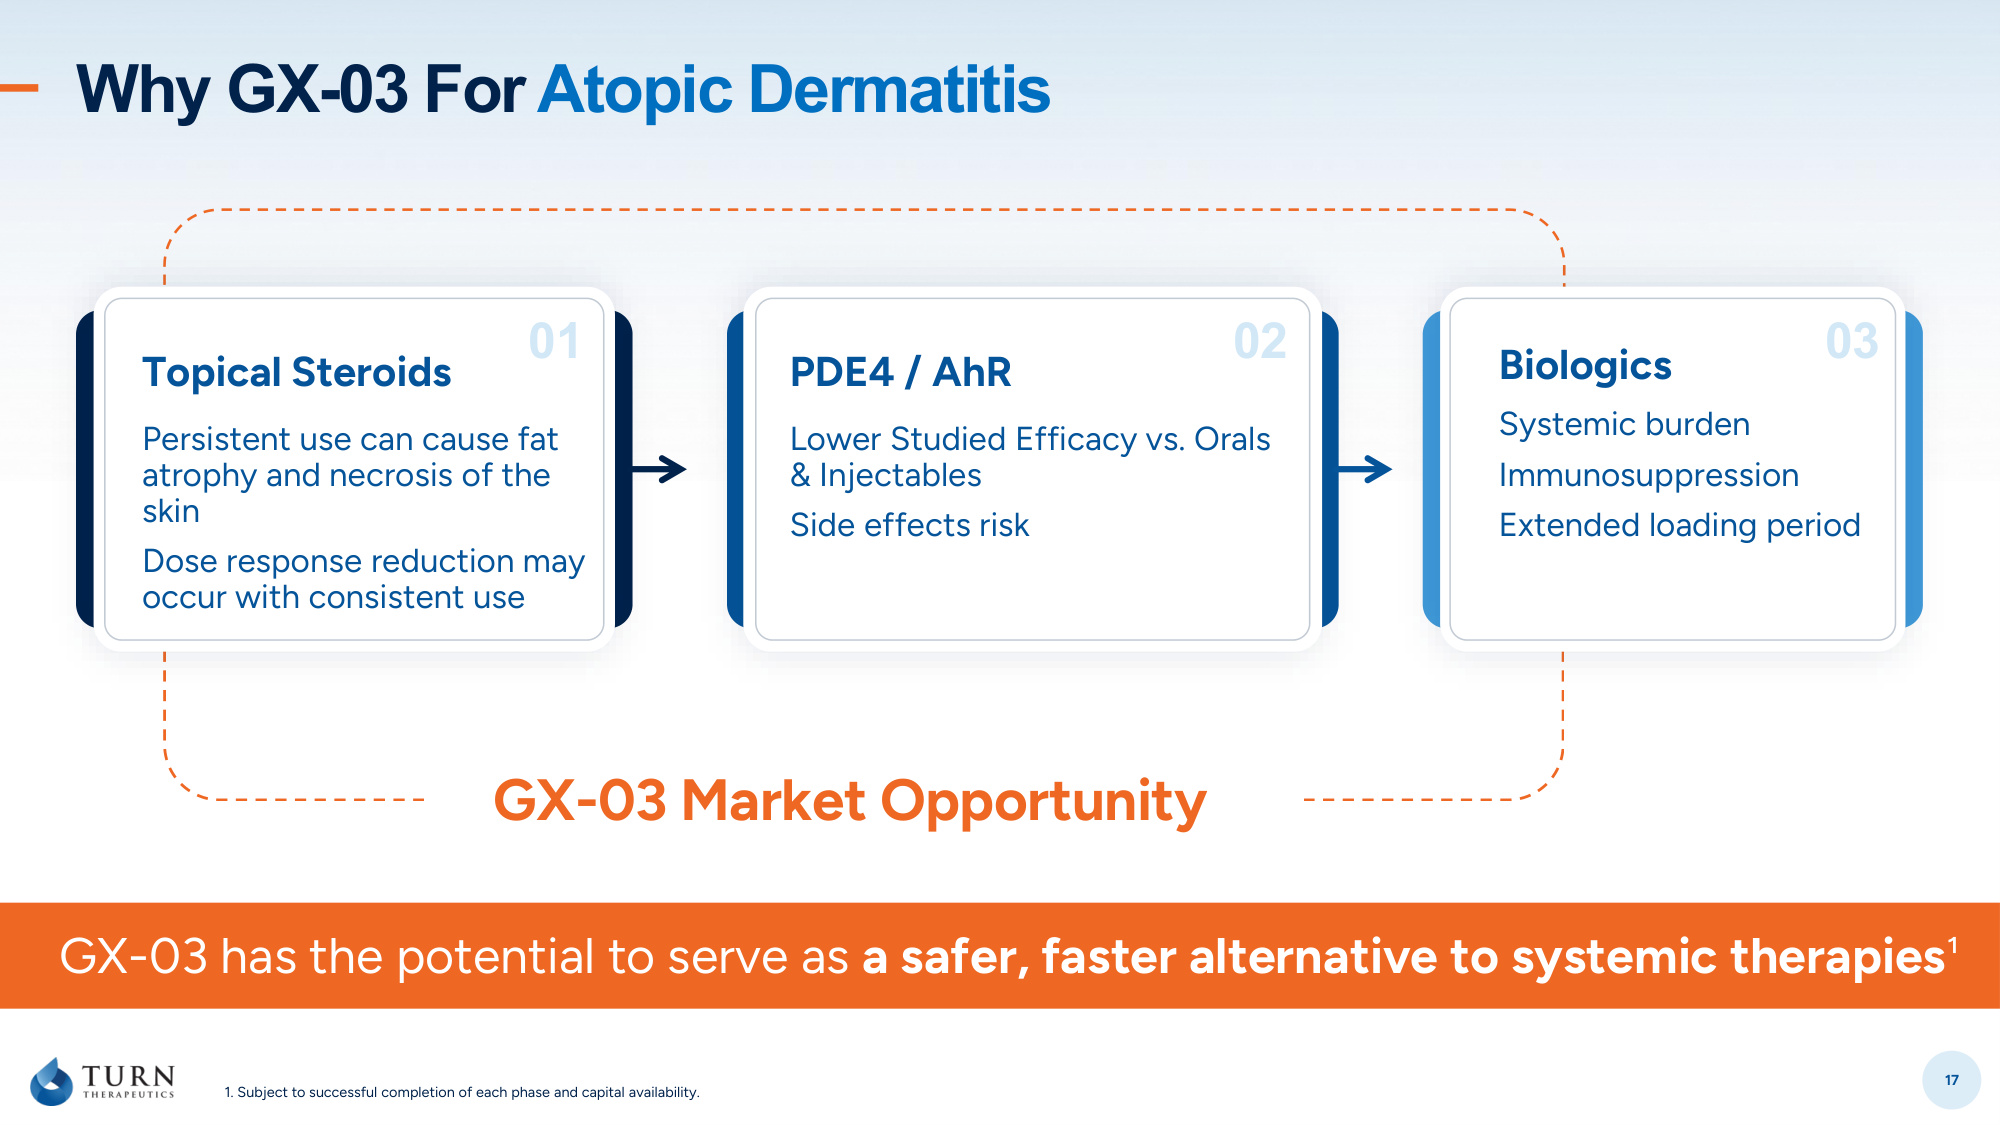
17 GX-03 Market Opportunity 1. Subject to successful completion of each phase and capital availability. Why GX-03 For Atopic Dermatitis 02 03 PDE4 / AhR Lower Studied Efficacy vs. Orals & Injectables Side effects risk Biologics Systemic burden Immunosuppression Extended loading period 01 Topical Steroids Persistent use can cause fat atrophy and necrosis of the skin Dose response reduction may occur with consistent use GX-03 has the potential to serve as a safer, faster alternative to systemic therapies¹

Investors@turntherapeutics.com 250 N. Westlake Blvd, #210 Westlake Village, CA 91362 Thank You!
19 Appendix
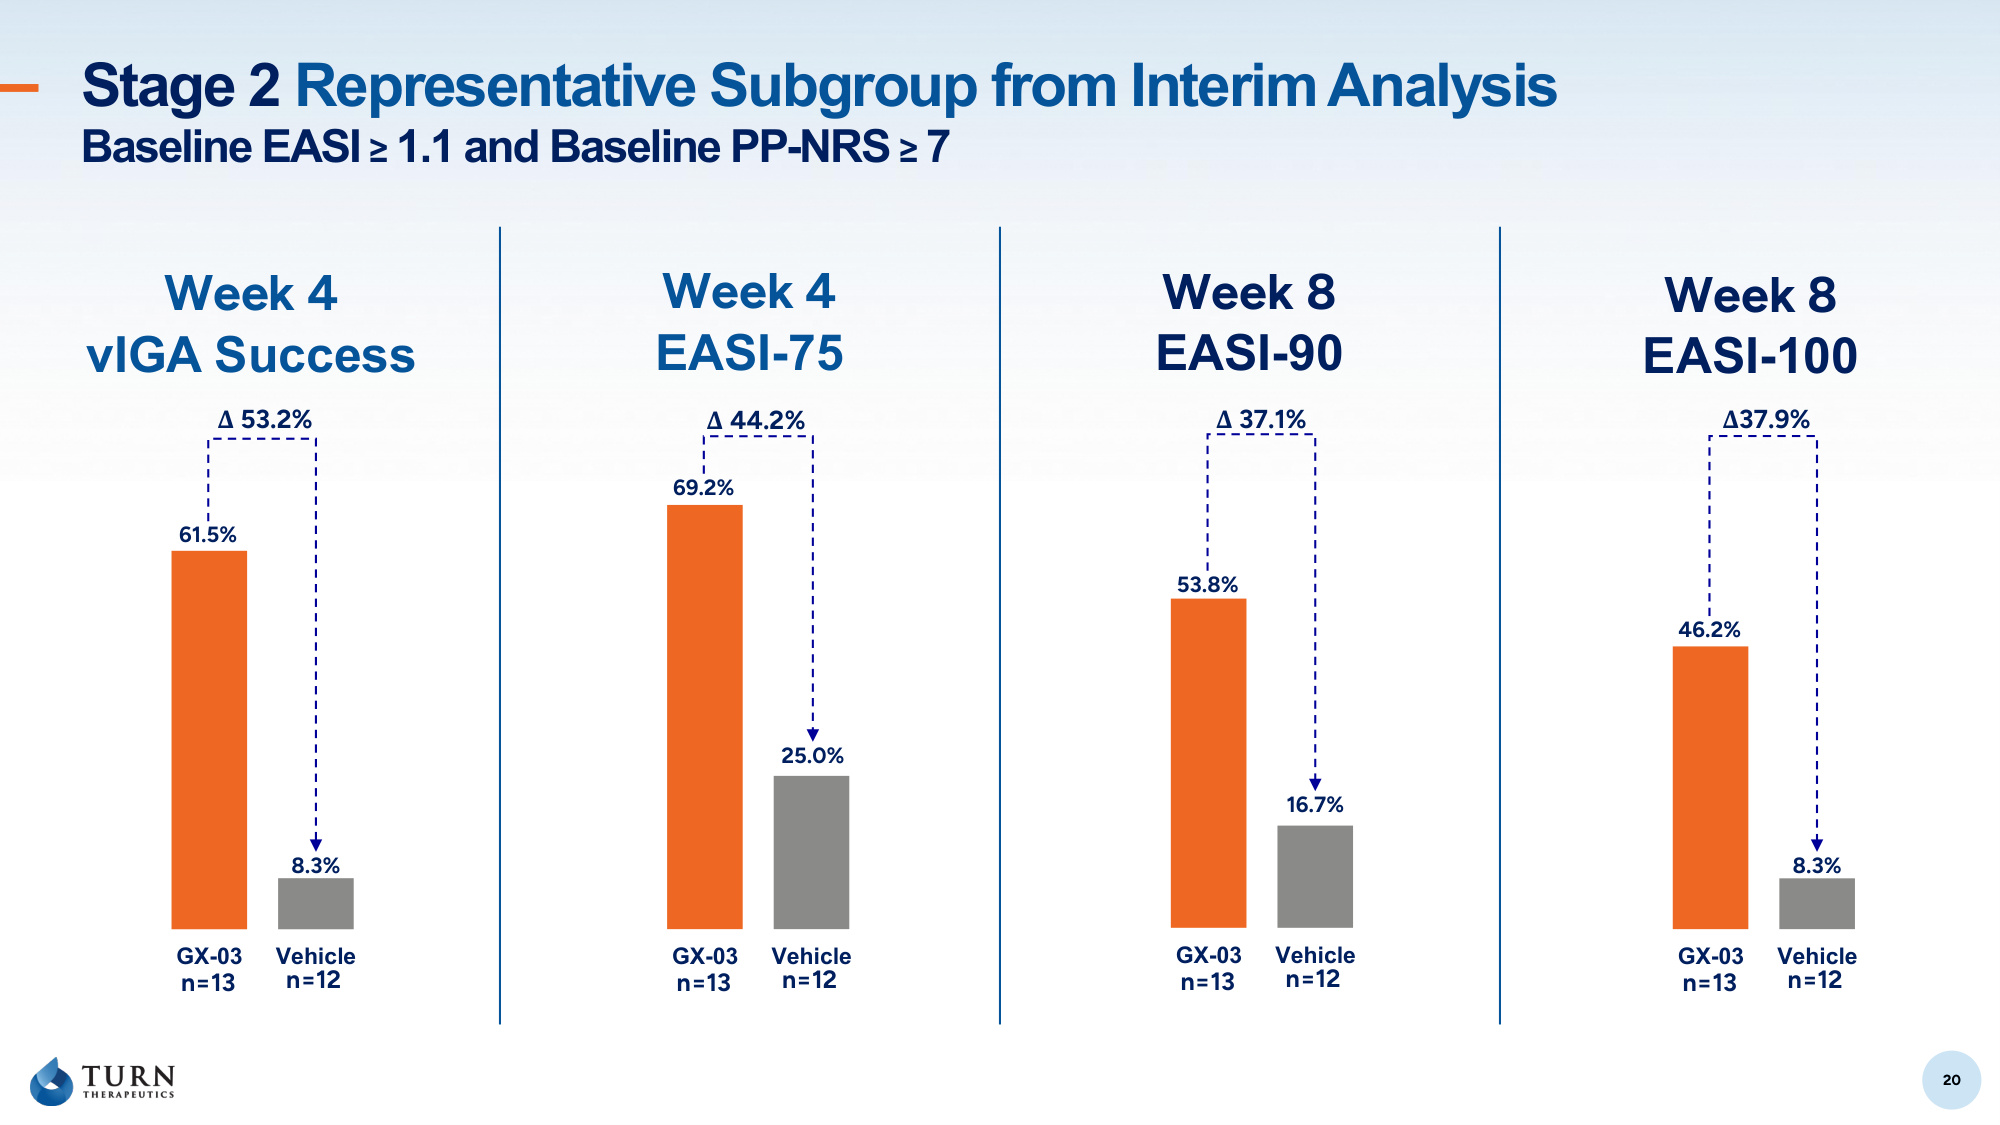
20 Stage 2 Representative Subgroup from Interim Analysis Baseline EASI ≥ 1.1 and Baseline PP-NRS ≥ 7 20 GX-03 Vehicle n=13 n=12 8.3% 61.5% Δ 53.2% Week 4 vIGA Success Week 8 EASI-90 Week 8 EASI-100 Week 4 EASI-75 GX-03 Vehicle n=13 n=12 25.0% 69.2% Δ 44.2% GX-03 Vehicle n=13 n=12 16.7% 53.8% Δ 37.1% GX-03 Vehicle n=13 n=12 8.3% 46.2% Δ37.9%
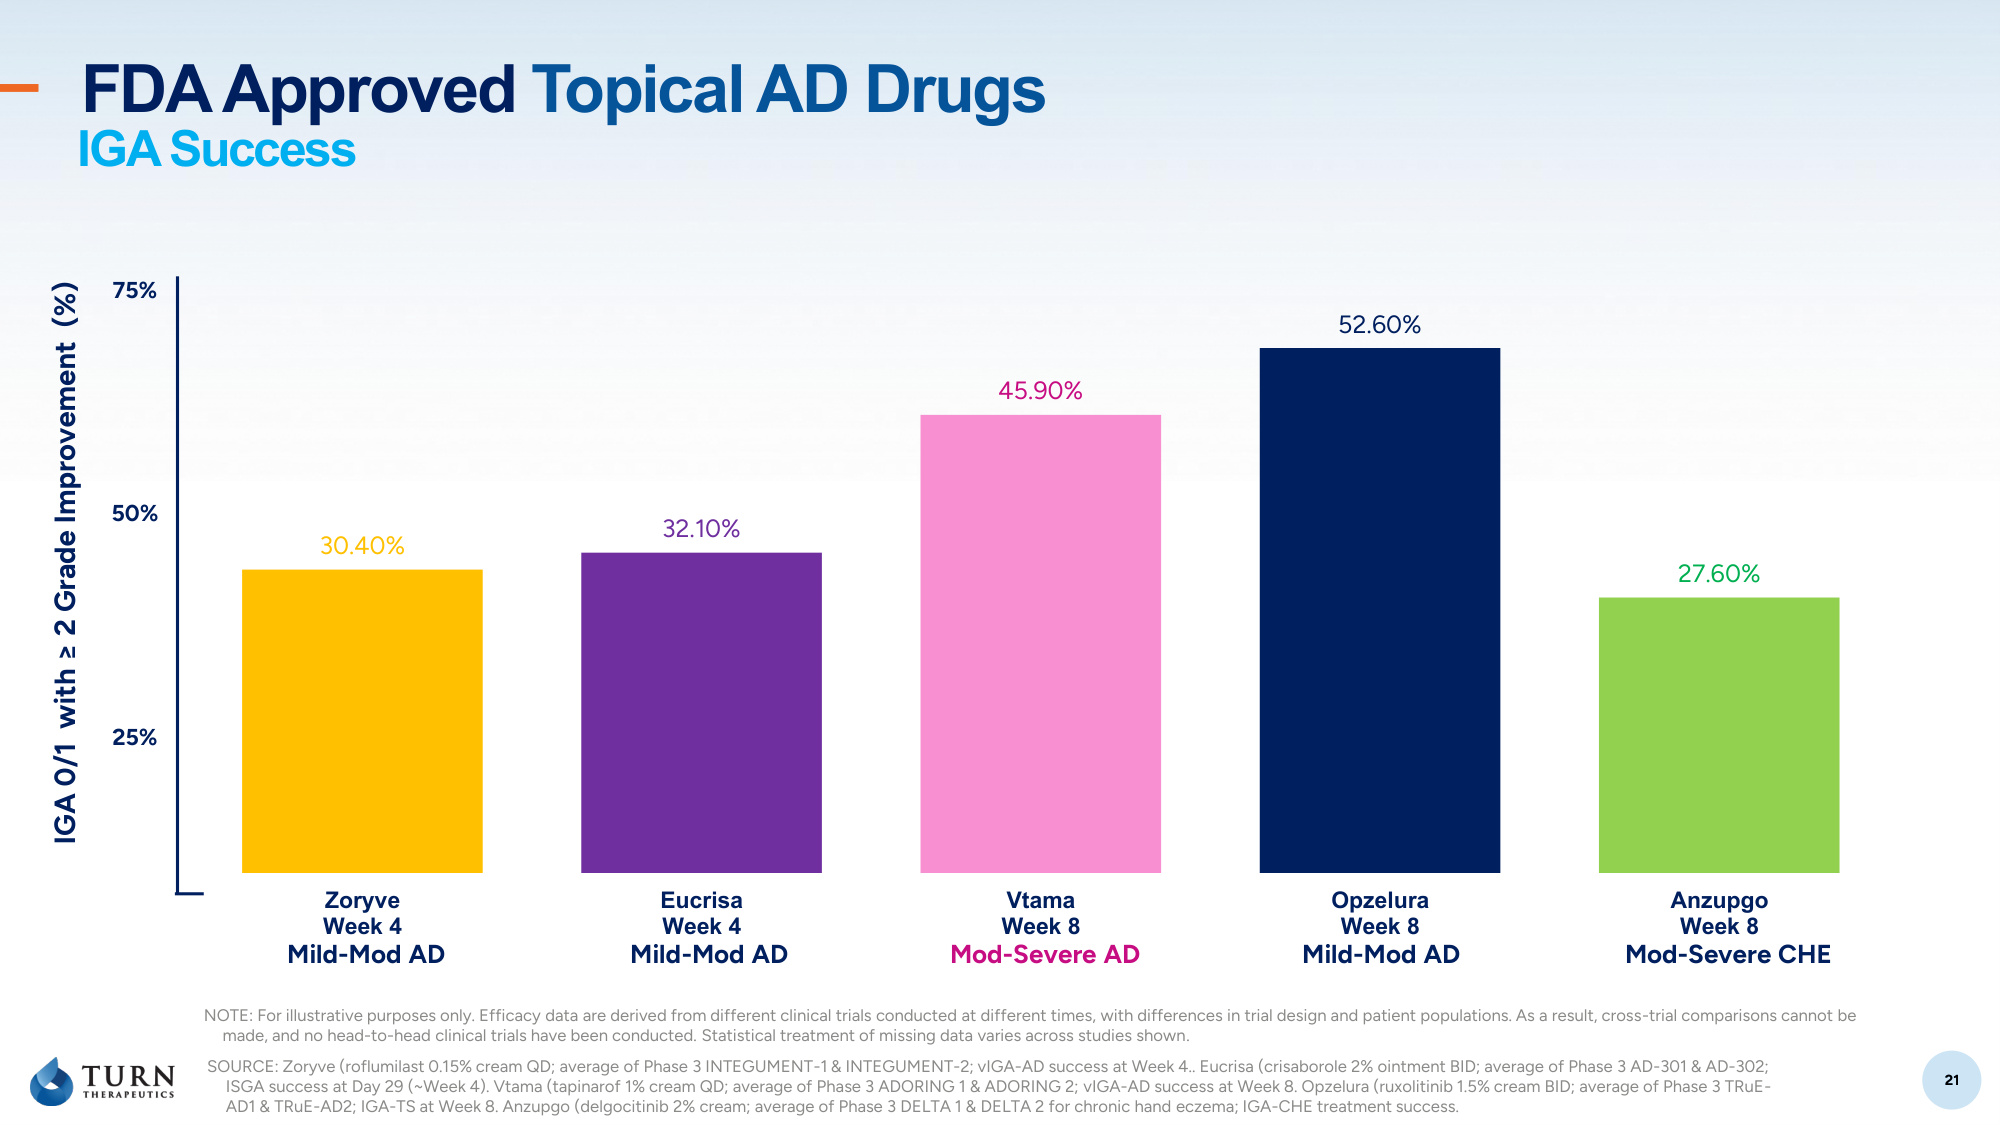
21 21 30.40% 32.10% 45.90% 52.60% 27.60% Zoryve Week 4 Eucrisa Week 4 Vtama Week 8 Opzelura Week 8 Anzupgo Week 8 FDA Approved Topical AD Drugs 25% 50% 75% IGA 0/1 with ≥ 2 Grade Improvement (%) SOURCE: Zoryve (roflumilast 0.15% cream QD; average of Phase 3 INTEGUMENT-1 & INTEGUMENT-2; vIGA-AD success at Week 4.. Eucrisa (crisaborole 2% ointment BID; average of Phase 3 AD-301 & AD-302; ISGA success at Day 29 (~Week 4). Vtama (tapinarof 1% cream QD; average of Phase 3 ADORING 1 & ADORING 2; vIGA-AD success at Week 8. Opzelura (ruxolitinib 1.5% cream BID; average of Phase 3 TRuE- AD1 & TRuE-AD2; IGA-TS at Week 8. Anzupgo (delgocitinib 2% cream; average of Phase 3 DELTA 1 & DELTA 2 for chronic hand eczema; IGA-CHE treatment success. Mild-Mod AD Mild-Mod AD Mod-Severe AD Mild-Mod AD Mod-Severe CHE IGA Success NOTE: For illustrative purposes only. Efficacy data are derived from different clinical trials conducted at different times, with differences in trial design and patient populations. As a result, cross-trial comparisons cannot be made, and no head-to-head clinical trials have been conducted. Statistical treatment of missing data varies across studies shown.
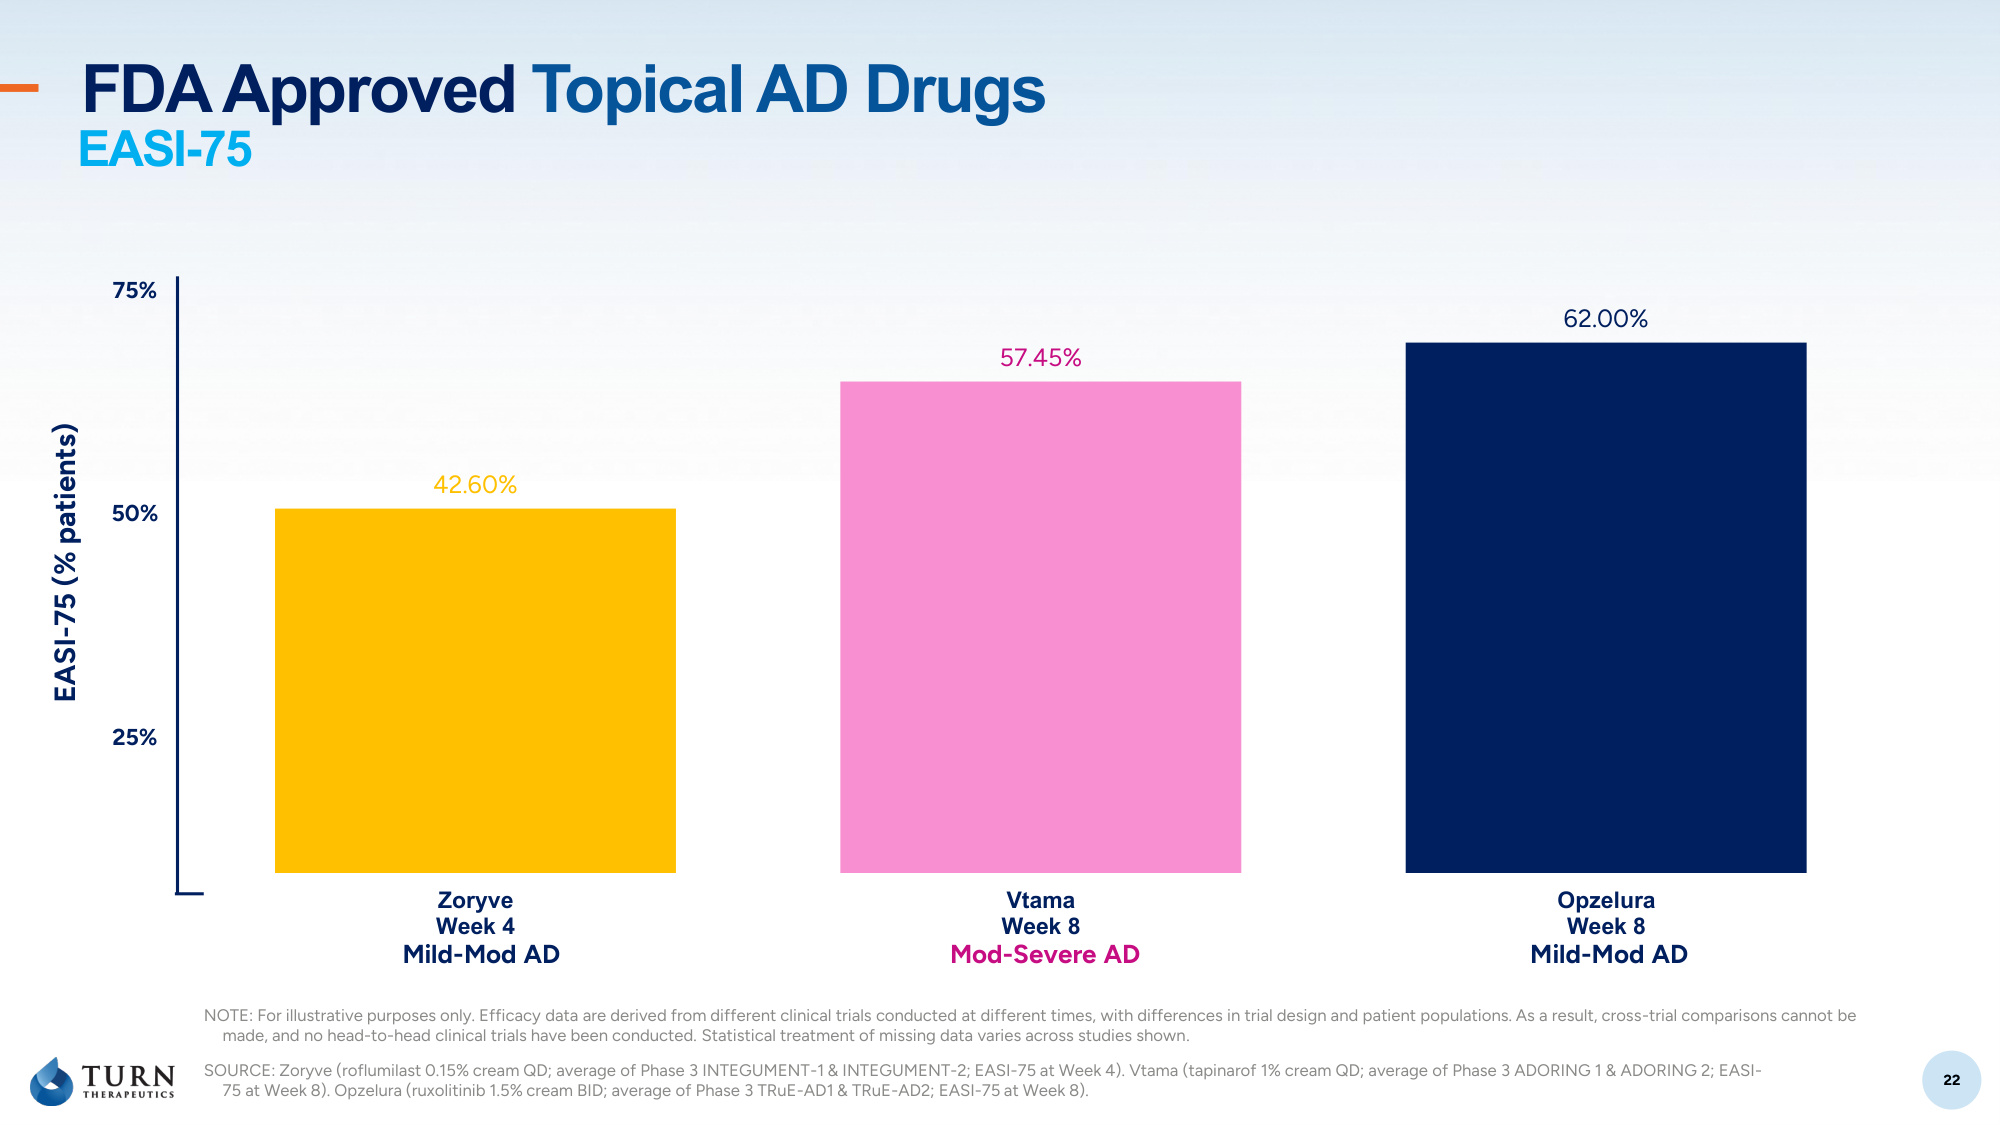
22 22 42.60% 57.45% 62.00% Zoryve Week 4 Vtama Week 8 Opzelura Week 8 FDA Approved Topical AD Drugs 25% 50% 75% EASI-75 (% patients) SOURCE: Zoryve (roflumilast 0.15% cream QD; average of Phase 3 INTEGUMENT-1 & INTEGUMENT-2; EASI-75 at Week 4). Vtama (tapinarof 1% cream QD; average of Phase 3 ADORING 1 & ADORING 2; EASI- 75 at Week 8). Opzelura (ruxolitinib 1.5% cream BID; average of Phase 3 TRuE-AD1 & TRuE-AD2; EASI-75 at Week 8). Mild-Mod AD Mod-Severe AD Mild-Mod AD EASI-75 NOTE: For illustrative purposes only. Efficacy data are derived from different clinical trials conducted at different times, with differences in trial design and patient populations. As a result, cross-trial comparisons cannot be made, and no head-to-head clinical trials have been conducted. Statistical treatment of missing data varies across studies shown.
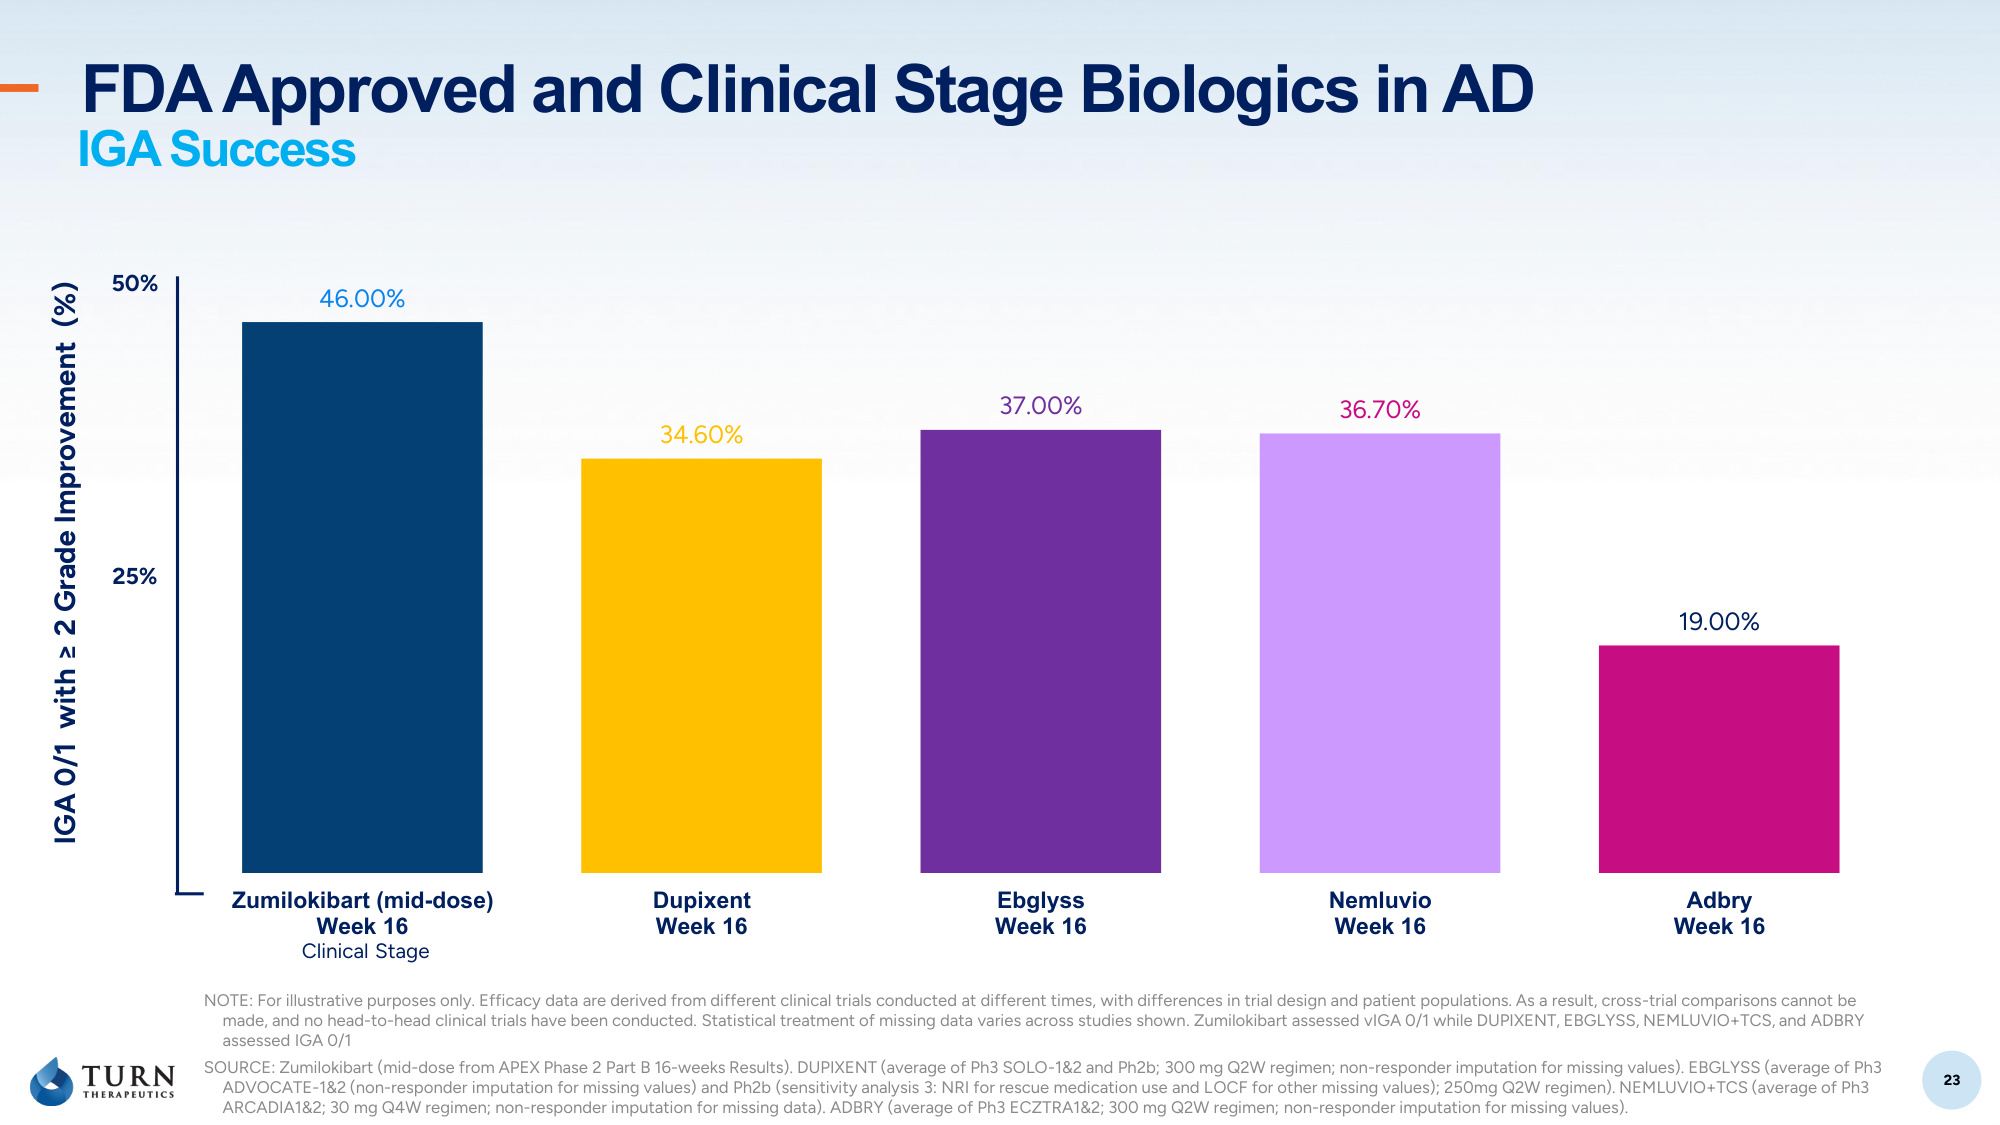
23 23 46.00% 34.60% 37.00% 36.70% 19.00% Zumilokibart (mid-dose) Week 16 Dupixent Week 16 Ebglyss Week 16 Nemluvio Week 16 Adbry Week 16 FDA Approved and Clinical Stage Biologics in AD 25% 50% IGA 0/1 with ≥ 2 Grade Improvement (%) SOURCE: Zumilokibart (mid-dose from APEX Phase 2 Part B 16-weeks Results). DUPIXENT (average of Ph3 SOLO-1&2 and Ph2b; 300 mg Q2W regimen; non-responder imputation for missing values). EBGLYSS (average of Ph3 ADVOCATE-1&2 (non-responder imputation for missing values) and Ph2b (sensitivity analysis 3: NRI for rescue medication use and LOCF for other missing values); 250mg Q2W regimen). NEMLUVIO+TCS (average of Ph3 ARCADIA1 30 mg Q4W regimen; non-responder imputation for missing data). ADBRY (average of Ph3 ECZTRA1 300 mg Q2W regimen; non-responder imputation for missing values). Clinical Stage IGA Success NOTE: For illustrative purposes only. Efficacy data are derived from different clinical trials conducted at different times, with differences in trial design and patient populations. As a result, cross-trial comparisons cannot be made, and no head-to-head clinical trials have been conducted. Statistical treatment of missing data varies across studies shown. Zumilokibart assessed vIGA 0/1 while DUPIXENT, EBGLYSS, NEMLUVIO+TCS, and ADBRY assessed IGA 0/1
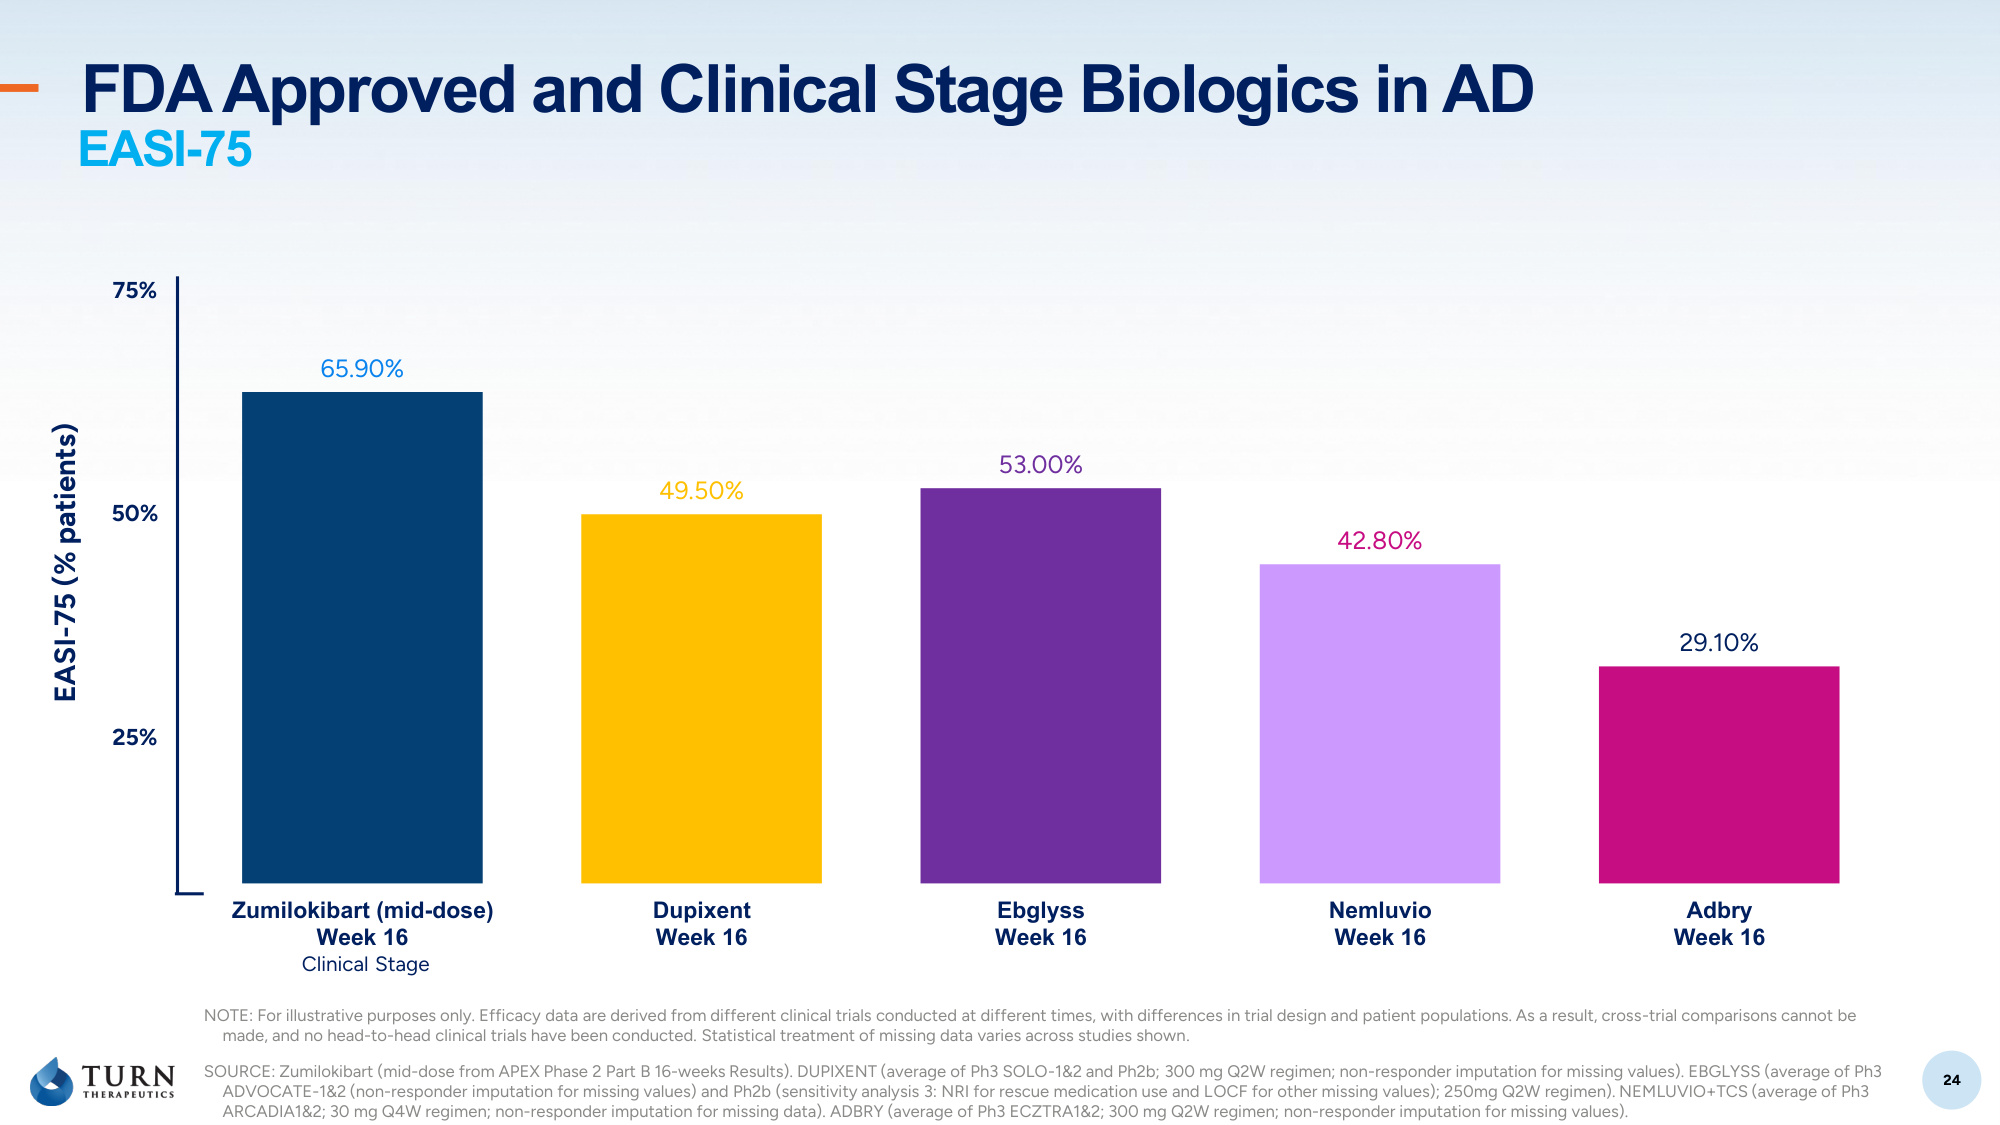
24 24 65.90% 49.50% 53.00% 42.80% 29.10% Zumilokibart (mid-dose) Week 16 Dupixent Week 16 Ebglyss Week 16 Nemluvio Week 16 Adbry Week 16 25% 50% 75% EASI-75 (% patients) SOURCE: Zumilokibart (mid-dose from APEX Phase 2 Part B 16-weeks Results). DUPIXENT (average of Ph3 SOLO-1&2 and Ph2b; 300 mg Q2W regimen; non-responder imputation for missing values). EBGLYSS (average of Ph3 ADVOCATE-1&2 (non-responder imputation for missing values) and Ph2b (sensitivity analysis 3: NRI for rescue medication use and LOCF for other missing values); 250mg Q2W regimen). NEMLUVIO+TCS (average of Ph3 ARCADIA1 30 mg Q4W regimen; non-responder imputation for missing data). ADBRY (average of Ph3 ECZTRA1 300 mg Q2W regimen; non-responder imputation for missing values). Clinical Stage EASI-75 NOTE: For illustrative purposes only. Efficacy data are derived from different clinical trials conducted at different times, with differences in trial design and patient populations. As a result, cross-trial comparisons cannot be made, and no head-to-head clinical trials have been conducted. Statistical treatment of missing data varies across studies shown. FDA Approved and Clinical Stage Biologics in AD
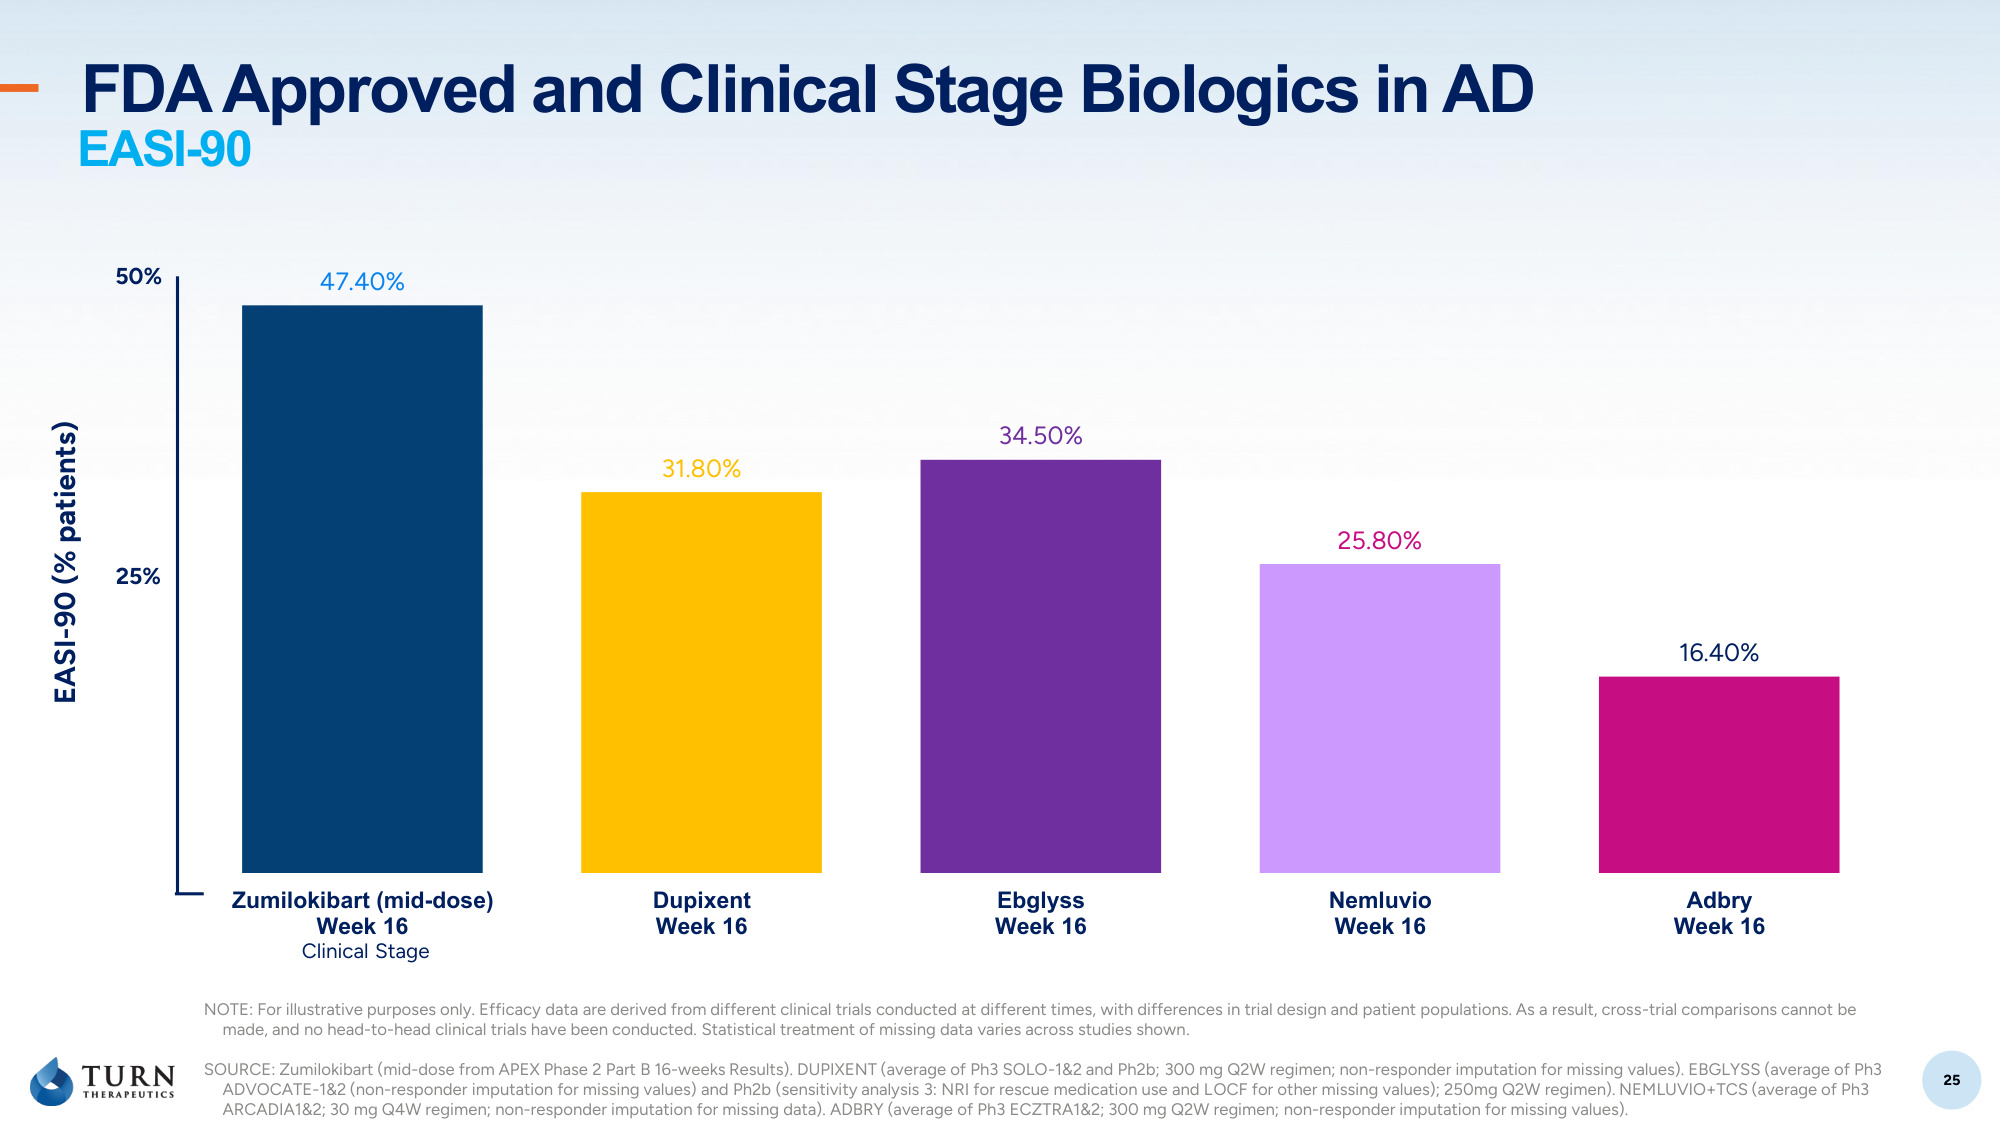
25 25 47.40% 31.80% 34.50% 25.80% 16.40% Zumilokibart (mid-dose) Week 16 Dupixent Week 16 Ebglyss Week 16 Nemluvio Week 16 Adbry Week 16 25% 50% EASI-90 (% patients) SOURCE: Zumilokibart (mid-dose from APEX Phase 2 Part B 16-weeks Results). DUPIXENT (average of Ph3 SOLO-1&2 and Ph2b; 300 mg Q2W regimen; non-responder imputation for missing values). EBGLYSS (average of Ph3 ADVOCATE-1&2 (non-responder imputation for missing values) and Ph2b (sensitivity analysis 3: NRI for rescue medication use and LOCF for other missing values); 250mg Q2W regimen). NEMLUVIO+TCS (average of Ph3 ARCADIA1 30 mg Q4W regimen; non-responder imputation for missing data). ADBRY (average of Ph3 ECZTRA1 300 mg Q2W regimen; non-responder imputation for missing values). Clinical Stage EASI-90 NOTE: For illustrative purposes only. Efficacy data are derived from different clinical trials conducted at different times, with differences in trial design and patient populations. As a result, cross-trial comparisons cannot be made, and no head-to-head clinical trials have been conducted. Statistical treatment of missing data varies across studies shown. FDA Approved and Clinical Stage Biologics in AD