Shareholder Report
Mar. 31, 2026
USD ($)
Holding
This report describes changes to the Fund that occurred during the reporting period.
What were the Fund costs for the last year? (based on a hypothetical $10,000 investment)
| Cost of a $10,000 investment |
Costs paid as a percentage of $10,000 investment* | |||
| Class W Shares |
$0 | 0.00% | ||
* Annualized for period less than one year.
How did the Fund perform last year? What affected the Fund’s performance?
| Performance Highlights • The Nuveen Core Bond Fund returned 4.77% for Class W Shares at net asset value (NAV) for the 12 months ended March 31, 2026. The Fund outperformed the Bloomberg U.S. Aggregate Bond Index, which returned 4.35%. • Top contributors to relative performance • An overweight to corporate bonds, including small out‑of‑benchmark allocations to high-yield and emerging-markets corporate bonds and a corresponding underweight to U.S. Treasuries. • Out‑of‑benchmark exposure to non‑agency mortgage-backed securities and an overweight to emerging-markets debt. • Security selection, especially within investment-grade corporate bonds and commercial mortgage-backed securities. • Top detractors from relative performance • Yield curve positioning. |
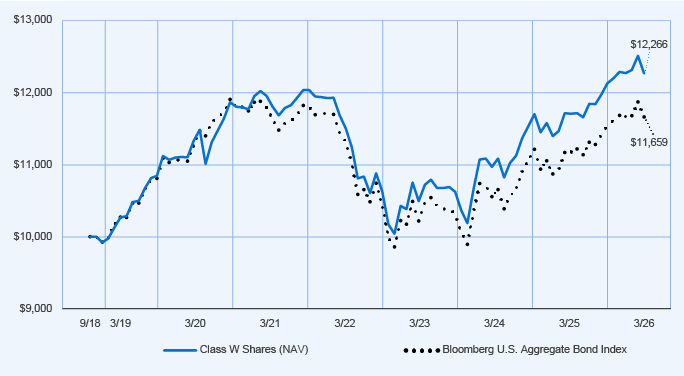
Average Annual Total Returns
| 1‑Year | 5‑Year | Since Inception (9/28/18) |
||||||||||
| Class W Shares at NAV |
4.77% | 0.98% | 2.76% | |||||||||
| Bloomberg U.S. Aggregate Bond Index |
4.35 | % | 0.31 | % | 2.07 | % | ||||||
Fund Statistics (as of March 31, 2026)
| Fund net assets |
$ 10,171,187,634 | |||
| Total number of portfolio holdings |
1,914 | |||
| Portfolio turnover (%) |
113% | |||
| Total management fees paid for the year |
$ 28,812,835 | |||
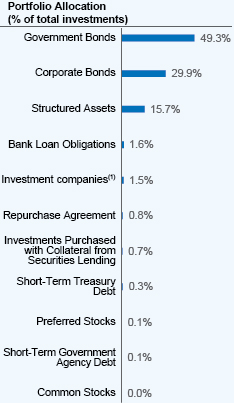
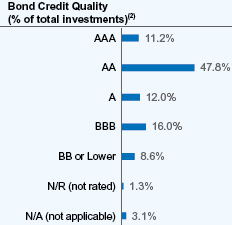
(1) Affiliated investment.
(2) Credit quality ratings are based on the Bloomberg Barclays methodology, which uses the median rating of those compiled by the Moody’s, Standard & Poor’s and Fitch ratings agencies. If ratings are available from only two of these agencies, the lower rating is used. When only one rating is available, that one is used. These ratings are subject to change without notice.
How has the Fund changed?
For more complete information, you may review the Fund’s next prospectus, which is expected to be available by August 1, 2026 at https://www.nuveen.com/en‑us/mutual‑funds/prospectuses or upon request at (800) 257‑8787.
For more complete information, you may review the Fund’s next prospectus, which is expected to be available by August 1, 2026 at https://www.nuveen.com/en‑us/mutual‑funds/prospectuses or upon request at (800) 257‑8787.
This report describes changes to the Fund that occurred during the reporting period.
What were the Fund costs for the last year? (based on a hypothetical $10,000 investment)
| Cost of a $10,000 investment |
Costs paid as a percentage of $10,000 investment* | |||
| Retirement Class Shares |
$54 | 0.53% | ||
* Annualized for period less than one year.
How did the Fund perform last year? What affected the Fund’s performance?
| Performance Highlights • The Nuveen Core Bond Fund returned 4.33% for Retirement Class Shares at net asset value (NAV) for the 12 months ended March 31, 2026. The Fund performed in line with the Bloomberg U.S. Aggregate Bond Index, which returned 4.35%. • Top contributors to relative performance • An overweight to corporate bonds, including small out‑of‑benchmark allocations to high-yield and emerging-markets corporate bonds and a corresponding underweight to U.S. Treasuries. • Out‑of‑benchmark exposure to non‑agency mortgage-backed securities and an overweight to emerging-markets debt. • Security selection, especially within investment-grade corporate bonds and commercial mortgage-backed securities. • Top detractors from relative performance • Yield curve positioning. |
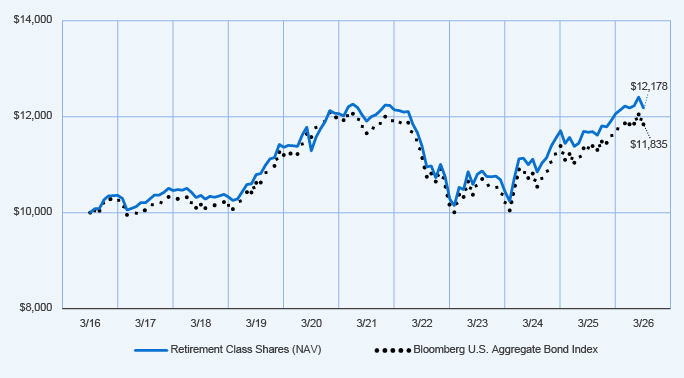
Average Annual Total Returns
| 1‑Year | 5‑Year | 10‑Year | ||||
| Retirement Class Shares at NAV |
4.33% | 0.45% | 1.99% | |||
| Bloomberg U.S. Aggregate Bond Index |
4.35% | 0.31% | 1.70% | |||
Fund Statistics (as of March 31, 2026)
| Fund net assets |
$10,171,187,634 | |||
| Total number of portfolio holdings |
1,914 | |||
| Portfolio turnover (%) |
113% | |||
| Total management fees paid for the year |
|
$ 28,812,835 |
| |
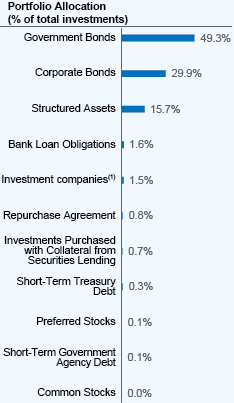
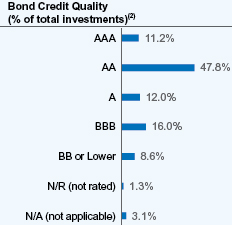
(1) Affiliated investment.
(2) Credit quality ratings are based on the Bloomberg Barclays methodology, which uses the median rating of those compiled by the Moody’s, Standard & Poor’s and Fitch ratings agencies. If ratings are available from only two of these agencies, the lower rating is used. When only one rating is available, that one is used. These ratings are subject to change without notice.
How has the Fund changed?
For more complete information, you may review the Fund’s next prospectus, which is expected to be available by August 1, 2026 at https://www.nuveen.com/en‑us/mutual‑funds/prospectuses or upon request at (800) 257‑8787.
For more complete information, you may review the Fund’s next prospectus, which is expected to be available by August 1, 2026 at https://www.nuveen.com/en‑us/mutual‑funds/prospectuses or upon request at (800) 257‑8787.
This report describes changes to the Fund that occurred during the reporting period.
What were the Fund costs for the last year? (based on a hypothetical $10,000 investment)
| Cost of a $10,000 investment |
Costs paid as a percentage of $10,000 investment* | |||
| Class R6 Shares |
$29 | 0.28% | ||
* Annualized for period less than one year.
How did the Fund perform last year? What affected the Fund’s performance?
| Performance Highlights • The Nuveen Core Bond Fund returned 4.48% for Class R6 Shares at net asset value (NAV) for the 12 months ended March 31, 2026. The Fund performed in line with the Bloomberg U.S. Aggregate Bond Index, which returned 4.35%. • Top contributors to relative performance • An overweight to corporate bonds, including small out‑of‑benchmark allocations to high-yield and emerging-markets corporate bonds and a corresponding underweight to U.S. Treasuries. • Out‑of‑benchmark exposure to non‑agency mortgage-backed securities and an overweight to emerging-markets debt. • Security selection, especially within investment-grade corporate bonds and commercial mortgage-backed securities. • Top detractors from relative performance • Yield curve positioning. |
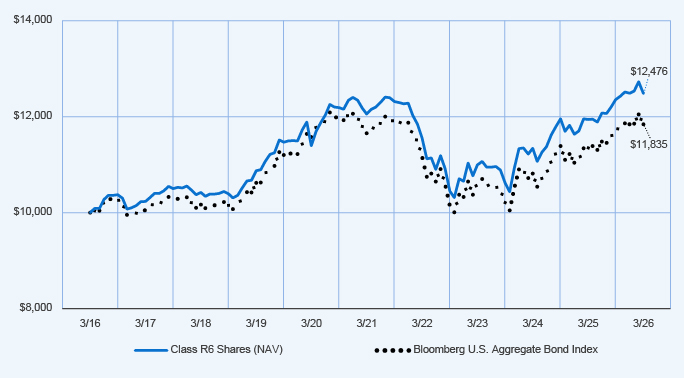
Average Annual Total Returns
| 1‑Year | 5‑Year | 10‑Year | ||||
| Class R6 Shares at NAV |
4.48% | 0.69% | 2.24% | |||
| Bloomberg U.S. Aggregate Bond Index |
4.35% | 0.31% | 1.70% | |||
Fund Statistics (as of March 31, 2026)
| Fund net assets |
$10,171,187,634 | |||
| Total number of portfolio holdings |
1,914 | |||
| Portfolio turnover (%) |
113% | |||
| Total management fees paid for the year |
$ 28,812,835 | |||
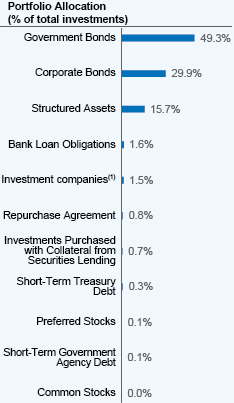
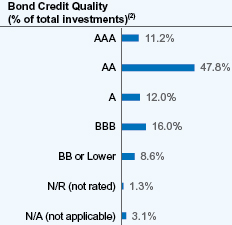
(1) Affiliated investment.
(2) Credit quality ratings are based on the Bloomberg Barclays methodology, which uses the median rating of those compiled by the Moody’s, Standard & Poor’s and Fitch ratings agencies. If ratings are available from only two of these agencies, the lower rating is used. When only one rating is available, that one is used. These ratings are subject to change without notice.
How has the Fund changed?
For more complete information, you may review the Fund’s next prospectus, which is expected to be available by August 1, 2026 at https://www.nuveen.com/en‑us/mutual‑funds/prospectuses or upon request at (800) 257‑8787.
For more complete information, you may review the Fund’s next prospectus, which is expected to be available by August 1, 2026 at https://www.nuveen.com/en‑us/mutual‑funds/prospectuses or upon request at (800) 257‑8787.
https://www.nuveen.com/en‑us/mutual‑funds/prospectuses. You can also request this information by contacting us at (800) 257‑8787.
This report describes changes to the Fund that occurred during the reporting period.
What were the Fund costs for the last year? (based on a hypothetical $10,000 investment)
| Cost of a $10,000 investment |
Costs paid as a percentage of $10,000 investment* | |||
| Premier Class Shares |
$44 | 0.43% | ||
* Annualized for period less than one year.
How did the Fund perform last year? What affected the Fund’s performance?
| Performance Highlights • The Nuveen Core Bond Fund returned 4.44% for Premier Class Shares at net asset value (NAV) for the 12 months ended March 31, 2026. The Fund performed in line with the Bloomberg U.S. Aggregate Bond Index, which returned 4.35%. • Top contributors to relative performance • An overweight to corporate bonds, including small out‑of‑benchmark allocations to high-yield and emerging-markets corporate bonds and a corresponding underweight to U.S. Treasuries. • Out‑of‑benchmark exposure to non‑agency mortgage-backed securities and an overweight to emerging-markets debt. • Security selection, especially within investment-grade corporate bonds and commercial mortgage-backed securities. • Top detractors from relative performance • Yield curve positioning. |
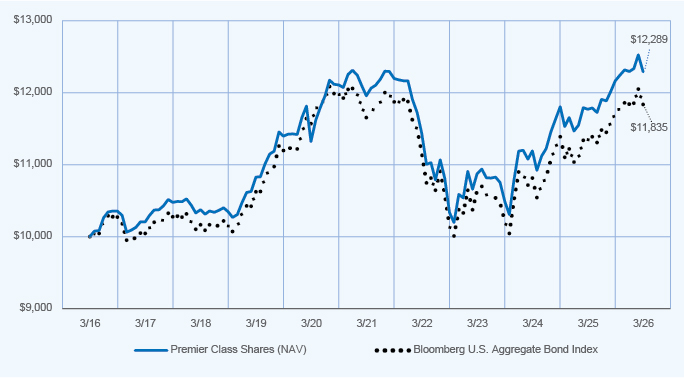
Average Annual Total Returns
| 1‑Year | 5‑Year | 10‑Year | ||||
| Premier Class Shares at NAV |
4.44% | 0.56% | 2.08% | |||
| Bloomberg U.S. Aggregate Bond Index |
4.35% | 0.31% | 1.70% | |||
Fund Statistics (as of March 31, 2026)
| Fund net assets |
$10,171,187,634 | |||
| Total number of portfolio holdings |
1,914 | |||
| Portfolio turnover (%) |
113% | |||
| Total management fees paid for the year |
$ 28,812,835 | |||
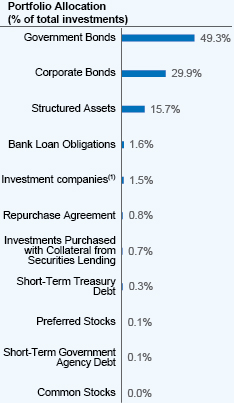
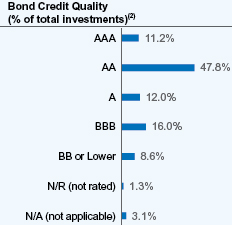
(1) Affiliated investment.
(2) Credit quality ratings are based on the Bloomberg Barclays methodology, which uses the median rating of those compiled by the Moody’s, Standard & Poor’s and Fitch ratings agencies. If ratings are available from only two of these agencies, the lower rating is used. When only one rating is available, that one is used. These ratings are subject to change without notice.
How has the Fund changed?
For more complete information, you may review the Fund’s next prospectus, which is expected to be available by August 1, 2026 at https://www.nuveen.com/en‑us/mutual‑funds/prospectuses or upon request at (800) 257‑8787.
For more complete information, you may review the Fund’s next prospectus, which is expected to be available by August 1, 2026 at https://www.nuveen.com/en‑us/mutual‑funds/prospectuses or upon request at (800) 257‑8787.
This report describes changes to the Fund that occurred during the reporting period.
What were the Fund costs for the last year? (based on a hypothetical $10,000 investment)
| Cost of a $10,000 investment |
Costs paid as a percentage of $10,000 investment* | |||
| Class I Shares |
$44 | 0.43% | ||
* Annualized for period less than one year.
How did the Fund perform last year? What affected the Fund’s performance?
| Performance Highlights • The Nuveen Core Bond Fund returned 4.33% for Class I Shares at net asset value (NAV) for the 12 months ended March 31, 2026. The Fund performed in line with the Bloomberg U.S. Aggregate Bond Index, which returned 4.35%. • Top contributors to relative performance • An overweight to corporate bonds, including small out‑of‑benchmark allocations to high-yield and emerging-markets corporate bonds and a corresponding underweight to U.S. Treasuries. • Out‑of‑benchmark exposure to non‑agency mortgage-backed securities and an overweight to emerging-markets debt. • Security selection, especially within investment-grade corporate bonds and commercial mortgage-backed securities. • Top detractors from relative performance • Yield curve positioning. |
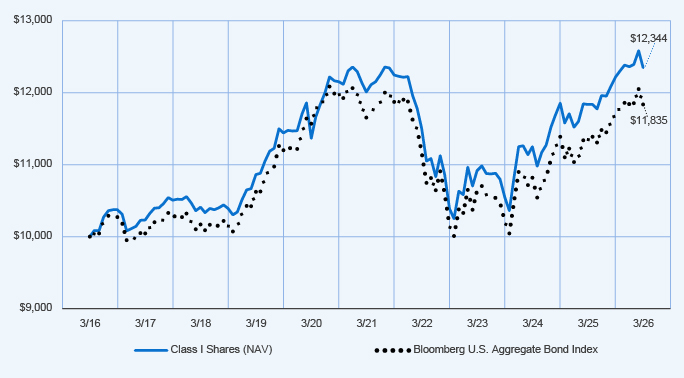
Average Annual Total Returns
| 1‑Year | 5‑Year | 10‑Year | ||||||||||
| Class I Shares at NAV |
4.33 | % | 0.55 | % | 2.13 | % | ||||||
| Bloomberg U.S. Aggregate Bond Index |
4.35 | % | 0.31 | % | 1.70 | % | ||||||
Fund Statistics (as of March 31, 2026)
| Fund net assets |
$10,171,187,634 | |||
| Total number of portfolio holdings |
1,914 | |||
| Portfolio turnover (%) |
113% | |||
| Total management fees paid for the year |
$ 28,812,835 | |||
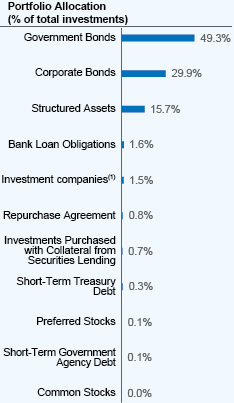
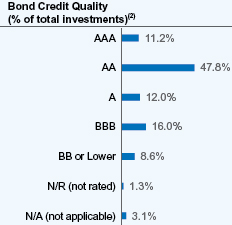
(1) Affiliated investment.
(2) Credit quality ratings are based on the Bloomberg Barclays methodology, which uses the median rating of those compiled by the Moody’s, Standard & Poor’s and Fitch ratings agencies. If ratings are available from only two of these agencies, the lower rating is used. When only one rating is available, that one is used. These ratings are subject to change without notice.
How has the Fund changed?
For more complete information, you may review the Fund’s next prospectus, which is expected to be available by August 1, 2026 at https://www.nuveen.com/en‑us/mutual‑funds/prospectuses or upon request at (800) 257‑8787.
For more complete information, you may review the Fund’s next prospectus, which is expected to be available by August 1, 2026 at https://www.nuveen.com/en‑us/mutual‑funds/prospectuses or upon request at (800) 257‑8787.
This report describes changes to the Fund that occurred during the reporting period.
What were the Fund costs for the last year? (based on a hypothetical $10,000 investment)
| Cost of a $10,000 investment |
Costs paid as a percentage of $10,000 investment* | |||
| Class A Shares |
$61 | 0.60% | ||
* Annualized for period less than one year.
How did the Fund perform last year? What affected the Fund’s performance?
| Performance Highlights • The Nuveen Core Bond Fund returned 4.26% for Class A Shares at net asset value (NAV) for the 12 months ended March 31, 2026. The Fund performed in line with the Bloomberg U.S. Aggregate Bond Index, which returned 4.35%. • Top contributors to relative performance • An overweight to corporate bonds, including small out‑of‑benchmark allocations to high-yield and emerging-markets corporate bonds and a corresponding underweight to U.S. Treasuries. • Out‑of‑benchmark exposure to non‑agency mortgage-backed securities and an overweight to emerging-markets debt. • Security selection, especially within investment-grade corporate bonds and commercial mortgage-backed securities. • Top detractors from relative performance • Yield curve positioning. |
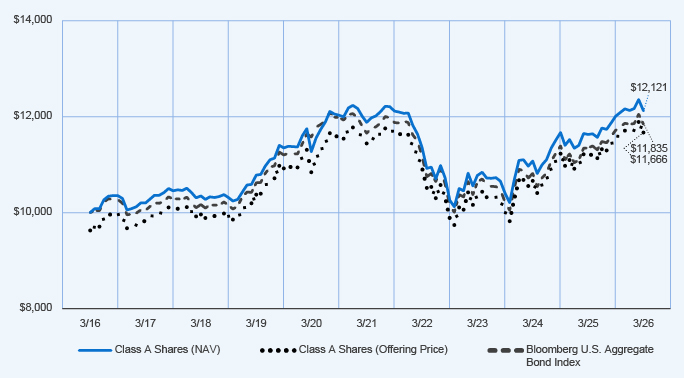
Average Annual Total Returns
| 1‑Year | 5‑Year | 10‑Year | ||||
| Class A Shares at NAV (excluding maximum sales charge) |
4.26% | 0.40% | 1.94% | |||
| Class A at maximum sales charge (Offering Price) |
0.35% | (0.36)% | 1.55% | |||
| Bloomberg U.S. Aggregate Bond Index |
4.35% | 0.31% | 1.70% | |||
Fund Statistics (as of March 31, 2026)
| Fund net assets |
$10,171,187,634 | |||
| Total number of portfolio holdings |
1,914 | |||
| Portfolio turnover (%) |
113% | |||
| Total management fees paid for the year |
$ 28,812,835 | |||
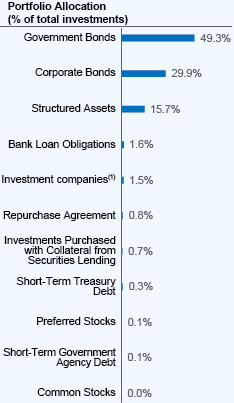
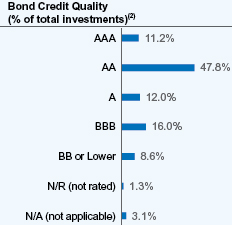
(1) Affiliated investment.
(2) Credit quality ratings are based on the Bloomberg Barclays methodology, which uses the median rating of those compiled by the Moody’s, Standard & Poor’s and Fitch ratings agencies. If ratings are available from only two of these agencies, the lower rating is used. When only one rating is available, that one is used. These ratings are subject to change without notice.
How has the Fund changed?
For more complete information, you may review the Fund’s next prospectus, which is expected to be available by August 1, 2026 at https://www.nuveen.com/en‑us/mutual‑funds/prospectuses or upon request at (800) 257‑8787.
For more complete information, you may review the Fund’s next prospectus, which is expected to be available by August 1, 2026 at https://www.nuveen.com/en‑us/mutual‑funds/prospectuses or upon request at (800) 257‑8787.
This report describes changes to the Fund that occurred during the reporting period.
What were the Fund costs for the last year? (based on a hypothetical $10,000 investment)
| Cost of a $10,000 investment |
Costs paid as a percentage of $10,000 investment* | |||
| Class A Shares |
$46 | 0.45% | ||
* Annualized for period less than one year.
Fund Statistics (as of March 31, 2026)
| Fund net assets |
$2,026,725,366 | |||
| Total number of portfolio holdings |
73 | |||
| Total management fees paid for the year |
$ 2,106,457 | |||
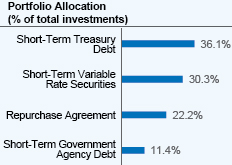
How has the Fund changed?
For more complete information, you may review the Fund’s next prospectus, which is expected to be available by August 1, 2026 at https://www.nuveen.com/en‑us/mutual‑funds/prospectuses or upon request at (800) 257‑8787.
For more complete information, you may review the Fund’s next prospectus, which is expected to be available by August 1, 2026 at https://www.nuveen.com/en‑us/mutual‑funds/prospectuses or upon request at (800) 257‑8787.
This report describes changes to the Fund that occurred during the reporting period.
What were the Fund costs for the last year? (based on a hypothetical $10,000 investment)
| Cost of a $10,000 investment |
Costs paid as a percentage of $10,000 investment* | |||
| Class I Shares |
$15 | 0.15% | ||
* Annualized for period less than one year.
Fund Statistics (as of March 31, 2026)
| Fund net assets |
$2,026,725,366 | |||
| Total number of portfolio holdings |
73 | |||
| Total management fees paid for the year |
$ 2,106,457 | |||
How has the Fund changed?
For more complete information, you may review the Fund’s next prospectus, which is expected to be available by August 1, 2026 at https://www.nuveen.com/en‑us/mutual‑funds/prospectuses or upon request at (800) 257‑8787.
For more complete information, you may review the Fund’s next prospectus, which is expected to be available by August 1, 2026 at https://www.nuveen.com/en‑us/mutual‑funds/prospectuses or upon request at (800) 257‑8787.
This report describes changes to the Fund that occurred during the reporting period.
What were the Fund costs for the last year? (based on a hypothetical $10,000 investment)
| Cost of a $10,000 investment |
Costs paid as a percentage of $10,000 investment* | |||
| Premier Class Shares |
$28 | 0.27% |
* Annualized for period less than one year.
Fund Statistics (as of March 31, 2026)
| Fund net assets |
$2,026,725,366 | |||
| Total number of portfolio holdings |
73 | |||
| Total management fees paid for the year |
$ 2,106,457 | |||
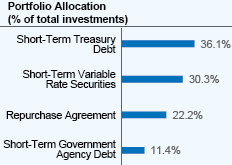
How has the Fund changed?
For more complete information, you may review the Fund’s next prospectus, which is expected to be available by August 1, 2026 at https://www.nuveen.com/en‑us/mutual‑funds/prospectuses or upon request at (800) 257‑8787.
For more complete information, you may review the Fund’s next prospectus, which is expected to be available by August 1, 2026 at https://www.nuveen.com/en‑us/mutual‑funds/prospectuses or upon request at (800) 257‑8787.
This report describes changes to the Fund that occurred during the reporting period.
What were the Fund costs for the last year? (based on a hypothetical $10,000 investment)
| Cost of a $10,000 investment |
Costs paid as a percentage of $10,000 investment* | |||
| Class R6 Shares |
$12 | 0.12% | ||
* Annualized for period less than one year.
Fund Statistics (as of March 31, 2026)
| Fund net assets |
$2,026,725,366 | |||
| Total number of portfolio holdings |
73 | |||
| Total management fees paid for the year |
$ 2,106,457 | |||
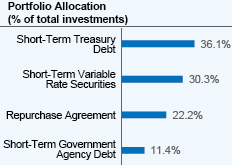
How has the Fund changed?
For more complete information, you may review the Fund’s next prospectus, which is expected to be available by August 1, 2026 at https://www.nuveen.com/en‑us/mutual‑funds/prospectuses or upon request at (800) 257‑8787.
For more complete information, you may review the Fund’s next prospectus, which is expected to be available by August 1, 2026 at https://www.nuveen.com/en‑us/mutual‑funds/prospectuses or upon request at (800) 257‑8787.
This report describes changes to the Fund that occurred during the reporting period.
What were the Fund costs for the last year? (based on a hypothetical $10,000 investment)
| Cost of a $10,000 investment |
Costs paid as a percentage of $10,000 investment* | |||
| Retirement Class Shares |
$38 | 0.37% | ||
* Annualized for period less than one year.
Fund Statistics (as of March 31, 2026)
| Fund net assets |
$2,026,725,366 | |||
| Total number of portfolio holdings |
73 | |||
| Total management fees paid for the year |
$ 2,106,457 | |||
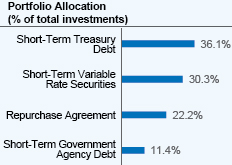
How has the Fund changed?
For more complete information, you may review the Fund’s next prospectus, which is expected to be available by August 1, 2026 at https://www.nuveen.com/en‑us/mutual‑funds/prospectuses or upon request at (800) 257‑8787.
For more complete information, you may review the Fund’s next prospectus, which is expected to be available by August 1, 2026 at https://www.nuveen.com/en‑us/mutual‑funds/prospectuses or upon request at (800) 257‑8787.
This report describes changes to the Fund that occurred during the reporting period.
What were the Fund costs for the last year? (based on a hypothetical $10,000 investment)
| Cost of a $10,000 investment |
Costs paid as a percentage of $10,000 investment* | |||
| Class W Shares |
$0 | 0.00% | ||
* Annualized for period less than one year.
How did the Fund perform last year? What affected the Fund’s performance?
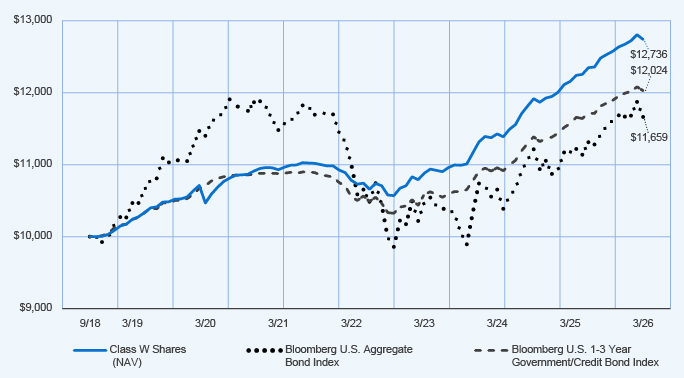
| Performance Highlights • The Nuveen Short Term Bond Fund returned 4.78% for Class W Shares at net asset value (NAV) for the 12 months ended March 31, 2026. The Fund outperformed the Bloomberg U.S. 1‑3 Year Government/Credit Bond Index, which returned 3.96%. • Top contributors to relative performance • Out‑of‑benchmark exposure to mortgage-backed securities, commercial mortgage-backed securities and asset-backed securities. • An overweight to corporate bonds. • Top detractors from relative performance • Yield curve positioning in U.S. Treasuries. |
Average Annual Total Returns
| 1‑Year | 5‑Year | Since Inception (9/28/18) | ||||
| Class W Shares at NAV |
4.78% | 3.11% | 3.28% | |||
| Bloomberg U.S. Aggregate Bond Index |
4.35% | 0.31% | 2.07% | |||
| Bloomberg U.S. 1‑3 Year Government/Credit Bond Index |
3.96% | 2.04% | 2.49% | |||
Fund Statistics (as of March 31, 2026)
| Fund net assets |
$1,734,899,596 | |||
| Total number of portfolio holdings |
293 | |||
| Portfolio turnover (%) |
189% | |||
| Total management fees paid for the year |
$ 4,521,242 | |||
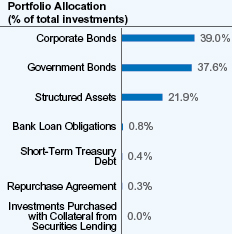
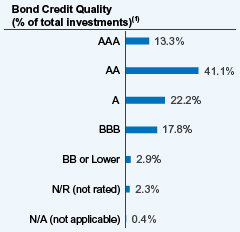
(1) Credit quality ratings are based on the Bloomberg Barclays methodology, which uses the median rating of those compiled by the Moody’s, Standard & Poor’s and Fitch ratings agencies. If ratings are available from only two of these agencies, the lower rating is used. When only one rating is available, that one is used. These ratings are subject to change without notice.
How has the Fund changed?
For more complete information, you may review the Fund’s next prospectus, which is expected to be available by August 1, 2026 at https://www.nuveen.com/en‑us/mutual‑funds/prospectuses or upon request at (800) 257‑8787.
For more complete information, you may review the Fund’s next prospectus, which is expected to be available by August 1, 2026 at https://www.nuveen.com/en‑us/mutual‑funds/prospectuses or upon request at (800) 257‑8787.
This report describes changes to the Fund that occurred during the reporting period.
What were the Fund costs for the last year? (based on a hypothetical $10,000 investment)
| Cost of a $10,000 investment |
Costs paid as a percentage of $10,000 investment* | |||
| Retirement Class Shares |
$52 | 0.51% | ||
* Annualized for period less than one year.
How did the Fund perform last year? What affected the Fund’s performance?
| Performance Highlights • The Nuveen Short Term Bond Fund returned 4.25% for Retirement Class Shares at net asset value (NAV) for the 12 months ended March 31, 2026. The Fund outperformed the Bloomberg U.S. 1‑3 Year Government/Credit Bond Index, which returned 3.96%. • Top contributors to relative performance • Out‑of‑benchmark exposure to mortgage-backed securities, commercial mortgage-backed securities and asset-backed securities. • An overweight to corporate bonds. • Top detractors from relative performance • Yield curve positioning in U.S. Treasuries. |
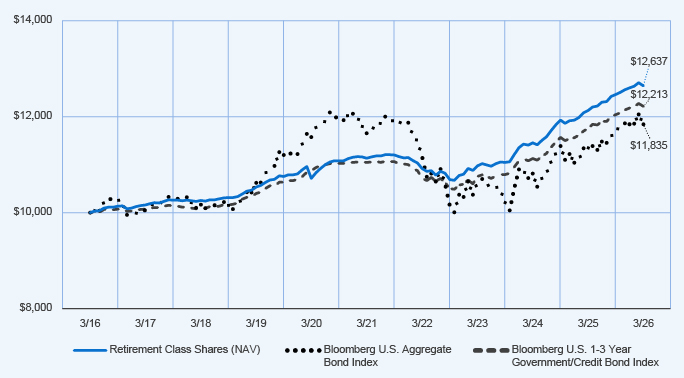
Average Annual Total Returns
| 1‑Year | 5‑Year | 10‑Year | ||||
| Retirement Class Shares at NAV |
4.25% | 2.57% | 2.37% | |||
| Bloomberg U.S. Aggregate Bond Index |
4.35% | 0.31% | 1.70% | |||
| Bloomberg U.S. 1‑3 Year Government/Credit Bond Index |
3.96% | 2.04% | 2.02% | |||
Fund Statistics (as of March 31, 2026)
| Fund net assets |
$1,734,899,596 | |||
| Total number of portfolio holdings |
293 | |||
| Portfolio turnover (%) |
189% | |||
| Total management fees paid for the year |
$ 4,521,242 | |||
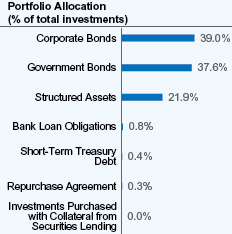
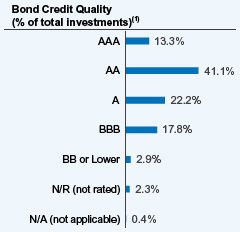
(1) Credit quality ratings are based on the Bloomberg Barclays methodology, which uses the median rating of those compiled by the Moody’s, Standard & Poor’s and Fitch ratings agencies. If ratings are available from only two of these agencies, the lower rating is used. When only one rating is available, that one is used. These ratings are subject to change without notice.
How has the Fund changed?
For more complete information, you may review the Fund’s next prospectus, which is expected to be available by August 1, 2026 at https://www.nuveen.com/en‑us/mutual‑funds/prospectuses or upon request at (800) 257‑8787.
For more complete information, you may review the Fund’s next prospectus, which is expected to be available by August 1, 2026 at https://www.nuveen.com/en‑us/mutual‑funds/prospectuses or upon request at (800) 257‑8787.
This report describes changes to the Fund that occurred during the reporting period.
What were the Fund costs for the last year? (based on a hypothetical $10,000 investment)
| Cost of a $10,000 investment |
Costs paid as a percentage of $10,000 investment* | |||
| Class R6 Shares |
$27 | 0.26% | ||
* Annualized for period less than one year.
How did the Fund perform last year? What affected the Fund’s performance?
| Performance Highlights • The Nuveen Short Term Bond Fund returned 4.51% for Class R6 Shares at net asset value (NAV) for the 12 months ended March 31, 2026. The Fund outperformed the Bloomberg U.S. 1‑3 Year Government/Credit Bond Index, which returned 3.96%. • Top contributors to relative performance • Out‑of‑benchmark exposure to mortgage-backed securities, commercial mortgage-backed securities and asset-backed securities. • An overweight to corporate bonds. • Top detractors from relative performance • Yield curve positioning in U.S. Treasuries. |
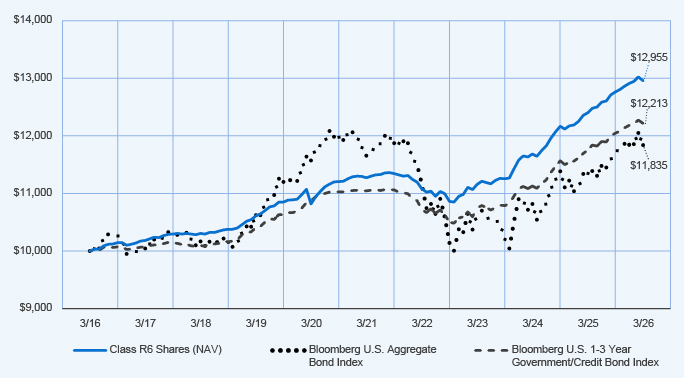
Average Annual Total Returns
| 1‑Year | 5‑Year | 10‑Year | ||||
| Class R6 Shares at NAV |
4.51% | 2.82% | 2.62% | |||
| Bloomberg U.S. Aggregate Bond Index |
4.35% | 0.31% | 1.70% | |||
| Bloomberg U.S. 1‑3 Year Government/Credit Bond Index |
3.96% | 2.04% | 2.02% | |||
Fund Statistics (as of March 31, 2026)
| Fund net assets |
$1,734,899,596 | |||
| Total number of portfolio holdings |
293 | |||
| Portfolio turnover (%) |
189% | |||
| Total management fees paid for the year |
$ 4,521,242 | |||
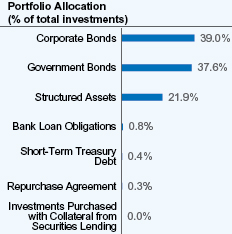
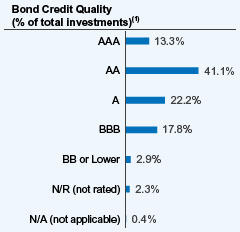
(1) Credit quality ratings are based on the Bloomberg Barclays methodology, which uses the median rating of those compiled by the Moody’s, Standard & Poor’s and Fitch ratings agencies. If ratings are available from only two of these agencies, the lower rating is used. When only one rating is available, that one is used. These ratings are subject to change without notice.
How has the Fund changed?
For more complete information, you may review the Fund’s next prospectus, which is expected to be available by August 1, 2026 at https://www.nuveen.com/en‑us/mutual‑funds/prospectuses or upon request at (800) 257‑8787.
For more complete information, you may review the Fund’s next prospectus, which is expected to be available by August 1, 2026 at https://www.nuveen.com/en‑us/mutual‑funds/prospectuses or upon request at (800) 257‑8787.
This report describes changes to the Fund that occurred during the reporting period.
What were the Fund costs for the last year? (based on a hypothetical $10,000 investment)
| Cost of a $10,000 investment |
Costs paid as a percentage of $10,000 investment* | |||
| Premier Class Shares |
$42 | 0.41% | ||
* Annualized for period less than one year.
How did the Fund perform last year? What affected the Fund’s performance?
| Performance Highlights • The Nuveen Short Term Bond Fund returned 4.35% for Premier Class Shares at net asset value (NAV) for the 12 months ended March 31, 2026. The Fund outperformed the Bloomberg U.S. 1‑3 Year Government/Credit Bond Index, which returned 3.96%. • Top contributors to relative performance • Out‑of‑benchmark exposure to mortgage-backed securities, commercial mortgage-backed securities and asset-backed securities. • An overweight to corporate bonds. • Top detractors from relative performance • Yield curve positioning in U.S. Treasuries. |
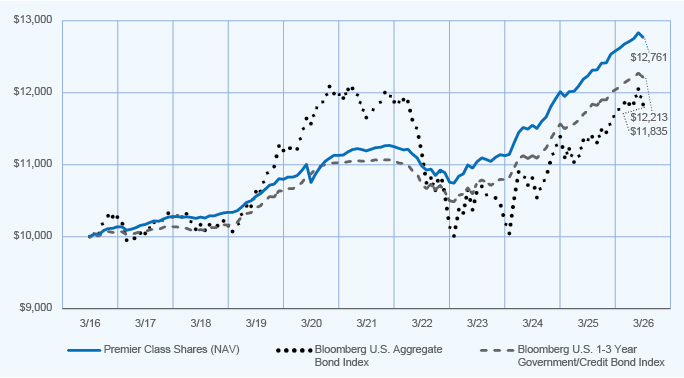
Average Annual Total Returns
| 1‑Year | 5‑Year | 10‑Year | ||||
| Premier Class Shares at NAV |
4.35% | 2.67% | 2.47% | |||
| Bloomberg U.S. Aggregate Bond Index |
4.35% | 0.31% | 1.70% | |||
| Bloomberg U.S. 1‑3 Year Government/Credit Bond Index |
3.96% | 2.04% | 2.02% | |||
Fund Statistics (as of March 31, 2026)
| Fund net assets |
$1,734,899,596 | |||
| Total number of portfolio holdings |
293 | |||
| Portfolio turnover (%) |
189% | |||
| Total management fees paid for the year |
$ 4,521,242 | |||
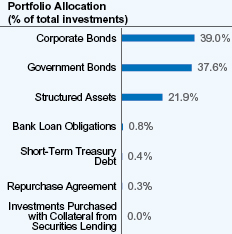
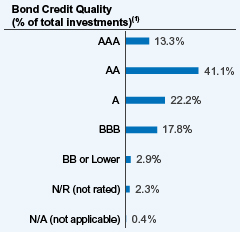
(1) Credit quality ratings are based on the Bloomberg Barclays methodology, which uses the median rating of those compiled by the Moody’s, Standard & Poor’s and Fitch ratings agencies. If ratings are available from only two of these agencies, the lower rating is used. When only one rating is available, that one is used. These ratings are subject to change without notice.
How has the Fund changed?
For more complete information, you may review the Fund’s next prospectus, which is expected to be available by August 1, 2026 at https://www.nuveen.com/en‑us/mutual‑funds/prospectuses or upon request at (800) 257‑8787.
For more complete information, you may review the Fund’s next prospectus, which is expected to be available by August 1, 2026 at https://www.nuveen.com/en‑us/mutual‑funds/prospectuses or upon request at (800) 257‑8787.
This report describes changes to the Fund that occurred during the reporting period.
What were the Fund costs for the last year? (based on a hypothetical $10,000 investment)
| Cost of a $10,000 investment |
Costs paid as a percentage of $10,000 investment* | |||
| Class I Shares |
$30 | 0.29% | ||
* Annualized for period less than one year.
How did the Fund perform last year? What affected the Fund’s performance?
| Performance Highlights • The Nuveen Short Term Bond Fund returned 4.37% for Class I Shares at net asset value (NAV) for the 12 months ended March 31, 2026. The Fund outperformed the Bloomberg U.S. 1‑3 Year Government/Credit Bond Index, which returned 3.96%. • Top contributors to relative performance • Out‑of‑benchmark exposure to mortgage-backed securities, commercial mortgage-backed securities and asset-backed securities. • An overweight to corporate bonds. • Top detractors from relative performance • Yield curve positioning in U.S. Treasuries. |
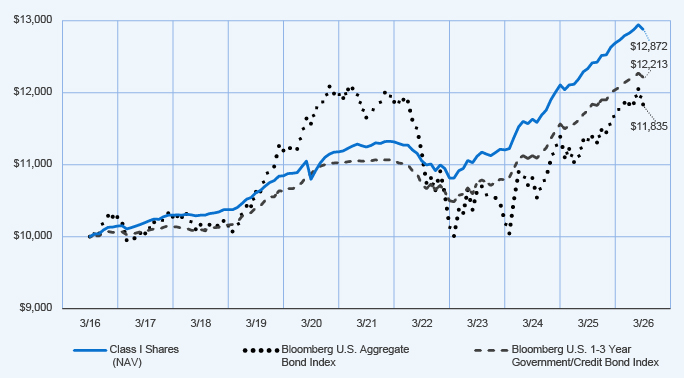
Average Annual Total Returns
| 1‑Year | 5‑Year | 10‑Year | ||||
| Class I Shares at NAV |
4.37% | 2.75% | 2.56% | |||
| Bloomberg U.S. Aggregate Bond Index |
4.35% | 0.31% | 1.70% | |||
| Bloomberg U.S. 1‑3 Year Government/Credit Bond Index |
3.96% | 2.04% | 2.02% | |||
Fund Statistics (as of March 31, 2026)
| Fund net assets |
$ | 1,734,899,596 | ||
| Total number of portfolio holdings |
293 | |||
| Portfolio turnover (%) |
189% | |||
| Total management fees paid for the year |
$ | 4,521,242 | ||
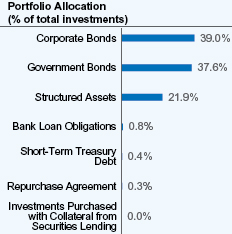
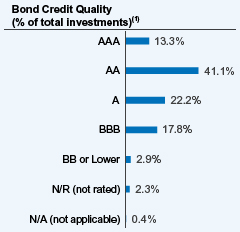
(1) Credit quality ratings are based on the Bloomberg Barclays methodology, which uses the median rating of those compiled by the Moody’s, Standard & Poor’s and Fitch ratings agencies. If ratings are available from only two of these agencies, the lower rating is used. When only one rating is available, that one is used. These ratings are subject to change without notice.
How has the Fund changed?
For more complete information, you may review the Fund’s next prospectus, which is expected to be available by August 1, 2026 at https://www.nuveen.com/en-us/mutual-funds/prospectuses or upon request at (800) 257-8787.
For more complete information, you may review the Fund’s next prospectus, which is expected to be available by August 1, 2026 at https://www.nuveen.com/en-us/mutual-funds/prospectuses or upon request at (800) 257-8787.
This report describes changes to the Fund that occurred during the reporting period.
What were the Fund costs for the last year? (based on a hypothetical $10,000 investment)
| Cost of a $10,000 investment |
Costs paid as a percentage of $10,000 investment* | |||
| Class A Shares |
$60 | 0.59% | ||
* Annualized for period less than one year.
How did the Fund perform last year? What affected the Fund’s performance?
| Performance Highlights • The Nuveen Short Term Bond Fund returned 4.17% for Class A Shares at net asset value (NAV) for the 12 months ended March 31, 2026. The Fund performed in line with the Bloomberg U.S. 1‑3 Year Government/Credit Bond Index, which returned 3.96%. • Top contributors to relative performance • Out‑of‑benchmark exposure to mortgage-backed securities, commercial mortgage-backed securities and asset-backed securities. • An overweight to corporate bonds. • Top detractors from relative performance • Yield curve positioning in U.S. Treasuries. |
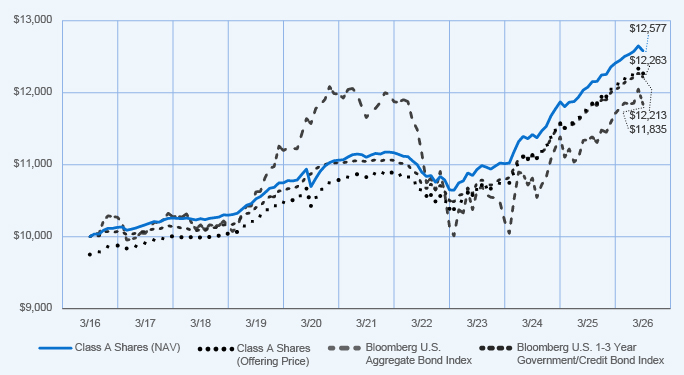
Average Annual Total Returns
| 1‑Year | 5‑Year | 10‑Year | ||||
| Class A Shares at NAV (excluding maximum sales charge) |
4.17% | 2.52% | 2.32% | |||
| Class A at maximum sales charge (Offering Price) |
1.56% | 2.01% | 2.06% | |||
| Bloomberg U.S. Aggregate Bond Index |
4.35% | 0.31% | 1.70% | |||
| Bloomberg U.S. 1‑3 Year Government/Credit Bond Index |
3.96% | 2.04% | 2.02% | |||
Fund Statistics (as of March 31, 2026)
| Fund net assets |
$1,734,899,596 | |||
| Total number of portfolio holdings |
293 | |||
| Portfolio turnover (%) |
189% | |||
| Total management fees paid for the year |
$ 4,521,242 | |||
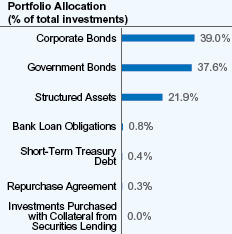
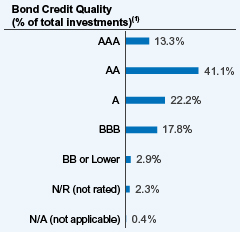
(1) Credit quality ratings are based on the Bloomberg Barclays methodology, which uses the median rating of those compiled by the Moody’s, Standard & Poor’s and Fitch ratings agencies. If ratings are available from only two of these agencies, the lower rating is used. When only one rating is available, that one is used. These ratings are subject to change without notice.
How has the Fund changed?
For more complete information, you may review the Fund’s next prospectus, which is expected to be available by August 1, 2026 at https://www.nuveen.com/en‑us/mutual‑funds/prospectuses or upon request at (800) 257‑8787.
For more complete information, you may review the Fund’s next prospectus, which is expected to be available by August 1, 2026 at https://www.nuveen.com/en‑us/mutual‑funds/prospectuses or upon request at (800) 257‑8787.
This report describes changes to the Fund that occurred during the reporting period.
What were the Fund costs for the last year? (based on a hypothetical $10,000 investment)
| Cost of a $10,000 investment |
Costs paid as a percentage of $10,000 investment* | |||
| Class A Shares |
$70 | 0.68% | ||
* Annualized for period less than one year.
How did the Fund perform last year? What affected the Fund’s performance?
| Performance Highlights • The Nuveen High Yield Fund returned 7.17% for Class A Shares at net asset value (NAV) for the 12 months ended March 31, 2026. The Fund performed in line with the ICE BofA BB‑B U.S. Cash Pay High Yield Constrained Index, which returned 7.04%. • Top contributors to relative performance • Security selection within the specialty retail industry, driven by an overweight to The Michaels Companies. • Security selection within the software/services industry. • Security selection within the health facilities industry. • Top detractors from relative performance • Security selection and an overweight position in the rail industry, including an overweight to Brightline East. • Security selection within the telecom – wireline integrated & services industry, including an overweight to LCPR Financing. • Security selection within the building materials industry, including an overweight to Cornerstone Building Brands, Inc. |
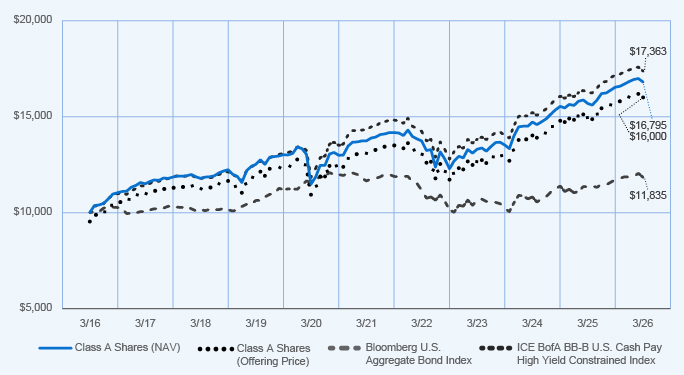
Average Annual Total Returns
| 1‑Year | 5‑Year | 10‑Year | ||||
| Class A Shares at NAV (excluding maximum sales charge) |
7.17% | 4.11% | 5.32% | |||
| Class A at maximum sales charge (Offering Price) |
2.04% | 3.09% | 4.81% | |||
| Bloomberg U.S. Aggregate Bond Index |
4.35% | 0.31% | 1.70% | |||
| ICE BofA BB‑B U.S. Cash Pay High Yield Constrained Index |
7.04% | 3.95% | 5.67% | |||
Fund Statistics (as of March 31, 2026)
| Fund net assets |
$2,186,139,486 | |||
| Total number of portfolio holdings |
370 | |||
| Portfolio turnover (%) |
48% | |||
| Total management fees paid for the year |
$ 7,149,632 | |||
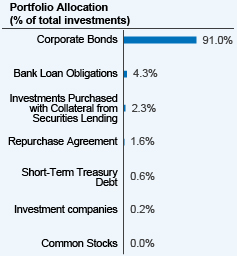
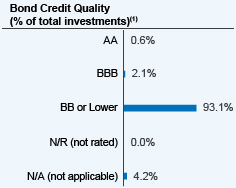
(1) Credit quality ratings are based on the Bloomberg Barclays methodology, which uses the median rating of those compiled by the Moody’s, Standard & Poor’s and Fitch ratings agencies. If ratings are available from only two of these agencies, the lower rating is used. When only one rating is available, that one is used. These ratings are subject to change without notice.
How has the Fund changed?
| • | Portfolio Manager Updates: Effective April 1, 2025, Jean Lin retired and is no longer a portfolio manager of the Fund. Effective July 1, 2025, Kevin Lorenz retired and is no longer a portfolio manager of the Fund. |
For more complete information, you may review the Fund’s next prospectus, which is expected to be available by August 1, 2026 at https://www.nuveen.com/en‑us/mutual‑funds/prospectuses or upon request at (800) 257‑8787.
For more complete information, you may review the Fund’s next prospectus, which is expected to be available by August 1, 2026 at https://www.nuveen.com/en‑us/mutual‑funds/prospectuses or upon request at (800) 257‑8787.
This report describes changes to the Fund that occurred during the reporting period.
What were the Fund costs for the last year? (based on a hypothetical $10,000 investment)
| Cost of a $10,000 investment |
Costs paid as a percentage of $10,000 investment* | |||
| Class I Shares |
$52 | 0.50% | ||
* Annualized for period less than one year.
How did the Fund perform last year? What affected the Fund’s performance?
| Performance Highlights • The Nuveen High Yield Fund returned 7.36% for Class I Shares at net asset value (NAV) for the 12 months ended March 31, 2026. The Fund outperformed the ICE BofA BB‑B U.S. Cash Pay High Yield Constrained Index, which returned 7.04%. • Top contributors to relative performance • Security selection within the specialty retail industry, driven by an overweight to The Michaels Companies. • Security selection within the software/services industry. • Security selection within the health facilities industry. • Top detractors from relative performance • Security selection and an overweight position in the rail industry, including an overweight to Brightline East. • Security selection within the telecom – wireline integrated & services industry, including an overweight to LCPR Financing. • Security selection within the building materials industry, including an overweight to Cornerstone Building Brands, Inc. |
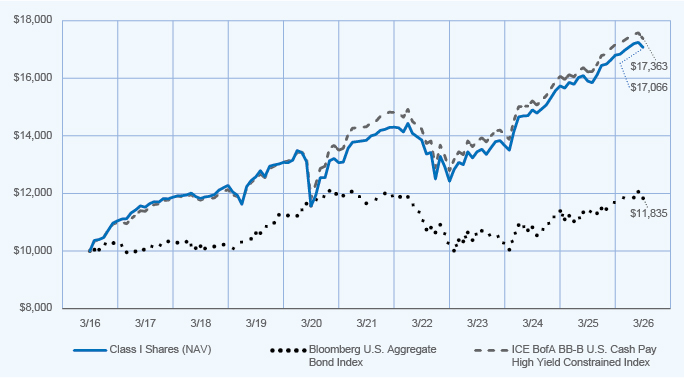
Average Annual Total Returns
| 1‑Year | 5‑Year | 10‑Year | ||||
| Class I Shares at NAV |
7.36% | 4.27% | 5.49% | |||
| Bloomberg U.S. Aggregate Bond Index |
4.35% | 0.31% | 1.70% | |||
| ICE BofA BB‑B U.S. Cash Pay High Yield Constrained Index |
7.04% | 3.95% | 5.67% | |||
Fund Statistics (as of March 31, 2026)
| Fund net assets |
$2,186,139,486 | |||
| Total number of portfolio holdings |
370 | |||
| Portfolio turnover (%) |
48% | |||
| Total management fees paid for the year |
$ 7,149,632 | |||
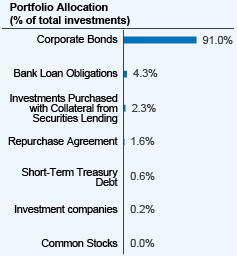
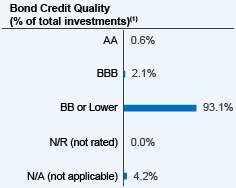
(1) Credit quality ratings are based on the Bloomberg Barclays methodology, which uses the median rating of those compiled by the Moody’s, Standard & Poor’s and Fitch ratings agencies. If ratings are available from only two of these agencies, the lower rating is used. When only one rating is available, that one is used. These ratings are subject to change without notice.
How has the Fund changed?
| • | Portfolio Manager Updates: Effective April 1, 2025, Jean Lin retired and is no longer a portfolio manager of the Fund. Effective July 1, 2025, Kevin Lorenz retired and is no longer a portfolio manager of the Fund. |
For more complete information, you may review the Fund’s next prospectus, which is expected to be available by August 1, 2026 at https://www.nuveen.com/en‑us/mutual‑funds/prospectuses or upon request at (800) 257‑8787.
For more complete information, you may review the Fund’s next prospectus, which is expected to be available by August 1, 2026 at https://www.nuveen.com/en‑us/mutual‑funds/prospectuses or upon request at (800) 257‑8787.
This report describes changes to the Fund that occurred during the reporting period.
What were the Fund costs for the last year? (based on a hypothetical $10,000 investment)
| Cost of a $10,000 investment |
Costs paid as a percentage of $10,000 investment* | |||
| Premier Class Shares |
$53 | 0.51% | ||
* Annualized for period less than one year.
How did the Fund perform last year? What affected the Fund’s performance?
| Performance Highlights • The Nuveen High Yield Fund returned 7.35% for Premier Class Shares at net asset value (NAV) for the 12 months ended March 31, 2026. The Fund outperformed the ICE BofA BB‑B U.S. Cash Pay High Yield Constrained Index, which returned 7.04%. • Top contributors to relative performance • Security selection within the specialty retail industry, driven by an overweight to The Michaels Companies. • Security selection within the software/services industry. • Security selection within the health facilities industry. • Top detractors from relative performance • Security selection and an overweight position in the rail industry, including an overweight to Brightline East. • Security selection within the telecom – wireline integrated & services industry, including an overweight to LCPR Financing. • Security selection within the building materials industry, including an overweight to Cornerstone Building Brands, Inc. |
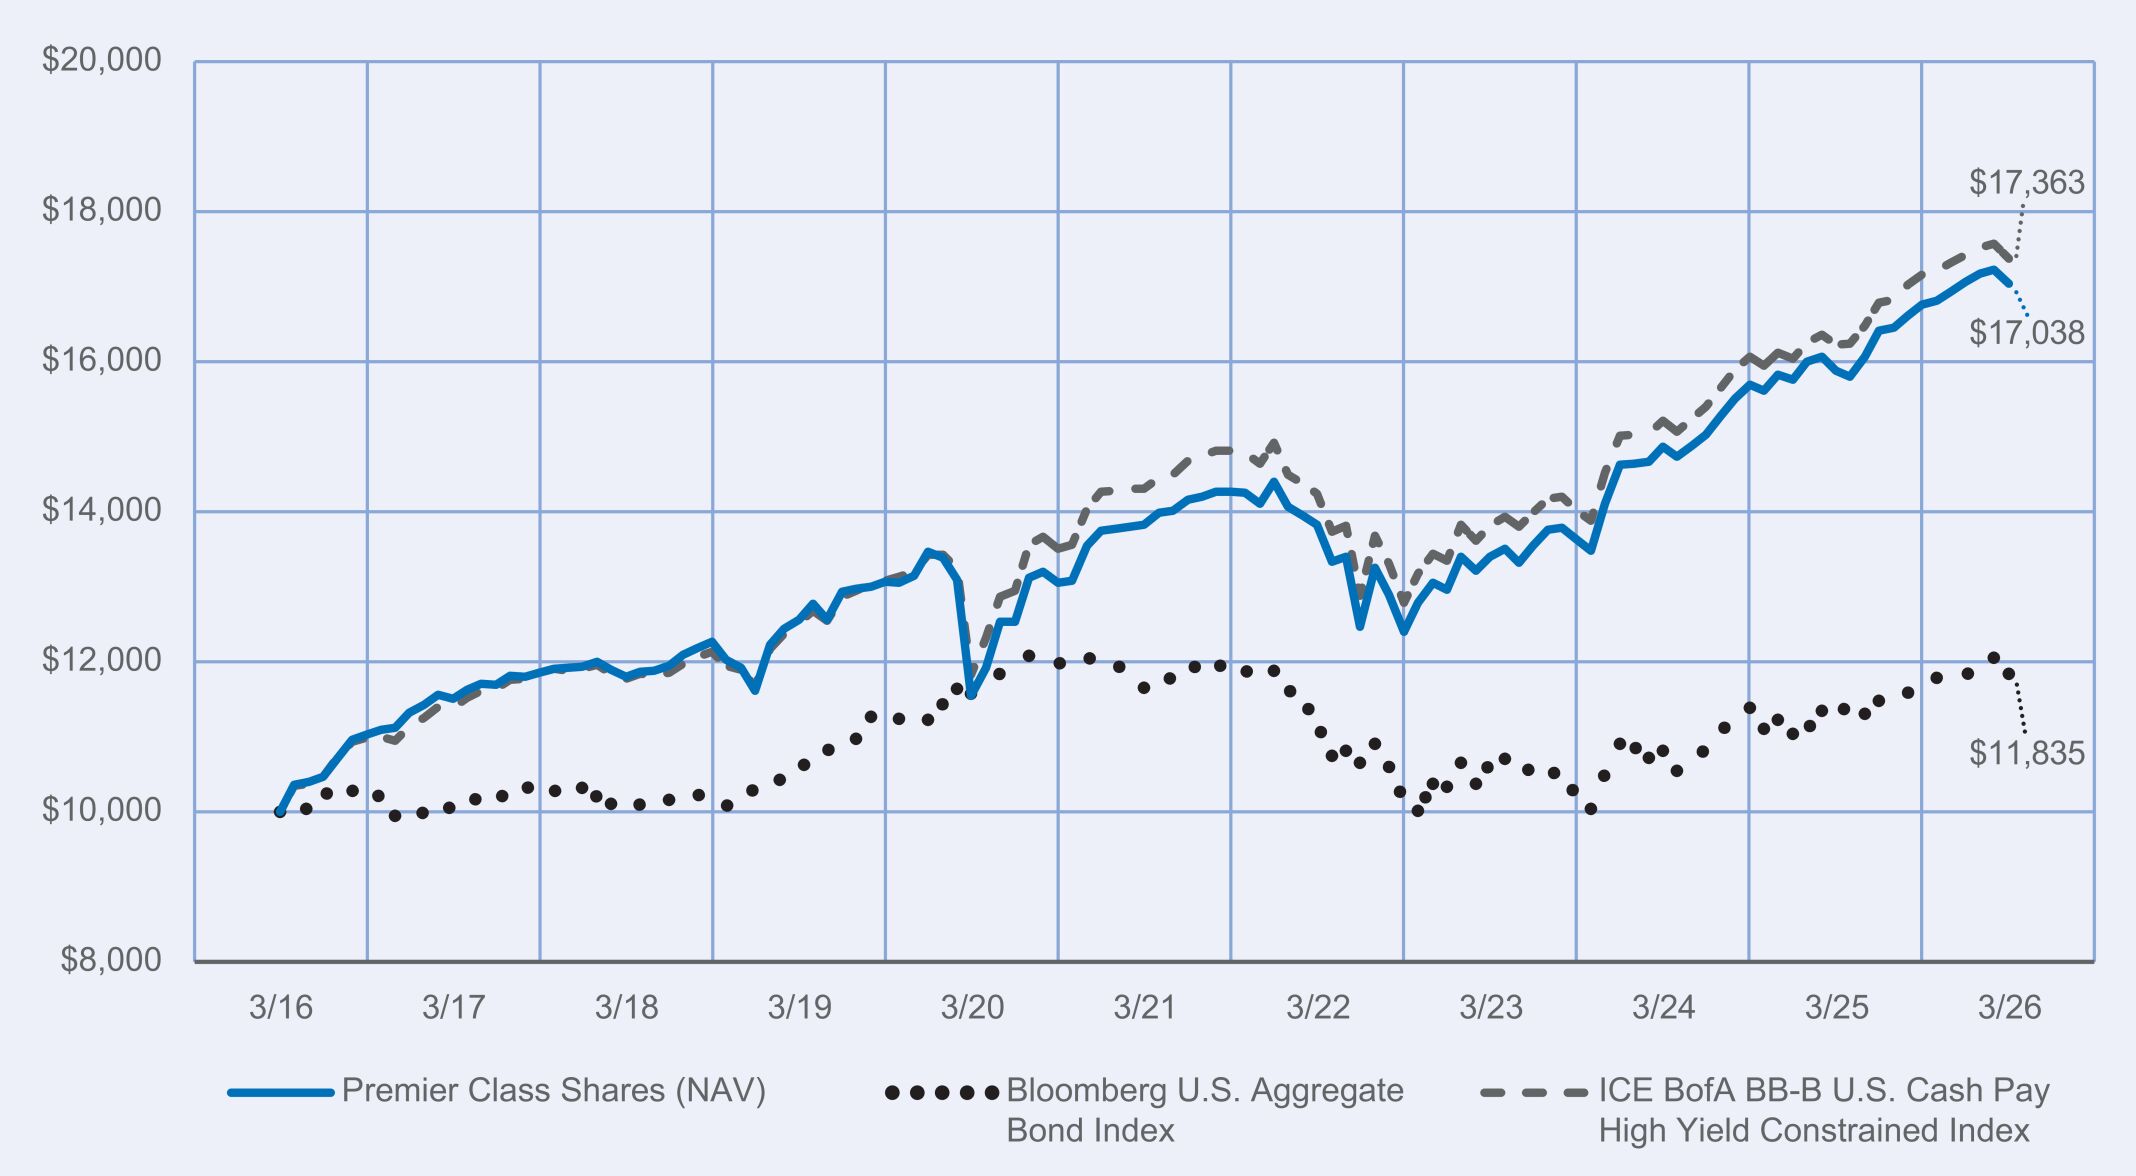
Average Annual Total Returns
| 1‑Year | 5‑Year | 10‑Year | ||||
| Premier Class Shares at NAV |
7.35% | 4.27% | 5.47% | |||
| Bloomberg U.S. Aggregate Bond Index |
4.35% | 0.31% | 1.70% | |||
| ICE BofA BB‑B U.S. Cash Pay High Yield Constrained Index |
7.04% | 3.95% | 5.67% | |||
Fund Statistics (as of March 31, 2026)
| Fund net assets |
$2,186,139,486 | |||
| Total number of portfolio holdings |
370 | |||
| Portfolio turnover (%) |
48% | |||
| Total management fees paid for the year |
$ 7,149,632 | |||
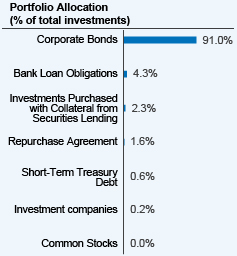 |
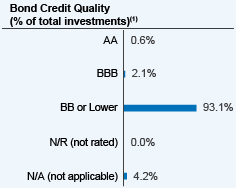 |
(1) Credit quality ratings are based on the Bloomberg Barclays methodology, which uses the median rating of those compiled by the Moody’s, Standard & Poor’s and Fitch ratings agencies. If ratings are available from only two of these agencies, the lower rating is used. When only one rating is available, that one is used. These ratings are subject to change without notice.
How has the Fund changed?
| • | Portfolio Manager Updates: Effective April 1, 2025, Jean Lin retired and is no longer a portfolio manager of the Fund. Effective July 1, 2025, Kevin Lorenz retired and is no longer a portfolio manager of the Fund. |
For more complete information, you may review the Fund’s next prospectus, which is expected to be available by August 1, 2026 at https://www.nuveen.com/en‑us/mutual‑funds/prospectuses or upon request at (800) 257‑8787.
For more complete information, you may review the Fund’s next prospectus, which is expected to be available by August 1, 2026 at https://www.nuveen.com/en‑us/mutual‑funds/prospectuses or upon request at (800) 257‑8787.
This report describes changes to the Fund that occurred during the reporting period.
What were the Fund costs for the last year? (based on a hypothetical $10,000 investment)
| Cost of a $10,000 investment |
Costs paid as a percentage of $10,000 investment* | |||
| Class R6 Shares |
$37 | 0.36% | ||
* Annualized for period less than one year.
How did the Fund perform last year? What affected the Fund’s performance?
Performance Highlights
| • | The Nuveen High Yield Fund returned 7.51% for Class R6 Shares at net asset value (NAV) for the 12 months ended March 31, 2026. The Fund outperformed the ICE BofA BB‑B U.S. Cash Pay High Yield Constrained Index, which returned 7.04%. |
| • | Top contributors to relative performance |
| • | Security selection within the specialty retail industry, driven by an overweight to The Michaels Companies. |
| • | Security selection within the software/services industry. |
| • | Security selection within the health facilities industry. |
| • | Top detractors from relative performance |
| • | Security selection and an overweight position in the rail industry, including an overweight to Brightline East. |
| • | Security selection within the telecom – wireline integrated & services industry, including an overweight to LCPR Financing. |
| • | Security selection within the building materials industry, including an overweight to Cornerstone Building Brands, Inc. |
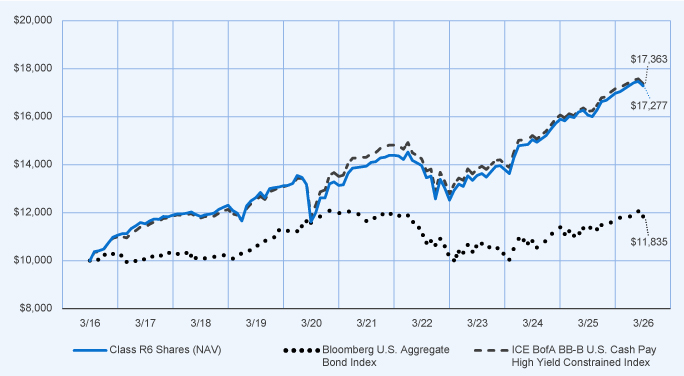
Average Annual Total Returns
| 1‑Year | 5‑Year | 10‑Year | ||||||||||
| Class R6 Shares at NAV |
7.51 | % | 4.40 | % | 5.62 | % | ||||||
| Bloomberg U.S. Aggregate Bond Index |
4.35 | % | 0.31 | % | 1.70 | % | ||||||
| ICE BofA BB‑B U.S. Cash Pay High Yield Constrained Index |
7.04 | % | 3.95 | % | 5.67 | % | ||||||
Fund Statistics (as of March 31, 2026)
| Fund net assets |
$ | 2,186,139,486 | ||
| Total number of portfolio holdings |
370 | |||
| Portfolio turnover (%) |
48% | |||
| Total management fees paid for the year |
$ | 7,149,632 | ||
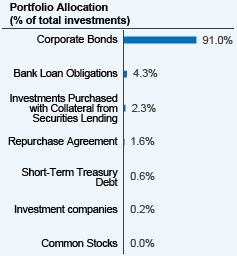
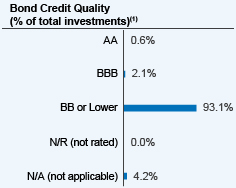
(1) Credit quality ratings are based on the Bloomberg Barclays methodology, which uses the median rating of those compiled by the Moody’s, Standard & Poor’s and Fitch ratings agencies. If ratings are available from only two of these agencies, the lower rating is used. When only one rating is available, that one is used. These ratings are subject to change without notice.
How has the Fund changed?
| • | Portfolio Manager Updates: Effective April 1, 2025, Jean Lin retired and is no longer a portfolio manager of the Fund. Effective July 1, 2025, Kevin Lorenz retired and is no longer a portfolio manager of the Fund. |
For more complete information, you may review the Fund’s next prospectus, which is expected to be available by August 1, 2026 at https://www.nuveen.com/en‑us/mutual‑funds/prospectuses or upon request at (800) 257‑8787.
For more complete information, you may review the Fund’s next prospectus, which is expected to be available by August 1, 2026 at https://www.nuveen.com/en‑us/mutual‑funds/prospectuses or upon request at (800) 257‑8787.
This report describes changes to the Fund that occurred during the reporting period.
What were the Fund costs for the last year? (based on a hypothetical $10,000 investment)
| Cost of a $10,000 investment |
Costs paid as a percentage of $10,000 investment* | |||
| Retirement Class Shares |
$63 | 0.61% | ||
* Annualized for period less than one year.
How did the Fund perform last year? What affected the Fund’s performance?
Performance Highlights
| • | The Nuveen High Yield Fund returned 7.25% for Retirement Class Shares at net asset value (NAV) for the 12 months ended March 31, 2026. The Fund performed in line with the ICE BofA BB‑B U.S. Cash Pay High Yield Constrained Index, which returned 7.04%. |
| • | Top contributors to relative performance |
| • | Security selection within the specialty retail industry, driven by an overweight to The Michaels Companies. |
| • | Security selection within the software/services industry. |
| • | Security selection within the health facilities industry. |
| • | Top detractors from relative performance |
| • | Security selection and an overweight position in the rail industry, including an overweight to Brightline East. |
| • | Security selection within the telecom – wireline integrated & services industry, including an overweight to LCPR Financing. |
| • | Security selection within the building materials industry, including an overweight to Cornerstone Building Brands, Inc. |
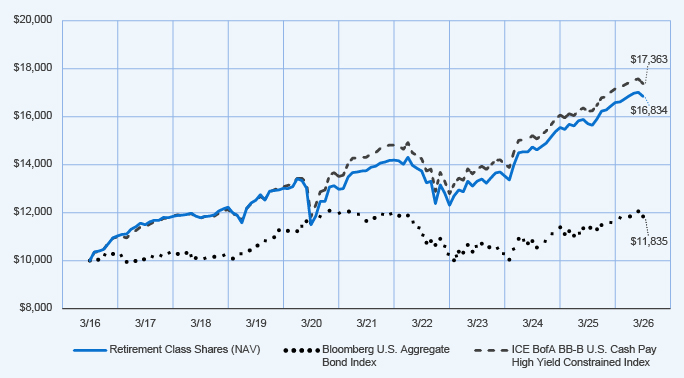
Average Annual Total Returns
| 1‑Year | 5‑Year | 10‑Year | ||||||||||
| Retirement Class Shares at NAV |
7.25 | % | 4.15 | % | 5.35 | % | ||||||
| Bloomberg U.S. Aggregate Bond Index |
4.35 | % | 0.31 | % | 1.70 | % | ||||||
| ICE BofA BB‑B U.S. Cash Pay High Yield Constrained Index |
7.04 | % | 3.95 | % | 5.67 | % | ||||||
Fund Statistics (as of March 31, 2026)
| Fund net assets |
$ | 2,186,139,486 | ||
| Total number of portfolio holdings |
370 | |||
| Portfolio turnover (%) |
48% | |||
| Total management fees paid for the year |
$ | 7,149,632 | ||
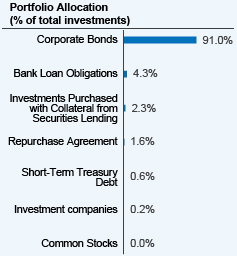
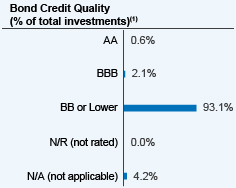
(1) Credit quality ratings are based on the Bloomberg Barclays methodology, which uses the median rating of those compiled by the Moody’s, Standard & Poor’s and Fitch ratings agencies. If ratings are available from only two of these agencies, the lower rating is used. When only one rating is available, that one is used. These ratings are subject to change without notice.
How has the Fund changed?
| • | Portfolio Manager Updates: Effective April 1, 2025, Jean Lin retired and is no longer a portfolio manager of the Fund. Effective July 1, 2025, Kevin Lorenz retired and is no longer a portfolio manager of the Fund. |
For more complete information, you may review the Fund’s next prospectus, which is expected to be available by August 1, 2026 at https://www.nuveen.com/en‑us/mutual‑funds/prospectuses or upon request at (800) 257‑8787.
For more complete information, you may review the Fund’s next prospectus, which is expected to be available by August 1, 2026 at https://www.nuveen.com/en‑us/mutual‑funds/prospectuses or upon request at (800) 257‑8787.
What were the Fund costs for the last year? (based on a hypothetical $10,000 investment)
| Cost of a $10,000 investment |
Costs paid as a percentage of $10,000 investment* | |||
| Class W Shares |
$0 | 0.00% | ||
* Annualized for period less than one year.
How did the Fund perform last year? What affected the Fund’s performance?
| Performance Highlights • The Nuveen High Yield Fund returned 7.90% for Class W Shares at net asset value (NAV) for the 12 months ended March 31, 2026. The Fund outperformed the ICE BofA BB‑B U.S. Cash Pay High Yield Constrained Index, which returned 7.04%. • Top contributors to relative performance • Security selection within the specialty retail industry, driven by an overweight to The Michaels Companies. • Security selection within the software/services industry. • Security selection within the health facilities industry. • Top detractors from relative performance • Security selection and an overweight position in the rail industry, including an overweight to Brightline East. • Security selection within the telecom – wireline integrated & services industry, including an overweight to LCPR Financing. • Security selection within the building materials industry, including an overweight to Cornerstone Building Brands, Inc. |
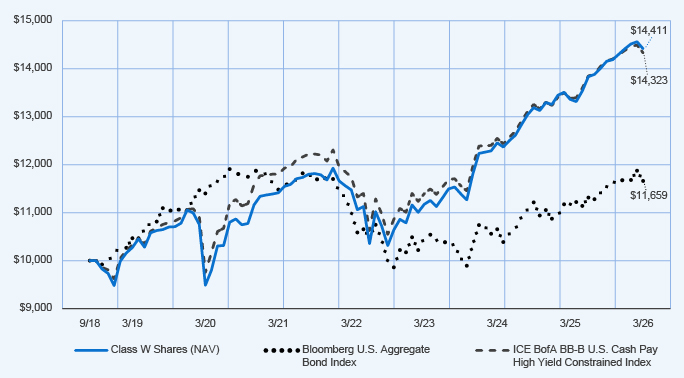
Average Annual Total Returns
| 1‑Year | 5‑Year | Since Inception (9/28/18) | ||||
| Class W Shares at NAV |
7.90% | 4.77% | 4.99% | |||
| Bloomberg U.S. Aggregate Bond Index |
4.35% | 0.31% | 2.07% | |||
| ICE BofA BB‑B U.S. Cash Pay High Yield Constrained Index |
7.04% | 3.95% | 4.90% | |||
Fund Statistics (as of March 31, 2026)
| Fund net assets |
$ 2,186,139,486 | |||
| Total number of portfolio holdings |
370 | |||
| Portfolio turnover (%) |
48% | |||
| Total management fees paid for the year |
$ 7,149,632 | |||
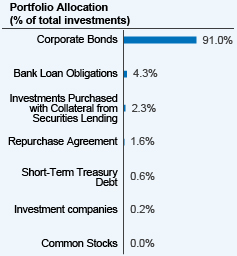
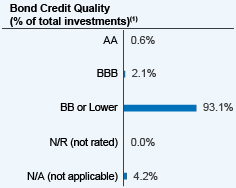
(1) Credit quality ratings are based on the Bloomberg Barclays methodology, which uses the median rating of those compiled by the Moody’s, Standard & Poor’s and Fitch ratings agencies. If ratings are available from only two of these agencies, the lower rating is used. When only one rating is available, that one is used. These ratings are subject to change without notice.
How has the Fund changed?
| • | Portfolio Manager Updates: Effective April 1, 2025, Jean Lin retired and is no longer a portfolio manager of the Fund. Effective July 1, 2025, Kevin Lorenz retired and is no longer a portfolio manager of the Fund. |
For more complete information, you may review the Fund’s next prospectus, which is expected to be available by August 1, 2026 at https://www.nuveen.com/en‑us/mutual‑funds/prospectuses or upon request at (800) 257‑8787.
For more complete information, you may review the Fund’s next prospectus, which is expected to be available by August 1, 2026 at https://www.nuveen.com/en‑us/mutual‑funds/prospectuses or upon request at (800) 257‑8787.
This report describes changes to the Fund that occurred during the reporting period.
What were the Fund costs for the last year? (based on a hypothetical $10,000 investment)
| Cost of a $10,000 investment |
Costs paid as a percentage of $10,000 investment* | |||
| Class W Shares |
$0 | 0.00% | ||
* Annualized for period less than one year.
How did the Fund perform last year? What affected the Fund’s performance?
| Performance Highlights • The Nuveen Core Plus Bond Fund returned 4.79% for Class W Shares at net asset value (NAV) for the 12 months ended March 31, 2026. The Fund outperformed the Bloomberg U.S. Aggregate Bond Index, which returned 4.35%. • Top contributors to relative performance • An overweight to corporate bonds, including out‑of‑benchmark allocations to high-yield and emerging-markets corporate bonds and a corresponding underweight to U.S. Treasuries. • An overweight to emerging-markets debt and out‑of‑benchmark exposure to non‑agency mortgage-backed securities. • Security selection, especially within corporate bonds and commercial mortgage-backed securities. • Top detractors from relative performance • Yield curve positioning. |
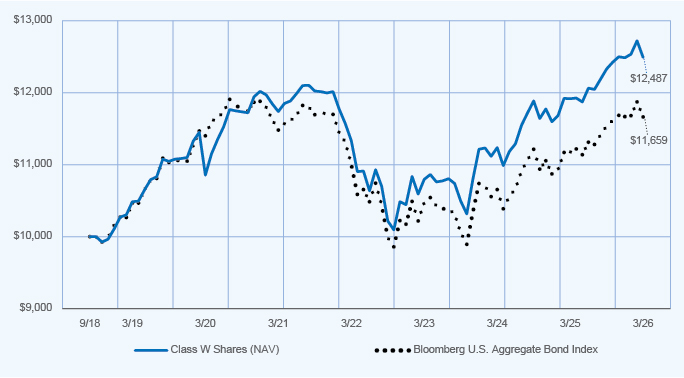
Average Annual Total Returns
| 1‑Year | 5‑Year | Since Inception (9/28/18) | ||||
| Class W Shares at NAV |
4.79% | 1.25% | 3.00% | |||
| Bloomberg U.S. Aggregate Bond Index |
4.35% | 0.31% | 2.07% | |||
Fund Statistics (as of March 31, 2026)
| Fund net assets |
$ 4,420,052,522 | |||
| Total number of portfolio holdings |
1,605 | |||
| Portfolio turnover (%) |
121% | |||
| Total management fees paid for the year |
$ 13,064,399 | |||
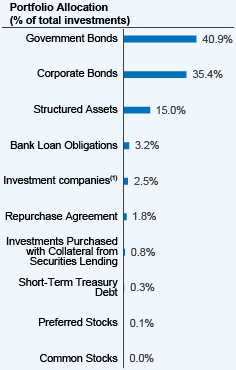
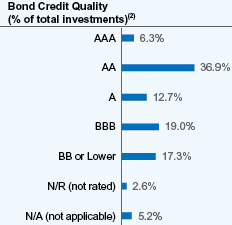
(1) Affiliated investment.
(2) Credit quality ratings are based on the Bloomberg Barclays methodology, which uses the median rating of those compiled by the Moody’s, Standard & Poor’s and Fitch ratings agencies. If ratings are available from only two of these agencies, the lower rating is used. When only one rating is available, that one is used. These ratings are subject to change without notice.
How has the Fund changed?
| • | Portfolio Manager Update: Effective July 1, 2025, Kevin Lorenz retired and is no longer a portfolio manager of the Fund. |
For more complete information, you may review the Fund’s next prospectus, which is expected to be available by August 1, 2026 at https://www.nuveen.com/en‑us/mutual‑funds/prospectuses or upon request at (800) 257‑8787.
For more complete information, you may review the Fund’s next prospectus, which is expected to be available by August 1, 2026 at https://www.nuveen.com/en‑us/mutual‑funds/prospectuses or upon request at (800) 257‑8787.
This report describes changes to the Fund that occurred during the reporting period.
What were the Fund costs for the last year? (based on a hypothetical $10,000 investment)
| Cost of a $10,000 investment |
Costs paid as a percentage of $10,000 investment* | |||
| Retirement Class Shares |
$55 | 0.54% | ||
* Annualized for period less than one year.
How did the Fund perform last year? What affected the Fund’s performance?
Performance Highlights
| • | The Nuveen Core Plus Bond Fund returned 4.23% for Retirement Class Shares at net asset value (NAV) for the 12 months ended March 31, 2026. The Fund performed in line with the Bloomberg U.S. Aggregate Bond Index, which returned 4.35%. |
| • | Top contributors to relative performance |
| • | An overweight to corporate bonds, including out‑of‑benchmark allocations to high-yield and emerging-markets corporate bonds and a corresponding underweight to U.S. Treasuries. |
| • | An overweight to emerging-markets debt and out‑of‑benchmark exposure to non‑agency mortgage-backed securities. |
| • | Security selection, especially within corporate bonds and commercial mortgage-backed securities. |
| • | Top detractors from relative performance |
| • | Yield curve positioning. |
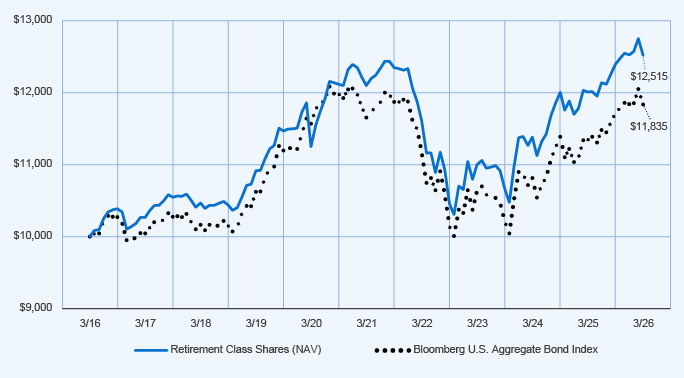
Average Annual Total Returns
| 1‑Year | 5‑Year | 10‑Year | ||||||||||
| Retirement Class Shares at NAV |
4.23 | % | 0.68 | % | 2.27 | % | ||||||
| Bloomberg U.S. Aggregate Bond Index |
4.35 | % | 0.31 | % | 1.70 | % | ||||||
Fund Statistics (as of March 31, 2026)
| Fund net assets |
$ | 4,420,052,522 | ||
| Total number of portfolio holdings |
1,605 | |||
| Portfolio turnover (%) |
121% | |||
| Total management fees paid for the year |
$ | 13,064,399 | ||
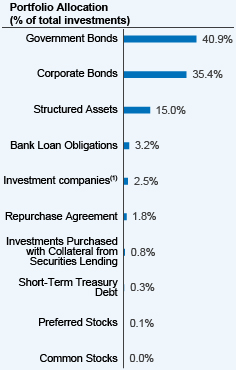
(1) Affiliated investment.
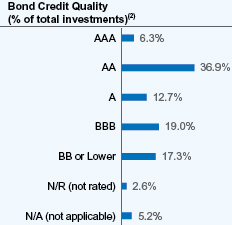
(2) Credit quality ratings are based on the Bloomberg Barclays methodology, which uses the median rating of those compiled by the Moody’s, Standard & Poor’s and Fitch ratings agencies. If ratings are available from only two of these agencies, the lower rating is used. When only one rating is available, that one is used. These ratings are subject to change without notice.
How has the Fund changed?
| • | Portfolio Manager Update: Effective July 1, 2025, Kevin Lorenz retired and is no longer a portfolio manager of the Fund. |
For more complete information, you may review the Fund’s next prospectus, which is expected to be available by August 1, 2026 at https://www.nuveen.com/en‑us/mutual‑funds/prospectuses or upon request at (800) 257‑8787.
For more complete information, you may review the Fund’s next prospectus, which is expected to be available by August 1, 2026 at https://www.nuveen.com/en‑us/mutual‑funds/prospectuses or upon request at (800) 257‑8787.
This report describes changes to the Fund that occurred during the reporting period.
What were the Fund costs for the last year? (based on a hypothetical $10,000 investment)
| Cost of a $10,000 investment |
Costs paid as a percentage of $10,000 investment* | |||
| Class R6 Shares |
$30 | 0.29% | ||
* Annualized for period less than one year.
How did the Fund perform last year? What affected the Fund’s performance?
Performance Highlights
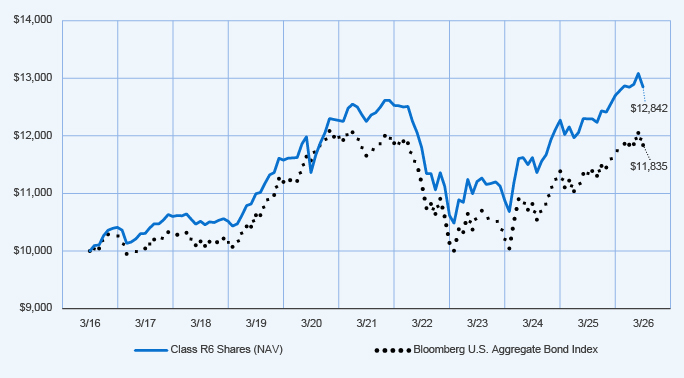
| • | The Nuveen Core Plus Bond Fund returned 4.49% for Class R6 Shares at net asset value (NAV) for the 12 months ended March 31, 2026. The Fund performed in line with the Bloomberg U.S. Aggregate Bond Index, which returned 4.35%. |
| • | Top contributors to relative performance |
| • | An overweight to corporate bonds, including out‑of‑benchmark allocations to high-yield and emerging-markets corporate bonds and a corresponding underweight to U.S. Treasuries. |
| • | An overweight to emerging-markets debt and out‑of‑benchmark exposure to non‑agency mortgage-backed securities. |
| • | Security selection, especially within corporate bonds and commercial mortgage-backed securities. |
| • | Top detractors from relative performance |
| • | Yield curve positioning. |
Average Annual Total Returns
| 1‑Year | 5‑Year | 10‑Year | ||||||||||
| Class R6 Shares at NAV |
4.49 | % | 0.95 | % | 2.53 | % | ||||||
| Bloomberg U.S. Aggregate Bond Index |
4.35 | % | 0.31 | % | 1.70 | % | ||||||
Fund Statistics (as of March 31, 2026)
| Fund net assets |
$ | 4,420,052,522 | ||
| Total number of portfolio holdings |
1,605 | |||
| Portfolio turnover (%) |
121% | |||
| Total management fees paid for the year |
$ | 13,064,399 | ||
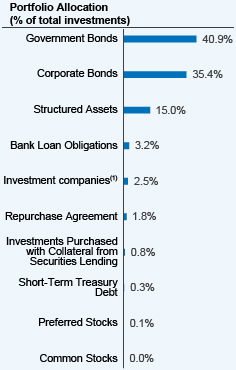
(1) Affiliated investment.
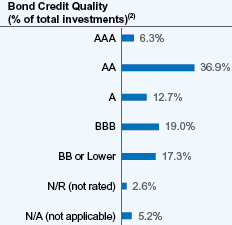
(2) Credit quality ratings are based on the Bloomberg Barclays methodology, which uses the median rating of those compiled by the Moody’s, Standard & Poor’s and Fitch ratings agencies. If ratings are available from only two of these agencies, the lower rating is used. When only one rating is available, that one is used. These ratings are subject to change without notice.
How has the Fund changed?
| • | Portfolio Manager Update: Effective July 1, 2025, Kevin Lorenz retired and is no longer a portfolio manager of the Fund. |
For more complete information, you may review the Fund’s next prospectus, which is expected to be available by August 1, 2026 at https://www.nuveen.com/en‑us/mutual‑funds/prospectuses or upon request at (800) 257‑8787.
For more complete information, you may review the Fund’s next prospectus, which is expected to be available by August 1, 2026 at https://www.nuveen.com/en‑us/mutual‑funds/prospectuses or upon request at (800) 257‑8787.
This report describes changes to the Fund that occurred during the reporting period.
What were the Fund costs for the last year? (based on a hypothetical $10,000 investment)
| Cost of a $10,000 investment |
Costs paid as a percentage of $10,000 investment* | |||
| Premier Class Shares |
$46 | 0.45% | ||
* Annualized for period less than one year.
How did the Fund perform last year? What affected the Fund’s performance?
| Performance Highlights • The Nuveen Core Plus Bond Fund returned 4.33% for Premier Class Shares at net asset value (NAV) for the 12 months ended March 31, 2026. The Fund performed in line with the Bloomberg U.S. Aggregate Bond Index, which returned 4.35%. • Top contributors to relative performance • An overweight to corporate bonds, including out‑of‑benchmark allocations to high-yield and emerging-markets corporate bonds and a corresponding underweight to U.S. Treasuries. • An overweight to emerging-markets debt and out‑of‑benchmark exposure to non‑agency mortgage-backed securities. • Security selection, especially within corporate bonds and commercial mortgage-backed securities. • Top detractors from relative performance • Yield curve positioning. |
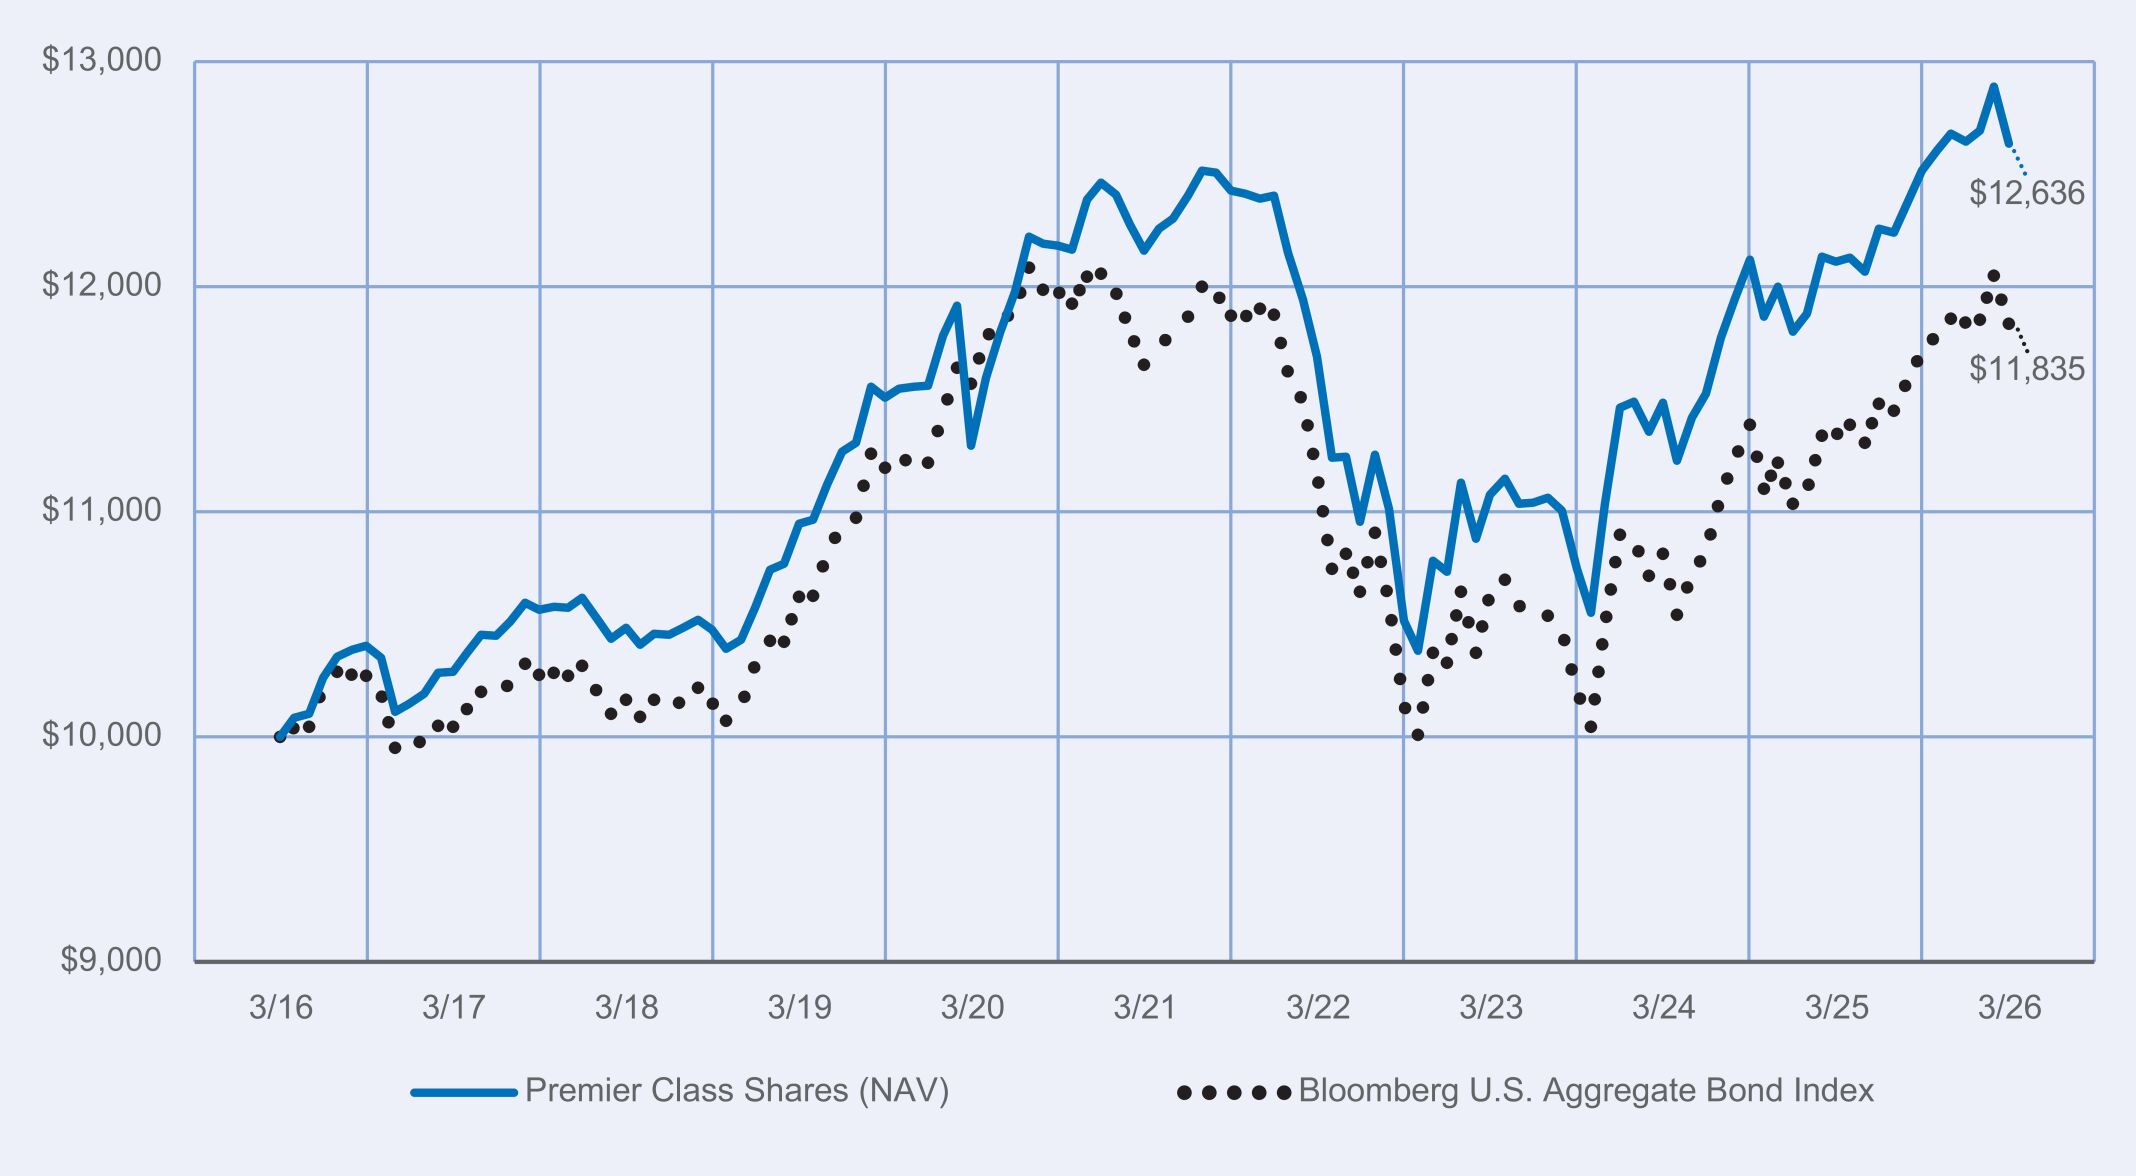
Average Annual Total Returns
| 1‑Year | 5‑Year | 10‑Year | ||||
| Premier Class Shares at NAV |
4.33% | 0.77% | 2.37% | |||
| Bloomberg U.S. Aggregate Bond Index |
4.35% | 0.31% | 1.70% | |||
Fund Statistics (as of March 31, 2026)
| Fund net assets |
$4,420,052,522 | |||
| Total number of portfolio holdings |
1,605 | |||
| Portfolio turnover (%) |
121% | |||
| Total management fees paid for the year |
$ 13,064,399 | |||
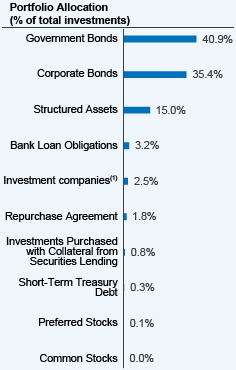
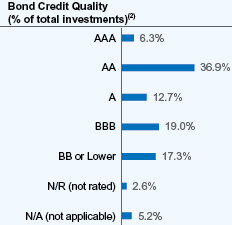
(1) Affiliated investment.
(2) Credit quality ratings are based on the Bloomberg Barclays methodology, which uses the median rating of those compiled by the Moody’s, Standard & Poor’s and Fitch ratings agencies. If ratings are available from only two of these agencies, the lower rating is used. When only one rating is available, that one is used. These ratings are subject to change without notice.
How has the Fund changed?
| • | Portfolio Manager Update: Effective July 1, 2025, Kevin Lorenz retired and is no longer a portfolio manager of the Fund. |
For more complete information, you may review the Fund’s next prospectus, which is expected to be available by August 1, 2026 at https://www.nuveen.com/en‑us/mutual‑funds/prospectuses or upon request at (800) 257‑8787.
For more complete information, you may review the Fund’s next prospectus, which is expected to be available by August 1, 2026 at https://www.nuveen.com/en‑us/mutual‑funds/prospectuses or upon request at (800) 257‑8787.
This report describes changes to the Fund that occurred during the reporting period.
What were the Fund costs for the last year? (based on a hypothetical $10,000 investment)
| Cost of a $10,000 investment |
Costs paid as a percentage of $10,000 investment* | |||
| Class I Shares |
$37 | 0.36% | ||
* Annualized for period less than one year.
How did the Fund perform last year? What affected the Fund’s performance?
| Performance Highlights • The Nuveen Core Plus Bond Fund returned 4.41% for Class I Shares at net asset value (NAV) for the 12 months ended March 31, 2026. The Fund performed in line with the Bloomberg U.S. Aggregate Bond Index, which returned 4.35%. • Top contributors to relative performance • An overweight to corporate bonds, including out‑of‑benchmark allocations to high-yield and emerging-markets corporate bonds and a corresponding underweight to U.S. Treasuries. • An overweight to emerging-markets debt and out‑of‑benchmark exposure to non‑agency mortgage-backed securities. • Security selection, especially within corporate bonds and commercial mortgage-backed securities. • Top detractors from relative performance • Yield curve positioning. |
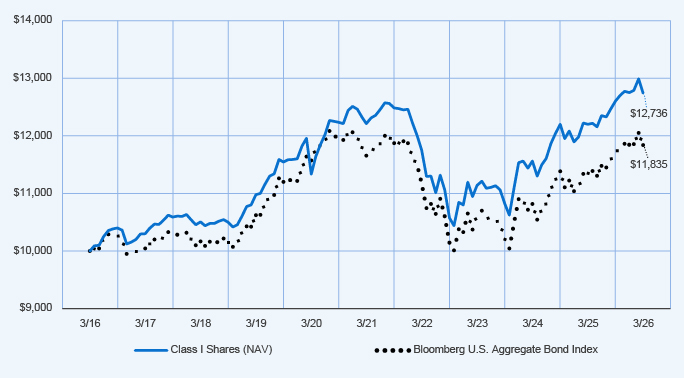
Average Annual Total Returns
| 1‑Year | 5‑Year | 10‑Year | ||||
| Class I Shares at NAV |
4.41% | 0.85% | 2.45% | |||
| Bloomberg U.S. Aggregate Bond Index |
4.35% | 0.31% | 1.70% | |||
Fund Statistics (as of March 31, 2026)
| Fund net assets |
$4,420,052,522 | |||
| Total number of portfolio holdings |
1,605 | |||
| Portfolio turnover (%) |
121% | |||
| Total management fees paid for the year |
$ 13,064,399 | |||
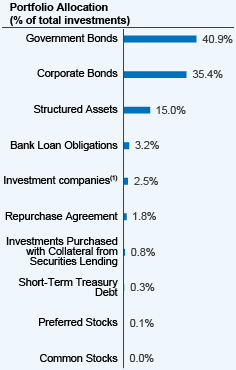
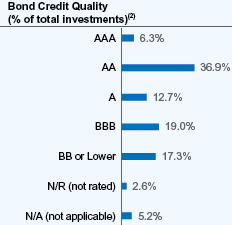
(1) Affiliated investment.
(2) Credit quality ratings are based on the Bloomberg Barclays methodology, which uses the median rating of those compiled by the Moody’s, Standard & Poor’s and Fitch ratings agencies. If ratings are available from only two of these agencies, the lower rating is used. When only one rating is available, that one is used. These ratings are subject to change without notice.
How has the Fund changed?
| • | Portfolio Manager Update: Effective July 1, 2025, Kevin Lorenz retired and is no longer a portfolio manager of the Fund. |
For more complete information, you may review the Fund’s next prospectus, which is expected to be available by August 1, 2026 at https://www.nuveen.com/en‑us/mutual‑funds/prospectuses or upon request at (800) 257‑8787.
For more complete information, you may review the Fund’s next prospectus, which is expected to be available by August 1, 2026 at https://www.nuveen.com/en‑us/mutual‑funds/prospectuses or upon request at (800) 257‑8787.
This report describes changes to the Fund that occurred during the reporting period.
What were the Fund costs for the last year? (based on a hypothetical $10,000 investment)
| Cost of a $10,000 investment |
Costs paid as a percentage of $10,000 investment* | |||
| Class A Shares |
$64 | 0.63% | ||
* Annualized for period less than one year.
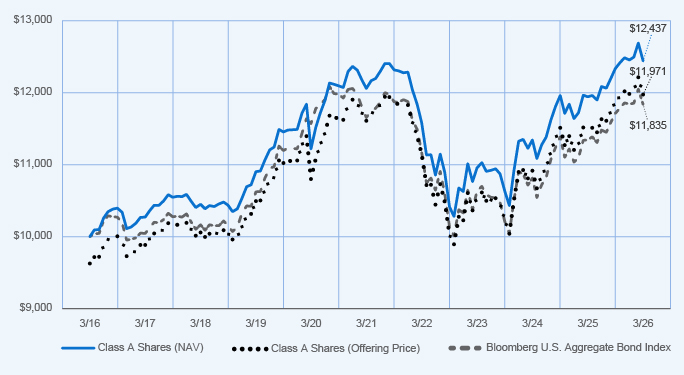
How did the Fund perform last year? What affected the Fund’s performance?
Performance Highlights
| • | The Nuveen Core Plus Bond Fund returned 4.14% for Class A Shares at net asset value (NAV) for the 12 months ended March 31, 2026. The Fund performed in line with the Bloomberg U.S. Aggregate Bond Index, which returned 4.35%. |
| • | Top contributors to relative performance |
| • | An overweight to corporate bonds, including out‑of‑benchmark allocations to high-yield and emerging-markets corporate bonds and a corresponding underweight to U.S. Treasuries. |
| • | An overweight to emerging-markets debt and out‑of‑benchmark exposure to non‑agency mortgage-backed securities. |
| • | Security selection, especially within corporate bonds and commercial mortgage-backed securities. |
| • | Top detractors from relative performance |
| • | Yield curve positioning. |
Average Annual Total Returns
| 1‑Year | 5‑Year | 10‑Year | ||||||||||
| Class A Shares at NAV (excluding maximum sales charge) |
4.14 | % | 0.62 | % | 2.20 | % | ||||||
| Class A at maximum sales charge (Offering Price) |
0.24 | % | (0.14 | )% | 1.81 | % | ||||||
| Bloomberg U.S. Aggregate Bond Index |
4.35 | % | 0.31 | % | 1.70 | % | ||||||
Fund Statistics (as of March 31, 2026)
| Fund net assets |
$ | 4,420,052,522 | ||
| Total number of portfolio holdings |
1,605 | |||
| Portfolio turnover (%) |
121% | |||
| Total management fees paid for the year |
$ | 13,064,399 | ||
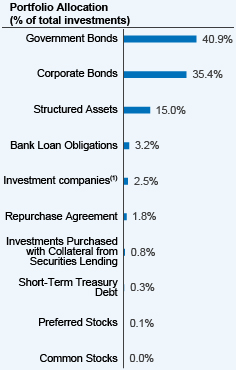
(1) Affiliated investment.
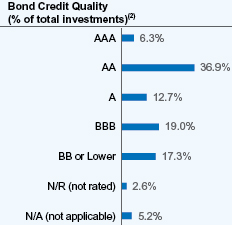
(2) Credit quality ratings are based on the Bloomberg Barclays methodology, which uses the median rating of those compiled by the Moody’s, Standard & Poor’s and Fitch ratings agencies. If ratings are available from only two of these agencies, the lower rating is used. When only one rating is available, that one is used. These ratings are subject to change without notice.
How has the Fund changed?
| • | Portfolio Manager Update: Effective July 1, 2025, Kevin Lorenz retired and is no longer a portfolio manager of the Fund. |
For more complete information, you may review the Fund’s next prospectus, which is expected to be available by August 1, 2026 at https://www.nuveen.com/en‑us/mutual‑funds/prospectuses or upon request at (800) 257‑8787.
For more complete information, you may review the Fund’s next prospectus, which is expected to be available by August 1, 2026 at https://www.nuveen.com/en‑us/mutual‑funds/prospectuses or upon request at (800) 257‑8787.
This report describes changes to the Fund that occurred during the reporting period.
What were the Fund costs for the last year? (based on a hypothetical $10,000 investment)
| Cost of a $10,000 investment |
Costs paid as a percentage of $10,000 investment* | |||
| Class A Shares |
$60 | 0.59% | ||
* Annualized for period less than one year.
How did the Fund perform last year? What affected the Fund’s performance?
Performance Highlights
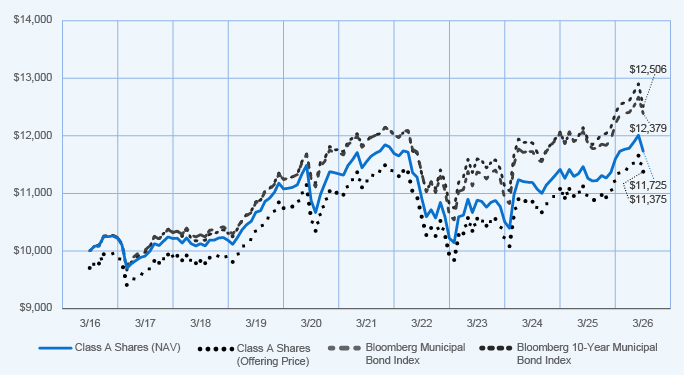
| • | The Nuveen 5‑15 Year Laddered Tax Exempt Bond Fund returned 4.15% for Class A Shares at net asset value (NAV) for the 12 months ended March 31, 2026. The Fund underperformed the Bloomberg 10‑Year Municipal Bond Index, which returned 4.81%. |
| • | Top contributors to relative performance |
| • | Security selection in the lease backed and local GO sectors. |
| • | An overweight to the housing sector. |
| • | Exposure to the utility and education sectors. |
| • | Top detractors from relative performance |
| • | Exposure to the state GO, special tax and water/sewer sectors. |
| • | Yield curve positioning. |
| • | Security selection in the industrial development, health care and transportation sectors. |
Average Annual Total Returns
| 1‑Year | 5‑Year | 10‑Year | ||||||||||
| Class A Shares at NAV (excluding maximum sales charge) |
4.15 | % | 0.31 | % | 1.60 | % | ||||||
| Class A at maximum sales charge (Offering Price) |
1.00 | % | (0.31 | )% | 1.30 | % | ||||||
| Bloomberg Municipal Bond Index |
4.29 | % | 0.84 | % | 2.16 | % | ||||||
| Bloomberg 10‑Year Municipal Bond Index |
4.81 | % | 1.00 | % | 2.26 | % | ||||||
Fund Statistics (as of March 31, 2026)
| Fund net assets |
$ | 192,196,208 | ||
| Total number of portfolio holdings |
187 | |||
| Portfolio turnover (%) |
14% | |||
| Total management fees paid for the year |
$ | 491,983 | ||
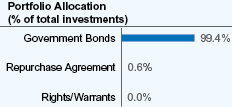
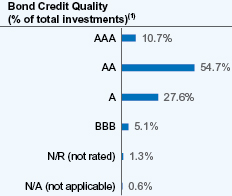
(1) Credit quality ratings are based on the Bloomberg Barclays methodology, which uses the median rating of those compiled by the Moody’s, Standard & Poor’s and Fitch ratings agencies. If ratings are available from only two of these agencies, the lower rating is used. When only one rating is available, that one is used. These ratings are subject to change without notice.
How has the Fund changed?
For more complete information, you may review the Fund’s next prospectus, which is expected to be available by August 1, 2026 at https://www.nuveen.com/en‑us/mutual‑funds/prospectuses or upon request at (800) 257‑8787.
For more complete information, you may review the Fund’s next prospectus, which is expected to be available by August 1, 2026 at https://www.nuveen.com/en‑us/mutual‑funds/prospectuses or upon request at (800) 257‑8787.
This report describes changes to the Fund that occurred during the reporting period.
What were the Fund costs for the last year? (based on a hypothetical $10,000 investment)
| Cost of a $10,000 investment |
Costs paid as a percentage of $10,000 investment* | |||
| Class I Shares |
$35 | 0.34% | ||
* Annualized for period less than one year.
How did the Fund perform last year? What affected the Fund’s performance?
| Performance Highlights • The Nuveen 5‑15 Year Laddered Tax Exempt Bond Fund returned 4.41% for Class I Shares at net asset value (NAV) for the 12 months ended March 31, 2026. The Fund underperformed the Bloomberg 10‑Year Municipal Bond Index, which returned 4.81%. • Top contributors to relative performance • Security selection in the lease backed and local GO sectors. • An overweight to the housing sector. • Exposure to the utility and education sectors. • Top detractors from relative performance • Exposure to the state GO, special tax and water/sewer sectors. • Yield curve positioning. • Security selection in the industrial development, health care and transportation sectors. |
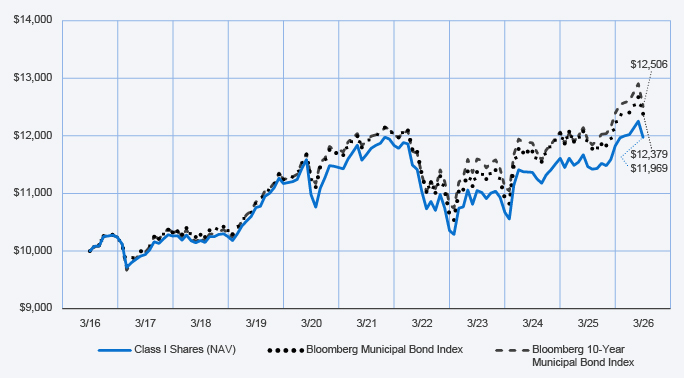
Average Annual Total Returns
| 1‑Year | 5‑Year | 10‑Year | ||||
| Class I Shares at NAV |
4.41% | 0.50% | 1.81% | |||
| Bloomberg Municipal Bond Index |
4.29% | 0.84% | 2.16% | |||
| Bloomberg 10‑Year Municipal Bond Index |
4.81% | 1.00% | 2.26% | |||
Fund Statistics (as of March 31, 2026)
| Fund net assets |
$192,196,208 | |||
| Total number of portfolio holdings |
187 | |||
| Portfolio turnover (%) |
14% | |||
| Total management fees paid for the year |
$ 491,983 | |||
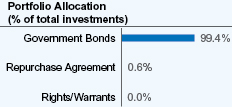 |
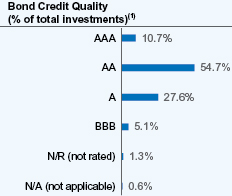 |
(1) Credit quality ratings are based on the Bloomberg Barclays methodology, which uses the median rating of those compiled by the Moody’s, Standard & Poor’s and Fitch ratings agencies. If ratings are available from only two of these agencies, the lower rating is used. When only one rating is available, that one is used. These ratings are subject to change without notice.
How has the Fund changed?
For more complete information, you may review the Fund’s next prospectus, which is expected to be available by August 1, 2026 at https://www.nuveen.com/en‑us/mutual‑funds/prospectuses or upon request at (800) 257‑8787.
For more complete information, you may review the Fund’s next prospectus, which is expected to be available by August 1, 2026 at https://www.nuveen.com/en‑us/mutual‑funds/prospectuses or upon request at (800) 257‑8787.
This report describes changes to the Fund that occurred during the reporting period.
What were the Fund costs for the last year? (based on a hypothetical $10,000 investment)
| Cost of a $10,000 investment |
Costs paid as a percentage of $10,000 investment* | |||
| Class R6 Shares |
$31 | 0.30% | ||
* Annualized for period less than one year.
How did the Fund perform last year? What affected the Fund’s performance?
| Performance Highlights • The Nuveen 5‑15 Year Laddered Tax Exempt Bond Fund returned 4.45% for Class R6 Shares at net asset value (NAV) for the 12 months ended March 31, 2026. The Fund underperformed the Bloomberg 10‑Year Municipal Bond Index, which returned 4.81%. • Top contributors to relative performance • Security selection in the lease backed and local GO sectors. • An overweight to the housing sector. • Exposure to the utility and education sectors. • Top detractors from relative performance • Exposure to the state GO, special tax and water/sewer sectors. • Yield curve positioning. • Security selection in the industrial development, health care and transportation sectors. |
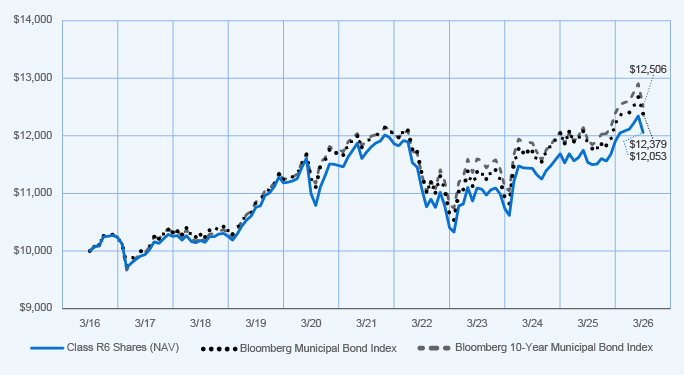
Average Annual Total Returns
| 1‑Year | 5‑Year | 10‑Year | ||||
| Class R6 Shares at NAV |
4.45% | 0.58% | 1.88% | |||
| Bloomberg Municipal Bond Index |
4.29% | 0.84% | 2.16% | |||
| Bloomberg 10‑Year Municipal Bond Index |
4.81% | 1.00% | 2.26% | |||
Fund Statistics (as of March 31, 2026)
| Fund net assets |
$192,196,208 | |||
| Total number of portfolio holdings |
187 | |||
| Portfolio turnover (%) |
14% | |||
| Total management fees paid for the year |
$ 491,983 | |||
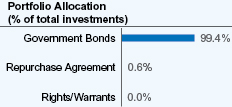
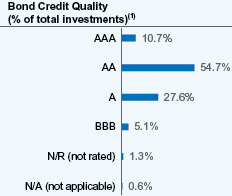
(1) Credit quality ratings are based on the Bloomberg Barclays methodology, which uses the median rating of those compiled by the Moody’s, Standard & Poor’s and Fitch ratings agencies. If ratings are available from only two of these agencies, the lower rating is used. When only one rating is available, that one is used. These ratings are subject to change without notice.
How has the Fund changed?
For more complete information, you may review the Fund’s next prospectus, which is expected to be available by August 1, 2026 at https://www.nuveen.com/en‑us/mutual‑funds/prospectuses or upon request at (800) 257‑8787.
For more complete information, you may review the Fund’s next prospectus, which is expected to be available by August 1, 2026 at https://www.nuveen.com/en‑us/mutual‑funds/prospectuses or upon request at (800) 257‑8787.
This report describes changes to the Fund that occurred during the reporting period.
What were the Fund costs for the last year? (based on a hypothetical $10,000 investment)
| Cost of a $10,000 investment |
Costs paid as a percentage of $10,000 investment* | |||
| Class W Shares |
$0 | 0.00% | ||
* Annualized for period less than one year.
How did the Fund perform last year? What affected the Fund’s performance?
| Performance Highlights • The Nuveen Bond Index Fund’s total return for Class W Shares at net asset value (NAV) was 4.39% for the 12 months ended March 31, 2026. The Fund’s index, the Bloomberg U.S. Aggregate Bond Index, returned 4.35%. • Despite the effect of certain expenses incurred by the Fund that are not incurred by the benchmark index, the Fund’s return at NAV outperformed that of the index. • The Fund had a risk profile similar to that of its benchmark. As such, there were no material contributors or detractors relative to the Fund’s benchmark during the period. |
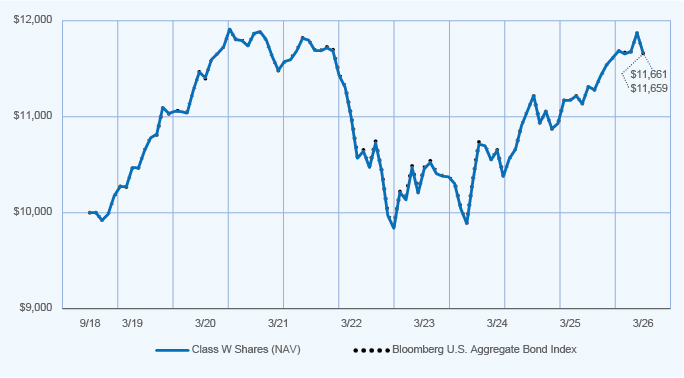
Average Annual Total Returns
| 1‑Year | 5‑Year | Since Inception (9/28/18) | ||||
| Class W Shares at NAV |
4.39% | 0.31% | 2.07% | |||
| Bloomberg U.S. Aggregate Bond Index |
4.35% | 0.31% | 2.07% | |||
Fund Statistics (as of March 31, 2026)
| Fund net assets |
$ 21,161,202,913 | |||
| Total number of portfolio holdings |
8,530 | |||
| Portfolio turnover (%) |
28% | |||
| Total management fees paid for the year |
$ 14,535,016 | |||
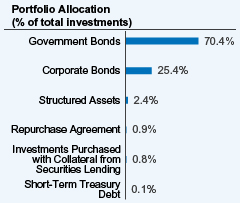
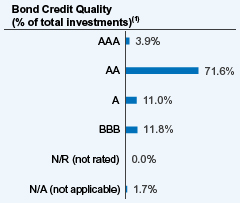
(1) Credit quality ratings are based on the Bloomberg Barclays methodology, which uses the median rating of those compiled by the Moody’s, Standard & Poor’s and Fitch ratings agencies. If ratings are available from only two of these agencies, the lower rating is used. When only one rating is available, that one is used. These ratings are subject to change without notice.
How has the Fund changed?
| • | Portfolio manager updates: Effective January 23, 2026, Joseph Spinelli was added as a portfolio manager of the Fund and Vivian Liu was removed as a portfolio manager of the Fund. |
For more complete information, you may review the Fund’s next prospectus, which is expected to be available by August 1, 2026 at https://www.nuveen.com/en‑us/mutual‑funds/prospectuses or upon request at (800) 257‑8787.
For more complete information, you may review the Fund’s next prospectus, which is expected to be available by August 1, 2026 at https://www.nuveen.com/en‑us/mutual‑funds/prospectuses or upon request at (800) 257‑8787.
This report describes changes to the Fund that occurred during the reporting period.
What were the Fund costs for the last year? (based on a hypothetical $10,000 investment)
| Cost of a $10,000 investment |
Costs paid as a percentage of $10,000 investment* | |||
| Class R6 Shares |
$7 | 0.07% | ||
* Annualized for period less than one year.
How did the Fund perform last year? What affected the Fund’s performance?
| Performance Highlights • The Nuveen Bond Index Fund’s total return for Class R6 Shares at net asset value (NAV) was 4.32% for the 12 months ended March 31, 2026. The Fund’s index, the Bloomberg U.S. Aggregate Bond Index, returned 4.35%. • The difference between the Fund’s total return at NAV and that of the index is attributable to management fees and other expenses incurred by the Fund that are not incurred by the index. • The Fund had a risk profile similar to that of its benchmark. As such, there were no material contributors or detractors relative to the Fund’s benchmark during the period. |
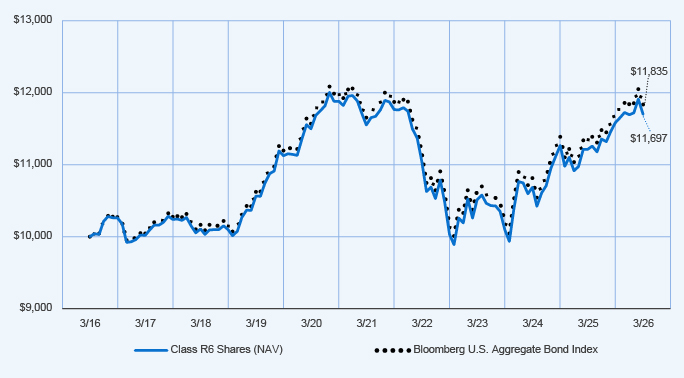
Average Annual Total Returns
| 1‑Year | 5‑Year | 10‑Year | ||||
| Class R6 Shares at NAV |
4.32% | 0.25% | 1.58% | |||
| Bloomberg U.S. Aggregate Bond Index |
4.35% | 0.31% | 1.70% | |||
Fund Statistics (as of March 31, 2026)
| Fund net assets |
$21,161,202,913 | |||
| Total number of portfolio holdings |
8,530 | |||
| Portfolio turnover (%) |
28% | |||
| Total management fees paid for the year |
$ 14,535,016 | |||
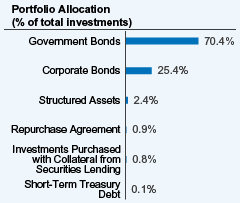
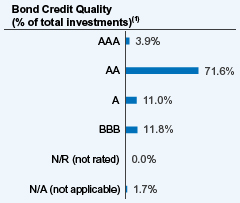
(1) Credit quality ratings are based on the Bloomberg Barclays methodology, which uses the median rating of those compiled by the Moody’s, Standard & Poor’s and Fitch ratings agencies. If ratings are available from only two of these agencies, the lower rating is used. When only one rating is available, that one is used. These ratings are subject to change without notice.
How has the Fund changed?
| • | Portfolio manager updates: Effective January 23, 2026, Joseph Spinelli was added as a portfolio manager of the Fund and Vivian Liu was removed as a portfolio manager of the Fund. |
For more complete information, you may review the Fund’s next prospectus, which is expected to be available by August 1, 2026 at https://www.nuveen.com/en‑us/mutual‑funds/prospectuses or upon request at (800) 257‑8787.
For more complete information, you may review the Fund’s next prospectus, which is expected to be available by August 1, 2026 at https://www.nuveen.com/en‑us/mutual‑funds/prospectuses or upon request at (800) 257‑8787.
This report describes changes to the Fund that occurred during the reporting period.
What were the Fund costs for the last year? (based on a hypothetical $10,000 investment)
| Cost of a $10,000 investment |
Costs paid as a percentage of $10,000 investment* | |||
| Retirement Class Shares |
$33 | 0.32% | ||
* Annualized for period less than one year.
How did the Fund perform last year? What affected the Fund’s performance?
| Performance Highlights • The Nuveen Bond Index Fund’s total return for Retirement Class Shares at net asset value (NAV) was 4.06% for the 12 months ended March 31, 2026. The Fund’s index, the Bloomberg U.S. Aggregate Bond Index, returned 4.35%. • The difference between the Fund’s total return at NAV and that of the index is attributable to management fees and other expenses incurred by the Fund that are not incurred by the index. • The Fund had a risk profile similar to that of its benchmark. As such, there were no material contributors or detractors relative to the Fund’s benchmark during the period. |
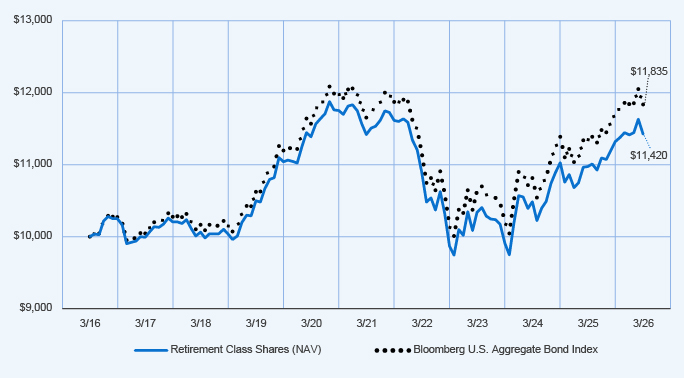
Average Annual Total Returns
| 1‑Year | 5‑Year | 10‑Year | ||||
| Retirement Class Shares at NAV |
4.06% | 0.01% | 1.34% | |||
| Bloomberg U.S. Aggregate Bond Index |
4.35% | 0.31% | 1.70% | |||
Fund Statistics (as of March 31, 2026)
| Fund net assets |
$21,161,202,913 | |||
| Total number of portfolio holdings |
8,530 | |||
| Portfolio turnover (%) |
28% | |||
| Total management fees paid for the year |
$ 14,535,016 | |||
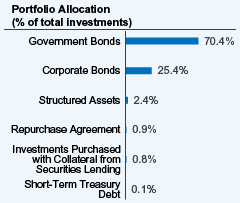
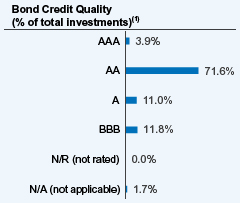
(1) Credit quality ratings are based on the Bloomberg Barclays methodology, which uses the median rating of those compiled by the Moody’s, Standard & Poor’s and Fitch ratings agencies. If ratings are available from only two of these agencies, the lower rating is used. When only one rating is available, that one is used. These ratings are subject to change without notice.
How has the Fund changed?
| • | Portfolio manager updates: Effective January 23, 2026, Joseph Spinelli was added as a portfolio manager of the Fund and Vivian Liu was removed as a portfolio manager of the Fund. |
For more complete information, you may review the Fund’s next prospectus, which is expected to be available by August 1, 2026 at https://www.nuveen.com/en‑us/mutual‑funds/prospectuses or upon request at (800) 257‑8787.
For more complete information, you may review the Fund’s next prospectus, which is expected to be available by August 1, 2026 at https://www.nuveen.com/en‑us/mutual‑funds/prospectuses or upon request at (800) 257‑8787.
This report describes changes to the Fund that occurred during the reporting period.
What were the Fund costs for the last year? (based on a hypothetical $10,000 investment)
| Cost of a $10,000 investment |
Costs paid as a percentage of $10,000 investment* | |||
| Premier Class Shares |
$22 | 0.22% | ||
* Annualized for period less than one year.
How did the Fund perform last year? What affected the Fund’s performance?
| Performance Highlights • The Nuveen Bond Index Fund’s total return for Premier Class Shares at net asset value (NAV) was 4.17% for the 12 months ended March 31, 2026. The Fund’s index, the Bloomberg U.S. Aggregate Bond Index, returned 4.35%. • The difference between the Fund’s total return at NAV and that of the index is attributable to management fees and other expenses incurred by the Fund that are not incurred by the index. • The Fund had a risk profile similar to that of its benchmark. As such, there were no material contributors or detractors relative to the Fund’s benchmark during the period. |
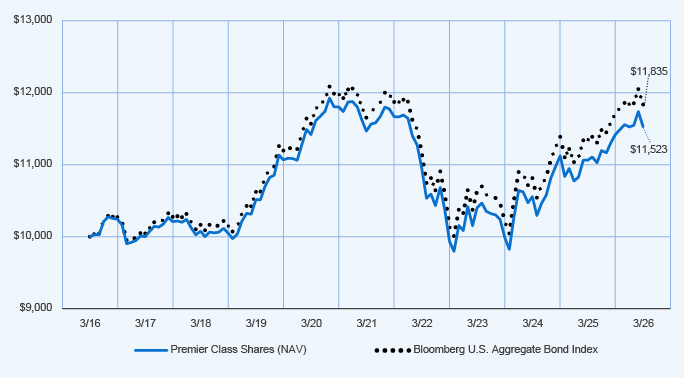
Average Annual Total Returns
| 1‑Year | 5‑Year | 10‑Year | ||||
| Premier Class Shares at NAV |
4.17% | 0.10% | 1.43% | |||
| Bloomberg U.S. Aggregate Bond Index |
4.35% | 0.31% | 1.70% | |||
Fund Statistics (as of March 31, 2026)
| Fund net assets |
$21,161,202,913 | |||
| Total number of portfolio holdings |
8,530 | |||
| Portfolio turnover (%) |
28% | |||
| Total management fees paid for the year |
$ 14,535,016 | |||
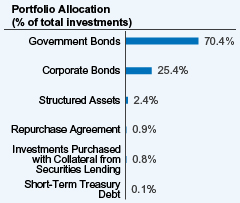
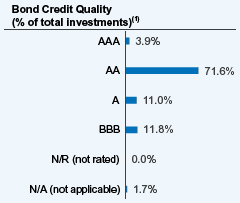
(1) Credit quality ratings are based on the Bloomberg Barclays methodology, which uses the median rating of those compiled by the Moody’s, Standard & Poor’s and Fitch ratings agencies. If ratings are available from only two of these agencies, the lower rating is used. When only one rating is available, that one is used. These ratings are subject to change without notice.
How has the Fund changed?
| • | Portfolio manager updates: Effective January 23, 2026, Joseph Spinelli was added as a portfolio manager of the Fund and Vivian Liu was removed as a portfolio manager of the Fund. |
For more complete information, you may review the Fund’s next prospectus, which is expected to be available by August 1, 2026 at https://www.nuveen.com/en‑us/mutual‑funds/prospectuses or upon request at (800) 257‑8787.
For more complete information, you may review the Fund’s next prospectus, which is expected to be available by August 1, 2026 at https://www.nuveen.com/en‑us/mutual‑funds/prospectuses or upon request at (800) 257‑8787.
This report describes changes to the Fund that occurred during the reporting period.
What were the Fund costs for the last year? (based on a hypothetical $10,000 investment)
| Cost of a $10,000 investment |
Costs paid as a percentage of $10,000 investment* | |||
| Class I Shares |
$17 | 0.17% | ||
* Annualized for period less than one year.
How did the Fund perform last year? What affected the Fund’s performance?
| Performance Highlights • The Nuveen Bond Index Fund’s total return for Class I Shares at net asset value (NAV) was 4.22% for the 12 months ended March 31, 2026. The Fund’s index, the Bloomberg U.S. Aggregate Bond Index, returned 4.35%. • The difference between the Fund’s total return at NAV and that of the index is attributable to management fees and other expenses incurred by the Fund that are not incurred by the index. • The Fund had a risk profile similar to that of its benchmark. As such, there were no material contributors or detractors relative to the Fund’s benchmark during the period. |
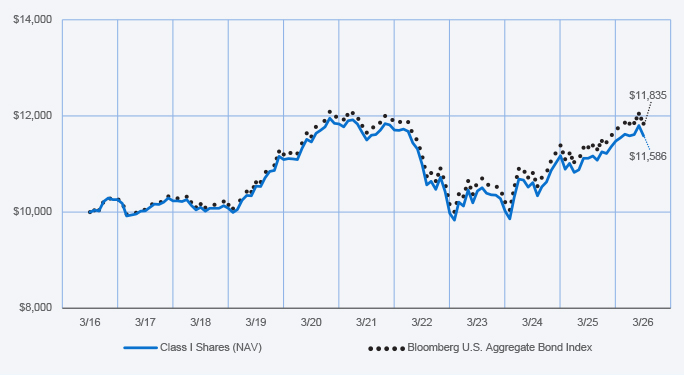
Average Annual Total Returns
| 1‑Year | 5‑Year | 10‑Year | ||||
| Class I Shares at NAV |
4.22% | 0.15% | 1.48% | |||
| Bloomberg U.S. Aggregate Bond Index |
4.35% | 0.31% | 1.70% | |||
Fund Statistics (as of March 31, 2026)
| Fund net assets |
$21,161,202,913 | |||
| Total number of portfolio holdings |
8,530 | |||
| Portfolio turnover (%) |
28% | |||
| Total management fees paid for the year |
$ 14,535,016 | |||
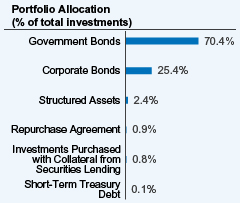 |
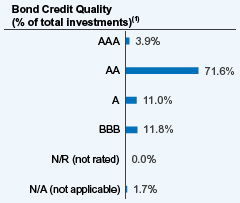 |
(1) Credit quality ratings are based on the Bloomberg Barclays methodology, which uses the median rating of those compiled by the Moody’s, Standard & Poor’s and Fitch ratings agencies. If ratings are available from only two of these agencies, the lower rating is used. When only one rating is available, that one is used. These ratings are subject to change without notice.
How has the Fund changed?
| • | Portfolio manager updates: Effective January 23, 2026, Joseph Spinelli was added as a portfolio manager of the Fund and Vivian Liu was removed as a portfolio manager of the Fund. |
For more complete information, you may review the Fund’s next prospectus, which is expected to be available by August 1, 2026 at https://www.nuveen.com/en‑us/mutual‑funds/prospectuses or upon request at (800) 257‑8787.
For more complete information, you may review the Fund’s next prospectus, which is expected to be available by August 1, 2026 at https://www.nuveen.com/en‑us/mutual‑funds/prospectuses or upon request at (800) 257‑8787.
This report describes changes to the Fund that occurred during the reporting period.
What were the Fund costs for the last year? (based on a hypothetical $10,000 investment)
| Cost of a $10,000 investment |
Costs paid as a percentage of $10,000 investment* | |||
| Class A Shares |
$41 | 0.40% | ||
* Annualized for period less than one year.
How did the Fund perform last year? What affected the Fund’s performance?
| Performance Highlights • The Nuveen Bond Index Fund’s total return for Class A Shares at net asset value (NAV) was 3.98% for the 12 months ended March 31, 2026. The Fund’s index, the Bloomberg U.S. Aggregate Bond Index, returned 4.35%. • The difference between the Fund’s total return at NAV and that of the index is attributable to management fees and other expenses incurred by the Fund that are not incurred by the index. • The Fund had a risk profile similar to that of its benchmark. As such, there were no material contributors or detractors relative to the Fund’s benchmark during the period. |
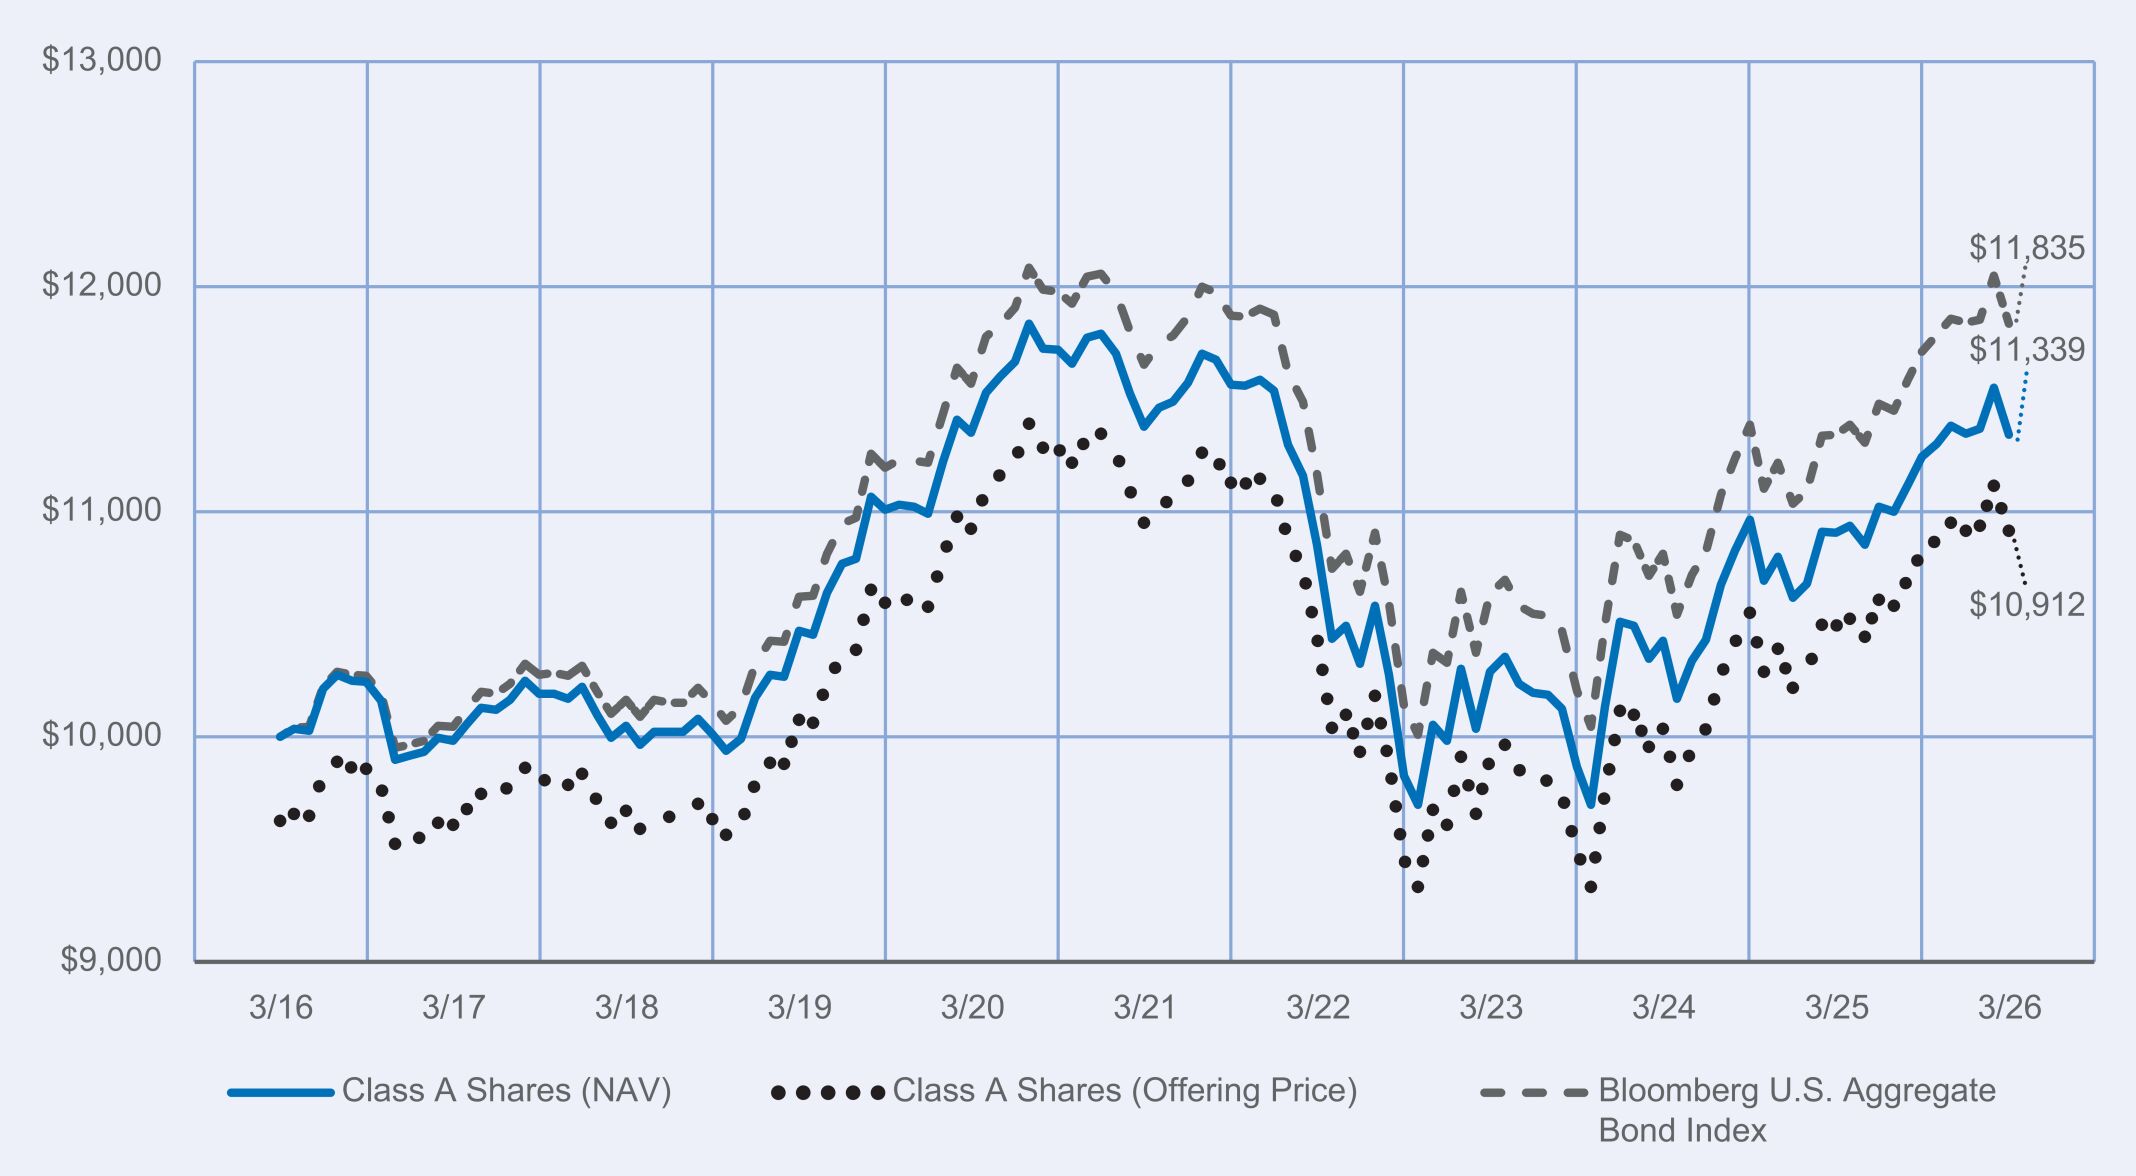
Average Annual Total Returns
| 1‑Year | 5‑Year | 10‑Year | ||||
| Class A Shares at NAV (excluding maximum sales charge) |
3.98% | (0.07)% | 1.26% | |||
| Class A at maximum sales charge (Offering Price) |
0.05% | (0.82)% | 0.88% | |||
| Bloomberg U.S. Aggregate Bond Index |
4.35% | 0.31% | 1.70% | |||
Fund Statistics (as of March 31, 2026)
| Fund net assets |
$21,161,202,913 | |||
| Total number of portfolio holdings |
8,530 | |||
| Portfolio turnover (%) |
28% | |||
| Total management fees paid for the year |
$ 14,535,016 | |||
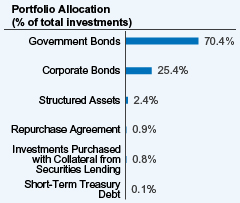
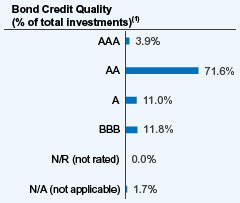
(1) Credit quality ratings are based on the Bloomberg Barclays methodology, which uses the median rating of those compiled by the Moody’s, Standard & Poor’s and Fitch ratings agencies. If ratings are available from only two of these agencies, the lower rating is used. When only one rating is available, that one is used. These ratings are subject to change without notice.
How has the Fund changed?
| • | Portfolio manager updates: Effective January 23, 2026, Joseph Spinelli was added as a portfolio manager of the Fund and Vivian Liu was removed as a portfolio manager of the Fund. |
For more complete information, you may review the Fund’s next prospectus, which is expected to be available by August 1, 2026 at https://www.nuveen.com/en‑us/mutual‑funds/prospectuses or upon request at (800) 257‑8787.
For more complete information, you may review the Fund’s next prospectus, which is expected to be available by August 1, 2026 at https://www.nuveen.com/en‑us/mutual‑funds/prospectuses or upon request at (800) 257‑8787.
This report describes changes to the Fund that occurred during the reporting period.
What were the Fund costs for the last year? (based on a hypothetical $10,000 investment)
| Cost of a $10,000 investment |
Costs paid as a percentage of $10,000 investment* | |||
| Class A Shares |
$69 | 0.67% | ||
* Annualized for period less than one year.
How did the Fund perform last year? What affected the Fund’s performance?
| Performance Highlights • The Nuveen Core Impact Bond Fund returned 4.63% for Class A Shares at net asset value (NAV) for the 12 months ended March 31, 2026. The Fund outperformed the Bloomberg U.S. Aggregate Bond Index, which returned 4.35%. • Top contributors to relative performance • An overweight to corporate bonds, including a small out‑of‑benchmark allocation to high-yield corporate bonds, out‑of‑benchmark exposure to non‑agency mortgage-backed securities, and a corresponding underweight to U.S. Treasuries. • Security selection within investment-grade corporate bonds and commercial mortgage-backed securities (CMBS). • An out‑of‑benchmark allocation to municipal bonds, as well as overweights to government credit securities, CMBS, and asset‑backed securities. • Top detractors from relative performance • Yield curve positioning. |
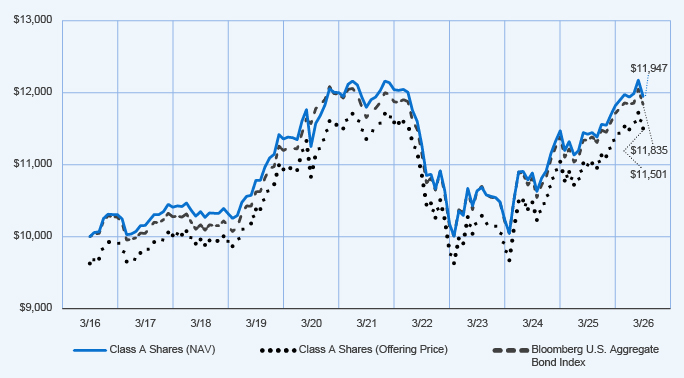
Average Annual Total Returns
| 1‑Year | 5‑Year | 10‑Year | ||||
| Class A Shares at NAV (excluding maximum sales charge) |
4.63% | 0.26% | 1.79% | |||
| Class A at maximum sales charge (Offering Price) |
0.70% | (0.51)% | 1.41% | |||
| Bloomberg U.S. Aggregate Bond Index |
4.35% | 0.31% | 1.70% | |||
Fund Statistics (as of March 31, 2026)
| Fund net assets |
$7,491,858,652 | |||
| Total number of portfolio holdings |
1,103 | |||
| Portfolio turnover (%) |
143% | |||
| Total management fees paid for the year |
$ 22,807,929 | |||
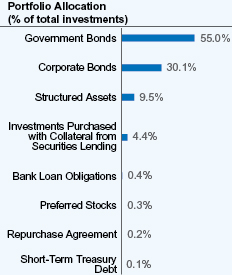
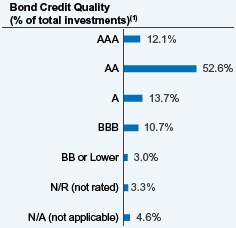
(1) Credit quality ratings are based on the Bloomberg Barclays methodology, which uses the median rating of those compiled by the Moody’s, Standard & Poor’s and Fitch ratings agencies. If ratings are available from only two of these agencies, the lower rating is used. When only one rating is available, that one is used. These ratings are subject to change without notice.
How has the Fund changed?
For more complete information, you may review the Fund’s next prospectus, which is expected to be available by August 1, 2026 at https://www.nuveen.com/en‑us/mutual‑funds/prospectuses or upon request at (800) 257‑8787.
For more complete information, you may review the Fund’s next prospectus, which is expected to be available by August 1, 2026 at https://www.nuveen.com/en‑us/mutual‑funds/prospectuses or upon request at (800) 257‑8787.
This report describes changes to the Fund that occurred during the reporting period.
What were the Fund costs for the last year? (based on a hypothetical $10,000 investment)
| Cost of a $10,000 investment |
Costs paid as a percentage of $10,000 investment* | |||
| Class I Shares |
$42 | 0.41% | ||
* Annualized for period less than one year.
How did the Fund perform last year? What affected the Fund’s performance?
| Performance Highlights • The Nuveen Core Impact Bond Fund returned 4.68% for Class I Shares at net asset value (NAV) for the 12 months ended March 31, 2026. The Fund outperformed the Bloomberg U.S. Aggregate Bond Index, which returned 4.35%. • Top contributors to relative performance • An overweight to corporate bonds, including a small out‑of‑benchmark allocation to high-yield corporate bonds, out‑of‑benchmark exposure to non‑agency mortgage-backed securities, and a corresponding underweight to U.S. Treasuries. • Security selection within investment-grade corporate bonds and commercial mortgage-backed securities (CMBS). • An out‑of‑benchmark allocation to municipal bonds, as well as overweights to government credit securities, CMBS, and asset-backed securities. • Top detractors from relative performance • Yield curve positioning. |
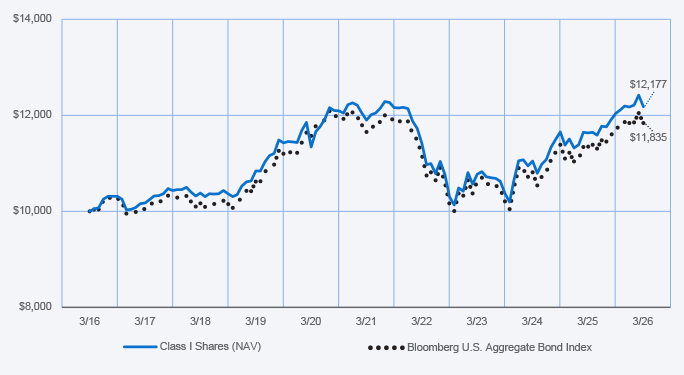
Average Annual Total Returns
| 1‑Year | 5‑Year | 10‑Year | ||||
| Class I Shares at NAV |
4.68% | 0.46% | 1.99% | |||
| Bloomberg U.S. Aggregate Bond Index |
4.35% | 0.31% | 1.70% | |||
Fund Statistics (as of March 31, 2026)
| Fund net assets |
$ | 7,491,858,652 | ||
| Total number of portfolio holdings |
1,103 | |||
| Portfolio turnover (%) |
143% | |||
| Total management fees paid for the year |
$ | 22,807,929 | ||
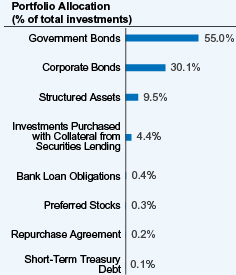
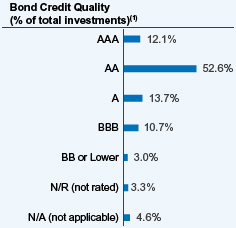
(1) Credit quality ratings are based on the Bloomberg Barclays methodology, which uses the median rating of those compiled by the Moody’s, Standard & Poor’s and Fitch ratings agencies. If ratings are available from only two of these agencies, the lower rating is used. When only one rating is available, that one is used. These ratings are subject to change without notice.
How has the Fund changed?
For more complete information, you may review the Fund’s next prospectus, which is expected to be available by August 1, 2026 at https://www.nuveen.com/en‑us/mutual‑funds/prospectuses or upon request at (800) 257‑8787.
For more complete information, you may review the Fund’s next prospectus, which is expected to be available by August 1, 2026 at https://www.nuveen.com/en‑us/mutual‑funds/prospectuses or upon request at (800) 257‑8787.
This report describes changes to the Fund that occurred during the reporting period.
What were the Fund costs for the last year? (based on a hypothetical $10,000 investment)
| Cost of a $10,000 investment |
Costs paid as a percentage of $10,000 investment* | |||
| Premier Class Shares |
$51 | 0.50% | ||
* Annualized for period less than one year.
How did the Fund perform last year? What affected the Fund’s performance?
| Performance Highlights • The Nuveen Core Impact Bond Fund returned 4.70% for Premier Class Shares at net asset value (NAV) for the 12 months ended March 31, 2026. The Fund outperformed the Bloomberg U.S. Aggregate Bond Index, which returned 4.35%. • Top contributors to relative performance • An overweight to corporate bonds, including a small out‑of‑benchmark allocation to high-yield corporate bonds, out‑of‑benchmark exposure to non‑agency mortgage-backed securities, and a corresponding underweight to U.S. Treasuries. • Security selection within investment-grade corporate bonds and commercial mortgage-backed securities (CMBS). • An out‑of‑benchmark allocation to municipal bonds, as well as overweights to government credit securities, CMBS, and asset-backed securities. • Top detractors from relative performance • Yield curve positioning. |
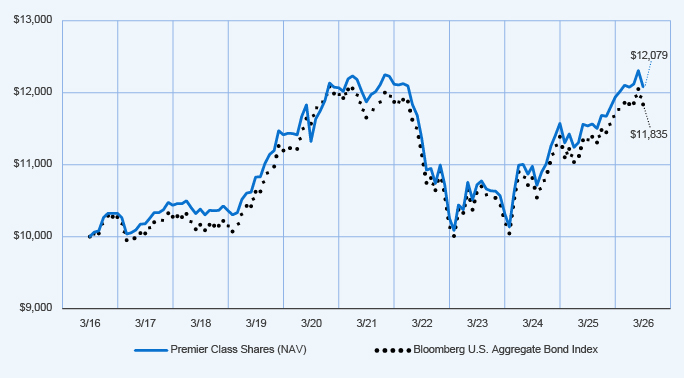
Average Annual Total Returns
| 1‑Year | 5‑Year | 10‑Year | ||||
| Premier Class Shares at NAV |
4.70% | 0.35% | 1.91% | |||
| Bloomberg U.S. Aggregate Bond Index |
4.35% | 0.31% | 1.70% | |||
Fund Statistics (as of March 31, 2026)
| Fund net assets |
$ | 7,491,858,652 | ||
| Total number of portfolio holdings |
1,103 | |||
| Portfolio turnover (%) |
143% | |||
| Total management fees paid for the year |
$ | 22,807,929 | ||
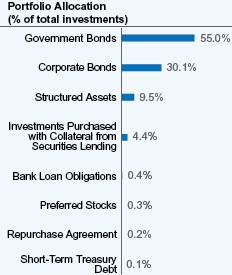
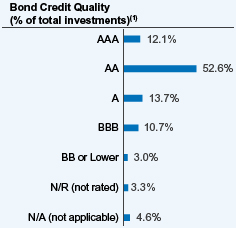
(1) Credit quality ratings are based on the Bloomberg Barclays methodology, which uses the median rating of those compiled by the Moody’s, Standard & Poor’s and Fitch ratings agencies. If ratings are available from only two of these agencies, the lower rating is used. When only one rating is available, that one is used. These ratings are subject to change without notice.
How has the Fund changed?
For more complete information, you may review the Fund’s next prospectus, which is expected to be available by August 1, 2026 at https://www.nuveen.com/en‑us/mutual‑funds/prospectuses or upon request at (800) 257‑8787.
For more complete information, you may review the Fund’s next prospectus, which is expected to be available by August 1, 2026 at https://www.nuveen.com/en‑us/mutual‑funds/prospectuses or upon request at (800) 257‑8787.
This report describes changes to the Fund that occurred during the reporting period.
What were the Fund costs for the last year? (based on a hypothetical $10,000 investment)
| Cost of a $10,000 investment |
Costs paid as a percentage of $10,000 investment* | |||
| Class R6 Shares |
$36 | 0.35% |
* Annualized for period less than one year.
How did the Fund perform last year? What affected the Fund’s performance?
| Performance Highlights • The Nuveen Core Impact Bond Fund returned 4.86% for Class R6 Shares at net asset value (NAV) for the 12 months ended March 31, 2026. The Fund outperformed the Bloomberg U.S. Aggregate Bond Index, which returned 4.35%. • Top contributors to relative performance • An overweight to corporate bonds, including a small out‑of‑benchmark allocation to high-yield corporate bonds, out‑of‑benchmark exposure to non‑agency mortgage-backed securities, and a corresponding underweight to U.S. Treasuries. • Security selection within investment-grade corporate bonds and commercial mortgage-backed securities (CMBS). • An out‑of‑benchmark allocation to municipal bonds, as well as overweights to government credit securities, CMBS, and asset-backed securities. • Top detractors from relative performance • Yield curve positioning. |
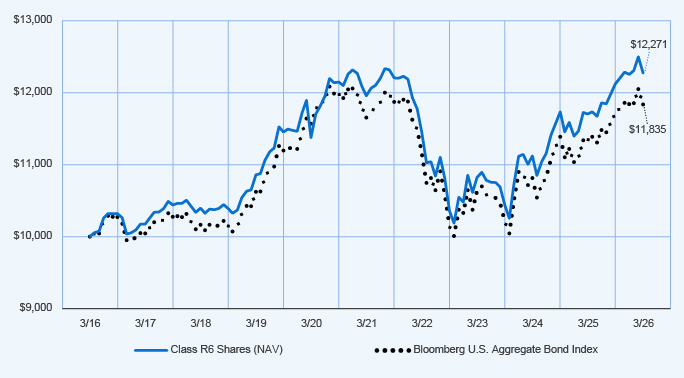
Average Annual Total Returns
| 1‑Year | 5‑Year | 10‑Year | ||||
| Class R6 Shares at NAV |
4.86% | 0.52% | 2.07% | |||
| Bloomberg U.S. Aggregate Bond Index |
4.35% | 0.31% | 1.70% | |||
Fund Statistics (as of March 31, 2026)
| Fund net assets |
$7,491,858,652 | |||
| Total number of portfolio holdings |
1,103 | |||
| Portfolio turnover (%) |
143% | |||
| Total management fees paid for the year |
$ 22,807,929 | |||
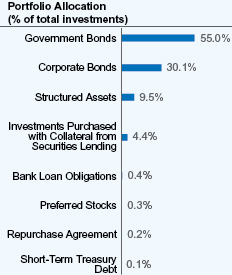
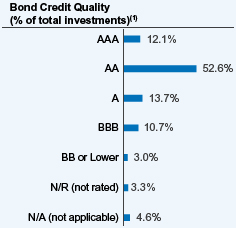
(1) Credit quality ratings are based on the Bloomberg Barclays methodology, which uses the median rating of those compiled by the Moody’s, Standard & Poor’s and Fitch ratings agencies. If ratings are available from only two of these agencies, the lower rating is used. When only one rating is available, that one is used. These ratings are subject to change without notice.
How has the Fund changed?
For more complete information, you may review the Fund’s next prospectus, which is expected to be available by August 1, 2026 at https://www.nuveen.com/en-us/mutual-funds/prospectuses or upon request at (800) 257‑8787.
For more complete information, you may review the Fund’s next prospectus, which is expected to be available by August 1, 2026 at https://www.nuveen.com/en-us/mutual-funds/prospectuses or upon request at (800) 257‑8787.
This report describes changes to the Fund that occurred during the reporting period.
What were the Fund costs for the last year? (based on a hypothetical $10,000 investment)
| Cost of a $10,000 investment |
Costs paid as a percentage of $10,000 investment* | |||
| Retirement Class Shares |
$61 | 0.60% | ||
* Annualized for period less than one year.
How did the Fund perform last year? What affected the Fund’s performance?
| Performance Highlights • The Nuveen Core Impact Bond Fund returned 4.60% for Retirement Class Shares at net asset value (NAV) for the 12 months ended March 31, 2026. The Fund performed in line with the Bloomberg U.S. Aggregate Bond Index, which returned 4.35%. • Top contributors to relative performance • An overweight to corporate bonds, including a small out‑of‑benchmark allocation to high-yield corporate bonds, out‑of‑benchmark exposure to non‑agency mortgage-backed securities, and a corresponding underweight to U.S. Treasuries. • Security selection within investment-grade corporate bonds and commercial mortgage-backed securities (CMBS). • An out‑of‑benchmark allocation to municipal bonds, as well as overweights to government credit securities, CMBS, and asset-backed securities. • Top detractors from relative performance • Yield curve positioning. |
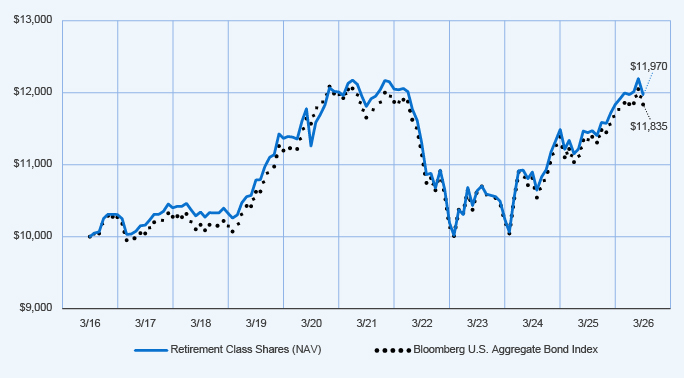
Average Annual Total Returns
| 1‑Year | 5‑Year | 10‑Year | ||||
| Retirement Class Shares at NAV |
4.60% | 0.27% | 1.81% | |||
| Bloomberg U.S. Aggregate Bond Index |
4.35% | 0.31% | 1.70% | |||
Fund Statistics (as of March 31, 2026)
| Fund net assets |
$7,491,858,652 | |||
| Total number of portfolio holdings |
1,103 | |||
| Portfolio turnover (%) |
143% | |||
| Total management fees paid for the year |
$ 22,807,929 | |||
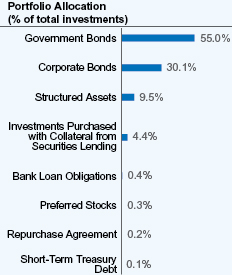
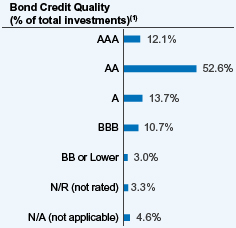
(1) Credit quality ratings are based on the Bloomberg Barclays methodology, which uses the median rating of those compiled by the Moody’s, Standard & Poor’s and Fitch ratings agencies. If ratings are available from only two of these agencies, the lower rating is used. When only one rating is available, that one is used. These ratings are subject to change without notice.
How has the Fund changed?
For more complete information, you may review the Fund’s next prospectus, which is expected to be available by August 1, 2026 at https://www.nuveen.com/en‑us/mutual‑funds/prospectuses or upon request at (800) 257‑8787.
For more complete information, you may review the Fund’s next prospectus, which is expected to be available by August 1, 2026 at https://www.nuveen.com/en‑us/mutual‑funds/prospectuses or upon request at (800) 257‑8787.
This report describes changes to the Fund that occurred during the reporting period.
What were the Fund costs for the last year? (based on a hypothetical $10,000 investment)
| Cost of a $10,000 investment |
Costs paid as a percentage of $10,000 investment* | |||
| Class W Shares |
$0 | 0.00% | ||
* Annualized for period less than one year.
How did the Fund perform last year? What affected the Fund’s performance?
| Performance Highlights • The Nuveen Short Term Bond Index Fund’s total return for Class W Shares at net asset value (NAV) was 3.96% for the 12 months ended March 31, 2026. The Fund’s index, the Bloomberg U.S. 1‑3 Year Government/Credit Bond Index, returned 3.96%. • Despite the effect of certain expenses incurred by the Fund that are not incurred by the benchmark index, the Fund’s return at NAV matched that of the index. • The Fund had a risk profile similar to that of its benchmark. As such, there were no material contributors or detractors relative to the Fund’s benchmark during the period. |
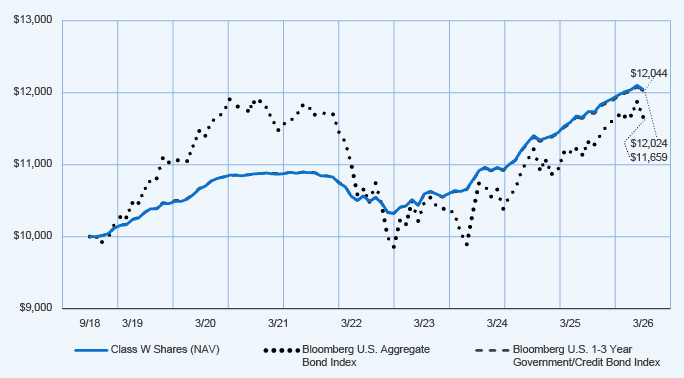
Average Annual Total Returns
| 1‑Year | 5‑Year | Since Inception (9/28/18) | ||||
| Class W Shares at NAV |
3.96% | 2.08% | 2.51% | |||
| Bloomberg U.S. Aggregate Bond Index |
4.35% | 0.31% | 2.07% | |||
| Bloomberg U.S. 1‑3 Year Government/Credit Bond Index |
3.96% | 2.04% | 2.49% | |||
Fund Statistics (as of March 31, 2026)
| Fund net assets |
$2,448,172,264 | |||
| Total number of portfolio holdings |
995 | |||
| Portfolio turnover (%) |
63% | |||
| Total management fees paid for the year |
$ 1,236,379 | |||
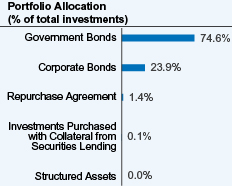
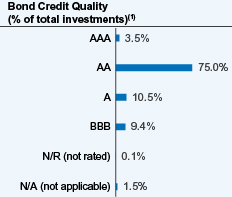
(1) Credit quality ratings are based on the Bloomberg Barclays methodology, which uses the median rating of those compiled by the Moody’s, Standard & Poor’s and Fitch ratings agencies. If ratings are available from only two of these agencies, the lower rating is used. When only one rating is available, that one is used. These ratings are subject to change without notice.
How has the Fund changed?
| • | Portfolio manager updates: Effective January 23, 2026, Joseph Spinelli was added as a portfolio manager of the Fund and Vivian Liu was removed as a portfolio manager of the Fund. |
For more complete information, you may review the Fund’s next prospectus, which is expected to be available by August 1, 2026 at https://www.nuveen.com/en‑us/mutual‑funds/prospectuses or upon request at (800) 257‑8787.
For more complete information, you may review the Fund’s next prospectus, which is expected to be available by August 1, 2026 at https://www.nuveen.com/en‑us/mutual‑funds/prospectuses or upon request at (800) 257‑8787.
This report describes changes to the Fund that occurred during the reporting period.
What were the Fund costs for the last year? (based on a hypothetical $10,000 investment)
| Cost of a $10,000 investment |
Costs paid as a percentage of $10,000 investment* | |||
| Retirement Class Shares |
$33 | 0.32% | ||
* Annualized for period less than one year.
How did the Fund perform last year? What affected the Fund’s performance?
| Performance Highlights • The Nuveen Short Term Bond Index Fund’s total return for Retirement Class Shares at net asset value (NAV) was 3.64% for the 12 months ended March 31, 2026. The Fund’s index, the Bloomberg U.S. 1‑3 Year Government/Credit Bond Index, returned 3.96%. • The difference between the Fund’s total return at NAV and that of the index is attributable to management fees and other expenses incurred by the Fund that are not incurred by the index. • The Fund had a risk profile similar to that of its benchmark. As such, there were no material contributors or detractors relative to the Fund’s benchmark during the period. |
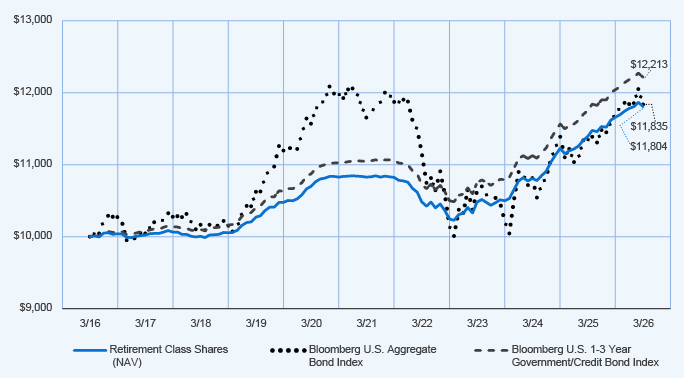
Average Annual Total Returns
| 1‑Year | 5‑Year | 10‑Year |
||||||||||
| Retirement Class Shares at NAV |
3.64 | % | 1.75 | % | 1.67 | % | ||||||
| Bloomberg U.S. Aggregate Bond Index |
4.35 | % | 0.31 | % | 1.70 | % | ||||||
| Bloomberg U.S. 1‑3 Year Government/Credit Bond Index |
3.96 | % | 2.04 | % | 2.02 | % | ||||||
Fund Statistics (as of March 31, 2026)
| Fund net assets |
$ | 2,448,172,264 | ||
| Total number of portfolio holdings |
995 | |||
| Portfolio turnover (%) |
63% | |||
| Total management fees paid for the year |
$ | 1,236,379 | ||
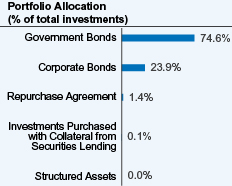
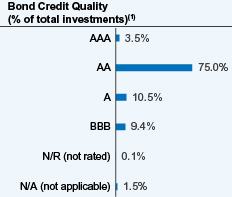
(1) Credit quality ratings are based on the Bloomberg Barclays methodology, which uses the median rating of those compiled by the Moody’s, Standard & Poor’s and Fitch ratings agencies. If ratings are available from only two of these agencies, the lower rating is used. When only one rating is available, that one is used. These ratings are subject to change without notice.
How has the Fund changed?
| • | Portfolio manager updates: Effective January 23, 2026, Joseph Spinelli was added as a portfolio manager of the Fund and Vivian Liu was removed as a portfolio manager of the Fund. |
For more complete information, you may review the Fund’s next prospectus, which is expected to be available by August 1, 2026 at https://www.nuveen.com/en‑us/mutual‑funds/prospectuses or upon request at (800) 257‑8787.
For more complete information, you may review the Fund’s next prospectus, which is expected to be available by August 1, 2026 at https://www.nuveen.com/en‑us/mutual‑funds/prospectuses or upon request at (800) 257‑8787.
This report describes changes to the Fund that occurred during the reporting period.
What were the Fund costs for the last year? (based on a hypothetical $10,000 investment)
| Cost of a $10,000 investment |
Costs paid as a percentage of $10,000 investment* | |||
| Class R6 Shares |
$7 | 0.07% | ||
* Annualized for period less than one year.
How did the Fund perform last year? What affected the Fund’s performance?
| Performance Highlights • The Nuveen Short Term Bond Index Fund’s total return for Class R6 Shares at net asset value (NAV) was 3.89% for the 12 months ended March 31, 2026. The Fund’s index, the Bloomberg U.S. 1‑3 Year Government/Credit Bond Index, returned 3.96%. • The difference between the Fund’s total return at NAV and that of the index is attributable to management fees and other expenses incurred by the Fund that are not incurred by the index. • The Fund had a risk profile similar to that of its benchmark. As such, there were no material contributors or detractors relative to the Fund’s benchmark during the period. |
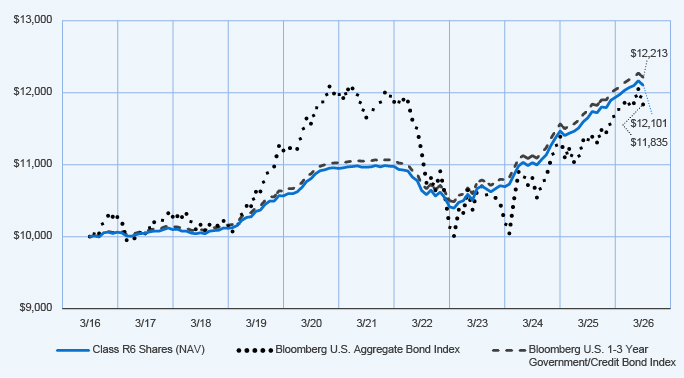
Average Annual Total Returns
| 1‑Year | 5‑Year | 10‑Year | ||||
| Class R6 Shares at NAV |
3.89% | 2.00% | 1.93% | |||
| Bloomberg U.S. Aggregate Bond Index |
4.35% | 0.31% | 1.70% | |||
| Bloomberg U.S. 1‑3 Year Government/Credit Bond Index |
3.96% | 2.04% | 2.02% | |||
Fund Statistics (as of March 31, 2026)
| Fund net assets |
$2,448,172,264 | |||
| Total number of portfolio holdings |
995 | |||
| Portfolio turnover (%) |
63% | |||
| Total management fees paid for the year |
$ 1,236,379 | |||
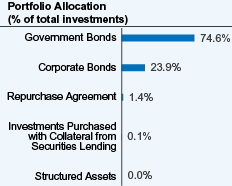
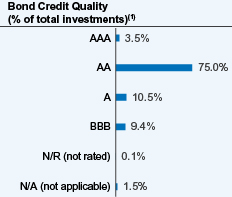
(1) Credit quality ratings are based on the Bloomberg Barclays methodology, which uses the median rating of those compiled by the Moody’s, Standard & Poor’s and Fitch ratings agencies. If ratings are available from only two of these agencies, the lower rating is used. When only one rating is available, that one is used. These ratings are subject to change without notice.
How has the Fund changed?
| • | Portfolio manager updates: Effective January 23, 2026, Joseph Spinelli was added as a portfolio manager of the Fund and Vivian Liu was removed as a portfolio manager of the Fund. |
For more complete information, you may review the Fund’s next prospectus, which is expected to be available by August 1, 2026 at https://www.nuveen.com/en‑us/mutual‑funds/prospectuses or upon request at (800) 257‑8787.
For more complete information, you may review the Fund’s next prospectus, which is expected to be available by August 1, 2026 at https://www.nuveen.com/en‑us/mutual‑funds/prospectuses or upon request at (800) 257‑8787.
This report describes changes to the Fund that occurred during the reporting period.
What were the Fund costs for the last year? (based on a hypothetical $10,000 investment)
| Cost of a $10,000 investment |
Costs paid as a percentage of $10,000 investment* | |||
| Premier Class Shares |
$24 | 0.24% | ||
* Annualized for period less than one year.
How did the Fund perform last year? What affected the Fund’s performance?
| Performance Highlights • The Nuveen Short Term Bond Index Fund’s total return for Premier Class Shares at net asset value (NAV) was 3.72% for the 12 months ended March 31, 2026. The Fund’s index, the Bloomberg U.S. 1-3 Year Government/Credit Bond Index, returned 3.96%. • The difference between the Fund’s total return at NAV and that of the index is attributable to management fees and other expenses incurred by the Fund that are not incurred by the index. • The Fund had a risk profile similar to that of its benchmark. As such, there were no material contributors or detractors relative to the Fund’s benchmark during the period. |
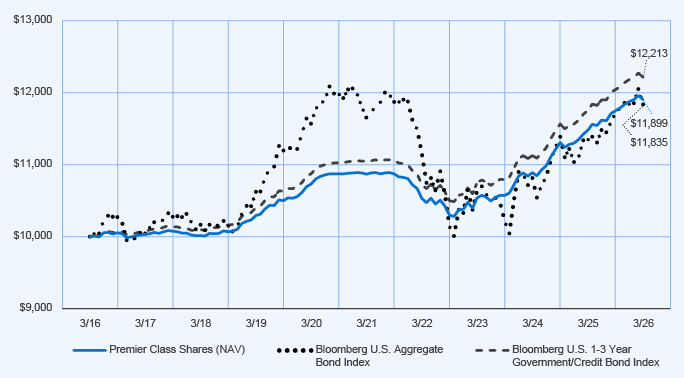
Average Annual Total Returns
| 1‑Year | 5‑Year | 10‑Year | ||||
| Premier Class Shares at NAV |
3.72% | 1.83% | 1.75% | |||
| Bloomberg U.S. Aggregate Bond Index |
4.35% | 0.31% | 1.70% | |||
| Bloomberg U.S. 1‑3 Year Government/Credit Bond Index |
3.96% | 2.04% | 2.02% | |||
Fund Statistics (as of March 31, 2026)
| Fund net assets |
$2,448,172,264 | |||
| Total number of portfolio holdings |
995 | |||
| Portfolio turnover (%) |
63% | |||
| Total management fees paid for the year |
$ 1,236,379 | |||
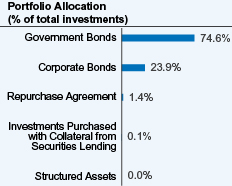
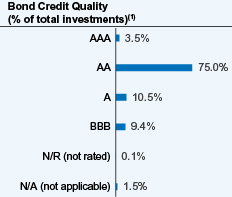
(1) Credit quality ratings are based on the Bloomberg Barclays methodology, which uses the median rating of those compiled by the Moody’s, Standard & Poor’s and Fitch ratings agencies. If ratings are available from only two of these agencies, the lower rating is used. When only one rating is available, that one is used. These ratings are subject to change without notice.
How has the Fund changed?
| • | Portfolio manager updates: Effective January 23, 2026, Joseph Spinelli was added as a portfolio manager of the Fund and Vivian Liu was removed as a portfolio manager of the Fund. |
For more complete information, you may review the Fund’s next prospectus, which is expected to be available by August 1, 2026 at https://www.nuveen.com/en‑us/mutual‑funds/prospectuses or upon request at (800) 257‑8787.
For more complete information, you may review the Fund’s next prospectus, which is expected to be available by August 1, 2026 at https://www.nuveen.com/en‑us/mutual‑funds/prospectuses or upon request at (800) 257‑8787.
This report describes changes to the Fund that occurred during the reporting period.
What were the Fund costs for the last year? (based on a hypothetical $10,000 investment)
| Cost of a $10,000 investment |
Costs paid as a percentage of $10,000 investment* | |||
| Class I Shares |
$19 | 0.19% | ||
* Annualized for period less than one year.
How did the Fund perform last year? What affected the Fund’s performance?
| Performance Highlights • The Nuveen Short Term Bond Index Fund’s total return for Class I Shares at net asset value (NAV) was 3.87% for the 12 months ended March 31, 2026. The Fund’s index, the Bloomberg U.S. 1‑3 Year Government/Credit Bond Index, returned 3.96%. • The difference between the Fund’s total return at NAV and that of the index is attributable to management fees and other expenses incurred by the Fund that are not incurred by the index. • The Fund had a risk profile similar to that of its benchmark. As such, there were no material contributors or detractors relative to the Fund’s benchmark during the period. |
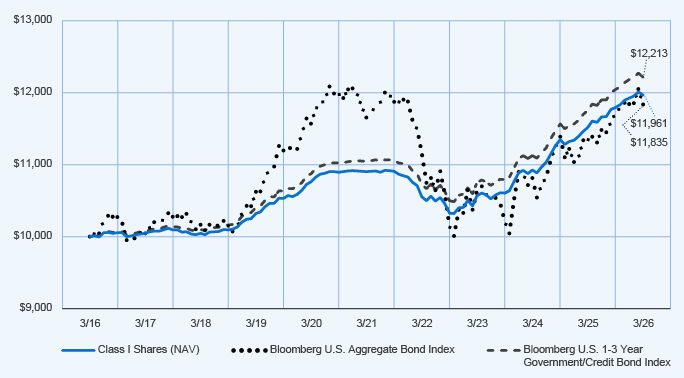
Average Annual Total Returns
| 1‑Year | 5‑Year | 10‑Year | ||||
| Class I Shares at NAV |
3.87% | 1.87% | 1.81% | |||
| Bloomberg U.S. Aggregate Bond Index |
4.35% | 0.31% | 1.70% | |||
| Bloomberg U.S. 1‑3 Year Government/Credit Bond Index |
3.96% | 2.04% | 2.02% | |||
Fund Statistics (as of March 31, 2026)
| Fund net assets |
$ | 2,448,172,264 | ||
| Total number of portfolio holdings |
995 | |||
| Portfolio turnover (%) |
63% | |||
| Total management fees paid for the year |
$ | 1,236,379 | ||
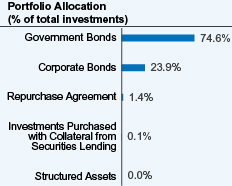
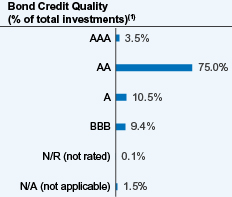
(1) Credit quality ratings are based on the Bloomberg Barclays methodology, which uses the median rating of those compiled by the Moody’s, Standard & Poor’s and Fitch ratings agencies. If ratings are available from only two of these agencies, the lower rating is used. When only one rating is available, that one is used. These ratings are subject to change without notice.
How has the Fund changed?
| • | Portfolio manager updates: Effective January 23, 2026, Joseph Spinelli was added as a portfolio manager of the Fund and Vivian Liu was removed as a portfolio manager of the Fund. |
For more complete information, you may review the Fund’s next prospectus, which is expected to be available by August 1, 2026 at https://www.nuveen.com/en‑us/mutual‑funds/prospectuses or upon request at (800) 257‑8787.
For more complete information, you may review the Fund’s next prospectus, which is expected to be available by August 1, 2026 at https://www.nuveen.com/en‑us/mutual‑funds/prospectuses or upon request at (800) 257‑8787.
This report describes changes to the Fund that occurred during the reporting period.
What were the Fund costs for the last year? (based on a hypothetical $10,000 investment)
| Cost of a $10,000 investment |
Costs paid as a percentage of $10,000 investment* | |||
| Class A Shares |
$40 | 0.39% | ||
* Annualized for period less than one year.
How did the Fund perform last year? What affected the Fund’s performance?
| Performance Highlights • The Nuveen Short Term Bond Index Fund’s total return for Class A Shares at net asset value (NAV) was 3.67% for the 12 months ended March 31, 2026. The Fund’s index, the Bloomberg U.S. 1‑3 Year Government/Credit Bond Index, returned 3.96%. • The difference between the Fund’s total return at NAV and that of the index is attributable to management fees and other expenses incurred by the Fund that are not incurred by the index. • The Fund had a risk profile similar to that of its benchmark. As such, there were no material contributors or detractors relative to the Fund’s benchmark during the period. |
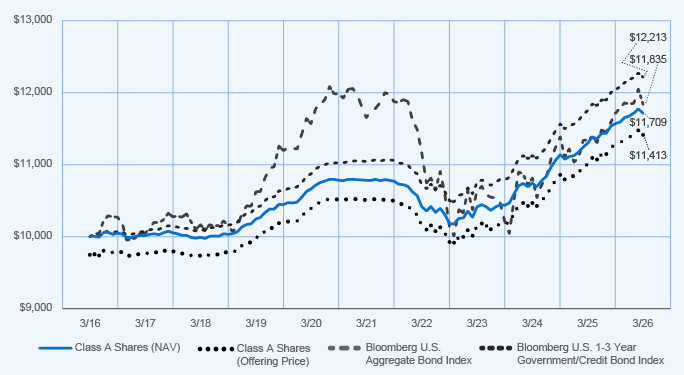
Average Annual Total Returns
| 1‑Year | 5‑Year | 10‑Year | ||||
| Class A Shares at NAV (excluding maximum sales charge) |
3.67% | 1.67% | 1.59% | |||
| Class A at maximum sales charge (Offering Price) |
1.05% | 1.15% | 1.33% | |||
| Bloomberg U.S. Aggregate Bond Index |
4.35% | 0.31% | 1.70% | |||
| Bloomberg U.S. 1‑3 Year Government/Credit Bond Index |
3.96% | 2.04% | 2.02% | |||
Fund Statistics (as of March 31, 2026)
| Fund net assets |
$2,448,172,264 | |||
| Total number of portfolio holdings |
995 | |||
| Portfolio turnover (%) |
63% | |||
| Total management fees paid for the year |
$ 1,236,379 | |||
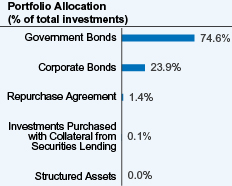
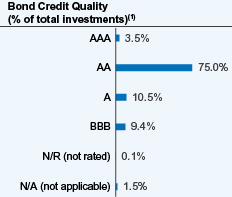
(1) Credit quality ratings are based on the Bloomberg Barclays methodology, which uses the median rating of those compiled by the Moody’s, Standard & Poor’s and Fitch ratings agencies. If ratings are available from only two of these agencies, the lower rating is used. When only one rating is available, that one is used. These ratings are subject to change without notice.
How has the Fund changed?
| • | Portfolio manager updates: Effective January 23, 2026, Joseph Spinelli was added as a portfolio manager of the Fund and Vivian Liu was removed as a portfolio manager of the Fund. |
For more complete information, you may review the Fund’s next prospectus, which is expected to be available by August 1, 2026 at https://www.nuveen.com/en‑us/mutual‑funds/prospectuses or upon request at (800) 257‑8787.
For more complete information, you may review the Fund’s next prospectus, which is expected to be available by August 1, 2026 at https://www.nuveen.com/en‑us/mutual‑funds/prospectuses or upon request at (800) 257‑8787.
This report describes changes to the Fund that occurred during the reporting period.
What were the Fund costs for the last year? (based on a hypothetical $10,000 investment)
| Cost of a $10,000 investment |
Costs paid as a percentage of $10,000 investment* | |||
| Class A Shares |
$78 | 0.76% | ||
* Annualized for period less than one year.
How did the Fund perform last year? What affected the Fund’s performance?
| Performance Highlights • The Nuveen Green Bond Fund returned 4.14% for Class A Shares at net asset value (NAV) for the 12 months ended March 31, 2026. The Fund underperformed the Bloomberg MSCI U.S. Green Bond Index, which returned 4.66%. • Top contributors to relative performance • An out‑of‑benchmark allocation to high-yield corporate bonds. • Security selection and an overweight to commercial mortgage-backed securities. • Out‑of‑benchmark exposure to municipal bonds and asset-backed securities. • Top detractors from relative performance • Exposure to government-agency and -credit securities, particularly emerging-markets debt. • Yield curve positioning. |
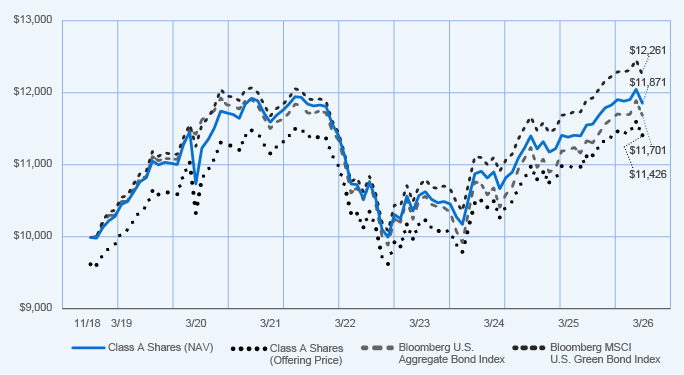
Average Annual Total Returns
| 1‑Year | 5‑Year | Since Inception (11/16/18) | ||||
| Class A Shares at NAV (excluding maximum sales charge) |
4.14% | 0.45% | 2.35% | |||
| Class A at maximum sales charge (Offering Price) |
0.29% | (0.31)% | 1.83% | |||
| Bloomberg U.S. Aggregate Bond Index |
4.35% | 0.31% | 2.15% | |||
| Bloomberg MSCI U.S. Green Bond Index |
4.66% | 0.95% | 2.80% | |||
Fund Statistics (as of March 31, 2026)
| Fund net assets |
$184,532,910 | |||
| Total number of portfolio holdings |
254 | |||
| Portfolio turnover (%) |
31% | |||
| Total management fees paid for the year |
$ 721,762 | |||
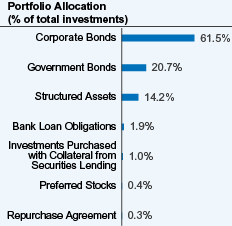
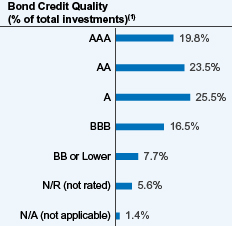
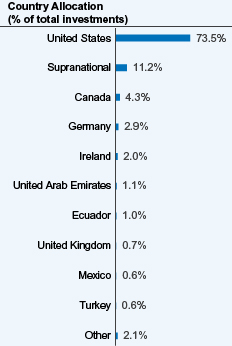
(1) Credit quality ratings are based on the Bloomberg Barclays methodology, which uses the median rating of those compiled by the Moody’s, Standard & Poor’s and Fitch ratings agencies. If ratings are available from only two of these agencies, the lower rating is used. When only one rating is available, that one is used. These ratings are subject to change without notice.
How has the Fund changed?
For more complete information, you may review the Fund’s next prospectus, which is expected to be available by August 1, 2026 at https://www.nuveen.com/en‑us/mutual‑funds/prospectuses or upon request at (800) 257‑8787.
For more complete information, you may review the Fund’s next prospectus, which is expected to be available by August 1, 2026 at https://www.nuveen.com/en‑us/mutual‑funds/prospectuses or upon request at (800) 257‑8787.
This report describes changes to the Fund that occurred during the reporting period.
What were the Fund costs for the last year? (based on a hypothetical $10,000 investment)
| Cost of a $10,000 investment |
Costs paid as a percentage of $10,000 investment* | |||
| Class I Shares |
$52 | 0.51% | ||
* Annualized for period less than one year.
How did the Fund perform last year? What affected the Fund’s performance?
| Performance Highlights • The Nuveen Green Bond Fund returned 4.40% for Class I Shares at net asset value (NAV) for the 12 months ended March 31, 2026. The Fund underperformed the Bloomberg MSCI U.S. Green Bond Index, which returned 4.66%. • Top contributors to relative performance • An out‑of‑benchmark allocation to high-yield corporate bonds. • Security selection and an overweight to commercial mortgage-backed securities. • Out‑of‑benchmark exposure to municipal bonds and asset-backed securities. • Top detractors from relative performance • Exposure to government-agency and -credit securities, particularly emerging-markets debt. • Yield curve positioning. |
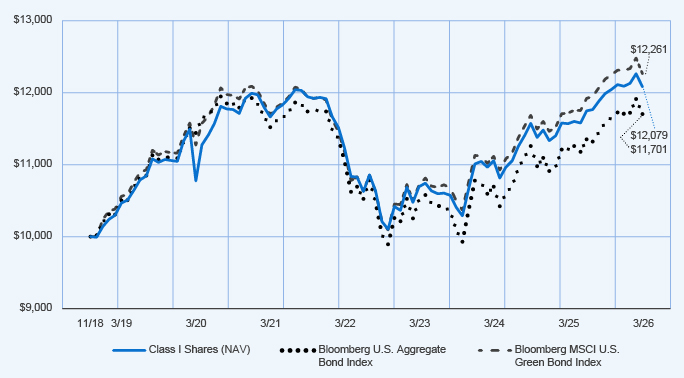
Average Annual Total Returns
| 1‑Year | 5‑Year | Since Inception (11/16/18) | ||||
| Class I Shares at NAV |
4.40% | 0.70% | 2.60% | |||
| Bloomberg U.S. Aggregate Bond Index |
4.35% | 0.31% | 2.15% | |||
| Bloomberg MSCI U.S. Green Bond Index |
4.66% | 0.95% | 2.80% | |||
Fund Statistics (as of March 31, 2026)
| Fund net assets |
$184,532,910 | |||
| Total number of portfolio holdings |
254 | |||
| Portfolio turnover (%) |
31% | |||
| Total management fees paid for the year |
$ 721,762 | |||
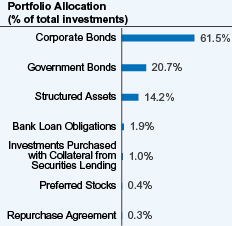
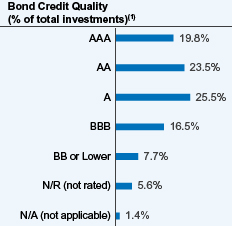
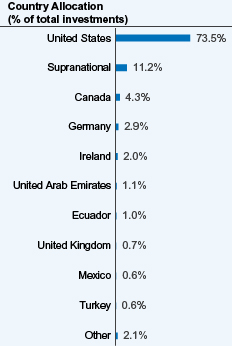
(1) Credit quality ratings are based on the Bloomberg Barclays methodology, which uses the median rating of those compiled by the Moody’s, Standard & Poor’s and Fitch ratings agencies. If ratings are available from only two of these agencies, the lower rating is used. When only one rating is available, that one is used. These ratings are subject to change without notice.
How has the Fund changed?
For more complete information, you may review the Fund’s next prospectus, which is expected to be available by August 1, 2026 at https://www.nuveen.com/en‑us/mutual‑funds/prospectuses or upon request at (800) 257‑8787.
For more complete information, you may review the Fund’s next prospectus, which is expected to be available by August 1, 2026 at https://www.nuveen.com/en‑us/mutual‑funds/prospectuses or upon request at (800) 257‑8787.
This report describes changes to the Fund that occurred during the reporting period.
What were the Fund costs for the last year? (based on a hypothetical $10,000 investment)
| Cost of a $10,000 investment |
Costs paid as a percentage of $10,000 investment* | |||
| Premier Class Shares |
$58 | 0.57% | ||
* Annualized for period less than one year.
How did the Fund perform last year? What affected the Fund’s performance?
| Performance Highlights • The Nuveen Green Bond Fund returned 4.33% for Premier Class Shares at net asset value (NAV) for the 12 months ended March 31, 2026. The Fund underperformed the Bloomberg MSCI U.S. Green Bond Index, which returned 4.66%. • Top contributors to relative performance • An out‑of‑benchmark allocation to high-yield corporate bonds. • Security selection and an overweight to commercial mortgage-backed securities. • Out‑of‑benchmark exposure to municipal bonds and asset-backed securities. • Top detractors from relative performance • Exposure to government-agency and -credit securities, particularly emerging-markets debt. • Yield curve positioning. |
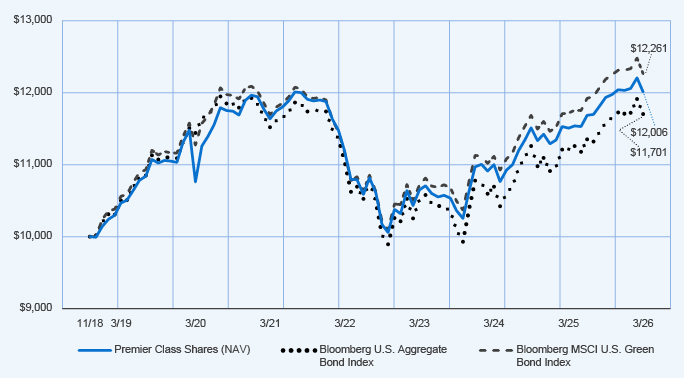
Average Annual Total Returns
| 1‑Year | 5‑Year | Since Inception (11/16/18) | ||||
| Premier Class Shares at NAV |
4.33% | 0.63% | 2.51% | |||
| Bloomberg U.S. Aggregate Bond Index |
4.35% | 0.31% | 2.15% | |||
| Bloomberg MSCI U.S. Green Bond Index |
4.66% | 0.95% | 2.80% | |||
Fund Statistics (as of March 31, 2026)
| Fund net assets |
$184,532,910 | |||
| Total number of portfolio holdings |
254 | |||
| Portfolio turnover (%) |
31% | |||
| Total management fees paid for the year |
$ 721,762 | |||
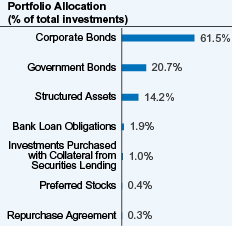
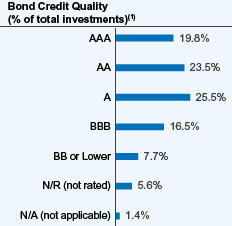
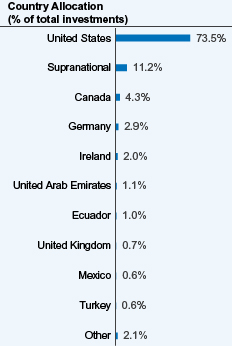
(1) Credit quality ratings are based on the Bloomberg Barclays methodology, which uses the median rating of those compiled by the Moody’s, Standard & Poor’s and Fitch ratings agencies. If ratings are available from only two of these agencies, the lower rating is used. When only one rating is available, that one is used. These ratings are subject to change without notice.
How has the Fund changed?
For more complete information, you may review the Fund’s next prospectus, which is expected to be available by August 1, 2026 at https://www.nuveen.com/en‑us/mutual‑funds/prospectuses or upon request at (800) 257‑8787.
For more complete information, you may review the Fund’s next prospectus, which is expected to be available by August 1, 2026 at https://www.nuveen.com/en‑us/mutual‑funds/prospectuses or upon request at (800) 257‑8787.
This report describes changes to the Fund that occurred during the reporting period.
What were the Fund costs for the last year? (based on a hypothetical $10,000 investment)
| Cost of a $10,000 investment |
Costs paid as a percentage of $10,000 investment* | |||
| Class R6 Shares |
$43 | 0.42% | ||
* Annualized for period less than one year.
How did the Fund perform last year? What affected the Fund’s performance?
| Performance Highlights • The Nuveen Green Bond Fund returned 4.49% for Class R6 Shares at net asset value (NAV) for the 12 months ended March 31, 2026. The Fund performed in line with the Bloomberg MSCI U.S. Green Bond Index, which returned 4.66%. • Top contributors to relative performance • An out‑of‑benchmark allocation to high-yield corporate bonds. • Security selection and an overweight to commercial mortgage-backed securities. • Out‑of‑benchmark exposure to municipal bonds and asset-backed securities. • Top detractors from relative performance • Exposure to government-agency and -credit securities, particularly emerging-markets debt. • Yield curve positioning. |
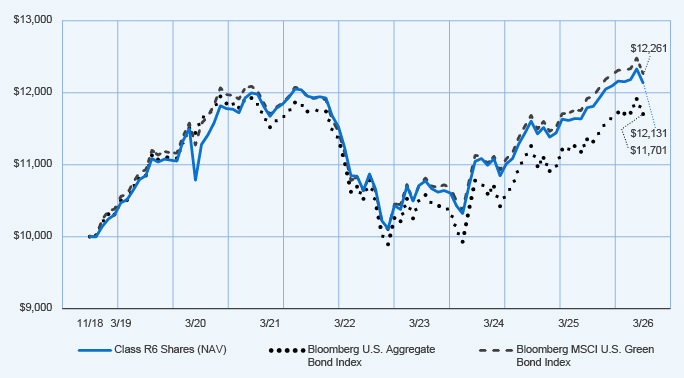
Average Annual Total Returns
| 1‑Year | 5‑Year | Since Inception (11/16/18) | ||||
| Class R6 Shares at NAV |
4.49% | 0.78% | 2.66% | |||
| Bloomberg U.S. Aggregate Bond Index |
4.35% | 0.31% | 2.15% | |||
| Bloomberg MSCI U.S. Green Bond Index |
4.66% | 0.95% | 2.80% | |||
Fund Statistics (as of March 31, 2026)
| Fund net assets |
$ | 184,532,910 | ||
| Total number of portfolio holdings |
254 | |||
| Portfolio turnover (%) |
31% | |||
| Total management fees paid for the year |
$ | 721,762 | ||
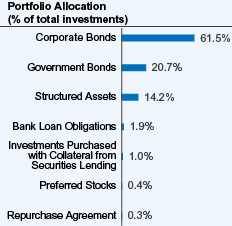
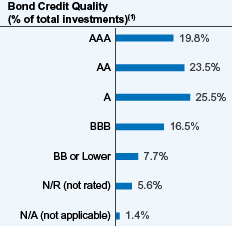
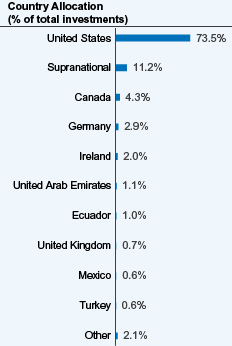
(1) Credit quality ratings are based on the Bloomberg Barclays methodology, which uses the median rating of those compiled by the Moody’s, Standard & Poor’s and Fitch ratings agencies. If ratings are available from only two of these agencies, the lower rating is used. When only one rating is available, that one is used. These ratings are subject to change without notice.
How has the Fund changed?
For more complete information, you may review the Fund’s next prospectus, which is expected to be available by August 1, 2026 at https://www.nuveen.com/en‑us/mutual‑funds/prospectuses or upon request at (800) 257‑8787.
For more complete information, you may review the Fund’s next prospectus, which is expected to be available by August 1, 2026 at https://www.nuveen.com/en‑us/mutual‑funds/prospectuses or upon request at (800) 257‑8787.
This report describes changes to the Fund that occurred during the reporting period.
What were the Fund costs for the last year? (based on a hypothetical $10,000 investment)
| Cost of a $10,000 investment |
Costs paid as a percentage of $10,000 investment* | |||
| Retirement Class Shares |
$68 | 0.67% | ||
* Annualized for period less than one year.
How did the Fund perform last year? What affected the Fund’s performance?
| Performance Highlights • The Nuveen Green Bond Fund returned 4.23% for Retirement Class Shares at net asset value (NAV) for the 12 months ended March 31, 2026. The Fund underperformed the Bloomberg MSCI U.S. Green Bond Index, which returned 4.66%. • Top contributors to relative performance • An out‑of‑benchmark allocation to high-yield corporate bonds. • Security selection and an overweight to commercial mortgage-backed securities. • Out‑of‑benchmark exposure to municipal bonds and asset-backed securities. • Top detractors from relative performance • Exposure to government-agency and -credit securities, particularly emerging-markets debt. • Yield curve positioning. |
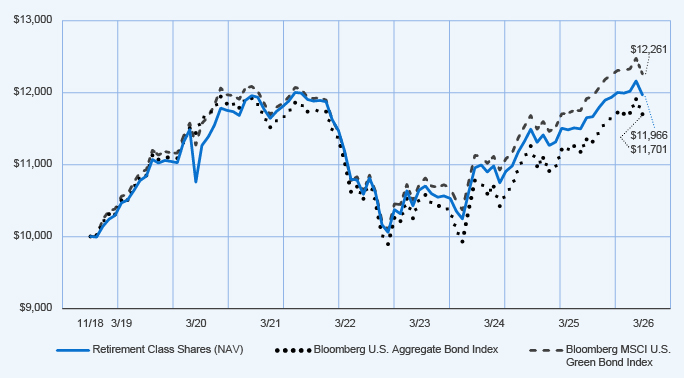
Average Annual Total Returns
| 1‑Year | 5‑Year | Since Inception (11/16/18) | ||||
| Retirement Class Shares at NAV |
4.23% | 0.55% | 2.47% | |||
| Bloomberg U.S. Aggregate Bond Index |
4.35% | 0.31% | 2.15% | |||
| Bloomberg MSCI U.S. Green Bond Index |
4.66% | 0.95% | 2.80% | |||
Fund Statistics (as of March 31, 2026)
| Fund net assets |
$184,532,910 | |||
| Total number of portfolio holdings |
254 | |||
| Portfolio turnover (%) |
31% | |||
| Total management fees paid for the year |
$ 721,762 | |||
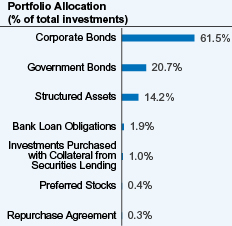
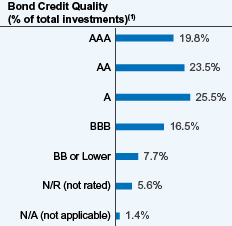
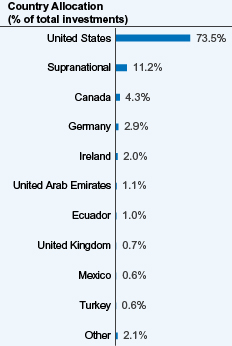
(1) Credit quality ratings are based on the Bloomberg Barclays methodology, which uses the median rating of those compiled by the Moody’s, Standard & Poor’s and Fitch ratings agencies. If ratings are available from only two of these agencies, the lower rating is used. When only one rating is available, that one is used. These ratings are subject to change without notice.
How has the Fund changed?
For more complete information, you may review the Fund’s next prospectus, which is expected to be available by August 1, 2026 at https://www.nuveen.com/en‑us/mutual‑funds/prospectuses or upon request at (800) 257‑8787.
For more complete information, you may review the Fund’s next prospectus, which is expected to be available by August 1, 2026 at https://www.nuveen.com/en‑us/mutual‑funds/prospectuses or upon request at (800) 257‑8787.
This report describes changes to the Fund that occurred during the reporting period.
What were the Fund costs for the last year? (based on a hypothetical $10,000 investment)
| Cost of a $10,000 investment |
Costs paid as a percentage of $10,000 investment* | |||
| Retirement Class Shares |
$60 | 0.59% | ||
* Annualized for period less than one year.
How did the Fund perform last year? What affected the Fund’s performance?
| Performance Highlights • The Nuveen Short Duration Impact Bond Fund returned 4.35% for Retirement Class Shares at net asset value (NAV) for the 12 months ended March 31, 2026. The Fund outperformed the Bloomberg U.S. 1‑3 Year Government/Credit Bond Index, which returned 3.96%. • Top contributors to relative performance • An overweight position and security selection in corporate bonds. • Out‑of‑benchmark exposure to asset-backed securities, commercial mortgage-backed securities and municipal bonds. • Overweights to government-credit and -agency securities. • Top detractors from relative performance • Yield curve positioning in U.S. Treasuries. |
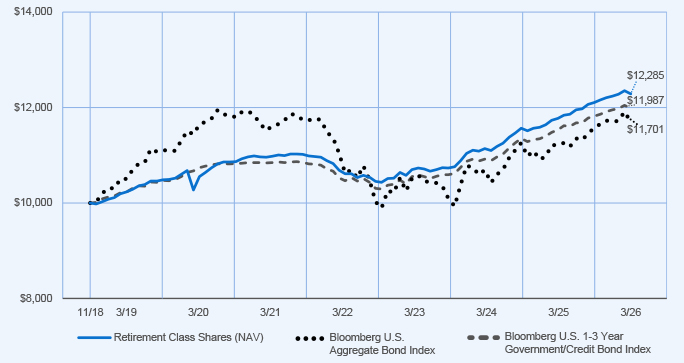
Average Annual Total Returns
| 1‑Year | 5‑Year | Since Inception (11/16/18) | ||||
| Retirement Class Shares at NAV |
4.35% | 2.31% | 2.83% | |||
| Bloomberg U.S. Aggregate Bond Index |
4.35% | 0.31% | 2.15% | |||
| Bloomberg U.S. 1‑3 Year Government/Credit Bond Index |
3.96% | 2.04% | 2.49% | |||
Fund Statistics (as of March 31, 2026)
| Fund net assets |
$347,309,345 | |||
| Total number of portfolio holdings |
268 | |||
| Portfolio turnover (%) |
305% | |||
| Total management fees paid for the year |
$ 469,315 | |||
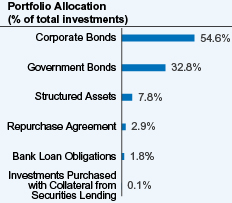
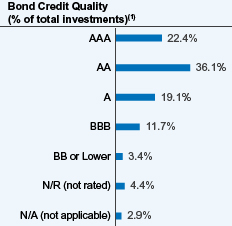
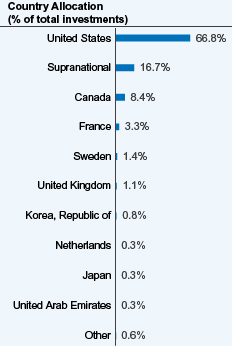
(1) Credit quality ratings are based on the Bloomberg Barclays methodology, which uses the median rating of those compiled by the Moody’s, Standard & Poor’s and Fitch ratings agencies. If ratings are available from only two of these agencies, the lower rating is used. When only one rating is available, that one is used. These ratings are subject to change without notice.
How has the Fund changed?
For more complete information, you may review the Fund’s next prospectus, which is expected to be available by August 1, 2026 at https://www.nuveen.com/en‑us/mutual‑funds/prospectuses or upon request at (800) 257‑8787.
For more complete information, you may review the Fund’s next prospectus, which is expected to be available by August 1, 2026 at https://www.nuveen.com/en‑us/mutual‑funds/prospectuses or upon request at (800) 257‑8787.
This report describes changes to the Fund that occurred during the reporting period.
What were the Fund costs for the last year? (based on a hypothetical $10,000 investment)
| Cost of a $10,000 investment |
Costs paid as a percentage of $10,000 investment* | |||
| Class R6 Shares |
$35 | 0.34% | ||
* Annualized for period less than one year.
How did the Fund perform last year? What affected the Fund’s performance?
| Performance Highlights • The Nuveen Short Duration Impact Bond Fund returned 4.60% for Class R6 Shares at net asset value (NAV) for the 12 months ended March 31, 2026. The Fund outperformed the Bloomberg U.S. 1‑3 Year Government/Credit Bond Index, which returned 3.96%. • Top contributors to relative performance • An overweight position and security selection in corporate bonds. • Out‑of‑benchmark exposure to asset-backed securities, commercial mortgage-backed securities and municipal bonds. • Overweights to government-credit and -agency securities. • Top detractors from relative performance • Yield curve positioning in U.S. Treasuries. |
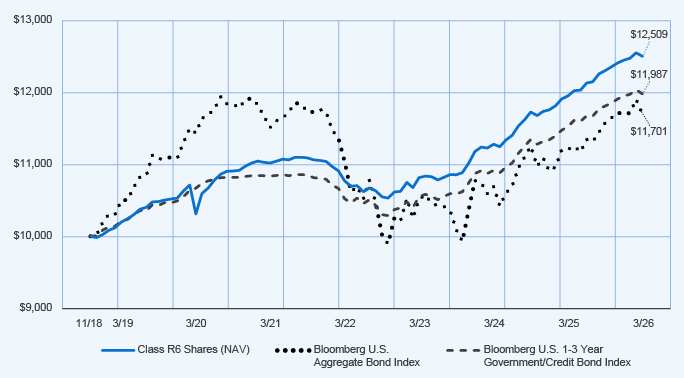
Average Annual Total Returns
| 1‑Year | 5‑Year | Since Inception (11/16/18) | ||||
| Class R6 Shares at NAV |
4.60% | 2.56% | 3.08% | |||
| Bloomberg U.S. Aggregate Bond Index |
4.35% | 0.31% | 2.15% | |||
| Bloomberg U.S. 1‑3 Year Government/Credit Bond Index |
3.96% | 2.04% | 2.49% | |||
Fund Statistics (as of March 31, 2026)
| Fund net assets |
$347,309,345 | |||
| Total number of portfolio holdings |
268 | |||
| Portfolio turnover (%) |
305% | |||
| Total management fees paid for the year |
$ 469,315 | |||
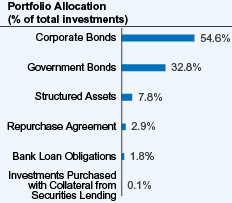
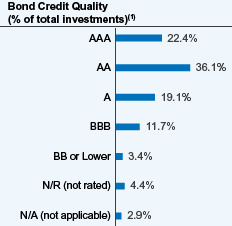
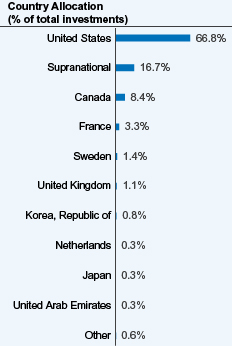
(1) Credit quality ratings are based on the Bloomberg Barclays methodology, which uses the median rating of those compiled by the Moody’s, Standard & Poor’s and Fitch ratings agencies. If ratings are available from only two of these agencies, the lower rating is used. When only one rating is available, that one is used. These ratings are subject to change without notice.
How has the Fund changed?
For more complete information, you may review the Fund’s next prospectus, which is expected to be available by August 1, 2026 at https://www.nuveen.com/en‑us/mutual‑funds/prospectuses or upon request at (800) 257‑8787.
For more complete information, you may review the Fund’s next prospectus, which is expected to be available by August 1, 2026 at https://www.nuveen.com/en‑us/mutual‑funds/prospectuses or upon request at (800) 257‑8787.
This report describes changes to the Fund that occurred during the reporting period.
What were the Fund costs for the last year? (based on a hypothetical $10,000 investment)
| Cost of a $10,000 investment |
Costs paid as a percentage of $10,000 investment* | |||
| Premier Class Shares |
$50 | 0.49% | ||
* Annualized for period less than one year.
How did the Fund perform last year? What affected the Fund’s performance?
| Performance Highlights • The Nuveen Short Duration Impact Bond Fund returned 4.54% for Premier Class Shares at net asset value (NAV) for the 12 months ended March 31, 2026. The Fund outperformed the Bloomberg U.S. 1‑3 Year Government/Credit Bond Index, which returned 3.96%. • Top contributors to relative performance • An overweight position and security selection in corporate bonds. • Out‑of‑benchmark exposure to asset-backed securities, commercial mortgage-backed securities and municipal bonds. • Overweights to government-credit and -agency securities. • Top detractors from relative performance • Yield curve positioning in U.S. Treasuries. |
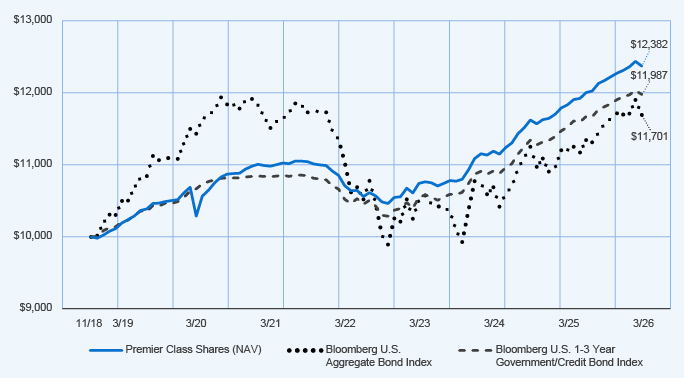
Average Annual Total Returns
| 1‑Year | 5‑Year | Since Inception (11/16/18) | ||||
| Premier Class Shares at NAV |
4.54% | 2.43% | 2.94% | |||
| Bloomberg U.S. Aggregate Bond Index |
4.35% | 0.31% | 2.15% | |||
| Bloomberg U.S. 1‑3 Year Government/Credit Bond Index |
3.96% | 2.04% | 2.49% | |||
Fund Statistics (as of March 31, 2026)
| Fund net assets |
$347,309,345 | |||
| Total number of portfolio holdings |
268 | |||
| Portfolio turnover (%) |
305% | |||
| Total management fees paid for the year |
$ 469,315 | |||
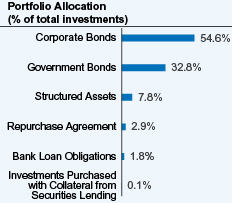
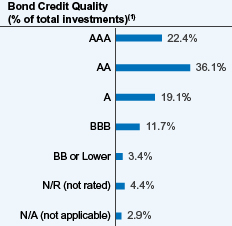
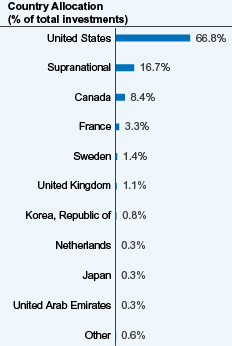
(1) Credit quality ratings are based on the Bloomberg Barclays methodology, which uses the median rating of those compiled by the Moody’s, Standard & Poor’s and Fitch ratings agencies. If ratings are available from only two of these agencies, the lower rating is used. When only one rating is available, that one is used. These ratings are subject to change without notice.
How has the Fund changed?
For more complete information, you may review the Fund’s next prospectus, which is expected to be available by August 1, 2026 at https://www.nuveen.com/en‑us/mutual‑funds/prospectuses or upon request at (800) 257‑8787.
For more complete information, you may review the Fund’s next prospectus, which is expected to be available by August 1, 2026 at https://www.nuveen.com/en‑us/mutual‑funds/prospectuses or upon request at (800) 257‑8787.
This report describes changes to the Fund that occurred during the reporting period.
What were the Fund costs for the last year? (based on a hypothetical $10,000 investment)
| Cost of a $10,000 investment |
Costs paid as a percentage of $10,000 investment* | |||
| Class I Shares |
$39 | 0.38% | ||
* Annualized for period less than one year.
How did the Fund perform last year? What affected the Fund’s performance?
| Performance Highlights • The Nuveen Short Duration Impact Bond Fund returned 4.45% for Class I Shares at net asset value (NAV) for the 12 months ended March 31, 2026. The Fund outperformed the Bloomberg U.S. 1‑3 Year Government/Credit Bond Index, which returned 3.96%. • Top contributors to relative performance • An overweight position and security selection in corporate bonds. • Out‑of‑benchmark exposure to asset-backed securities, commercial mortgage-backed securities and municipal bonds. • Overweights to government-credit and -agency securities. • Top detractors from relative performance • Yield curve positioning in U.S. Treasuries. |
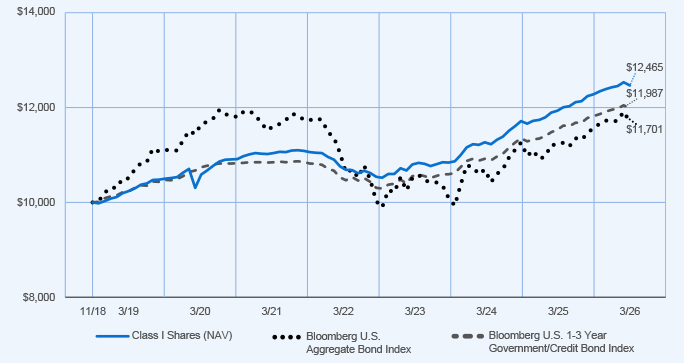
Average Annual Total Returns
| 1‑Year | 5‑Year | Since Inception (11/16/18) | ||||
| Class I Shares at NAV |
4.45% | 2.50% | 3.03% | |||
| Bloomberg U.S. Aggregate Bond Index |
4.35% | 0.31% | 2.15% | |||
| Bloomberg U.S. 1‑3 Year Government/Credit Bond Index |
3.96% | 2.04% | 2.49% | |||
Fund Statistics (as of March 31, 2026)
| Fund net assets |
$347,309,345 | |||
| Total number of portfolio holdings |
268 | |||
| Portfolio turnover (%) |
305% | |||
| Total management fees paid for the year |
$ 469,315 | |||
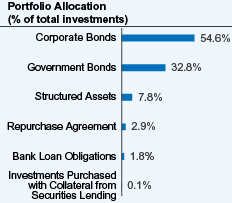
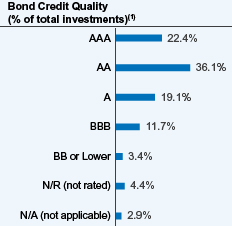
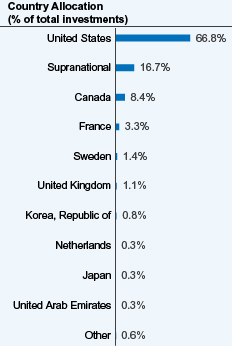
(1) Credit quality ratings are based on the Bloomberg Barclays methodology, which uses the median rating of those compiled by the Moody’s, Standard & Poor’s and Fitch ratings agencies. If ratings are available from only two of these agencies, the lower rating is used. When only one rating is available, that one is used. These ratings are subject to change without notice.
How has the Fund changed?
For more complete information, you may review the Fund’s next prospectus, which is expected to be available by August 1, 2026 at https://www.nuveen.com/en‑us/mutual‑funds/prospectuses or upon request at (800) 257‑8787.
For more complete information, you may review the Fund’s next prospectus, which is expected to be available by August 1, 2026 at https://www.nuveen.com/en‑us/mutual‑funds/prospectuses or upon request at (800) 257‑8787.
This report describes changes to the Fund that occurred during the reporting period.
What were the Fund costs for the last year? (based on a hypothetical $10,000 investment)
| Cost of a $10,000 investment |
Costs paid as a percentage of $10,000 investment* | |||
| Class A Shares |
$67 | 0.66% | ||
* Annualized for period less than one year.
How did the Fund perform last year? What affected the Fund’s performance?
| Performance Highlights • The Nuveen Short Duration Impact Bond Fund returned 4.26% for Class A Shares at net asset value (NAV) for the 12 months ended March 31, 2026. The Fund outperformed the Bloomberg U.S. 1‑3 Year Government/Credit Bond Index, which returned 3.96%. • Top contributors to relative performance • An overweight position and security selection in corporate bonds. • Out‑of‑benchmark exposure to asset-backed securities, commercial mortgage-backed securities and municipal bonds. • Overweights to government-credit and -agency securities. • Top detractors from relative performance • Yield curve positioning in U.S. Treasuries. |
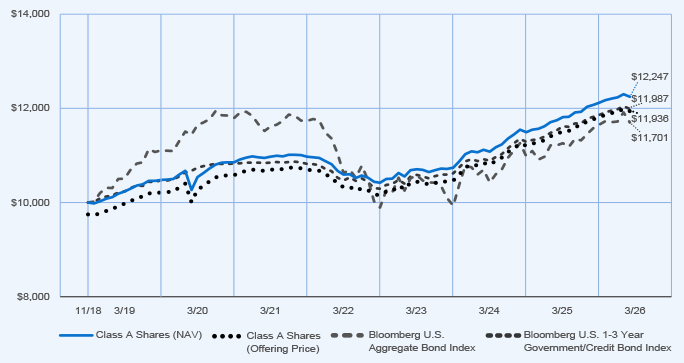
Average Annual Total Returns
| 1‑Year | 5‑Year | Since Inception (11/16/18) | ||||
| Class A Shares at NAV (excluding maximum sales charge) |
4.26% | 2.27% | 2.79% | |||
| Class A at maximum sales charge (Offering Price) |
1.64% | 1.76% | 2.43% | |||
| Bloomberg U.S. Aggregate Bond Index |
4.35% | 0.31% | 2.15% | |||
| Bloomberg U.S. 1‑3 Year Government/Credit Bond Index |
3.96% | 2.04% | 2.49% | |||
Fund Statistics (as of March 31, 2026)
| Fund net assets |
$347,309,345 | |||
| Total number of portfolio holdings |
268 | |||
| Portfolio turnover (%) |
305% | |||
| Total management fees paid for the year |
$ 469,315 | |||
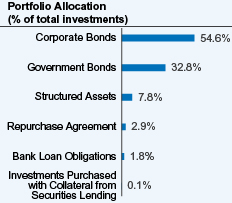
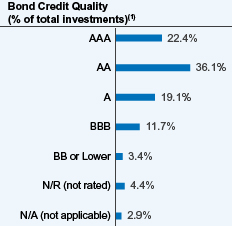
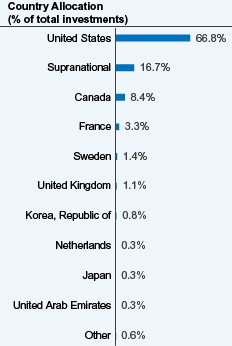
(1) Credit quality ratings are based on the Bloomberg Barclays methodology, which uses the median rating of those compiled by the Moody’s, Standard & Poor’s and Fitch ratings agencies. If ratings are available from only two of these agencies, the lower rating is used. When only one rating is available, that one is used. These ratings are subject to change without notice.
How has the Fund changed?
For more complete information, you may review the Fund’s next prospectus, which is expected to be available by August 1, 2026 at https://www.nuveen.com/en‑us/mutual‑funds/prospectuses or upon request at (800) 257‑8787.
For more complete information, you may review the Fund’s next prospectus, which is expected to be available by August 1, 2026 at https://www.nuveen.com/en‑us/mutual‑funds/prospectuses or upon request at (800) 257‑8787.
| [1] | Annualized for period less than one year. |
| [2] | Annualized for period less than one year. |
| [3] | Annualized for period less than one year. |
| [4] | Annualized for period less than one year. |
| [5] | Annualized for period less than one year. |
| [6] | Annualized for period less than one year. |
| [7] | Annualized for period less than one year. |
| [8] | Annualized for period less than one year. |
| [9] | Annualized for period less than one year. |
| [10] | Annualized for period less than one year. |
| [11] | Annualized for period less than one year. |
| [12] | Annualized for period less than one year. |
| [13] | Annualized for period less than one year. |
| [14] | Annualized for period less than one year. |
| [15] | Annualized for period less than one year. |
| [16] | Annualized for period less than one year. |
| [17] | Annualized for period less than one year. |
| [18] | Annualized for period less than one year. |
| [19] | Annualized for period less than one year. |
| [20] | Annualized for period less than one year. |
| [21] | Annualized for period less than one year. |
| [22] | Annualized for period less than one year. |
| [23] | Annualized for period less than one year. |
| [24] | Annualized for period less than one year. |
| [25] | Annualized for period less than one year. |
| [26] | Annualized for period less than one year. |
| [27] | Annualized for period less than one year. |
| [28] | Annualized for period less than one year. |
| [29] | Annualized for period less than one year. |
| [30] | Annualized for period less than one year. |
| [31] | Annualized for period less than one year. |
| [32] | Annualized for period less than one year. |
| [33] | Annualized for period less than one year. |
| [34] | Annualized for period less than one year. |
| [35] | Annualized for period less than one year. |
| [36] | Annualized for period less than one year. |
| [37] | Annualized for period less than one year. |
| [38] | Annualized for period less than one year. |
| [39] | Annualized for period less than one year. |
| [40] | Annualized for period less than one year. |
| [41] | Annualized for period less than one year. |
| [42] | Annualized for period less than one year. |
| [43] | Annualized for period less than one year. |
| [44] | Annualized for period less than one year. |
| [45] | Annualized for period less than one year. |
| [46] | Annualized for period less than one year. |
| [47] | Annualized for period less than one year. |
| [48] | Annualized for period less than one year. |
| [49] | Annualized for period less than one year. |
| [50] | Annualized for period less than one year. |
| [51] | Annualized for period less than one year. |
| [52] | Annualized for period less than one year. |
| [53] | Annualized for period less than one year. |
| [54] | Annualized for period less than one year. |
| [55] | Annualized for period less than one year. |
| [56] | Annualized for period less than one year. |
| [57] | Annualized for period less than one year. |
| [58] | Annualized for period less than one year. |
| [59] | Annualized for period less than one year. |