Shareholder Report
Apr. 30, 2026
USD ($)
Holding
What were the Fund costs for the last year?
(Based on a hypothetical $10,000 investment)
| Fund (Class) | Costs of a $10,000 investment | Costs paid as a percentage of a $10,000 investment |
| Steward Values Enhanced Large Cap Fund (Institutional Class/SEECX) |
$67 | 0.58% |
How did the Fund perform last year? What affected the Fund's performance?
FUND AND MARKET PERFORMANCE
For the fiscal year ended April 30, 2026, the Steward Values Enhanced Large Cap Fund (Institutional Class) (the “Fund”) returned 29.51%, underperforming the S&P 500 Index (the “Benchmark”) return of 31.05%.
Positive and negative contributors to performance
The Fund implements a strategy to upweight companies that score at the top of its positive value score rankings. At fiscal year end, the Fund screened out 4.6% of the Benchmark weight; therefore, the Fund upweighted 46 companies by at least 10 basis points (“bps”) each.
The performance of the Fund can also be affected by its values-based screening policies. For the year fiscal year ended April 30, 2026, the Fund’s values-based screening policies had a negative performance impact of 62 bps. Not owning companies such as Johnson and Johnson (51.1%), Merck (32.8%) and AbbVie (11.9%) detracted 56 bps of relative performance, collectively. All three names are restricted for participation in embryonic stem cell research.
On the positive side, not owning UnitedHealth (-7.4%) and Vertex (-16.1%) added 20 bps of relative performance. UnitedHealth cannot be held due to owning abortion facilities and Vertex cannot be held due to participation in embryonic stem cell research.
Fund Performance
The performance graph below shows the performance of a hypothetical $100,000 initial investment in the Fund's Institutional Class over a ten-year period (or for the life of the Fund or share class, if shorter). The subsequent account value as of the end of the reporting period is listed next to the name of the Fund or index, as applicable. The performance table below shows the average annual total returns of the Fund's Institutional Class for the past one-, five- and ten-year periods, as applicable (or for the life of the Fund or share class, if shorter), as of the end of the reporting period. Both the graph and table compare the performance of the Fund's Institutional Class to an appropriate broad-based index and may compare to additional indices reflecting the market segment(s) in which the Fund invests, over the same periods.
GROWTH OF $100,000
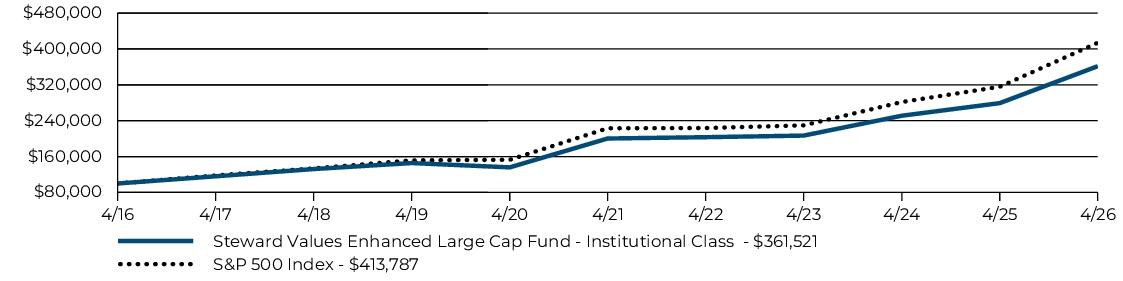
| Average Annual Total Returns | 1 Year | 5 Year | 10 Year |
| Steward Values Enhanced Large Cap Fund (Institutional Class/SEECX) | 29.51% | 12.53% | 13.71% |
| S&P 500 Index | 31.05% | 13.14% | 15.26% |
Key Fund Statistics (April 30, 2026)
| Fund net assets | $316,699,303 |
| Total number of portfolio holdings | 409 |
| Total advisory fees paid | $631,413 |
| Portfolio turnover rate as of the end of the reporting period | 26% |
What did the Fund invest in? (April 30, 2026)
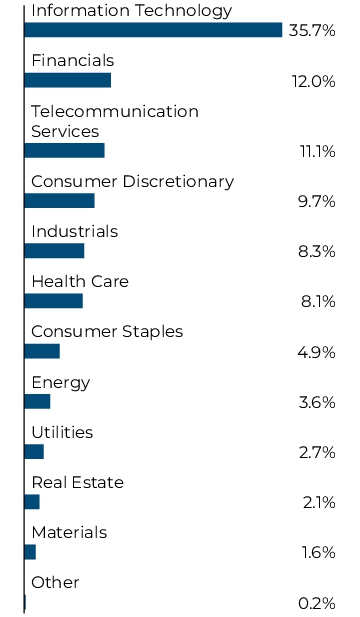
The tables below show the investment makeup of the Fund, representing the percentage of the net assets of the Fund.
TOP TEN HOLDINGS
| NVIDIA Corp. | 7.9% |
| Apple, Inc. | 6.5% |
| Microsoft Corp. | 4.8% |
| Amazon.com, Inc. | 4.1% |
| Alphabet, Inc., Class A | 3.6% |
| Broadcom, Inc. | 3.2% |
| Alphabet, Inc., Class C | 2.9% |
| Meta Platforms, Inc., Class A | 2.1% |
| Tesla, Inc. | 1.7% |
| JPMorgan Chase & Co. | 1.5% |
SECTOR ALLOCATION
TOP TEN HOLDINGS
| NVIDIA Corp. | 7.9% |
| Apple, Inc. | 6.5% |
| Microsoft Corp. | 4.8% |
| Amazon.com, Inc. | 4.1% |
| Alphabet, Inc., Class A | 3.6% |
| Broadcom, Inc. | 3.2% |
| Alphabet, Inc., Class C | 2.9% |
| Meta Platforms, Inc., Class A | 2.1% |
| Tesla, Inc. | 1.7% |
| JPMorgan Chase & Co. | 1.5% |
What were the Fund costs for the last year?
(Based on a hypothetical $10,000 investment)
| Fund (Class) | Costs of a $10,000 investment | Costs paid as a percentage of a $10,000 investment |
| Steward Values Enhanced Large Cap Fund (Class R6/SEEHX) |
$54 | 0.47% |
How did the Fund perform last year? What affected the Fund's performance?
FUND AND MARKET PERFORMANCE
For the fiscal year ended April 30, 2026, the Steward Values Enhanced Large Cap Fund (Class R6) (the “Fund”) returned 29.65%, underperforming the S&P 500 Index (the “Benchmark”) return of 31.05%.
Positive and negative contributors to performance
The Fund implements a strategy to upweight companies that score at the top of its positive value score rankings. At fiscal year end, the Fund screened out 4.6% of the Benchmark weight; therefore, the Fund upweighted 46 companies by at least 10 basis points (“bps”) each.
The performance of the Fund can also be affected by its values-based screening policies. For the year fiscal year ended April 30, 2026, the Fund’s values-based screening policies had a negative performance impact of 62 bps. Not owning companies such as Johnson and Johnson (51.1%), Merck (32.8%) and AbbVie (11.9%) detracted 56 bps of relative performance, collectively. All three names are restricted for participation in embryonic stem cell research.
On the positive side, not owning UnitedHealth (-7.4%) and Vertex (-16.1%) added 20 bps of relative performance. UnitedHealth cannot be held due to owning abortion facilities and Vertex cannot be held due to participation in embryonic stem cell research.
Fund Performance
The performance graph below shows the performance of a hypothetical $10,000 initial investment in the Fund's Class R6 over a ten-year period (or for the life of the Fund or share class, if shorter). The subsequent account value as of the end of the reporting period is listed next to the name of the Fund or index, as applicable. The performance table below shows the average annual total returns of the Fund's Class R6 for the past one-, five- and ten-year periods, as applicable (or for the life of the Fund or share class, if shorter), as of the end of the reporting period. Both the graph and table compare the performance of the Fund's Class R6 to an appropriate broad-based index and may compare to additional indices reflecting the market segment(s) in which the Fund invests, over the same periods.
GROWTH OF $10,000
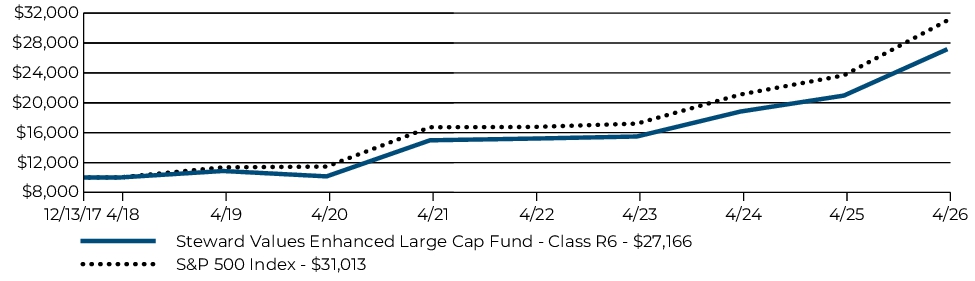
| Average Annual Total Returns | 1 Year | 5 Year | Since Inception |
| Steward Values Enhanced Large Cap Fund (Class R6/SEEHX) | 29.65% | 12.65% | 12.67% |
| S&P 500 Index | 31.05% | 13.14% | 14.46% |
Key Fund Statistics (April 30, 2026)
| Fund net assets | $316,699,303 |
| Total number of portfolio holdings | 409 |
| Total advisory fees paid | $631,413 |
| Portfolio turnover rate as of the end of the reporting period | 26% |
What did the Fund invest in? (April 30, 2026)
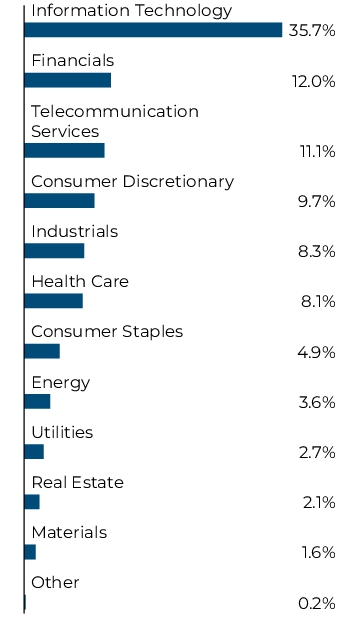
The tables below show the investment makeup of the Fund, representing the percentage of the net assets of the Fund.
TOP TEN HOLDINGS
| NVIDIA Corp. | 7.9% |
| Apple, Inc. | 6.5% |
| Microsoft Corp. | 4.8% |
| Amazon.com, Inc. | 4.1% |
| Alphabet, Inc., Class A | 3.6% |
| Broadcom, Inc. | 3.2% |
| Alphabet, Inc., Class C | 2.9% |
| Meta Platforms, Inc., Class A | 2.1% |
| Tesla, Inc. | 1.7% |
| JPMorgan Chase & Co. | 1.5% |
SECTOR ALLOCATION
TOP TEN HOLDINGS
| NVIDIA Corp. | 7.9% |
| Apple, Inc. | 6.5% |
| Microsoft Corp. | 4.8% |
| Amazon.com, Inc. | 4.1% |
| Alphabet, Inc., Class A | 3.6% |
| Broadcom, Inc. | 3.2% |
| Alphabet, Inc., Class C | 2.9% |
| Meta Platforms, Inc., Class A | 2.1% |
| Tesla, Inc. | 1.7% |
| JPMorgan Chase & Co. | 1.5% |
What were the Fund costs for the last year?
(Based on a hypothetical $10,000 investment)
| Fund (Class) | Costs of a $10,000 investment | Costs paid as a percentage of a $10,000 investment |
| Steward Values Enhanced Large Cap Fund (Class A/SEEKX) |
$95 | 0.83% |
How did the Fund perform last year? What affected the Fund's performance?
FUND AND MARKET PERFORMANCE
For the fiscal year ended April 30, 2026, the Steward Values Enhanced Large Cap Fund (Class A) (the “Fund”) returned 29.15%, underperforming the S&P 500 Index (the “Benchmark”) return of 31.05%.
Positive and negative contributors to performance
The Fund implements a strategy to upweight companies that score at the top of its positive value score rankings. At fiscal year end, the Fund screened out 4.6% of the Benchmark weight; therefore, the Fund upweighted 46 companies by at least 10 basis points (“bps”) each.
The performance of the Fund can also be affected by its values-based screening policies. For the year fiscal year ended April 30, 2026, the Fund’s values-based screening policies had a negative performance impact of 62 bps. Not owning companies such as Johnson and Johnson (51.1%), Merck (32.8%) and AbbVie (11.9%) detracted 56 bps of relative performance, collectively. All three names are restricted for participation in embryonic stem cell research.
On the positive side, not owning UnitedHealth (-7.4%) and Vertex (-16.1%) added 20 bps of relative performance. UnitedHealth cannot be held due to owning abortion facilities and Vertex cannot be held due to participation in embryonic stem cell research.
Fund Performance
The performance graph below shows the performance of a hypothetical $10,000 initial investment in the Fund's Class A over a ten-year period (or for the life of the Fund or share class, if shorter). The subsequent account value as of the end of the reporting period is listed next to the name of the Fund or index, as applicable. The performance table below shows the average annual total returns of the Fund's Class A for the past one-, five- and ten-year periods, as applicable (or for the life of the Fund or share class, if shorter), as of the end of the reporting period. Both the graph and table compare the performance of the Fund's Class A to an appropriate broad-based index and may compare to additional indices reflecting the market segment(s) in which the Fund invests, over the same periods.
GROWTH OF $10,000
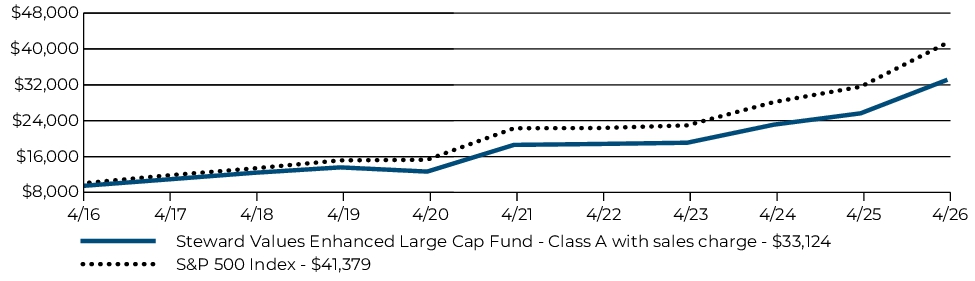
| Average Annual Total Returns | 1 Year | 5 Year | 10 Year |
| Steward Values Enhanced Large Cap Fund (Class A/SEEKX) (with maximum 5.75% sales charge) | 21.73% | 10.91% | 12.72% |
| Steward Values Enhanced Large Cap Fund (Class A/SEEKX) (without sales charge) | 29.15% | 12.23% | 13.39% |
| S&P 500 Index | 31.05% | 13.14% | 15.26% |
Key Fund Statistics (April 30, 2026)
| Fund net assets | $316,699,303 |
| Total number of portfolio holdings | 409 |
| Total advisory fees paid | $631,413 |
| Portfolio turnover rate as of the end of the reporting period | 26% |
What did the Fund invest in? (April 30, 2026)
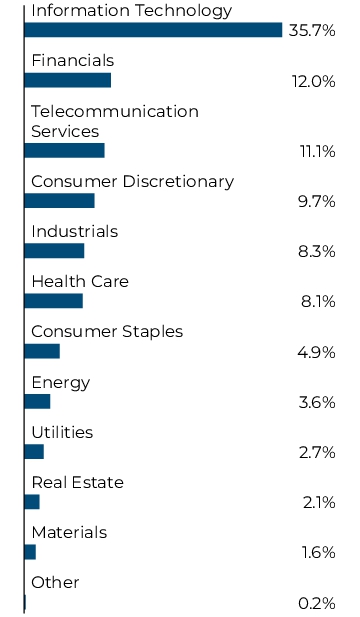
The tables below show the investment makeup of the Fund, representing the percentage of the net assets of the Fund.
TOP TEN HOLDINGS
| NVIDIA Corp. | 7.9% |
| Apple, Inc. | 6.5% |
| Microsoft Corp. | 4.8% |
| Amazon.com, Inc. | 4.1% |
| Alphabet, Inc., Class A | 3.6% |
| Broadcom, Inc. | 3.2% |
| Alphabet, Inc., Class C | 2.9% |
| Meta Platforms, Inc., Class A | 2.1% |
| Tesla, Inc. | 1.7% |
| JPMorgan Chase & Co. | 1.5% |
SECTOR ALLOCATION
TOP TEN HOLDINGS
| NVIDIA Corp. | 7.9% |
| Apple, Inc. | 6.5% |
| Microsoft Corp. | 4.8% |
| Amazon.com, Inc. | 4.1% |
| Alphabet, Inc., Class A | 3.6% |
| Broadcom, Inc. | 3.2% |
| Alphabet, Inc., Class C | 2.9% |
| Meta Platforms, Inc., Class A | 2.1% |
| Tesla, Inc. | 1.7% |
| JPMorgan Chase & Co. | 1.5% |
What were the Fund costs for the last year?
(Based on a hypothetical $10,000 investment)
| Fund (Class) | Costs of a $10,000 investment | Costs paid as a percentage of a $10,000 investment |
| Steward Select Bond Fund (Class A/SEAKX) |
$96 | 0.94% |
How did the Fund perform last year? What affected the Fund's performance?
Fund and Market Performance
For the fiscal year ended April 30, 2026, the Steward Select Bond Fund (Class A) (the “Fund”) returned 3.67%, outperforming the Bloomberg U.S. Government/Credit Bond Index (the “Benchmark”) return of 3.55%.
Positive and Negative Contributors to Performance
There were numerous shocks to the economy during the period, including the differing variations of tariff policy, the surge of AI and the large capex associated with the technology, and the energy shock related to geopolitical events in the Middle East. We shouldn’t be surprised that US 10-year yields vacillated, beginning the 12-month period at 4.16% on 4/30/25, hitting a high of the period on 5/21/25 at 4.60%, dropping to a low of 3.94% on 2/27/26, and ending the period on 4/30/26 at a level not too far from where we started at 4.37%. Although the Fund maintained a shorter duration than its Benchmark, we did move duration much closer to neutral to help reduce interest rate volatility as we expected the Fed to begin cutting rates towards the end of 2025. We also increased the US Treasury allocation to take advantage of opportunities in the sector and better align with the Benchmark. The largest positive contributors to the Fund’s outperformance relative to the Benchmark were duration, security selection, allocation decisions, and the carry effect as the yield curve steepened. The spread effect was the largest drag on performance relative to the Benchmark as there were brief spans of spread widening and our overweight to the corporate sector, although a positive for the income component of total return, intensified that effect.
Fund Performance
The performance graph below shows the performance of a hypothetical $10,000 initial investment in the Fund's Class A over a ten-year period (or for the life of the Fund or share class, if shorter). The subsequent account value as of the end of the reporting period is listed next to the name of the Fund or index, as applicable. The performance table below shows the average annual total returns of the Fund's Class A for the past one-, five- and ten-year periods, as applicable (or for the life of the Fund or share class, if shorter), as of the end of the reporting period. Both the graph and table compare the performance of the Fund's Class A to an appropriate broad-based index and may compare to additional indices reflecting the market segment(s) in which the Fund invests, over the same periods.
GROWTH OF $10,000
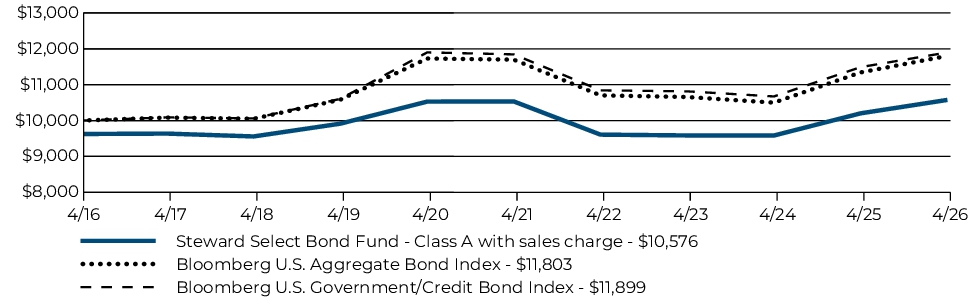
| Average Annual Total Returns | 1 Year | 5 Year | 10 Year |
| Steward Select Bond Fund (Class A/SEAKX) (with maximum 3.75% sales charge) | (0.22)% | (0.68)% | 0.56% |
| Steward Select Bond Fund (Class A/SEAKX) (without sales charge) | 3.67% | 0.08% | 0.94% |
| Bloomberg U.S. Aggregate Bond Index | 4.06% | 0.18% | 1.67% |
| Bloomberg U.S. Government/Credit Bond Index | 3.55% | 0.09% | 1.75% |
Key Fund Statistics (April 30, 2026)
| Fund net assets | $221,539,187 |
| Total number of portfolio holdings | 150 |
| Total advisory fees paid | $630,176 |
| Portfolio turnover rate as of the end of the reporting period | 13% |
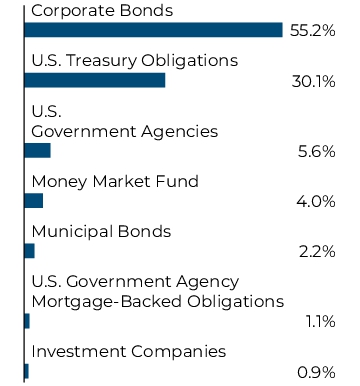
What did the Fund invest in? (April 30, 2026)
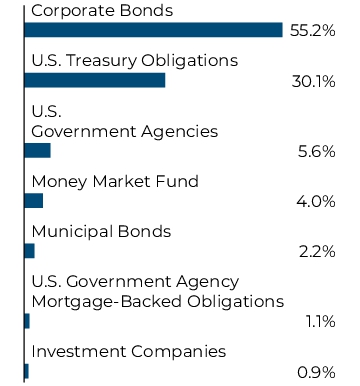
The tables below show the investment makeup of the Fund, representing the percentage of the net assets of the Fund.
TOP TEN HOLDINGS
| Northern Institutional Treasury Portfolio (Premier Class) | 4.0% |
| QUALCOMM, Inc. | 1.8% |
| U.S. Treasury Notes, 3.50%, 02/15/33 | 1.7% |
| U.S. Treasury Bonds, 4.00%, 11/15/42 | 1.6% |
| U.S. Treasury Notes, 1.25%, 04/15/28 | 1.5% |
| L3Harris Technologies, Inc. | 1.4% |
| U.S. Treasury Notes, 4.38%, 05/15/34 | 1.4% |
| U.S. Treasury Notes, 4.13%, 03/31/31 | 1.4% |
| U.S. Treasury Notes, 4.00%, 07/31/30 | 1.4% |
| U.S. Treasury Notes, 4.00%, 06/30/32 | 1.3% |
ASSET TYPE ALLOCATION
TOP TEN HOLDINGS
| Northern Institutional Treasury Portfolio (Premier Class) | 4.0% |
| QUALCOMM, Inc. | 1.8% |
| U.S. Treasury Notes, 3.50%, 02/15/33 | 1.7% |
| U.S. Treasury Bonds, 4.00%, 11/15/42 | 1.6% |
| U.S. Treasury Notes, 1.25%, 04/15/28 | 1.5% |
| L3Harris Technologies, Inc. | 1.4% |
| U.S. Treasury Notes, 4.38%, 05/15/34 | 1.4% |
| U.S. Treasury Notes, 4.13%, 03/31/31 | 1.4% |
| U.S. Treasury Notes, 4.00%, 07/31/30 | 1.4% |
| U.S. Treasury Notes, 4.00%, 06/30/32 | 1.3% |
What were the Fund costs for the last year?
(Based on a hypothetical $10,000 investment)
| Fund (Class) | Costs of a $10,000 investment | Costs paid as a percentage of a $10,000 investment |
| Steward Select Bond Fund (Institutional Class/SEACX) |
$69 | 0.68% |
How did the Fund perform last year? What affected the Fund's performance?
Fund and Market Performance
For the fiscal year ended April 30, 2026, the Steward Select Bond Fund (Institutional Class) (the “Fund”) returned 3.93%, outperforming the Bloomberg U.S. Government/Credit Bond Index (the “Benchmark”) return of 3.55%.
Positive and Negative Contributors to Performance
There were numerous shocks to the economy during the period, including the differing variations of tariff policy, the surge of AI and the large capex associated with the technology, and the energy shock related to geopolitical events in the Middle East. We shouldn’t be surprised that US 10-year yields vacillated, beginning the 12-month period at 4.16% on 4/30/25, hitting a high of the period on 5/21/25 at 4.60%, dropping to a low of 3.94% on 2/27/26, and ending the period on 4/30/26 at a level not too far from where we started at 4.37%. Although the Fund maintained a shorter duration than its Benchmark, we did move duration much closer to neutral to help reduce interest rate volatility as we expected the Fed to begin cutting rates towards the end of 2025. We also increased the US Treasury allocation to take advantage of opportunities in the sector and better align with the Benchmark. The largest positive contributors to the Fund’s outperformance relative to the Benchmark were duration, security selection, allocation decisions, and the carry effect as the yield curve steepened. The spread effect was the largest drag on performance relative to the Benchmark as there were brief spans of spread widening and our overweight to the corporate sector, although a positive for the income component of total return, intensified that effect.
Fund Performance
The performance graph below shows the performance of a hypothetical $100,000 initial investment in the Fund's Institutional Class over a ten-year period (or for the life of the Fund or share class, if shorter). The subsequent account value as of the end of the reporting period is listed next to the name of the Fund or index, as applicable. The performance table below shows the average annual total returns of the Fund's Institutional Class for the past one-, five- and ten-year periods, as applicable (or for the life of the Fund or share class, if shorter), as of the end of the reporting period. Both the graph and table compare the performance of the Fund's Institutional Class to an appropriate broad-based index and may compare to additional indices reflecting the market segment(s) in which the Fund invests, over the same periods.
GROWTH OF $100,000
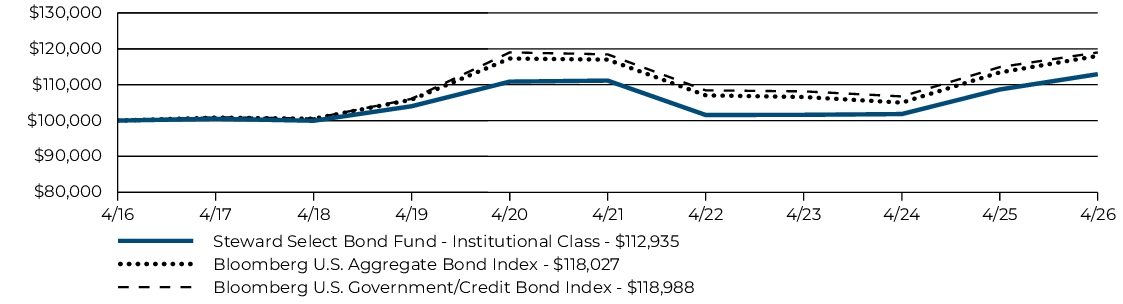
| Average Annual Total Returns | 1 Year | 5 Year | 10 Year |
| Steward Select Bond Fund (Institutional Class/SEACX) | 3.93% | 0.32% | 1.22% |
| Bloomberg U.S. Aggregate Bond Index | 4.06% | 0.18% | 1.67% |
| Bloomberg U.S. Government/Credit Bond Index | 3.55% | 0.09% | 1.75% |
Key Fund Statistics (April 30, 2026)
| Fund net assets | $221,539,187 |
| Total number of portfolio holdings | 150 |
| Total advisory fees paid | $630,176 |
| Portfolio turnover rate as of the end of the reporting period | 13% |
What did the Fund invest in? (April 30, 2026)
The tables below show the investment makeup of the Fund, representing the percentage of the net assets of the Fund.
TOP TEN HOLDINGS
| Northern Institutional Treasury Portfolio (Premier Class) | 4.0% |
| QUALCOMM, Inc. | 1.8% |
| U.S. Treasury Notes, 3.50%, 02/15/33 | 1.7% |
| U.S. Treasury Bonds, 4.00%, 11/15/42 | 1.6% |
| U.S. Treasury Notes, 1.25%, 04/15/28 | 1.5% |
| L3Harris Technologies, Inc. | 1.4% |
| U.S. Treasury Notes, 4.38%, 05/15/34 | 1.4% |
| U.S. Treasury Notes, 4.13%, 03/31/31 | 1.4% |
| U.S. Treasury Notes, 4.00%, 07/31/30 | 1.4% |
| U.S. Treasury Notes, 4.00%, 06/30/32 | 1.3% |
ASSET TYPE ALLOCATION
TOP TEN HOLDINGS
| Northern Institutional Treasury Portfolio (Premier Class) | 4.0% |
| QUALCOMM, Inc. | 1.8% |
| U.S. Treasury Notes, 3.50%, 02/15/33 | 1.7% |
| U.S. Treasury Bonds, 4.00%, 11/15/42 | 1.6% |
| U.S. Treasury Notes, 1.25%, 04/15/28 | 1.5% |
| L3Harris Technologies, Inc. | 1.4% |
| U.S. Treasury Notes, 4.38%, 05/15/34 | 1.4% |
| U.S. Treasury Notes, 4.13%, 03/31/31 | 1.4% |
| U.S. Treasury Notes, 4.00%, 07/31/30 | 1.4% |
| U.S. Treasury Notes, 4.00%, 06/30/32 | 1.3% |
This report describes changes to the Fund that occurred during the reporting period.
What were the Fund costs for the last year?
(Based on a hypothetical $10,000 investment)
| Fund (Class) | Costs of a $10,000 investment | Costs paid as a percentage of a $10,000 investment |
| Steward Values Enhanced International Fund (Institutional Class/SNTCX) |
$87 | 0.75% |
How did the Fund perform last year? What affected the Fund's performance?
Fund and Market Performance
For the fiscal year ended April 30, 2026, the Steward Values Enhanced International Fund (Institutional Class) (the “Fund”) returned 30.74%, underperforming the S&P International 700 ADR Index (the “Benchmark”) return of 43.62%. For comparison purposes, the return for the Fund’s secondary benchmark (the "Blended Benchmark Index"), comprised of the S&P Developed Markets ADR Index (85%) and the S&P Emerging 50 ADR Index (15%) returned 32.26% for the period.
Positive and negative contributors to performance
The Fund’s dual market structure kept the same allocation to emerging markets during the fiscal year: 80% allocated toward non-U.S. developed markets (DM) and 20% toward emerging markets (EM). As a reminder, the Fund’s dual market structure has historically tilted its EM allocation between 10-20% of total net assets, with 15% representing a neutral position. During the year, the allocation to EM positively impacted the Fund by 156 basis points (“bps”) relative to the Blended Benchmark Index.
As it relates to countries, Denmark was the largest positive contributor to relative performance, driven by the Fund’s inability to hold Novo Nordisk. The United Kingdom was the largest negative contributor to relative performance, due to positive performing exclusions, AstraZeneca and British American Tobacco.
The Fund’s values-based screening policies impact performance relative to the Benchmark. For the year fiscal year ended April 30, 2026, the Fund’s values-based screening detracted from relative performance by 252 bps. Not owning large index weights Novartis (32.9%) and AstraZeneca (30.9%), negatively impacted the portfolio by 247 bps. The Fund is unable to hold both due to embryonic stem cell research. Not owning underperforming stocks Novo Nordisk (-34.4%) and Sanofi SA (-11.7%) positively impacted relative performance by 163 bps. Novo Nordisk is removed due to embryonic stem cell research and Sanofi for abortion-related activities.
Fund Performance
The performance graph below shows the performance of a hypothetical $100,000 initial investment in the Fund's Institutional Class over a ten-year period (or for the life of the Fund or share class, if shorter). The subsequent account value as of the end of the reporting period is listed next to the name of the Fund or index, as applicable. The performance table below shows the average annual total returns of the Fund's Institutional Class for the past one-, five- and ten-year periods, as applicable (or for the life of the Fund or share class, if shorter), as of the end of the reporting period. Both the graph and table compare the performance of the Fund's Institutional Class to an appropriate broad-based index and may compare to additional indices reflecting the market segment(s) in which the Fund invests, over the same periods.
GROWTH OF $100,000
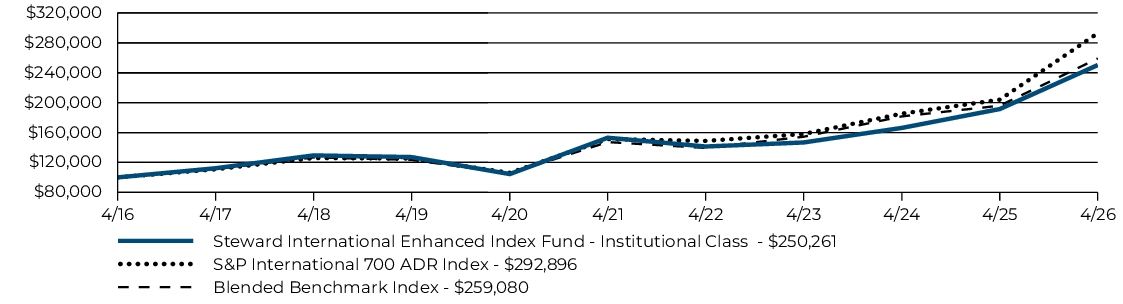
| Average Annual Total Returns | 1 Year | 5 Year | 10 Year |
| Steward Values Enhanced International Fund (Institutional Class/SNTCX) | 30.74% | 10.33% | 9.61% |
| S&P International 700 ADR Index | 43.62% | 14.13% | 11.35% |
| Blended Benchmark Index | 32.26% | 11.96% | 9.99% |
The Blended Benchmark Index is comprised of the S&P Developed Markets ADR Index (85%) and the S&P Emerging 50 ADR Index (15%). The Blended Benchmark Index was added as an additional comparative index because the Fund's investment adviser believes the Blended Benchmark Index better represents the Fund's overall investment process.
Key Fund Statistics (April 30, 2026)
| Fund net assets | $301,948,654 |
| Total number of portfolio holdings | 111 |
| Total advisory fees paid | $1,000,945 |
| Portfolio turnover rate as of the end of the reporting period | 59% |
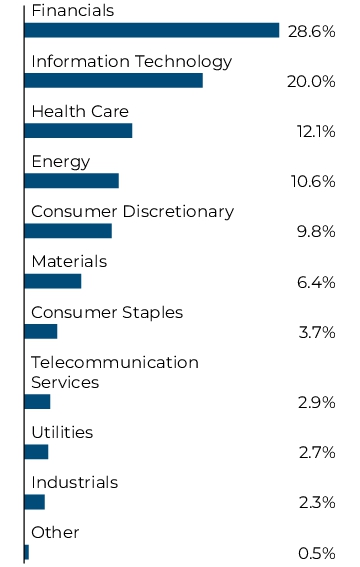
What did the Fund invest in? (April 30, 2026)
The tables below show the investment makeup of the Fund, representing the percentage of the net assets of the Fund.
TOP TEN HOLDINGS
| ASML Holding N.V., Sponsored NYS | 8.0% |
| HSBC Holdings PLC, Sponsored ADR | 4.6% |
| Taiwan Semiconductor Manufacturing Co. Ltd., Sponsored ADR | 4.4% |
| Takeda Pharmaceutical Co. Ltd., ADR | 3.9% |
| Shell PLC, ADR | 3.8% |
| Unilever PLC, Sponsored ADR | 3.5% |
| Mitsubishi UFJ Financial Group, Inc., Sponsored ADR | 3.2% |
| Alibaba Group Holding Ltd., Sponsored ADR | 3.2% |
| TotalEnergies SE | 3.1% |
| BHP Group Ltd., Sponsored ADR | 3.0% |
SECTOR ALLOCATION
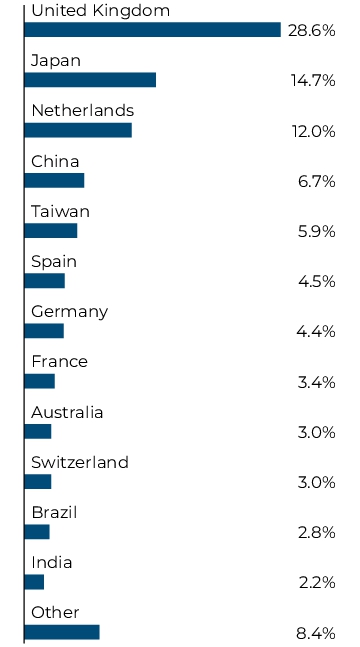
GEOGRAPHICAL ALLOCATION
TOP TEN HOLDINGS
| ASML Holding N.V., Sponsored NYS | 8.0% |
| HSBC Holdings PLC, Sponsored ADR | 4.6% |
| Taiwan Semiconductor Manufacturing Co. Ltd., Sponsored ADR | 4.4% |
| Takeda Pharmaceutical Co. Ltd., ADR | 3.9% |
| Shell PLC, ADR | 3.8% |
| Unilever PLC, Sponsored ADR | 3.5% |
| Mitsubishi UFJ Financial Group, Inc., Sponsored ADR | 3.2% |
| Alibaba Group Holding Ltd., Sponsored ADR | 3.2% |
| TotalEnergies SE | 3.1% |
| BHP Group Ltd., Sponsored ADR | 3.0% |
Material Fund Changes
This is a summary of certain changes to the Fund since May 1, 2025. For more comprehensive information, you may review the Fund's prospectus and any applicable supplements at crossmarkglobal.com/stewardfunds/ or by contacting 888-845-6910.
Effective July 31, 2025, the name of the Fund was changed from Steward International Enhanced Index Fund to Steward Values Enhanced International Fund. In addition to the name change, the Fund also (i) eliminated its investment policy that, under normal circumstances, the Fund invests at least 80% of its assets in the securities of companies included in the S&P International 700 ADR Index (however, the Fund still invests at least 80% of its assets in the securities of non-U.S. companies) and (ii) amended its investment process to provide for the upweighting of a certain number of portfolio companies, relative to their weightings in the Blended Benchmark Index, based on their positive value scores.
This is a summary of certain changes to the Fund since May 1, 2025. For more comprehensive information, you may review the Fund's prospectus and any applicable supplements at crossmarkglobal.com/stewardfunds/ or by contacting 888-845-6910.
This report describes changes to the Fund that occurred during the reporting period.
What were the Fund costs for the last year?
(Based on a hypothetical $10,000 investment)
| Fund (Class) | Costs of a $10,000 investment | Costs paid as a percentage of a $10,000 investment |
| Steward Values Enhanced International Fund (Class R6/SNTFX) |
$76 | 0.66% |
How did the Fund perform last year? What affected the Fund's performance?
Fund and Market Performance
For the fiscal year ended April 30, 2026, the Steward Values Enhanced International Fund (Class R6) (the “Fund”) returned 30.88%, underperforming the S&P International 700 ADR Index (the “Benchmark”) return of 43.62%. For comparison purposes, the return for the Fund’s secondary benchmark (the "Blended Benchmark Index"), comprised of the S&P Developed Markets ADR Index (85%) and the S&P Emerging 50 ADR Index (15%) returned 32.26% for the period.
Positive and negative contributors to performance
The Fund’s dual market structure kept the same allocation to emerging markets during the fiscal year: 80% allocated toward non-U.S. developed markets (DM) and 20% toward emerging markets (EM). As a reminder, the Fund’s dual market structure has historically tilted its EM allocation between 10-20% of total net assets, with 15% representing a neutral position. During the year, the allocation to EM positively impacted the Fund by 156 basis points (“bps”) relative to the Blended Benchmark Index
As it relates to countries, Denmark was the largest positive contributor to relative performance, driven by the Fund’s inability to hold Novo Nordisk. The United Kingdom was the largest negative contributor to relative performance, due to positive performing exclusions, AstraZeneca and British American Tobacco.
The Fund’s values-based screening policies impact performance relative to the Benchmark. For the year fiscal year ended April 30, 2026, the Fund’s values-based screening detracted from relative performance by 252 bps. Not owning large index weights Novartis (32.9%) and AstraZeneca (30.9%), negatively impacted the portfolio by 247 bps. The Fund is unable to hold both due to embryonic stem cell research. Not owning underperforming stocks Novo Nordisk (-34.4%) and Sanofi SA (-11.7%) positively impacted relative performance by 163 bps. Novo Nordisk is removed due to embryonic stem cell research and Sanofi for abortion-related activities.
Fund Performance
The performance graph below shows the performance of a hypothetical $10,000 initial investment in the Fund's Class R6 over a ten-year period (or for the life of the Fund or share class, if shorter). The subsequent account value as of the end of the reporting period is listed next to the name of the Fund or index, as applicable. The performance table below shows the average annual total returns of the Fund's Class R6 for the past one-, five- and ten-year periods, as applicable (or for the life of the Fund or share class, if shorter), as of the end of the reporting period. Both the graph and table compare the performance of the Fund's Class R6 to an appropriate broad-based index and may compare to additional indices reflecting the market segment(s) in which the Fund invests, over the same periods.
GROWTH OF $10,000
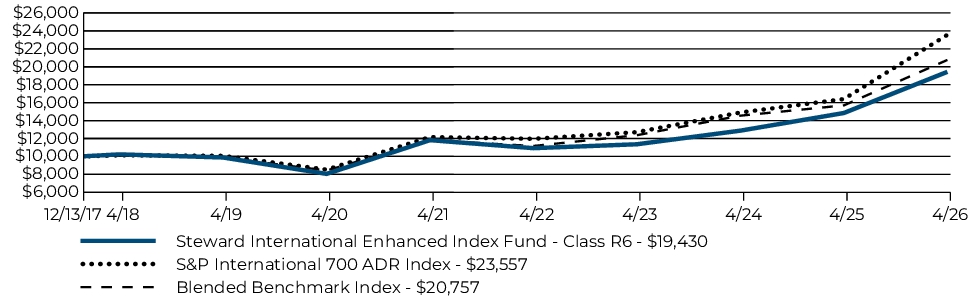
| Average Annual Total Returns | 1 Year | 5 Year | Since Inception |
| Steward Values Enhanced International Fund (Class R6/SNTFX) | 30.88% | 10.45% | 8.25% |
| S&P International 700 ADR Index | 43.62% | 14.13% | 10.77% |
| Blended Benchmark Index | 32.26% | 11.96% | 9.11% |
The Blended Benchmark Index is comprised of the S&P Developed Markets ADR Index (85%) and the S&P Emerging 50 ADR Index (15%). The Blended Benchmark Index was added as an additional comparative index because the Fund's investment adviser believes the Blended Benchmark Index better represents the Fund's overall investment process.
Key Fund Statistics (April 30, 2026)
| Fund net assets | $301,948,654 |
| Total number of portfolio holdings | 111 |
| Total advisory fees paid | $1,000,945 |
| Portfolio turnover rate as of the end of the reporting period | 59% |
What did the Fund invest in? (April 30, 2026)
The tables below show the investment makeup of the Fund, representing the percentage of the net assets of the Fund.
TOP TEN HOLDINGS
| ASML Holding N.V., Sponsored NYS | 8.0% |
| HSBC Holdings PLC, Sponsored ADR | 4.6% |
| Taiwan Semiconductor Manufacturing Co. Ltd., Sponsored ADR | 4.4% |
| Takeda Pharmaceutical Co. Ltd., ADR | 3.9% |
| Shell PLC, ADR | 3.8% |
| Unilever PLC, Sponsored ADR | 3.5% |
| Mitsubishi UFJ Financial Group, Inc., Sponsored ADR | 3.2% |
| Alibaba Group Holding Ltd., Sponsored ADR | 3.2% |
| TotalEnergies SE | 3.1% |
| BHP Group Ltd., Sponsored ADR | 3.0% |
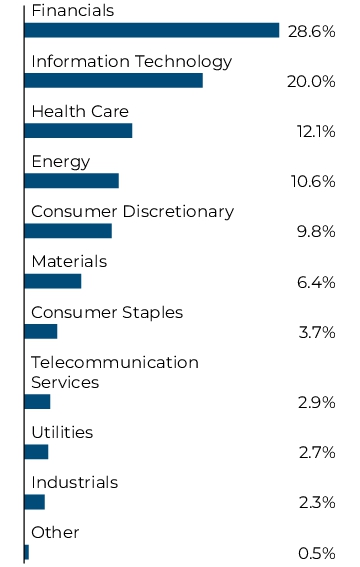
SECTOR ALLOCATION
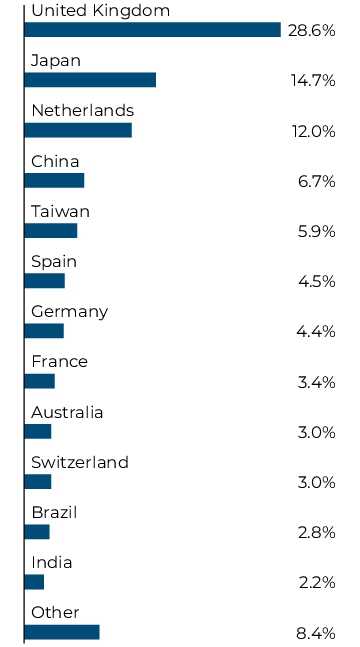
GEOGRAPHICAL ALLOCATION
TOP TEN HOLDINGS
| ASML Holding N.V., Sponsored NYS | 8.0% |
| HSBC Holdings PLC, Sponsored ADR | 4.6% |
| Taiwan Semiconductor Manufacturing Co. Ltd., Sponsored ADR | 4.4% |
| Takeda Pharmaceutical Co. Ltd., ADR | 3.9% |
| Shell PLC, ADR | 3.8% |
| Unilever PLC, Sponsored ADR | 3.5% |
| Mitsubishi UFJ Financial Group, Inc., Sponsored ADR | 3.2% |
| Alibaba Group Holding Ltd., Sponsored ADR | 3.2% |
| TotalEnergies SE | 3.1% |
| BHP Group Ltd., Sponsored ADR | 3.0% |
Material Fund Changes
This is a summary of certain changes to the Fund since May 1, 2025. For more comprehensive information, you may review the Fund's prospectus and any applicable supplements at crossmarkglobal.com/stewardfunds/ or by contacting 888-845-6910.
Effective July 31, 2025, the name of the Fund was changed from Steward International Enhanced Index Fund to Steward Values Enhanced International Fund. In addition to the name change, the Fund also (i) eliminated its investment policy that, under normal circumstances, the Fund invests at least 80% of its assets in the securities of companies included in the S&P International 700 ADR Index (however, the Fund still invests at least 80% of its assets in the securities of non-U.S. companies) and (ii) amended its investment process to provide for the upweighting of a certain number of portfolio companies, relative to their weightings in the Blended Benchmark Index, based on their positive value scores.
This is a summary of certain changes to the Fund since May 1, 2025. For more comprehensive information, you may review the Fund's prospectus and any applicable supplements at crossmarkglobal.com/stewardfunds/ or by contacting 888-845-6910.
This report describes changes to the Fund that occurred during the reporting period.
What were the Fund costs for the last year?
(Based on a hypothetical $10,000 investment)
| Fund (Class) | Costs of a $10,000 investment | Costs paid as a percentage of a $10,000 investment |
| Steward Values Enhanced International Fund (Class A/SNTKX) |
$118 | 1.02% |
How did the Fund perform last year? What affected the Fund's performance?
Fund and Market Performance
For the fiscal year ended April 30, 2026, the Steward Values Enhanced International Fund (Class A) (the “Fund”) returned 30.39%, underperforming the S&P International 700 ADR Index (the “Benchmark”) return of 43.62%. For comparison purposes, the return for the Fund’s secondary benchmark (the "Blended Benchmark Index"), comprised of the S&P Developed Markets ADR Index (85%) and the S&P Emerging 50 ADR Index (15%), returned 32.26% for the period.
Positive and negative contributors to performance
The Fund’s dual market structure kept the same allocation to emerging markets during the fiscal year: 80% allocated toward non-U.S. developed markets (DM) and 20% toward emerging markets (EM). As a reminder, the Fund’s dual market structure has historically tilted its EM allocation between 10-20% of total net assets, with 15% representing a neutral position. During the year, the allocation to EM positively impacted the Fund by 156 basis points (“bps”) relative to the Blended Benchmark Index.
As it relates to countries, Denmark was the largest positive contributor to relative performance, driven by the Fund’s inability to hold Novo Nordisk. The United Kingdom was the largest negative contributor to relative performance, due to positive performing exclusions, AstraZeneca and British American Tobacco.
The Fund’s values-based screening policies impact performance relative to the Benchmark. For the year fiscal year ended April 30, 2026, the Fund’s values-based screening detracted from relative performance by 252 bps. Not owning large index weights Novartis (32.9%) and AstraZeneca (30.9%), negatively impacted the portfolio by 247 bps. The Fund is unable to hold both due to embryonic stem cell research. Not owning underperforming stocks Novo Nordisk (-34.4%) and Sanofi SA (-11.7%) positively impacted relative performance by 163 bps. Novo Nordisk is removed due to embryonic stem cell research and Sanofi for abortion-related activities.
Fund Performance
The performance graph below shows the performance of a hypothetical $10,000 initial investment in the Fund's Class A over a ten-year period (or for the life of the Fund or share class, if shorter). The subsequent account value as of the end of the reporting period is listed next to the name of the Fund or index, as applicable. The performance table below shows the average annual total returns of the Fund's Class A for the past one-, five- and ten-year periods, as applicable (or for the life of the Fund or share class, if shorter), as of the end of the reporting period. Both the graph and table compare the performance of the Fund's Class A to an appropriate broad-based index and may compare to additional indices reflecting the market segment(s) in which the Fund invests, over the same periods.
GROWTH OF $10,000
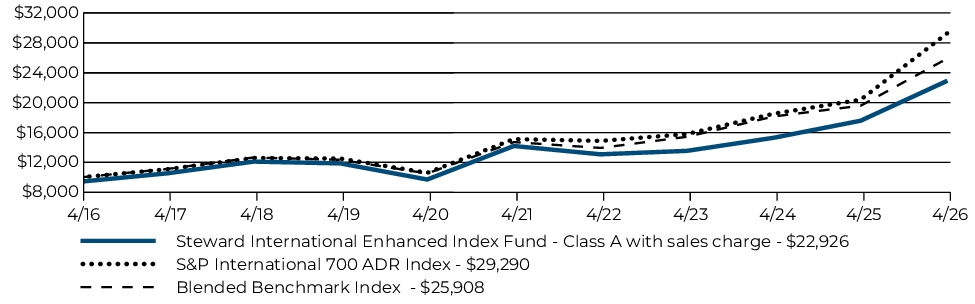
| Average Annual Total Returns | 1 Year | 5 Year | 10 Year |
| Steward Values Enhanced International Fund (Class A/SNTKX) (with maximum 5.75% sales charge) | 22.90% | 8.75% | 8.65% |
| Steward Values Enhanced International Fund (Class A/SNTKX) (without sales charge) | 30.39% | 10.05% | 9.30% |
| S&P International 700 ADR Index | 43.62% | 14.13% | 11.35% |
| Blended Benchmark Index | 32.26% | 11.96% | 9.99% |
The Blended Benchmark Index is comprised of the S&P Developed Markets ADR Index (85%) and the S&P Emerging 50 ADR Index (15%). The Blended Benchmark Index was added as an additional comparative index because the Fund's investment adviser believes the Blended Benchmark Index better represents the Fund's overall investment process.
Key Fund Statistics (April 30, 2026)
| Fund net assets | $301,948,654 |
| Total number of portfolio holdings | 111 |
| Total advisory fees paid | $1,000,945 |
| Portfolio turnover rate as of the end of the reporting period | 59% |
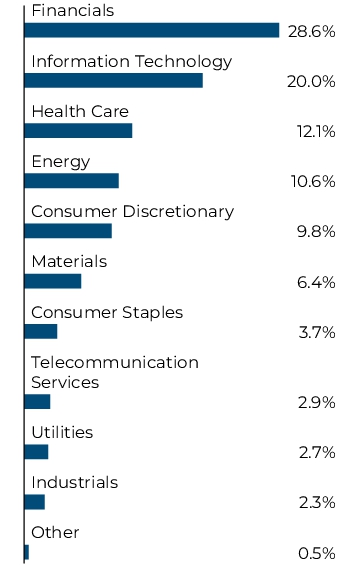
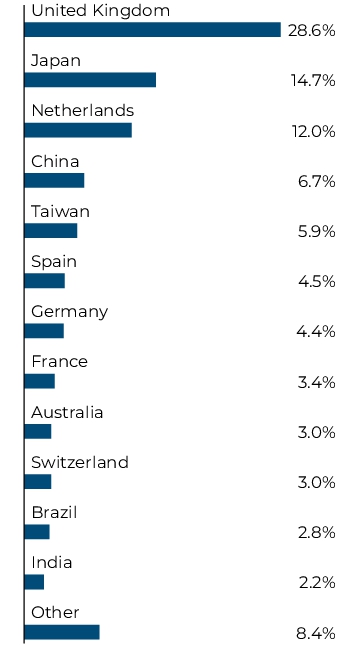
What did the Fund invest in? (April 30, 2026)
The tables below show the investment makeup of the Fund, representing the percentage of the net assets of the Fund.
TOP TEN HOLDINGS
| ASML Holding N.V., Sponsored NYS | 8.0% |
| HSBC Holdings PLC, Sponsored ADR | 4.6% |
| Taiwan Semiconductor Manufacturing Co. Ltd., Sponsored ADR | 4.4% |
| Takeda Pharmaceutical Co. Ltd., ADR | 3.9% |
| Shell PLC, ADR | 3.8% |
| Unilever PLC, Sponsored ADR | 3.5% |
| Mitsubishi UFJ Financial Group, Inc., Sponsored ADR | 3.2% |
| Alibaba Group Holding Ltd., Sponsored ADR | 3.2% |
| TotalEnergies SE | 3.1% |
| BHP Group Ltd., Sponsored ADR | 3.0% |
SECTOR ALLOCATION
GEOGRAPHICAL ALLOCATION
TOP TEN HOLDINGS
| ASML Holding N.V., Sponsored NYS | 8.0% |
| HSBC Holdings PLC, Sponsored ADR | 4.6% |
| Taiwan Semiconductor Manufacturing Co. Ltd., Sponsored ADR | 4.4% |
| Takeda Pharmaceutical Co. Ltd., ADR | 3.9% |
| Shell PLC, ADR | 3.8% |
| Unilever PLC, Sponsored ADR | 3.5% |
| Mitsubishi UFJ Financial Group, Inc., Sponsored ADR | 3.2% |
| Alibaba Group Holding Ltd., Sponsored ADR | 3.2% |
| TotalEnergies SE | 3.1% |
| BHP Group Ltd., Sponsored ADR | 3.0% |
Material Fund Changes
This is a summary of certain changes to the Fund since May 1, 2025. For more comprehensive information, you may review the Fund's prospectus and any applicable supplements at crossmarkglobal.com/stewardfunds/ or by contacting 888-845-6910.
Effective July 31, 2025, the name of the Fund was changed from Steward International Enhanced Index Fund to Steward Values Enhanced International Fund. In addition to the name change, the Fund also (i) eliminated its investment policy that, under normal circumstances, the Fund invests at least 80% of its assets in the securities of companies included in the S&P International 700 ADR Index (however, the Fund still invests at least 80% of its assets in the securities of non-U.S. companies) and (ii) amended its investment process to provide for the upweighting of a certain number of portfolio companies, relative to their weightings in the Blended Benchmark Index, based on their positive value scores.
This is a summary of certain changes to the Fund since May 1, 2025. For more comprehensive information, you may review the Fund's prospectus and any applicable supplements at crossmarkglobal.com/stewardfunds/ or by contacting 888-845-6910.
What were the Fund costs for the last year?
(Based on a hypothetical $10,000 investment)
| Fund (Class) | Costs of a $10,000 investment | Costs paid as a percentage of a $10,000 investment |
| Steward Global Equity Income Fund (Class A/SGIDX) |
$140 | 1.24% |
How did the Fund perform last year? What affected the Fund's performance?
Fund and Market Performance
For the fiscal year ended April 30, 2026, the Steward Global Equity Income Fund (Class A) (the “Fund”) returned 25.33%, underperforming the MSCI World Index (the “Benchmark”) return of 29.68%. For dividend income comparison purposes, the MSCI World High Dividend Yield Index returned 20.82%.
Positive and Negative Contributors to Performance
The Fund’s allocation at the end of the period was 60% U.S. and 40% international. From a country perspective, the U.S. was the largest contributor to performance with a total return of 15.76%. Canada (14.03% of total net assets) was the second largest contributor with a total return of 47.38%. India (0.98% of total net assets) and the Philippines (1.25% of total net assets) were negative contributing countries, with total returns of -23.92% and -8.85% during the period, respectively.
The leading positive stock contributors to performance included Taiwan Semiconductor Manufacturing Co. (3.97% of total net assets), Broadcom Inc. (3.11% of total net assets), and Analog Devices, Inc. (1.86% of total net assets). Total return for these stocks was 139.88%, 118.63%, and 109.55% during the period, respectively. Leading negative stock contributors to performance were Paychex, Inc. (1.53% of total net assets), Accenture PLC (0.94% of total net assets), and Broadridge Financial Solutions, Inc. (1.38% of total net assets). Total return for these stocks was -34.81%, -39.50%, and -35.38% for the period, respectively.
Relative to the Benchmark, performance was negatively impacted from relative underweights in NVIDIA Corp., Alphabet Inc., and Micron Technology which rose 83.27%, 143.15%, and 573.71% during the period, respectively. These stocks were excluded from the Fund because their dividend yields failed to meet longstanding minimum criteria for the strategy.
For the fiscal year ended April 30, 2026, the Fund’s values-based screening policies had a positive impact on performance relative to the Benchmark. For example, the screens restricted UnitedHealth Group from purchase in the Fund due to the company’s Abortion activities as well as Philip Morris International due to its Tobacco business. Total return during the period for these stocks was -7.40% and -0.24%, respectively. Not owning these underperforming stocks positively impacted Fund performance.
Fund Performance
The performance graph below shows the performance of a hypothetical $10,000 initial investment in the Fund's Class A over a ten-year period (or for the life of the Fund or share class, if shorter). The subsequent account value as of the end of the reporting period is listed next to the name of the Fund or index, as applicable. The performance table below shows the average annual total returns of the Fund's Class A for the past one-, five- and ten-year periods, as applicable (or for the life of the Fund or share class, if shorter), as of the end of the reporting period. Both the graph and table compare the performance of the Fund's Class A to an appropriate broad-based index and may compare to additional indices reflecting the market segment(s) in which the Fund invests, over the same periods.
GROWTH OF $10,000
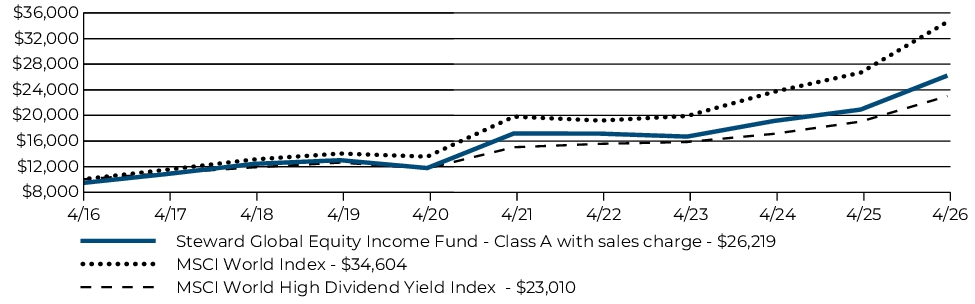
| Average Annual Total Returns | 1 Year | 5 Year | 10 Year |
| Steward Global Equity Income Fund (Class A/SGIDX) (with maximum 5.75% sales charge) | 18.14% | 7.53% | 10.12% |
| Steward Global Equity Income Fund (Class A/SGIDX) (without sales charge) | 25.33% | 8.81% | 10.77% |
| MSCI World Index | 29.68% | 11.80% | 13.22% |
| MSCI World High Dividend Yield Index | 20.82% | 8.87% | 8.69% |
Key Fund Statistics (April 30, 2026)
| Fund net assets | $476,146,579 |
| Total number of portfolio holdings | 66 |
| Total advisory fees paid | $2,768,519 |
| Portfolio turnover rate as of the end of the reporting period | 30% |
What did the Fund invest in? (April 30, 2026)
The tables below show the investment makeup of the Fund, representing the percentage of the net assets of the Fund.
TOP TEN HOLDINGS
| Taiwan Semiconductor Manufacturing Co. Ltd., Sponsored ADR | 4.7% |
| Broadcom, Inc. | 3.8% |
| Analog Devices, Inc. | 2.6% |
| Suncor Energy, Inc. | 2.2% |
| Lloyds Banking Group PLC, ADR | 2.2% |
| HSBC Holdings PLC, Sponsored ADR | 2.2% |
| Banco Bilbao Vizcaya Argentaria SA, Sponsored ADR | 2.1% |
| Gap, Inc. (The) | 2.1% |
| ZTO Express Cayman, Inc., ADR | 2.0% |
| McDonald's Corp. | 2.0% |
SECTOR ALLOCATION
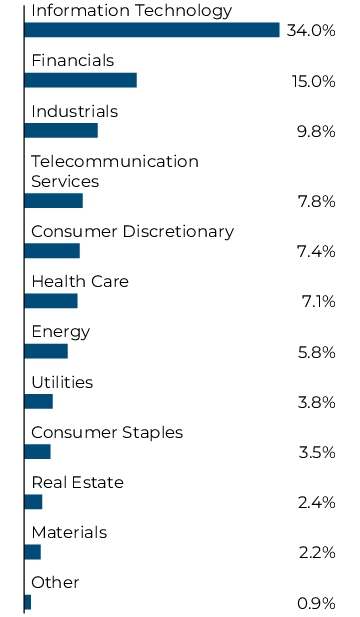
GEOGRAPHICAL ALLOCATION
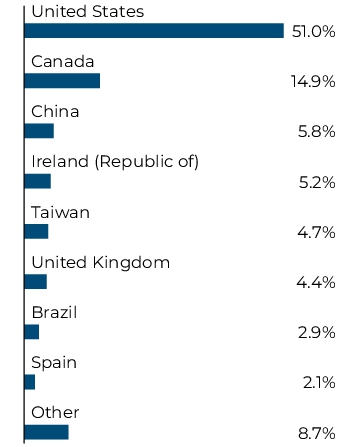
TOP TEN HOLDINGS
| Taiwan Semiconductor Manufacturing Co. Ltd., Sponsored ADR | 4.7% |
| Broadcom, Inc. | 3.8% |
| Analog Devices, Inc. | 2.6% |
| Suncor Energy, Inc. | 2.2% |
| Lloyds Banking Group PLC, ADR | 2.2% |
| HSBC Holdings PLC, Sponsored ADR | 2.2% |
| Banco Bilbao Vizcaya Argentaria SA, Sponsored ADR | 2.1% |
| Gap, Inc. (The) | 2.1% |
| ZTO Express Cayman, Inc., ADR | 2.0% |
| McDonald's Corp. | 2.0% |
What were the Fund costs for the last year?
(Based on a hypothetical $10,000 investment)
| Fund (Class) | Costs of a $10,000 investment | Costs paid as a percentage of a $10,000 investment |
| Steward Global Equity Income Fund (Class C/SGIFX) |
$221 | 1.97% |
How did the Fund perform last year? What affected the Fund's performance?
Fund and Market Performance
For the fiscal year ended April 30, 2026, the Steward Global Equity Income Fund (Class C) (the “Fund”) returned 24.42%, underperforming the MSCI World Index (the “Benchmark”) return of 29.68%. For dividend income comparison purposes, the MSCI World High Dividend Yield Index returned 20.82%.
Positive and Negative Contributors to Performance
The Fund’s allocation at the end of the period was 60% U.S. and 40% international. From a country perspective, the U.S. was the largest contributor to performance with a total return of 15.76%. Canada (14.03% of total net assets) was the second largest contributor with a total return of 47.38%. India (0.98% of total net assets) and the Philippines (1.25% of total net assets) were negative contributing countries, with total returns of -23.92% and -8.85% during the period, respectively.
The leading positive stock contributors to performance included Taiwan Semiconductor Manufacturing Co. (3.97% of total net assets), Broadcom Inc. (3.11% of total net assets), and Analog Devices, Inc. (1.86% of total net assets). Total return for these stocks was 139.88%, 118.63%, and 109.55% during the period, respectively. Leading negative stock contributors to performance were Paychex, Inc. (1.53% of total net assets), Accenture PLC (0.94% of total net assets), and Broadridge Financial Solutions, Inc. (1.38% of total net assets). Total return for these stocks was -34.81%, -39.50%, and -35.38% for the period, respectively.
Relative to the Benchmark, performance was negatively impacted from relative underweights in NVIDIA Corp., Alphabet Inc., and Micron Technology which rose 83.27%, 143.15%, and 573.71% during the period, respectively. These stocks were excluded from the Fund because their dividend yields failed to meet longstanding minimum criteria for the strategy.
For the fiscal year ended April 30, 2026, the Fund’s values-based screening policies had a positive impact on performance relative to the Benchmark. For example, the screens restricted UnitedHealth Group from purchase in the Fund due to the company’s Abortion activities as well as Philip Morris International due to its Tobacco business. Total return during the period for these stocks was -7.40% and -0.24%, respectively. Not owning these underperforming stocks positively impacted Fund performance.
Fund Performance
The performance graph below shows the performance of a hypothetical $10,000 initial investment in the Fund's Class C over a ten-year period (or for the life of the Fund or share class, if shorter). The subsequent account value as of the end of the reporting period is listed next to the name of the Fund or index, as applicable. The performance table below shows the average annual total returns of the Fund's Class C for the past one-, five- and ten-year periods, as applicable (or for the life of the Fund or share class, if shorter), as of the end of the reporting period. Both the graph and table compare the performance of the Fund's Class C to an appropriate broad-based index and may compare to additional indices reflecting the market segment(s) in which the Fund invests, over the same periods.
GROWTH OF $10,000
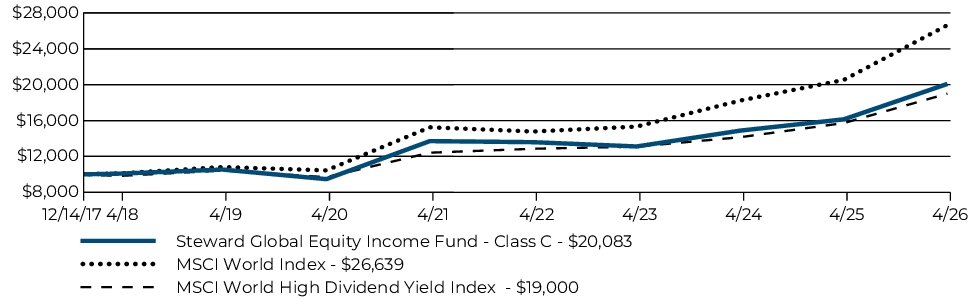
| Average Annual Total Returns | 1 Year | 5 Year | Since Inception |
| Steward Global Equity Income Fund (Class C/SGIFX) (with maximum 1.00% CDSC sales charge) | 23.42% | 7.93% | 8.68% |
| Steward Global Equity Income Fund (Class C/SGIFX) (without sales charge) | 24.42% | 7.93% | 8.68% |
| MSCI World Index | 29.68% | 11.80% | 12.41% |
| MSCI World High Dividend Yield Index | 20.82% | 8.87% | 7.96% |
Key Fund Statistics (April 30, 2026)
| Fund net assets | $476,146,579 |
| Total number of portfolio holdings | 66 |
| Total advisory fees paid | $2,768,519 |
| Portfolio turnover rate as of the end of the reporting period | 30% |
What did the Fund invest in? (April 30, 2026)
The tables below show the investment makeup of the Fund, representing the percentage of the net assets of the Fund.
TOP TEN HOLDINGS
| Taiwan Semiconductor Manufacturing Co. Ltd., Sponsored ADR | 4.7% |
| Broadcom, Inc. | 3.8% |
| Analog Devices, Inc. | 2.6% |
| Suncor Energy, Inc. | 2.2% |
| Lloyds Banking Group PLC, ADR | 2.2% |
| HSBC Holdings PLC, Sponsored ADR | 2.2% |
| Banco Bilbao Vizcaya Argentaria SA, Sponsored ADR | 2.1% |
| Gap, Inc. (The) | 2.1% |
| ZTO Express Cayman, Inc., ADR | 2.0% |
| McDonald's Corp. | 2.0% |
SECTOR ALLOCATION
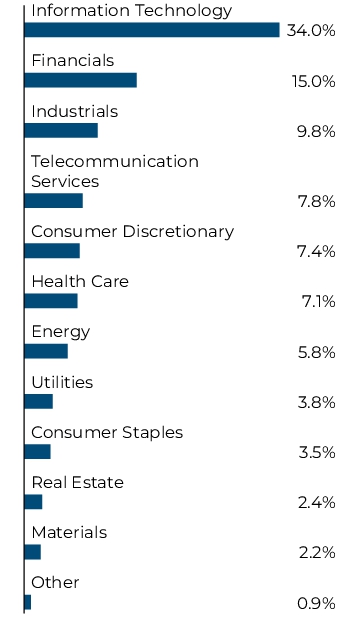
GEOGRAPHICAL ALLOCATION
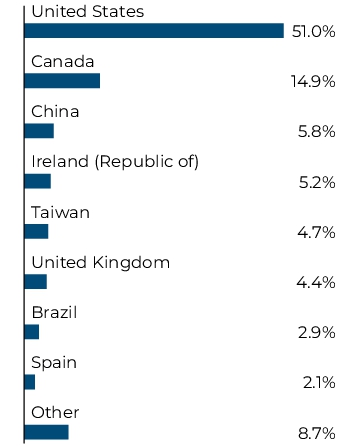
TOP TEN HOLDINGS
| Taiwan Semiconductor Manufacturing Co. Ltd., Sponsored ADR | 4.7% |
| Broadcom, Inc. | 3.8% |
| Analog Devices, Inc. | 2.6% |
| Suncor Energy, Inc. | 2.2% |
| Lloyds Banking Group PLC, ADR | 2.2% |
| HSBC Holdings PLC, Sponsored ADR | 2.2% |
| Banco Bilbao Vizcaya Argentaria SA, Sponsored ADR | 2.1% |
| Gap, Inc. (The) | 2.1% |
| ZTO Express Cayman, Inc., ADR | 2.0% |
| McDonald's Corp. | 2.0% |
What were the Fund costs for the last year?
(Based on a hypothetical $10,000 investment)
| Fund (Class) | Costs of a $10,000 investment | Costs paid as a percentage of a $10,000 investment |
| Steward Global Equity Income Fund (Class R6/SGIGX) |
$98 | 0.87% |
How did the Fund perform last year? What affected the Fund's performance?
Fund and Market Performance
For the fiscal year ended April 30, 2026, the Steward Global Equity Income Fund (Class R6) (the “Fund”) returned 25.80%, underperforming the MSCI World Index (the “Benchmark”) return of 29.68%. For dividend income comparison purposes, the MSCI World High Dividend Yield Index returned 20.82%.
Positive and Negative Contributors to Performance
The Fund’s allocation at the end of the period was 60% U.S. and 40% international. From a country perspective, the U.S. was the largest contributor to performance with a total return of 15.76%. Canada (14.03% of total net assets) was the second largest contributor with a total return of 47.38%. India (0.98% of total net assets) and the Philippines (1.25% of total net assets) were negative contributing countries, with total returns of -23.92% and -8.85% during the period, respectively.
The leading positive stock contributors to performance included Taiwan Semiconductor Manufacturing Co. (3.97% of total net assets), Broadcom Inc. (3.11% of total net assets), and Analog Devices, Inc. (1.86% of total net assets). Total return for these stocks was 139.88%, 118.63%, and 109.55% during the period, respectively. Leading negative stock contributors to performance were Paychex, Inc. (1.53% of total net assets), Accenture PLC (0.94% of total net assets), and Broadridge Financial Solutions, Inc. (1.38% of total net assets). Total return for these stocks was -34.81%, -39.50%, and -35.38% for the period, respectively.
Relative to the Benchmark, performance was negatively impacted from relative underweights in NVIDIA Corp., Alphabet Inc., and Micron Technology which rose 83.27%, 143.15%, and 573.71% during the period, respectively. These stocks were excluded from the Fund because their dividend yields failed to meet longstanding minimum criteria for the strategy.
For the fiscal year ended April 30, 2026, the Fund’s values-based screening policies had a positive impact on performance relative to the Benchmark. For example, the screens restricted UnitedHealth Group from purchase in the Fund due to the company’s Abortion activities as well as Philip Morris International due to its Tobacco business. Total return during the period for these stocks was -7.40% and -0.24%, respectively. Not owning these underperforming stocks positively impacted Fund performance.
Fund Performance
The performance graph below shows the performance of a hypothetical $10,000 initial investment in the Fund's Class R6 over a ten-year period (or for the life of the Fund or share class, if shorter). The subsequent account value as of the end of the reporting period is listed next to the name of the Fund or index, as applicable. The performance table below shows the average annual total returns of the Fund's Class R6 for the past one-, five- and ten-year periods, as applicable (or for the life of the Fund or share class, if shorter), as of the end of the reporting period. Both the graph and table compare the performance of the Fund's Class R6 to an appropriate broad-based index and may compare to additional indices reflecting the market segment(s) in which the Fund invests, over the same periods.
GROWTH OF $10,000
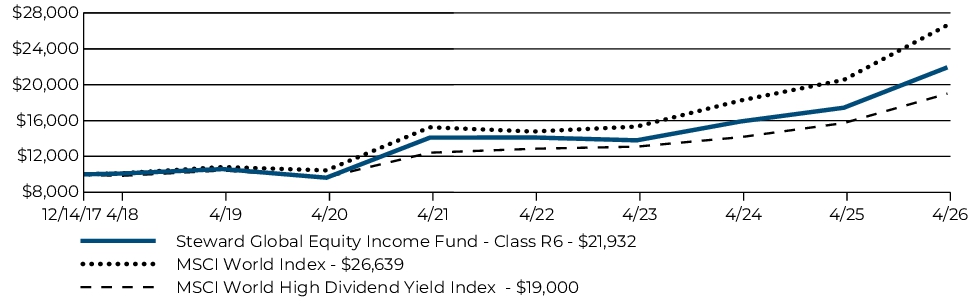
| Average Annual Total Returns | 1 Year | 5 Year | Since Inception |
| Steward Global Equity Income Fund (Class R6/SGIGX) | 25.80% | 9.24% | 9.83% |
| MSCI World Index | 29.68% | 11.80% | 12.41% |
| MSCI World High Dividend Yield Index | 20.82% | 8.87% | 7.96% |
Key Fund Statistics (April 30, 2026)
| Fund net assets | $476,146,579 |
| Total number of portfolio holdings | 66 |
| Total advisory fees paid | $2,768,519 |
| Portfolio turnover rate as of the end of the reporting period | 30% |
What did the Fund invest in? (April 30, 2026)
The tables below show the investment makeup of the Fund, representing the percentage of the net assets of the Fund.
TOP TEN HOLDINGS
| Taiwan Semiconductor Manufacturing Co. Ltd., Sponsored ADR | 4.7% |
| Broadcom, Inc. | 3.8% |
| Analog Devices, Inc. | 2.6% |
| Suncor Energy, Inc. | 2.2% |
| Lloyds Banking Group PLC, ADR | 2.2% |
| HSBC Holdings PLC, Sponsored ADR | 2.2% |
| Banco Bilbao Vizcaya Argentaria SA, Sponsored ADR | 2.1% |
| Gap, Inc. (The) | 2.1% |
| ZTO Express Cayman, Inc., ADR | 2.0% |
| McDonald's Corp. | 2.0% |
SECTOR ALLOCATION
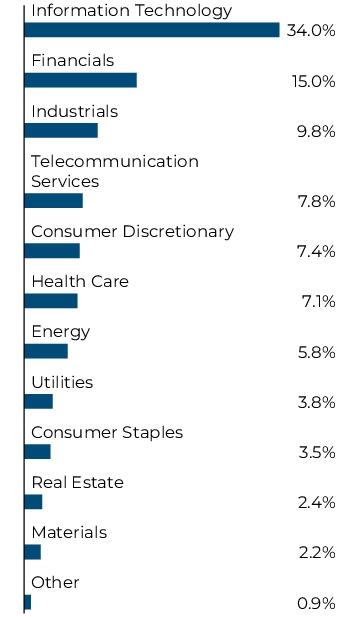
GEOGRAPHICAL ALLOCATION
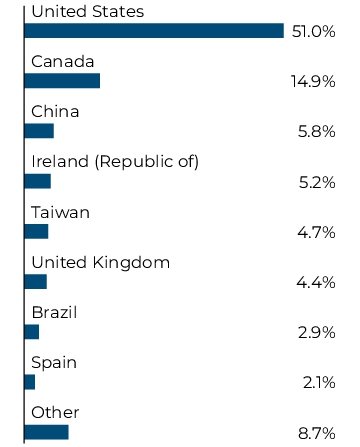
TOP TEN HOLDINGS
| Taiwan Semiconductor Manufacturing Co. Ltd., Sponsored ADR | 4.7% |
| Broadcom, Inc. | 3.8% |
| Analog Devices, Inc. | 2.6% |
| Suncor Energy, Inc. | 2.2% |
| Lloyds Banking Group PLC, ADR | 2.2% |
| HSBC Holdings PLC, Sponsored ADR | 2.2% |
| Banco Bilbao Vizcaya Argentaria SA, Sponsored ADR | 2.1% |
| Gap, Inc. (The) | 2.1% |
| ZTO Express Cayman, Inc., ADR | 2.0% |
| McDonald's Corp. | 2.0% |
What were the Fund costs for the last year?
(Based on a hypothetical $10,000 investment)
| Fund (Class) | Costs of a $10,000 investment | Costs paid as a percentage of a $10,000 investment |
| Steward Global Equity Income Fund (Institutional Class/SGISX) |
$112 | 0.99% |
How did the Fund perform last year? What affected the Fund's performance?
Fund and Market Performance
For the fiscal year ended April 30, 2026, the Steward Global Equity Income Fund (Institutional Class) (the “Fund”) returned 25.64%, underperforming the MSCI World Index (the “Benchmark”) return of 29.68%. For dividend income comparison purposes, the MSCI World High Dividend Yield Index returned 20.82%.
Positive and Negative Contributors to Performance
The Fund’s allocation at the end of the period was 60% U.S. and 40% international. From a country perspective, the U.S. was the largest contributor to performance with a total return of 15.76%. Canada (14.03% of total net assets) was the second largest contributor with a total return of 47.38%. India (0.98% of total net assets) and the Philippines (1.25% of total net assets) were negative contributing countries, with total returns of -23.92% and -8.85% during the period, respectively.
The leading positive stock contributors to performance included Taiwan Semiconductor Manufacturing Co. (3.97% of total net assets), Broadcom Inc. (3.11% of total net assets), and Analog Devices, Inc. (1.86% of total net assets). Total return for these stocks was 139.88%, 118.63%, and 109.55% during the period, respectively. Leading negative stock contributors to performance were Paychex, Inc. (1.53% of total net assets), Accenture PLC (0.94% of total net assets), and Broadridge Financial Solutions, Inc. (1.38% of total net assets). Total return for these stocks was -34.81%, -39.50%, and -35.38% for the period, respectively.
Relative to the Benchmark, performance was negatively impacted from relative underweights in NVIDIA Corp., Alphabet Inc., and Micron Technology which rose 83.27%, 143.15%, and 573.71% during the period, respectively. These stocks were excluded from the Fund because their dividend yields failed to meet longstanding minimum criteria for the strategy.
For the fiscal year ended April 30, 2026, the Fund’s values-based screening policies had a positive impact on performance relative to the Benchmark. For example, the screens restricted UnitedHealth Group from purchase in the Fund due to the company’s Abortion activities as well as Philip Morris International due to its Tobacco business. Total return during the period for these stocks was -7.40% and -0.24%, respectively. Not owning these underperforming stocks positively impacted Fund performance.
Fund Performance
The performance graph below shows the performance of a hypothetical $100,000 initial investment in the Fund's Institutional Class over a ten-year period (or for the life of the Fund or share class, if shorter). The subsequent account value as of the end of the reporting period is listed next to the name of the Fund or index, as applicable. The performance table below shows the average annual total returns of the Fund's Institutional Class for the past one-, five- and ten-year periods, as applicable (or for the life of the Fund or share class, if shorter), as of the end of the reporting period. Both the graph and table compare the performance of the Fund's Institutional Class to an appropriate broad-based index and may compare to additional indices reflecting the market segment(s) in which the Fund invests, over the same periods.
GROWTH OF $100,000
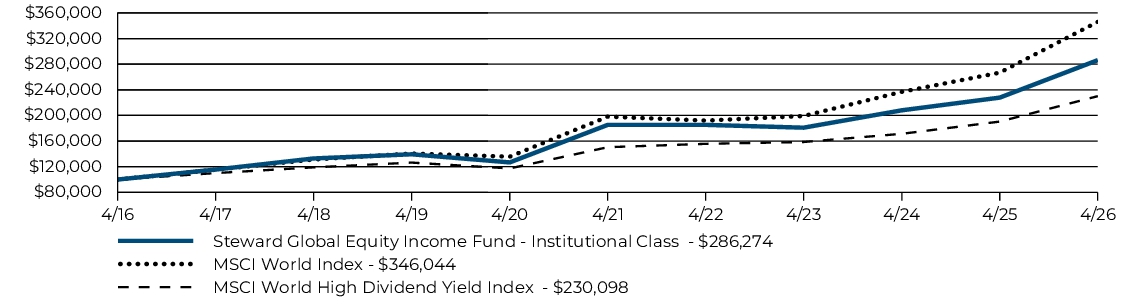
| Average Annual Total Returns | 1 Year | 5 Year | 10 Year |
| Steward Global Equity Income Fund (Institutional Class/SGISX) | 25.64% | 9.09% | 11.09% |
| MSCI World Index | 29.68% | 11.80% | 13.22% |
| MSCI World High Dividend Yield Index | 20.82% | 8.87% | 8.69% |
Key Fund Statistics (April 30, 2026)
| Fund net assets | $476,146,579 |
| Total number of portfolio holdings | 66 |
| Total advisory fees paid | $2,768,519 |
| Portfolio turnover rate as of the end of the reporting period | 30% |
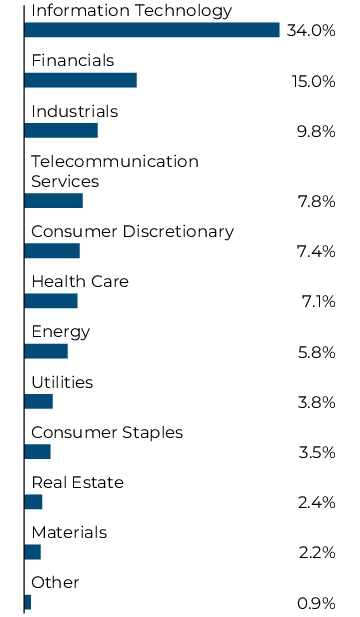
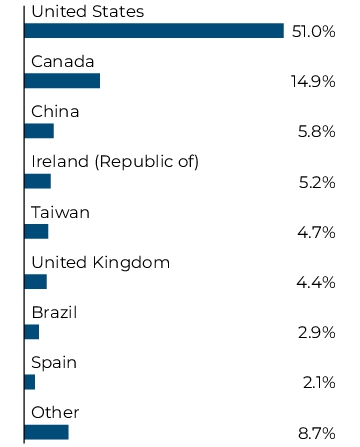
What did the Fund invest in? (April 30, 2026)
The tables below show the investment makeup of the Fund, representing the percentage of the net assets of the Fund.
TOP TEN HOLDINGS
| Taiwan Semiconductor Manufacturing Co. Ltd., Sponsored ADR | 4.7% |
| Broadcom, Inc. | 3.8% |
| Analog Devices, Inc. | 2.6% |
| Suncor Energy, Inc. | 2.2% |
| Lloyds Banking Group PLC, ADR | 2.2% |
| HSBC Holdings PLC, Sponsored ADR | 2.2% |
| Banco Bilbao Vizcaya Argentaria SA, Sponsored ADR | 2.1% |
| Gap, Inc. (The) | 2.1% |
| ZTO Express Cayman, Inc., ADR | 2.0% |
| McDonald's Corp. | 2.0% |
SECTOR ALLOCATION
GEOGRAPHICAL ALLOCATION
TOP TEN HOLDINGS
| Taiwan Semiconductor Manufacturing Co. Ltd., Sponsored ADR | 4.7% |
| Broadcom, Inc. | 3.8% |
| Analog Devices, Inc. | 2.6% |
| Suncor Energy, Inc. | 2.2% |
| Lloyds Banking Group PLC, ADR | 2.2% |
| HSBC Holdings PLC, Sponsored ADR | 2.2% |
| Banco Bilbao Vizcaya Argentaria SA, Sponsored ADR | 2.1% |
| Gap, Inc. (The) | 2.1% |
| ZTO Express Cayman, Inc., ADR | 2.0% |
| McDonald's Corp. | 2.0% |
What were the Fund costs for the last year?
(Based on a hypothetical $10,000 investment)
| Fund (Class) | Costs of a $10,000 investment | Costs paid as a percentage of a $10,000 investment |
| Steward Values Enhanced Small-Mid Cap Fund (Institutional Class/SCECX) |
$71 | 0.61% |
How did the Fund perform last year? What affected the Fund's performance?
FUND AND MARKET PERFORMANCE
For the fiscal year ended April 30, 2026, the Steward Values Enhanced Small-Mid Cap Fund (Institutional Class) (the “Fund”) returned 32.13%, underperforming the S&P 1000 Index (the “Benchmark”) return of 32.43%.
Positive and negative contributors to performance
The Fund implements a strategy to upweight companies that score at the top of its positive value score rankings. At fiscal year end, the Fund screened out 4.6% of the Benchmark weight; therefore, the Fund upweighted 46 companies by at least 10 basis points (“bps”) each.
The performance of the Fund can also be affected by its values-based screening policies. For the fiscal year ended April 30, 2026, the Fund’s values-based screening policies had a negative performance impact of 72 bps. Not owning companies such as Casey’s General Stores (64.6%), Tenet Healthcare (23.9%) and Carlyle Group (33.0%) detracted 44 bps collectively. Casey’s General Stores is excluded due to alcohol and tobacco sales while Tenet Healthcare and Carlyle Group are both removed for owning abortion related facilities.
On the positive side, not owning Corcept Therapeutics (-35.3%) and Medical Properties Trust (-4.0%) added 7 bps of relative performance. Both names are removed for abortion-related activities.
Fund Performance
The performance graph below shows the performance of a hypothetical $100,000 initial investment in the Fund's Institutional Class over a ten-year period (or for the life of the Fund or share class, if shorter). The subsequent account value as of the end of the reporting period is listed next to the name of the Fund or index, as applicable. The performance table below shows the average annual total returns of the Fund's Institutional Class for the past one-, five- and ten-year periods, as applicable (or for the life of the Fund or share class, if shorter), as of the end of the reporting period. Both the graph and table compare the performance of the Fund's Institutional Class to an appropriate broad-based index and may compare to additional indices reflecting the market segment(s) in which the Fund invests, over the same periods.
GROWTH OF $100,000
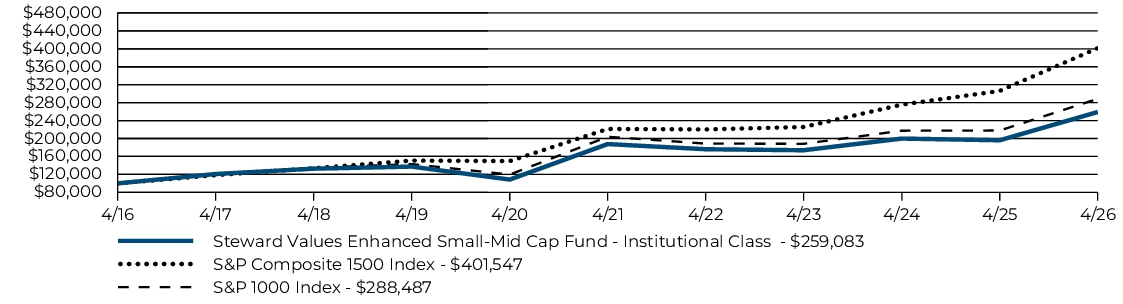
| Average Annual Total Returns | 1 Year | 5 Year | 10 Year |
| Steward Values Enhanced Small-Mid Cap Fund (Institutional Class/SCECX) | 32.13% | 6.67% | 9.99% |
| S&P Composite 1500 Index | 31.05% | 12.65% | 14.92% |
| S&P 1000 Index | 32.43% | 7.19% | 11.18% |
Key Fund Statistics (April 30, 2026)
| Fund net assets | $189,447,273 |
| Total number of portfolio holdings | 842 |
| Total advisory fees paid | $387,139 |
| Portfolio turnover rate as of the end of the reporting period | 27% |
What did the Fund invest in? (April 30, 2026)
The tables below show the investment makeup of the Fund, representing the percentage of the net assets of the Fund.
TOP TEN HOLDINGS
| US Foods Holding Corp. | 0.7% |
| nVent Electric PLC | 0.6% |
| MasTec, Inc. | 0.5% |
| Royal Gold, Inc. | 0.5% |
| Curtiss-Wright Corp. | 0.5% |
| ATI, Inc. | 0.5% |
| RB Global, Inc. | 0.5% |
| Everpure, Inc., Class A | 0.5% |
| XPO, Inc. | 0.5% |
| Woodward, Inc. | 0.5% |
SECTOR ALLOCATION
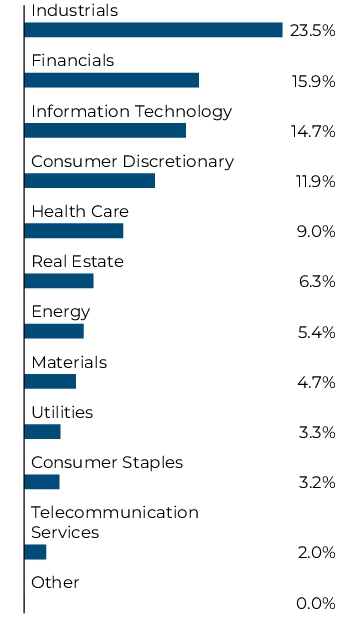
TOP TEN HOLDINGS
| US Foods Holding Corp. | 0.7% |
| nVent Electric PLC | 0.6% |
| MasTec, Inc. | 0.5% |
| Royal Gold, Inc. | 0.5% |
| Curtiss-Wright Corp. | 0.5% |
| ATI, Inc. | 0.5% |
| RB Global, Inc. | 0.5% |
| Everpure, Inc., Class A | 0.5% |
| XPO, Inc. | 0.5% |
| Woodward, Inc. | 0.5% |
What were the Fund costs for the last year?
(Based on a hypothetical $10,000 investment)
| Fund (Class) | Costs of a $10,000 investment | Costs paid as a percentage of a $10,000 investment |
| Steward Values Enhanced Small-Mid Cap Fund (Class R6/SSMOX) |
$57 | 0.49% |
How did the Fund perform last year? What affected the Fund's performance?
FUND AND MARKET PERFORMANCE
For the fiscal year ended April 30, 2026, the Steward Values Enhanced Small-Mid Cap Fund (Class R6) (the “Fund”) returned 32.31%, underperforming the S&P 1000 Index (the “Benchmark”) return of 32.43%.
Positive and negative contributors to performance
The Fund implements a strategy to upweight companies that score at the top of its positive value score rankings. At fiscal year end, the Fund screened out 4.6% of the Benchmark weight; therefore, the Fund upweighted 46 companies by at least 10 basis points (“bps”) each.
The performance of the Fund can also be affected by its values-based screening policies. For the fiscal year ended April 30, 2026, the Fund’s values-based screening policies had a negative performance impact of 72 bps. Not owning companies such as Casey’s General Stores (64.6%), Tenet Healthcare (23.9%) and Carlyle Group (33.0%) detracted 44 bps collectively. Casey’s General Stores is excluded due to alcohol and tobacco sales while Tenet Healthcare and Carlyle Group are both removed for owning abortion related facilities.
On the positive side, not owning Corcept Therapeutics (-35.3%) and Medical Properties Trust (-4.0%) added 7 bps of relative performance. Both names are removed for abortion-related activities.
Fund Performance
The performance graph below shows the performance of a hypothetical $10,000 initial investment in the Fund's Class R6 over a ten-year period (or for the life of the Fund or share class, if shorter). The subsequent account value as of the end of the reporting period is listed next to the name of the Fund or index, as applicable. The performance table below shows the average annual total returns of the Fund's Class R6 for the past one-, five- and ten-year periods, as applicable (or for the life of the Fund or share class, if shorter), as of the end of the reporting period. Both the graph and table compare the performance of the Fund's Class R6 to an appropriate broad-based index and may compare to additional indices reflecting the market segment(s) in which the Fund invests, over the same periods.
GROWTH OF $10,000
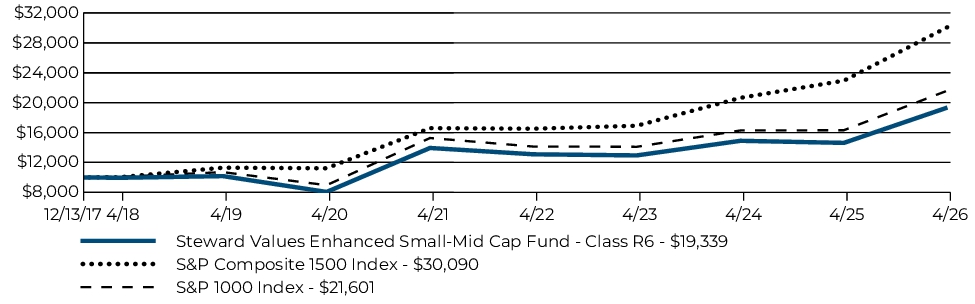
| Average Annual Total Returns | 1 Year | 5 Year | Since Inception |
| Steward Values Enhanced Small-Mid Cap Fund (Class R6/SSMOX) | 32.31% | 6.77% | 8.19% |
| S&P Composite 1500 Index | 31.05% | 12.65% | 14.05% |
| S&P 1000 Index | 32.43% | 7.19% | 9.63% |
Key Fund Statistics (April 30, 2026)
| Fund net assets | $189,447,273 |
| Total number of portfolio holdings | 842 |
| Total advisory fees paid | $387,139 |
| Portfolio turnover rate as of the end of the reporting period | 27% |
What did the Fund invest in? (April 30, 2026)
The tables below show the investment makeup of the Fund, representing the percentage of the net assets of the Fund.
TOP TEN HOLDINGS
| US Foods Holding Corp. | 0.7% |
| nVent Electric PLC | 0.6% |
| MasTec, Inc. | 0.5% |
| Royal Gold, Inc. | 0.5% |
| Curtiss-Wright Corp. | 0.5% |
| ATI, Inc. | 0.5% |
| RB Global, Inc. | 0.5% |
| Everpure, Inc., Class A | 0.5% |
| XPO, Inc. | 0.5% |
| Woodward, Inc. | 0.5% |
SECTOR ALLOCATION
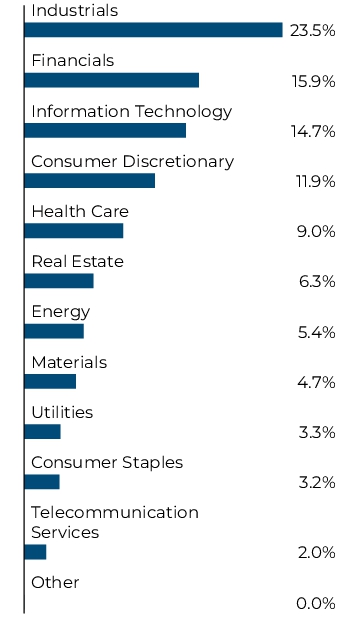
TOP TEN HOLDINGS
| US Foods Holding Corp. | 0.7% |
| nVent Electric PLC | 0.6% |
| MasTec, Inc. | 0.5% |
| Royal Gold, Inc. | 0.5% |
| Curtiss-Wright Corp. | 0.5% |
| ATI, Inc. | 0.5% |
| RB Global, Inc. | 0.5% |
| Everpure, Inc., Class A | 0.5% |
| XPO, Inc. | 0.5% |
| Woodward, Inc. | 0.5% |
What were the Fund costs for the last year?
(Based on a hypothetical $10,000 investment)
| Fund (Class) | Costs of a $10,000 investment | Costs paid as a percentage of a $10,000 investment |
| Steward Values Enhanced Small-Mid Cap Fund (Class A/TRDFX) |
$94 | 0.81% |
How did the Fund perform last year? What affected the Fund's performance?
FUND AND MARKET PERFORMANCE
For the fiscal year ended April 30, 2026, the Steward Values Enhanced Small-Mid Cap Fund (Class A) (the “Fund”) returned 31.84%, underperforming the S&P 1000 Index (the “Benchmark”) return of 32.43%.
Positive and negative contributors to performance
The Fund implements a strategy to upweight companies that score at the top of its positive value score rankings. At fiscal year end, the Fund screened out 4.6% of the Benchmark weight; therefore, the Fund upweighted 46 companies by at least 10 basis points (“bps”) each.
The performance of the Fund can also be affected by its values-based screening policies. For the fiscal year ended April 30, 2026, the Fund’s values-based screening policies had a negative performance impact of 72 bps. Not owning companies such as Casey’s General Stores (64.6%), Tenet Healthcare (23.9%) and Carlyle Group (33.0%) detracted 44 bps collectively. Casey’s General Stores is excluded due to alcohol and tobacco sales while Tenet Healthcare and Carlyle Group are both removed for owning abortion related facilities.
On the positive side, not owning Corcept Therapeutics (-35.3%) and Medical Properties Trust (-4.0%) added 7 bps of relative performance. Both names are removed for abortion-related activities.
Fund Performance
The performance graph below shows the performance of a hypothetical $10,000 initial investment in the Fund's Class A over a ten-year period (or for the life of the Fund or share class, if shorter). The subsequent account value as of the end of the reporting period is listed next to the name of the Fund or index, as applicable. The performance table below shows the average annual total returns of the Fund's Class A for the past one-, five- and ten-year periods, as applicable (or for the life of the Fund or share class, if shorter), as of the end of the reporting period. Both the graph and table compare the performance of the Fund's Class A to an appropriate broad-based index and may compare to additional indices reflecting the market segment(s) in which the Fund invests, over the same periods.
GROWTH OF $10,000
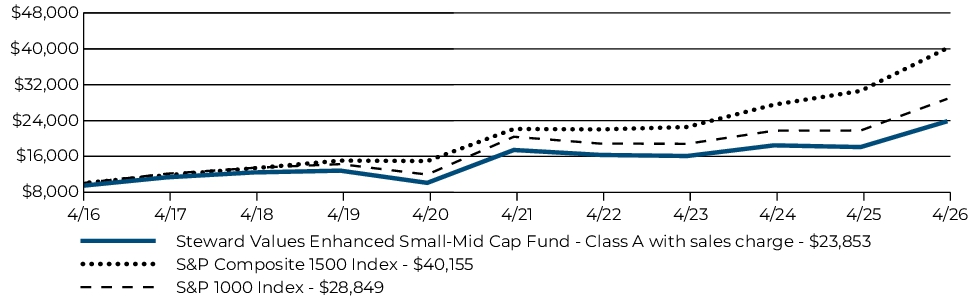
| Average Annual Total Returns | 1 Year | 5 Year | 10 Year |
| Steward Values Enhanced Small-Mid Cap Fund (Class A/TRDFX) (with maximum 5.75% sales charge) | 24.25% | 5.20% | 9.08% |
| Steward Values Enhanced Small-Mid Cap Fund (Class A/TRDFX) (without sales charge) | 31.84% | 6.46% | 9.73% |
| S&P Composite 1500 Index | 31.05% | 12.65% | 14.92% |
| S&P 1000 Index | 32.43% | 7.19% | 11.18% |
Key Fund Statistics (April 30, 2026)
| Fund net assets | $189,447,273 |
| Total number of portfolio holdings | 842 |
| Total advisory fees paid | $387,139 |
| Portfolio turnover rate as of the end of the reporting period | 27% |
What did the Fund invest in? (April 30, 2026)
The tables below show the investment makeup of the Fund, representing the percentage of the net assets of the Fund.
TOP TEN HOLDINGS
| US Foods Holding Corp. | 0.7% |
| nVent Electric PLC | 0.6% |
| MasTec, Inc. | 0.5% |
| Royal Gold, Inc. | 0.5% |
| Curtiss-Wright Corp. | 0.5% |
| ATI, Inc. | 0.5% |
| RB Global, Inc. | 0.5% |
| Everpure, Inc., Class A | 0.5% |
| XPO, Inc. | 0.5% |
| Woodward, Inc. | 0.5% |
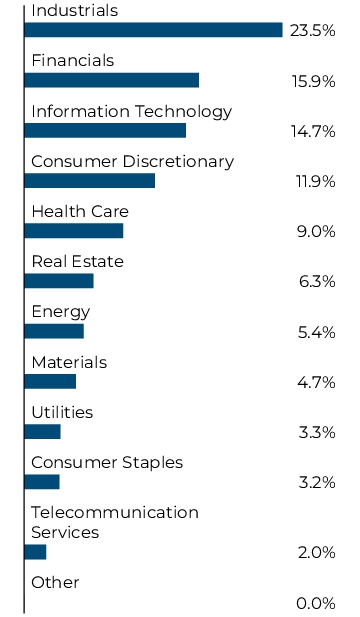
SECTOR ALLOCATION
TOP TEN HOLDINGS
| US Foods Holding Corp. | 0.7% |
| nVent Electric PLC | 0.6% |
| MasTec, Inc. | 0.5% |
| Royal Gold, Inc. | 0.5% |
| Curtiss-Wright Corp. | 0.5% |
| ATI, Inc. | 0.5% |
| RB Global, Inc. | 0.5% |
| Everpure, Inc., Class A | 0.5% |
| XPO, Inc. | 0.5% |
| Woodward, Inc. | 0.5% |
What were the Fund costs for the last year?
(Based on a hypothetical $10,000 investment)
| Fund (Class) | Costs of a $10,000 investment(1) | Costs paid as a percentage of a $10,000 investment(1) |
| Steward Covered Call Income Fund (Class A/SCJAX) |
$137 | 1.25% |
|
(1) |
Reflects applicable expense reimbursements and fee waivers. |
How did the Fund perform last year? What affected the Fund's performance?
Fund and Market Performance
For the fiscal year ended April 30, 2026, the Steward Covered Call Income Fund (Class A) (the “Fund”) returned 18.54%, underperforming the S&P 500 Index (the “Benchmark”) return of 31.05%. The Fund’s secondary benchmark, the Cboe S&P 500 BuyWrite Index (BXM), returned 17.52% over the same period.
Positive and Negative Contributors to Performance
With regards to the performance attribution for the Fund during the fiscal year ended April 30, 2026, there were several sectors and individual stocks worth highlighting. From a sector allocation standpoint for the stock portfolio, the sectors contributing the most to relative performance against the Benchmark were information technology, energy, consumer discretionary and industrials. Detracting the most from relative performance were consumer staples, financials and healthcare. Several stocks that contributed the most to relative performance were Advanced Micro-Devices, Alphabet, Broadcom, Nvidia and Exxon Mobil. Stocks detracting the most from relative performance were SalesForce, ServiceNow and T-Mobile. When considering the values-based screens we apply, the total impact to the Fund by not owning the screened-out companies was a materially positive 81 basis points, with the majority of the net impact coming from our embryonic stem cell research screens and abortion-related screens.
Fund Performance
The performance graph below shows the performance of a hypothetical $10,000 initial investment in the Fund's Class A over a ten-year period (or for the life of the Fund or share class, if shorter). The subsequent account value as of the end of the reporting period is listed next to the name of the Fund or index, as applicable. The performance table below shows the average annual total returns of the Fund's Class A for the past one-, five- and ten-year periods, as applicable (or for the life of the Fund or share class, if shorter), as of the end of the reporting period. Both the graph and table compare the performance of the Fund's Class A to an appropriate broad-based index and may compare to additional indices reflecting the market segment(s) in which the Fund invests, over the same periods.
GROWTH OF $10,000
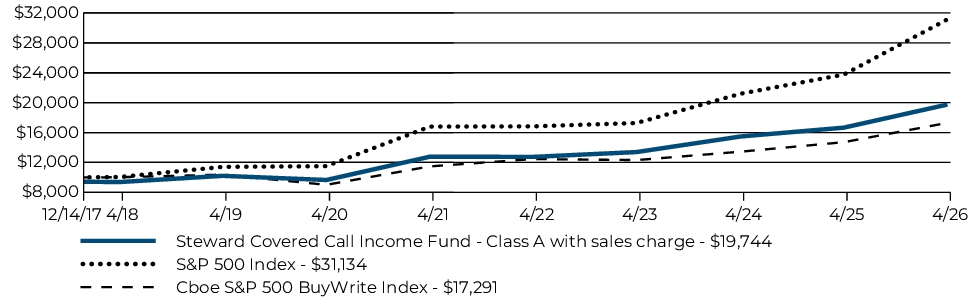
| Average Annual Total Returns | 1 Year | 5 Year | Since Inception |
| Steward Covered Call Income Fund (Class A/SCJAX) (with maximum 5.75% sales charge) | 11.74% | 7.83% | 8.46% |
| Steward Covered Call Income Fund (Class A/SCJAX) (without sales charge) | 18.54% | 9.11% | 9.23% |
| S&P 500 Index | 31.05% | 13.14% | 14.52% |
| Cboe S&P 500 BuyWrite Index | 17.52% | 8.56% | 6.76% |
Key Fund Statistics (April 30, 2026)
| Fund net assets | $121,644,722 |
| Total number of portfolio holdings | 184 |
| Total advisory fees paid, net | $515,394 |
| Portfolio turnover rate as of the end of the reporting period | 86% |
What did the Fund invest in? (April 30, 2026)
The tables below show the investment makeup of the Fund, representing the percentage of the net assets of the Fund.
TOP TEN HOLDINGS
| NVIDIA Corp. | 4.9% |
| Apple, Inc. | 4.8% |
| Amazon.com, Inc. | 4.8% |
| Microsoft Corp. | 4.6% |
| Alphabet, Inc., Class A | 4.0% |
| Broadcom, Inc. | 3.9% |
| Alphabet, Inc., Class C | 3.2% |
| Advanced Micro Devices, Inc. | 2.7% |
| Meta Platforms, Inc., Class A | 2.5% |
| Tesla, Inc. | 2.0% |
SECTOR ALLOCATION
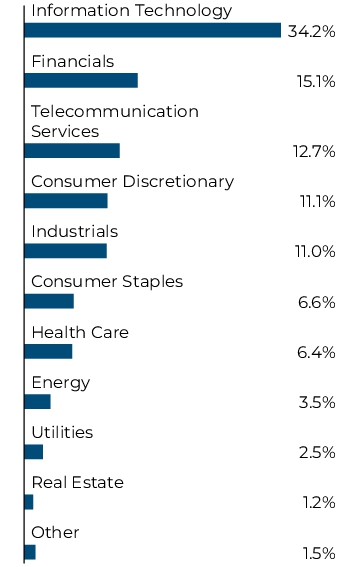
The Fund writes (sells) covered call options on certain securities held.
TOP TEN HOLDINGS
| NVIDIA Corp. | 4.9% |
| Apple, Inc. | 4.8% |
| Amazon.com, Inc. | 4.8% |
| Microsoft Corp. | 4.6% |
| Alphabet, Inc., Class A | 4.0% |
| Broadcom, Inc. | 3.9% |
| Alphabet, Inc., Class C | 3.2% |
| Advanced Micro Devices, Inc. | 2.7% |
| Meta Platforms, Inc., Class A | 2.5% |
| Tesla, Inc. | 2.0% |
What were the Fund costs for the last year?
(Based on a hypothetical $10,000 investment)
| Fund (Class) | Costs of a $10,000 investment(1) | Costs paid as a percentage of a $10,000 investment(1) |
| Steward Covered Call Income Fund (Class C/SCJCX) |
$218 | 2.00% |
|
(1) |
Reflects applicable expense reimbursements and fee waivers. |
How did the Fund perform last year? What affected the Fund's performance?
Fund and Market Performance
For the fiscal year ended April 30, 2026, the Steward Covered Call Income Fund (Class C) (the “Fund”) returned 17.56%, underperforming the S&P 500 Index (the “Benchmark”) return of 31.05%. The Fund’s secondary benchmark, the Cboe S&P 500 BuyWrite Index (BXM), returned 17.52% over the same period.
Positive and Negative Contributors to Performance
With regards to the performance attribution for the Fund during the fiscal year ended April 30, 2026, there were several sectors and individual stocks worth highlighting. From a sector allocation standpoint for the stock portfolio, the sectors contributing the most to relative performance against the Benchmark were information technology, energy, consumer discretionary and industrials. Detracting the most from relative performance were consumer staples, financials and healthcare. Several stocks that contributed the most to relative performance were Advanced Micro-Devices, Alphabet, Broadcom, Nvidia and Exxon Mobil. Stocks detracting the most from relative performance were SalesForce, ServiceNow and T-Mobile. When considering the values-based screens we apply, the total impact to the Fund by not owning the screened-out companies was a materially positive 81 basis points, with the majority of the net impact coming from our embryonic stem cell research screens and abortion-related screens.
Fund Performance
The performance graph below shows the performance of a hypothetical $10,000 initial investment in the Fund's Class C over a ten-year period (or for the life of the Fund or share class, if shorter). The subsequent account value as of the end of the reporting period is listed next to the name of the Fund or index, as applicable. The performance table below shows the average annual total returns of the Fund's Class C for the past one-, five- and ten-year periods, as applicable (or for the life of the Fund or share class, if shorter), as of the end of the reporting period. Both the graph and table compare the performance of the Fund's Class C to an appropriate broad-based index and may compare to additional indices reflecting the market segment(s) in which the Fund invests, over the same periods.
GROWTH OF $10,000
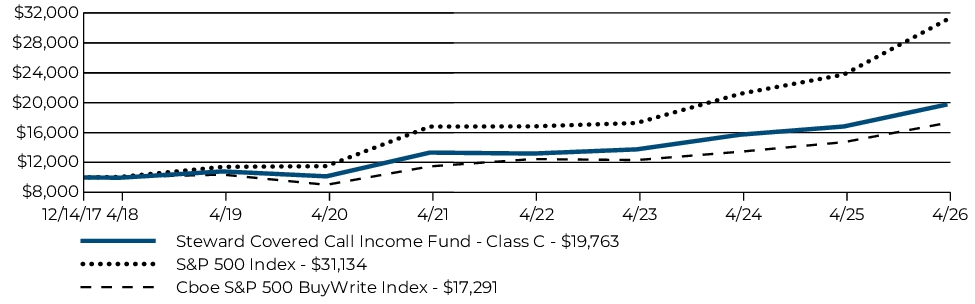
| Average Annual Total Returns | 1 Year | 5 Year | Since Inception |
| Steward Covered Call Income Fund (Class C/SCJCX) (with maximum 1.00% CDSC sales charge) | 16.56% | 8.22% | 8.47% |
| Steward Covered Call Income Fund (Class C/SCJCX) (without sales charge) | 17.56% | 8.22% | 8.47% |
| S&P 500 Index | 31.05% | 13.14% | 14.52% |
| Cboe S&P 500 BuyWrite Index | 17.52% | 8.56% | 6.76% |
Key Fund Statistics (April 30, 2026)
| Fund net assets | $121,644,722 |
| Total number of portfolio holdings | 184 |
| Total advisory fees paid, net | $515,394 |
| Portfolio turnover rate as of the end of the reporting period | 86% |
What did the Fund invest in? (April 30, 2026)
The tables below show the investment makeup of the Fund, representing the percentage of the net assets of the Fund.
TOP TEN HOLDINGS
| NVIDIA Corp. | 4.9% |
| Apple, Inc. | 4.8% |
| Amazon.com, Inc. | 4.8% |
| Microsoft Corp. | 4.6% |
| Alphabet, Inc., Class A | 4.0% |
| Broadcom, Inc. | 3.9% |
| Alphabet, Inc., Class C | 3.2% |
| Advanced Micro Devices, Inc. | 2.7% |
| Meta Platforms, Inc., Class A | 2.5% |
| Tesla, Inc. | 2.0% |
SECTOR ALLOCATION
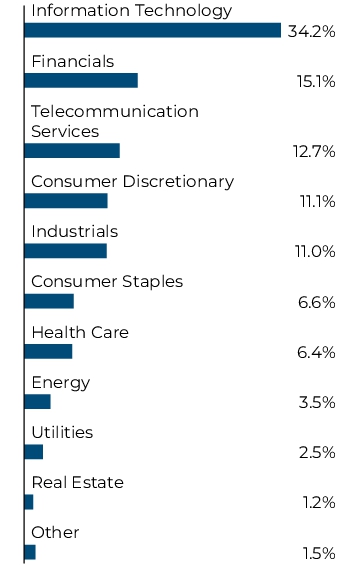
The Fund writes (sells) covered call options on certain securities held.
TOP TEN HOLDINGS
| NVIDIA Corp. | 4.9% |
| Apple, Inc. | 4.8% |
| Amazon.com, Inc. | 4.8% |
| Microsoft Corp. | 4.6% |
| Alphabet, Inc., Class A | 4.0% |
| Broadcom, Inc. | 3.9% |
| Alphabet, Inc., Class C | 3.2% |
| Advanced Micro Devices, Inc. | 2.7% |
| Meta Platforms, Inc., Class A | 2.5% |
| Tesla, Inc. | 2.0% |
What were the Fund costs for the period?
(Based on a hypothetical $10,000 investment)
| Fund (Class) | Costs of a $10,000 investment(1) | Costs paid as a percentage of a $10,000 investment(2) |
| Steward Covered Call Income Fund (Class R6/SCJKX) |
$69 | 1.00% |
|
(1) |
Class R6 shares of the Fund commenced operations on August 28, 2025. Had Class R6 shares of the Fund been in operation for a full year, the cost of a $10,000 investment would have been higher. Reflects applicable expense reimbursements and fee waivers. |
|
(2) |
Annualized. Reflects applicable expense reimbursements and fee waivers. |
How did the Fund perform last year? What affected the Fund's performance?
Fund and Market Performance
For the period August 28, 2025 (commencement of operations) through fiscal year ended April 30, 2026, the Steward Covered Call Income Fund (Class R6) (the “Fund”) returned 6.68%, underperforming the S&P 500 Index (the “Benchmark”) return of 11.76%. The Fund’s secondary benchmark, the Cboe S&P 500 BuyWrite Index (BXM), returned 11.28% over the same period.
Positive and Negative Contributors to Performance
With regards to the performance attribution for the Fund during the fiscal year ended April 30, 2026, there were several sectors and individual stocks worth highlighting. From a sector allocation standpoint for the stock portfolio, the sectors contributing the most to relative performance against the Benchmark were information technology, energy, consumer discretionary and industrials. Detracting the most from relative performance were consumer staples, financials and healthcare. Several stocks that contributed the most to relative performance were Advanced Micro-Devices, Alphabet, Broadcom, Nvidia and Exxon Mobil. Stocks detracting the most from relative performance were SalesForce, ServiceNow and T-Mobile. When considering the values-based screens we apply, the total impact to the Fund by not owning the screened-out companies was a materially positive 81 basis points, with the majority of the net impact coming from our embryonic stem cell research screens and abortion-related screens.
Fund Performance
The performance graph below shows the performance of a hypothetical $10,000 initial investment in the Fund's Class R6 over a ten-year period (or for the life of the Fund or share class, if shorter). The subsequent account value as of the end of the reporting period is listed next to the name of the Fund or index, as applicable. The performance table below shows the average annual total returns of the Fund's Class R6 for the past one-, five- and ten-year periods, as applicable (or for the life of the Fund or share class, if shorter), as of the end of the reporting period. Both the graph and table compare the performance of the Fund's Class R6 to an appropriate broad-based index and may compare to additional indices reflecting the market segment(s) in which the Fund invests, over the same periods.
GROWTH OF $10,000
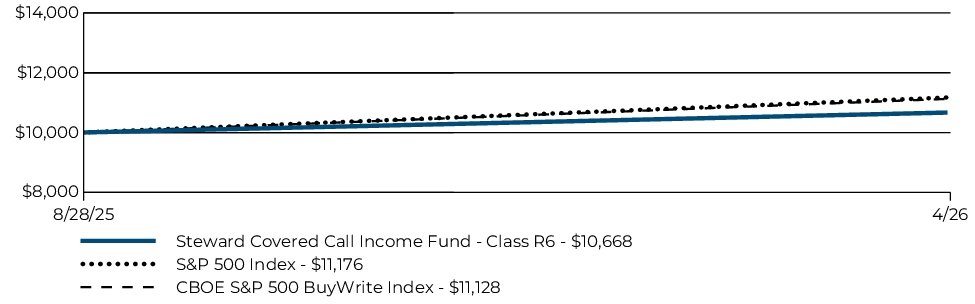
| Average Annual Total Returns | Since Inception |
| Steward Covered Call Income Fund (Class R6/SCJKX) | 6.68% |
| S&P 500 Index | 11.76% |
| Cboe S&P 500 BuyWrite Index | 11.28% |
Key Fund Statistics (April 30, 2026)
| Fund net assets | $121,644,722 |
| Total number of portfolio holdings | 184 |
| Total advisory fees paid, net | $515,394 |
| Portfolio turnover rate as of the end of the reporting period | 86% |
What did the Fund invest in? (April 30, 2026)
The tables below show the investment makeup of the Fund, representing the percentage of the net assets of the Fund.
TOP TEN HOLDINGS
| NVIDIA Corp. | 4.9% |
| Apple, Inc. | 4.8% |
| Amazon.com, Inc. | 4.8% |
| Microsoft Corp. | 4.6% |
| Alphabet, Inc., Class A | 4.0% |
| Broadcom, Inc. | 3.9% |
| Alphabet, Inc., Class C | 3.2% |
| Advanced Micro Devices, Inc. | 2.7% |
| Meta Platforms, Inc., Class A | 2.5% |
| Tesla, Inc. | 2.0% |
SECTOR ALLOCATION
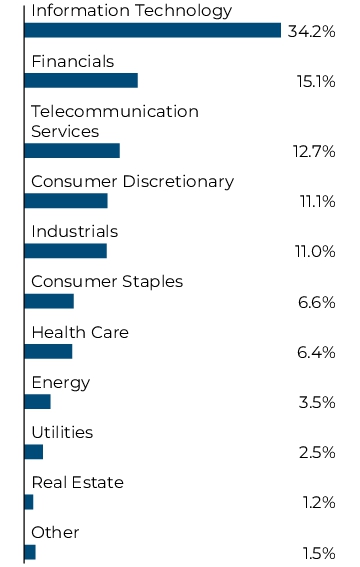
The Fund writes (sells) covered call options on certain securities held.
TOP TEN HOLDINGS
| NVIDIA Corp. | 4.9% |
| Apple, Inc. | 4.8% |
| Amazon.com, Inc. | 4.8% |
| Microsoft Corp. | 4.6% |
| Alphabet, Inc., Class A | 4.0% |
| Broadcom, Inc. | 3.9% |
| Alphabet, Inc., Class C | 3.2% |
| Advanced Micro Devices, Inc. | 2.7% |
| Meta Platforms, Inc., Class A | 2.5% |
| Tesla, Inc. | 2.0% |
What were the Fund costs for the last year?
(Based on a hypothetical $10,000 investment)
| Fund (Class) | Costs of a $10,000 investment(1) | Costs paid as a percentage of a $10,000 investment(1) |
| Steward Covered Call Income Fund (Institutional Class/SCJIX) |
$109 | 1.00% |
|
(1) |
Reflects applicable expense reimbursements and fee waivers. |
How did the Fund perform last year? What affected the Fund's performance?
Fund and Market Performance
For the fiscal year ended April 30, 2026, the Steward Covered Call Income Fund (Institutional Class) (the “Fund”) returned 18.77%, underperforming the S&P 500 Index (the “Benchmark”) return of 31.05%. The Fund’s secondary benchmark, the Cboe S&P 500 BuyWrite Index (BXM), returned 17.52% over the same period.
Positive and Negative Contributors to Performance
With regards to the performance attribution for the Fund during the fiscal year ended April 30, 2026, there were several sectors and individual stocks worth highlighting. From a sector allocation standpoint for the stock portfolio, the sectors contributing the most to relative performance against the Benchmark were information technology, energy, consumer discretionary and industrials. Detracting the most from relative performance were consumer staples, financials and healthcare. Several stocks that contributed the most to relative performance were Advanced Micro-Devices, Alphabet, Broadcom, Nvidia and Exxon Mobil. Stocks detracting the most from relative performance were SalesForce, ServiceNow and T-Mobile. When considering the values-based screens we apply, the total impact to the Fund by not owning the screened-out companies was a materially positive 81 basis points, with the majority of the net impact coming from our embryonic stem cell research screens and abortion-related screens.
Fund Performance
The performance graph below shows the performance of a hypothetical $100,000 initial investment in the Fund's Institutional Class over a ten-year period (or for the life of the Fund or share class, if shorter). The subsequent account value as of the end of the reporting period is listed next to the name of the Fund or index, as applicable. The performance table below shows the average annual total returns of the Fund's Institutional Class for the past one-, five- and ten-year periods, as applicable (or for the life of the Fund or share class, if shorter), as of the end of the reporting period. Both the graph and table compare the performance of the Fund's Institutional Class to an appropriate broad-based index and may compare to additional indices reflecting the market segment(s) in which the Fund invests, over the same periods.
GROWTH OF $100,000
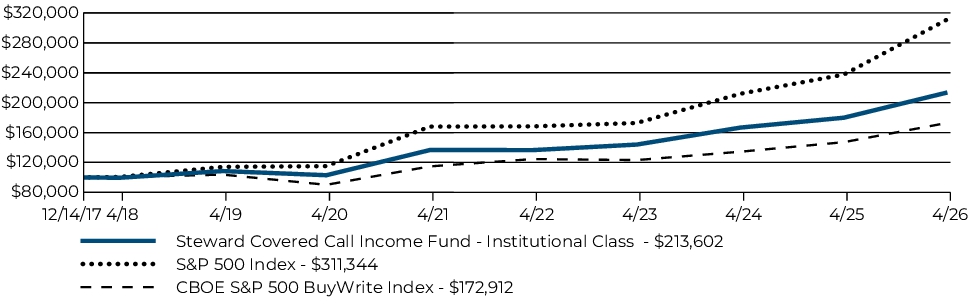
| Average Annual Total Returns | 1 Year | 5 Year | Since Inception |
| Steward Covered Call Income Fund (Institutional Class/SCJIX) | 18.77% | 9.36% | 9.48% |
| S&P 500 Index | 31.05% | 13.14% | 14.52% |
| Cboe S&P 500 BuyWrite Index | 17.52% | 8.56% | 6.76% |
Key Fund Statistics (April 30, 2026)
| Fund net assets | $121,644,722 |
| Total number of portfolio holdings | 184 |
| Total advisory fees paid, net | $515,394 |
| Portfolio turnover rate as of the end of the reporting period | 86% |
What did the Fund invest in? (April 30, 2026)
The tables below show the investment makeup of the Fund, representing the percentage of the net assets of the Fund.
TOP TEN HOLDINGS
| NVIDIA Corp. | 4.9% |
| Apple, Inc. | 4.8% |
| Amazon.com, Inc. | 4.8% |
| Microsoft Corp. | 4.6% |
| Alphabet, Inc., Class A | 4.0% |
| Broadcom, Inc. | 3.9% |
| Alphabet, Inc., Class C | 3.2% |
| Advanced Micro Devices, Inc. | 2.7% |
| Meta Platforms, Inc., Class A | 2.5% |
| Tesla, Inc. | 2.0% |
SECTOR ALLOCATION
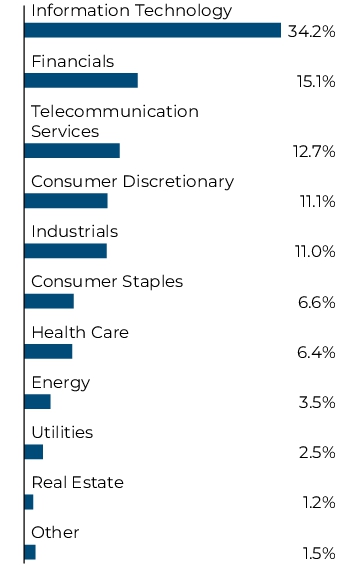
The Fund writes (sells) covered call options on certain securities held.
TOP TEN HOLDINGS
| NVIDIA Corp. | 4.9% |
| Apple, Inc. | 4.8% |
| Amazon.com, Inc. | 4.8% |
| Microsoft Corp. | 4.6% |
| Alphabet, Inc., Class A | 4.0% |
| Broadcom, Inc. | 3.9% |
| Alphabet, Inc., Class C | 3.2% |
| Advanced Micro Devices, Inc. | 2.7% |
| Meta Platforms, Inc., Class A | 2.5% |
| Tesla, Inc. | 2.0% |
What were the Fund costs for the last year?
(Based on a hypothetical $10,000 investment)
| Fund (Class) | Costs of a $10,000 investment | Costs paid as a percentage of a $10,000 investment |
| Steward Equity Market Neutral Fund (Institutional Class/SMNIX) |
$250 | 2.48%(1) |
|
(1) |
Includes the effect of dividend expense and brokerage expense on securities sold short and does not include the proportionate share of expenses and income in the underlying funds in which the Fund invests. |
How did the Fund perform last year? What affected the Fund's Performance
Fund and Market Performance
For the fiscal year ended April 30, 2026, the Steward Equity Market Neutral Fund (Institutional Class) (the “Fund”) returned 1.56%, underperforming the ICE BofA 3 Month US Treasury Bill Index (the “Benchmark” ) return of 3.98%.
Positive and Negative Contributors to Performance
The underperformance of the Fund relative to the Benchmark was significantly influenced by a negative allocation effect, although partially offset by a positive stock selection effect. Specifically, the short positions within the materials and industrials sectors were the largest detractors from performance while short positions within consumer staples and communications services positively impacted performance during the period. The long positions within industrials and consumer discretionary added value for the period only modestly offset by long positions in consumer staples. On an individual stock basis, the largest detractors from performance within the short positions were Five Below, Inc. and MP Materials Corp., while the short positions in Strategy Inc and Liberty Broadband Corp were among the top performers. Within the long positions, GoDaddy, Inc. and H&R Block were the largest detractors from performance while Twilio, Inc., Cummins Inc. and WESCO International were the largest contributors.
Fund Performance
The performance graph below shows the performance of a hypothetical $100,000 initial investment in the Fund's Institutional Class over a ten-year period (or for the life of the Fund or share class, if shorter). The subsequent account value as of the end of the reporting period is listed next to the name of the Fund or index, as applicable. The performance table below shows the average annual total returns of the Fund's Institutional Class for the past one-, five- and ten-year periods, as applicable (or for the life of the Fund or share class, if shorter), as of the end of the reporting period. Both the graph and table compare the performance of the Fund's Institutional Class to an appropriate broad-based index and may compare to additional indices reflecting the market segment(s) in which the Fund invests, over the same periods.
GROWTH OF $100,000
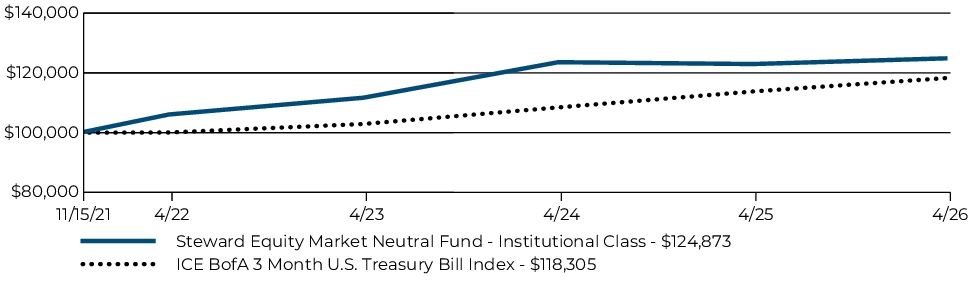
| Average Annual Total Returns | 1 Year | Since Inception |
| Steward Equity Market Neutral Fund (Institutional Class/SMNIX) | 1.56% | 5.11% |
| ICE BofA 3 Month U.S. Treasury Bill Index | 3.98% | 3.85% |
Key Fund Statistics (April 30, 2026)
| Fund net assets | $106,082,568 |
| Total number of portfolio holdings | 227 |
| Total advisory fees paid | $1,077,611 |
| Portfolio turnover rate as of the end of the reporting period | 176% |
What did the Fund invest in? (April 30, 2026)
The tables below show the investment makeup of the Fund, representing the percentage of the net assets of the Fund.
TOP TEN HOLDINGS
| Long: | |
| QUALCOMM, Inc. | 1.1% |
| Western Digital Corp. | 1.0% |
| Weatherford International PLC | 1.0% |
| Chord Energy Corp. | 1.0% |
| TechnipFMC PLC | 0.9% |
| Short: | |
| Aurora Innovation, Inc. | (1.2)% |
| Blue Owl Capital, Inc. | (1.1)% |
| Strategy, Inc. | (1.1)% |
| KKR & Co., Inc. | (1.1)% |
| Atmos Energy Corp. | (1.1)% |
SECTOR ALLOCATION
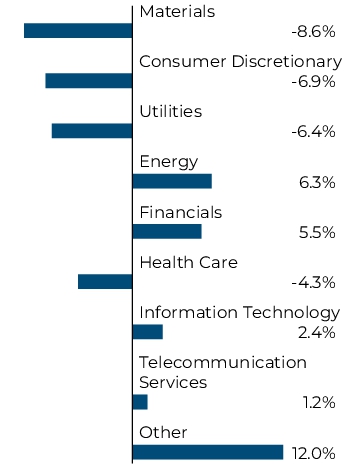
TOP TEN HOLDINGS
| Long: | |
| QUALCOMM, Inc. | 1.1% |
| Western Digital Corp. | 1.0% |
| Weatherford International PLC | 1.0% |
| Chord Energy Corp. | 1.0% |
| TechnipFMC PLC | 0.9% |
| Short: | |
| Aurora Innovation, Inc. | (1.2)% |
| Blue Owl Capital, Inc. | (1.1)% |
| Strategy, Inc. | (1.1)% |
| KKR & Co., Inc. | (1.1)% |
| Atmos Energy Corp. | (1.1)% |
What were the Fund costs for the last year?
(Based on a hypothetical $10,000 investment)
| Fund (Class) | Costs of a $10,000 investment | Costs paid as a percentage of a $10,000 investment |
| Steward Equity Market Neutral Fund (Class A/SMNAX) |
$271 | 2.69%(1) |
|
(1) |
Includes the effect of dividend expense and brokerage expense on securities sold short and does not include the proportionate share of expenses and income in the underlying funds in which the Fund invests. |
How did the Fund perform last year? What affected the Fund's performance?
Fund and Market Performance
For the fiscal year ended April 30, 2026, the Steward Equity Market Neutral Fund (Class A) (the “Fund”) returned 1.34%, underperforming the ICE BofA 3 Month US Treasury Bill Index (the “Benchmark” ) return of 3.98%.
Positive and Negative Contributors to Performance
The underperformance of the Fund relative to the Benchmark was significantly influenced by a negative allocation effect, although partially offset by a positive stock selection effect. Specifically, the short positions within the materials and industrials sectors were the largest detractors from performance while short positions within consumer staples and communications services positively impacted performance during the period. The long positions within industrials and consumer discretionary added value for the period only modestly offset by long positions in consumer staples. On an individual stock basis, the largest detractors from performance within the short positions were Five Below, Inc. and MP Materials Corp., while the short positions in Strategy Inc and Liberty Broadband Corp were among the top performers. Within the long positions, GoDaddy, Inc. and H&R Block were the largest detractors from performance while Twilio, Inc., Cummins Inc. and WESCO International were the largest contributors.
Fund Performance
The performance graph below shows the performance of a hypothetical $10,000 initial investment in the Fund's Class A over a ten-year period (or for the life of the Fund or share class, if shorter). The subsequent account value as of the end of the reporting period is listed next to the name of the Fund or index, as applicable. The performance table below shows the average annual total returns of the Fund's Class A for the past one-, five- and ten-year periods, as applicable (or for the life of the Fund or share class, if shorter), as of the end of the reporting period. Both the graph and table compare the performance of the Fund's Class A to an appropriate broad-based index and may compare to additional indices reflecting the market segment(s) in which the Fund invests, over the same periods.
GROWTH OF $10,000
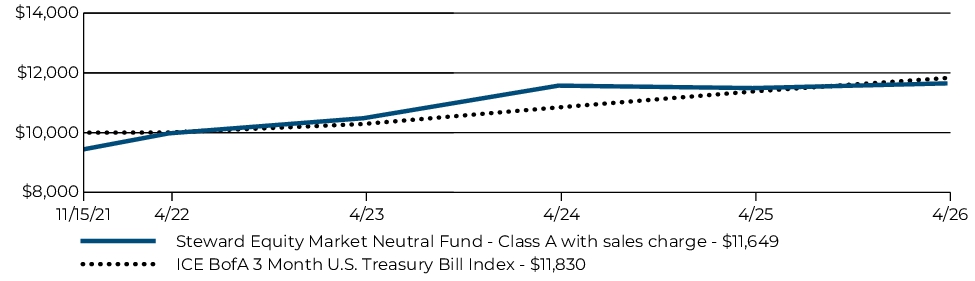
| Average Annual Total Returns | 1 Year | Since Inception |
| Steward Equity Market Neutral Fund (Class A/SMNAX) (with maximum 5.75% sales charge) | (4.44)% | 3.49% |
| Steward Equity Market Neutral Fund (Class A/SMNAX) (without sales charge) | 1.34% | 4.88% |
| ICE BofA 3 Month U.S. Treasury Bill Index | 3.98% | 3.85% |
Key Fund Statistics (April 30, 2026)
| Fund net assets | $106,082,568 |
| Total number of portfolio holdings | 227 |
| Total advisory fees paid | $1,077,611 |
| Portfolio turnover rate as of the end of the reporting period | 176% |
What did the Fund invest in? (April 30, 2026)
The tables below show the investment makeup of the Fund, representing the percentage of the net assets of the Fund.
TOP TEN HOLDINGS
| Long: | |
| QUALCOMM, Inc. | 1.1% |
| Western Digital Corp. | 1.0% |
| Weatherford International PLC | 1.0% |
| Chord Energy Corp. | 1.0% |
| TechnipFMC PLC | 0.9% |
| Short: | |
| Aurora Innovation, Inc. | (1.2)% |
| Blue Owl Capital, Inc. | (1.1)% |
| Strategy, Inc. | (1.1)% |
| KKR & Co., Inc. | (1.1)% |
| Atmos Energy Corp. | (1.1)% |
SECTOR ALLOCATION
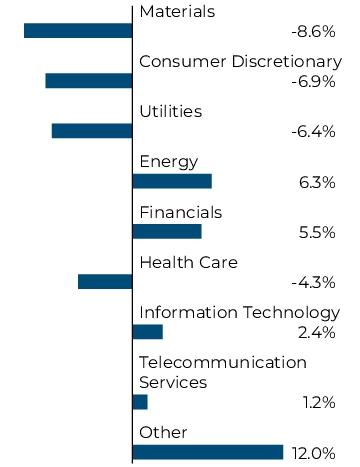
TOP TEN HOLDINGS
| Long: | |
| QUALCOMM, Inc. | 1.1% |
| Western Digital Corp. | 1.0% |
| Weatherford International PLC | 1.0% |
| Chord Energy Corp. | 1.0% |
| TechnipFMC PLC | 0.9% |
| Short: | |
| Aurora Innovation, Inc. | (1.2)% |
| Blue Owl Capital, Inc. | (1.1)% |
| Strategy, Inc. | (1.1)% |
| KKR & Co., Inc. | (1.1)% |
| Atmos Energy Corp. | (1.1)% |
What were the Fund costs for the last year?
(Based on a hypothetical $10,000 investment)
| Fund (Class) | Costs of a $10,000 investment(1) | Costs paid as a percentage of a $10,000 investment(1) |
| Steward Large Cap Core Fund (Class A/SJCAX) |
$113 | 1.00% |
|
(1) |
Reflects applicable expense reimbursements and fee waivers. |
How did the Fund perform last year? What affected the Fund's performance?
Fund and Market Performance
For the fiscal year ended April 30, 2026, the Steward Large Cap Core Fund (Class A) (the “Fund”) returned 26.16%, underperforming the Russell 1000 Index (the “Benchmark”) return of 30.42%.
Positive and Negative Contributors to Performance
The Fund's underperformance relative to the Benchmark was primarily attributed to negative stock selection with adverse sector allocation further reducing the returns. The information technology sector detracted significantly with a total effect of -4.53%, largely driven by the semiconductors and semiconductor equipment companies which contributed -3.09% to the negative results. Conversely, communication services contributed positively with a total effect of 1.18%, supported by the Telecommunication Services Industry Group. On an individual stock basis, the largest detractors from performance were H&R Block, Inc. and Adobe Inc. and the underweight to Tesla, Inc. The largest positive contributors to performance were Millicom International Cellular SA and TechnipFMC plc.
Fund Performance
The performance graph below shows the performance of a hypothetical $10,000 initial investment in the Fund's Class A over a ten-year period (or for the life of the Fund or share class, if shorter). The subsequent account value as of the end of the reporting period is listed next to the name of the Fund or index, as applicable. The performance table below shows the average annual total returns of the Fund's Class A for the past one-, five- and ten-year periods, as applicable (or for the life of the Fund or share class, if shorter), as of the end of the reporting period. Both the graph and table compare the performance of the Fund's Class A to an appropriate broad-based index and may compare to additional indices reflecting the market segment(s) in which the Fund invests, over the same periods.
GROWTH OF $10,000
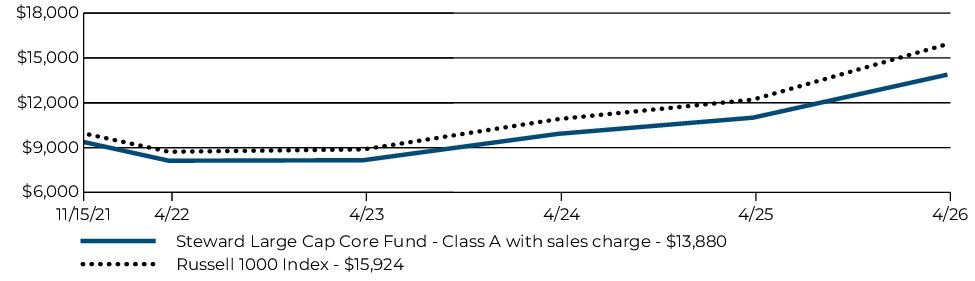
| Average Annual Total Returns | 1 Year | Since Inception |
| Steward Large Cap Core Fund (Class A/SJCAX) (with maximum 5.75% sales charge) | 18.90% | 7.64% |
| Steward Large Cap Core Fund (Class A/SJCAX) (without sales charge) | 26.16% | 9.08% |
| Russell 1000 Index | 30.42% | 11.01% |
Key Fund Statistics (April 30, 2026)
| Fund net assets | $200,496,206 |
| Total number of portfolio holdings | 90 |
| Total advisory fees paid, net | $649,573 |
| Portfolio turnover rate as of the end of the reporting period | 101% |
What did the Fund invest in? (April 30, 2026)
The tables below show the investment makeup of the Fund, representing the percentage of the net assets of the Fund.
TOP TEN HOLDINGS
| Apple, Inc. | 6.9% |
| NVIDIA Corp. | 6.3% |
| Alphabet, Inc., Class A | 5.2% |
| Microsoft Corp. | 3.7% |
| Amazon.com, Inc. | 2.9% |
| Visa, Inc., Class A | 2.0% |
| Broadcom, Inc. | 1.9% |
| Mastercard, Inc., Class A | 1.5% |
| QUALCOMM, Inc. | 1.4% |
| Bank of America Corp. | 1.4% |
SECTOR ALLOCATION
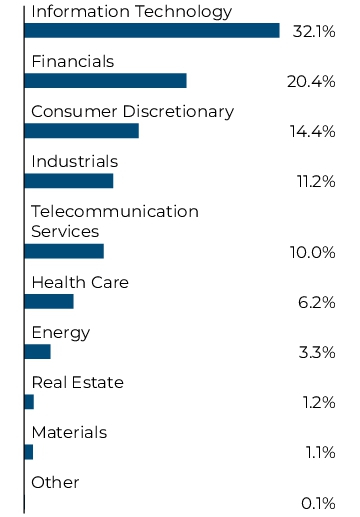
TOP TEN HOLDINGS
| Apple, Inc. | 6.9% |
| NVIDIA Corp. | 6.3% |
| Alphabet, Inc., Class A | 5.2% |
| Microsoft Corp. | 3.7% |
| Amazon.com, Inc. | 2.9% |
| Visa, Inc., Class A | 2.0% |
| Broadcom, Inc. | 1.9% |
| Mastercard, Inc., Class A | 1.5% |
| QUALCOMM, Inc. | 1.4% |
| Bank of America Corp. | 1.4% |
What were the Fund costs for the last year?
(Based on a hypothetical $10,000 investment)
| Fund (Class) | Costs of a $10,000 investment(1) | Costs paid as a percentage of a $10,000 investment(1) |
| Steward Large Cap Core Fund (Class R6/SJCRX) |
$85 | 0.75% |
|
(1)
|
Reflects applicable expense reimbursements and fee waivers.
|
How did the Fund perform last year? What affected the Fund's performance?
Fund and Market Performance
For the fiscal year ended April 30, 2026, the Steward Large Cap Core Fund (Class R6) (the “Fund”) returned 26.45%, underperforming the Russell 1000 Index (the “Benchmark”) return of 30.42%.
Positive and Negative Contributors to Performance
The Fund's underperformance relative to the Benchmark was primarily attributed to negative stock selection with adverse sector allocation further reducing the returns. The information technology sector detracted significantly with a total effect of -4.53%, largely driven by the semiconductors and semiconductor equipment companies which contributed -3.09% to the negative results. Conversely, communication services contributed positively with a total effect of 1.18%, supported by the Telecommunication Services Industry Group. On an individual stock basis, the largest detractors from performance were H&R Block, Inc. and Adobe Inc. and the underweight to Tesla, Inc. The largest positive contributors to performance were Millicom International Cellular SA and TechnipFMC plc.
Fund Performance
The performance graph below shows the performance of a hypothetical $10,000 initial investment in the Fund's Class R6 over a ten-year period (or for the life of the Fund or share class, if shorter). The subsequent account value as of the end of the reporting period is listed next to the name of the Fund or index, as applicable. The performance table below shows the average annual total returns of the Fund's Class R6 for the past one-, five- and ten-year periods, as applicable (or for the life of the Fund or share class, if shorter), as of the end of the reporting period. Both the graph and table compare the performance of the Fund's Class R6 to an appropriate broad-based index and may compare to additional indices reflecting the market segment(s) in which the Fund invests, over the same periods.
GROWTH OF $10,000
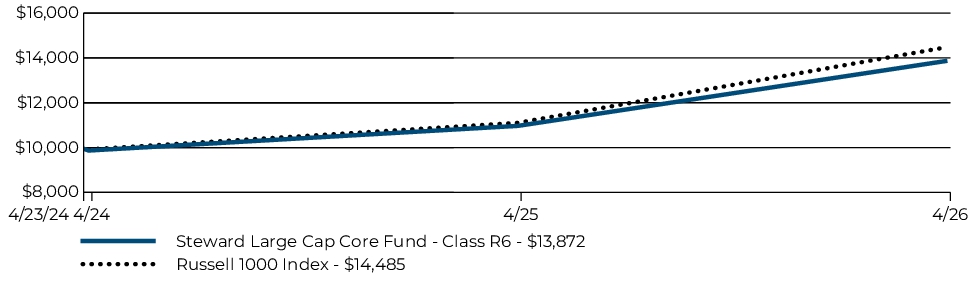
| Average Annual Total Returns | 1 Year | Since Inception |
| Steward Large Cap Core Fund (Class R6/SJCRX) | 26.45% | 17.60% |
| Russell 1000 Index | 30.42% | 20.14% |
Key Fund Statistics (April 30, 2026)
| Fund net assets | $200,496,206 |
| Total number of portfolio holdings | 90 |
| Total advisory fees paid, net | $649,573 |
| Portfolio turnover rate as of the end of the reporting period | 101% |
What did the Fund invest in? (April 30, 2026)
The tables below show the investment makeup of the Fund, representing the percentage of the net assets of the Fund.
TOP TEN HOLDINGS
| Apple, Inc. | 6.9% |
| NVIDIA Corp. | 6.3% |
| Alphabet, Inc., Class A | 5.2% |
| Microsoft Corp. | 3.7% |
| Amazon.com, Inc. | 2.9% |
| Visa, Inc., Class A | 2.0% |
| Broadcom, Inc. | 1.9% |
| Mastercard, Inc., Class A | 1.5% |
| QUALCOMM, Inc. | 1.4% |
| Bank of America Corp. | 1.4% |
SECTOR ALLOCATION
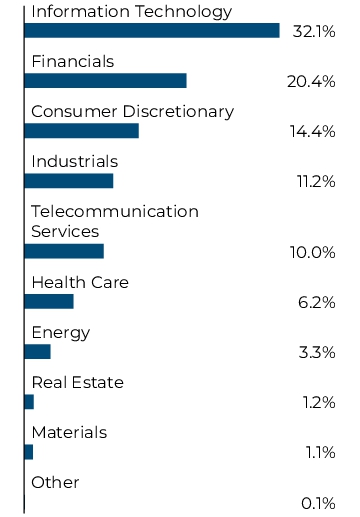
TOP TEN HOLDINGS
| Apple, Inc. | 6.9% |
| NVIDIA Corp. | 6.3% |
| Alphabet, Inc., Class A | 5.2% |
| Microsoft Corp. | 3.7% |
| Amazon.com, Inc. | 2.9% |
| Visa, Inc., Class A | 2.0% |
| Broadcom, Inc. | 1.9% |
| Mastercard, Inc., Class A | 1.5% |
| QUALCOMM, Inc. | 1.4% |
| Bank of America Corp. | 1.4% |
What were the Fund costs for the last year?
(Based on a hypothetical $10,000 investment)
| Fund (Class) | Costs of a $10,000 investment(1) | Costs paid as a percentage of a $10,000 investment(1) |
| Steward Large Cap Core Fund (Institutional Class/SJCIX) |
$85 | 0.75% |
|
(1) |
Reflects applicable expense reimbursements and fee waivers. |
How did the Fund perform last year? What affected the Fund's performance?
Fund and Market Performance
For the fiscal year ended April 30, 2026, the Steward Large Cap Core Fund (Institutional Class) (the “Fund”) returned 26.44%, underperforming the Russell 1000 Index (the “Benchmark”) return of 30.42%.
Positive and Negative Contributors to Performance
The Fund's underperformance relative to the Benchmark was primarily attributed to negative stock selection with adverse sector allocation further reducing the returns. The information technology sector detracted significantly with a total effect of -4.53%, largely driven by the semiconductors and semiconductor equipment companies which contributed -3.09% to the negative results. Conversely, communication services contributed positively with a total effect of 1.18%, supported by the Telecommunication Services Industry Group. On an individual stock basis, the largest detractors from performance were H&R Block, Inc. and Adobe Inc. and the underweight to Tesla, Inc. The largest positive contributors to performance were Millicom International Cellular SA and TechnipFMC plc.
Fund Performance
The performance graph below shows the performance of a hypothetical $100,000 initial investment in the Fund's Institutional Class over a ten-year period (or for the life of the Fund or share class, if shorter). The subsequent account value as of the end of the reporting period is listed next to the name of the Fund or index, as applicable. The performance table below shows the average annual total returns of the Fund's Institutional Class for the past one-, five- and ten-year periods, as applicable (or for the life of the Fund or share class, if shorter), as of the end of the reporting period. Both the graph and table compare the performance of the Fund's Institutional Class to an appropriate broad-based index and may compare to additional indices reflecting the market segment(s) in which the Fund invests, over the same periods.
GROWTH OF $100,000
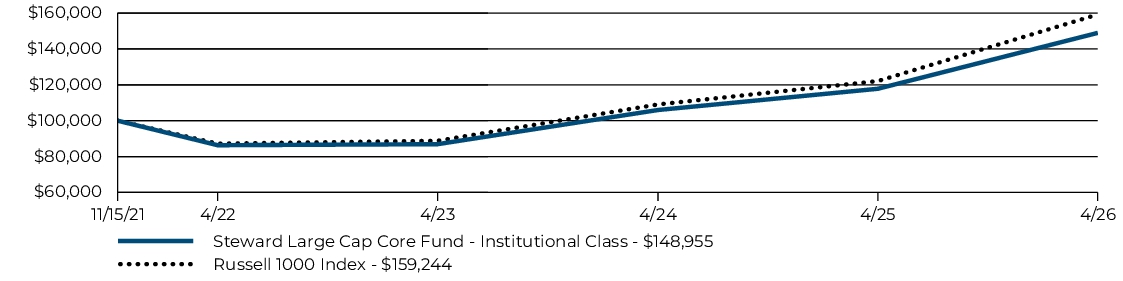
| Average Annual Total Returns | 1 Year | Since Inception |
| Steward Large Cap Core Fund (Institutional Class/SJCIX) | 26.44% | 9.36% |
| Russell 1000 Index | 30.42% | 11.01% |
Key Fund Statistics (April 30, 2026)
| Fund net assets | $200,496,206 |
| Total number of portfolio holdings | 90 |
| Total advisory fees paid, net | $649,573 |
| Portfolio turnover rate as of the end of the reporting period | 101% |
What did the Fund invest in? (April 30, 2026)
The tables below show the investment makeup of the Fund, representing the percentage of the net assets of the Fund.
TOP TEN HOLDINGS
| Apple, Inc. | 6.9% |
| NVIDIA Corp. | 6.3% |
| Alphabet, Inc., Class A | 5.2% |
| Microsoft Corp. | 3.7% |
| Amazon.com, Inc. | 2.9% |
| Visa, Inc., Class A | 2.0% |
| Broadcom, Inc. | 1.9% |
| Mastercard, Inc., Class A | 1.5% |
| QUALCOMM, Inc. | 1.4% |
| Bank of America Corp. | 1.4% |
SECTOR ALLOCATION
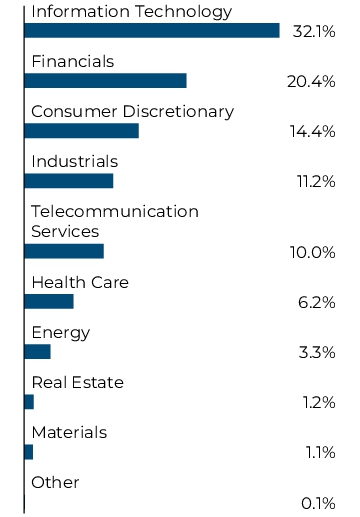
TOP TEN HOLDINGS
| Apple, Inc. | 6.9% |
| NVIDIA Corp. | 6.3% |
| Alphabet, Inc., Class A | 5.2% |
| Microsoft Corp. | 3.7% |
| Amazon.com, Inc. | 2.9% |
| Visa, Inc., Class A | 2.0% |
| Broadcom, Inc. | 1.9% |
| Mastercard, Inc., Class A | 1.5% |
| QUALCOMM, Inc. | 1.4% |
| Bank of America Corp. | 1.4% |
What were the Fund costs for the last year?
(Based on a hypothetical $10,000 investment)
| Fund (Class) | Costs of a $10,000 investment(1) | Costs paid as a percentage of a $10,000 investment(1) |
| Steward Large Cap Growth Fund (Institutional Class/SJGIX) |
$84 | 0.75% |
|
(1) |
Reflects applicable expense reimbursements and fee waivers. |
How did the Fund perform last year? What affected the Fund's performance?
Fund and Market Performance
For the fiscal year ended April 30, 2026, the Steward Large Cap Growth Fund (Institutional Class) (the “Fund”) returned 24.41%, underperforming the Russell 1000 Growth Index (the “Benchmark”) return of 30.63%.
Positive and Negative Contributors to Performance
The Fund’s underperformance relative to the Benchmark was primarily driven by a sector allocation with stock selection further reducing returns. The information technology sector was the largest detractor with a total effect of -3.20%, primarily driven by the software and services companies which subtracted -2.19%. Conversely, health care contributed positively, adding 66 basis points overall, with pharmaceuticals biotechnology & life sciences providing a gain of 93 basis points. On an individual stock basis, the largest detractors were Sprout Farmers Market, Inc. and the underweight in Broadcom Inc. The best performing stocks were Microsoft Corp. and Comfort Systems USA, Inc.
Fund Performance
The performance graph below shows the performance of a hypothetical $100,000 initial investment in the Fund's Institutional Class over a ten-year period (or for the life of the Fund or share class, if shorter). The subsequent account value as of the end of the reporting period is listed next to the name of the Fund or index, as applicable. The performance table below shows the average annual total returns of the Fund's Institutional Class for the past one-, five- and ten-year periods, as applicable (or for the life of the Fund or share class, if shorter), as of the end of the reporting period. Both the graph and table compare the performance of the Fund's Institutional Class to an appropriate broad-based index and may compare to additional indices reflecting the market segment(s) in which the Fund invests, over the same periods.
GROWTH OF $100,000
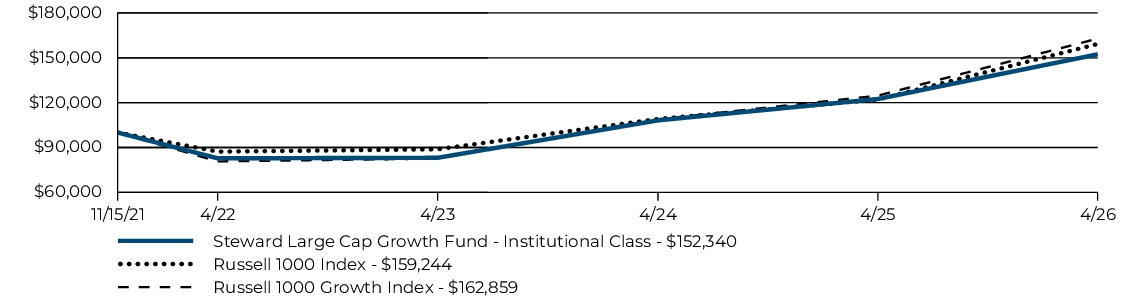
| Average Annual Total Returns | 1 Year | Since Inception |
| Steward Large Cap Growth Fund (Institutional Class/SJGIX) | 24.41% | 9.91% |
| Russell 1000 Index | 30.42% | 11.01% |
| Russell 1000 Growth Index | 30.63% | 11.57% |
Key Fund Statistics (April 30, 2026)
| Fund net assets | $247,660,819 |
| Total number of portfolio holdings | 69 |
| Total advisory fees paid, net | $842,827 |
| Portfolio turnover rate as of the end of the reporting period | 106% |
What did the Fund invest in? (April 30, 2026)
The tables below show the investment makeup of the Fund, representing the percentage of the net assets of the Fund.
TOP TEN HOLDINGS
| NVIDIA Corp. | 12.3% |
| Apple, Inc. | 9.4% |
| Alphabet, Inc., Class A | 5.4% |
| Broadcom, Inc. | 4.7% |
| Amazon.com, Inc. | 4.3% |
| Meta Platforms, Inc., Class A | 2.5% |
| Microsoft Corp. | 2.5% |
| Visa, Inc., Class A | 2.4% |
| Tesla, Inc. | 2.3% |
| Mastercard, Inc., Class A | 2.2% |
SECTOR ALLOCATION
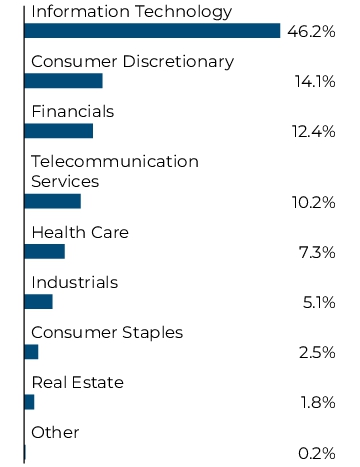
TOP TEN HOLDINGS
| NVIDIA Corp. | 12.3% |
| Apple, Inc. | 9.4% |
| Alphabet, Inc., Class A | 5.4% |
| Broadcom, Inc. | 4.7% |
| Amazon.com, Inc. | 4.3% |
| Meta Platforms, Inc., Class A | 2.5% |
| Microsoft Corp. | 2.5% |
| Visa, Inc., Class A | 2.4% |
| Tesla, Inc. | 2.3% |
| Mastercard, Inc., Class A | 2.2% |
What were the Fund costs for the last year?
(Based on a hypothetical $10,000 investment)
| Fund (Class) | Costs of a $10,000 investment(1) | Costs paid as a percentage of a $10,000 investment(1) |
| Steward Large Cap Growth Fund (Class A/SJGAX) |
$112 | 1.00% |
|
(1) |
Reflects applicable expense reimbursements and fee waivers. |
How did the Fund perform last year? What affected the Fund's performance?
Fund and Market Performance
For the fiscal year ended April 30, 2026, the Steward Large Cap Growth Fund (Class A) (the “Fund”) returned 24.12%, underperforming the Russell 1000 Growth Index (the “Benchmark”) return of 30.63%.
Positive and Negative Contributors to Performance
The Fund’s underperformance relative to the Benchmark was primarily driven by a sector allocation with stock selection further reducing returns. The information technology sector was the largest detractor with a total effect of -3.20%, primarily driven by the software and services companies which subtracted -2.19%. Conversely, health care contributed positively, adding 66 basis points overall, with pharmaceuticals biotechnology & life sciences providing a gain of 93 basis points. On an individual stock basis, the largest detractors were Sprout Farmers Market, Inc. and the underweight in Broadcom Inc. The best performing stocks were Microsoft Corp. and Comfort Systems USA, Inc.
Fund Performance
The performance graph below shows the performance of a hypothetical $10,000 initial investment in the Fund's Class A over a ten-year period (or for the life of the Fund or share class, if shorter). The subsequent account value as of the end of the reporting period is listed next to the name of the Fund or index, as applicable. The performance table below shows the average annual total returns of the Fund's Class A for the past one-, five- and ten-year periods, as applicable (or for the life of the Fund or share class, if shorter), as of the end of the reporting period. Both the graph and table compare the performance of the Fund's Class A to an appropriate broad-based index and may compare to additional indices reflecting the market segment(s) in which the Fund invests, over the same periods.
GROWTH OF $10,000
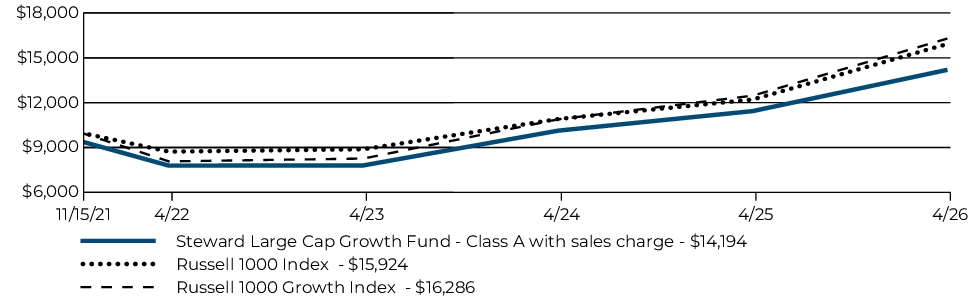
| Average Annual Total Returns | 1 Year | Since Inception |
| Steward Large Cap Growth Fund (Class A/SJGAX) (with maximum 5.75% sales charge) | 16.99% | 8.18% |
| Steward Large Cap Growth Fund (Class A/SJGAX) (without sales charge) | 24.12% | 9.63% |
| Russell 1000 Index | 30.42% | 11.01% |
| Russell 1000 Growth Index | 30.63% | 11.57% |
Key Fund Statistics (April 30, 2026)
| Fund net assets | $247,660,819 |
| Total number of portfolio holdings | 69 |
| Total advisory fees paid, net | $842,827 |
| Portfolio turnover rate as of the end of the reporting period | 106% |
What did the Fund invest in? (April 30, 2026)
The tables below show the investment makeup of the Fund, representing the percentage of the net assets of the Fund.
TOP TEN HOLDINGS
| NVIDIA Corp. | 12.3% |
| Apple, Inc. | 9.4% |
| Alphabet, Inc., Class A | 5.4% |
| Broadcom, Inc. | 4.7% |
| Amazon.com, Inc. | 4.3% |
| Meta Platforms, Inc., Class A | 2.5% |
| Microsoft Corp. | 2.5% |
| Visa, Inc., Class A | 2.4% |
| Tesla, Inc. | 2.3% |
| Mastercard, Inc., Class A | 2.2% |
SECTOR ALLOCATION
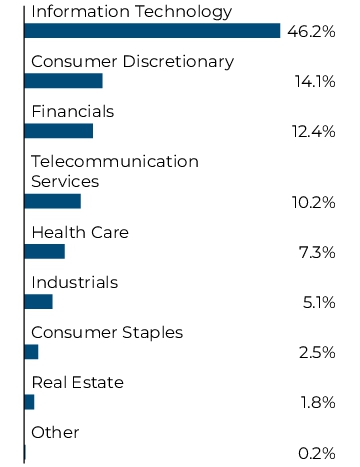
TOP TEN HOLDINGS
| NVIDIA Corp. | 12.3% |
| Apple, Inc. | 9.4% |
| Alphabet, Inc., Class A | 5.4% |
| Broadcom, Inc. | 4.7% |
| Amazon.com, Inc. | 4.3% |
| Meta Platforms, Inc., Class A | 2.5% |
| Microsoft Corp. | 2.5% |
| Visa, Inc., Class A | 2.4% |
| Tesla, Inc. | 2.3% |
| Mastercard, Inc., Class A | 2.2% |
What were the Fund costs for the last year?
(Based on a hypothetical $10,000 investment)
| Fund (Class) | Costs of a $10,000 investment(1) | Costs paid as a percentage of a $10,000 investment(1) |
| Steward Large Cap Value Fund (Class A/SJVAX) |
$113 | 1.00% |
|
(1) |
Reflects applicable expense reimbursements and fee waivers. |
How did the Fund perform last year? What affected the Fund's performance?
Fund and Market Performance
For the fiscal year ended April 30, 2026, the Steward Large Cap Value Fund (Class A) (the “Fund”) returned 25.73%, underperforming the Russell 1000 Value Index (the “Benchmark”) return of 29.25%.
Positive and Negative Contributors to Performance
The Fund’s underperformance relative to the Benchmark was primarily driven by sector allocation which was modestly offset by positive stock selection. Detractors included information technology, which reduced relative performance by -5.58%, particularly within the semiconductors and semiconductor equipment companies at -4.45%. Conversely, financials contributed positively by 2.69%, with financial services companies adding 1.78%. On an individual stock basis, the largest detractors were Micron Technology Inc. and Genpact Limited. The best performing stocks were Millicom International Cellular SA and Western Digital Corporation.
Fund Performance
The performance graph below shows the performance of a hypothetical $10,000 initial investment in the Fund's Class A over a ten-year period (or for the life of the Fund or share class, if shorter). The subsequent account value as of the end of the reporting period is listed next to the name of the Fund or index, as applicable. The performance table below shows the average annual total returns of the Fund's Class A for the past one-, five- and ten-year periods, as applicable (or for the life of the Fund or share class, if shorter), as of the end of the reporting period. Both the graph and table compare the performance of the Fund's Class A to an appropriate broad-based index and may compare to additional indices reflecting the market segment(s) in which the Fund invests, over the same periods.
GROWTH OF $10,000
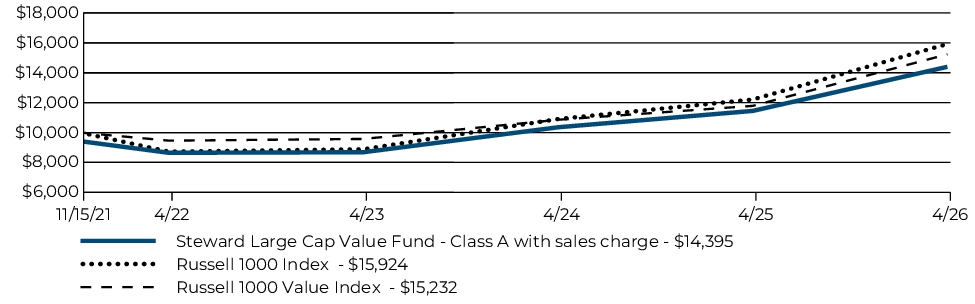
| Average Annual Total Returns | 1 Year | Since Inception |
| Steward Large Cap Value Fund (Class A/SJVAX) (with maximum 5.75% sales charge) | 18.51% | 8.52% |
| Steward Large Cap Value Fund (Class A/SJVAX) (without sales charge) | 25.73% | 9.98% |
| Russell 1000 Index | 30.42% | 11.01% |
| Russell 1000 Value Index | 29.25% | 9.91% |
Key Fund Statistics (April 30, 2026)
| Fund net assets | $137,064,089 |
| Total number of portfolio holdings | 96 |
| Total advisory fees paid, net | $340,065 |
| Portfolio turnover rate as of the end of the reporting period | 107% |
What did the Fund invest in? (April 30, 2026)
The tables below show the investment makeup of the Fund, representing the percentage of the net assets of the Fund.
TOP TEN HOLDINGS
| Alphabet, Inc., Class A | 4.5% |
| Bank of America Corp. | 2.0% |
| Analog Devices, Inc. | 1.8% |
| Berkshire Hathaway, Inc., Class B | 1.7% |
| International Business Machines Corp. | 1.7% |
| Morgan Stanley | 1.6% |
| Verizon Communications, Inc. | 1.6% |
| JPMorgan Chase & Co. | 1.6% |
| Citigroup, Inc. | 1.6% |
| Western Digital Corp. | 1.6% |
SECTOR ALLOCATION
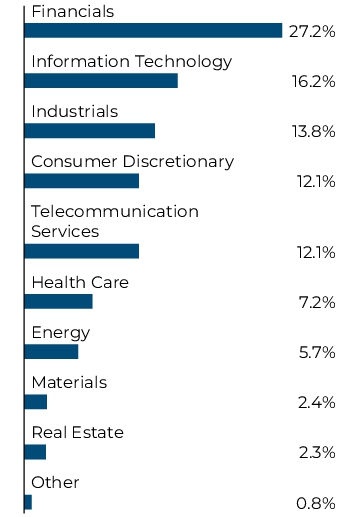
TOP TEN HOLDINGS
| Alphabet, Inc., Class A | 4.5% |
| Bank of America Corp. | 2.0% |
| Analog Devices, Inc. | 1.8% |
| Berkshire Hathaway, Inc., Class B | 1.7% |
| International Business Machines Corp. | 1.7% |
| Morgan Stanley | 1.6% |
| Verizon Communications, Inc. | 1.6% |
| JPMorgan Chase & Co. | 1.6% |
| Citigroup, Inc. | 1.6% |
| Western Digital Corp. | 1.6% |
What were the Fund costs for the last year?
(Based on a hypothetical $10,000 investment)
| Fund (Class) | Costs of a $10,000 investment(1) | Costs paid as a percentage of a $10,000 investment(1) |
| Steward Large Cap Value Fund (Institutional Class/SJVIX) |
$85 | 0.75% |
|
(1) |
Reflects applicable expense reimbursements and fee waivers. |
How did the Fund perform last year? What affected the Fund's performance?
Fund and Market Performance
For the fiscal year ended April 30, 2026, the Steward Large Cap Value Fund (Institutional Class) (the “Fund”) returned 26.07%, underperforming the Russell 1000 Value Index (the “Benchmark”) return of 29.25%.
Positive and Negative Contributors to Performance
The Fund’s underperformance relative to the Benchmark was primarily driven by sector allocation which was modestly offset by positive stock selection. Detractors included information technology, which reduced relative performance by -5.58%, particularly within the semiconductors and semiconductor equipment companies at -4.45%. Conversely, financials contributed positively by 2.69%, with financial services companies adding 1.78%. On an individual stock basis, the largest detractors were Micron Technology Inc. and Genpact Limited. The best performing stocks were Millicom International Cellular SA and Western Digital Corporation.
Fund Performance
The performance graph below shows the performance of a hypothetical $100,000 initial investment in the Fund's Institutional Class over a ten-year period (or for the life of the Fund or share class, if shorter). The subsequent account value as of the end of the reporting period is listed next to the name of the Fund or index, as applicable. The performance table below shows the average annual total returns of the Fund's Institutional Class for the past one-, five- and ten-year periods, as applicable (or for the life of the Fund or share class, if shorter), as of the end of the reporting period. Both the graph and table compare the performance of the Fund's Institutional Class to an appropriate broad-based index and may compare to additional indices reflecting the market segment(s) in which the Fund invests, over the same periods.
GROWTH OF $100,000
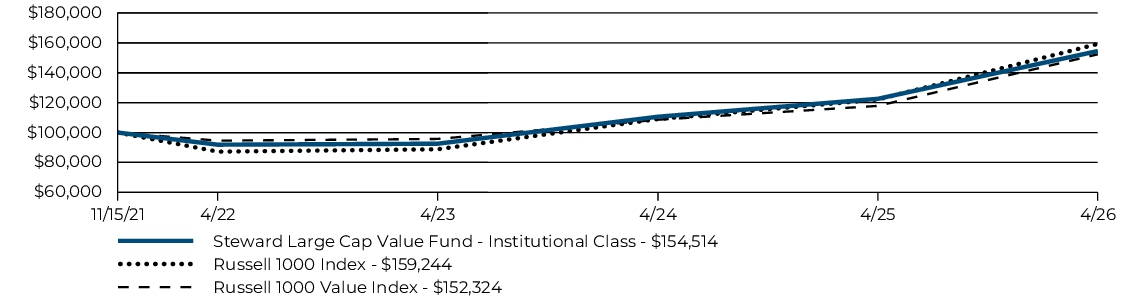
| Average Annual Total Returns | 1 Year | Since Inception |
| Steward Large Cap Value Fund (Institutional Class/SJVIX) | 26.07% | 10.26% |
| Russell 1000 Index | 30.42% | 11.01% |
| Russell 1000 Value Index | 29.25% | 9.91% |
Key Fund Statistics (April 30, 2026)
| Fund net assets | $137,064,089 |
| Total number of portfolio holdings | 96 |
| Total advisory fees paid, net | $340,065 |
| Portfolio turnover rate as of the end of the reporting period | 107% |
What did the Fund invest in? (April 30, 2026)
The tables below show the investment makeup of the Fund, representing the percentage of the net assets of the Fund.
TOP TEN HOLDINGS
| Alphabet, Inc., Class A | 4.5% |
| Bank of America Corp. | 2.0% |
| Analog Devices, Inc. | 1.8% |
| Berkshire Hathaway, Inc., Class B | 1.7% |
| International Business Machines Corp. | 1.7% |
| Morgan Stanley | 1.6% |
| Verizon Communications, Inc. | 1.6% |
| JPMorgan Chase & Co. | 1.6% |
| Citigroup, Inc. | 1.6% |
| Western Digital Corp. | 1.6% |
SECTOR ALLOCATION
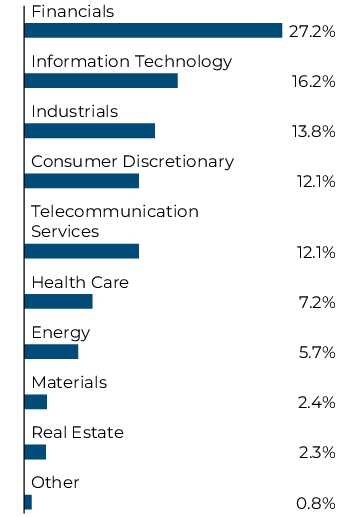
TOP TEN HOLDINGS
| Alphabet, Inc., Class A | 4.5% |
| Bank of America Corp. | 2.0% |
| Analog Devices, Inc. | 1.8% |
| Berkshire Hathaway, Inc., Class B | 1.7% |
| International Business Machines Corp. | 1.7% |
| Morgan Stanley | 1.6% |
| Verizon Communications, Inc. | 1.6% |
| JPMorgan Chase & Co. | 1.6% |
| Citigroup, Inc. | 1.6% |
| Western Digital Corp. | 1.6% |
| [1] | Reflects applicable expense reimbursements and fee waivers. |
| [2] | Reflects applicable expense reimbursements and fee waivers. |
| [3] | Class R6 shares of the Fund commenced operations on August 28, 2025. Had Class R6 shares of the Fund been in operation for a full year, the cost of a $10,000 investment would have been higher. Reflects applicable expense reimbursements and fee waivers. |
| [4] | Annualized. Reflects applicable expense reimbursements and fee waivers. |
| [5] | Reflects applicable expense reimbursements and fee waivers. |
| [6] | Includes the effect of dividend expense and brokerage expense on securities sold short and does not include the proportionate share of expenses and income in the underlying funds in which the Fund invests. |
| [7] | Includes the effect of dividend expense and brokerage expense on securities sold short and does not include the proportionate share of expenses and income in the underlying funds in which the Fund invests. |
| [8] | Reflects applicable expense reimbursements and fee waivers. |
| [9] | Reflects applicable expense reimbursements and fee waivers. |
| [10] | Reflects applicable expense reimbursements and fee waivers. |
| [11] | Reflects applicable expense reimbursements and fee waivers. |
| [12] | Reflects applicable expense reimbursements and fee waivers. |
| [13] | Reflects applicable expense reimbursements and fee waivers. |
| [14] | Reflects applicable expense reimbursements and fee waivers. |