
Exhibit 99.2
Overview July 2026
This presentation contains forward - looking statements that involve substantial risks and uncertainties. All statements, other th an statements of historical facts, contained in this presentation, including statements about our expectations regarding the potential benefits, activity, effec tiv eness, and safety of our product candidates, our expectations with regard to the design and results of our research and development programs, preclinical studies, and cli nic al trials, including the timing and availability of data from such studies and trials, our preclinical, clinical, and regulatory development plans for our product candidates, including the timing or likelihood of regulatory filings and approvals for our product candidates, our expectations with regard to our ability to license, acqui re, discover, and develop additional products candidates and advance such product candidates into, and successfully complete, preclinical studies and clinical trials, the pot ential market size and size of the potential patient populations for our product candidates and any future product candidates, our ability to maintain existing, an d establish new, strategic collaborations, licensing, or other arrangements, the scope of protection we are able to establish and maintain for intellectual property rig hts covering our initial product candidates and any future product candidates, our business strategy, and our future results of operations and financial position, and our an tic ipated cash runway are forward - looking statements. The words “anticipate,” “believe,” “estimate,” “expect,” “intend,” “may,” “might,” “plan,” “predict,” “project,” “ta rget,” “potential,” “will,” “would,” “could,” “should,” “continue,” and similar expressions are intended to identify forward - looking statements, although not all forward - look ing statements contain these identifying words. These forward - looking statements are subject to a number of risks, uncertainties and assumptions. Risks regarding our bus iness are described in detail in our Securities and Exchange Commission filings, including in our Annual Report on Form 10 - K for the year ended December 31, 2025, an d our other filings with the SEC, which are available on the SEC’s website at www.sec.gov. We may not actually achieve the plans, intentions or expectations di scl osed in our forward - looking statements, and you should not place undue reliance on our forward - looking statements. Actual results or events could differ mat erially from the plans, intentions and expectations disclosed in the forward - looking statements we make. The forward - looking statements contained in this presentation reflect our current views with respect to future events, and we assume no obligation to update any forward - looking statements except as required by applicable law. This presentation also contains estimates and other statistical data made by independent parties and by us relating to market si ze and growth and other data about our industry. This data involves a number of assumptions and limitations, and you are cautioned not to give undue weight to such est imates. Industry publications and third - party research, surveys and studies generally indicate that their information has been obtained from sources believed to be r eli able, although they do not guarantee the accuracy or completeness of such information. In addition, projections, assumptions, and estimates of our future performance and the future performance of the markets in which we operate are necessarily subject to a high degree of uncertainty and risk. This presentation contains trademarks, service marks, trade names and copyrights of Tvardi and other companies which are the pro perty of their respective owners. 2 Disclaimer and Forward - Looking Statements
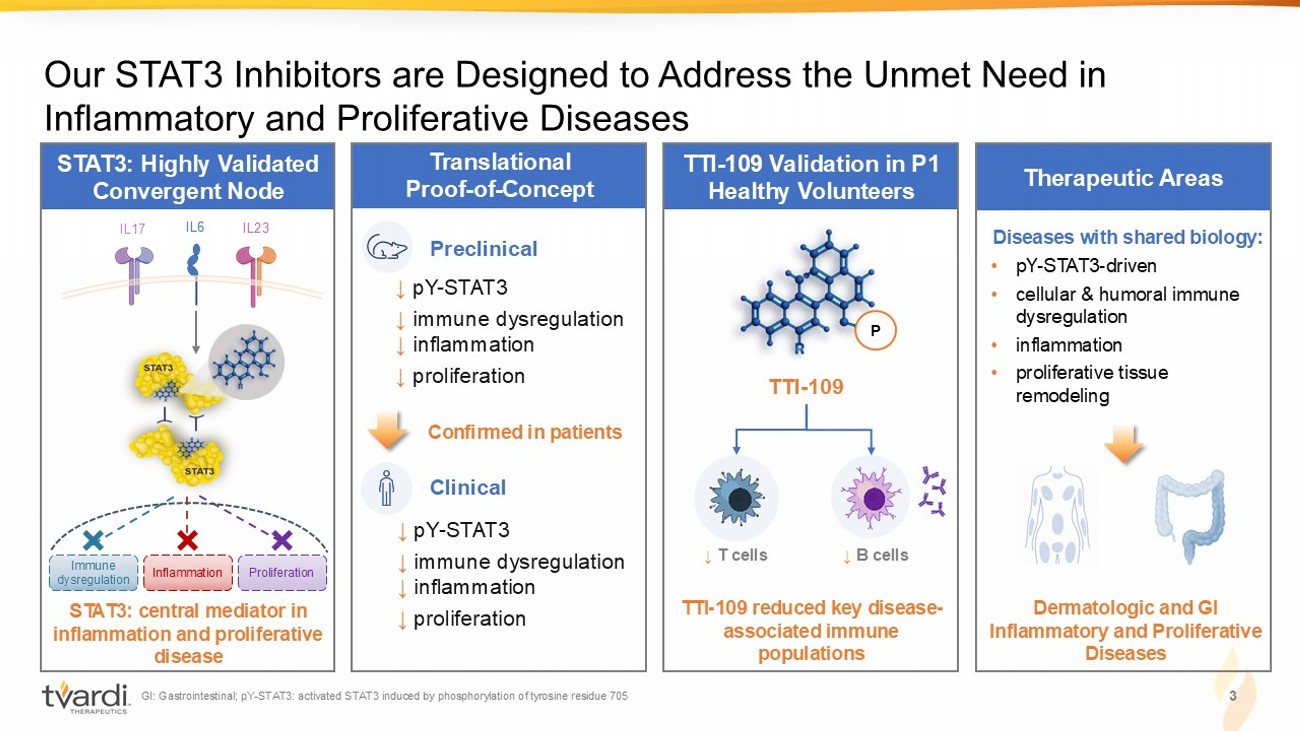
STAT3: Highly Validated Convergent Node Translational Proof - of - Concept STAT3: central mediator in inflammation and proliferative disease Our STAT3 Inhibitors are Designed to Address the Unmet Need in Inflammatory and Proliferative Diseases IL6 IL17 I L23 TTI - 109 Validation in P1 Healthy Volunteers TTI - 109 reduced key disease - associated immune populations Therapeutic Areas Diseases with shared biology: • pY - STAT3 - driven • cellular & humoral immune dysregulation • inflammation • proliferative tissue remodeling Dermatologic and GI Inflammatory and Proliferative Diseases Preclinical ↓ pY - STAT3 ↓ immune dysregulation ↓ inflammation ↓ proliferation Clinical Confirmed in patients P TTI - 109 ↓ B cells ↓ T cells 3 GI: Gastrointestinal; pY - STAT3: activated STAT3 induced by phosphorylation of tyrosine residue 705 ↓ pY - STAT3 ↓ immune dysregulation ↓ inflammation ↓ proliferation Immune dysregulation Inflammation Proliferation
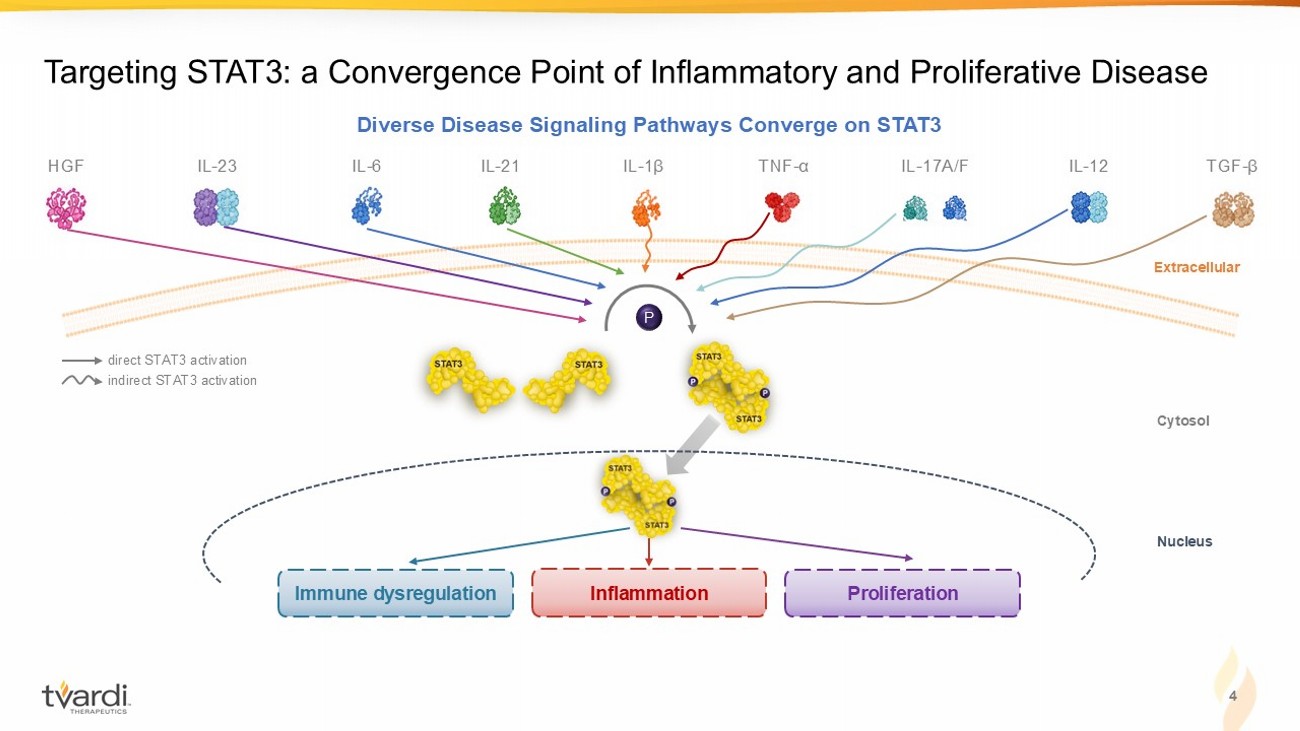
4 Targeting STAT3: a Convergence Point of Inflammatory and Proliferative Disease IL - 23 IL - 1 β IL - 6 IL - 21 IL - 17A/F IL - 12 TNF - α direct STAT3 activation indirect STAT3 activation TGF - β HGF Immune dysregulation Inflammation Proliferation Extracellular Cytosol Nucleus P Diverse Disease Signaling Pathways Converge on STAT3
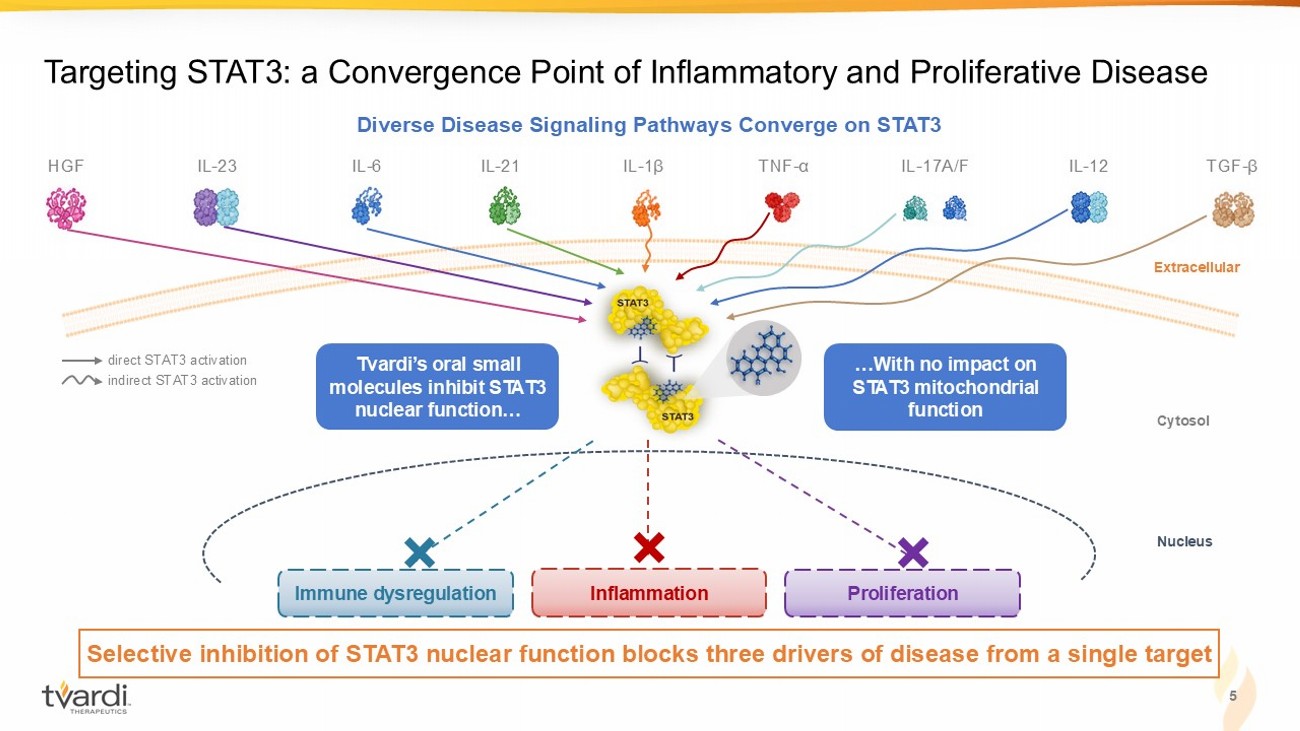
5 Targeting STAT3: a Convergence Point of Inflammatory and Proliferative Disease Diverse Disease Signaling Pathways Converge on STAT3 IL - 23 IL - 1 β IL - 6 IL - 21 IL - 17A/F IL - 12 TNF - α direct STAT3 activation indirect STAT3 activation TGF - β HGF Immune dysregulation Inflammation Proliferation Selective inhibition of STAT3 nuclear function blocks three drivers of disease from a single target Extracellular Cytosol Nucleus Tvardi’s oral small m olecules inhibit STAT3 nuclear f unction… …With no impact on STAT3 mitochondrial function
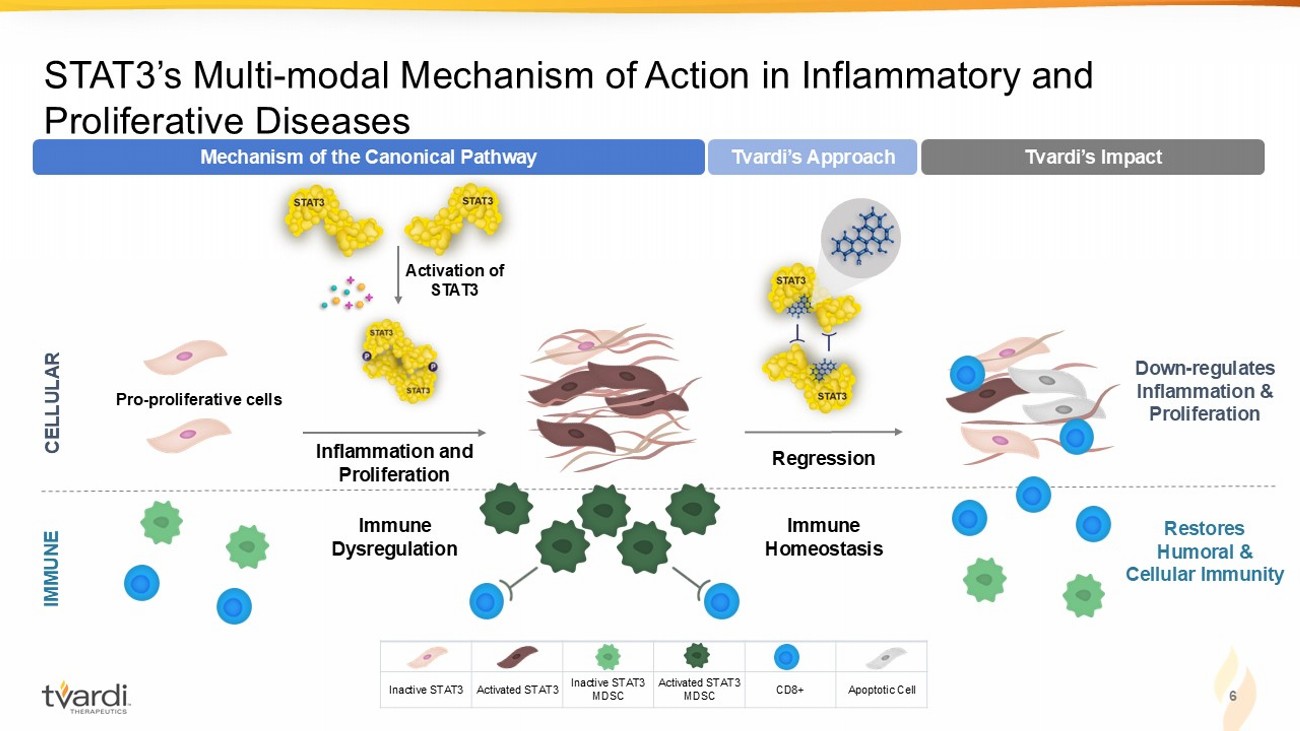
6 STAT3’s Multi - modal Mechanism of Action in Inflammatory and Proliferative Diseases Restores Humoral & Cellular Immunity Immune Homeostasis Regression Tvardi’s Approach Tvardi’s Impact Down - regulates Inflammation & Proliferation CELLULAR IMMUNE Immune Dysregulation Pro - proliferative cells Activation of STAT3 Inflammation and Proliferation Mechanism of the Canonical Pathway Apoptotic Cell CD8+ Activated STAT3 MDSC Inactive STAT3 MDSC Activated STAT3 Inactive STAT3
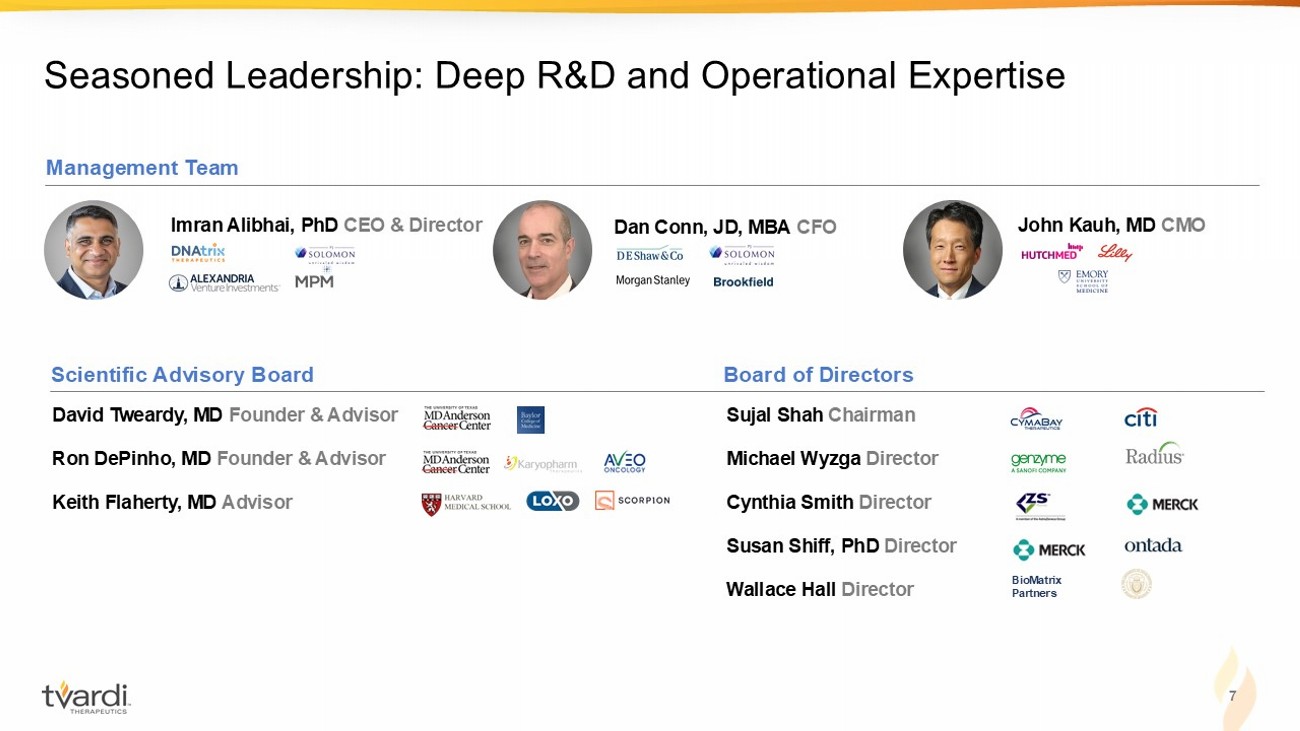
7 Seasoned Leadership: Deep R&D and Operational Expertise Sujal Shah Chairman Michael Wyzga Director Cynthia Smith Director Susan Shiff, PhD Director Wallace Hall Director Dan Conn, JD, MBA CFO John Kauh, MD CMO Imran Alibhai, PhD CEO & Director David Tweardy, MD Founder & Advisor Ron DePinho, MD Founder & Advisor Keith Flaherty, MD Advisor Management Team Scientific Advisory Board Board of Directors BioMatrix Partners

TTI - 109
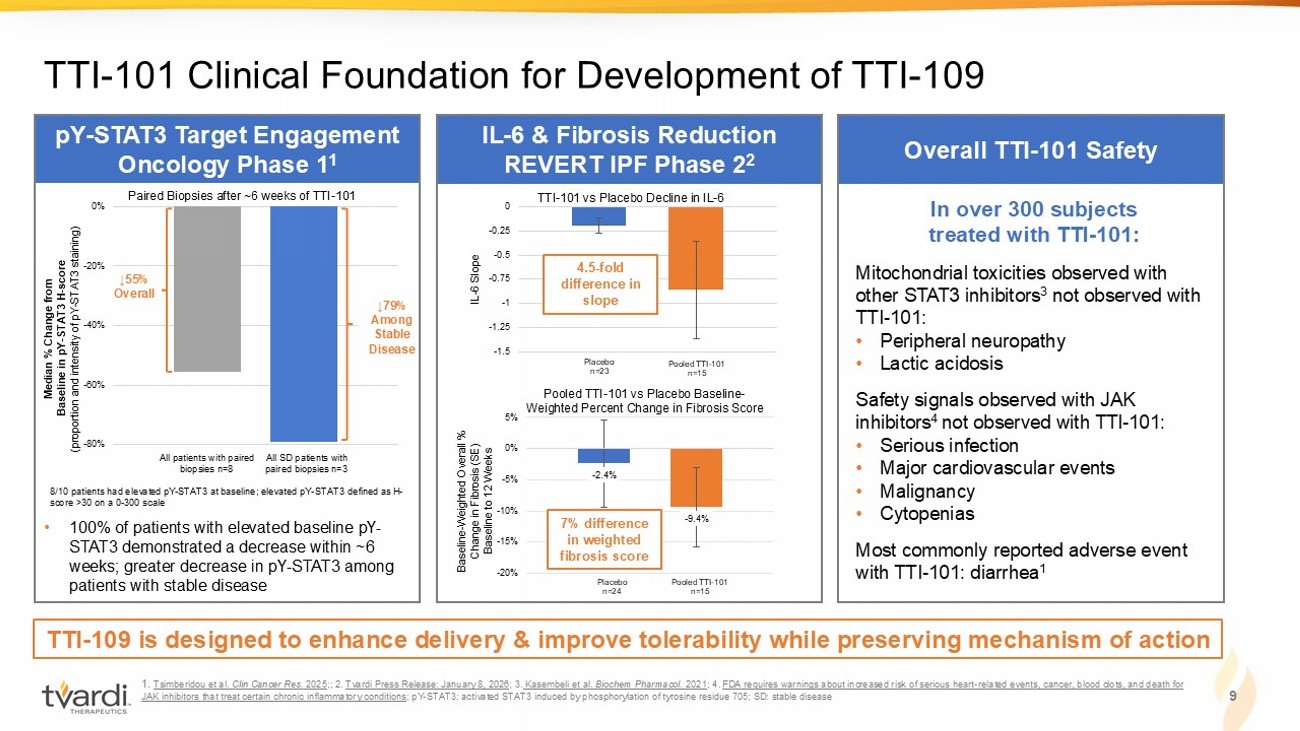
1. Tsimberidou et al. Clin Cancer Res. 2025 ;; 2. Tvardi Press Release: January 8, 2026 ; 3. Kasembeli et al. Biochem Pharmacol. 2021 ; 4. FDA requires warnings about increased risk of serious heart - related events, cancer, blood clots, and death for JAK inhibitors that treat certain chronic inflammatory conditions ; pY - STAT3: activated STAT3 induced by phosphorylation of tyrosine residue 705; SD: stable disease TTI - 101 Clinical Foundation for Development of TTI - 109 9 Median % Change from Baseline in pY - STAT3 H - score (proportion and intensity of pY - STAT3 staining) All patients with paired biopsies n=8 All SD patients with paired biopsies n=3 -80% -60% -40% -20% 0% ↓79% Among Stable Disease 8/10 patients had elevated pY - STAT3 at baseline; elevated pY - STAT3 defined as H - score >30 on a 0 - 300 scale ↓55% Overall Paired Biopsies after ~6 weeks of TTI - 101 pY - STAT3 Target Engagement Oncology Phase 1 1 Overall TTI - 101 Safety IL - 6 & Fibrosis Reduction REVERT IPF Phase 2 2 - 2.4% - 9.4% -20% -15% -10% -5% 0% 5% Pooled TTI - 101 vs Placebo Baseline - Weighted Percent Change in Fibrosis Score Baseline - Weighted Overall % Change in Fibrosis (SE) Baseline to 12 Weeks Placebo n=24 Pooled TTI - 101 n=15 -1.5 -1.25 -1 -0.75 -0.5 -0.25 0 TTI - 101 vs Placebo Decline in IL - 6 Placebo n=23 Pooled TTI - 101 n=15 IL - 6 Slope In over 300 subjects treated with TTI - 101: Mitochondrial toxicities observed with other STAT3 inhibitors 3 not observed with TTI - 101: • Peripheral neuropathy • Lactic acidosis Safety signals observed with JAK inhibitors 4 not observed with TTI - 101: • Serious infection • Major cardiovascular events • Malignancy • Cytopenias Most commonly reported adverse event with TTI - 101: diarrhea 1 TTI - 109 is designed to enhance delivery & improve tolerability while preserving mechanism of action 7% difference in weighted fibrosis score 4.5 - fold difference in slope • 100% of patients with elevated baseline pY - STAT3 demonstrated a decrease within ~6 weeks; greater decrease in pY - STAT3 among patients with stable disease
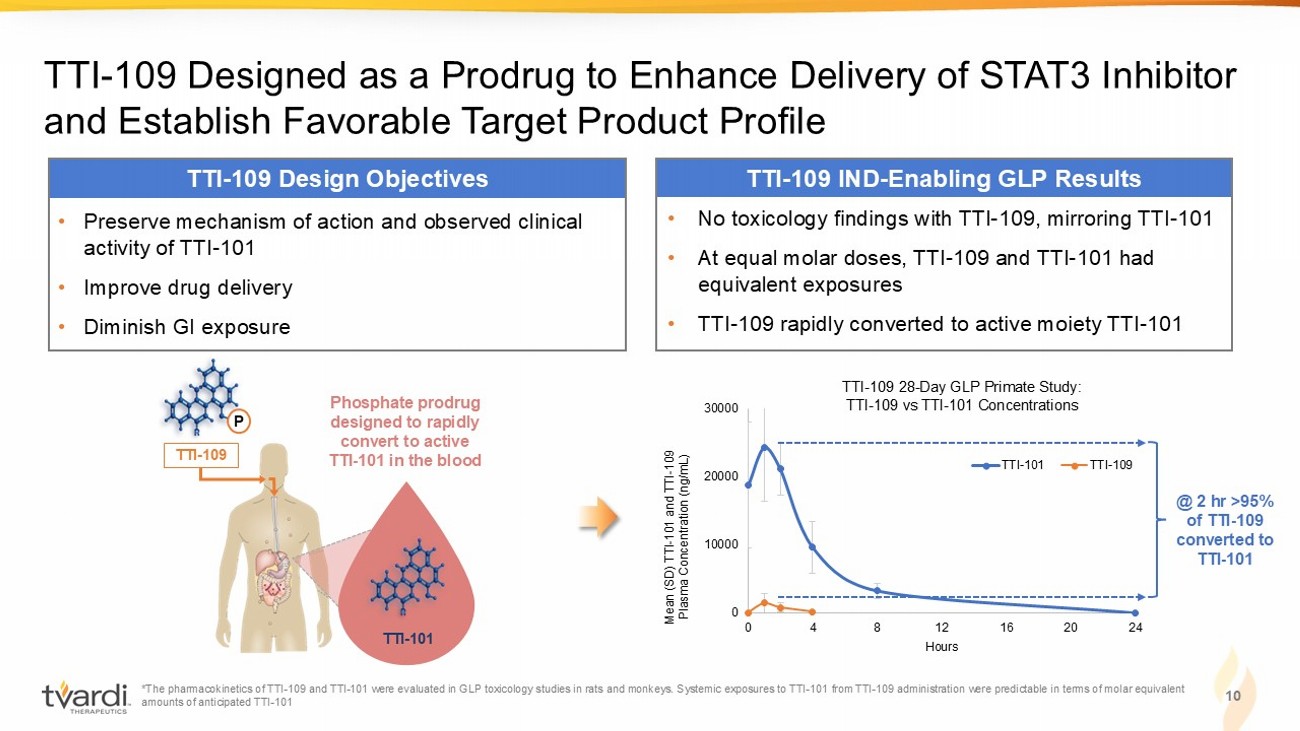
TTI - 109 Designed as a Prodrug to Enhance Delivery of STAT3 Inhibitor and Establish Favorable Target Product Profile TTI - 101 Phosphate prodrug designed to rapidly convert to active TTI - 101 in the blood P TTI - 109 10 TTI - 109 Design Objectives • Preserve mechanism of action and observed clinical activity of TTI - 101 • Improve drug delivery • Diminish GI exposure Mean (SD) TTI - 101 and TTI - 109 Plasma Concentration (ng/mL) 0 10000 20000 30000 0 4 8 12 16 20 24 TTI-101 TTI-109 *The pharmacokinetics of TTI - 109 and TTI - 101 were evaluated in GLP toxicology studies in rats and monkeys. Systemic exposures to TTI - 101 from TTI - 109 administration were predictable in terms of molar equivalent amounts of anticipated TTI - 101 @ 2 hr >95% of TTI - 109 converted to TTI - 101 TTI - 109 28 - Day GLP Primate Study: TTI - 109 vs TTI - 101 Concentrations TTI - 109 IND - Enabling GLP Results • No toxicology findings with TTI - 109, mirroring TTI - 101 • At equal molar doses, TTI - 109 and TTI - 101 had equivalent exposures • TTI - 109 rapidly converted to active moiety TTI - 101 Hours
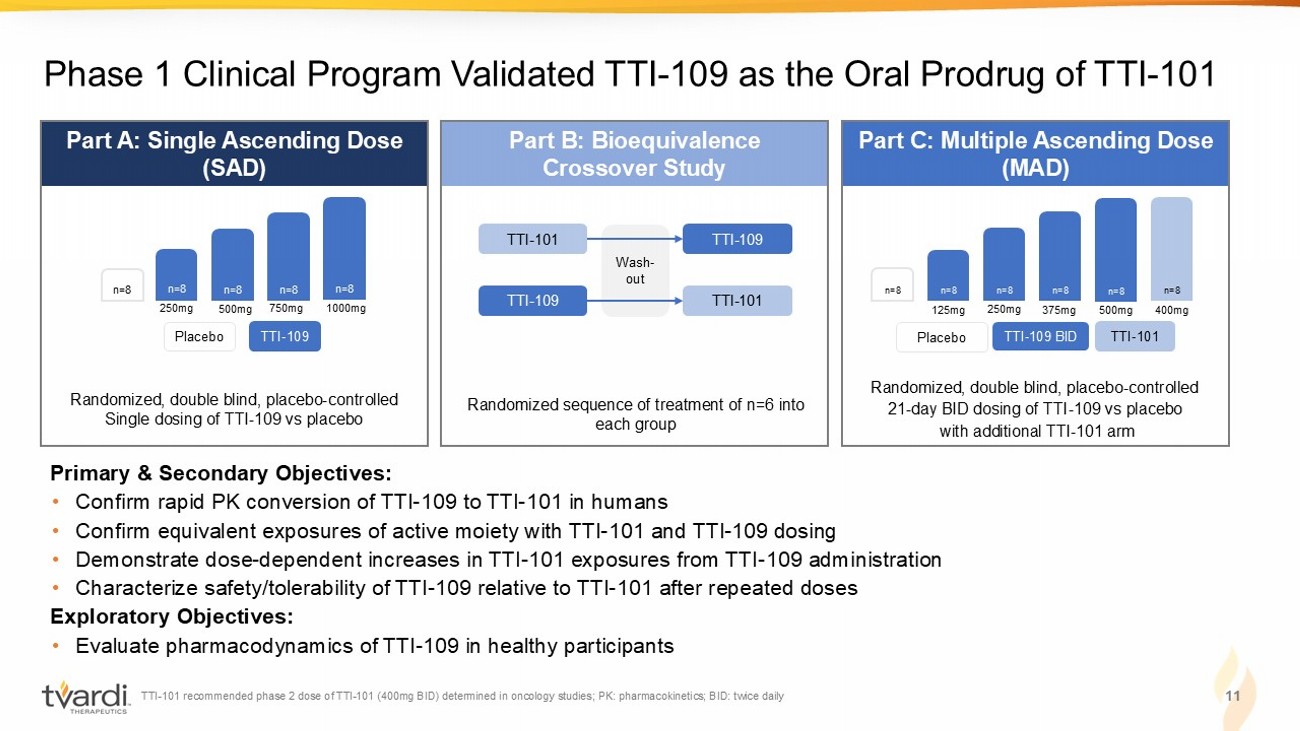
TTI - 101 recommended phase 2 dose of TTI - 101 (400mg BID) determined in oncology studies; PK: pharmacokinetics; BID: twice daily 11 Phase 1 Clinical Program Validated TTI - 109 as the Oral Prodrug of TTI - 101 Part B: Bioequivalence Crossover Study Randomized sequence of treatment of n=6 into each group TTI - 101 TTI - 109 TTI - 109 TTI - 101 Wash - out Part A: Single Ascending Dose (SAD) Primary & Secondary Objectives: • Confirm rapid PK conversion of TTI - 109 to TTI - 101 in humans • Confirm equivalent exposures of active moiety with TTI - 101 and TTI - 109 dosing • Demonstrate dose - dependent increases in TTI - 101 exposures from TTI - 109 administration • Characterize safety/tolerability of TTI - 109 relative to TTI - 101 after repeated doses Exploratory Objectives: • Evaluate pharmacodynamics of TTI - 109 in healthy participants TTI - 109 Placebo Part C: Multiple Ascending Dose (MAD) Randomized, double blind, placebo - controlled 21 - day BID dosing of TTI - 109 vs placebo with additional TTI - 101 arm TTI - 109 BID Placebo TTI - 101 n=8 n=8 n=8 n=8 n=8 n=8 n=8 n=8 n=8 n=8 n=8 Randomized, double blind, placebo - controlled Single dosing of TTI - 109 vs placebo 250mg 500mg 750mg 1000mg 125mg 250mg 375mg 500mg 400mg
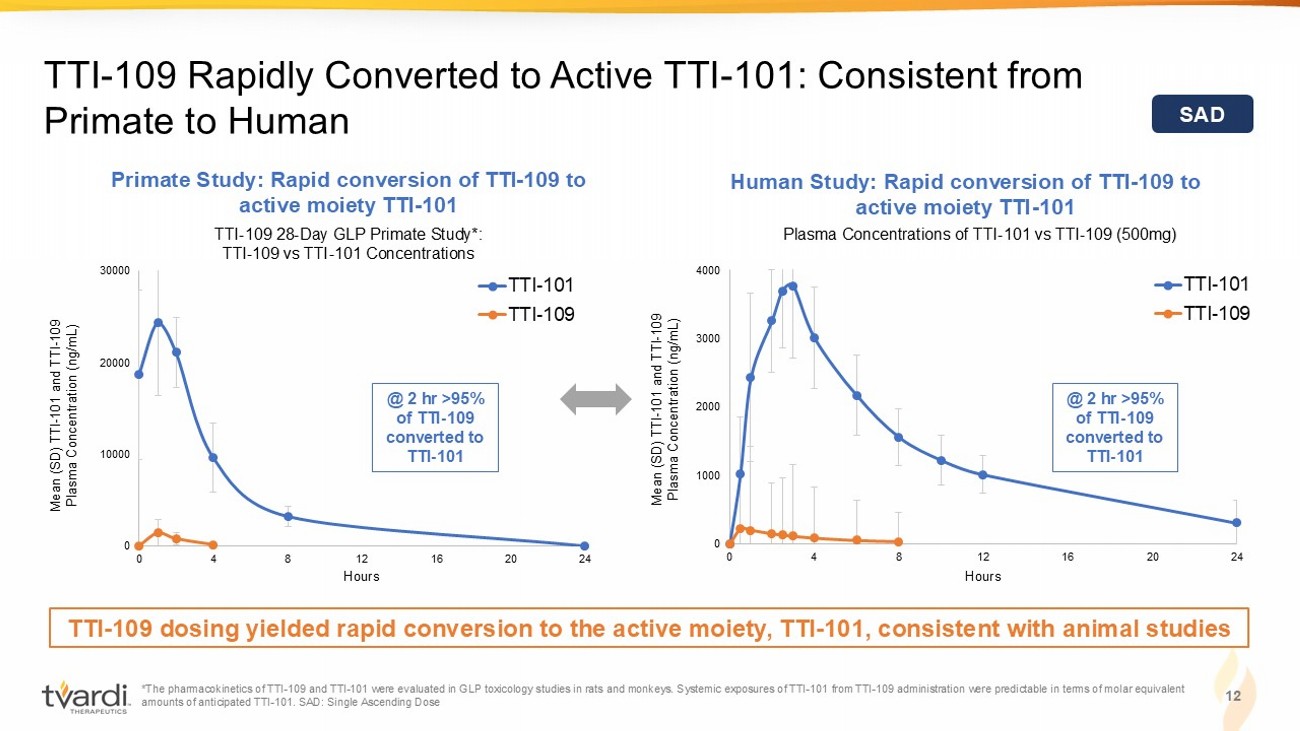
*The pharmacokinetics of TTI - 109 and TTI - 101 were evaluated in GLP toxicology studies in rats and monkeys. Systemic exposures of TTI - 101 from TTI - 109 administration were predictable in terms of molar equivalent amounts of anticipated TTI - 101. SAD: Single Ascending Dose 12 TTI - 109 Rapidly Converted to Active TTI - 101: Consistent from Primate to Human SAD Plasma Concentrations of TTI - 101 vs TTI - 109 (500mg) Primate Study: Rapid conversion of TTI - 109 to active moiety TTI - 101 Human Study: Rapid conversion of TTI - 109 to active moiety TTI - 101 TTI - 109 28 - Day GLP Primate Study*: TTI - 109 vs TTI - 101 Concentrations TTI - 109 dosing yielded rapid conversion to the active moiety, TTI - 101, consistent with animal studies Mean (SD) TTI - 101 and TTI - 109 Plasma Concentration (ng/mL) 0 10000 20000 30000 0 4 8 12 16 20 24 TTI-101 TTI-109 0 1000 2000 3000 4000 0 4 8 12 16 20 24 TTI-101 TTI-109 Mean (SD) TTI - 101 and TTI - 109 Plasma Concentration (ng/mL) @ 2 hr >95% of TTI - 109 converted to TTI - 101 @ 2 hr >95% of TTI - 109 converted to TTI - 101 Hours Hours
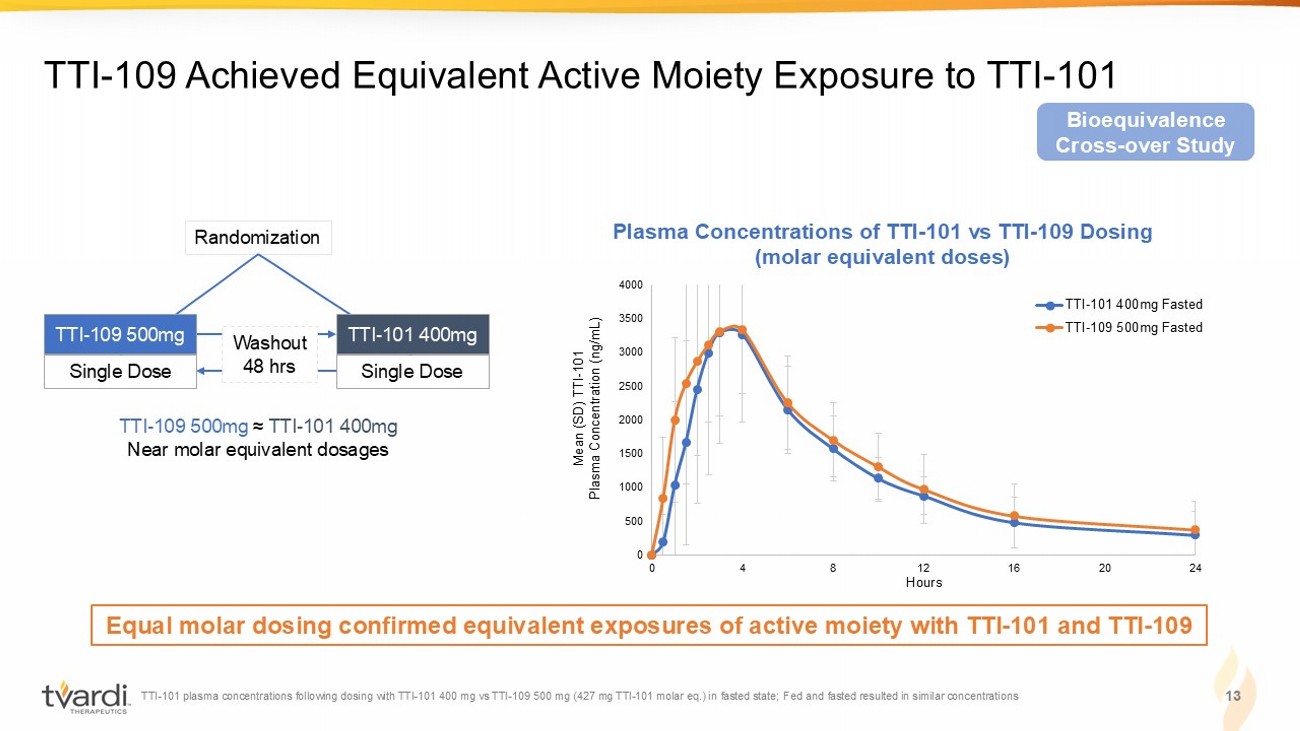
TTI - 101 plasma concentrations following dosing with TTI - 101 400 mg vs TTI - 109 500 mg (427 mg TTI - 101 molar eq.) in fasted state; Fed and fasted resulted in similar concentrations 13 TTI - 109 Achieved Equivalent Active Moiety Exposure to TTI - 101 Equal molar dosing confirmed equivalent exposures of active moiety with TTI - 101 and TTI - 109 Single Dose Single Dose Randomization Washout 48 hrs TTI - 109 500mg TTI - 101 400mg Bioequivalence Cross - over Study Plasma Concentrations of TTI - 101 vs TTI - 109 Dosing (molar equivalent doses) 0 500 1000 1500 2000 2500 3000 3500 4000 0 4 8 12 16 20 24 TTI-101 400mg Fasted TTI-109 500mg Fasted Mean (SD) TTI - 101 Plasma Concentration (ng/mL) TTI - 109 500mg ≈ TTI - 101 400mg Near molar equivalent dosages Hours
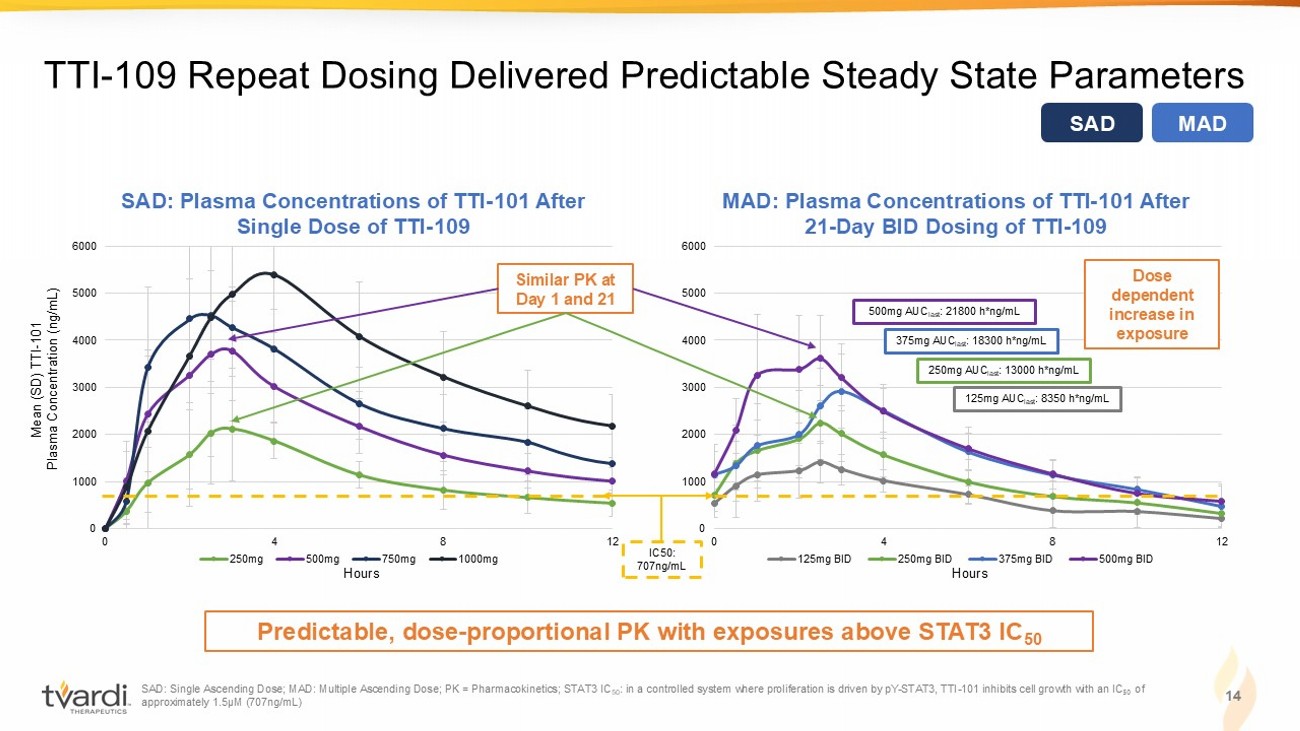
SAD: Single Ascending Dose; MAD: Multiple Ascending Dose; PK = Pharmacokinetics; STAT3 IC 50 : in a controlled system where proliferation is driven by pY - STAT3, TTI - 101 inhibits cell growth with an IC ₅₀ of approximately 1.5µM (707ng/mL) 14 TTI - 109 Repeat Dosing Delivered Predictable Steady State Parameters Predictable, dose - proportional PK with exposures above STAT3 IC 50 Mean (SD) TTI - 101 Plasma Concentration (ng/mL) 0 1000 2000 3000 4000 5000 6000 0 4 8 12 250mg 500mg 750mg 1000mg 0 1000 2000 3000 4000 5000 6000 0 4 8 12 125mg BID 250mg BID 375mg BID 500mg BID 500mg AUC last : 21800 h*ng/mL 375mg AUC last : 18300 h*ng/mL 250mg AUC last : 13000 h*ng/mL 125mg AUC last : 8350 h*ng/mL SAD: Plasma Concentrations of TTI - 101 After Single Dose of TTI - 109 MAD: Plasma Concentrations of TTI - 101 After 21 - Day BID Dosing of TTI - 109 Similar PK at Day 1 and 21 Dose dependent increase in exposure IC50: 707ng/mL SAD MAD Hours Hours
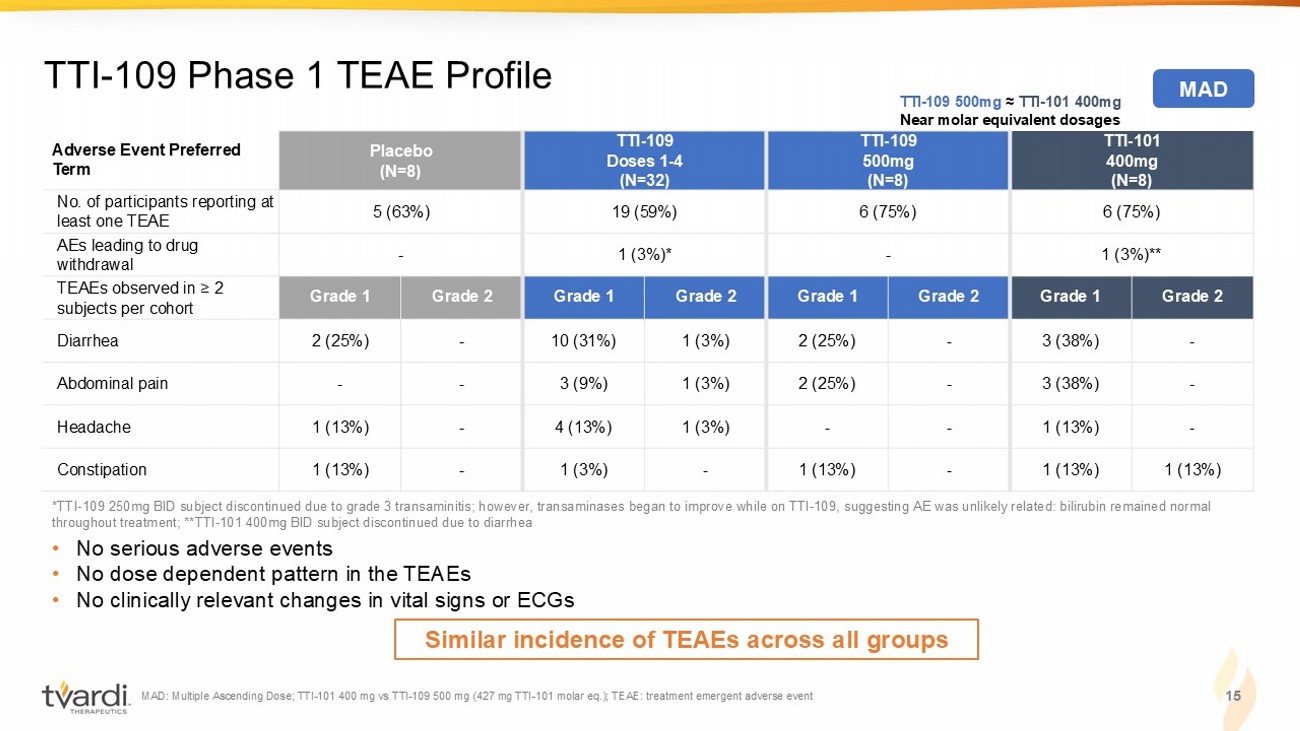
TTI - 101 400mg (N=8) TTI - 109 500mg (N=8) TTI - 109 Doses 1 - 4 (N=32) Placebo (N=8) Adverse Event Preferred Term 6 (75%) 6 (75%) 19 (59%) 5 (63%) No. of participants reporting at least one TEAE 1 (3%)** - 1 (3%)* - AEs leading to drug withdrawal Grade 2 Grade 1 Grade 2 Grade 1 Grade 2 Grade 1 Grade 2 Grade 1 TEAEs observed in ≥ 2 subjects per cohort - 3 (38%) - 2 (25%) 1 (3%) 10 (31%) - 2 (25%) Diarrhea - 3 (38%) - 2 (25%) 1 (3%) 3 (9%) - - Abdominal pain - 1 (13%) - - 1 (3%) 4 (13%) - 1 (13%) Headache 1 (13%) 1 (13%) - 1 (13%) - 1 (3%) - 1 (13%) Constipation MAD: Multiple Ascending Dose; TTI - 101 400 mg vs TTI - 109 500 mg (427 mg TTI - 101 molar eq.); TEAE: treatment emergent adverse even t 15 TTI - 109 Phase 1 TEAE Profile • No serious adverse events • No dose dependent pattern in the TEAEs • No clinically relevant changes in vital signs or ECGs TTI - 109 500mg ≈ TTI - 101 400mg Near molar equivalent dosages MAD Similar incidence of TEAEs across all groups *TTI - 109 250mg BID subject discontinued due to grade 3 transaminitis; however, transaminases began to improve while on TTI - 109, suggesting AE was unlikely related: bilirubin remained normal throughout treatment; **TTI - 101 400mg BID subject discontinued due to diarrhea
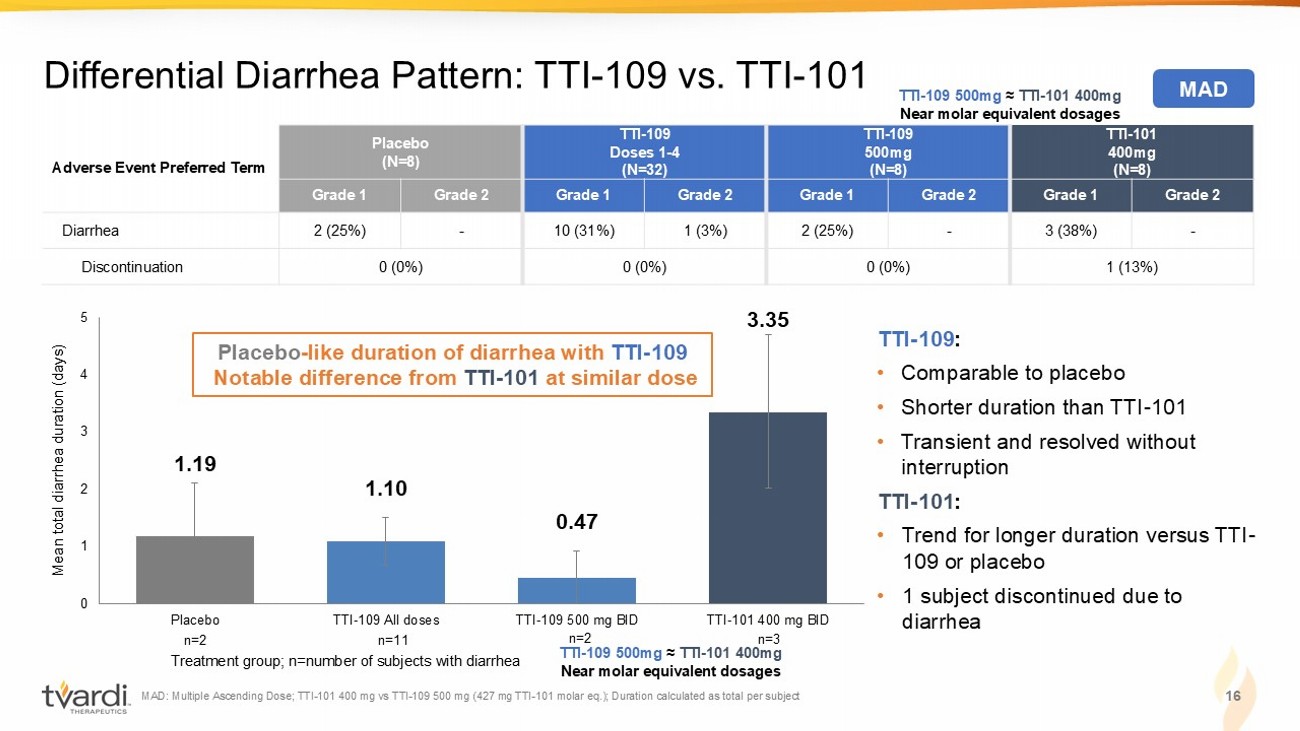
1.19 1.10 0.47 3.35 0 1 2 3 4 5 Placebo TTI-109 All doses TTI-109 500 mg BID TTI-101 400 mg BID TTI - 101 400mg (N=8) TTI - 109 500mg (N=8) TTI - 109 Doses 1 - 4 (N=32) Placebo (N=8) Adverse Event Preferred Term Grade 2 Grade 1 Grade 2 Grade 1 Grade 2 Grade 1 Grade 2 Grade 1 - 3 (38%) - 2 (25%) 1 (3%) 10 (31%) - 2 (25%) Diarrhea 1 (13%) 0 (0%) 0 (0%) 0 (0%) Discontinuation MAD: Multiple Ascending Dose; TTI - 101 400 mg vs TTI - 109 500 mg (427 mg TTI - 101 molar eq.); Duration calculated as total per subj ect 16 Differential Diarrhea Pattern: TTI - 109 vs. TTI - 101 TTI - 109 : • Comparable to placebo • Shorter duration than TTI - 101 • Transient and resolved without interruption TTI - 101 : • Trend for longer duration versus TTI - 109 or placebo • 1 subject discontinued due to diarrhea Mean total diarrhea duration (days) Treatment group; n=number of subjects with diarrhea Placebo - like duration of diarrhea with TTI - 109 Notable difference from TTI - 101 at similar dose MAD TTI - 109 500mg ≈ TTI - 101 400mg Near molar equivalent dosages n=2 n=11 n=2 n=3 TTI - 109 500mg ≈ TTI - 101 400mg Near molar equivalent dosages
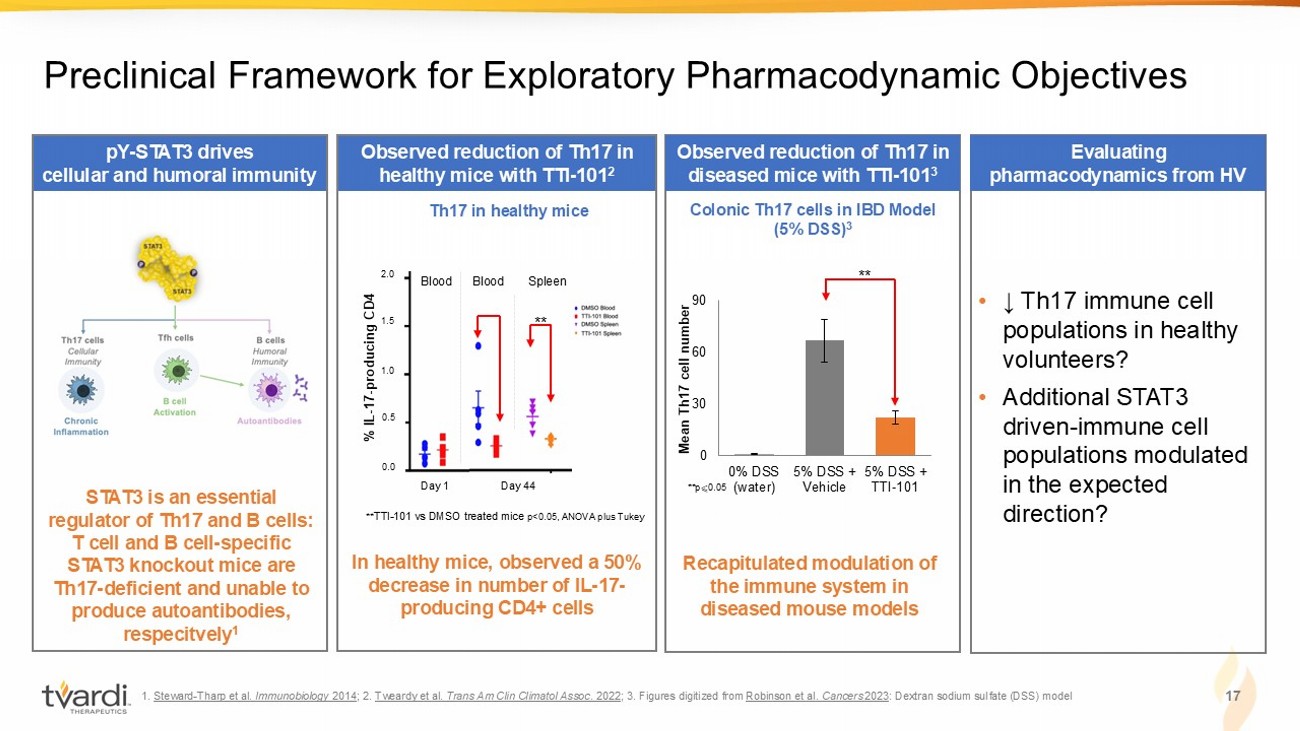
1. Steward - Tharp et al. Immunobiology 2014 ; 2. Tweardy et al. Trans Am Clin Climatol Assoc . 2022 ; 3. Figures digitized from Robinson et al. Cancers 2023 : Dextran sodium sulfate (DSS) model 17 Preclinical Framework for Exploratory Pharmacodynamic Objectives pY - STAT3 drives cellular and humoral immunity STAT3 is an essential regulator of Th17 and B cells: T cell and B cell - specific STAT3 knockout mice are Th17 - deficient and unable to produce autoantibodies, respecitvely 1 Observed reduction of Th17 in diseased mice with TTI - 101 3 Recapitulated modulation of the immune system in diseased mouse models 0 30 60 90 0% DSS (water) 5% DSS + Vehicle 5% DSS + TTI-101 Mean Th17 cell number **p ⩽ 0.05 Colonic Th17 cells in IBD Model (5% DSS) 3 ** Th17 in healthy mice Observed reduction of Th17 in healthy mice with TTI - 101 2 In healthy mice, observed a 50% decrease in number of IL - 17 - producing CD4+ cells Day 1 Day 44 Blood Blood Spleen ** TTI - 101 vs DMSO treated mice p<0.05, ANOVA plus Tukey 2.0 1.5 1.0 0.5 0.0 % IL - 17 - producing CD4 ** Evaluating pharmacodynamics from HV • ↓ Th17 immune cell populations in healthy volunteers? • Additional STAT3 driven - immune cell populations modulated in the expected direction?
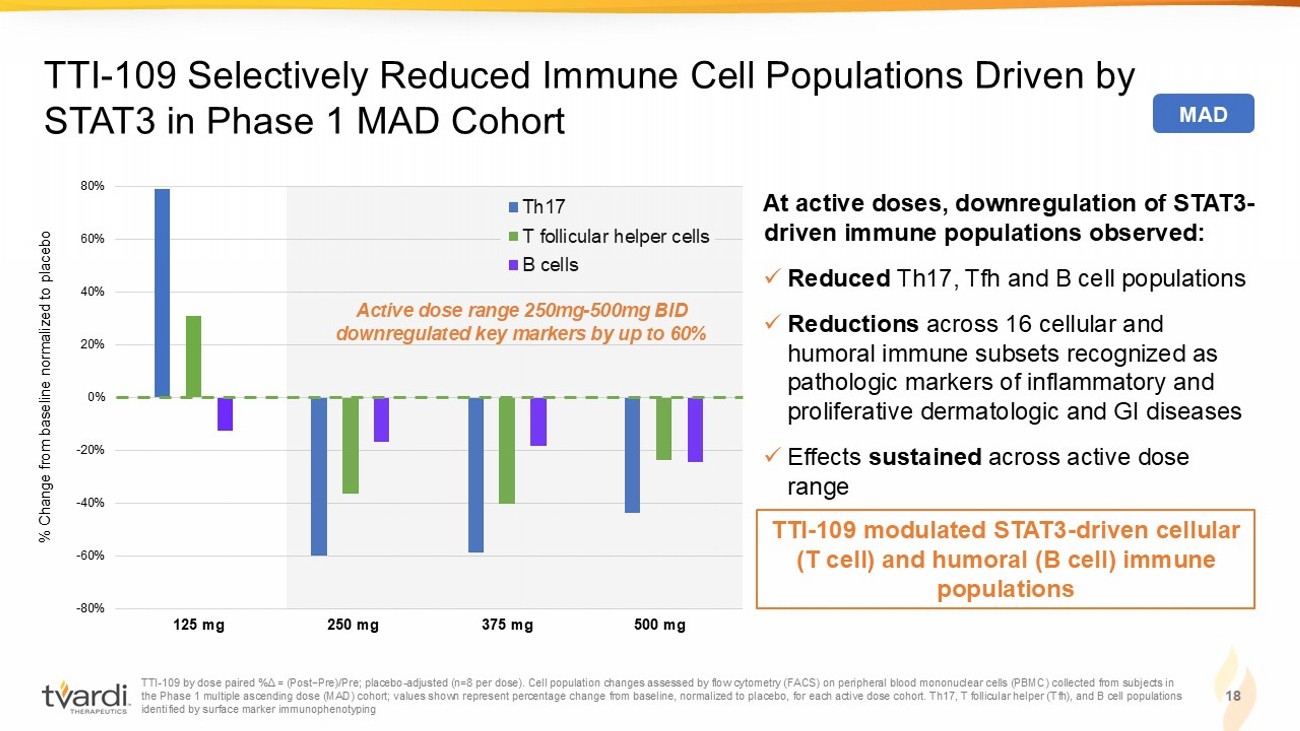
-80% -60% -40% -20% 0% 20% 40% 60% 80% Adj % Δ D1 Adj % Δ D2 Adj % Δ D3 Adj % Δ D4 Th17 T follicular helper cells B cells TTI - 109 by dose paired % Δ = ( Post−Pre)/Pre; placebo - adjusted (n=8 per dose). Cell population changes assessed by flow cytometry (FACS) on peripheral blood mo nonuclear cells (PBMC) collected from subjects in the Phase 1 multiple ascending dose (MAD) cohort; values shown represent percentage change from baseline, normalized to place bo, for each active dose cohort. Th17, T follicular helper ( Tfh ), and B cell populations identified by surface marker immunophenotyping 18 TTI - 109 Selectively Reduced Immune Cell Populations Driven by STAT3 in Phase 1 MAD Cohort At active doses, downregulation of STAT3 - driven immune populations observed: x Reduced Th17, Tfh and B cell populations x Reductions across 16 cellular and humoral immune subsets recognized as pathologic markers of inflammatory and proliferative dermatologic and GI diseases x Effects sustained across active dose range 125 mg 250 mg 375 mg 500 mg Active dose range 250mg - 500mg BID downregulated key markers by up to 60% % Change from baseline normalized to placebo MAD TTI - 109 modulated STAT3 - driven cellular (T cell) and humoral (B cell) immune populations
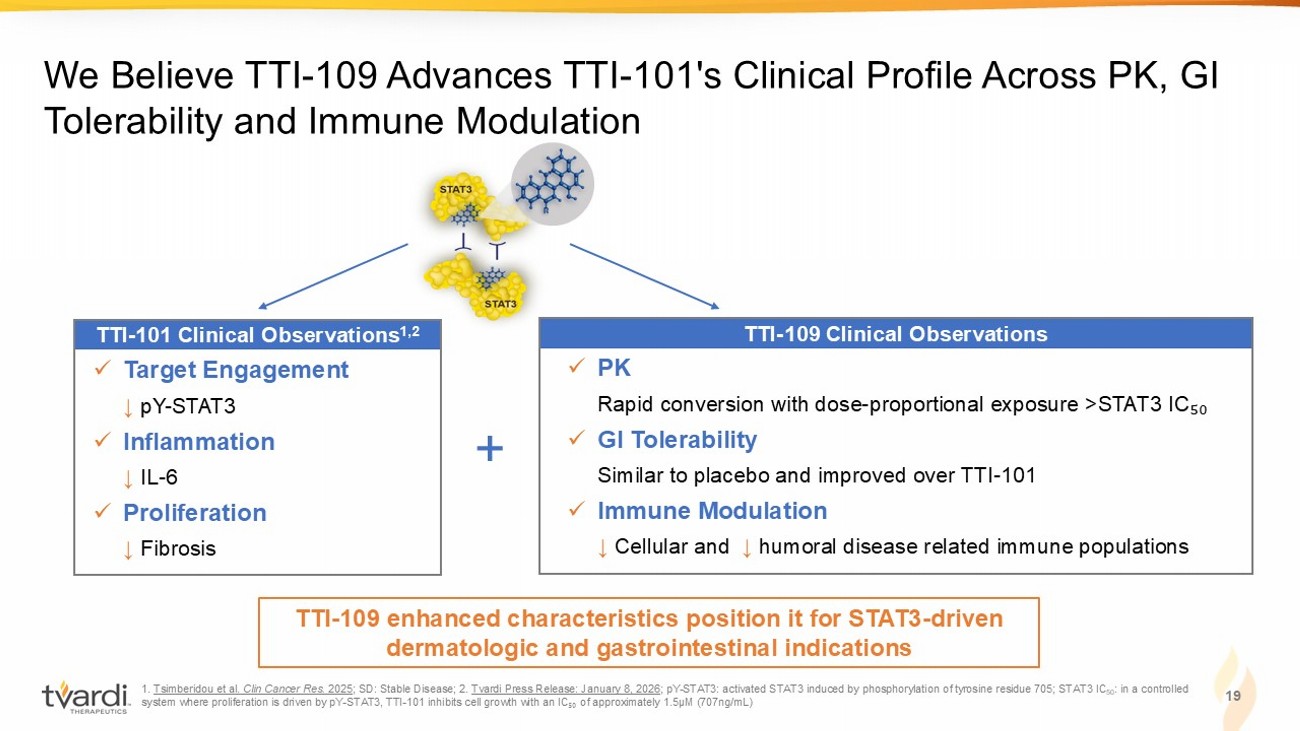
1. Tsimberidou et al. Clin Cancer Res. 2025 ; SD: Stable Disease; 2. Tvardi Press Release: January 8, 2026 ; pY - STAT3: activated STAT3 induced by phosphorylation of tyrosine residue 705; STAT3 IC 50 : in a controlled system where proliferation is driven by pY - STAT3, TTI - 101 inhibits cell growth with an IC ₅₀ of approximately 1.5µM (707ng/mL) We Believe TTI - 109 Advances TTI - 101's Clinical Profile Across PK, GI Tolerability and Immune Modulation 19 TTI - 109 enhanced characteristics position it for STAT3 - driven dermatologic and gastrointestinal indications TTI - 101 Clinical Observations 1,2 x Target Engagement ↓ pY - STAT3 x Inflammation ↓ IL - 6 x Proliferation ↓ Fibrosis TTI - 109 Clinical Observations x PK Rapid conversion with dose - proportional exposure >STAT3 IC ₅₀ x GI Tolerability Similar to placebo and improved over TTI - 101 x Immune Modulation ↓ Cellular and ↓ humoral disease related immune populations +
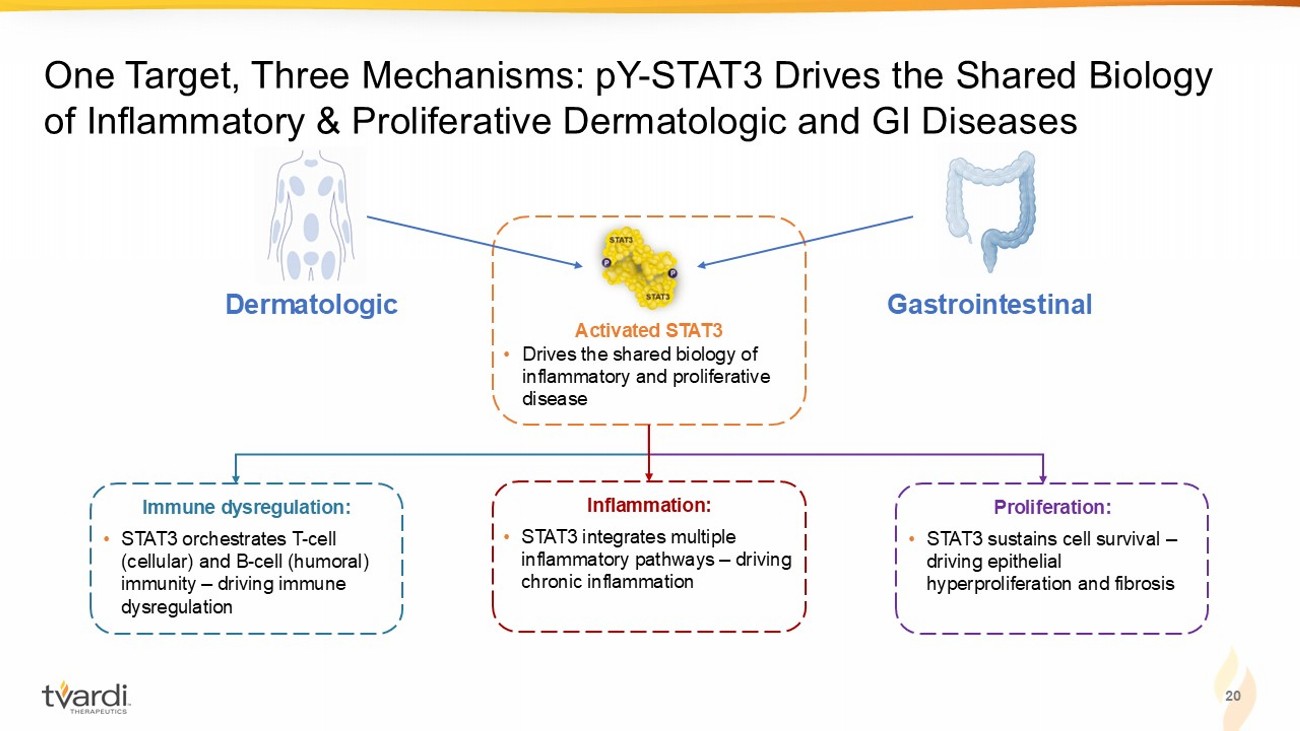
20 One Target, Three Mechanisms: pY - STAT3 Drives the Shared Biology of Inflammatory & Proliferative Dermatologic and GI Diseases Gastrointestinal Dermatologic Immune dysregulation: • STAT3 orchestrates T - cell (cellular) and B - cell (humoral) immunity – driving immune dysregulation Inflammation: • STAT3 integrates multiple inflammatory pathways – driving chronic inflammation Proliferation: • STAT3 sustains cell survival – driving epithelial hyperproliferation and fibrosis Activated STAT3 • Drives the shared biology of inflammatory and proliferative disease
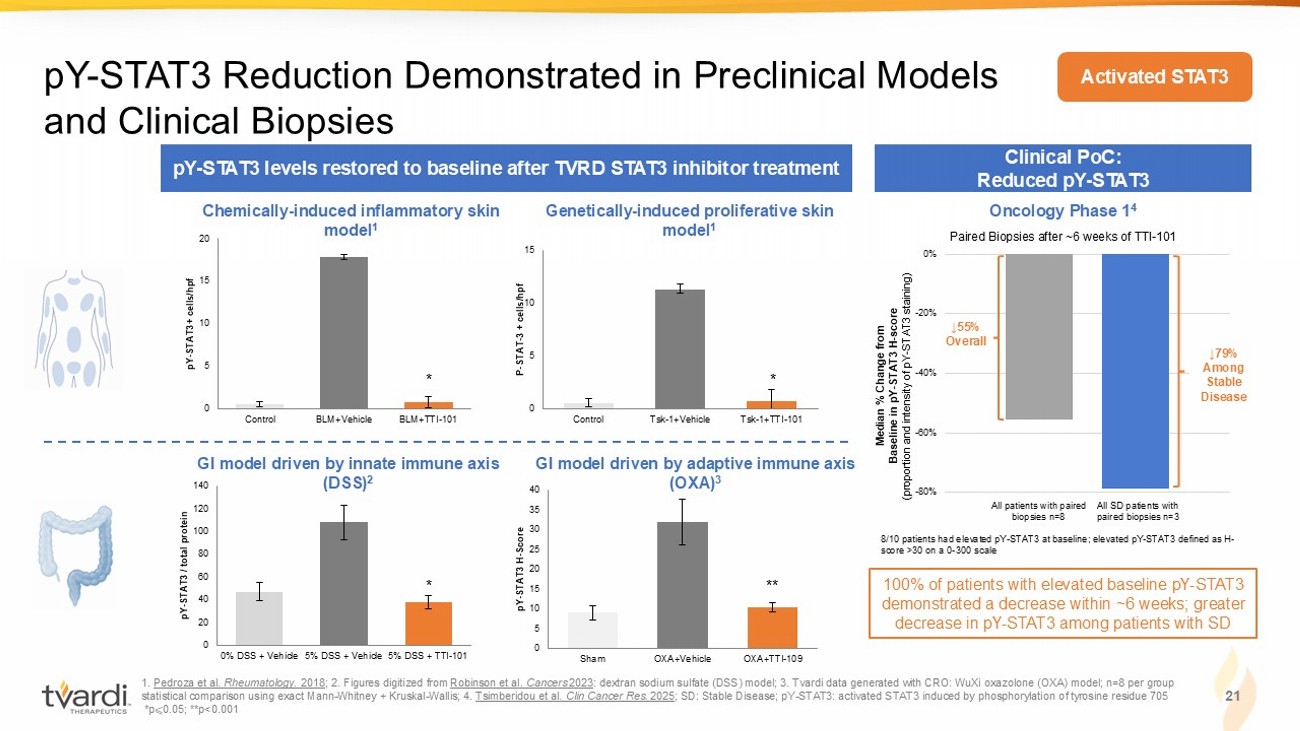
1. Pedroza et al. Rheumatology. 2018 ; 2. Figures digitized from Robinson et al. Cancers 2023 : dextran sodium sulfate (DSS) model; 3. Tvardi data generated with CRO: WuXi oxazolone (OXA) model; n=8 per group statistical comparison using exact Mann - Whitney + Kruskal - Wallis; 4. Tsimberidou et al. Clin Cancer Res. 2025 ; SD: Stable Disease; pY - STAT3: activated STAT3 induced by phosphorylation of tyrosine residue 705 *p ⩽ 0.05; **p<0.001 21 pY - STAT3 Reduction Demonstrated in Preclinical Models and Clinical Biopsies pY - STAT3 levels restored to baseline after TVRD STAT3 inhibitor treatment Clinical PoC: Reduced pY - STAT3 Median % Change from Baseline in pY - STAT3 H - score (proportion and intensity of pY - STAT3 staining) All patients with paired biopsies n=8 All SD patients with paired biopsies n=3 -80% -60% -40% -20% 0% ↓79% Among Stable Disease 8/10 patients had elevated pY - STAT3 at baseline; elevated pY - STAT3 defined as H - score >30 on a 0 - 300 scale ↓55% Overall Paired Biopsies after ~6 weeks of TTI - 101 100% of patients with elevated baseline pY - STAT3 demonstrated a decrease within ~6 weeks; greater decrease in pY - STAT3 among patients with SD 0 5 10 15 20 Control BLM+Vehicle BLM+TTI-101 pY - STAT3+ cells/hpf Chemically - induced inflammatory skin model 1 Genetically - induced proliferative skin model 1 0 5 10 15 Control Tsk-1+Vehicle Tsk-1+TTI-101 P - STAT - 3 + cells/hpf * * 0 20 40 60 80 100 120 140 0% DSS + Vehicle 5% DSS + Vehicle 5% DSS + TTI-101 pY - STAT3 / total protein 0 5 10 15 20 25 30 35 40 Sham OXA+Vehicle OXA+TTI-109 pY - STAT3 H - Score * ** GI model driven by innate immune axis (DSS) 2 GI model driven by adaptive immune axis (OXA) 3 Oncology Phase 1 4 Activated STAT3
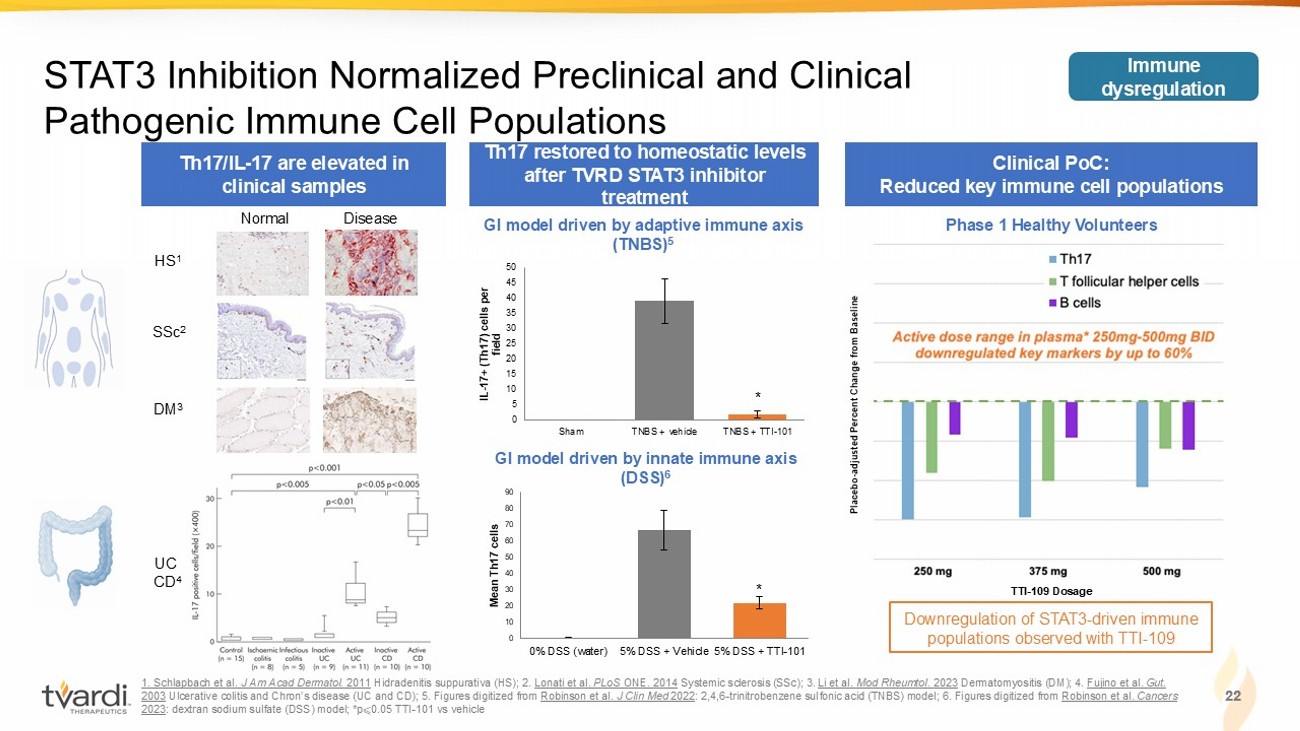
0 5 10 15 20 25 30 35 40 45 50 Sham TNBS + vehicle TNBS + TTI-101 IL - 17+ (Th17) cells per field 1. Schlapbach et al. J Am Acad Dermatol. 2011 Hidradenitis suppurativa (HS); 2. Lonati et al. PLoS ONE. 2014 Systemic sclerosis ( SSc ); 3. Li et al. Mod Rheumtol. 2023 Dermatomyositis (DM); 4. Fujino et al. Gut. 2003 Ulcerative colitis and Chron’s disease (UC and CD); 5. Figures digitized from Robinson et al. J Clin Med 2022 : 2,4,6 - trinitrobenzene sulfonic acid (TNBS) model; 6. Figures digitized from Robinson et al. Cancers 2023 : dextran sodium sulfate (DSS) model; *p ⩽ 0.05 TTI - 101 vs vehicle 22 STAT3 Inhibition Normalized Preclinical and Clinical Pathogenic Immune Cell Populations Th17 restored to homeostatic levels after TVRD STAT3 inhibitor treatment Clinical PoC: Reduced key immune cell populations * Phase 1 Healthy Volunteers TTI - 109 Dosage Placebo - adjusted Percent Change from Baseline 0 10 20 30 40 50 60 70 80 90 0% DSS (water) 5% DSS + Vehicle 5% DSS + TTI-101 Mean Th17 cells 22 GI model driven by innate immune axis (DSS) 6 Normal HS 1 Disease Th17/IL - 17 are elevated in clinical samples SSc 2 DM 3 GI model driven by adaptive immune axis (TNBS) 5 UC CD 4 * Downregulation of STAT3 - driven immune populations observed with TTI - 109 Immune dysregulation
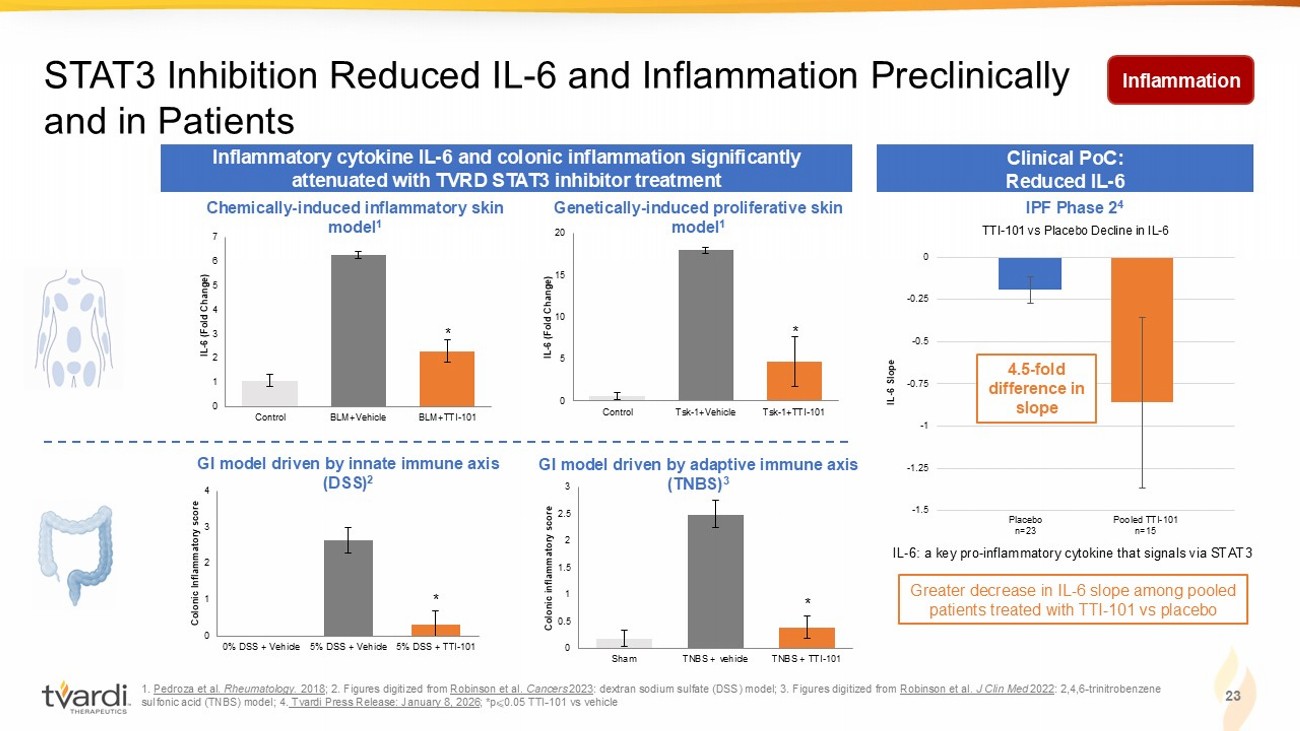
0 0.5 1 1.5 2 2.5 3 Sham TNBS + vehicle TNBS + TTI-101 Colonic inflammatory score 1. Pedroza et al. Rheumatology. 2018 ; 2. Figures digitized from Robinson et al. Cancers 2023 : dextran sodium sulfate (DSS) model; 3. Figures digitized from Robinson et al. J Clin Med 2022 : 2,4,6 - trinitrobenzene sulfonic acid (TNBS) model; 4. Tvardi Press Release: January 8, 2026 ; *p ⩽ 0.05 TTI - 101 vs vehicle 23 STAT3 Inhibition Reduced IL - 6 and Inflammation Preclinically and in Patients Inflammatory cytokine IL - 6 and colonic inflammation significantly attenuated with TVRD STAT3 inhibitor treatment Clinical PoC: Reduced IL - 6 Chemically - induced inflammatory skin model 1 Genetically - induced proliferative skin model 1 * * * * GI model driven by innate immune axis (DSS) 2 GI model driven by adaptive immune axis (TNBS) 3 IPF Phase 2 4 0 1 2 3 4 5 6 7 Control BLM+Vehicle BLM+TTI-101 IL - 6 (Fold Change) 0 5 10 15 20 Control Tsk-1+Vehicle Tsk-1+TTI-101 IL - 6 (Fold Change) 0 1 2 3 4 0% DSS + Vehicle 5% DSS + Vehicle 5% DSS + TTI-101 Colonic Inflammatory score Greater decrease in IL - 6 slope among pooled patients treated with TTI - 101 vs placebo IL - 6: a key pro - inflammatory cytokine that signals via STAT3 -1.5 -1.25 -1 -0.75 -0.5 -0.25 0 TTI - 101 vs Placebo Decline in IL - 6 IL - 6 Slope 4.5 - fold difference in slope Placebo n=23 Pooled TTI - 101 n=15 * * * Inflammation
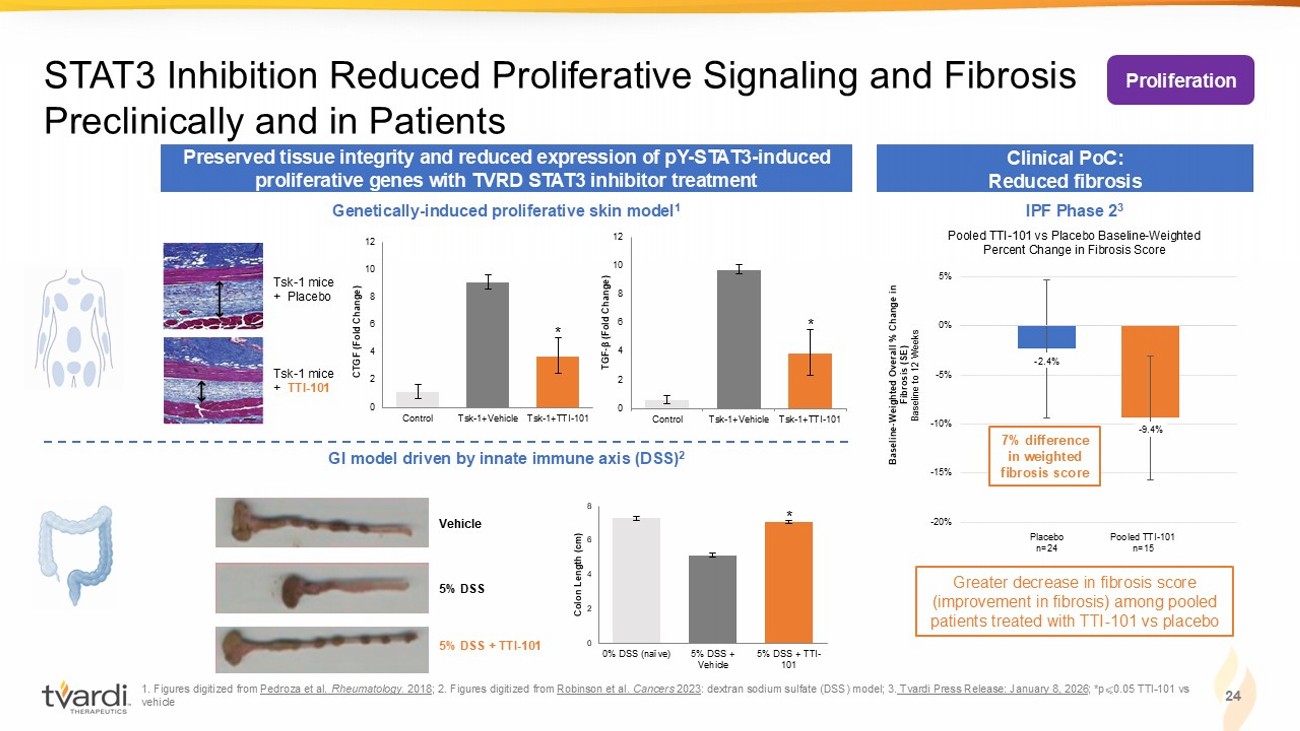
1. Figures digitized from Pedroza et al. Rheumatology. 2018 ; 2. Figures digitized from Robinson et al. Cancers 2023 : dextran sodium sulfate (DSS) model; 3. Tvardi Press Release: January 8, 2026 ; *p ⩽ 0.05 TTI - 101 vs vehicle 24 STAT3 Inhibition Reduced Proliferative Signaling and Fibrosis Preclinically and in Patients Preserved tissue integrity and reduced expression of pY - STAT3 - induced proliferative genes with TVRD STAT3 inhibitor treatment Clinical PoC: Reduced fibrosis Genetically - induced proliferative skin model 1 GI model driven by innate immune axis (DSS) 2 Tsk - 1 mice + Placebo Tsk - 1 mice + TTI - 101 Vehicle 5% DSS 5% DSS + TTI - 101 0 2 4 6 8 0% DSS (naïve) 5% DSS + Vehicle 5% DSS + TTI- 101 Colon Length (cm) * 0 2 4 6 8 10 12 Control Tsk-1+Vehicle Tsk-1+TTI-101 TGF - β ( Fold Change) * 0 2 4 6 8 10 12 Control Tsk-1+Vehicle Tsk-1+TTI-101 CTGF (Fold Change) * Greater decrease in fibrosis score (improvement in fibrosis) among pooled patients treated with TTI - 101 vs placebo - 2.4% - 9.4% -20% -15% -10% -5% 0% 5% Pooled TTI - 101 vs Placebo Baseline - Weighted Percent Change in Fibrosis Score Baseline - Weighted Overall % Change in Fibrosis (SE) Baseline to 12 Weeks Placebo n=24 Pooled TTI - 101 n=15 7% difference in weighted fibrosis score IPF Phase 2 3 Proliferation
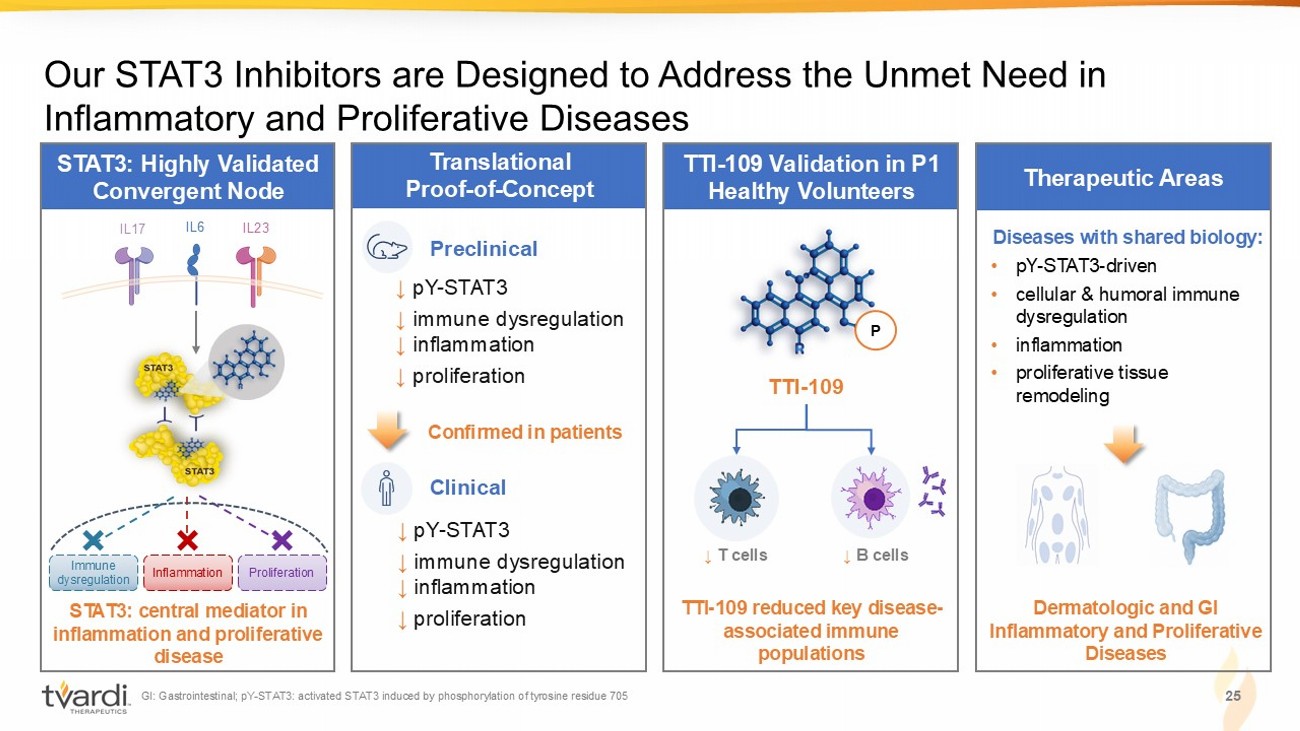
STAT3: Highly Validated Convergent Node Translational Proof - of - Concept STAT3: central mediator in inflammation and proliferative disease Our STAT3 Inhibitors are Designed to Address the Unmet Need in Inflammatory and Proliferative Diseases IL6 IL17 I L23 TTI - 109 Validation in P1 Healthy Volunteers TTI - 109 reduced key disease - associated immune populations Therapeutic Areas Diseases with shared biology: • pY - STAT3 - driven • cellular & humoral immune dysregulation • inflammation • proliferative tissue remodeling Dermatologic and GI Inflammatory and Proliferative Diseases Preclinical ↓ pY - STAT3 ↓ immune dysregulation ↓ inflammation ↓ proliferation Clinical Confirmed in patients P TTI - 109 ↓ B cells ↓ T cells 25 GI: Gastrointestinal; pY - STAT3: activated STAT3 induced by phosphorylation of tyrosine residue 705 ↓ pY - STAT3 ↓ immune dysregulation ↓ inflammation ↓ proliferation Immune dysregulation Inflammation Proliferation

TTI - 101 in HCC
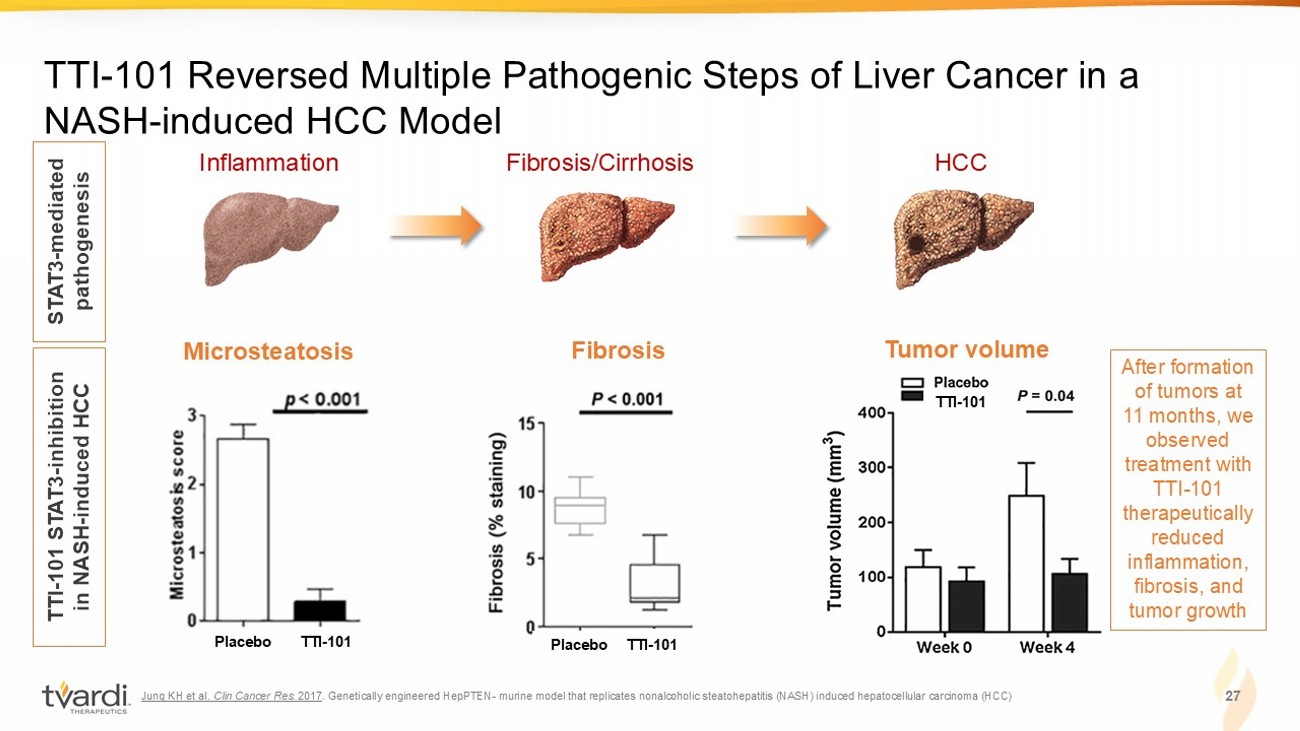
Jung KH et al. Clin Cancer Res. 2017 . Genetically engineered HepPTEN - murine model that replicates nonalcoholic steatohepatitis (NASH) induced hepatocellular carcin oma (HCC) 27 TTI - 101 Reversed Multiple Pathogenic Steps of Liver Cancer in a NASH - induced HCC Model Inflammation Fibrosis/Cirrhosis HCC STAT3 - mediated pathogenesis TTI - 101 STAT3 - inhibition in NASH - induced HCC TTI - 101 Tumor volume Microsteatosis Placebo TTI - 101 TTI - 101 Fibrosis Placebo TTI - 101 After formation of tumors at 11 months, we observed treatment with TTI - 101 therapeutically reduced inflammation, fibrosis, and tumor growth
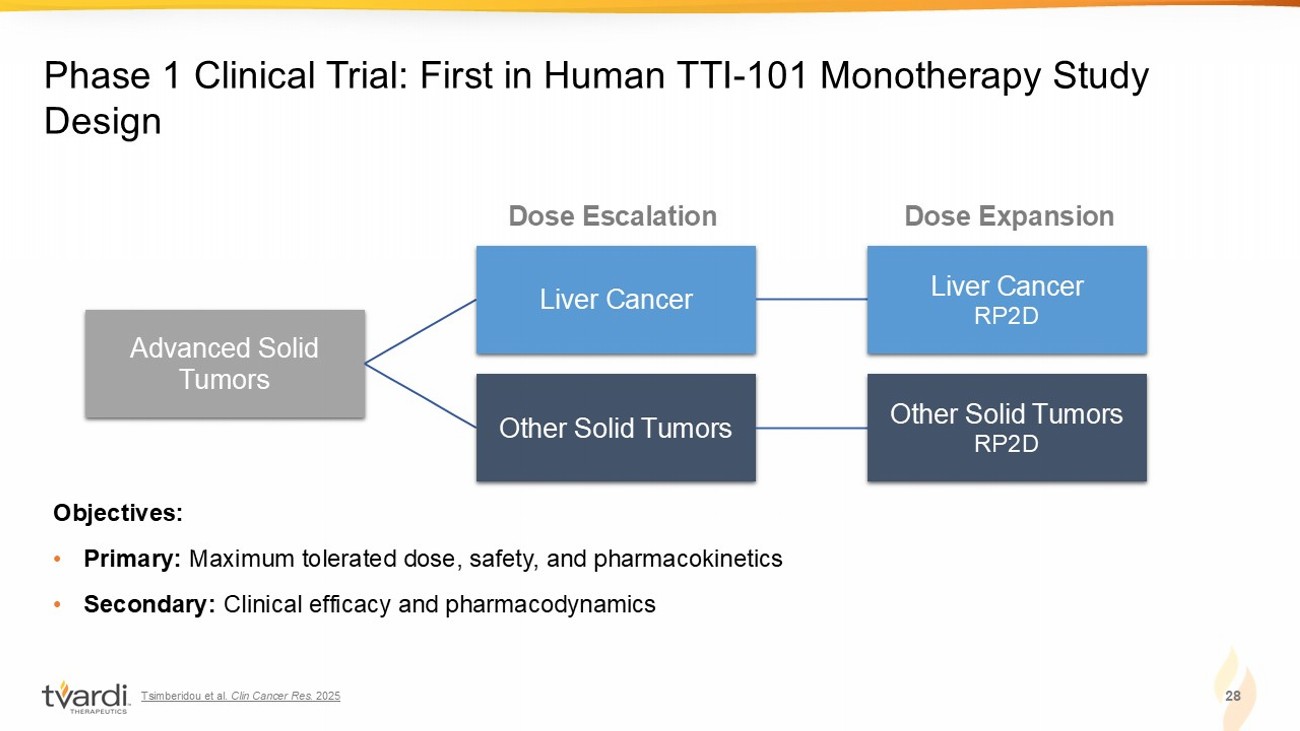
Tsimberidou et al. Clin Cancer Res. 2025 28 Phase 1 Clinical Trial: First in Human TTI - 101 Monotherapy Study Design Advanced Solid Tumors Liver Cancer Liver Cancer RP2D Other Solid Tumors Other Solid Tumors RP2D Objectives: • Primary: Maximum tolerated dose, safety, and pharmacokinetics • Secondary: Clinical efficacy and pharmacodynamics Dose Escalation Dose Expansion
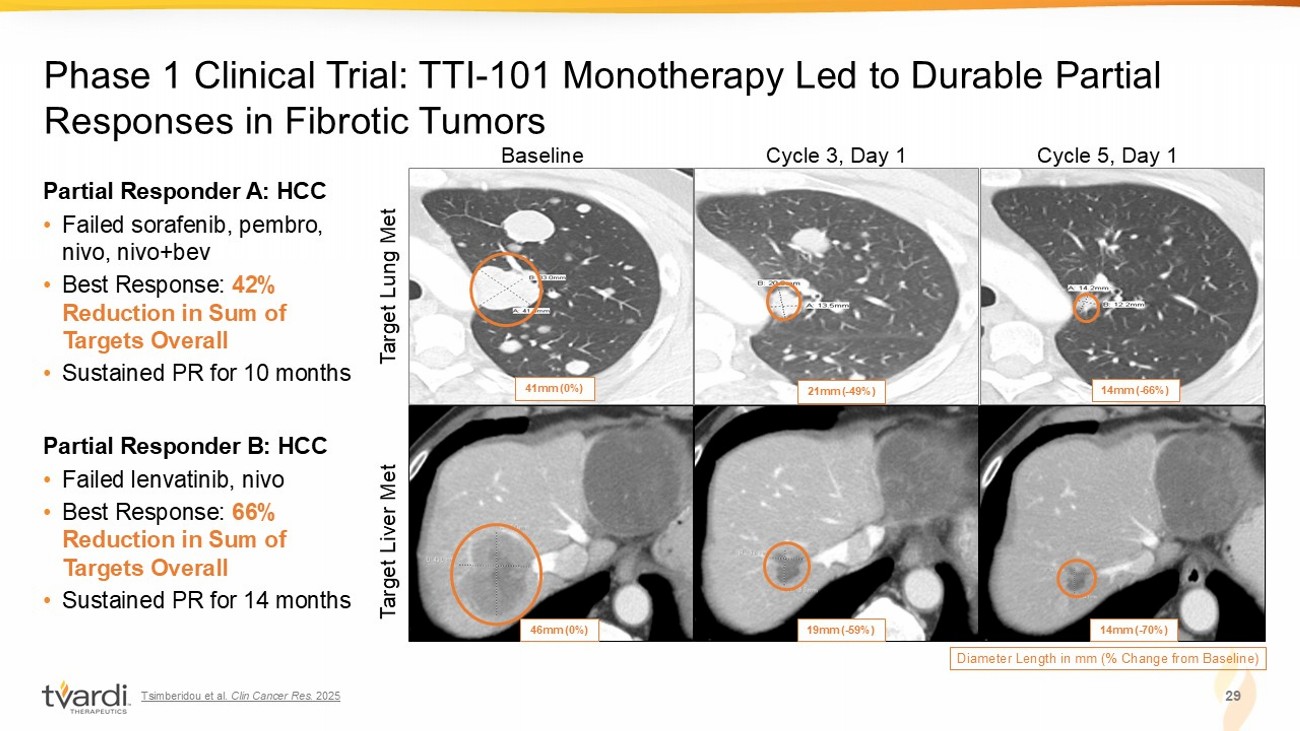
Tsimberidou et al. Clin Cancer Res. 2025 29 Phase 1 Clinical Trial: TTI - 101 Monotherapy Led to Durable Partial Responses in Fibrotic Tumors Baseline Cycle 5, Day 1 Cycle 3, Day 1 Diameter Length in mm (% Change from Baseline) 41mm (0%) 14mm ( - 66%) 21mm ( - 49%) 14mm ( - 70%) 19mm ( - 59%) 46mm (0%) Target Lung Met Target Liver Met Partial Responder A: HCC • Failed sorafenib, pembro, nivo, nivo+bev • Best Response: 42% Reduction in Sum of Targets Overall • Sustained PR for 10 months Partial Responder B: HCC • Failed lenvatinib, nivo • Best Response: 66% Reduction in Sum of Targets Overall • Sustained PR for 14 months
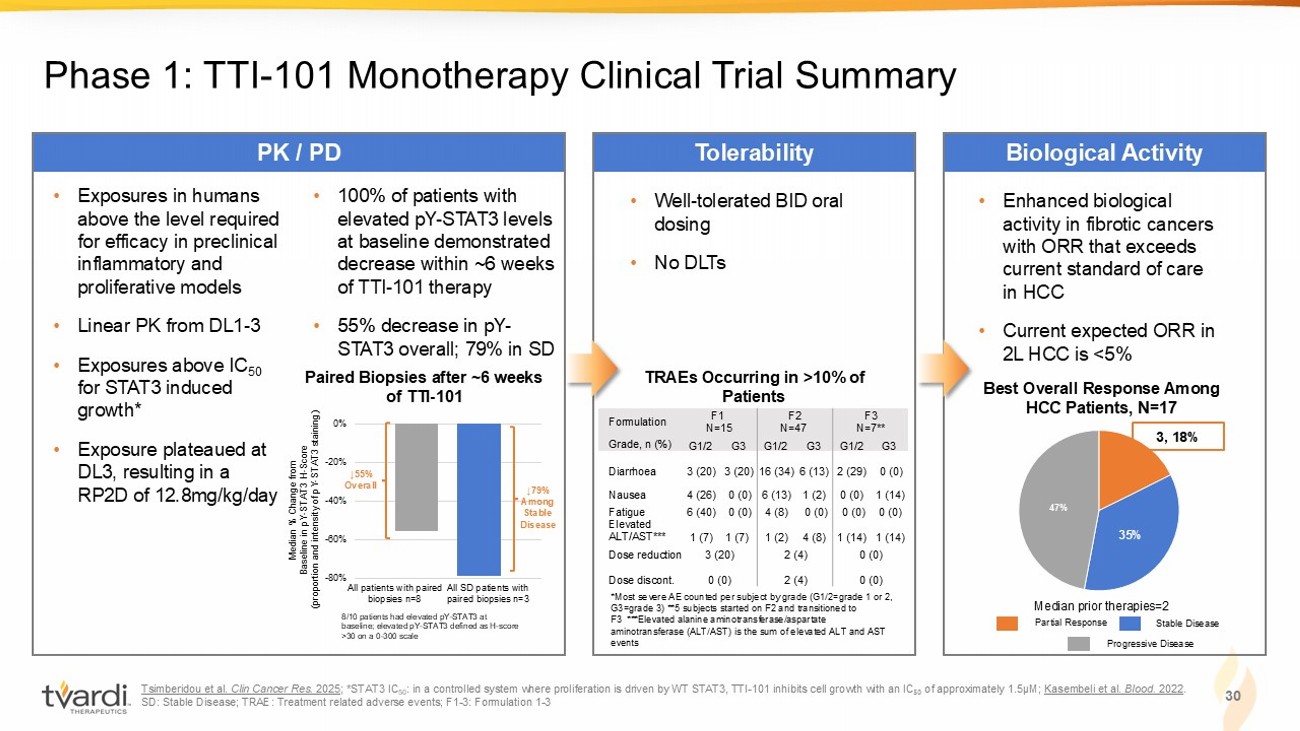
Tsimberidou et al. Clin Cancer Res. 2025 ; *STAT3 IC 50 : in a controlled system where proliferation is driven by WT STAT3, TTI - 101 inhibits cell growth with an IC ₅₀ of approximately 1.5µM; Kasembeli et al. Blood. 2022 . SD: Stable Disease; TRAE: Treatment related adverse events; F1 - 3: Formulation 1 - 3 30 Phase 1: TTI - 101 Monotherapy Clinical Trial Summary Tolerability PK / PD Biological Activity • Well - t olerated BID oral dosing • No DLTs *Most severe AE counted per subject by grade (G1/2=grade 1 or 2, G3=grade 3) **5 subjects started on F2 and transitioned to F3 ***Elevated alanine aminotransferase/aspartate aminotransferase (ALT/AST) is the sum of elevated ALT and AST events TRAEs Occurring in >10% of Patients • Exposure s in humans above the level required for efficacy in preclinical inflammatory and proliferative models • Linear PK from DL1 - 3 • Exposures above IC 50 for STAT3 induced growth* • Exposure plateaued at DL3, resulting in a RP2D of 12.8mg/kg/day Median % Change from Baseline in pY - STAT3 H - Score (proportion and intensity of pY - STAT3 staining) All patients with paired biopsies n=8 All SD patients with paired biopsies n=3 -80% -60% -40% -20% 0% ↓79% Among Stable Disease 8/10 patients had elevated pY - STAT3 at baseline; elevated pY - STAT3 defined as H - score >30 on a 0 - 300 scale ↓55% Overall • 100% of patients with elevated pY - STAT3 levels at baseline demonstrated decrease within ~6 weeks of TTI - 101 therapy • 55% decrease in pY - STAT3 overall; 79% in SD • Enhanced biological activity in fibrotic cancers with ORR that exceeds current standard of care in HCC • Current expected ORR in 2L HCC is <5% 35% 47% 3, 18% Best Overall Response Among HCC Patients, N=17 Median prior therapies=2 Paired Biopsies after ~6 weeks of TTI - 101 Partial Response Stable Disease Progressive Disease F3 N=7** F2 N=47 F1 N=15 Formulation G3 G1/2 G3 G1/2 G3 G1/2 Grade, n (%) 0 (0) 2 (29) 6 (13) 16 (34) 3 (20) 3 (20) Diarrhoea 1 (14) 0 (0) 1 (2) 6 (13) 0 (0) 4 (26) Nausea 0 (0) 0 (0) 0 (0) 4 (8) 0 (0) 6 (40) Fatigue 1 (14) 1 (14) 4 (8) 1 (2) 1 (7) 1 (7) Elevated ALT/AST*** 0 (0) 2 (4) 3 (20) Dose reduction 0 (0) 2 (4) 0 (0) Dose discont.
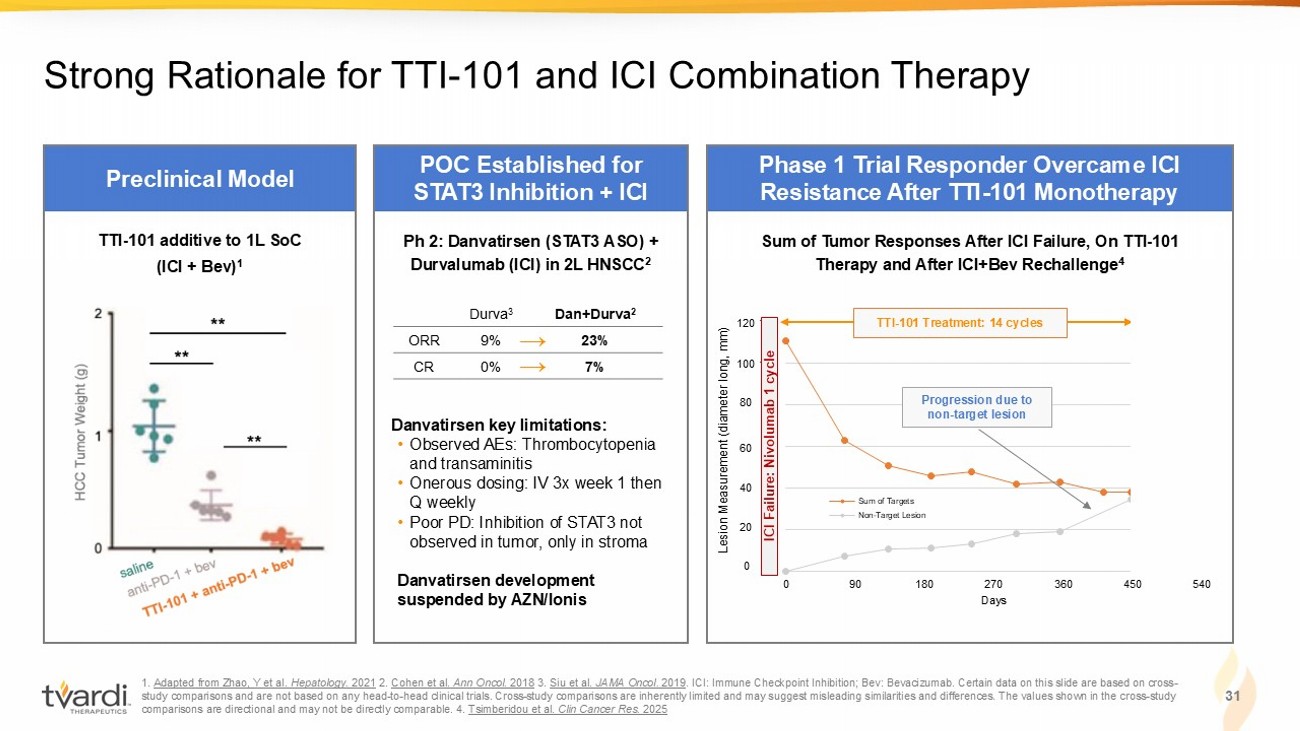
1. Adapted from Zhao, Y et al. Hepatology. 2021 2. Cohen et al. Ann Oncol. 2018 3. Siu et al. JAMA Oncol. 2019 . ICI: Immune Checkpoint Inhibition; Bev: Bevacizumab. Certain data on this slide are based on cross - study comparisons and are not based on any head - to - head clinical trials. C ross - study comparisons are inherently limited and may suggest misleading similarities and differences. The values shown in the c ross - study comparisons are directional and may not be directly comparable. 4. Tsimberidou et al. Clin Cancer Res. 2025 31 Strong Rationale for TTI - 101 and ICI Combination Therapy 0 20 40 60 80 100 120 0 90 180 270 360 450 540 Days Sum of Targets Non-Target Lesion Preclinical Model POC Established for STAT3 Inhibition + ICI Phase 1 Trial Responder Overcame ICI Resistance After TTI - 101 Monotherapy → → Ph 2: Danvatirsen (STAT3 ASO) + Durvalumab (ICI) in 2L HNSCC 2 Danvatirsen key limitations: • Observed AEs: Thrombocytopenia and transaminitis • Onerous dosing: IV 3x week 1 then Q weekly • Poor PD: Inhibition of STAT3 not observed in tumor, only in stroma Danvatirsen development suspended by AZN/Ionis Dan+Durva 2 Durva 3 23% 9% ORR 7% 0% CR TTI - 101 additive to 1L SoC (ICI + Bev) 1 Progression due to non - target lesion New Response ICI + Bev Rechallenge Sum of Tumor Responses After ICI Failure, On TTI - 101 Therapy and After ICI+Bev Rechallenge 4 0 20 40 60 80 100 120 ICI Failure: Nivolumab 1 cycle Lesion Measurement (diameter long, mm) TTI - 101 Treatment: 14 cycles
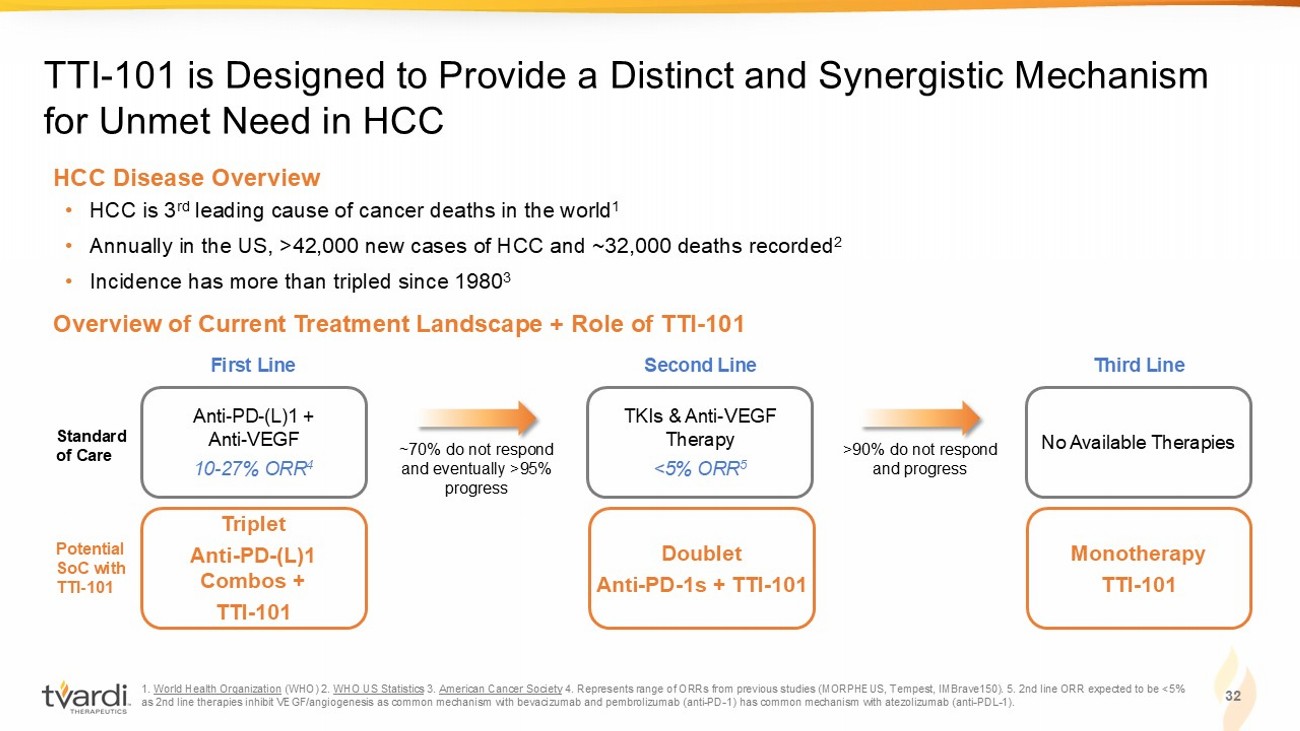
1. World Health Organization (WHO) 2. WHO US Statistics 3. American Cancer Society 4. Represents range of ORRs from previous studies (MORPHEUS, Tempest, IMBrave150). 5. 2nd line ORR expected to be <5% as 2nd line therapies inhibit VEGF/angiogenesis as common mechanism with bevacizumab and pembrolizumab (anti - PD - 1) has common me chanism with atezolizumab (anti - PDL - 1). 32 TTI - 101 is Designed to Provide a Distinct and Synergistic Mechanism for Unmet Need in HCC Overview of Current Treatment Landscape + Role of TTI - 101 • HCC is 3 rd leading cause of cancer deaths in the world 1 • Annually in the US, >42,000 new cases of HCC and ~32,000 deaths recorded 2 • Incidence has more than tripled since 1980 3 HCC Disease Overview Triplet Anti - PD - (L)1 Combos + TTI - 101 Potential SoC with TTI - 101 Doublet Anti - PD - 1s + TTI - 101 Monotherapy TTI - 101 Anti - PD - (L)1 + Anti - VEGF 10 - 27% ORR 4 Standard of Care First Line TKIs & Anti - VEGF Therapy <5% ORR 5 Second Line No Available Therapies Third Line ~70% do not respond and eventually >95% progress >90% do not respond and progress
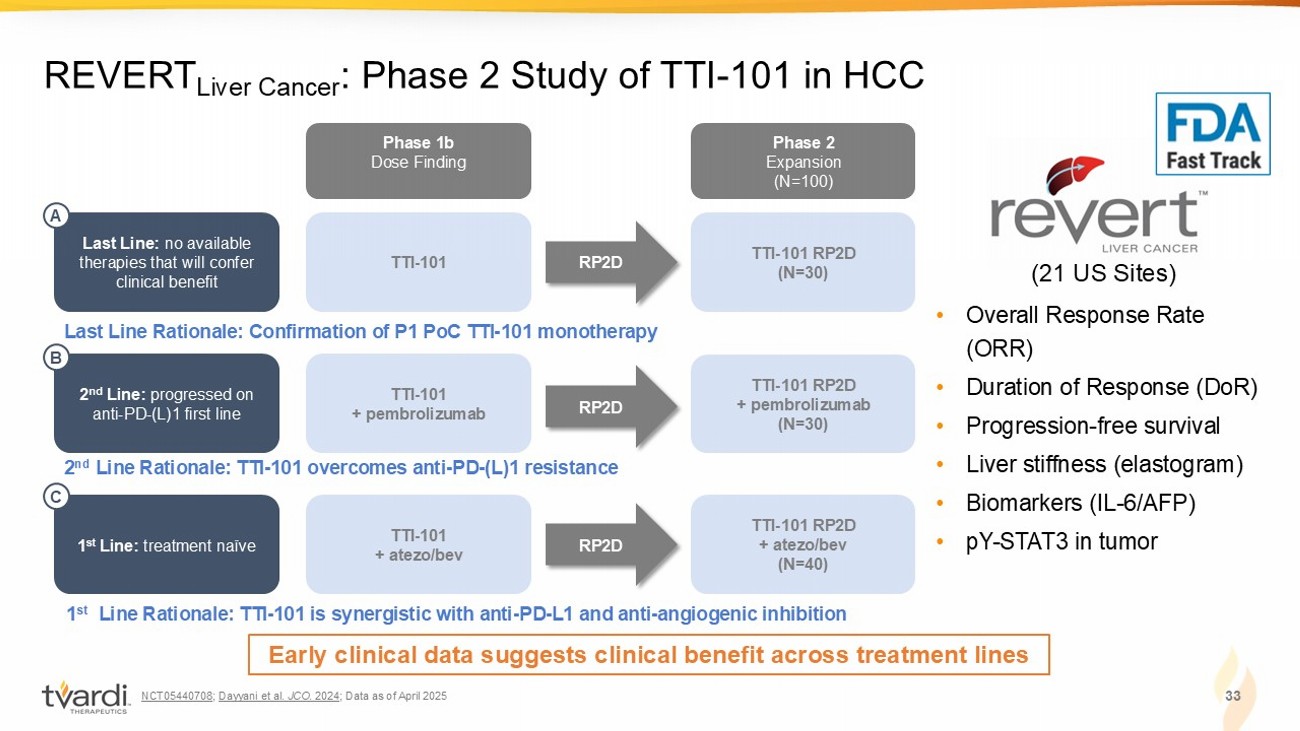
NCT05440708 ; Dayyani et al. JCO . 2024 ; Data as of April 2025 33 REVERT Liver Cancer : Phase 2 Study of TTI - 101 in HCC • Overall Response Rate (ORR) • Duration of Response (DoR) • Progression - free survival • Liver stiffness (elastogram) • Biomarkers (IL - 6/AFP) • pY - STAT3 in tumor (21 US Sites) Phase 1b Dose Finding Phase 2 Expansion (N=100) TTI - 101 RP2D (N=30) TTI - 101 Last Line: no available therapies that will confer clinical benefit RP2D Last Line Rationale: Confirmation of P1 PoC TTI - 101 monotherapy A TTI - 101 RP2D + pembrolizumab (N=30) TTI - 101 + pembrolizumab RP2D 2 nd Line Rationale: TTI - 101 overcomes anti - PD - (L)1 resistance 2 nd Line: progressed on anti - PD - (L)1 first line B TTI - 101 RP2D + atezo/bev (N=40) TTI - 101 + atezo/bev RP2D 1 st Line Rationale: TTI - 101 is synergistic with anti - PD - L1 and anti - angiogenic inhibition 1 st Line : treatment naïve C Early clinical data suggests clinical benefit across treatment lines
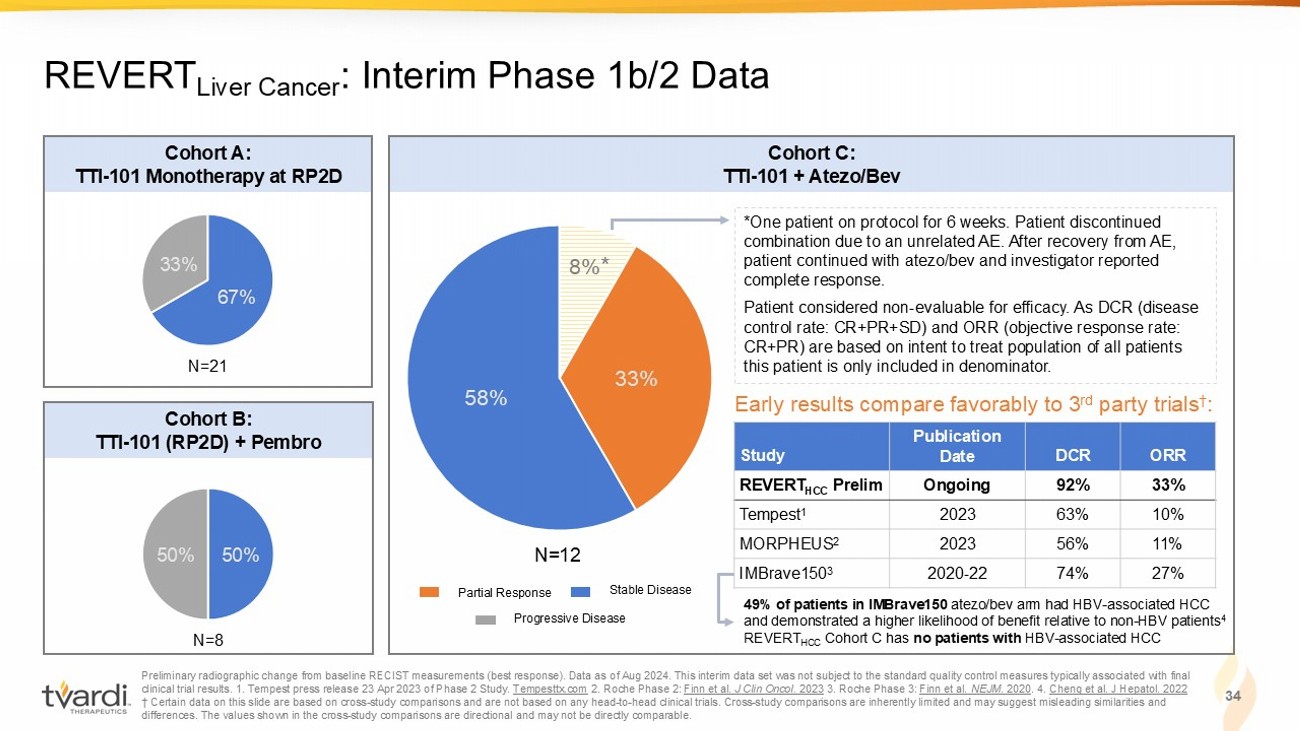
Preliminary radiographic change from baseline RECIST measurements (best response). Data as of Aug 2024. This interim data set wa s not subject to the standard quality control measures typically associated with final clinical trial results. 1. Tempest press release 23 Apr 2023 of Phase 2 Study. Tempesttx.com 2. Roche Phase 2: Finn et al. J Clin Oncol. 2023 3. Roche Phase 3: Finn et al. NEJM . 2020 . 4 . Cheng et al. J Hepatol. 2022 † Certain data on this slide are based on cross - study comparisons and are not based on any head - to - head clinical trials. Cross - s tudy comparisons are inherently limited and may suggest misleading similarities and differences. The values shown in the cross - study comparisons are directional and may not be directly comparable. 34 REVERT Liver Cancer : Interim Phase 1b/2 Data 67% 33% 50% 50% 8% 33% 58% Cohort A: TTI - 101 Monotherapy at RP2D Cohort B: TTI - 101 (RP2D) + Pembro Cohort C: TTI - 101 + Atezo/Bev *One patient on protocol for 6 weeks. Patient discontinued combination due to an unrelated AE. After recovery from AE, patient continued with atezo/bev and investigator reported complete response. Patient considered non - evaluable for efficacy. As DCR (disease control rate: CR+PR+SD) and ORR (objective response rate: CR+PR) are based on intent to treat population of all patients this patient is only included in denominator. N=21 N=8 N=12 ORR DCR Publication Date Study 33% 92% Ongoing REVERT HCC Prelim 10% 63% 2023 Tempest 1 11% 56% 2023 MORPHEUS 2 27% 74% 2020 - 22 IMBrave150 3 Early results compare favorably to 3 rd party trials † : Partial Response Stable Disease Progressive Disease * 49% of patients in IMBrave150 atezo/bev arm had HBV - associated HCC and demonstrated a higher likelihood of benefit relative to non - HBV patients 4 REVERT HCC Cohort C has no patients with HBV - associated HCC
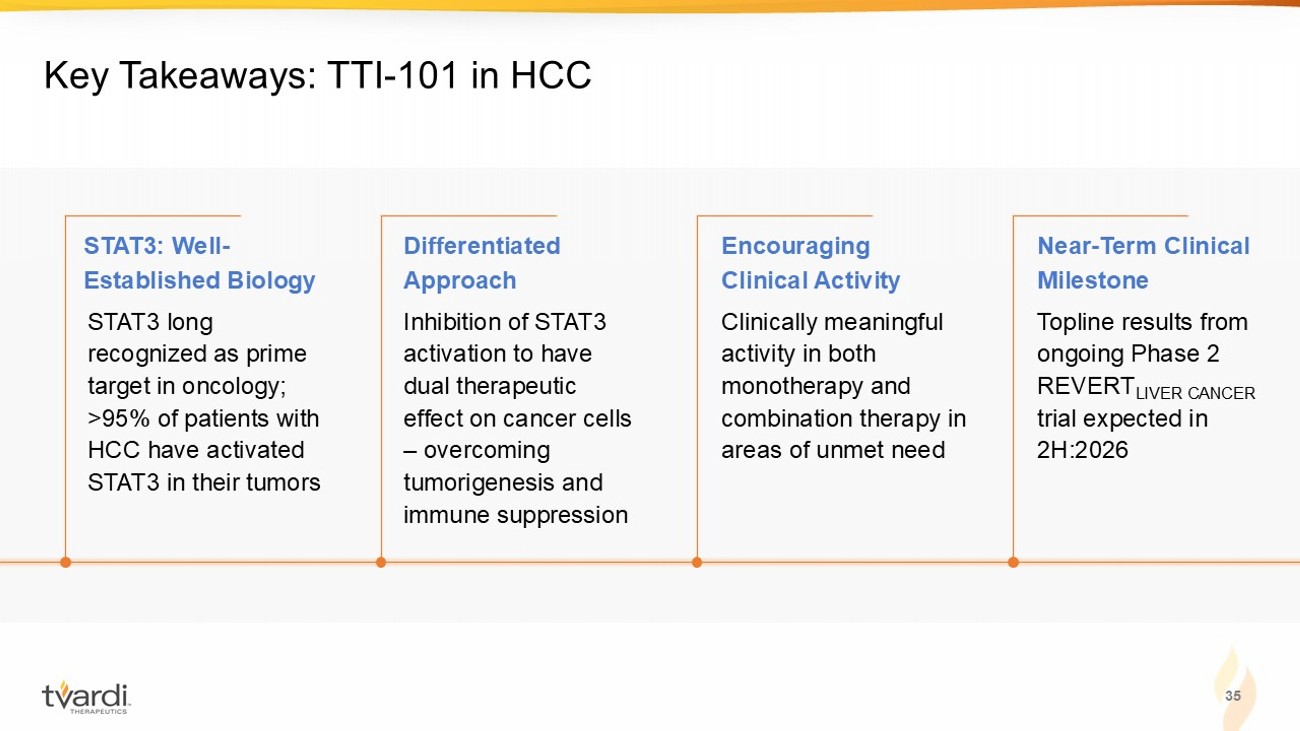
35 Key Takeaways: TTI - 101 in HCC Inhibition of STAT3 activation to have dual therapeutic effect on cancer cells – overcoming tumorigenesis and immune suppression Clinically meaningful activity in both monotherapy and combination therapy in areas of unmet need Topline results from ongoing Phase 2 REVERT LIVER CANCER trial expected in 2H:2026 STAT3 long recognized as prime target in oncology; >95% of patients with HCC have activated STAT3 in their tumors STAT3: Well - Established Biology Differentiated Approach Encouraging Clinical Activity Near - Term Clinical Milestone
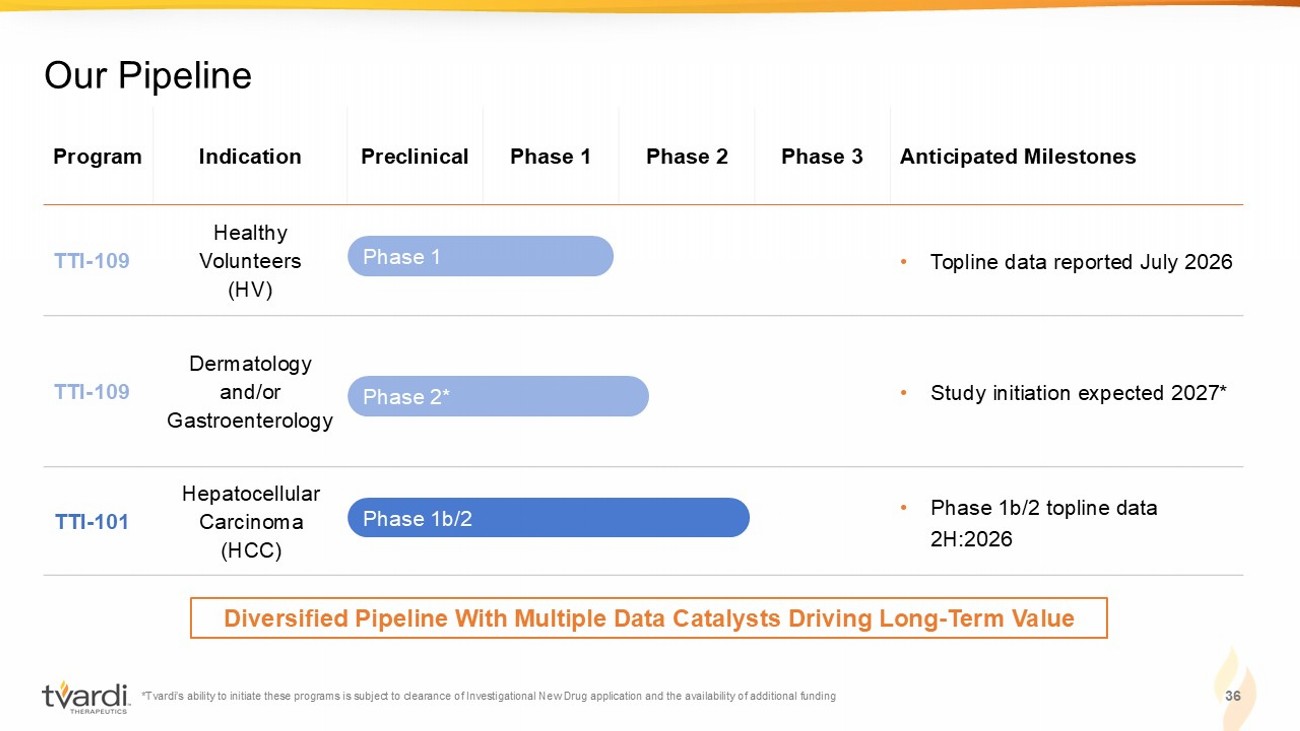
*Tvardi’s ability to initiate these programs is subject to clearance of Investigational New Drug application and the availabi lit y of additional funding 36 Our Pipeline Anticipated Milestones Phase 3 Phase 2 Phase 1 Preclinical Indication Program • Topline data reported July 2026 Healthy Volunteers (HV) TTI - 109 • Study initiation expected 2027* Dermatology and/or Gastroenterology TTI - 109 • Phase 1b/2 topline data 2H:2026 Hepatocellular Carcinoma (HCC) TTI - 101 Phase 1 Phase 1b/2 Diversified Pipeline With Multiple Data Catalysts Driving Long - Term Value Phase 2*
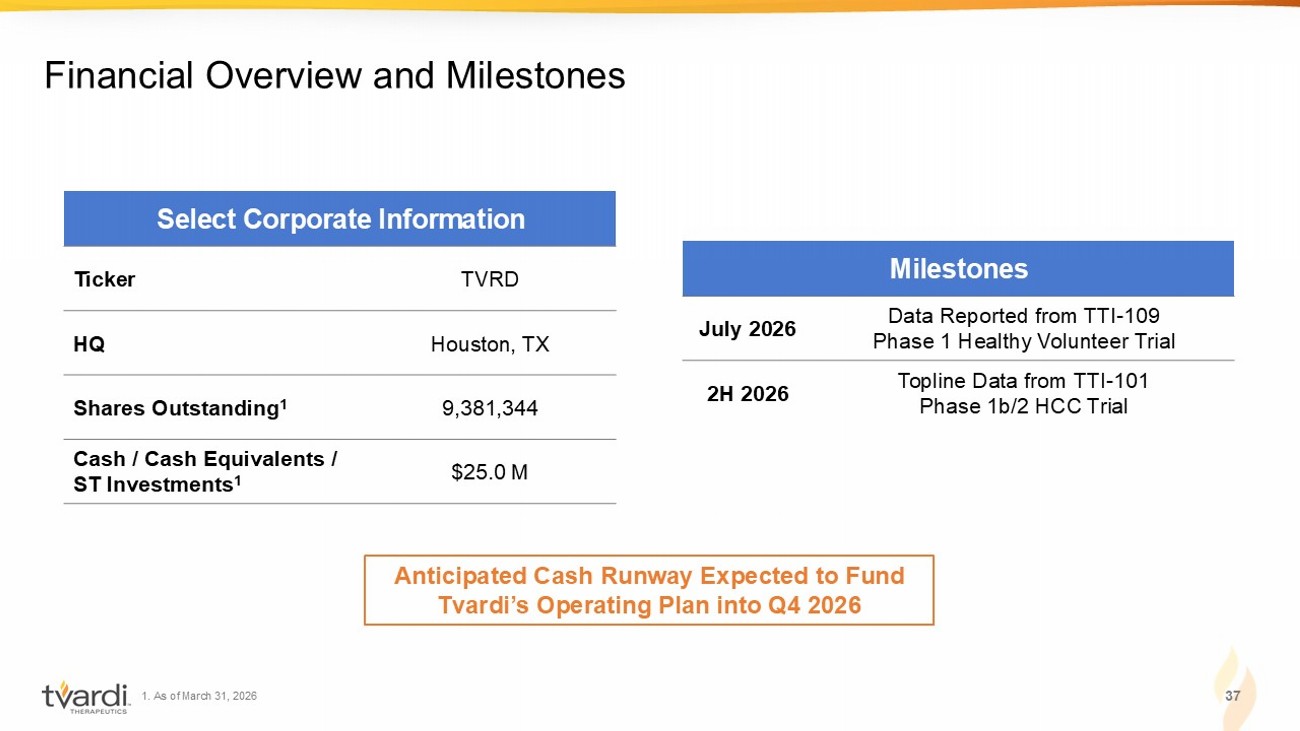
1. As of March 31, 2026 37 Financial Overview and Milestones Select Corporate Information TVRD Ticker Houston, TX HQ 9,381,344 Shares Outstanding 1 $25.0 M Cash / Cash Equivalents / ST Investments 1 Milestones Data Reported from TTI - 109 Phase 1 Healthy Volunteer Trial July 2026 Topline Data from TTI - 101 Phase 1b/2 HCC Trial 2H 2026 Anticipated Cash Runway Expected to Fund Tvardi’s Operating Plan into Q4 2026

Appendix A. Preclinical Support
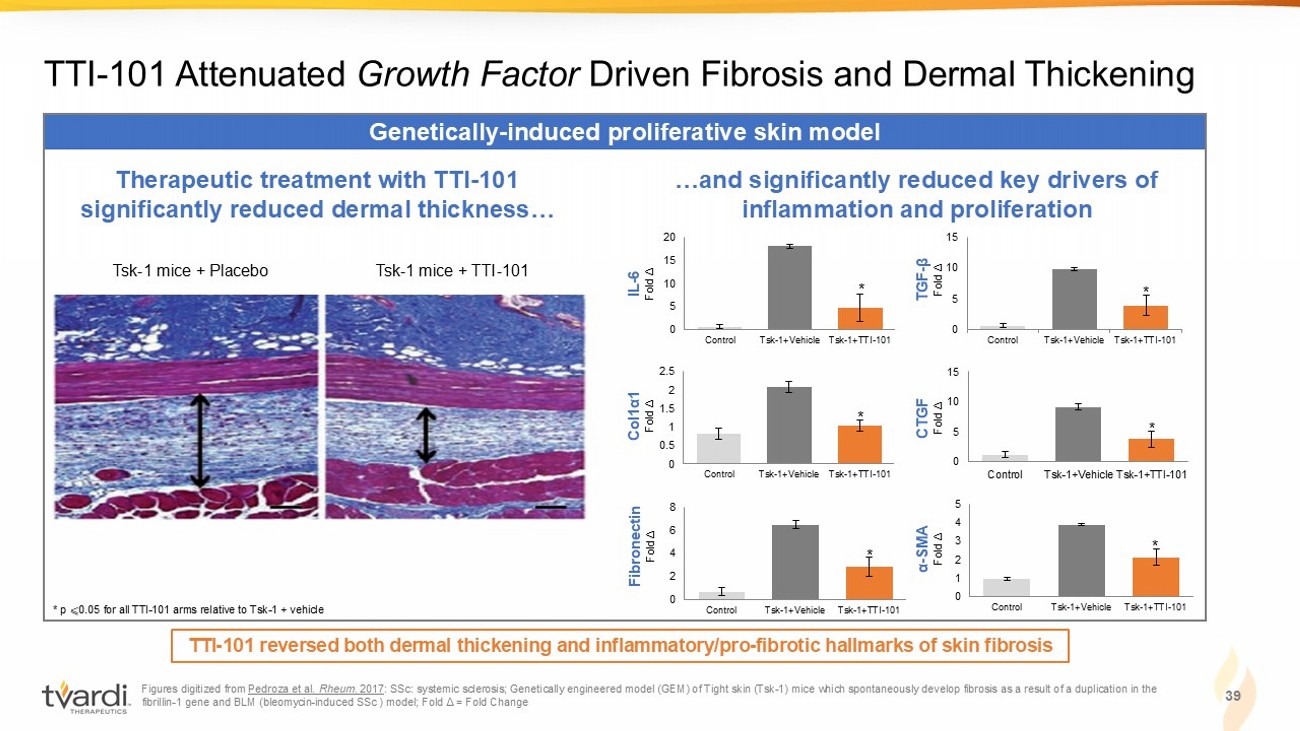
Figures digitized from Pedroza et al. Rheum. 2017 : SSc : systemic sclerosis; Genetically engineered model (GEM) of Tight skin (Tsk - 1) mice which spontaneously develop fibrosis as a result of a duplication in the fibrillin - 1 gene and BLM (bleomycin - induced SSc ) model; Fold Δ = Fold Change 39 TTI - 101 Attenuated Growth Factor Driven Fibrosis and Dermal Thickening Genetically - induced proliferative skin model TTI - 101 reversed both dermal thickening and inflammatory/pro - fibrotic hallmarks of skin fibrosis Tsk - 1 mice + Placebo Tsk - 1 mice + TTI - 101 Therapeutic treatment with TTI - 101 significantly reduced dermal thickness… …and significantly reduced key drivers of inflammation and proliferation 0 5 10 15 20 Control Tsk-1+Vehicle Tsk-1+TTI-101 IL - 6 Fold Δ 0 0.5 1 1.5 2 2.5 Control Tsk-1+Vehicle Tsk-1+TTI-101 Col1 α1 Fold Δ 0 2 4 6 8 Control Tsk-1+Vehicle Tsk-1+TTI-101 Fibronectin Fold Δ 0 1 2 3 4 5 Control Tsk-1+Vehicle Tsk-1+TTI-101 α - SMA Fold Δ 0 5 10 15 Control Tsk-1+Vehicle Tsk-1+TTI-101 CTGF Fold Δ 0 5 10 15 Control Tsk-1+Vehicle Tsk-1+TTI-101 TGF - β Fold Δ * * * * * * * p ⩽ 0.05 for all TTI - 101 arms relative to Tsk - 1 + vehicle
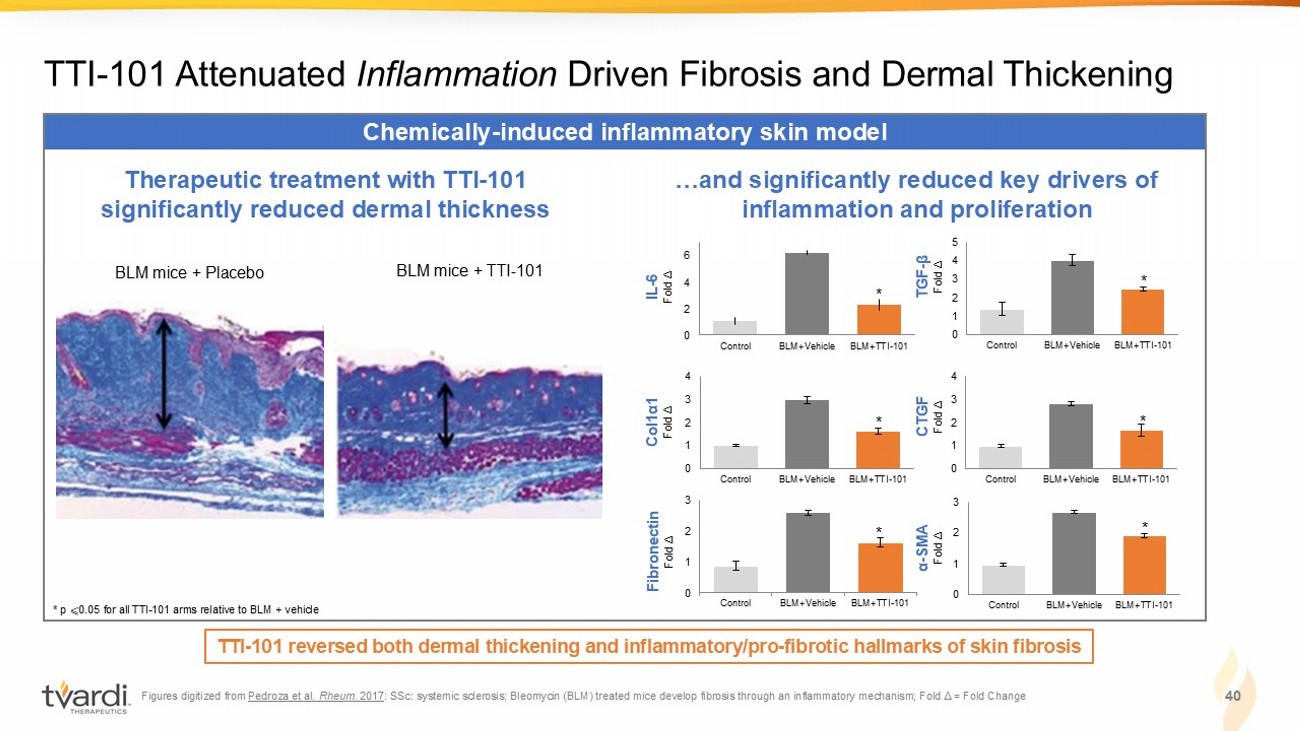
Figures digitized from Pedroza et al. Rheum. 2017 : SSc : systemic sclerosis; Bleomycin (BLM) treated mice develop fibrosis through an inflammatory mechanism; Fold Δ = Fold Change 40 TTI - 101 Attenuated Inflammation Driven Fibrosis and Dermal Thickening Chemically - induced inflammatory skin model TTI - 101 reversed both dermal thickening and inflammatory/pro - fibrotic hallmarks of skin fibrosis BLM mice + Placebo BLM mice + TTI - 101 Therapeutic treatment with TTI - 101 significantly reduced dermal thickness 0 2 4 6 Control BLM+Vehicle BLM+TTI-101 IL - 6 Fold Δ 0 1 2 3 4 Control BLM+Vehicle BLM+TTI-101 Col1 α1 Fold Δ 0 1 2 3 Control BLM+Vehicle BLM+TTI-101 Fibronectin Fold Δ …and significantly reduced key drivers of inflammation and proliferation 0 1 2 3 Control BLM+Vehicle BLM+TTI-101 α - SMA Fold Δ 0 1 2 3 4 Control BLM+Vehicle BLM+TTI-101 CTGF Fold Δ 0 1 2 3 4 5 Control BLM+Vehicle BLM+TTI-101 TGF - β Fold Δ * * * * * * * p ⩽ 0.05 for all TTI - 101 arms relative to BLM + vehicle
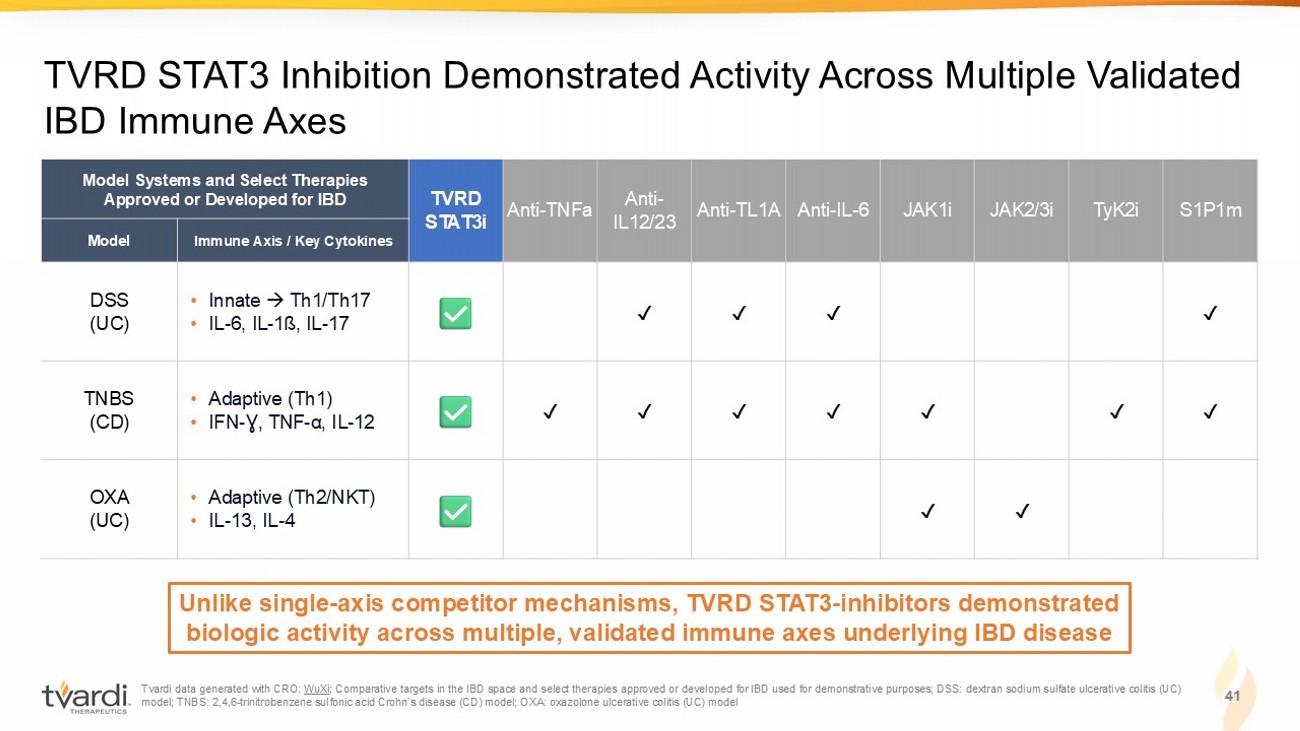
Tvardi data generated with CRO: WuXi ; Comparative targets in the IBD space and select therapies approved or developed for IBD used for demonstrative purposes; DS S: dextran sodium sulfate ulcerative colitis (UC) model; TNBS: 2,4,6 - trinitrobenzene sulfonic acid Crohn’s disease (CD) model; OXA: oxazolone ulcerative colitis (UC) model 41 TVRD STAT3 Inhibition Demonstrated Activity Across Multiple Validated IBD Immune Axes S1P1m TyK2i JAK2/3i JAK1i Anti - IL - 6 Anti - TL1A Anti - IL12/23 Anti - TNFa TVRD STAT3i Model Systems and Select Therapies Approved or Developed for IBD Immune Axis / Key Cytokines Model ✓ ✓ ✓ ✓ • Innate Th1/Th17 • IL - 6, IL - 1ß, IL - 17 DSS (UC) ✓ ✓ ✓ ✓ ✓ ✓ ✓ • Adaptive (Th1) • IFN - Ɣ, TNF - α , IL - 12 TNBS (CD) ✓ ✓ • Adaptive (Th2/NKT) • IL - 13, IL - 4 OXA (UC) Unlike single - axis competitor mechanisms, TVRD STAT3 - inhibitors demonstrated biologic activity across multiple, validated immune axes underlying IBD disease
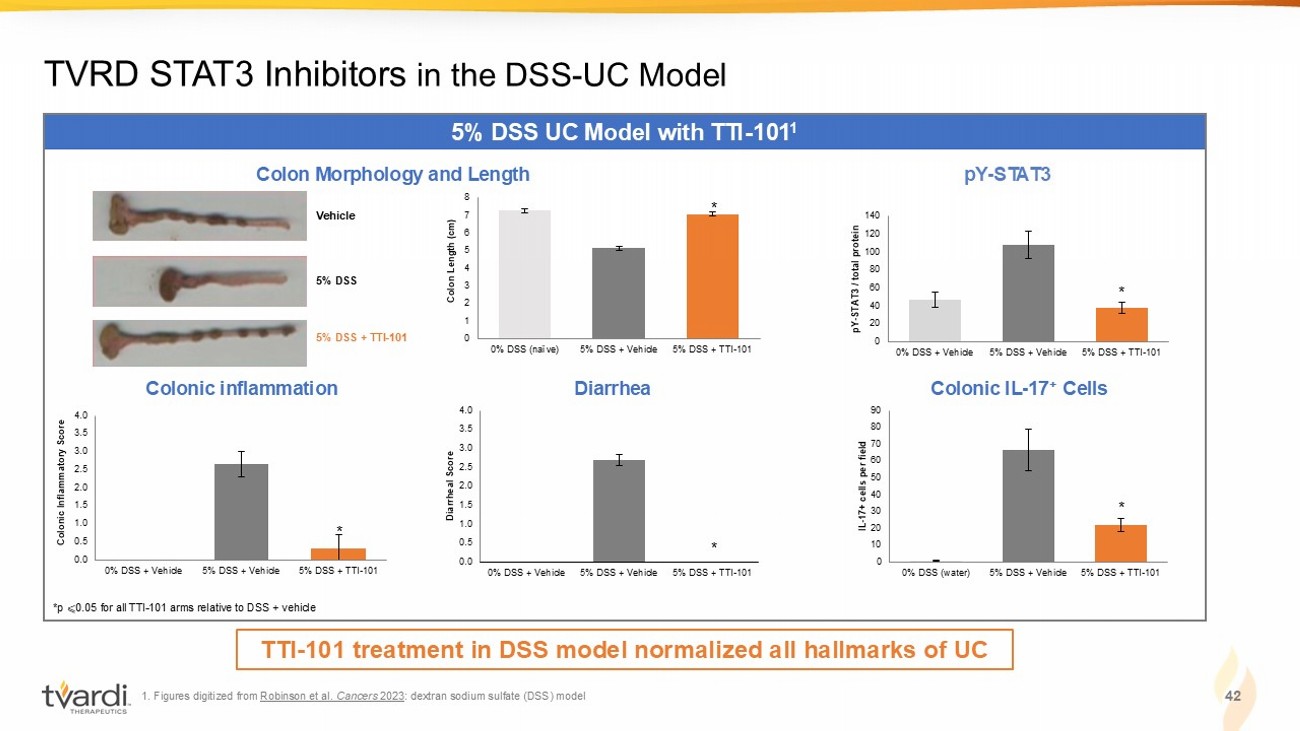
0.0 0.5 1.0 1.5 2.0 2.5 3.0 3.5 4.0 0% DSS + Vehicle 5% DSS + Vehicle 5% DSS + TTI-101 Diarrheal Score 0.0 0.5 1.0 1.5 2.0 2.5 3.0 3.5 4.0 0% DSS + Vehicle 5% DSS + Vehicle 5% DSS + TTI-101 Colonic Inflammatory Score 0 20 40 60 80 100 120 140 0% DSS + Vehicle 5% DSS + Vehicle 5% DSS + TTI-101 pY - STAT3 / total protein 0 1 2 3 4 5 6 7 8 0% DSS (naïve) 5% DSS + Vehicle 5% DSS + TTI-101 Colon Length (cm) 1. Figures digitized from Robinson et al. Cancers 2023 : dextran sodium sulfate (DSS) model 42 TVRD STAT3 Inhibitors in the DSS - UC Model 5% DSS UC Model with TTI - 101 1 Colon Morphology and Length *p ⩽ 0.05 for all TTI - 101 arms relative to DSS + vehicle * pY - STAT3 * Colonic inflammation Diarrhea Colonic IL - 17 + Cells * * TTI - 101 treatment in DSS model normalized all hallmarks of UC Vehicle 5% DSS 5% DSS + TTI - 101 0 10 20 30 40 50 60 70 80 90 0% DSS (water) 5% DSS + Vehicle 5% DSS + TTI-101 IL - 17+ cells per field *
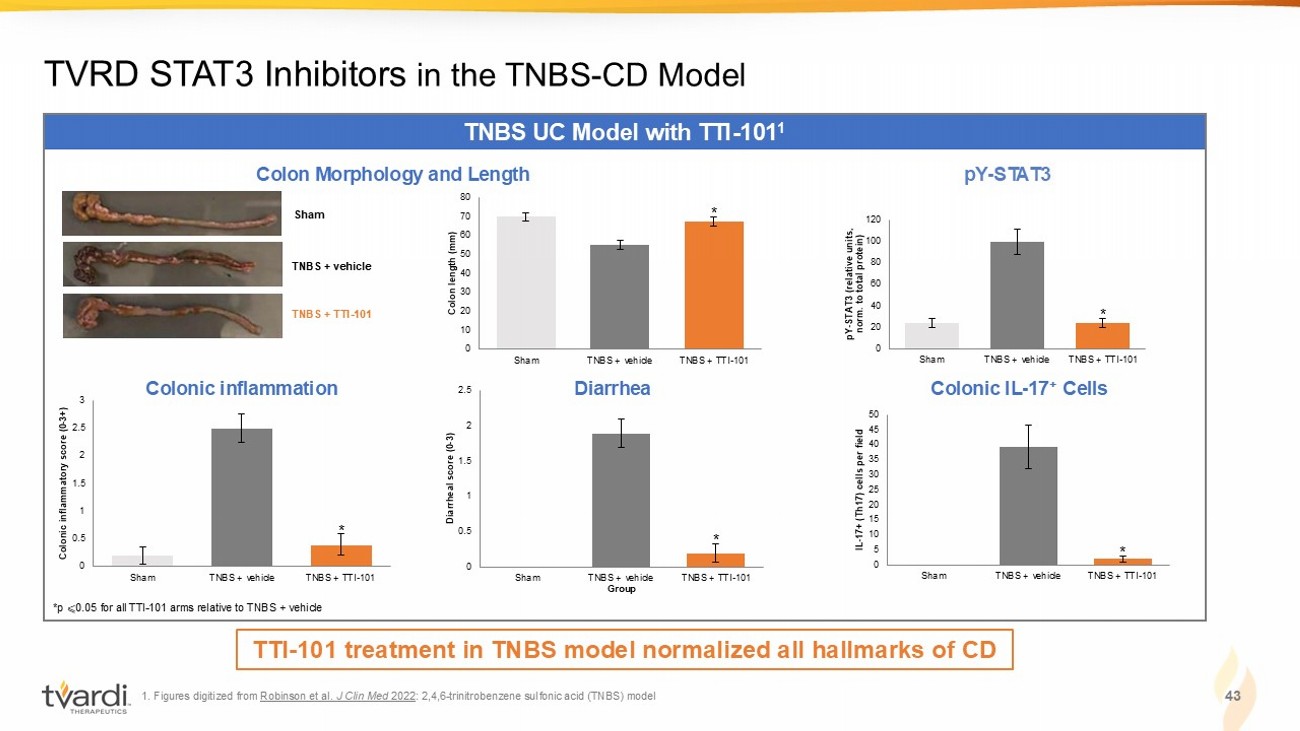
0 5 10 15 20 25 30 35 40 45 50 Sham TNBS + vehicle TNBS + TTI-101 IL - 17+ (Th17) cells per field * 0 20 40 60 80 100 120 Sham TNBS + vehicle TNBS + TTI-101 pY - STAT3 (relative units, norm. to total protein) 0 10 20 30 40 50 60 70 80 Sham TNBS + vehicle TNBS + TTI-101 Colon length (mm) 1. Figures digitized from Robinson et al. J Clin Med 2022 : 2,4,6 - trinitrobenzene sulfonic acid (TNBS) model 43 TVRD STAT3 Inhibitors in the TNBS - CD Model TNBS UC Model with TTI - 101 1 Sham TNBS + vehicle TNBS + TTI - 101 Colon Morphology and Length *p ⩽ 0.05 for all TTI - 101 arms relative to TNBS + vehicle * pY - STAT3 * 0 0.5 1 1.5 2 2.5 Sham TNBS + vehicle TNBS + TTI-101 Diarrheal score (0 - 3) Group 0 0.5 1 1.5 2 2.5 3 Sham TNBS + vehicle TNBS + TTI-101 Colonic inflammatory score (0 - 3+) Colonic inflammation Diarrhea Colonic IL - 17 + Cells * * TTI - 101 treatment in TNBS model normalized all hallmarks of CD
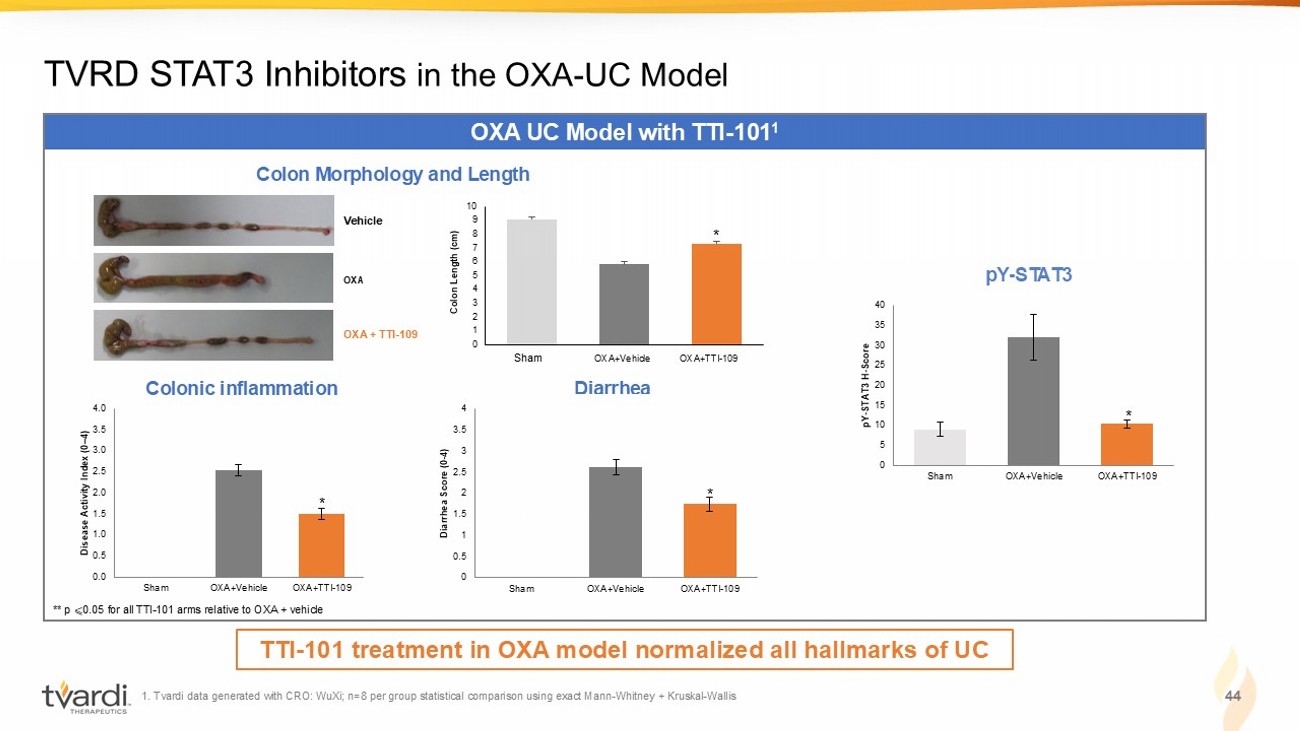
0.0 0.5 1.0 1.5 2.0 2.5 3.0 3.5 4.0 Sham OXA+Vehicle OXA+TTI-109 Disease Activity Index (0 – 4) 0 5 10 15 20 25 30 35 40 Sham OXA+Vehicle OXA+TTI-109 pY - STAT3 H - Score 1. Tvardi data generated with CRO: WuXi; n=8 per group statistical comparison using exact Mann - Whitney + Kruskal - Wallis 44 TVRD STAT3 Inhibitors in the OXA - UC Model OXA UC Model with TTI - 101 1 Colon Morphology and Length pY - STAT3 * Colonic inflammation Diarrhea TTI - 101 treatment in OXA model normalized all hallmarks of UC 0 1 2 3 4 5 6 7 8 9 10 2 3 4 Vehicle OXA OXA + TTI - 109 Colon Length (cm) Sham OXA+Vehicle OXA+TTI - 109 * 0 0.5 1 1.5 2 2.5 3 3.5 4 Sham OXA+Vehicle OXA+TTI-109 Diarrhea Score (0 - 4) * * ** p ⩽ 0.05 for all TTI - 101 arms relative to OXA + vehicle

Appendix B. TTI - 101 in IPF
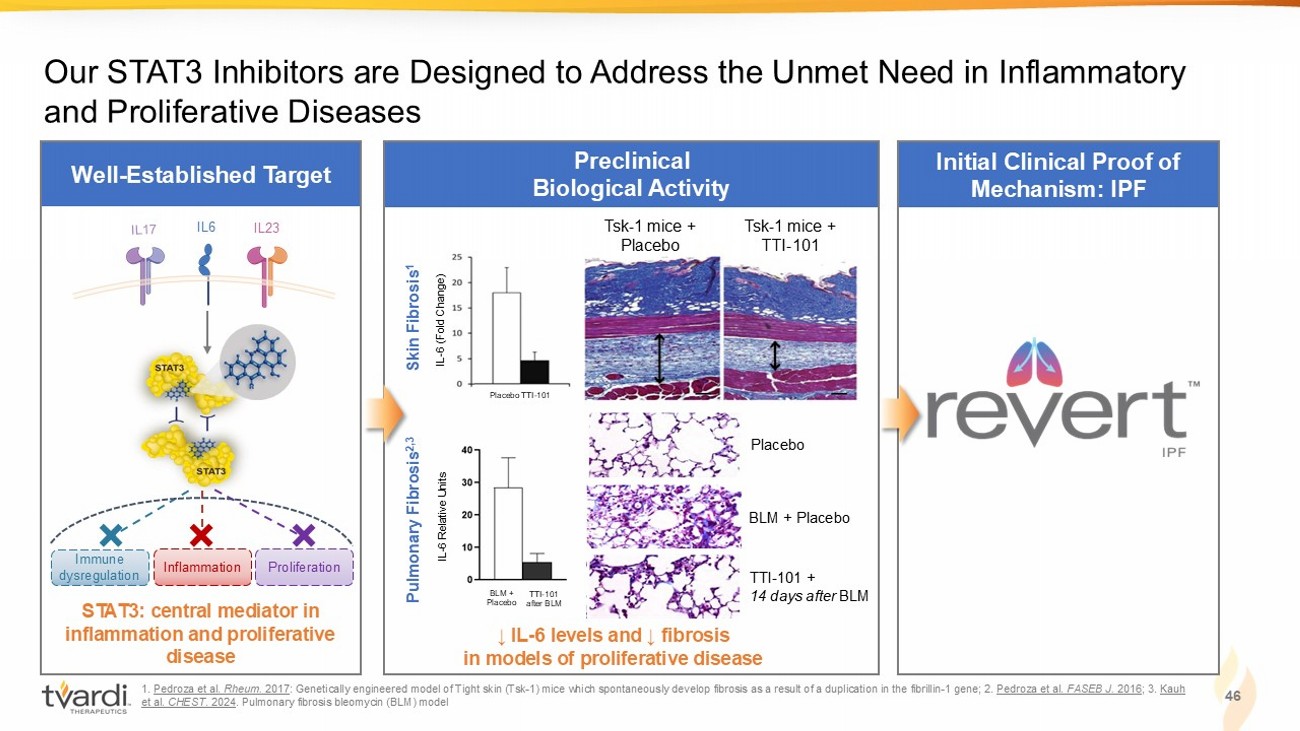
Pulmonary Fibrosis 2,3 Initial Clinical Proof of Mechanism: IPF Well - Established Target 1 . Pedroza et al. Rheum. 2017 : Genetically engineered model of Tight skin (Tsk - 1) mice which spontaneously develop fibrosis as a result of a duplication in the fibrillin - 1 gene; 2. Pedroza et al. FASEB J. 2016 ; 3. Kauh et al. CHEST . 2024 . P ulmonary fibrosis b leomycin (BLM) model Preclinical Biological Activity Our STAT3 Inhibitors are Designed to Address the Unmet Need in Inflammatory and Proliferative Diseases Tsk - 1 mice + Placebo Tsk - 1 mice + TTI - 101 ↓ IL - 6 levels and ↓ fibrosis in models of proliferative disease IL - 6 (Fold Change) Placebo TTI - 101 BLM + Placebo Placebo BLM + Placebo TTI - 101 + 14 days after BLM Skin Fibrosis 1 IL - 6 Relative Units TTI - 101 after BLM 46 STAT3: central mediator in inflammation and proliferative disease IL6 IL 23 Immune dysregulation Inflammation Proliferation
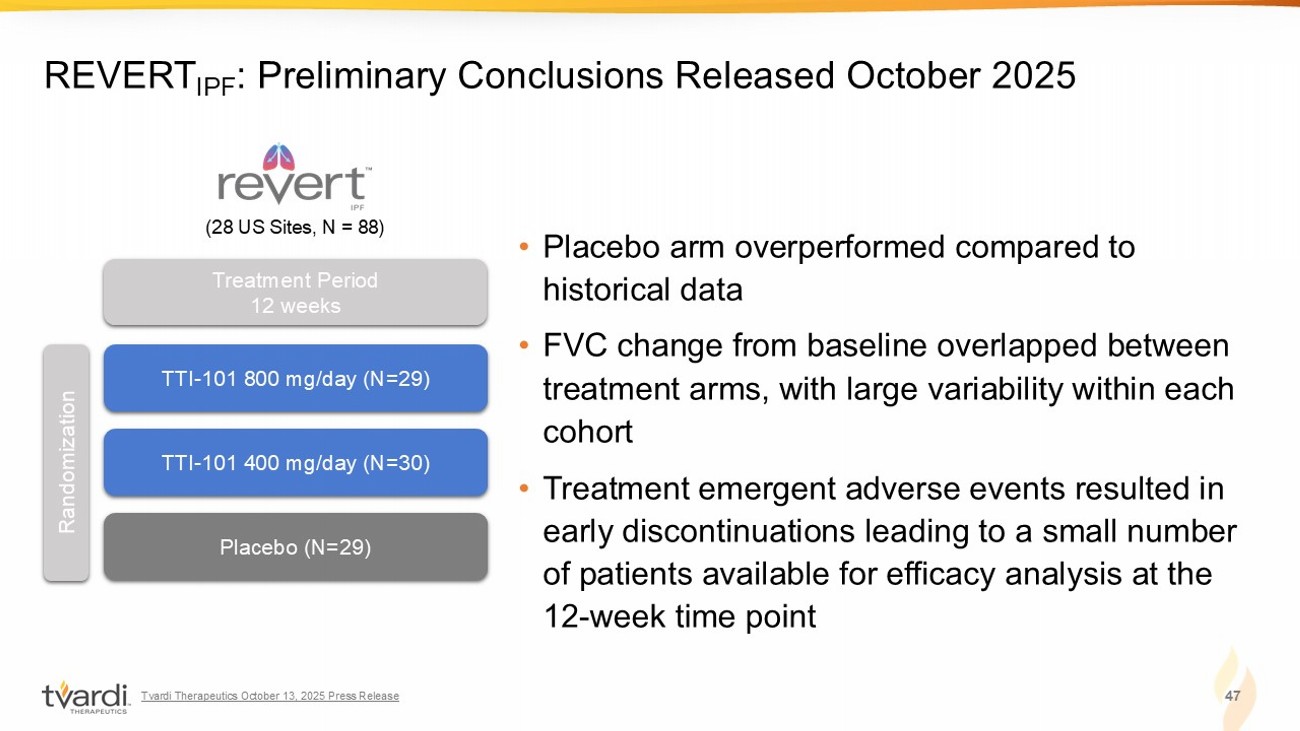
• Placebo arm overperformed compared to historical data • FVC change from baseline overlapped between treatment arms, with large variability within each cohort • Treatment emergent adverse events resulted in early discontinuations leading to a small number of patients available for efficacy analysis at the 12 - week time point 47 REVERT IPF : Preliminary Conclusions Released October 2025 TTI - 101 800 mg/day (N=29) TTI - 101 400 mg/day (N=30) Placebo (N=29) Randomization Treatment Period 12 weeks (28 US Sites, N = 88) Tvardi Therapeutics October 13, 2025 Press Release
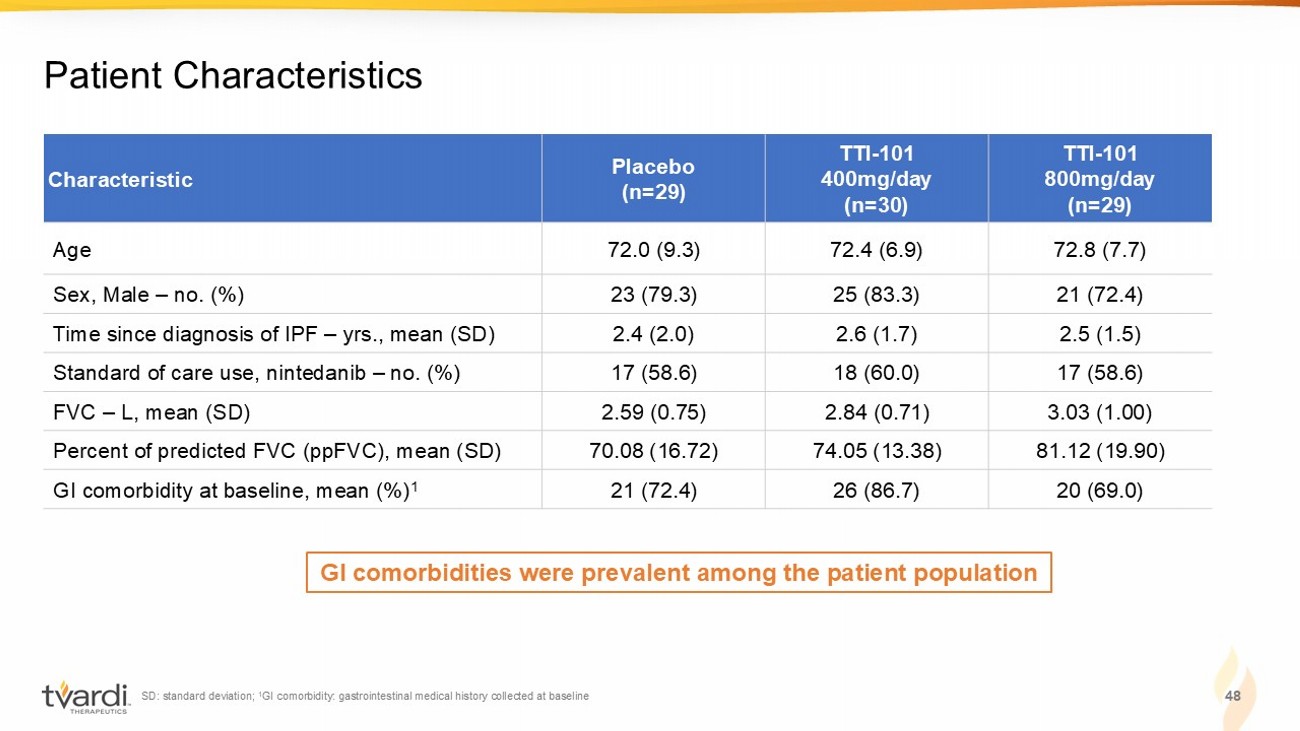
SD: standard deviation; 1 GI comorbidity: gastrointestinal medical history collected at baseline 48 Patient Characteristics TTI - 101 800mg/day (n=29) TTI - 101 400mg/day (n=30) Placebo (n=29) Characteristic 72.8 (7.7) 72.4 (6.9) 72.0 (9.3) Age 21 (72.4) 25 (83.3) 23 (79.3) Sex, Male – no. (%) 2.5 (1.5) 2.6 (1.7) 2.4 (2.0) Time since diagnosis of IPF – yrs., mean (SD) 17 (58.6) 18 (60.0) 17 (58.6) Standard of care use, nintedanib – no. (%) 3.03 (1.00) 2.84 (0.71) 2.59 (0.75) FVC – L, mean (SD) 81.12 (19.90) 74.05 (13.38) 70.08 (16.72) Percent of predicted FVC (ppFVC), mean (SD) 20 (69.0) 26 (86.7) 21 (72.4) GI comorbidity at baseline, mean (%) 1 GI comorbidities were prevalent among the patient population
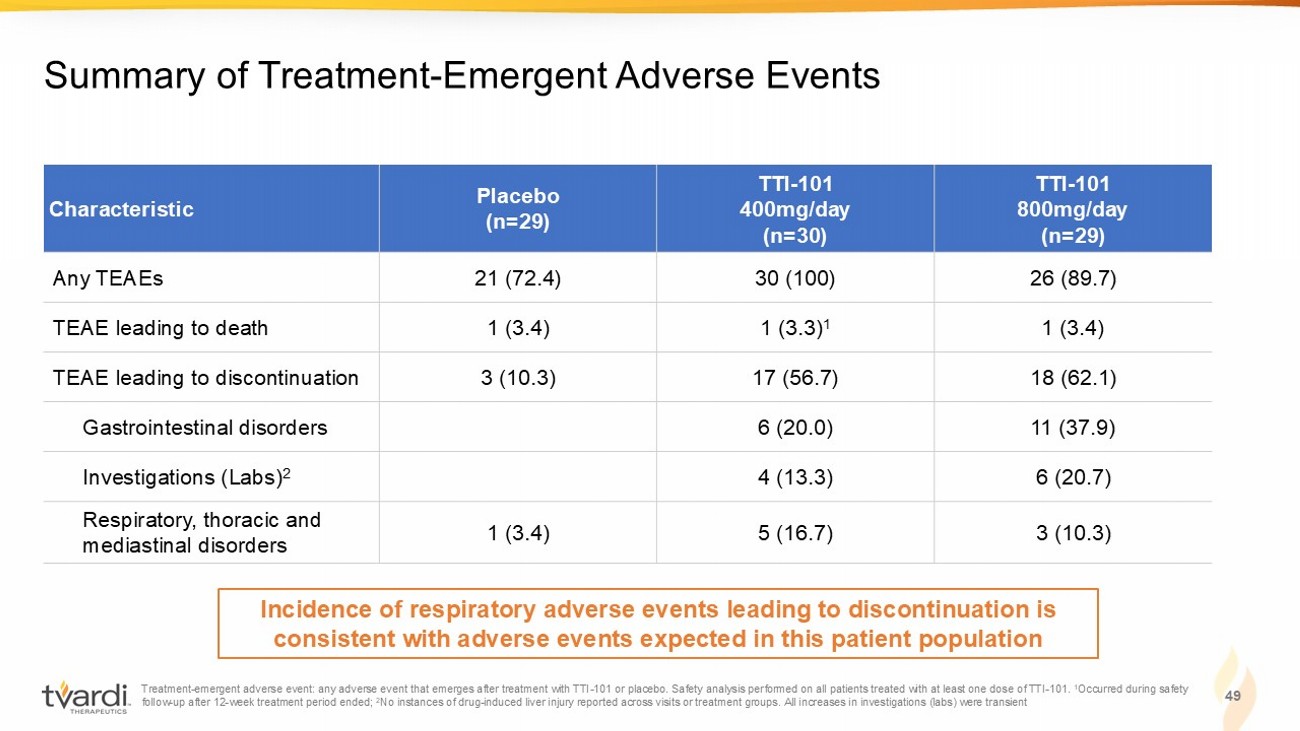
Treatment - emergent adverse event: any adverse event that emerges after treatment with TTI - 101 or placebo. Safety analysis perfor med on all patients treated with at least one dose of TTI - 101. 1 Occurred during safety follow - up after 12 - week treatment period ended; 2 No instances of drug - induced liver injury reported across visits or treatment groups. All increases in investigations (labs) wer e transient 49 Summary of Treatment - Emergent Adverse Events TTI - 101 800mg/day (n=29) TTI - 101 400mg/day (n=30) Placebo (n=29) Characteristic 26 (89.7) 30 (100) 21 (72.4) Any TEAEs 1 (3.4) 1 (3.3) 1 1 (3.4) TEAE leading to death 18 (62.1) 17 (56.7) 3 (10.3) TEAE leading to discontinuation 11 (37.9) 6 (20.0) Gastrointestinal disorders 6 (20.7) 4 (13.3) Investigations (Labs) 2 3 (10.3) 5 (16.7) 1 (3.4) Respiratory, thoracic and mediastinal disorders Incidence of respiratory adverse events leading to discontinuation is consistent with adverse events expected in this patient population
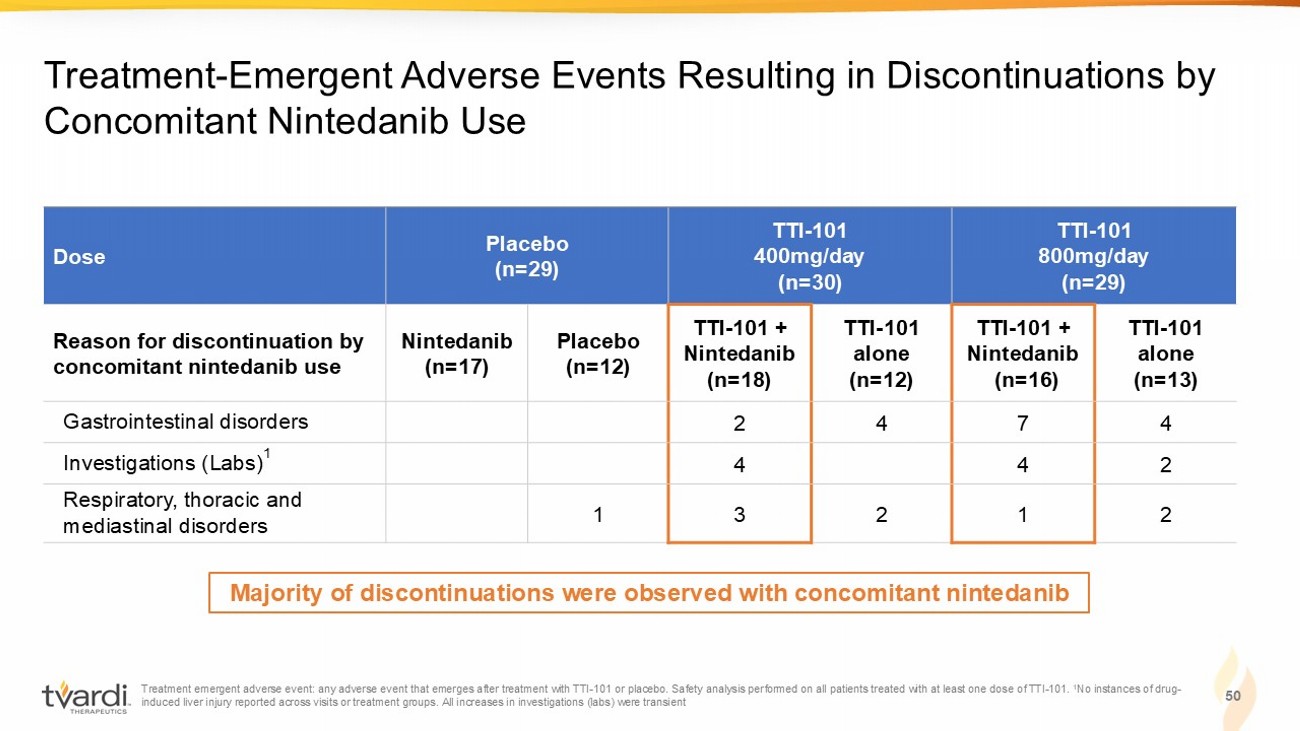
Treatment emergent adverse event: any adverse event that emerges after treatment with TTI - 101 or placebo. Safety analysis perfor med on all patients treated with at least one dose of TTI - 101. 1 No instances of drug - induced liver injury reported across visits or treatment groups. All increases in investigations (labs) were transient 50 Treatment - Emergent Adverse Events Resulting in Discontinuations by Concomitant Nintedanib Use TTI - 101 800mg/day (n=29) TTI - 101 400mg/day (n=30) Placebo (n=29) Dose TTI - 101 alone (n=13) TTI - 101 + Nintedanib (n=16) TTI - 101 alone (n=12) TTI - 101 + Nintedanib (n=18) Placebo (n=12) Nintedanib (n=17) Reason for discontinuation by concomitant nintedanib use 4 7 4 2 Gastrointestinal disorders 2 4 4 Investigations (Labs) 1 2 1 2 3 1 Respiratory, thoracic and mediastinal disorders Majority of discontinuations were observed with concomitant nintedanib
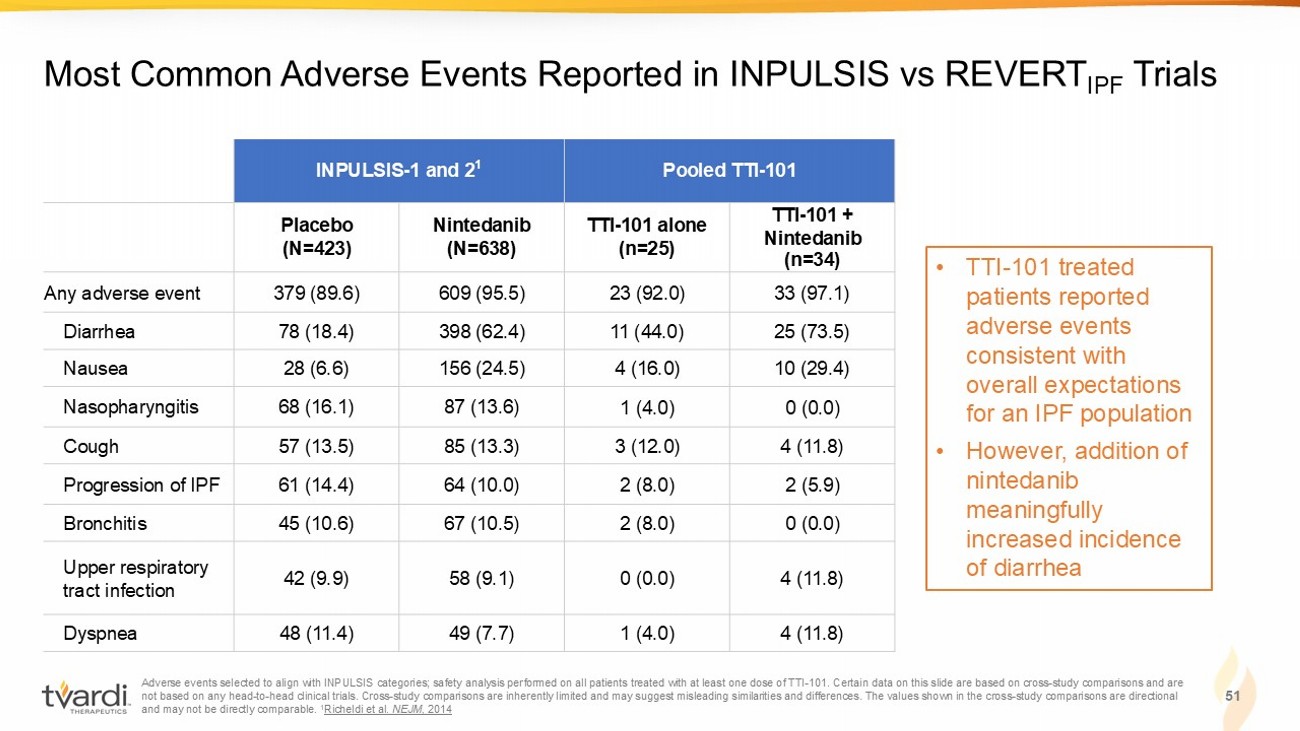
Adverse events selected to align with INPULSIS categories; safety analysis performed on all patients treated with at least on e d ose of TTI - 101. Certain data on this slide are based on cross - study comparisons and are not based on any head - to - head clinical trials. Cross - study comparisons are inherently limited and may suggest misleading similar ities and differences. The values shown in the cross - study comparisons are directional and may not be directly comparable. 1 Richeldi et al. NEJM, 2014 51 Most Common Adverse Events Reported in INPULSIS vs REVERT IPF Trials Pooled TTI - 101 INPULSIS - 1 and 2 1 TTI - 101 + Nintedanib (n=34) TTI - 101 alone (n=25) Nintedanib (N=638) Placebo (N=423) 33 (97.1) 23 (92.0) 609 (95.5) 379 (89.6) Any adverse event 25 (73.5) 11 (44.0) 398 (62.4) 78 (18.4) Diarrhea 10 (29.4) 4 (16.0) 156 (24.5) 28 (6.6) Nausea 0 (0.0) 1 (4.0) 87 (13.6) 68 (16.1) Nasopharyngitis 4 (11.8) 3 (12.0) 85 (13.3) 57 (13.5) Cough 2 (5.9) 2 (8.0) 64 (10.0) 61 (14.4) Progression of IPF 0 (0.0) 2 (8.0) 67 (10.5) 45 (10.6) Bronchitis 4 (11.8) 0 (0.0) 58 (9.1) 42 (9.9) Upper respiratory tract infection 4 (11.8) 1 (4.0) 49 (7.7) 48 (11.4) Dyspnea • TTI - 101 treated patients reported adverse events consistent with overall expectations for an IPF population • However, addition of nintedanib meaningfully increased incidence of diarrhea
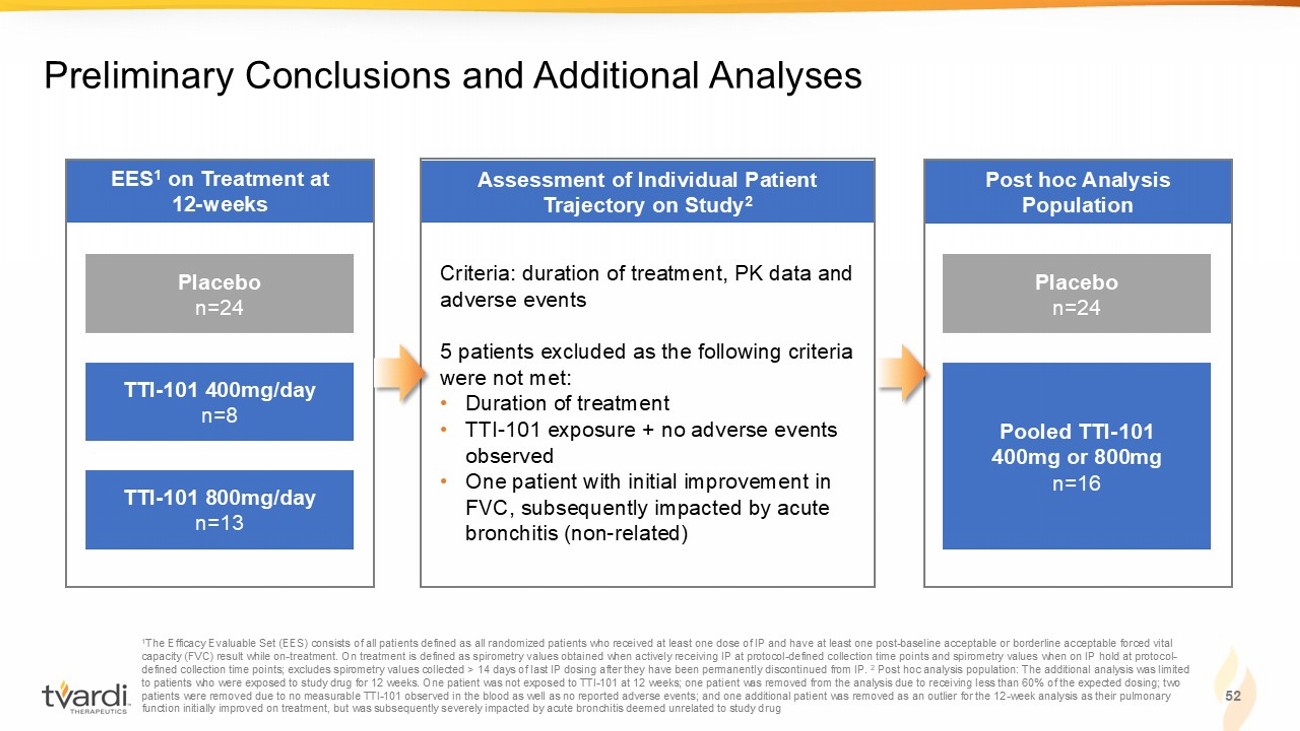
Post hoc Analysis Population Assessment of Individual Patient Trajectory on Study 2 EES 1 on Treatment at 12 - weeks 52 Preliminary Conclusions and Additional Analyses 1 The Efficacy Evaluable Set (EES) consists of all patients defined as all randomized patients who received at least one dose o f I P and have at least one post - baseline acceptable or borderline acceptable forced vital capacity (FVC) result while on - treatment. On treatment is defined as spirometry values obtained when actively receiving IP at pr otocol - defined collection time points and spirometry values when on IP hold at protocol - defined collection time points; excludes spirometry values collected > 14 days of last IP dosing after they have been permane ntl y discontinued from IP. 2 Post hoc analysis population: The additional analysis was limited to patients who were exposed to study drug for 12 weeks. One patient was not exposed to TTI - 101 at 12 weeks; one patient was rem oved from the analysis due to receiving less than 60% of the expected dosing; two patients were removed due to no measurable TTI - 101 observed in the blood as well as no reported adverse events; and one addition al patient was removed as an outlier for the 12 - week analysis as their pulmonary function initially improved on treatment, but was subsequently severely impacted by acute bronchitis deemed unrelated to stud y d rug Placebo n=24 TTI - 101 400mg/day n=8 TTI - 101 800mg/day n=13 Placebo n=24 Pooled TTI - 101 400mg or 800mg n=16 Criteria: duration of treatment, PK data and adverse events 5 patients excluded as the following criteria were not met: • Duration of treatment • TTI - 101 exposure + no adverse events observed • One patient with initial improvement in FVC, subsequently impacted by acute bronchitis (non - related)
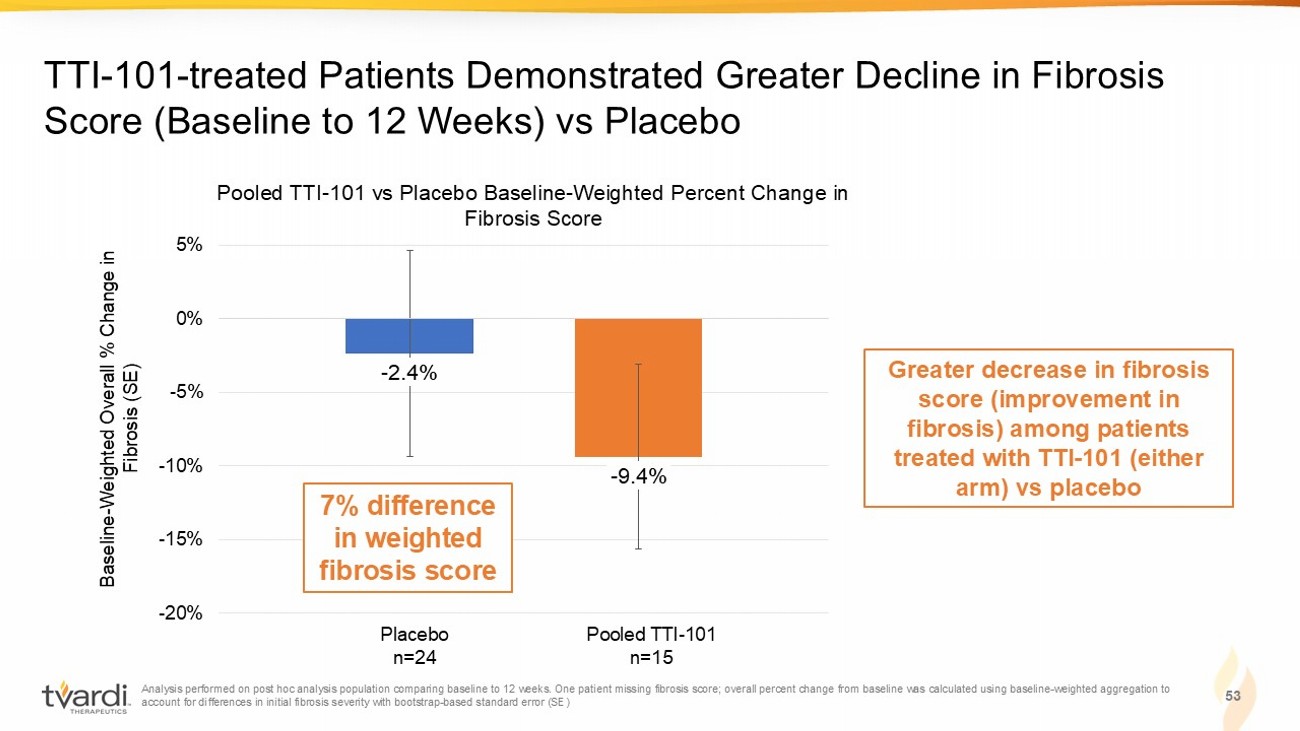
Analysis performed on post hoc analysis population comparing baseline to 12 weeks. One patient missing fibrosis score; overal l p ercent change from baseline was calculated using baseline - weighted aggregation to account for differences in initial fibrosis severity with bootstrap - based standard error (SE) 53 TTI - 101 - treated Patients Demonstrated Greater Decline in Fibrosis Score (Baseline to 12 Weeks) vs Placebo 24 24 20* 15* Greater decrease in fibrosis score (improvement in fibrosis) among patients treated with TTI - 101 (either arm) vs placebo - 2.4% - 9.4% -20% -15% -10% -5% 0% 5% Pooled TTI - 101 vs Placebo Baseline - Weighted Percent Change in Fibrosis Score Baseline - Weighted Overall % Change in Fibrosis (SE) Placebo n=24 Pooled TTI - 101 n=15 7% difference in weighted fibrosis score
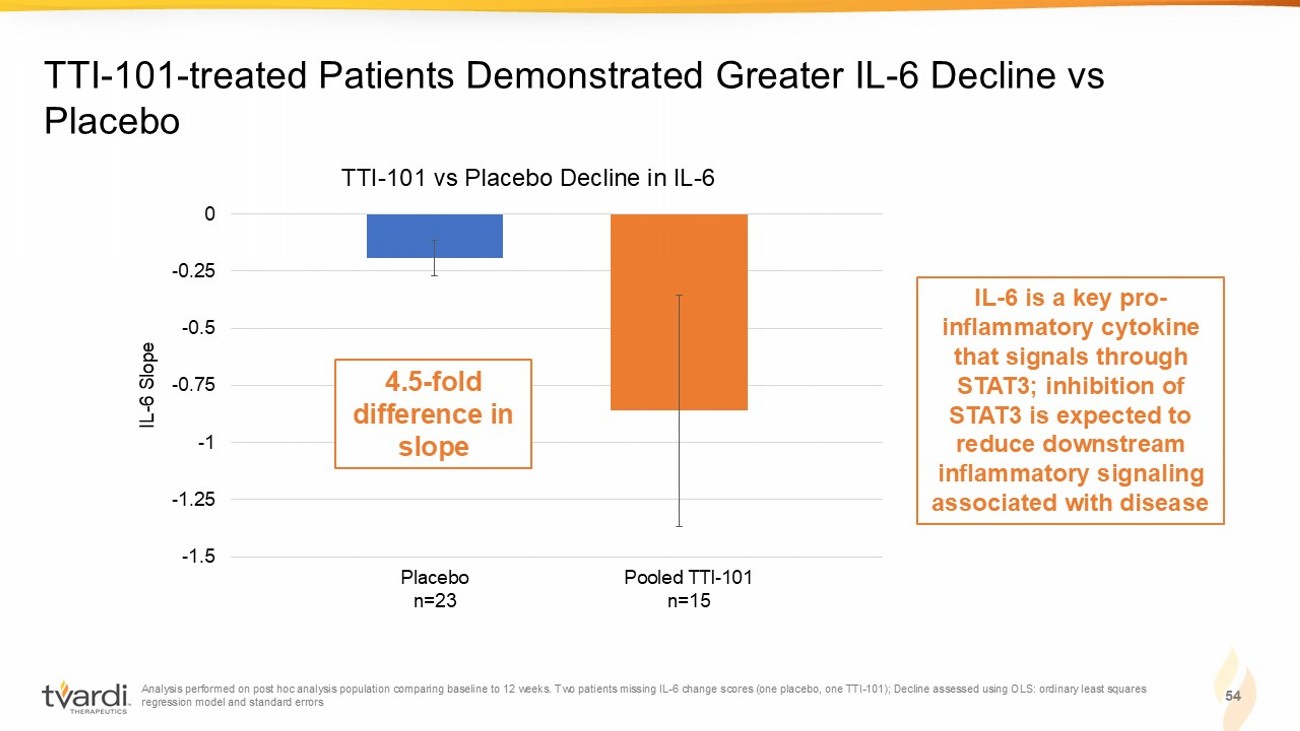
Analysis performed on post hoc analysis population comparing baseline to 12 weeks. Two patients missing IL - 6 change scores (one placebo, one TTI - 101); Decline assessed using OLS: ordinary least squares regression model and standard errors 54 TTI - 101 - treated Patients Demonstrated Greater IL - 6 Decline vs Placebo -1.5 -1.25 -1 -0.75 -0.5 -0.25 0 TTI - 101 vs Placebo Decline in IL - 6 IL - 6 Slope Placebo n=23 Pooled TTI - 101 n=15 4.5 - fold difference in slope IL - 6 is a key pro - inflammatory cytokine that signals through STAT3; inhibition of STAT3 is expected to reduce downstream inflammatory signaling associated with disease
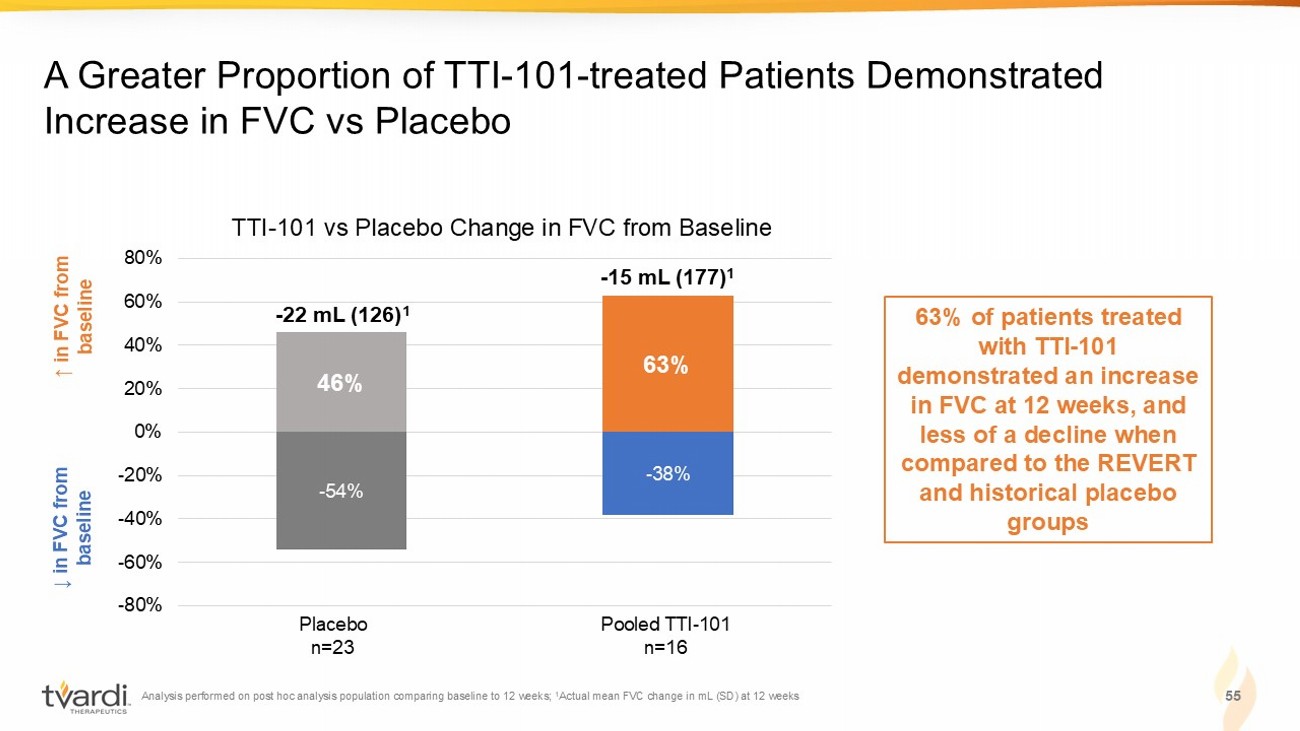
Analysis performed on post hoc analysis population comparing baseline to 12 weeks; 1 Actual mean FVC change in mL (SD) at 12 weeks 55 A Greater Proportion of TTI - 101 - treated Patients Demonstrated Increase in FVC vs Placebo ↓ in FVC from baseline ↑ in FVC from baseline 63% of patients treated with TTI - 101 demonstrated an increase in FVC at 12 weeks, and less of a decline when compared to the REVERT and historical placebo groups - 54% - 38% 46% 63% -80% -60% -40% -20% 0% 20% 40% 60% 80% Placebo n=23 Pooled TTI - 101 n=16 TTI - 101 vs Placebo Change in FVC from Baseline - 22 mL (126) 1 - 15 mL (177) 1
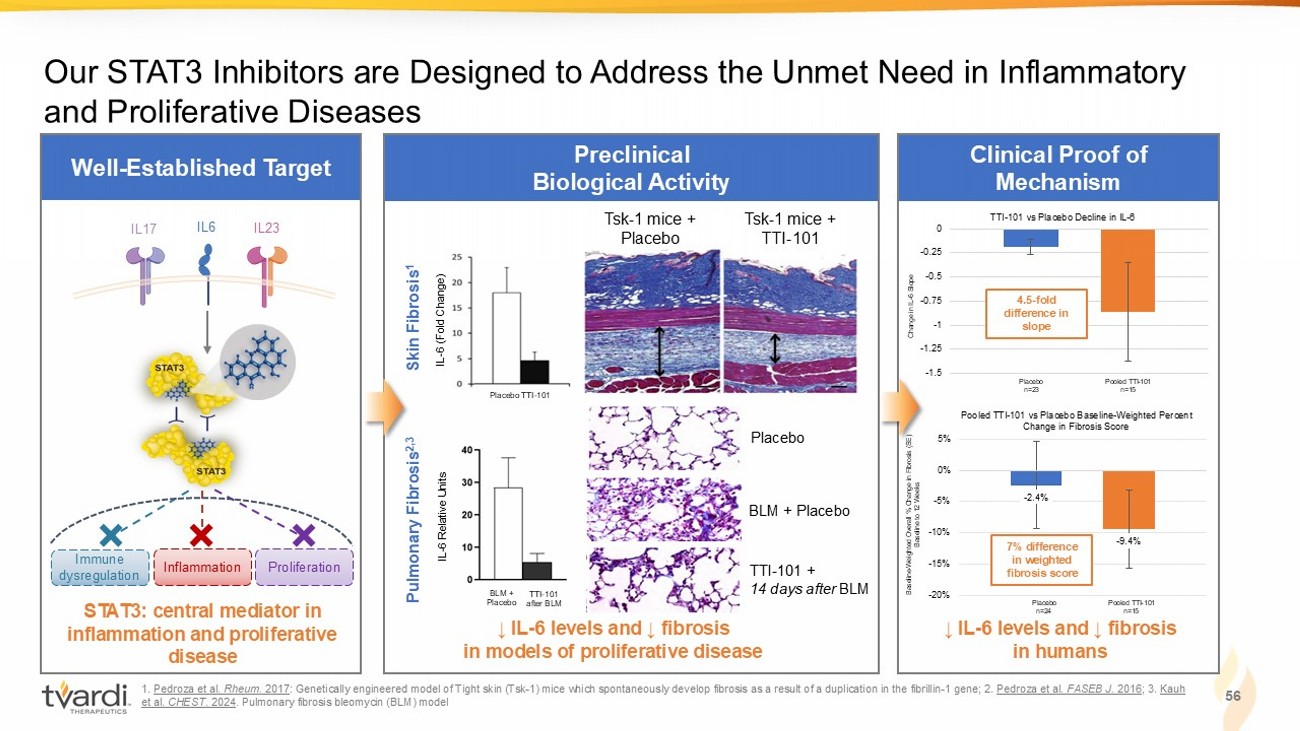
Well - Established Target 1 . Pedroza et al. Rheum. 2017 : Genetically engineered model of Tight skin (Tsk - 1) mice which spontaneously develop fibrosis as a result of a duplication in the fibrillin - 1 gene; 2. Pedroza et al. FASEB J. 2016 ; 3. Kauh et al. CHEST . 2024 . P ulmonary fibrosis b leomycin (BLM) model Preclinical Biological Activity Our STAT3 Inhibitors are Designed to Address the Unmet Need in Inflammatory and Proliferative Diseases Tsk - 1 mice + Placebo Tsk - 1 mice + TTI - 101 ↓ IL - 6 levels and ↓ fibrosis in models of proliferative disease Placebo BLM + Placebo TTI - 101 + 14 days after BLM 56 Clinical Proof of Mechanism ↓ IL - 6 levels and ↓ fibrosis in humans - 2.4% - 9.4% -20% -15% -10% -5% 0% 5% Pooled TTI - 101 vs Placebo Baseline - Weighted Percent Change in Fibrosis Score Baseline - Weighted Overall % Change in Fibrosis (SE) Baseline to 12 Weeks Placebo n=24 Pooled TTI - 101 n=15 7% difference in weighted fibrosis score -1.5 -1.25 -1 -0.75 -0.5 -0.25 0 TTI - 101 vs Placebo Decline in IL - 6 Change in IL - 6 Slope Placebo n=23 Pooled TTI - 101 n=15 4.5 - fold difference in slope STAT3: central mediator in inflammation and proliferative disease IL6 IL17 IL23 Immune dysregulation Inflammation Proliferation Pulmonary Fibrosis 2,3 IL - 6 (Fold Change) Placebo TTI - 101 BLM + Placebo Skin Fibrosis 1 IL - 6 Relative Units TTI - 101 after BLM