Shareholder Report
Apr. 30, 2026
USD ($)
Holding
What Were The Fund Costs For The Last Year ?
(Based on a hypothetical $10,000 investment)
| Fund | Costs of a $10,000 investment | Costs paid as a percentage of a $10,000 investment |
| Invesco Bloomberg MVP Multi-factor ETF | $31 | 0.29% |
How Did The Fund Perform During The Period?
• During the fiscal year ended April 30, 2026, U.S. equities delivered solid performance and ultimately pushed to new highs despite bouts of volatility tied to geopolitical developments. The market's leadership remained heavily influenced by large-cap growth-oriented sectors such as information technology and communication services. The Fund's multi-factor approach resulted in an underweight allocation to mega-capitalization securities, creating a performance headwind relative to the S&P 500® Index.
• The Fund is passively managed and seeks to track the investment results (before fees and expenses) of the Bloomberg MVP Index (the “Index”). The Fund generally will invest at least 90% of its total assets in securities that comprise the Index.
• For the fiscal year ended April 30, 2026, the Fund's performance, on a net asset value ("NAV") basis, 13.22%, differed from the return of the Index, 13.48%, primarily due to fees and expenses incurred by the Fund during the period.
What contributed to performance?
Sector Allocations | Industrials sector, followed by the utilities and health care sectors, respectively.
Positions | Cummins Inc., an industrials company, and Vistra Corp., a utilities company (no longer held at fiscal year-end).
What detracted from performance?
Sector Allocations | No sectors detracted from the Fund's performance during the period.
Positions | Cognizant Technology Solutions Corp., Class A, an information technology company (no longer held at fiscal year-end), and Broadridge Financial Solutions, Inc., an industrials company (no longer held at fiscal year-end).
How Has The Fund Historically Performed?
Growth of $10,000 Investment
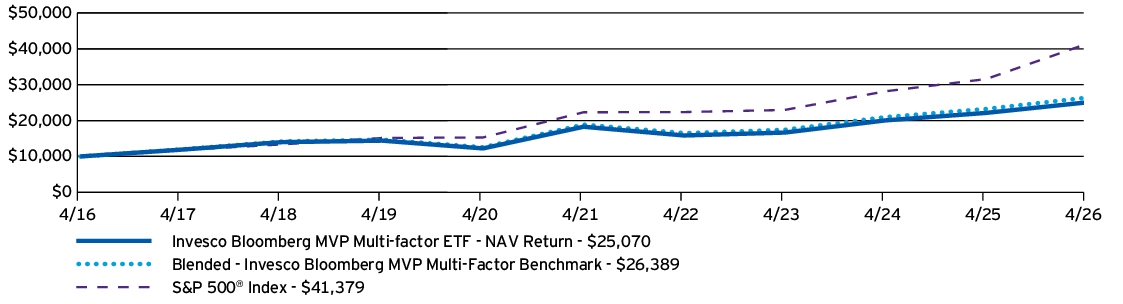
AVERAGE ANNUAL TOTAL RETURNS |
1 Year |
5 Years |
10 Years |
| Invesco Bloomberg MVP Multi-factor ETF — NAV Return | 13.22% | 6.52% | 9.63% |
| Blended - Invesco Bloomberg MVP Multi-Factor Benchmark | 13.48% | 6.91% | 10.19% |
| S&P 500® Index | 31.05% | 13.14% | 15.26% |
Performance figures do not reflect deduction of taxes a shareholder would pay on Fund distributions or sale of Fund shares.
What Are Key Statistics About The Fund?
(as of April 30, 2026)
| Fund net assets | $102,131,254 |
| Total number of portfolio holdings | 57 |
| Total advisory fees paid | $304,661 |
| Portfolio turnover rate | 176% |
What Comprised The Fund's Holdings?
(as of April 30, 2026)
Top ten holdings*
(% of net assets)
(% of net assets)
| Alphabet, Inc., Class A | 2.35% |
| Jabil, Inc. | 2.23% |
| Cummins, Inc. | 2.19% |
| Cisco Systems, Inc. | 2.07% |
| Ferguson Enterprises, Inc. | 2.02% |
| FedEx Corp. | 1.99% |
| CDW Corp. | 1.99% |
| Synchrony Financial | 1.97% |
| Principal Financial Group, Inc. | 1.97% |
| United Parcel Service, Inc., Class B | 1.94% |
| * Excluding money market fund holdings, if any. |
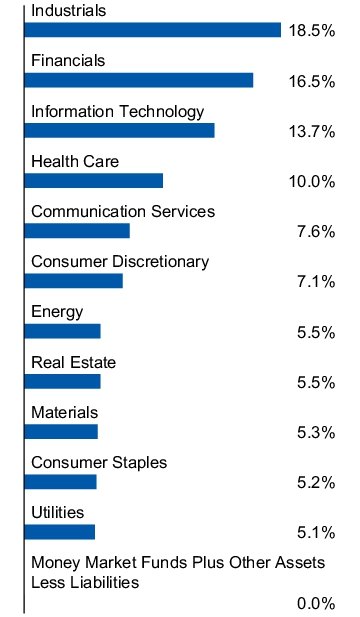
Sector allocation
(% of net assets)
(% of net assets)
Top ten holdings*
(% of net assets)
(% of net assets)
| Alphabet, Inc., Class A | 2.35% |
| Jabil, Inc. | 2.23% |
| Cummins, Inc. | 2.19% |
| Cisco Systems, Inc. | 2.07% |
| Ferguson Enterprises, Inc. | 2.02% |
| FedEx Corp. | 1.99% |
| CDW Corp. | 1.99% |
| Synchrony Financial | 1.97% |
| Principal Financial Group, Inc. | 1.97% |
| United Parcel Service, Inc., Class B | 1.94% |
| * Excluding money market fund holdings, if any. |
What Were The Fund Costs For The Last Year ?
(Based on a hypothetical $10,000 investment)
| Fund | Costs of a $10,000 investment | Costs paid as a percentage of a $10,000 investment |
| Invesco S&P SmallCap Momentum ETF | $42 | 0.35% |
How Did The Fund Perform During The Period?
• During the fiscal year ended April 30, 2026, U.S. equities experienced positive returns for the majority of the year, although geopolitical conflict towards the end of the year sparked bouts of increased volatility. The Fund's focus on momentum securities, or those with relatively stronger price returns over a trailing twelve-month period, was a notable driver of its relative outperformance versus the S&P SmallCap 600® Index during the period, as investors continued to favor the momentum factor.
• The Fund is passively managed and seeks to track the investment results (before fees and expenses) of the S&P SmallCap 600 Momentum Index (the “Index”). The Fund generally will invest at least 90% of its total assets in securities that comprise the Index.
• For the fiscal year ended April 30, 2026, the Fund's performance, on a net asset value ("NAV") basis, 41.41%, differed from the return of the Index, 42.00%, primarily due to fees and expenses incurred by the Fund during the period, which was compounded during a period of strong performance.
What contributed to performance?
Sector Allocations | Information technology sector, followed by the industrials and financials sectors, respectively.
Positions | TTM Technologies, Inc., an information technology company (no longer held at fiscal year-end), and Viavi Solutions, Inc., an information technology company.
What detracted from performance?
Sector Allocations | Health care sector.
Positions | ADMA Biologics, Inc., a health care company (no longer held at fiscal year-end), and GEO Group, Inc. (The), an industrials company (no longer held at fiscal year-end).
How Has The Fund Historically Performed?
Growth of $10,000 Investment
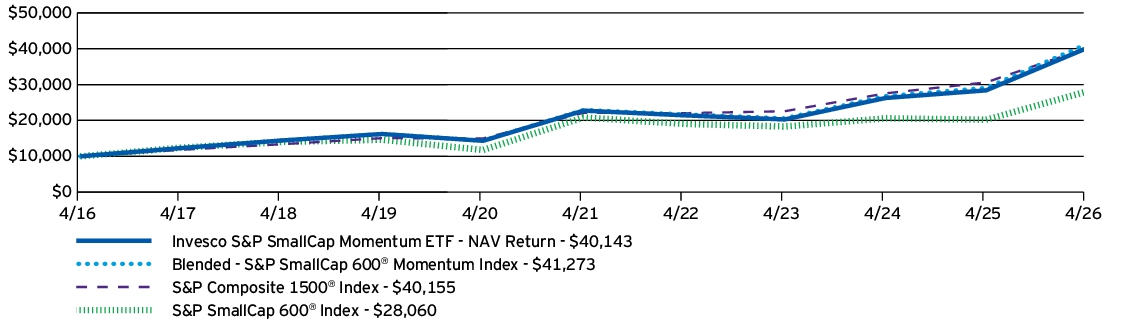
AVERAGE ANNUAL TOTAL RETURNS |
1 Year |
5 Years |
10 Years |
| Invesco S&P SmallCap Momentum ETF — NAV Return | 41.41% | 12.03% | 14.91% |
| Blended - S&P SmallCap 600® Momentum Index | 42.00% | 12.49% | 15.23% |
| S&P Composite 1500® Index | 31.17% | 12.65% | 14.91% |
| S&P SmallCap 600® Index | 38.86% | 6.15% | 10.87% |
Performance figures do not reflect deduction of taxes a shareholder would pay on Fund distributions or sale of Fund shares.
What Are Key Statistics About The Fund?
(as of April 30, 2026)
| Fund net assets | $2,753,437,654 |
| Total number of portfolio holdings | 116 |
| Total advisory fees paid | $5,803,800 |
| Portfolio turnover rate | 121% |
What Comprised The Fund's Holdings?
(as of April 30, 2026)
Top ten holdings*
(% of net assets)
(% of net assets)
| Viavi Solutions, Inc. | 4.00% |
| Viasat, Inc. | 3.47% |
| Primoris Services Corp. | 3.09% |
| ESCO Technologies, Inc. | 2.69% |
| Sanmina Corp. | 2.52% |
| FormFactor, Inc. | 2.24% |
| Powell Industries, Inc. | 2.06% |
| Krystal Biotech, Inc. | 1.91% |
| Indivior Pharmaceuticals, Inc. | 1.78% |
| StoneX Group, Inc. | 1.77% |
| * Excluding money market fund holdings, if any. |
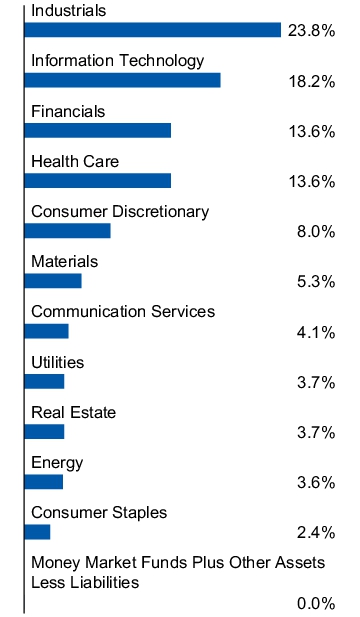
Sector allocation
(% of net assets)
(% of net assets)
Top ten holdings*
(% of net assets)
(% of net assets)
| Viavi Solutions, Inc. | 4.00% |
| Viasat, Inc. | 3.47% |
| Primoris Services Corp. | 3.09% |
| ESCO Technologies, Inc. | 2.69% |
| Sanmina Corp. | 2.52% |
| FormFactor, Inc. | 2.24% |
| Powell Industries, Inc. | 2.06% |
| Krystal Biotech, Inc. | 1.91% |
| Indivior Pharmaceuticals, Inc. | 1.78% |
| StoneX Group, Inc. | 1.77% |
| * Excluding money market fund holdings, if any. |
What Were The Fund Costs For The Last Year ?
(Based on a hypothetical $10,000 investment)
| Fund | Costs of a $10,000 investment | Costs paid as a percentage of a $10,000 investment |
| Invesco S&P SmallCap Value with Momentum ETF | $43 | 0.36% |
How Did The Fund Perform During The Period?
• During the fiscal year ended April 30, 2026, U.S. equities experienced positive returns for the majority of the year, although geopolitical conflict towards the end of the year sparked bouts of increased volatility. The Fund outperformed the S&P SmallCap 600® Index due to its focus on value securities, which outperformed broader U.S. small-cap equities during the period. A large relative overweight allocation to the financials sector as well as strong security selection results within the consumer staples sector were notably supportive of the relative outperformance.
• The Fund is passively managed and seeks to track the investment results (before fees and expenses) of the S&P SmallCap 600 High Momentum Value Index (the “Index”). The Fund generally will invest at least 90% of its total assets in securities that comprise the Index.
• For the fiscal year ended April 30, 2026, the Fund's performance, on a net asset value ("NAV") basis, 39.44%, differed from the return of the Index, 39.92%, primarily due to fees and expenses incurred by the Fund during the period.
What contributed to performance?
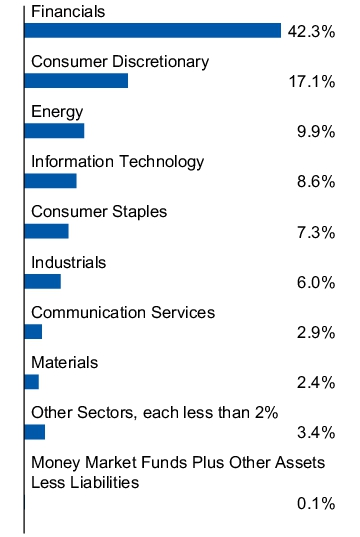
Sector Allocations | Financials sector, followed by the consumer discretionary and information technology sectors, respectively.
Positions | Victoria's Secret & Co., a consumer discretionary company (no longer held at fiscal year-end), and United Natural Foods, Inc., a consumer staples company.
What detracted from performance?
Sector Allocations | No sector detracted from the Fund's performance during the period.
Positions | Kohl's Corp., a consumer discretionary company, and Select Medical Holdings Corp., a health care company (no longer held at fiscal year-end).
How Has The Fund Historically Performed?
Growth of $10,000 Investment
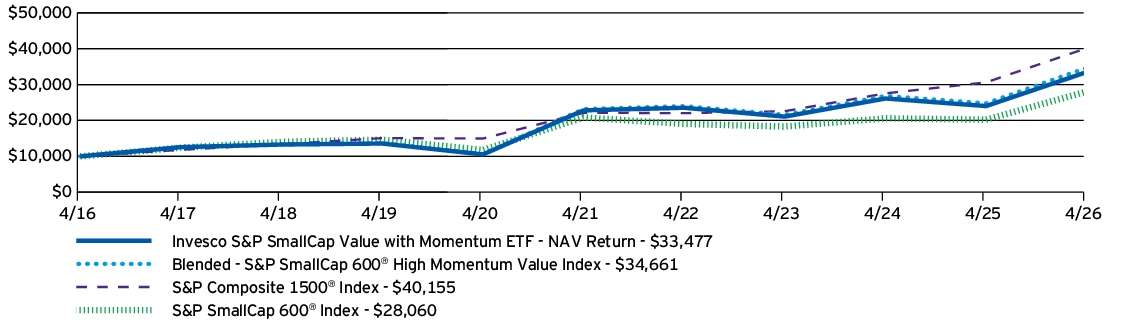
AVERAGE ANNUAL TOTAL RETURNS |
1 Year |
5 Years |
10 Years |
| Invesco S&P SmallCap Value with Momentum ETF — NAV Return | 39.44% | 7.98% | 12.84% |
| Blended - S&P SmallCap 600® High Momentum Value Index | 39.92% | 8.40% | 13.24% |
| S&P Composite 1500® Index | 31.17% | 12.65% | 14.91% |
| S&P SmallCap 600® Index | 38.86% | 6.15% | 10.87% |
Performance figures do not reflect deduction of taxes a shareholder would pay on Fund distributions or sale of Fund shares.
What Are Key Statistics About The Fund?
(as of April 30, 2026)
| Fund net assets | $613,139,649 |
| Total number of portfolio holdings | 120 |
| Total advisory fees paid | $1,676,807 |
| Portfolio turnover rate | 84% |
What Comprised The Fund's Holdings?
(as of April 30, 2026)
Top ten holdings*
(% of net assets)
(% of net assets)
| StoneX Group, Inc. | 1.88% |
| Andersons, Inc. (The) | 1.83% |
| United Natural Foods, Inc. | 1.70% |
| MarineMax, Inc. | 1.59% |
| Par Pacific Holdings, Inc. | 1.52% |
| AdaptHealth Corp. | 1.40% |
| Sonic Automotive, Inc., Class A | 1.37% |
| Vishay Intertechnology, Inc. | 1.37% |
| Deluxe Corp. | 1.28% |
| Dana, Inc. | 1.27% |
| * Excluding money market fund holdings, if any. |
Sector allocation
(% of net assets)
(% of net assets)
Top ten holdings*
(% of net assets)
(% of net assets)
| StoneX Group, Inc. | 1.88% |
| Andersons, Inc. (The) | 1.83% |
| United Natural Foods, Inc. | 1.70% |
| MarineMax, Inc. | 1.59% |
| Par Pacific Holdings, Inc. | 1.52% |
| AdaptHealth Corp. | 1.40% |
| Sonic Automotive, Inc., Class A | 1.37% |
| Vishay Intertechnology, Inc. | 1.37% |
| Deluxe Corp. | 1.28% |
| Dana, Inc. | 1.27% |
| * Excluding money market fund holdings, if any. |
What Were The Fund Costs For The Last Year ?
(Based on a hypothetical $10,000 investment)
| Fund | Costs of a $10,000 investment | Costs paid as a percentage of a $10,000 investment |
| Invesco Biotechnology & Genome ETF | $68 | 0.59% |
How Did The Fund Perform During The Period?
• During the fiscal year ended April 30, 2026, U.S. equities experienced positive returns for the majority of the year, although geopolitical conflict towards the end of the year sparked bouts of increased volatility. During the period, the health care sector underperformed the broader market. The Fund's multi-factor methodology led to security selection performance tailwind compared to the S&P Composite 1500® Biotechnology Index.
• The Fund is passively managed and seeks to track the investment results (before fees and expenses) of the Dynamic Biotech & Genome Intellidex® Index (the “Index”). The Fund generally will invest at least 90% of its total assets in securities that comprise the Index.
• For the fiscal year ended April 30, 2026, the Fund's performance, on a net asset value ("NAV") basis, 29.08%, differed from the return of the Index, 29.70%, primarily due to fees and expenses incurred by the Fund during the period.
What contributed to performance?
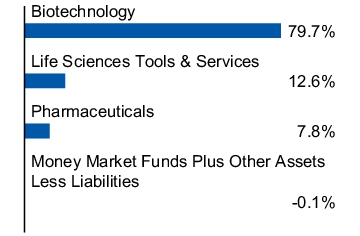
Sub-Industry Allocations | Biotechnology sub-industry, followed by the pharmaceuticals and life sciences tools & services sub-industries, respectively.
Positions | United Therapeutics Corp., a biotechnology company, and Exact Sciences Corp., a health care equipment company (no longer held at fiscal year-end).
What detracted from performance?
Sub-Industry Allocations | No sub-industry detracted from the Fund's performance during the period.
Positions | Akebia Therapeutics, Inc., a biotechnology company (no longer held at fiscal year-end), and TG Therapeutics, Inc., a biotechnology company.
How Has The Fund Historically Performed?
Growth of $10,000 Investment
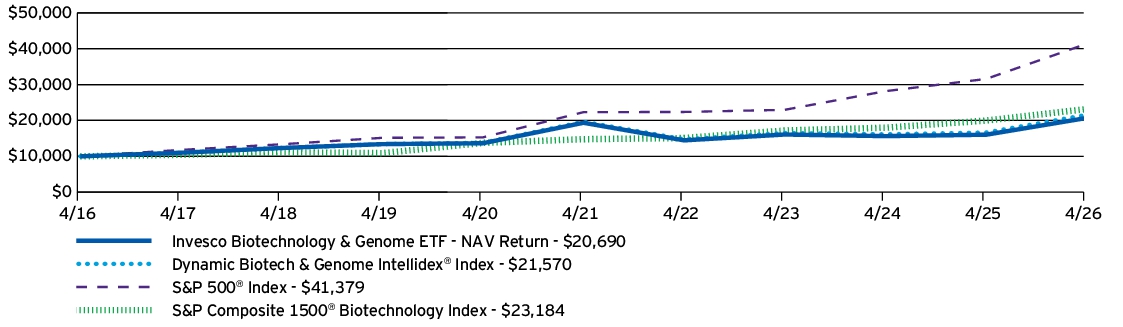
AVERAGE ANNUAL TOTAL RETURNS |
1 Year |
5 Years |
10 Years |
| Invesco Biotechnology & Genome ETF — NAV Return | 29.08% | 1.34% | 7.54% |
| Dynamic Biotech & Genome Intellidex® Index | 29.70% | 1.90% | 7.99% |
| S&P 500® Index | 31.05% | 13.14% | 15.26% |
| S&P Composite 1500® Biotechnology Index | 16.09% | 9.43% | 8.77% |
Performance figures do not reflect deduction of taxes a shareholder would pay on Fund distributions or sale of Fund shares.
What Are Key Statistics About The Fund?
(as of April 30, 2026)
| Fund net assets | $247,382,190 |
| Total number of portfolio holdings | 33 |
| Total advisory fees paid | $1,192,501 |
| Portfolio turnover rate | 103% |
What Comprised The Fund's Holdings?
(as of April 30, 2026)
Top ten holdings*
(% of net assets)
(% of net assets)
| United Therapeutics Corp. | 6.28% |
| Illumina, Inc. | 5.37% |
| Biogen, Inc. | 5.05% |
| Incyte Corp. | 4.91% |
| Alnylam Pharmaceuticals, Inc. | 4.84% |
| Regeneron Pharmaceuticals, Inc. | 4.77% |
| Amgen, Inc. | 4.71% |
| Gilead Sciences, Inc. | 4.62% |
| BioCryst Pharmaceuticals, Inc. | 3.42% |
| Catalyst Pharmaceuticals, Inc. | 3.30% |
| * Excluding money market fund holdings, if any. |
Sub-industry allocation
(% of net assets)
(% of net assets)
Top ten holdings*
(% of net assets)
(% of net assets)
| United Therapeutics Corp. | 6.28% |
| Illumina, Inc. | 5.37% |
| Biogen, Inc. | 5.05% |
| Incyte Corp. | 4.91% |
| Alnylam Pharmaceuticals, Inc. | 4.84% |
| Regeneron Pharmaceuticals, Inc. | 4.77% |
| Amgen, Inc. | 4.71% |
| Gilead Sciences, Inc. | 4.62% |
| BioCryst Pharmaceuticals, Inc. | 3.42% |
| Catalyst Pharmaceuticals, Inc. | 3.30% |
| * Excluding money market fund holdings, if any. |
What Were The Fund Costs For The Last Year ?
(Based on a hypothetical $10,000 investment)
| Fund | Costs of a $10,000 investment | Costs paid as a percentage of a $10,000 investment |
| Invesco Food & Beverage ETF | $66 | 0.63%† |
|
†
|
Reflects fee waivers and/or expense reimbursements, without which expenses would have been higher.
|
How Did The Fund Perform During The Period?
• During the fiscal year ended April 30, 2026, U.S. equities experienced positive returns for the majority of the year, although geopolitical conflict towards the end of the year sparked bouts of increased volatility. During the period, the consumer staples sector underperformed the broader market. The Fund's multifactor methodology led to an overweight in food distributor stocks, which created a performance tailwind compared to the S&P Composite 1500® Food Beverage & Tobacco Index.
• The Fund is passively managed and seeks to track the investment results (before fees and expenses) of the Dynamic Food & Beverage Intellidex® Index (the “Index”). The Fund generally will invest at least 90% of its total assets in securities that comprise the Index.
• For the fiscal year ended April 30, 2026, the Fund's performance, on a net asset value ("NAV") basis, 8.03%, differed from the return of the Index, 8.77%, primarily due to fees and expenses incurred by the Fund during the period.
What contributed to performance?
Sub-Industry Allocations | Food distributors sub-industry, followed by the agricultural products & services and restaurants sub-industries, respectively.
Positions | United Natural Foods, Inc., a food distributors company, and Monster Beverage Corp., a soft drinks & non-alcoholic beverages company.
What detracted from performance?
Sub-Industry Allocations | Food retail sub-industry, followed by the packaged foods & meats sub-industry.
Positions | Sprouts Farmers Market, Inc., a food retail company (no longer held at fiscal year-end), and Nomad Foods Ltd., a packaged foods & meats company.
How Has The Fund Historically Performed?
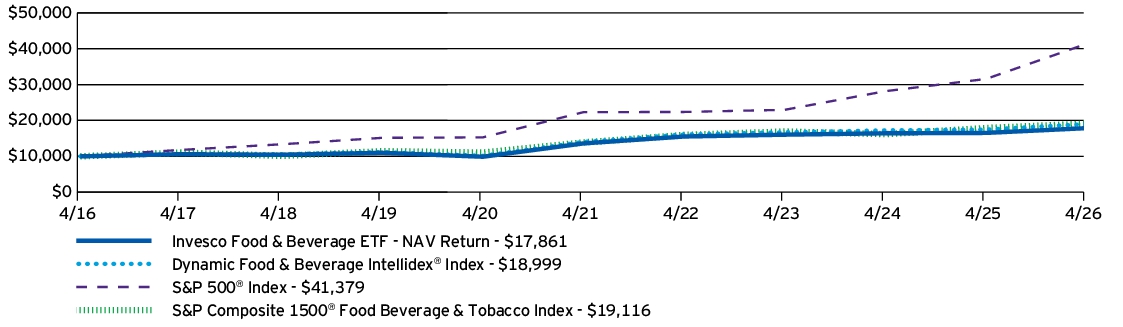
Growth of $10,000 Investment
AVERAGE ANNUAL TOTAL RETURNS |
1 Year |
5 Years |
10 Years |
| Invesco Food & Beverage ETF — NAV Return | 8.03% | 5.59% | 5.97% |
| Dynamic Food & Beverage Intellidex® Index | 8.77% | 6.29% | 6.63% |
| S&P 500® Index | 31.05% | 13.14% | 15.26% |
| S&P Composite 1500® Food Beverage & Tobacco Index | 6.94% | 6.63% | 6.69% |
Performance figures do not reflect deduction of taxes a shareholder would pay on Fund distributions or sale of Fund shares.
What Are Key Statistics About The Fund?
(as of April 30, 2026)
| Fund net assets | $94,416,624 |
| Total number of portfolio holdings | 33 |
| Total advisory fees paid | $475,578 |
| Portfolio turnover rate | 107% |
What Comprised The Fund's Holdings?
(as of April 30, 2026)
Top ten holdings*
(% of net assets)
(% of net assets)
| Archer-Daniels-Midland Co. | 5.52% |
| Corteva, Inc. | 5.24% |
| Mondelez International, Inc., Class A | 5.06% |
| Kroger Co. (The) | 4.92% |
| PepsiCo, Inc. | 4.71% |
| Monster Beverage Corp. | 4.54% |
| Sysco Corp. | 4.19% |
| Hershey Co. (The) | 4.06% |
| United Natural Foods, Inc. | 3.57% |
| Darling Ingredients, Inc. | 3.35% |
| * Excluding money market fund holdings, if any. |
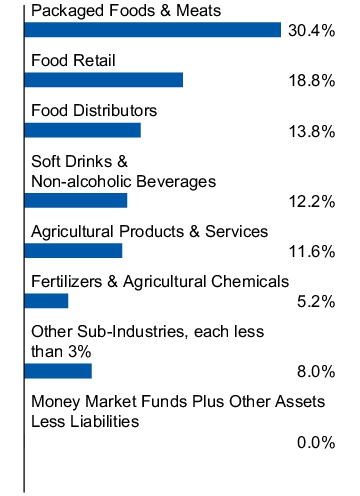
Sub-industry allocation
(% of net assets)
(% of net assets)
Top ten holdings*
(% of net assets)
(% of net assets)
| Archer-Daniels-Midland Co. | 5.52% |
| Corteva, Inc. | 5.24% |
| Mondelez International, Inc., Class A | 5.06% |
| Kroger Co. (The) | 4.92% |
| PepsiCo, Inc. | 4.71% |
| Monster Beverage Corp. | 4.54% |
| Sysco Corp. | 4.19% |
| Hershey Co. (The) | 4.06% |
| United Natural Foods, Inc. | 3.57% |
| Darling Ingredients, Inc. | 3.35% |
| * Excluding money market fund holdings, if any. |
What Were The Fund Costs For The Last Year ?
(Based on a hypothetical $10,000 investment)
| Fund | Costs of a $10,000 investment | Costs paid as a percentage of a $10,000 investment |
| Invesco Leisure and Entertainment ETF | $66 | 0.58% |
How Did The Fund Perform During The Period?
• During the fiscal year ended April 30, 2026, U.S. equities experienced positive returns for the majority of the year, although geopolitical conflict towards the end of the year sparked bouts of increased volatility. During the period, the consumer discretionary sector underperformed the broader market. The Fund's multi-factor methodology led to a security selection performance tailwind in packaged foods & meats stocks compared to the S&P Composite 1500® Hotels Restaurants & Leisure Index.
• The Fund is passively managed and seeks to track the investment results (before fees and expenses) of the Dynamic Leisure & Entertainment Intellidex® Index (the “Index”). The Fund generally will invest at least 90% of its total assets in securities that comprise the Index.
• For the fiscal year ended April 30, 2026, the Fund's performance, on a net asset value ("NAV") basis, 27.48%, differed from the return of the Index, 28.21%, primarily due to fees and expenses incurred by the Fund during the period, which was compounded during a period of strong performance.
What contributed to performance?
Sub-Industry Allocations | Movies & entertainment sub-industry, followed by the hotels, resorts & cruise lines and passenger airlines sub-industries, respectively.
Positions | Warner Bros. Discovery, Inc., Series A, a movies & entertainment company (no longer held at fiscal year-end), and Expedia Group, Inc., a hotels resorts & cruise lines company.
What detracted from performance?
Sub-Industry Allocations | Interactive media & services sub-industry, followed by the leisure facilities sub-industry.
Positions | Flutter Entertainment PLC, a casinos & gaming company (no longer held at fiscal year-end), and TripAdvisor, Inc., an interactive media & services company.
How Has The Fund Historically Performed?
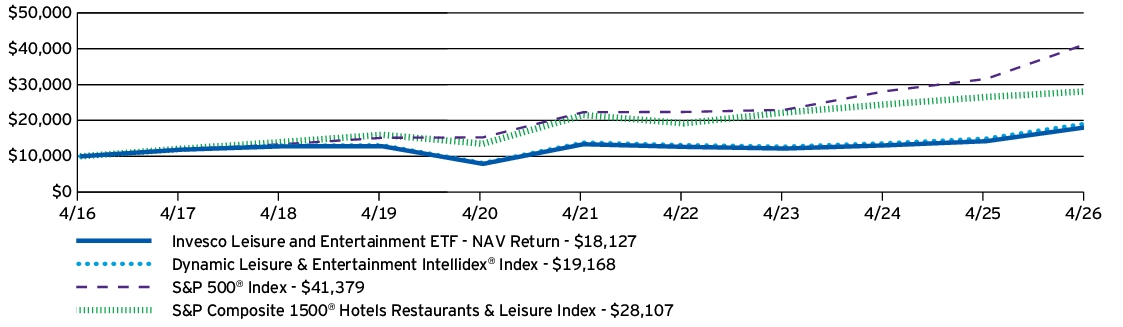
Growth of $10,000 Investment
AVERAGE ANNUAL TOTAL RETURNS |
1 Year |
5 Years |
10 Years |
| Invesco Leisure and Entertainment ETF — NAV Return | 27.48% | 6.28% | 6.13% |
| Dynamic Leisure & Entertainment Intellidex® Index | 28.21% | 6.74% | 6.72% |
| S&P 500® Index | 31.05% | 13.14% | 15.26% |
| S&P Composite 1500® Hotels Restaurants & Leisure Index | 5.96% | 5.50% | 10.89% |
Performance figures do not reflect deduction of taxes a shareholder would pay on Fund distributions or sale of Fund shares.
What Are Key Statistics About The Fund?
(as of April 30, 2026)
| Fund net assets | $244,873,472 |
| Total number of portfolio holdings | 33 |
| Total advisory fees paid | $1,506,341 |
| Portfolio turnover rate | 168% |
What Comprised The Fund's Holdings?
(as of April 30, 2026)
Top ten holdings*
(% of net assets)
(% of net assets)
| Expedia Group, Inc. | 6.24% |
| Airbnb, Inc., Class A | 5.56% |
| Marriott International, Inc., Class A | 5.25% |
| Las Vegas Sands Corp. | 4.94% |
| Carnival Corp. | 4.17% |
| Royal Caribbean Cruises Ltd. | 4.15% |
| Sysco Corp. | 4.14% |
| Lionsgate Studios Corp. | 4.11% |
| United Airlines Holdings, Inc. | 3.98% |
| Versant Media Group, Inc. | 3.66% |
| * Excluding money market fund holdings, if any. |
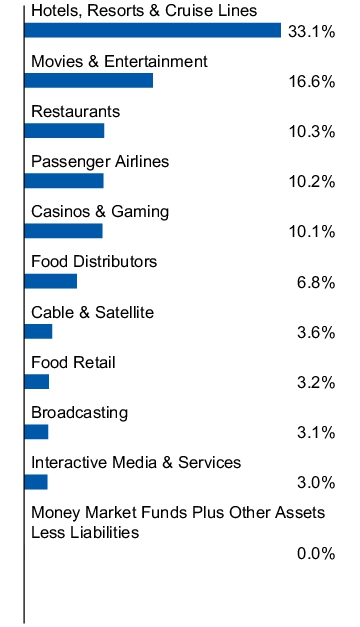
Sub-industry allocation
(% of net assets)
(% of net assets)
Top ten holdings*
(% of net assets)
(% of net assets)
| Expedia Group, Inc. | 6.24% |
| Airbnb, Inc., Class A | 5.56% |
| Marriott International, Inc., Class A | 5.25% |
| Las Vegas Sands Corp. | 4.94% |
| Carnival Corp. | 4.17% |
| Royal Caribbean Cruises Ltd. | 4.15% |
| Sysco Corp. | 4.14% |
| Lionsgate Studios Corp. | 4.11% |
| United Airlines Holdings, Inc. | 3.98% |
| Versant Media Group, Inc. | 3.66% |
| * Excluding money market fund holdings, if any. |
What Were The Fund Costs For The Last Year ?
(Based on a hypothetical $10,000 investment)
| Fund | Costs of a $10,000 investment | Costs paid as a percentage of a $10,000 investment |
| Invesco Next Gen Media and Gaming ETF | $66 | 0.63%† |
|
†
|
Reflects fee waivers and/or expense reimbursements, without which expenses would have been higher.
|
How Did The Fund Perform During The Period?
• During the fiscal year ended April 30, 2026, U.S. equities experienced positive returns for the majority of the year, although geopolitical conflict towards the end of the year sparked bouts of increased volatility. During the period, semiconductors and semiconductor equipment, to which the Fund had significant exposure through the implementation of its underlying index methodology, outperformed the broader stock market. In addition to the Fund's focus on media- and gaming-related industries, its thematic media methodology created a performance tailwind compared to the S&P Composite 1500® Media Index.
• The Fund is passively managed and seeks to track the investment results (before fees and expenses) of the STOXX World AC NexGen Media Index (the “Index”). The Fund generally will invest at least 90% of its total assets in securities that comprise the Index.
• For the fiscal year ended April 30, 2026, the Fund's performance, on a net asset value ("NAV") basis, 10.76%, differed from the return of the Index, 11.25%, primarily due to fees and expenses incurred by the Fund during the period.
What contributed to performance?
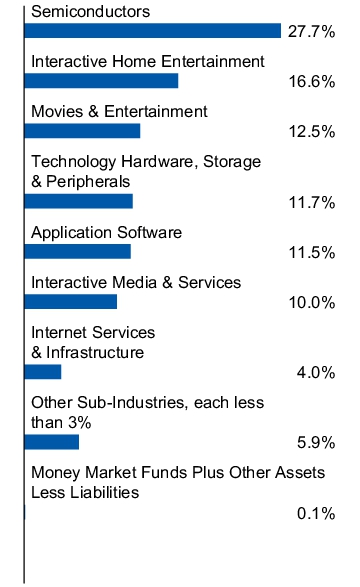
Sub-Industry Allocations | Semiconductors sub-industry, followed by the internet services & infrastructure and technology hardware storage & peripherals sub-industries, respectively.
Positions | Advanced Micro Devices, Inc., a semiconductors company, and NVIDIA Corp., a semiconductors company.
What detracted from performance?
Sub-Industry Allocations | Interactive home entertainment sub-industry, followed by the application software and movies & entertainment sub-industries, respectively.
Positions | Nintendo Co., Ltd., an interactive home entertainment company, and Adobe, Inc., an application software company.
How Has The Fund Historically Performed?
Growth of $10,000 Investment
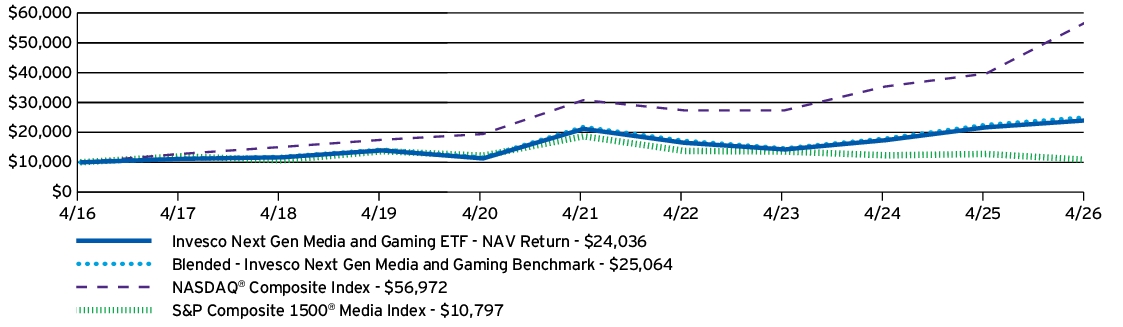
AVERAGE ANNUAL TOTAL RETURNS |
1 Year |
5 Years |
10 Years |
| Invesco Next Gen Media and Gaming ETF — NAV Return | 10.76% | 2.57% | 9.17% |
| Blended - Invesco Next Gen Media and Gaming Benchmark | 11.25% | 2.80% | 9.62% |
| NASDAQ® Composite Index | 43.57% | 13.09% | 19.01% |
| S&P Composite 1500® Media Index | -15.67% | -10.40% | 0.77% |
Performance figures do not reflect deduction of taxes a shareholder would pay on Fund distributions or sale of Fund shares.
What Are Key Statistics About The Fund?
(as of April 30, 2026)
| Fund net assets | $43,193,763 |
| Total number of portfolio holdings | 93 |
| Total advisory fees paid | $579,329 |
| Portfolio turnover rate | 27% |
What Comprised The Fund's Holdings?
(as of April 30, 2026)
Top ten holdings*
(% of net assets)
(% of net assets)
| Advanced Micro Devices, Inc. | 13.33% |
| NVIDIA Corp. | 8.10% |
| Apple, Inc. | 7.89% |
| Netflix, Inc. | 7.38% |
| Meta Platforms, Inc., Class A | 7.14% |
| QUALCOMM, Inc. | 5.73% |
| Cloudflare, Inc., Class A | 4.04% |
| Adobe, Inc. | 3.82% |
| Spotify Technology S.A. | 3.66% |
| Nintendo Co. Ltd. | 3.21% |
| * Excluding money market fund holdings, if any. |
Sub-industry allocation
(% of net assets)
(% of net assets)
Top ten holdings*
(% of net assets)
(% of net assets)
| Advanced Micro Devices, Inc. | 13.33% |
| NVIDIA Corp. | 8.10% |
| Apple, Inc. | 7.89% |
| Netflix, Inc. | 7.38% |
| Meta Platforms, Inc., Class A | 7.14% |
| QUALCOMM, Inc. | 5.73% |
| Cloudflare, Inc., Class A | 4.04% |
| Adobe, Inc. | 3.82% |
| Spotify Technology S.A. | 3.66% |
| Nintendo Co. Ltd. | 3.21% |
| * Excluding money market fund holdings, if any. |
What Were The Fund Costs For The Last Year ?
(Based on a hypothetical $10,000 investment)
| Fund | Costs of a $10,000 investment | Costs paid as a percentage of a $10,000 investment |
| Invesco Next Gen Connectivity ETF | $53 | 0.40% |
How Did The Fund Perform During The Period?
• During the fiscal year ended April 30, 2026, U.S. equities experienced positive returns for the majority of the year, although geopolitical conflict towards the end of the year sparked bouts of increased volatility. During the period, connectivity-related industries outperformed the broader stock market. Despite the Fund's focus on connectivity-related industries, its thematic emerging connectivity methodology created a performance headwind compared to the S&P Composite 1500® Communications Equipment Index.
• The Fund is passively managed and seeks to track the investment results (before fees and expenses) of the STOXX World AC NexGen Connectivity Index (the “Index”). The Fund generally will invest at least 90% of its total assets in securities that comprise the Index.
• For the fiscal year ended April 30, 2026, the Fund's performance, on a net asset value ("NAV") basis, 65.89%, differed from the return of the Index, 65.29%, primarily due to positive foreign fair valuation impact and positive differences in the tax withholding treatment of dividends between the Fund and the Index, partially offset by fees and expenses incurred by the Fund during the period.
What contributed to performance?
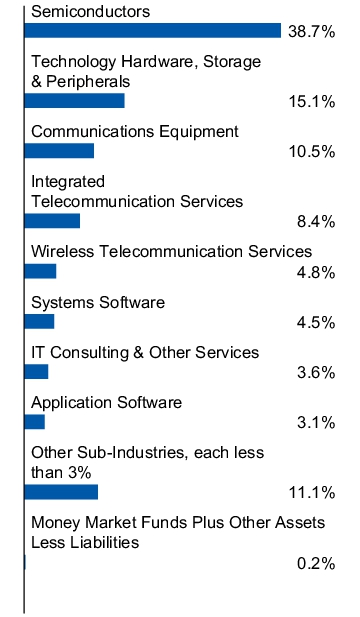
Sub-Industry Allocations | Semiconductors sub-industry, followed by the technology hardware storage & peripherals and communications equipment sub-industries, respectively.
Positions | Broadcom Inc., a semiconductors company, and Taiwan Semiconductor Manufacturing Co., Ltd., a semiconductors company.
What detracted from performance?
Sub-Industry Allocations | IT consulting & other services sub-industry, followed by the cable & satellite and systems software sub-industries, respectively.
Positions | Accenture PLC, an IT consulting & other services company, and T-Mobile US, Inc., a wireless telecommunication services company.
How Has The Fund Historically Performed?
Growth of $10,000 Investment
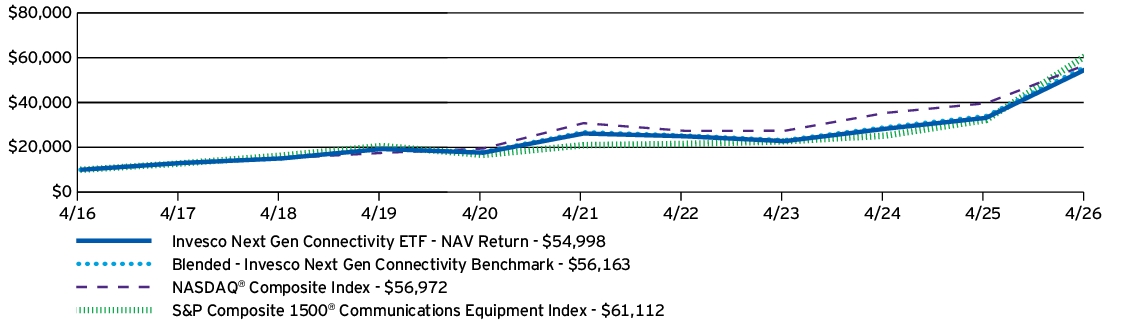
AVERAGE ANNUAL TOTAL RETURNS |
1 Year |
5 Years |
10 Years |
| Invesco Next Gen Connectivity ETF — NAV Return | 65.89% | 16.01% | 18.59% |
| Blended - Invesco Next Gen Connectivity Benchmark | 65.29% | 15.96% | 18.84% |
| NASDAQ® Composite Index | 43.57% | 13.09% | 19.01% |
| S&P Composite 1500® Communications Equipment Index | 89.70% | 23.84% | 19.84% |
Performance figures do not reflect deduction of taxes a shareholder would pay on Fund distributions or sale of Fund shares.
What Are Key Statistics About The Fund?
(as of April 30, 2026)
| Fund net assets | $133,608,093 |
| Total number of portfolio holdings | 98 |
| Total advisory fees paid | $264,795 |
| Portfolio turnover rate | 19% |
What Comprised The Fund's Holdings?
(as of April 30, 2026)
Top ten holdings*
(% of net assets)
(% of net assets)
| Broadcom, Inc. | 8.45% |
| Taiwan Semiconductor Manufacturing Co. Ltd. | 7.99% |
| Apple, Inc. | 7.21% |
| Samsung Electronics Co. Ltd. | 7.00% |
| Micron Technology, Inc. | 6.06% |
| Intel Corp. | 5.69% |
| Cisco Systems, Inc. | 4.25% |
| SK hynix, Inc. | 4.10% |
| Verizon Communications, Inc. | 2.58% |
| Arista Networks, Inc. | 2.49% |
| * Excluding money market fund holdings, if any. |
Sub-industry allocation
(% of net assets)
(% of net assets)
Top ten holdings*
(% of net assets)
(% of net assets)
| Broadcom, Inc. | 8.45% |
| Taiwan Semiconductor Manufacturing Co. Ltd. | 7.99% |
| Apple, Inc. | 7.21% |
| Samsung Electronics Co. Ltd. | 7.00% |
| Micron Technology, Inc. | 6.06% |
| Intel Corp. | 5.69% |
| Cisco Systems, Inc. | 4.25% |
| SK hynix, Inc. | 4.10% |
| Verizon Communications, Inc. | 2.58% |
| Arista Networks, Inc. | 2.49% |
| * Excluding money market fund holdings, if any. |
What Were The Fund Costs For The Last Year ?
(Based on a hypothetical $10,000 investment)
| Fund | Costs of a $10,000 investment | Costs paid as a percentage of a $10,000 investment |
| Invesco Pharmaceuticals ETF | $67 | 0.58% |
How Did The Fund Perform During The Period?
• During the fiscal year ended April 30, 2026, U.S. equities experienced positive returns for the majority of the year, although geopolitical conflict towards the end of the year sparked bouts of increased volatility. During the period, the health care sector underperformed the broader stock market. The Fund's multi-factor methodology led to an overweight in health care equipment, which created a performance tailwind compared to the S&P Composite 1500® Pharmaceuticals Index.
• The Fund is passively managed and seeks to track the investment results (before fees and expenses) of the Dynamic Pharmaceutical Intellidex® Index (the “Index”). The Fund generally will invest at least 90% of its total assets in securities that comprise the Index.
• For the fiscal year ended April 30, 2026, the Fund's performance, on a net asset value ("NAV") basis, 29.49%, differed from the return of the Index, 30.21%, primarily due to fees and expenses incurred by the Fund during the period.
What contributed to performance?
Sub-Industry Allocations | Pharmaceuticals sub-industry, followed by the biotechnology sub-industry.
Positions | Avadel Pharmaceuticals PLC, a pharmaceuticals company (no longer held at fiscal year-end), and Travere Therapeutics, Inc., a biotechnology company.
What detracted from performance?
Sub-Industry Allocations | Health care equipment sub-industry.
Positions | Abbott Laboratories, a health care equipment company, and Perrigo Co. PLC, a pharmaceuticals company.
How Has The Fund Historically Performed?
Growth of $10,000 Investment
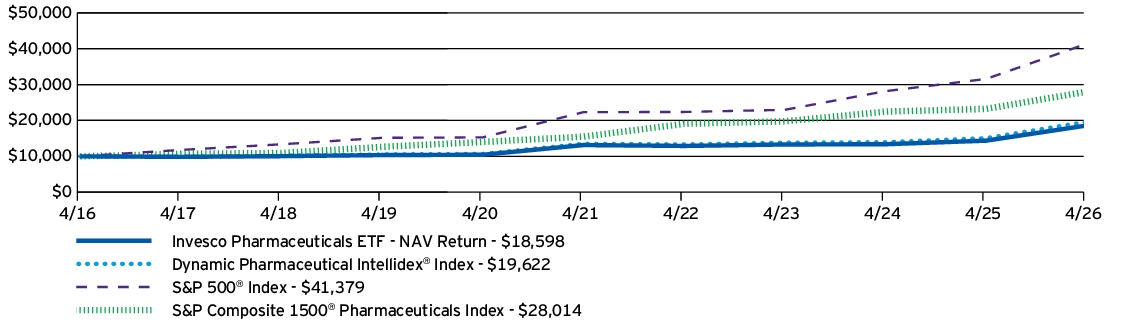
AVERAGE ANNUAL TOTAL RETURNS |
1 Year |
5 Years |
10 Years |
| Invesco Pharmaceuticals ETF — NAV Return | 29.49% | 7.19% | 6.40% |
| Dynamic Pharmaceutical Intellidex® Index | 30.21% | 7.75% | 6.97% |
| S&P 500® Index | 31.05% | 13.14% | 15.26% |
| S&P Composite 1500® Pharmaceuticals Index | 20.58% | 12.59% | 10.85% |
Performance figures do not reflect deduction of taxes a shareholder would pay on Fund distributions or sale of Fund shares.
What Are Key Statistics About The Fund?
(as of April 30, 2026)
| Fund net assets | $333,093,019 |
| Total number of portfolio holdings | 34 |
| Total advisory fees paid | $1,525,311 |
| Portfolio turnover rate | 36% |
What Comprised The Fund's Holdings?
(as of April 30, 2026)
Top ten holdings*
(% of net assets)
(% of net assets)
| Pfizer, Inc. | 5.20% |
| Johnson & Johnson | 4.93% |
| AbbVie, Inc. | 4.89% |
| Amgen, Inc. | 4.78% |
| Eli Lilly and Co. | 4.74% |
| Gilead Sciences, Inc. | 4.68% |
| Merck & Co., Inc. | 4.65% |
| Abbott Laboratories | 4.18% |
| Travere Therapeutics, Inc. | 3.99% |
| Corcept Therapeutics, Inc. | 3.73% |
| * Excluding money market fund holdings, if any. |
Sub-industry allocation
(% of net assets)
(% of net assets)
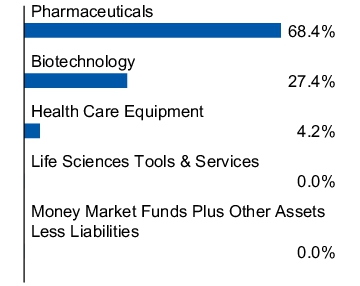
Top ten holdings*
(% of net assets)
(% of net assets)
| Pfizer, Inc. | 5.20% |
| Johnson & Johnson | 4.93% |
| AbbVie, Inc. | 4.89% |
| Amgen, Inc. | 4.78% |
| Eli Lilly and Co. | 4.74% |
| Gilead Sciences, Inc. | 4.68% |
| Merck & Co., Inc. | 4.65% |
| Abbott Laboratories | 4.18% |
| Travere Therapeutics, Inc. | 3.99% |
| Corcept Therapeutics, Inc. | 3.73% |
| * Excluding money market fund holdings, if any. |
What Were The Fund Costs For The Last Year ?
(Based on a hypothetical $10,000 investment)
| Fund | Costs of a $10,000 investment | Costs paid as a percentage of a $10,000 investment |
| Invesco Semiconductors ETF | $107 | 0.55% |
How Did The Fund Perform During The Period?
• During the fiscal year ended April 30, 2026, U.S. equities experienced positive returns for the majority of the year, although geopolitical conflict towards the end of the year sparked bouts of increased volatility. During the period, semiconductors outperformed the broader stock market. In addition to the Fund's focus on semiconductor stocks, its multi-factor methodology created a performance tailwind compared to the S&P Composite 1500® Semiconductor Index.
• The Fund is passively managed and seeks to track the investment results (before fees and expenses) of the Dynamic Semiconductor Intellidex® Index (the “Index”). The Fund generally will invest at least 90% of its total assets in securities that comprise the Index.
• For the fiscal year ended April 30, 2026, the Fund's performance, on a net asset value ("NAV") basis, 189.32%, differed from the return of the Index, 190.97%, primarily due to fees and expenses incurred by the Fund during the period, which was compounded during a period of strong performance and partially offset by income received from the securities lending program in which the Fund participates.
What contributed to performance?
Sub-Industry Allocations | Semiconductors sub-industry, followed by the semiconductor materials & equipment and electronic equipment & instruments sub-industries, respectively.
Positions | Micron Technology, Inc., a semiconductors company, and Lam Research Corp., a semiconductor materials & equipment company.
What detracted from performance?
Sub-Industry Allocations | Automotive parts & equipment sub-industry.
Positions | Mobileye Global, Inc., an automotive parts & equipment company (no longer held at fiscal year-end), and Ichor Holdings, Ltd., a semiconductor materials & equipment company (no longer held at fiscal year-end).
How Has The Fund Historically Performed?
Growth of $10,000 Investment
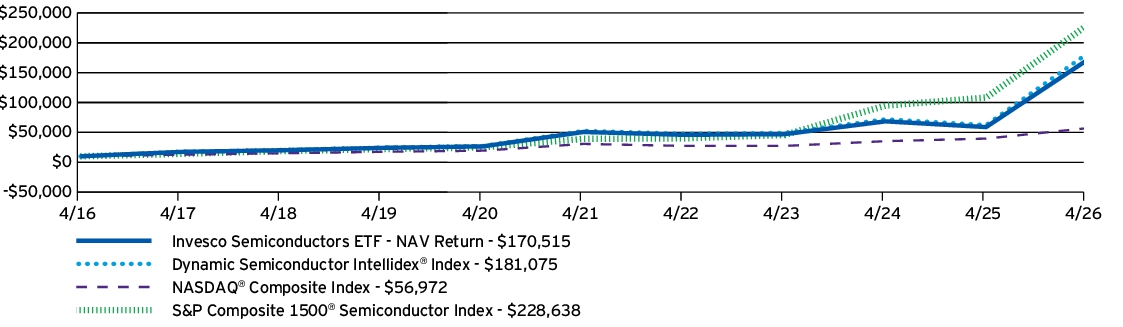
AVERAGE ANNUAL TOTAL RETURNS |
1 Year |
5 Years |
10 Years |
| Invesco Semiconductors ETF — NAV Return | 189.32% | 27.42% | 32.79% |
| Dynamic Semiconductor Intellidex® Index | 190.97% | 28.12% | 33.59% |
| NASDAQ® Composite Index | 43.57% | 13.09% | 19.01% |
| S&P Composite 1500® Semiconductor Index | 111.33% | 42.22% | 36.75% |
Performance figures do not reflect deduction of taxes a shareholder would pay on Fund distributions or sale of Fund shares.
What Are Key Statistics About The Fund?
(as of April 30, 2026)
| Fund net assets | $1,995,081,050 |
| Total number of portfolio holdings | 33 |
| Total advisory fees paid | $4,875,138 |
| Portfolio turnover rate | 105% |
What Comprised The Fund's Holdings?
(as of April 30, 2026)
Top ten holdings*
(% of net assets)
(% of net assets)
| MaxLinear, Inc. | 8.00% |
| Advanced Micro Devices, Inc. | 6.27% |
| Texas Instruments, Inc. | 4.98% |
| Broadcom, Inc. | 4.85% |
| Micron Technology, Inc. | 4.68% |
| KLA Corp. | 4.40% |
| Lam Research Corp. | 3.99% |
| Applied Materials, Inc. | 3.95% |
| NVIDIA Corp. | 3.91% |
| Tower Semiconductor Ltd. | 3.62% |
| * Excluding money market fund holdings, if any. |
Sub-industry allocation
(% of net assets)
(% of net assets)
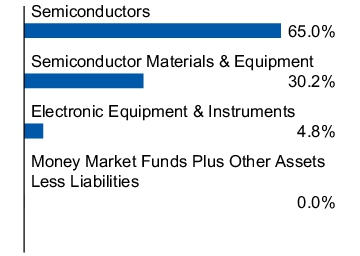
Top ten holdings*
(% of net assets)
(% of net assets)
| MaxLinear, Inc. | 8.00% |
| Advanced Micro Devices, Inc. | 6.27% |
| Texas Instruments, Inc. | 4.98% |
| Broadcom, Inc. | 4.85% |
| Micron Technology, Inc. | 4.68% |
| KLA Corp. | 4.40% |
| Lam Research Corp. | 3.99% |
| Applied Materials, Inc. | 3.95% |
| NVIDIA Corp. | 3.91% |
| Tower Semiconductor Ltd. | 3.62% |
| * Excluding money market fund holdings, if any. |
What Were The Fund Costs For The Last Year ?
(Based on a hypothetical $10,000 investment)
| Fund | Costs of a $10,000 investment | Costs paid as a percentage of a $10,000 investment |
| Invesco AI and Next Gen Software ETF | $83 | 0.57% |
How Did The Fund Perform During The Period?
• During the fiscal year ended April 30, 2026, U.S. equities experienced positive returns for a majority of the year, while increasingly rotating back toward artificial intelligence (AI)-linked themes. Renewed AI investment momentum benefited companies tied to next-generation software development and broader AI buildout. As a result, the Fund outperformed the S&P Composite 1500® Software & Services Index.
• The Fund is passively managed and seeks to track the investment results (before fees and expenses) of the STOXX World AC NexGen Software Development Index (the “Index”). The Fund generally will invest at least 90% of its total assets in securities that comprise the Index.
• For the fiscal year ended April 30, 2026, the Fund's performance, on a net asset value ("NAV") basis, 90.27%, differed from the return of the Index, 90.29%, primarily due to fees and expenses incurred by the Fund during the period.
What contributed to performance?
Sub-Industry Allocations | Semiconductors sub-industry, followed by the interactive media & services and technology hardware storage & peripherals sub-industries, respectively.
Positions | Micron Technology, Inc., a semiconductors company, and SK hynix Inc., a semiconductors company.
What detracted from performance?
Sub-Industry Allocations | Application software sub-industry, followed by the health care equipment sub-industry.
Positions | Strategy Inc., Class A, an application software company, and Adobe, Inc., an application software company.
How Has The Fund Historically Performed?
Growth of $10,000 Investment
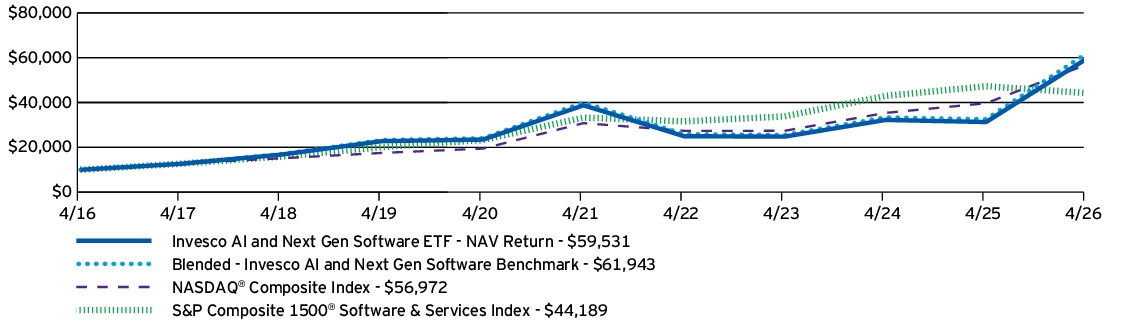
AVERAGE ANNUAL TOTAL RETURNS |
1 Year |
5 Years |
10 Years |
| Invesco AI and Next Gen Software ETF — NAV Return | 90.27% | 8.97% | 19.53% |
| Blended - Invesco AI and Next Gen Software Benchmark | 90.29% | 9.14% | 20.00% |
| NASDAQ® Composite Index | 43.57% | 13.09% | 19.01% |
| S&P Composite 1500® Software & Services Index | -6.51% | 5.83% | 16.02% |
Performance figures do not reflect deduction of taxes a shareholder would pay on Fund distributions or sale of Fund shares.
What Are Key Statistics About The Fund?
(as of April 30, 2026)
| Fund net assets | $875,307,932 |
| Total number of portfolio holdings | 102 |
| Total advisory fees paid | $2,960,138 |
| Portfolio turnover rate | 26% |
What Comprised The Fund's Holdings?
(as of April 30, 2026)
Top ten holdings*
(% of net assets)
(% of net assets)
| SK hynix, Inc. | 9.02% |
| Micron Technology, Inc. | 8.10% |
| Alphabet, Inc., Class A | 8.05% |
| Intel Corp. | 7.11% |
| NVIDIA Corp. | 6.92% |
| Advanced Micro Devices, Inc. | 6.40% |
| Meta Platforms, Inc., Class A | 4.76% |
| QUALCOMM, Inc. | 3.55% |
| Intuitive Surgical, Inc. | 3.41% |
| Western Digital Corp. | 3.19% |
| * Excluding money market fund holdings, if any. |
Sub-industry allocation
(% of net assets)
(% of net assets)
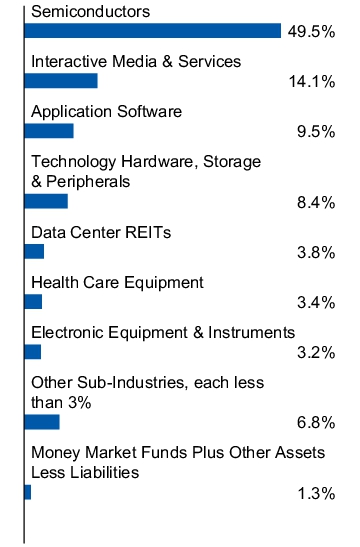
Top ten holdings*
(% of net assets)
(% of net assets)
| SK hynix, Inc. | 9.02% |
| Micron Technology, Inc. | 8.10% |
| Alphabet, Inc., Class A | 8.05% |
| Intel Corp. | 7.11% |
| NVIDIA Corp. | 6.92% |
| Advanced Micro Devices, Inc. | 6.40% |
| Meta Platforms, Inc., Class A | 4.76% |
| QUALCOMM, Inc. | 3.55% |
| Intuitive Surgical, Inc. | 3.41% |
| Western Digital Corp. | 3.19% |
| * Excluding money market fund holdings, if any. |
What Were The Fund Costs For The Last Year ?
(Based on a hypothetical $10,000 investment)
| Fund | Costs of a $10,000 investment | Costs paid as a percentage of a $10,000 investment |
| Invesco International Dividend AchieversTM ETF | $58 | 0.53% |
How Did The Fund Perform During The Period?
• During the fiscal year ended April 30, 2026, international equities experienced positive returns for the majority of the year, although geopolitical conflict towards the end of the year sparked bouts of increased volatility. During the period, the Fund underperformed the MSCI EAFE® Index primarily due to its security selection in the industrials and information technology sectors.
• The Fund is passively managed and seeks to track the investment results (before fees and expenses) of the Nasdaq International Dividend AchieversTM Index (the “Index”). The Fund generally will invest at least 90% of its total assets in securities that comprise the Index.
• For the fiscal year ended April 30, 2026, the Fund's performance, on a net asset value ("NAV") basis, 20.37%, differed from the return of the Index, 20.28%, primarily due to income received from the securities lending program in which the Fund participates and positive differences in the tax withholding treatment of dividends between the Fund and the Index, which were partially offset by fees and expenses incurred by the Fund during the period.
What contributed to performance?
Sector Allocations | Financials sector, followed by the energy and utilities sectors, respectively.
Positions | Canadian Natural Resources Ltd., an energy company, and Magna International, Inc., a consumer discretionary company.
What detracted from performance?
Sector Allocations | Information technology sector, followed by the health care and industrials sectors, respectively.
Positions | Diageo PLC, ADR, a consumer staples company (no longer held at fiscal year-end), and Novo Nordisk A/S, ADR, a health care company.
How Has The Fund Historically Performed?
Growth of $10,000 Investment
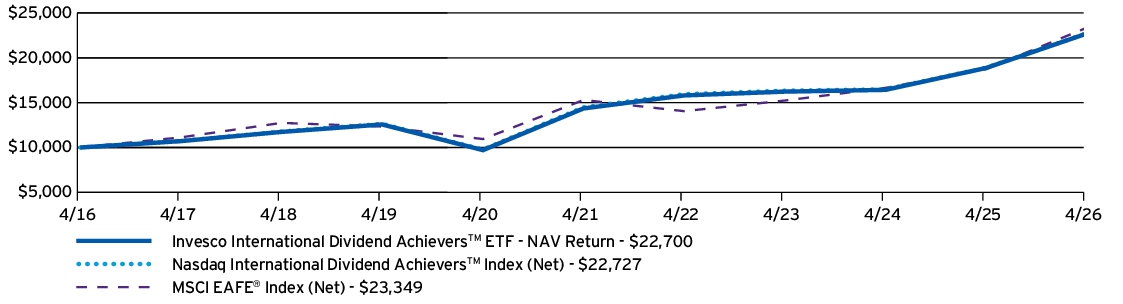
AVERAGE ANNUAL TOTAL RETURNS |
1 Year |
5 Years |
10 Years |
| Invesco International Dividend AchieversTM ETF — NAV Return | 20.37% | 9.60% | 8.54% |
| Nasdaq International Dividend Achievers™ Index (Net) | 20.28% | 9.43% | 8.56% |
| MSCI EAFE® Index (Net) | 24.60% | 8.83% | 8.85% |
Performance figures do not reflect deduction of taxes a shareholder would pay on Fund distributions or sale of Fund shares.
What Are Key Statistics About The Fund?
(as of April 30, 2026)
| Fund net assets | $928,793,878 |
| Total number of portfolio holdings | 65 |
| Total advisory fees paid | $3,520,837 |
| Portfolio turnover rate | 55% |
What Comprised The Fund's Holdings?
(as of April 30, 2026)
Top ten holdings*
(% of net assets)
(% of net assets)
| TELUS Corp. | 3.71% |
| Eni S.p.A., ADR | 3.64% |
| Itau Unibanco Holding S.A., ADR | 3.61% |
| Enbridge, Inc. | 3.28% |
| Novo Nordisk A/S, ADR | 3.17% |
| Brookfield Renewable Partners L.P. | 3.02% |
| British American Tobacco PLC, ADR | 2.93% |
| PT Telkom Indonesia (Persero) Tbk, ADR | 2.93% |
| FinVolution Group, ADR | 2.65% |
| Sanofi S.A., ADR | 2.63% |
| * Excluding money market fund holdings, if any. |
Sector allocation
(% of net assets)
(% of net assets)
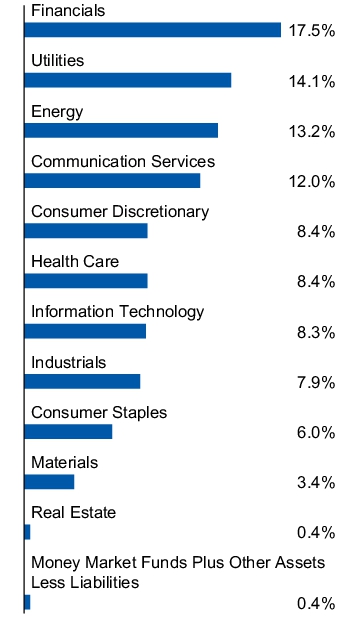
Top ten holdings*
(% of net assets)
(% of net assets)
| TELUS Corp. | 3.71% |
| Eni S.p.A., ADR | 3.64% |
| Itau Unibanco Holding S.A., ADR | 3.61% |
| Enbridge, Inc. | 3.28% |
| Novo Nordisk A/S, ADR | 3.17% |
| Brookfield Renewable Partners L.P. | 3.02% |
| British American Tobacco PLC, ADR | 2.93% |
| PT Telkom Indonesia (Persero) Tbk, ADR | 2.93% |
| FinVolution Group, ADR | 2.65% |
| Sanofi S.A., ADR | 2.63% |
| * Excluding money market fund holdings, if any. |
What Were The Fund Costs For The Last Year ?
(Based on a hypothetical $10,000 investment)
| Fund | Costs of a $10,000 investment | Costs paid as a percentage of a $10,000 investment |
| Invesco Dividend AchieversTM ETF | $58 | 0.52% |
How Did The Fund Perform During The Period?
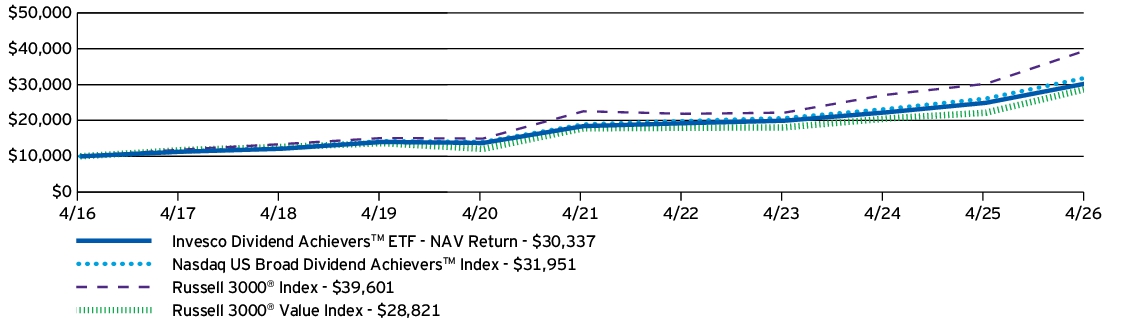
• During the fiscal year ended April 30, 2026, U.S. equities experienced positive returns for the majority of the year, although geopolitical conflict towards the end of the year sparked bouts of increased volatility. During the period, the Fund underperformed the Russell 3000® Index primarily due to its security selection within the information technology sector and relative overweight allocation to the health care sector.
• The Fund is passively managed and seeks to track the investment results (before fees and expenses) of the Nasdaq US Broad Dividend AchieversTM Index (the “Index”). The Fund generally will invest at least 90% of its total assets in securities that comprise the Index.
• For the fiscal year ended April 30, 2026, the Fund's performance, on a net asset value ("NAV") basis, 21.72%, differed from the return of the Index, 22.39%, primarily due to fees and expenses incurred by the Fund during the period.
What contributed to performance?
Sector Allocations | Information technology sector, followed by the financials and industrials sectors, respectively.
Positions | Broadcom, Inc., an information technology company, and Apple, Inc., an information technology company.
What detracted from performance?
Sector Allocations | No sectors detracted from the Fund's performance during the period.
Positions | Accenture PLC, Class A, an information technology company, and Abbott Laboratories, a health care company.
How Has The Fund Historically Performed?
Growth of $10,000 Investment
AVERAGE ANNUAL TOTAL RETURNS |
1 Year |
5 Years |
10 Years |
| Invesco Dividend AchieversTM ETF — NAV Return | 21.72% | 10.49% | 11.74% |
| Nasdaq US Broad Dividend Achievers™ Index | 22.39% | 11.07% | 12.32% |
| Russell 3000® Index | 31.01% | 11.91% | 14.75% |
| Russell 3000® Value Index | 29.96% | 10.09% | 11.17% |
Performance figures do not reflect deduction of taxes a shareholder would pay on Fund distributions or sale of Fund shares.
What Are Key Statistics About The Fund?
(as of April 30, 2026)
| Fund net assets | $764,161,259 |
| Total number of portfolio holdings | 433 |
| Total advisory fees paid | $2,919,012 |
| Portfolio turnover rate | 6% |
What Comprised The Fund's Holdings?
(as of April 30, 2026)
Top ten holdings*
(% of net assets)
(% of net assets)
| Broadcom, Inc. | 5.20% |
| Microsoft Corp. | 4.13% |
| Apple, Inc. | 4.09% |
| Walmart, Inc. | 3.84% |
| Eli Lilly and Co. | 3.22% |
| JPMorgan Chase & Co. | 3.08% |
| Exxon Mobil Corp. | 2.35% |
| Visa, Inc., Class A | 2.02% |
| Johnson & Johnson | 2.02% |
| Oracle Corp. | 1.69% |
| * Excluding money market fund holdings, if any. |
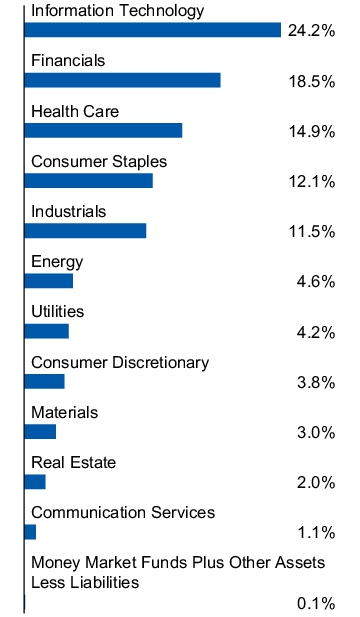
Sector allocation
(% of net assets)
(% of net assets)
Top ten holdings*
(% of net assets)
(% of net assets)
| Broadcom, Inc. | 5.20% |
| Microsoft Corp. | 4.13% |
| Apple, Inc. | 4.09% |
| Walmart, Inc. | 3.84% |
| Eli Lilly and Co. | 3.22% |
| JPMorgan Chase & Co. | 3.08% |
| Exxon Mobil Corp. | 2.35% |
| Visa, Inc., Class A | 2.02% |
| Johnson & Johnson | 2.02% |
| Oracle Corp. | 1.69% |
| * Excluding money market fund holdings, if any. |
What Were The Fund Costs For The Last Year ?
(Based on a hypothetical $10,000 investment)
| Fund | Costs of a $10,000 investment | Costs paid as a percentage of a $10,000 investment |
| Invesco Aerospace & Defense ETF | $69 | 0.58% |
How Did The Fund Perform During The Period?
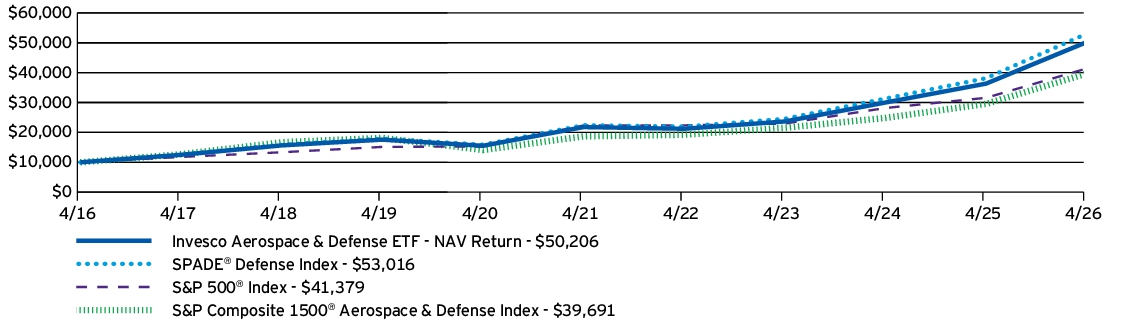
• During the fiscal year ended April 30, 2026, U.S. equities experienced positive returns for the majority of the year, although geopolitical conflict towards the end of the year sparked bouts of increased volatility. During the period, the aerospace and defense industry outperformed the broader market. In addition to the Fund's focus on aerospace and defense stocks, its security selection led to a performance tailwind compared to the S&P Composite 1500® Aerospace & Defense Index.
• The Fund is passively managed and seeks to track the investment results (before fees and expenses) of the SPADE® Defense Index (the “Index”). The Fund generally will invest at least 90% of its total assets in securities that comprise the Index.
• For the fiscal year ended April 30, 2026, the Fund's performance, on a net asset value ("NAV") basis, 38.20%, differed from the return of the Index, 39.02%, primarily due to fees and expenses incurred by the Fund during the period, which was compounded during a period of strong performance.
What contributed to performance?
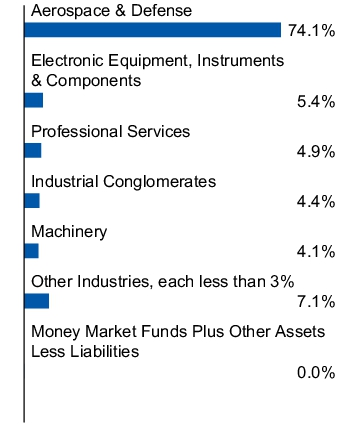
Industry Allocations | Aerospace & defense industry, followed by the electronic equipment instruments & components and machinery industries, respectively.
Positions | General Electric Co., an aerospace & defense company, and RTX Corp., an aerospace & defense company.
What detracted from performance?
Industry Allocations | No industries detracted from the Fund's performance during the period.
Positions | Booz Allen Hamilton Holding Corp., a professional services company, and Axon Enterprise, Inc., an aerospace & defense company.
How Has The Fund Historically Performed?
Growth of $10,000 Investment
AVERAGE ANNUAL TOTAL RETURNS |
1 Year |
5 Years |
10 Years |
| Invesco Aerospace & Defense ETF — NAV Return | 38.20% | 18.18% | 17.51% |
| SPADE® Defense Index | 39.02% | 18.80% | 18.15% |
| S&P 500® Index | 31.05% | 13.14% | 15.26% |
| S&P Composite 1500® Aerospace & Defense Index | 34.30% | 16.26% | 14.78% |
Performance figures do not reflect deduction of taxes a shareholder would pay on Fund distributions or sale of Fund shares.
What Are Key Statistics About The Fund?
(as of April 30, 2026)
| Fund net assets | $8,014,351,302 |
| Total number of portfolio holdings | 63 |
| Total advisory fees paid | $33,684,796 |
| Portfolio turnover rate | 14% |
What Comprised The Fund's Holdings?
(as of April 30, 2026)
Top ten holdings*
(% of net assets)
(% of net assets)
| Boeing Co. (The) | 9.11% |
| General Electric Co. | 7.85% |
| RTX Corp. | 7.13% |
| Lockheed Martin Corp. | 6.39% |
| General Dynamics Corp. | 4.52% |
| Northrop Grumman Corp. | 4.46% |
| Honeywell International, Inc. | 4.39% |
| Howmet Aerospace, Inc. | 4.18% |
| L3Harris Technologies, Inc. | 3.76% |
| Parker-Hannifin Corp. | 3.74% |
| * Excluding money market fund holdings, if any. |
Industry allocation
(% of net assets)
(% of net assets)
Top ten holdings*
(% of net assets)
(% of net assets)
| Boeing Co. (The) | 9.11% |
| General Electric Co. | 7.85% |
| RTX Corp. | 7.13% |
| Lockheed Martin Corp. | 6.39% |
| General Dynamics Corp. | 4.52% |
| Northrop Grumman Corp. | 4.46% |
| Honeywell International, Inc. | 4.39% |
| Howmet Aerospace, Inc. | 4.18% |
| L3Harris Technologies, Inc. | 3.76% |
| Parker-Hannifin Corp. | 3.74% |
| * Excluding money market fund holdings, if any. |
What Were The Fund Costs For The Last Year ?
(Based on a hypothetical $10,000 investment)
| Fund | Costs of a $10,000 investment | Costs paid as a percentage of a $10,000 investment |
| Invesco Building & Construction ETF | $73 | 0.57% |
How Did The Fund Perform During The Period?
• During the fiscal year ended April 30, 2026, U.S. equities experienced positive returns for the majority of the year, although geopolitical conflict towards the end of the year sparked bouts of increased volatility. During the period, the materials sector lagged the broader market. The Fund's multi-factor methodology led to an overweight in construction material stocks, which created a performance headwind compared to the S&P Composite 1500® Construction & Engineering Index.
• The Fund is passively managed and seeks to track the investment results (before fees and expenses) of the Dynamic Building & Construction Intellidex® Index (the “Index”). The Fund generally will invest at least 90% of its total assets in securities that comprise the Index.
• For the fiscal year ended April 30, 2026, the Fund's performance, on a net asset value ("NAV") basis, 54.66%, differed from the return of the Index, 55.61%, primarily due to fees and expenses incurred by the Fund during the period, which was compounded during a period of strong performance.
What contributed to performance?
Sub-Industry Allocations | Construction & engineering sub-industry, followed by the building products and construction materials sub-industries, respectively.
Positions | Comfort Systems USA, Inc., a construction & engineering company, and Tutor Perini Corp., a construction & engineering company.
What detracted from performance?
Sub-Industry Allocations | Home improvement retail sub-industry, followed by the other specialty retail sub-industry.
Positions | Champion Homes, Inc., a homebuilding company, and Tractor Supply Co., a specialty retail company (no longer held at fiscal year-end).
How Has The Fund Historically Performed?
Growth of $10,000 Investment
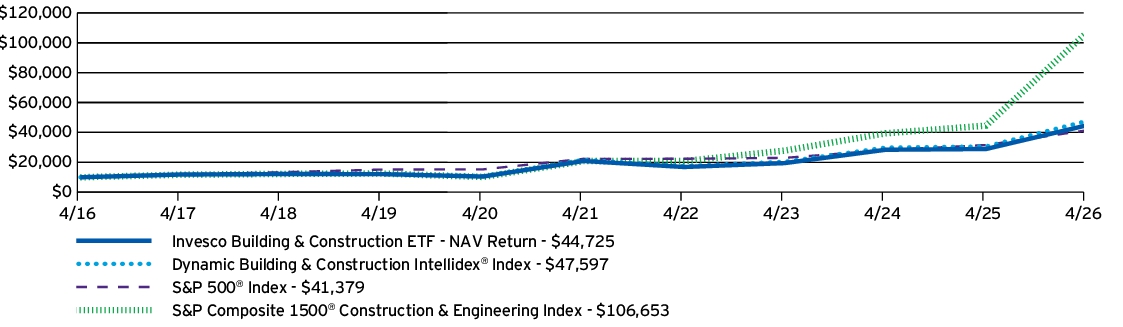
AVERAGE ANNUAL TOTAL RETURNS |
1 Year |
5 Years |
10 Years |
| Invesco Building & Construction ETF — NAV Return | 54.66% | 16.45% | 16.16% |
| Dynamic Building & Construction Intellidex® Index | 55.61% | 17.14% | 16.88% |
| S&P 500® Index | 31.05% | 13.14% | 15.26% |
| S&P Composite 1500® Construction & Engineering Index | 139.30% | 38.67% | 26.71% |
Performance figures do not reflect deduction of taxes a shareholder would pay on Fund distributions or sale of Fund shares.
What Are Key Statistics About The Fund?
(as of April 30, 2026)
| Fund net assets | $456,743,973 |
| Total number of portfolio holdings | 33 |
| Total advisory fees paid | $1,540,222 |
| Portfolio turnover rate | 97% |
What Comprised The Fund's Holdings?
(as of April 30, 2026)
Top ten holdings*
(% of net assets)
(% of net assets)
| Comfort Systems USA, Inc. | 6.39% |
| Johnson Controls International PLC | 5.15% |
| CRH PLC | 4.92% |
| Vulcan Materials Co. | 4.84% |
| Martin Marietta Materials, Inc. | 4.53% |
| Lowe's Cos., Inc. | 4.37% |
| Home Depot, Inc. (The) | 4.36% |
| Amrize Ltd. | 4.20% |
| Argan, Inc. | 4.16% |
| MYR Group, Inc. | 4.04% |
| * Excluding money market fund holdings, if any. |
Sub-industry allocation
(% of net assets)
(% of net assets)
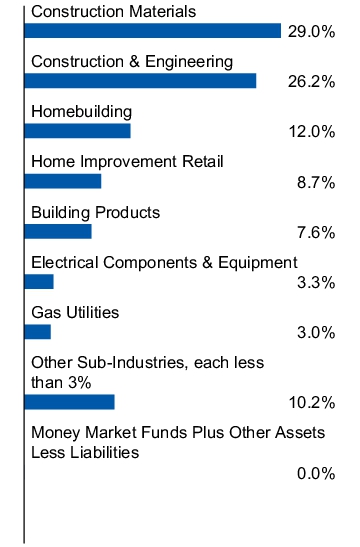
Top ten holdings*
(% of net assets)
(% of net assets)
| Comfort Systems USA, Inc. | 6.39% |
| Johnson Controls International PLC | 5.15% |
| CRH PLC | 4.92% |
| Vulcan Materials Co. | 4.84% |
| Martin Marietta Materials, Inc. | 4.53% |
| Lowe's Cos., Inc. | 4.37% |
| Home Depot, Inc. (The) | 4.36% |
| Amrize Ltd. | 4.20% |
| Argan, Inc. | 4.16% |
| MYR Group, Inc. | 4.04% |
| * Excluding money market fund holdings, if any. |
What Were The Fund Costs For The Last Year ?
(Based on a hypothetical $10,000 investment)
| Fund | Costs of a $10,000 investment | Costs paid as a percentage of a $10,000 investment |
| Invesco Energy Exploration & Production ETF | $82 | 0.63%† |
|
†
|
Reflects fee waivers and/or expense reimbursements, without which expenses would have been higher.
|
How Did The Fund Perform During The Period?
• During the fiscal year ended April 30, 2026, U.S. equities experienced positive returns for the majority of the year, although geopolitical conflict towards the end of the year sparked bouts of increased volatility. During the period, the energy sector benefited from elevated commodity prices. In addition to the Fund's focus on energy stocks, its multi-factor methodology led to an overweight in oil & gas refining & marketing stocks, which created a performance tailwind compared to the S&P Composite 1500® Oil & Gas Exploration & Production Index.
• The Fund is passively managed and seeks to track the investment results (before fees and expenses) of the Dynamic Energy Exploration & Production Intellidex® Index (the “Index”). The Fund generally will invest at least 90% of its total assets in securities that comprise the Index.
• For the fiscal year ended April 30, 2026, the Fund's performance, on a net asset value ("NAV") basis, 61.30%, differed from the return of the Index, 62.22%, primarily due to fees and expenses incurred by the Fund during the period, which was compounded during a period of strong performance and partially offset by income received from the securities lending program in which the Fund participates.
What contributed to performance?
Sub-Industry Allocations | Oil & gas exploration & production sub-industry, followed by the oil & gas refining & marketing and integrated oil & gas sub-industries, respectively.
Positions | Valero Energy Corp., an oil & gas refining & marketing company, and Marathon Petroleum Corp., an oil & gas refining & marketing company.
What detracted from performance?
Sub-Industry Allocations | No sub-industry detracted from the Fund's performance during the period.
Positions | HighPeak Energy Inc., an oil & gas exploration & production company (no longer held at fiscal year-end), and CVR Energy, Inc., an oil & gas refining & marketing company (no longer held at fiscal year-end).
How Has The Fund Historically Performed?
Growth of $10,000 Investment
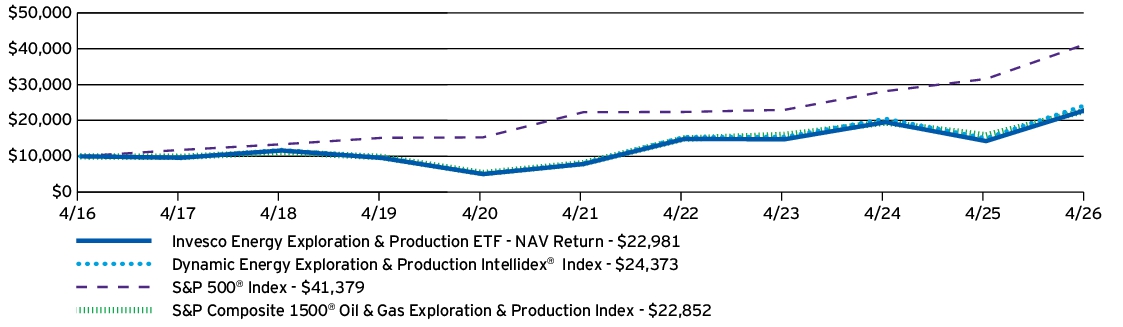
AVERAGE ANNUAL TOTAL RETURNS |
1 Year |
5 Years |
10 Years |
| Invesco Energy Exploration & Production ETF — NAV Return | 61.30% | 23.94% | 8.68% |
| Dynamic Energy Exploration & Production Intellidex® Index | 62.22% | 24.73% | 9.32% |
| S&P 500® Index | 31.05% | 13.14% | 15.26% |
| S&P Composite 1500® Oil & Gas Exploration & Production Index | 44.44% | 23.01% | 8.62% |
Performance figures do not reflect deduction of taxes a shareholder would pay on Fund distributions or sale of Fund shares.
What Are Key Statistics About The Fund?
(as of April 30, 2026)
| Fund net assets | $133,730,006 |
| Total number of portfolio holdings | 33 |
| Total advisory fees paid | $353,501 |
| Portfolio turnover rate | 62% |
What Comprised The Fund's Holdings?
(as of April 30, 2026)
Top ten holdings*
(% of net assets)
(% of net assets)
| Marathon Petroleum Corp. | 5.36% |
| Valero Energy Corp. | 5.35% |
| Diamondback Energy, Inc. | 5.02% |
| Occidental Petroleum Corp. | 4.92% |
| Phillips 66 | 4.89% |
| ConocoPhillips | 4.80% |
| EQT Corp. | 4.34% |
| Expand Energy Corp. | 4.17% |
| Par Pacific Holdings, Inc. | 3.68% |
| APA Corp. | 3.27% |
| * Excluding money market fund holdings, if any. |
Sub-industry allocation
(% of net assets)
(% of net assets)
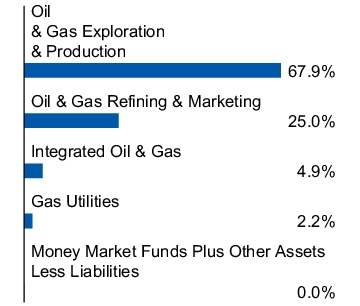
Top ten holdings*
(% of net assets)
(% of net assets)
| Marathon Petroleum Corp. | 5.36% |
| Valero Energy Corp. | 5.35% |
| Diamondback Energy, Inc. | 5.02% |
| Occidental Petroleum Corp. | 4.92% |
| Phillips 66 | 4.89% |
| ConocoPhillips | 4.80% |
| EQT Corp. | 4.34% |
| Expand Energy Corp. | 4.17% |
| Par Pacific Holdings, Inc. | 3.68% |
| APA Corp. | 3.27% |
| * Excluding money market fund holdings, if any. |
What Were The Fund Costs For The Last Year ?
(Based on a hypothetical $10,000 investment)
| Fund | Costs of a $10,000 investment | Costs paid as a percentage of a $10,000 investment |
| Invesco Oil & Gas Services ETF | $99 | 0.63%† |
|
†
|
Reflects fee waivers and/or expense reimbursements, without which expenses would have been higher.
|
How Did The Fund Perform During The Period?
• During the fiscal year ended April 30, 2026, U.S. equities experienced positive returns for the majority of the year, although geopolitical conflict towards the end of the year sparked bouts of increased volatility. During the period, the energy sector outperformed the broader stock market. In addition to the Fund's focus on energy stocks, its multi-factor methodology led to an overweight in oil gas & consumable fuels, which created a performance tailwind compared to the S&P Composite 1500® Energy Equipment & Services Index.
• The Fund is passively managed and seeks to track the investment results (before fees and expenses) of the Dynamic Oil Services Intellidex® Index (the “Index”). The Fund generally will invest at least 90% of its total assets in securities that comprise the Index.
• For the fiscal year ended April 30, 2026, the Fund's performance, on a net asset value ("NAV") basis, 115.38%, differed from the return of the Index, 116.62%, primarily due to fees and expenses incurred by the Fund during the period, which was compounded during a period of strong performance and partially offset by income received from the securities lending program in which the Fund participates.
What contributed to performance?
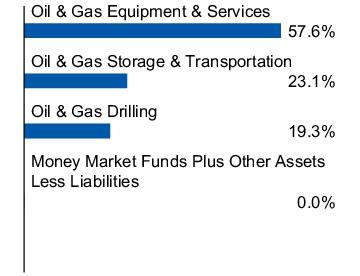
Sub-Industry Allocations | Oil & gas equipment & services sub-industry, followed by the oil & gas storage & transportation and oil & gas drilling sub-industries, respectively.
Positions | Weatherford International PLC, an oil & gas equipment & services company, and TechnipFMC PLC, an oil & gas equipment & services company.
What detracted from performance?
Sub-Industry Allocations | No sub-industry detracted from the Fund's performance during the period.
Positions | Excelerate Energy, Inc., an oil & gas storage & transportation company, and Golar LNG Ltd., an oil & gas storage & transportation company (no longer held at fiscal year-end).
How Has The Fund Historically Performed?
Growth of $10,000 Investment
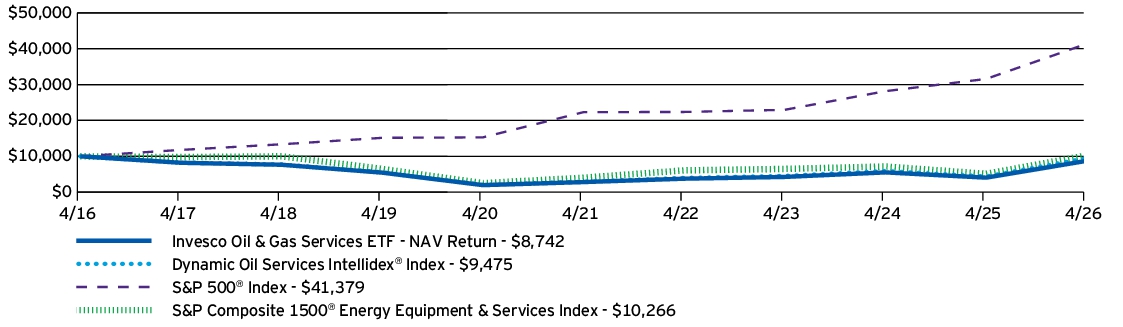
AVERAGE ANNUAL TOTAL RETURNS |
1 Year |
5 Years |
10 Years |
| Invesco Oil & Gas Services ETF — NAV Return | 115.38% | 25.34% | -1.34% |
| Dynamic Oil Services Intellidex® Index | 116.62% | 26.48% | -0.54% |
| S&P 500® Index | 31.05% | 13.14% | 15.26% |
| S&P Composite 1500® Energy Equipment & Services Index | 100.12% | 20.50% | 0.26% |
Performance figures do not reflect deduction of taxes a shareholder would pay on Fund distributions or sale of Fund shares.
What Are Key Statistics About The Fund?
(as of April 30, 2026)
| Fund net assets | $138,032,524 |
| Total number of portfolio holdings | 33 |
| Total advisory fees paid | $152,938 |
| Portfolio turnover rate | 64% |
What Comprised The Fund's Holdings?
(as of April 30, 2026)
Top ten holdings*
(% of net assets)
(% of net assets)
| Halliburton Co. | 5.42% |
| TechnipFMC PLC | 5.30% |
| Noble Corp. PLC | 5.07% |
| Baker Hughes Co., Class A | 4.94% |
| Transocean Ltd. | 4.78% |
| Weatherford International PLC | 4.73% |
| Frontline PLC | 4.58% |
| NOV, Inc. | 4.55% |
| ProPetro Holding Corp. | 3.69% |
| Patterson-UTI Energy, Inc. | 3.67% |
| * Excluding money market fund holdings, if any. |
Sub-industry allocation
(% of net assets)
(% of net assets)
Top ten holdings*
(% of net assets)
(% of net assets)
| Halliburton Co. | 5.42% |
| TechnipFMC PLC | 5.30% |
| Noble Corp. PLC | 5.07% |
| Baker Hughes Co., Class A | 4.94% |
| Transocean Ltd. | 4.78% |
| Weatherford International PLC | 4.73% |
| Frontline PLC | 4.58% |
| NOV, Inc. | 4.55% |
| ProPetro Holding Corp. | 3.69% |
| Patterson-UTI Energy, Inc. | 3.67% |
| * Excluding money market fund holdings, if any. |
What Were The Fund Costs For The Last Year ?
(Based on a hypothetical $10,000 investment)
| Fund | Costs of a $10,000 investment | Costs paid as a percentage of a $10,000 investment |
| Invesco High Yield Equity Dividend AchieversTM ETF | $57 | 0.52% |
How Did The Fund Perform During The Period?
• During the fiscal year ended April 30, 2026, U.S. equities experienced positive returns for the majority of the year, although geopolitical conflict towards the end of the year sparked bouts of increased volatility. During the period, the Fund underperformed the Dow Jones U.S. Select Dividend Index primarily due to its security selection in the technology hardware storage & peripherals and diversified telecommunication services industries.
• The Fund is passively managed and seeks to track the investment results (before fees and expenses) of the Nasdaq US Dividend Achievers 50TM Index (the “Index”). The Fund generally will invest at least 90% of its total assets in securities that comprise the Index.
• For the fiscal year ended April 30, 2026, the Fund's performance, on a net asset value ("NAV") basis, 19.02%, differed from the return of the Index, 19.63%, primarily due to fees and expenses incurred by the Fund during the period.
What contributed to performance?
Industry Allocations | Banks industry, followed by the capital markets and leisure products industries, respectively.
Positions | Polaris, Inc., a leisure products company, and LyondellBasell Industries N.V., Class A, a chemicals company.
What detracted from performance?
Industry Allocations | Diversified telecommunication services industry, followed by the food products and pharmaceuticals industries, respectively.
Positions | Cogent Communications Holdings, Inc., a diversified telecommunication services company (no longer held at fiscal year-end), and Flowers Foods, Inc., a food products company.
How Has The Fund Historically Performed?
Growth of $10,000 Investment
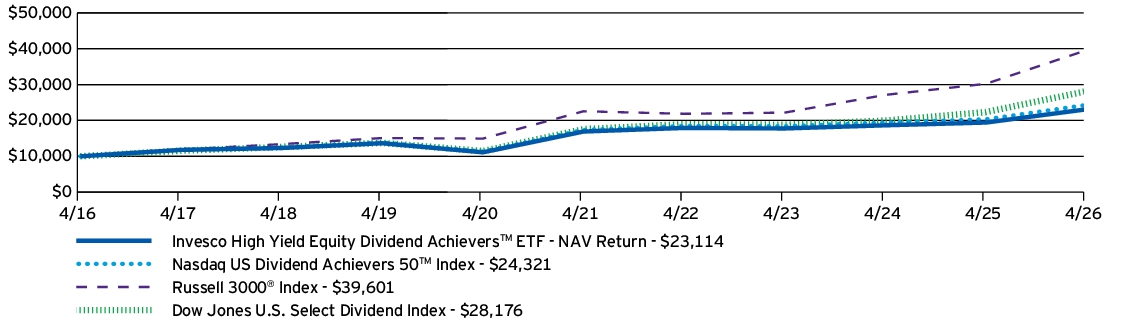
AVERAGE ANNUAL TOTAL RETURNS |
1 Year |
5 Years |
10 Years |
| Invesco High Yield Equity Dividend AchieversTM ETF — NAV Return | 19.02% | 6.44% | 8.74% |
| Nasdaq US Dividend Achievers 50™ Index | 19.63% | 6.98% | 9.29% |
| Russell 3000® Index | 31.01% | 11.91% | 14.75% |
| Dow Jones U.S. Select Dividend Index | 26.12% | 9.91% | 10.91% |
Performance figures do not reflect deduction of taxes a shareholder would pay on Fund distributions or sale of Fund shares.
What Are Key Statistics About The Fund?
(as of April 30, 2026)
| Fund net assets | $1,066,079,432 |
| Total number of portfolio holdings | 53 |
| Total advisory fees paid | $4,308,892 |
| Portfolio turnover rate | 56% |
What Comprised The Fund's Holdings?
(as of April 30, 2026)
Top ten holdings*
(% of net assets)
(% of net assets)
| Insperity, Inc. | 6.20% |
| LyondellBasell Industries N.V., Class A | 4.74% |
| Robert Half, Inc. | 4.07% |
| Flowers Foods, Inc. | 3.52% |
| Perrigo Co. PLC | 3.03% |
| HP, Inc. | 2.61% |
| Altria Group, Inc. | 2.45% |
| Universal Corp. | 2.34% |
| John Wiley & Sons, Inc., Class A | 2.33% |
| Pfizer, Inc. | 2.32% |
| * Excluding money market fund holdings, if any. |
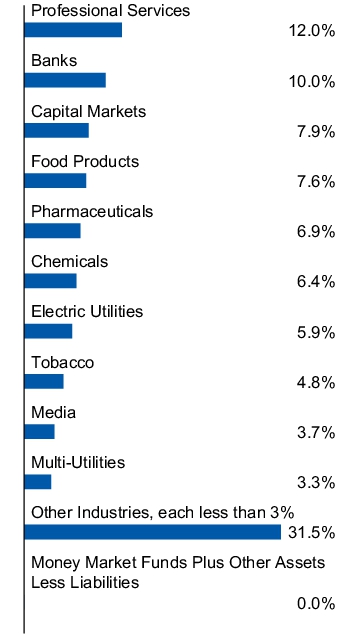
Industry allocation
(% of net assets)
(% of net assets)
Top ten holdings*
(% of net assets)
(% of net assets)
| Insperity, Inc. | 6.20% |
| LyondellBasell Industries N.V., Class A | 4.74% |
| Robert Half, Inc. | 4.07% |
| Flowers Foods, Inc. | 3.52% |
| Perrigo Co. PLC | 3.03% |
| HP, Inc. | 2.61% |
| Altria Group, Inc. | 2.45% |
| Universal Corp. | 2.34% |
| John Wiley & Sons, Inc., Class A | 2.33% |
| Pfizer, Inc. | 2.32% |
| * Excluding money market fund holdings, if any. |
What Were The Fund Costs For The Last Year ?
(Based on a hypothetical $10,000 investment)
| Fund | Costs of a $10,000 investment | Costs paid as a percentage of a $10,000 investment |
| Invesco Dorsey Wright Utilities Momentum ETF | $67 | 0.60%† |
|
†
|
Reflects fee waivers and/or expense reimbursements, without which expenses would have been higher.
|
How Did The Fund Perform During The Period?
• During the fiscal year ended April 30, 2026, U.S. equities experienced positive returns for the majority of the year, although geopolitical conflict towards the end of the year sparked bouts of increased volatility. During the period, utilities underperformed the broader stock market. Despite the Fund's focus on utilities stocks, its momentum methodology improved performance compared to the S&P 500® Utilities Index.
• The Fund is passively managed and seeks to track the investment results (before fees and expenses) of the Dorsey Wright Utilities Technical LeadersTM Index (the “Index”). The Fund generally will invest at least 90% of its total assets in securities that comprise the Index.
• For the fiscal year ended April 30, 2026, the Fund's performance, on a net asset value ("NAV") basis, 21.81%, differed from the return of the Index, 22.40%, primarily due to fees and expenses incurred by the Fund during the period.
What contributed to performance?
Sub-Industry Allocations | Electric utilities sub-industry, followed by the heavy electrical equipment and multi-utilities sub-industries, respectively.
Positions | GE Vernova Inc., a heavy electrical equipment company, and Oklo Inc., Class A, an electric utilities company (no longer held at fiscal year-end).
What detracted from performance?
Sub-Industry Allocations | Passenger airlines sub-industry, followed by the integrated telecommunication services and water utilities sub-industries, respectively.
Positions | Surf Air Mobility, Inc., a passenger airlines company (no longer held at fiscal year-end), and Vistra Corp., an independent power producers & energy traders company.
How Has The Fund Historically Performed?
Growth of $10,000 Investment
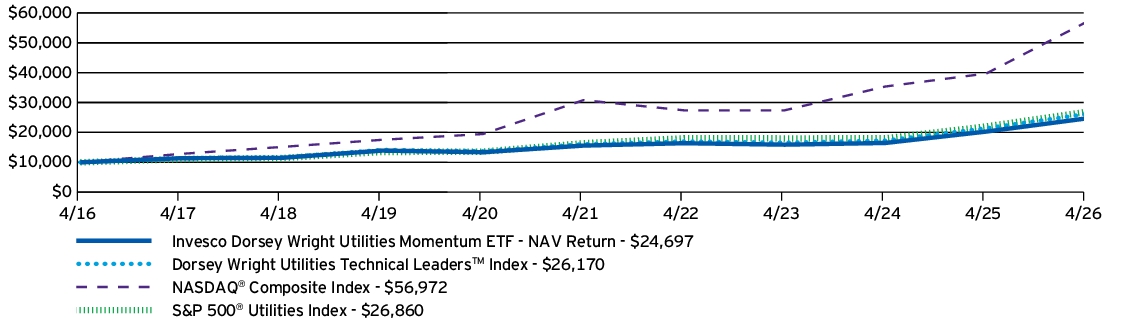
AVERAGE ANNUAL TOTAL RETURNS |
1 Year |
5 Years |
10 Years |
| Invesco Dorsey Wright Utilities Momentum ETF — NAV Return | 21.81% | 9.63% | 9.46% |
| Dorsey Wright Utilities Technical Leaders™ Index | 22.40% | 10.26% | 10.10% |
| NASDAQ® Composite Index | 43.57% | 13.09% | 19.01% |
| S&P 500® Utilities Index | 22.10% | 10.40% | 10.39% |
Performance figures do not reflect deduction of taxes a shareholder would pay on Fund distributions or sale of Fund shares.
What Are Key Statistics About The Fund?
(as of April 30, 2026)
| Fund net assets | $78,277,871 |
| Total number of portfolio holdings | 39 |
| Total advisory fees paid | $167,213 |
| Portfolio turnover rate | 58% |
What Comprised The Fund's Holdings?
(as of April 30, 2026)
Top ten holdings*
(% of net assets)
(% of net assets)
| GE Vernova, Inc. | 5.33% |
| Constellation Energy Corp. | 4.40% |
| ONEOK, Inc. | 4.38% |
| Atmos Energy Corp. | 4.17% |
| NiSource, Inc. | 4.08% |
| Duke Energy Corp. | 3.83% |
| WEC Energy Group, Inc. | 3.80% |
| Sempra | 3.62% |
| DTE Energy Co. | 3.39% |
| Entergy Corp. | 3.29% |
| * Excluding money market fund holdings, if any. |
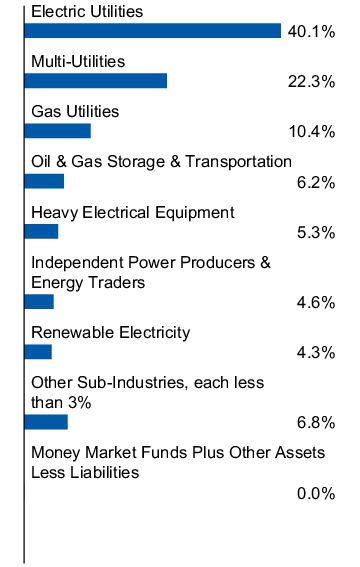
Sub-industry allocation
(% of net assets)
(% of net assets)
Top ten holdings*
(% of net assets)
(% of net assets)
| GE Vernova, Inc. | 5.33% |
| Constellation Energy Corp. | 4.40% |
| ONEOK, Inc. | 4.38% |
| Atmos Energy Corp. | 4.17% |
| NiSource, Inc. | 4.08% |
| Duke Energy Corp. | 3.83% |
| WEC Energy Group, Inc. | 3.80% |
| Sempra | 3.62% |
| DTE Energy Co. | 3.39% |
| Entergy Corp. | 3.29% |
| * Excluding money market fund holdings, if any. |
What Were The Fund Costs For The Last Year ?
(Based on a hypothetical $10,000 investment)
| Fund | Costs of a $10,000 investment | Costs paid as a percentage of a $10,000 investment |
| Invesco Water Resources ETF | $61 | 0.59% |
How Did The Fund Perform During The Period?
• During the fiscal year ended April 30, 2026, water equities lagged broader U.S. equity markets. The Fund's security selection within the information technology and industrials sectors contributed to its underperformance relative to the S&P 500® Index.
• The Fund is passively managed and seeks to track the investment results (before fees and expenses) of the Nasdaq OMX US WaterTM Index (the “Index”). The Fund generally will invest at least 90% of its total assets in securities that comprise the Index.
• For the fiscal year ended April 30, 2026, the Fund's performance, on a net asset value ("NAV") basis, 5.64%, differed from the return of the Index, 6.30%, primarily due to fees and expenses incurred by the Fund during the period.
What contributed to performance?
Industry Allocations | Machinery industry, followed by the trading companies & distributors and building products industries, respectively.
Positions | Ferguson Enterprises, Inc., a trading companies & distributors company, and Mueller Industries, Inc., a machinery company.
What detracted from performance?
Industry Allocations | Software industry, followed by the electronic equipment instruments & components and water utilities industries, respectively.
Positions | Roper Technologies, Inc., a software company, and Badger Meter, Inc., an electronic equipment instruments & components company.
How Has The Fund Historically Performed?
Growth of $10,000 Investment
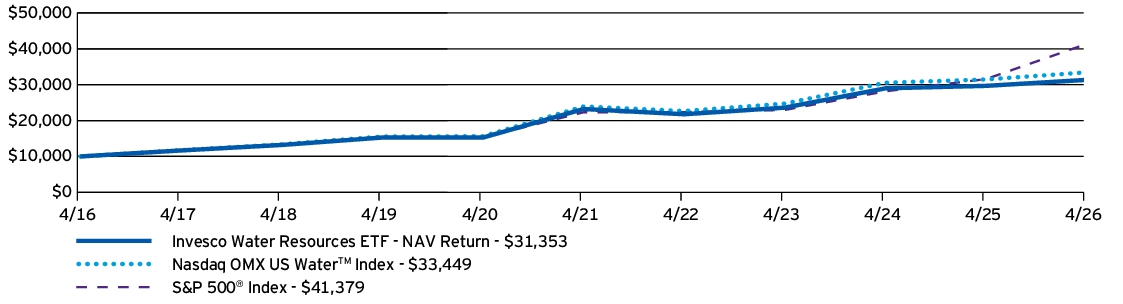
AVERAGE ANNUAL TOTAL RETURNS |
1 Year |
5 Years |
10 Years |
| Invesco Water Resources ETF — NAV Return | 5.64% | 6.19% | 12.11% |
| Nasdaq OMX US Water™ Index | 6.30% | 6.92% | 12.83% |
| S&P 500® Index | 31.05% | 13.14% | 15.26% |
Performance figures do not reflect deduction of taxes a shareholder would pay on Fund distributions or sale of Fund shares.
What Are Key Statistics About The Fund?
(as of April 30, 2026)
| Fund net assets | $2,085,783,142 |
| Total number of portfolio holdings | 39 |
| Total advisory fees paid | $10,760,833 |
| Portfolio turnover rate | 34% |
What Comprised The Fund's Holdings?
(as of April 30, 2026)
Top ten holdings*
(% of net assets)
(% of net assets)
| Ferguson Enterprises, Inc. | 8.68% |
| Roper Technologies, Inc. | 8.57% |
| Waters Corp. | 8.18% |
| Ecolab, Inc. | 7.14% |
| American Water Works Co., Inc. | 6.95% |
| IDEX Corp. | 4.39% |
| Mueller Industries, Inc. | 4.37% |
| Core & Main, Inc., Class A | 3.93% |
| Xylem, Inc. | 3.85% |
| Veralto Corp. | 3.83% |
| * Excluding money market fund holdings, if any. |
Industry allocation
(% of net assets)
(% of net assets)
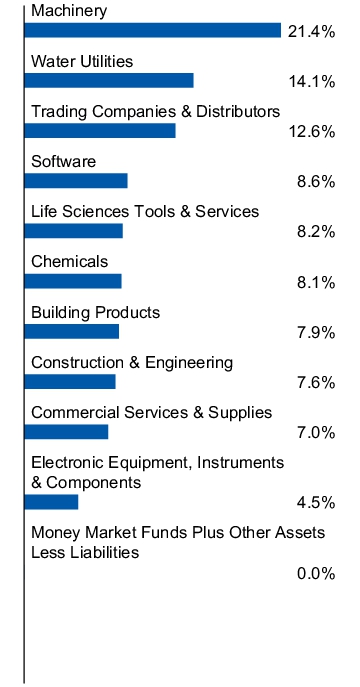
Top ten holdings*
(% of net assets)
(% of net assets)
| Ferguson Enterprises, Inc. | 8.68% |
| Roper Technologies, Inc. | 8.57% |
| Waters Corp. | 8.18% |
| Ecolab, Inc. | 7.14% |
| American Water Works Co., Inc. | 6.95% |
| IDEX Corp. | 4.39% |
| Mueller Industries, Inc. | 4.37% |
| Core & Main, Inc., Class A | 3.93% |
| Xylem, Inc. | 3.85% |
| Veralto Corp. | 3.83% |
| * Excluding money market fund holdings, if any. |
What Were The Fund Costs For The Last Year ?
(Based on a hypothetical $10,000 investment)
| Fund | Costs of a $10,000 investment | Costs paid as a percentage of a $10,000 investment |
| Invesco S&P 500® Quality ETF | $17 | 0.15%† |
|
†
|
Reflects fee waivers and/or expense reimbursements, without which expenses would have been higher.
|
How Did The Fund Perform During The Period?
• During the fiscal year ended April 30, 2026, U.S. equities experienced positive returns for the majority of the year, although geopolitical conflict towards the end of the year sparked bouts of increased volatility. During the period, securities with a greater exposure to the quality factor, a composite measure of return-on-equity, leverage, and balance sheet accruals, underperformed the S&P 500® Index. The Fund's methodology focuses on securities with these features, creating a headwind to Fund performance relative to the S&P 500® Index.
• The Fund is passively managed and seeks to track the investment results (before fees and expenses) of the S&P 500® Quality Index (the “Index”). The Fund generally will invest at least 90% of its total assets in securities that comprise the Index.
• For the fiscal year ended April 30, 2026, the Fund's performance, on a net asset value ("NAV") basis, 23.96%, differed from the return of the Index, 24.16%, primarily due to fees and expenses incurred by the Fund during the period.
What contributed to performance?
Sector Allocations | Information technology sector, followed by the industrials and communication services sectors, respectively.
Positions | Lam Research Corp., an information technology company, and Caterpillar, Inc., an industrials company.
What detracted from performance?
Sector Allocations | Financials sector.
Positions | AppLovin Corp., Class A, an information technology company, and Adobe, Inc., an information technology company.
How Has The Fund Historically Performed?
Growth of $10,000 Investment
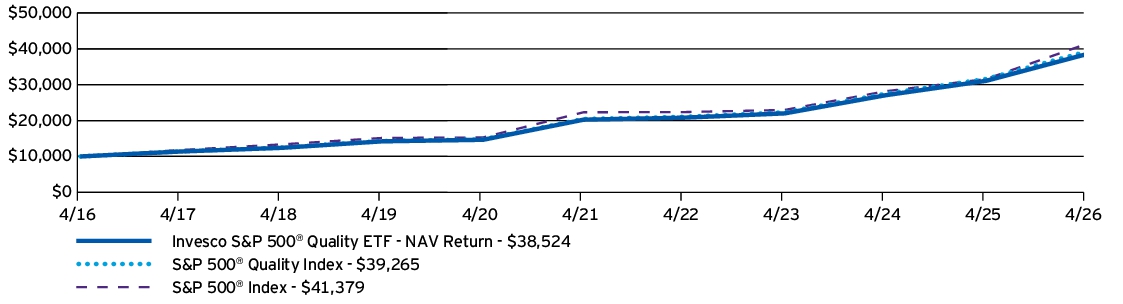
AVERAGE ANNUAL TOTAL RETURNS |
1 Year |
5 Years |
10 Years |
| Invesco S&P 500® Quality ETF — NAV Return | 23.96% | 13.73% | 14.44% |
| S&P 500® Quality Index | 24.16% | 13.92% | 14.66% |
| S&P 500® Index | 31.05% | 13.14% | 15.26% |
Performance figures do not reflect deduction of taxes a shareholder would pay on Fund distributions or sale of Fund shares.
What Are Key Statistics About The Fund?
(as of April 30, 2026)
| Fund net assets | $17,273,061,625 |
| Total number of portfolio holdings | 102 |
| Total advisory fees paid | $14,492,922 |
| Portfolio turnover rate | 38% |
What Comprised The Fund's Holdings?
(as of April 30, 2026)
Top ten holdings*
(% of net assets)
(% of net assets)
| Costco Wholesale Corp. | 4.81% |
| Visa, Inc., Class A | 4.69% |
| Apple, Inc. | 4.51% |
| Mastercard, Inc., Class A | 4.32% |
| General Electric Co. | 4.16% |
| Lam Research Corp. | 4.09% |
| Caterpillar, Inc. | 3.78% |
| Cisco Systems, Inc. | 3.54% |
| Procter & Gamble Co. (The) | 3.46% |
| Coca-Cola Co. (The) | 3.34% |
| * Excluding money market fund holdings, if any. |
Sector allocation
(% of net assets)
(% of net assets)
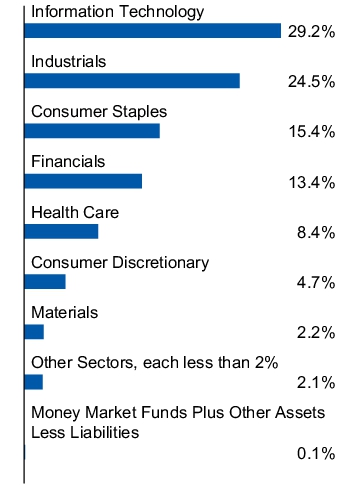
Top ten holdings*
(% of net assets)
(% of net assets)
| Costco Wholesale Corp. | 4.81% |
| Visa, Inc., Class A | 4.69% |
| Apple, Inc. | 4.51% |
| Mastercard, Inc., Class A | 4.32% |
| General Electric Co. | 4.16% |
| Lam Research Corp. | 4.09% |
| Caterpillar, Inc. | 3.78% |
| Cisco Systems, Inc. | 3.54% |
| Procter & Gamble Co. (The) | 3.46% |
| Coca-Cola Co. (The) | 3.34% |
| * Excluding money market fund holdings, if any. |
What Were The Fund Costs For The Last Year ?
(Based on a hypothetical $10,000 investment)
| Fund | Costs of a $10,000 investment | Costs paid as a percentage of a $10,000 investment |
| Invesco Golden Dragon China ETF | $71 | 0.70% |
How Did The Fund Perform During The Period?
• During the fiscal year ended April 30, 2026, China's economy remained uneven, with modest growth supported by targeted policy easing and exports, but constrained by ongoing property-sector weakness, soft domestic demand, and cautious consumer and business confidence. Overweight allocations to financials and consumer discretionary sectors were leading detractors from Fund performance compared to the FTSE China 50 Index.
• The Fund is passively managed and seeks to track the investment results (before fees and expenses) of the Nasdaq Golden Dragon China IndexTM (the “Index”). The Fund generally will invest at least 90% of its total assets in securities that comprise the Index.
• For the fiscal year ended April 30, 2026, the Fund's performance, on a net asset value ("NAV") basis, 2.19%, differed from the return of the Index, 1.87%, primarily due to income received from the securities lending program in which the Fund participates, partially offset by fees and expenses incurred by the Fund during the period.
What contributed to performance?
Sector Allocations | Consumer discretionary sector, followed by the communication services and information technology sectors, respectively.
Positions | Baidu, Inc., ADR, a communication services company, and NIO, Inc., ADR, a consumer discretionary company.
What detracted from performance?
Sector Allocations | Financials sector, followed by the industrials and health care sectors, respectively.
Positions | Qfin Holdings, Inc., ADR, a financials company, and BGM Group Ltd., a health care company (no longer held at fiscal year-end).
How Has The Fund Historically Performed?
Growth of $10,000 Investment
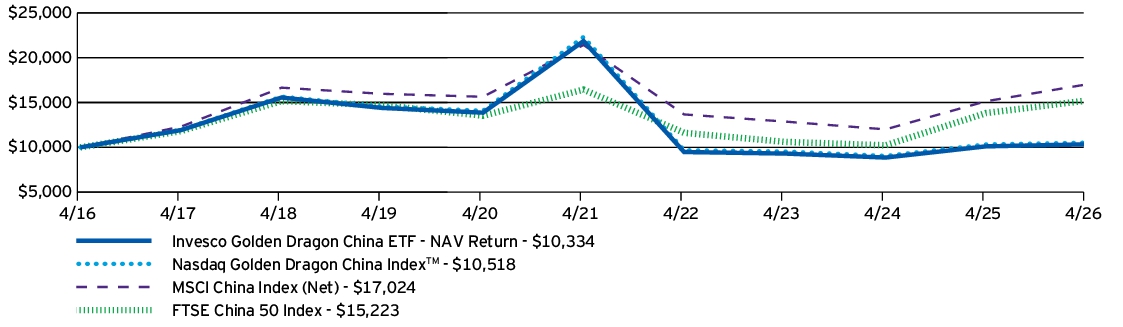
AVERAGE ANNUAL TOTAL RETURNS |
1 Year |
5 Years |
10 Years |
| Invesco Golden Dragon China ETF — NAV Return | 2.19% | -13.91% | 0.33% |
| Nasdaq Golden Dragon China Index™ | 1.87% | -13.96% | 0.51% |
| MSCI China Index (Net) | 12.42% | -4.49% | 5.46% |
| FTSE China 50 Index | 10.11% | -1.52% | 4.29% |
Performance figures do not reflect deduction of taxes a shareholder would pay on Fund distributions or sale of Fund shares.
What Are Key Statistics About The Fund?
(as of April 30, 2026)
| Fund net assets | $114,648,229 |
| Total number of portfolio holdings | 74 |
| Total advisory fees paid | $695,095 |
| Portfolio turnover rate | 23% |
What Comprised The Fund's Holdings?
(as of April 30, 2026)
Top ten holdings*
(% of net assets)
(% of net assets)
| JD.com, Inc., ADR | 8.88% |
| Baidu, Inc., ADR | 8.51% |
| Alibaba Group Holding Ltd., ADR | 7.66% |
| Yum China Holdings, Inc. | 7.39% |
| NetEase, Inc., ADR | 5.79% |
| NIO, Inc., ADR | 5.23% |
| H World Group Ltd., ADR | 3.94% |
| New Oriental Education & Technology Group, Inc., ADR | 3.53% |
| Full Truck Alliance Co. Ltd., ADR | 3.52% |
| Vipshop Holdings Ltd., ADR | 3.46% |
| * Excluding money market fund holdings, if any. |
Sector allocation
(% of net assets)
(% of net assets)
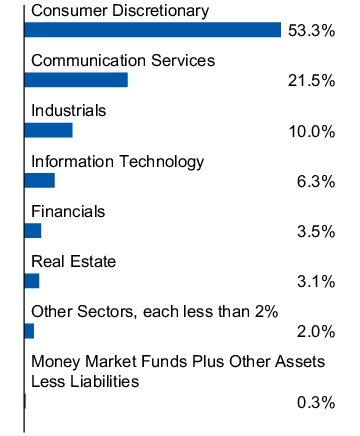
Top ten holdings*
(% of net assets)
(% of net assets)
| JD.com, Inc., ADR | 8.88% |
| Baidu, Inc., ADR | 8.51% |
| Alibaba Group Holding Ltd., ADR | 7.66% |
| Yum China Holdings, Inc. | 7.39% |
| NetEase, Inc., ADR | 5.79% |
| NIO, Inc., ADR | 5.23% |
| H World Group Ltd., ADR | 3.94% |
| New Oriental Education & Technology Group, Inc., ADR | 3.53% |
| Full Truck Alliance Co. Ltd., ADR | 3.52% |
| Vipshop Holdings Ltd., ADR | 3.46% |
| * Excluding money market fund holdings, if any. |
What Were The Fund Costs For The Last Year ?
(Based on a hypothetical $10,000 investment)
| Fund | Costs of a $10,000 investment | Costs paid as a percentage of a $10,000 investment |
| Invesco WilderHill Clean Energy ETF | $109 | 0.63% |
How Did The Fund Perform During The Period?
• During the fiscal year ended April 30, 2026, clean energy stocks significantly outperformed the Russell 2000® Growth Index due primarily to geopolitical volatility. The Fund's overweight allocation to and security selection in the industrials sector also contributed to its outperformance relative to the Russell 2000® Growth Index during the period.
• The Fund is passively managed and seeks to track the investment results (before fees and expenses) of the WilderHill Clean Energy Index (the “Index”). The Fund generally will invest at least 90% of its total assets in securities that comprise the Index.
• For the fiscal year ended April 30, 2026, the Fund's performance, on a net asset value ("NAV") basis, 147.28%, differed from the return of the Index, 147.51%, primarily due to fees and expenses incurred by the Fund during the period.
What contributed to performance?
Industry Allocations | Electrical equipment industry, followed by the semiconductors & semiconductor equipment and metals & mining industries, respectively.
Positions | Navitas Semiconductor Corp., a semiconductors & semiconductor equipment company, and Bloom Energy Corp., Class A, an electrical equipment company.
What detracted from performance?
Industry Allocations | No industries detracted from the Fund's performance during the period.
Positions | Wolfspeed, Inc., a semiconductors & semiconductor equipment company (no longer held at fiscal year-end), and Enphase Energy, Inc., a semiconductors & semiconductor equipment company.
How Has The Fund Historically Performed?
Growth of $10,000 Investment
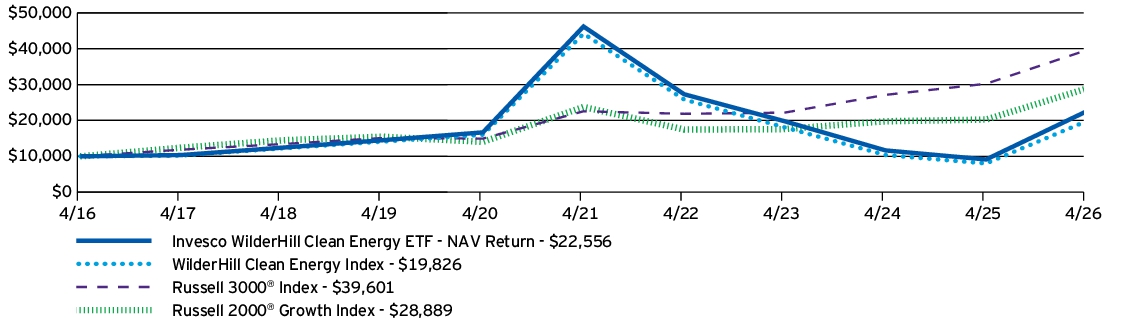
AVERAGE ANNUAL TOTAL RETURNS |
1 Year |
5 Years |
10 Years |
| Invesco WilderHill Clean Energy ETF — NAV Return | 147.28% | -13.35% | 8.47% |
| WilderHill Clean Energy Index | 147.51% | -14.81% | 7.08% |
| Russell 3000® Index | 31.01% | 11.91% | 14.75% |
| Russell 2000® Growth Index | 42.64% | 4.00% | 11.19% |
Performance figures do not reflect deduction of taxes a shareholder would pay on Fund distributions or sale of Fund shares.
What Are Key Statistics About The Fund?
(as of April 30, 2026)
| Fund net assets | $450,374,069 |
| Total number of portfolio holdings | 71 |
| Total advisory fees paid | $2,411,842 |
| Portfolio turnover rate | 65% |
What Comprised The Fund's Holdings?
(as of April 30, 2026)
Top ten holdings*
(% of net assets)
(% of net assets)
| Sigma Lithium Corp. | 2.65% |
| Bloom Energy Corp., Class A | 2.43% |
| FuelCell Energy, Inc. | 2.41% |
| Navitas Semiconductor Corp. | 2.23% |
| American Superconductor Corp. | 2.09% |
| Lifezone Metals Ltd. | 2.05% |
| Lithium Argentina AG | 2.01% |
| Monolithic Power Systems, Inc. | 1.87% |
| Powell Industries, Inc. | 1.85% |
| MYR Group, Inc. | 1.83% |
| * Excluding money market fund holdings, if any. |
Industry allocation
(% of net assets)
(% of net assets)
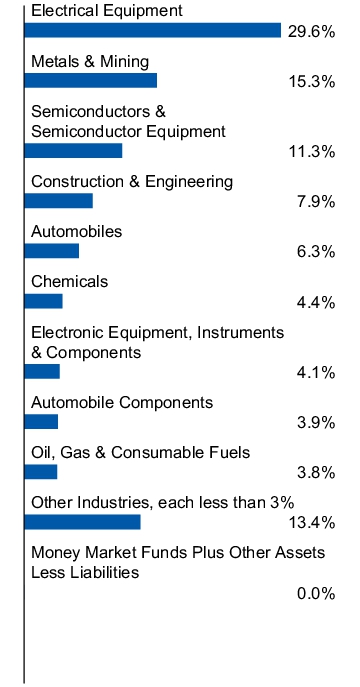
Top ten holdings*
(% of net assets)
(% of net assets)
| Sigma Lithium Corp. | 2.65% |
| Bloom Energy Corp., Class A | 2.43% |
| FuelCell Energy, Inc. | 2.41% |
| Navitas Semiconductor Corp. | 2.23% |
| American Superconductor Corp. | 2.09% |
| Lifezone Metals Ltd. | 2.05% |
| Lithium Argentina AG | 2.01% |
| Monolithic Power Systems, Inc. | 1.87% |
| Powell Industries, Inc. | 1.85% |
| MYR Group, Inc. | 1.83% |
| * Excluding money market fund holdings, if any. |
What Were The Fund Costs For The Last Year ?
(Based on a hypothetical $10,000 investment)
| Fund | Costs of a $10,000 investment | Costs paid as a percentage of a $10,000 investment |
| Invesco Large Cap Growth ETF | $68 | 0.55% |
How Did The Fund Perform During The Period?
• During the fiscal year ended April 30, 2026, U.S. equities experienced positive returns for the majority of the year, although geopolitical conflict towards the end of the year sparked bouts of increased volatility. During the period, security selection within the information technology and industrials sectors were relative performance tailwinds for the Fund versus the Russell 1000® Growth Index.
• The Fund is passively managed and seeks to track the investment results (before fees and expenses) of the Dynamic Large Cap Growth Intellidex® Index (the “Index”). The Fund generally will invest at least 90% of its total assets in securities that comprise the Index.
• For the fiscal year ended April 30, 2026, the Fund's performance, on a net asset value ("NAV") basis, 46.75%, differed from the return of the Index, 47.56%, primarily due to fees and expenses incurred by the Fund during the period, which was compounded during a period of strong performance.
What contributed to performance?
Sector Allocations | Information technology sector, followed by the industrials and communication services sectors, respectively.
Positions | Micron Technology, Inc., an information technology company, and Broadcom, Inc., an information technology company.
What detracted from performance?
Sector Allocations | Health care sector, followed by the energy sector.
Positions | Intuitive Surgical, Inc., a health care company (no longer held at fiscal year-end), and Veeva Systems, Inc., Class A, a health care company (no longer held at fiscal year-end).
How Has The Fund Historically Performed?
Growth of $10,000 Investment
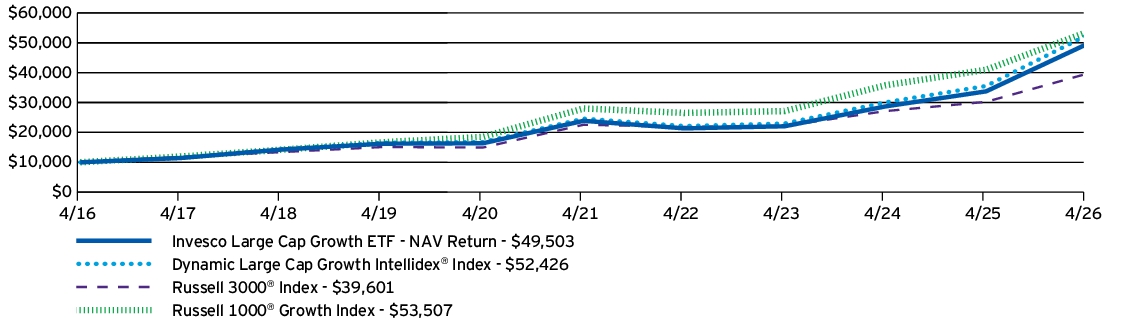
AVERAGE ANNUAL TOTAL RETURNS |
1 Year |
5 Years |
10 Years |
| Invesco Large Cap Growth ETF — NAV Return | 46.75% | 15.70% | 17.34% |
| Dynamic Large Cap Growth Intellidex® Index | 47.56% | 16.34% | 18.02% |
| Russell 3000® Index | 31.01% | 11.91% | 14.75% |
| Russell 1000® Growth Index | 30.63% | 13.82% | 18.26% |
Performance figures do not reflect deduction of taxes a shareholder would pay on Fund distributions or sale of Fund shares.
What Are Key Statistics About The Fund?
(as of April 30, 2026)
| Fund net assets | $1,914,588,007 |
| Total number of portfolio holdings | 52 |
| Total advisory fees paid | $6,913,609 |
| Portfolio turnover rate | 97% |
What Comprised The Fund's Holdings?
(as of April 30, 2026)
Top ten holdings*
(% of net assets)
(% of net assets)
| Advanced Micro Devices, Inc. | 5.10% |
| Broadcom, Inc. | 3.94% |
| Amazon.com, Inc. | 3.91% |
| Alphabet, Inc., Class A | 3.80% |
| Micron Technology, Inc. | 3.80% |
| Palantir Technologies, Inc., Class A | 3.32% |
| Visa, Inc., Class A | 3.30% |
| Microsoft Corp. | 3.22% |
| Walmart, Inc. | 3.20% |
| NVIDIA Corp. | 3.18% |
| * Excluding money market fund holdings, if any. |
Sector allocation
(% of net assets)
(% of net assets)
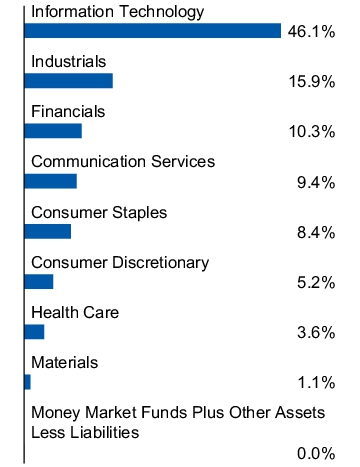
Top ten holdings*
(% of net assets)
(% of net assets)
| Advanced Micro Devices, Inc. | 5.10% |
| Broadcom, Inc. | 3.94% |
| Amazon.com, Inc. | 3.91% |
| Alphabet, Inc., Class A | 3.80% |
| Micron Technology, Inc. | 3.80% |
| Palantir Technologies, Inc., Class A | 3.32% |
| Visa, Inc., Class A | 3.30% |
| Microsoft Corp. | 3.22% |
| Walmart, Inc. | 3.20% |
| NVIDIA Corp. | 3.18% |
| * Excluding money market fund holdings, if any. |
What Were The Fund Costs For The Last Year ?
(Based on a hypothetical $10,000 investment)
| Fund | Costs of a $10,000 investment | Costs paid as a percentage of a $10,000 investment |
| Invesco Large Cap Value ETF | $64 | 0.55% |
How Did The Fund Perform During The Period?
• During the fiscal year ended April 30, 2026, U.S. equities experienced positive returns for the majority of the year, although geopolitical conflict towards the end of the year sparked bouts of increased volatility. During the period, security selection within the financials and health care sectors were relative performance tailwinds for the Fund versus the Russell 1000® Value Index.
• The Fund is passively managed and seeks to track the investment results (before fees and expenses) of the Dynamic Large Cap Value Intellidex® Index (the “Index”). The Fund generally will invest at least 90% of its total assets in securities that comprise the Index.
• For the fiscal year ended April 30, 2026, the Fund's performance, on a net asset value ("NAV") basis, 30.92%, differed from the return of the Index, 31.70%, primarily due to fees and expenses incurred by the Fund during the period, which was compounded during a period of strong performance.
What contributed to performance?
Sector Allocations | Financials sector, followed by the energy and health care sectors, respectively.
Positions | Morgan Stanley, a financials company, and Goldman Sachs Group, Inc. (The), a financials company.
What detracted from performance?
Sector Allocations | Communication services sector.
Positions | Charter Communications, Inc., Class A, a communication services company (no longer held at fiscal year-end), and Uber Technologies, Inc., an industrials company (no longer held at fiscal year-end).
How Has The Fund Historically Performed?
Growth of $10,000 Investment
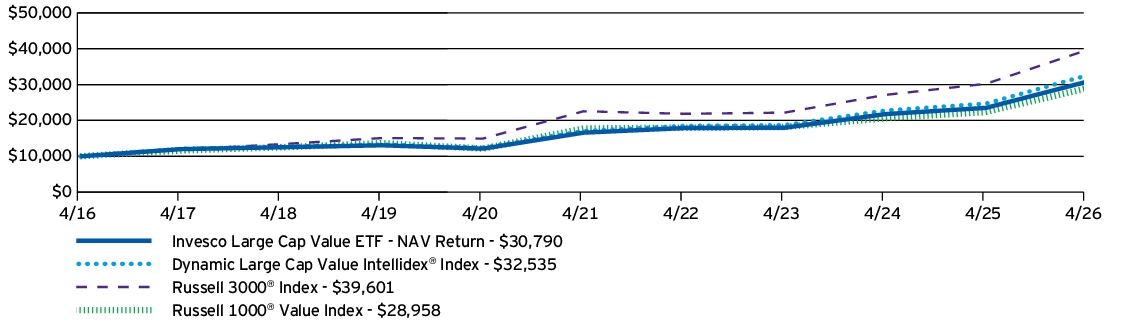
AVERAGE ANNUAL TOTAL RETURNS |
1 Year |
5 Years |
10 Years |
| Invesco Large Cap Value ETF — NAV Return | 30.92% | 13.16% | 11.90% |
| Dynamic Large Cap Value Intellidex® Index | 31.70% | 13.79% | 12.52% |
| Russell 3000® Index | 31.01% | 11.91% | 14.75% |
| Russell 1000® Value Index | 29.25% | 10.29% | 11.22% |
Performance figures do not reflect deduction of taxes a shareholder would pay on Fund distributions or sale of Fund shares.
What Are Key Statistics About The Fund?
(as of April 30, 2026)
| Fund net assets | $1,479,410,978 |
| Total number of portfolio holdings | 51 |
| Total advisory fees paid | $6,134,308 |
| Portfolio turnover rate | 110% |
What Comprised The Fund's Holdings?
(as of April 30, 2026)
Top ten holdings*
(% of net assets)
(% of net assets)
| UnitedHealth Group, Inc. | 4.33% |
| Cisco Systems, Inc. | 3.75% |
| Citigroup, Inc. | 3.74% |
| Morgan Stanley | 3.62% |
| Bank of America Corp. | 3.40% |
| JPMorgan Chase & Co. | 3.37% |
| Chevron Corp. | 3.34% |
| Exxon Mobil Corp. | 3.31% |
| Goldman Sachs Group, Inc. (The) | 3.28% |
| Walt Disney Co. (The) | 3.13% |
| * Excluding money market fund holdings, if any. |
Sector allocation
(% of net assets)
(% of net assets)
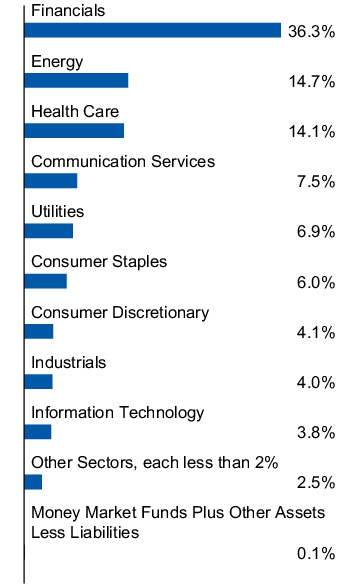
Top ten holdings*
(% of net assets)
(% of net assets)
| UnitedHealth Group, Inc. | 4.33% |
| Cisco Systems, Inc. | 3.75% |
| Citigroup, Inc. | 3.74% |
| Morgan Stanley | 3.62% |
| Bank of America Corp. | 3.40% |
| JPMorgan Chase & Co. | 3.37% |
| Chevron Corp. | 3.34% |
| Exxon Mobil Corp. | 3.31% |
| Goldman Sachs Group, Inc. (The) | 3.28% |
| Walt Disney Co. (The) | 3.13% |
| * Excluding money market fund holdings, if any. |
What Were The Fund Costs For The Last Year ?
(Based on a hypothetical $10,000 investment)
| Fund | Costs of a $10,000 investment | Costs paid as a percentage of a $10,000 investment |
| Invesco S&P MidCap Momentum ETF | $41 | 0.34% |
How Did The Fund Perform During The Period?
• During the fiscal year ended April 30, 2026, U.S. equities experienced positive returns for the majority of the year, although geopolitical conflict towards the end of the year sparked bouts of increased volatility. During the period, the Fund outperformed the S&P MidCap 400® Index primarily due to its security selection within the information technology and industrials sectors.
• The Fund is passively managed and seeks to track the investment results (before fees and expenses) of the S&P MidCap 400® Momentum Index (the “Index”). The Fund generally will invest at least 90% of its total assets in securities that comprise the Index.
• For the fiscal year ended April 30, 2026, the Fund's performance, on a net asset value ("NAV") basis, 39.49%, differed from the return of the Index, 40.04%, primarily due to fees and expenses incurred by the Fund during the period, which was compounded during a period of strong performance.
What contributed to performance?
Sector Allocations | Industrials sector, followed by the information technology and financials sectors, respectively.
Positions | Lumentum Holdings, Inc., an information technology company (no longer held at fiscal year-end), and Comfort Systems USA, Inc., an industrials company (no longer held at fiscal year-end).
What detracted from performance?
Sector Allocations | Consumer discretionary sector, followed by the consumer staples and communication services sectors, respectively.
Positions | Sprouts Farmers Market, Inc., a consumer staples company (no longer held at fiscal year-end), and Duolingo, Inc., a consumer discretionary company (no longer held at fiscal year-end).
How Has The Fund Historically Performed?
Growth of $10,000 Investment
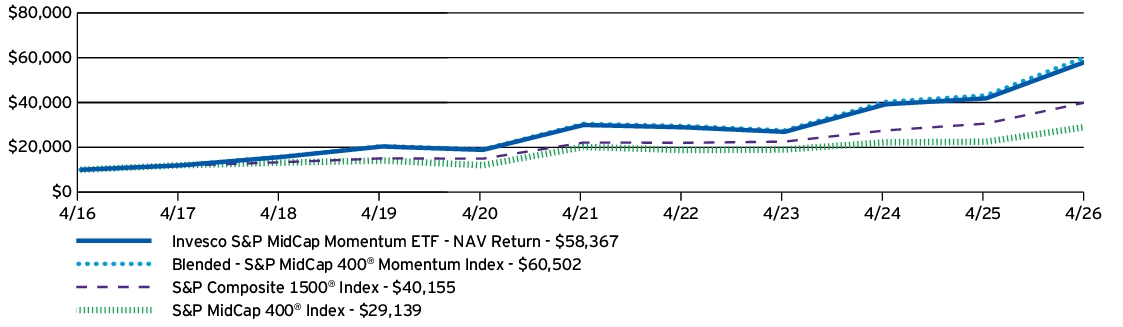
AVERAGE ANNUAL TOTAL RETURNS |
1 Year |
5 Years |
10 Years |
| Invesco S&P MidCap Momentum ETF — NAV Return | 39.49% | 14.26% | 19.29% |
| Blended - S&P MidCap 400® Momentum Index | 40.04% | 14.67% | 19.72% |
| S&P Composite 1500® Index | 31.17% | 12.65% | 14.91% |
| S&P MidCap 400® Index | 29.49% | 7.60% | 11.29% |
Performance figures do not reflect deduction of taxes a shareholder would pay on Fund distributions or sale of Fund shares.
What Are Key Statistics About The Fund?
(as of April 30, 2026)
| Fund net assets | $6,804,339,837 |
| Total number of portfolio holdings | 79 |
| Total advisory fees paid | $13,949,322 |
| Portfolio turnover rate | 129% |
What Comprised The Fund's Holdings?
(as of April 30, 2026)
Top ten holdings*
(% of net assets)
(% of net assets)
| Curtiss-Wright Corp. | 3.92% |
| TechnipFMC PLC | 3.61% |
| Fabrinet | 2.87% |
| ATI, Inc. | 2.64% |
| TTM Technologies, Inc. | 2.62% |
| Royal Gold, Inc. | 2.60% |
| Woodward, Inc. | 2.59% |
| Flex Ltd. | 2.56% |
| nVent Electric PLC | 2.33% |
| MasTec, Inc. | 2.27% |
| * Excluding money market fund holdings, if any. |
Sector allocation
(% of net assets)
(% of net assets)
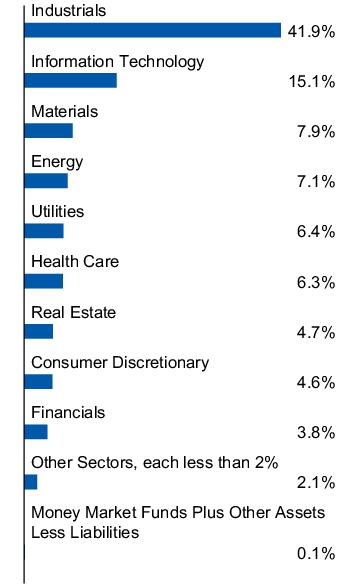
Top ten holdings*
(% of net assets)
(% of net assets)
| Curtiss-Wright Corp. | 3.92% |
| TechnipFMC PLC | 3.61% |
| Fabrinet | 2.87% |
| ATI, Inc. | 2.64% |
| TTM Technologies, Inc. | 2.62% |
| Royal Gold, Inc. | 2.60% |
| Woodward, Inc. | 2.59% |
| Flex Ltd. | 2.56% |
| nVent Electric PLC | 2.33% |
| MasTec, Inc. | 2.27% |
| * Excluding money market fund holdings, if any. |
What Were The Fund Costs For The Last Year ?
(Based on a hypothetical $10,000 investment)
| Fund | Costs of a $10,000 investment | Costs paid as a percentage of a $10,000 investment |
| Invesco S&P MidCap Value with Momentum ETF | $44 | 0.37% |
How Did The Fund Perform During The Period?
• During the fiscal year ended April 30, 2026, U.S. equities experienced positive returns for the majority of the year, although geopolitical conflict towards the end of the year sparked bouts of increased volatility. The Fund's outperformance relative to the S&P MidCap 400® Index was primarily due to its focus on value securities, which outperformed broader mid-cap U.S. equities during the period. A large relative overweight allocation to the financials sector as well as strong security selection results within that sector were notably supportive of relative outperformance.
• The Fund is passively managed and seeks to track the investment results (before fees and expenses) of the S&P MidCap 400® High Momentum Value Index (the “Index”). The Fund generally will invest at least 90% of its total assets in securities that comprise the Index.
• For the fiscal year ended April 30, 2026, the Fund's performance, on a net asset value ("NAV") basis, 38.46%, differed from the return of the Index, 39.06%, primarily due to fees and expenses incurred by the Fund during the period, which was compounded during a period of strong performance.
What contributed to performance?
Sector Allocations | Financials sector, followed by the communication services and industrials sectors, respectively.
Positions | EchoStar Corp., Class A, a communication services company (no longer held at fiscal year-end), and TD SYNNEX Corp., an information technology company.
What detracted from performance?
Sector Allocations | Materials sector, followed by the consumer staples sector.
Positions | Kyndryl Holdings Inc., an information technology company, and Graphic Packaging Holding Co., a materials company (no longer held at fiscal year-end).
How Has The Fund Historically Performed?
Growth of $10,000 Investment
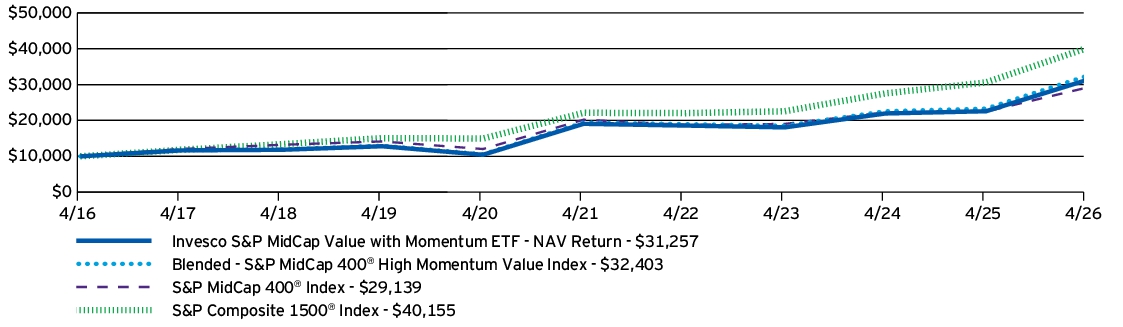
AVERAGE ANNUAL TOTAL RETURNS |
1 Year |
5 Years |
10 Years |
| Invesco S&P MidCap Value with Momentum ETF — NAV Return | 38.46% | 10.40% | 12.07% |
| Blended - S&P MidCap 400® High Momentum Value Index | 39.06% | 10.82% | 12.48% |
| S&P Composite 1500® Index | 31.17% | 12.65% | 14.91% |
| S&P MidCap 400® Index | 29.49% | 7.60% | 11.29% |
Performance figures do not reflect deduction of taxes a shareholder would pay on Fund distributions or sale of Fund shares.
What Are Key Statistics About The Fund?
(as of April 30, 2026)
| Fund net assets | $455,214,573 |
| Total number of portfolio holdings | 81 |
| Total advisory fees paid | $952,155 |
| Portfolio turnover rate | 55% |
What Comprised The Fund's Holdings?
(as of April 30, 2026)
Top ten holdings*
(% of net assets)
(% of net assets)
| TD SYNNEX Corp. | 2.95% |
| Lear Corp. | 2.61% |
| HF Sinclair Corp. | 2.32% |
| Brighthouse Financial, Inc. | 2.15% |
| Valaris Ltd. | 2.11% |
| PBF Energy, Inc., Class A | 2.08% |
| RenaissanceRe Holdings Ltd. | 1.97% |
| Albertson's Cos., Inc., Class A | 1.89% |
| Graham Holdings Co., Class B | 1.77% |
| Macy's, Inc. | 1.75% |
| * Excluding money market fund holdings, if any. |
Sector allocation
(% of net assets)
(% of net assets)
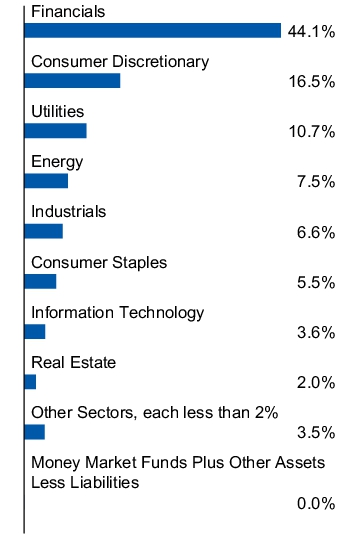
Top ten holdings*
(% of net assets)
(% of net assets)
| TD SYNNEX Corp. | 2.95% |
| Lear Corp. | 2.61% |
| HF Sinclair Corp. | 2.32% |
| Brighthouse Financial, Inc. | 2.15% |
| Valaris Ltd. | 2.11% |
| PBF Energy, Inc., Class A | 2.08% |
| RenaissanceRe Holdings Ltd. | 1.97% |
| Albertson's Cos., Inc., Class A | 1.89% |
| Graham Holdings Co., Class B | 1.77% |
| Macy's, Inc. | 1.75% |
| * Excluding money market fund holdings, if any. |
What Were The Fund Costs For The Last Year ?
(Based on a hypothetical $10,000 investment)
| Fund | Costs of a $10,000 investment | Costs paid as a percentage of a $10,000 investment |
| Invesco RAFI US 1000 ETF | $40 | 0.34% |
How Did The Fund Perform During The Period?
• During the fiscal year ended April 30, 2026, U.S. equities delivered strong results despite periodic volatility. The Fund's fundamental weighting approach led to a security selection tailwind in the information technology sector compared to the Russell 1000® Index.
• The Fund is passively managed and seeks to track the investment results (before fees and expenses) of the RAFITM Fundamental Select US 1000 Index (the “Index”). The Fund generally will invest at least 90% of its total assets in securities that comprise the Index.
• For the fiscal year ended April 30, 2026, the Fund's performance, on a net asset value ("NAV") basis, 34.34%, differed from the return of the Index, 34.78%, primarily due to fees and expenses incurred by the Fund during the period.
What contributed to performance?
Sector Allocations | Information technology sector, followed by the financials and communication services sectors, respectively.
Positions | Alphabet Inc., Class A, a communication services company, and Intel Corp., an information technology company.
What detracted from performance?
Sector Allocations | No sectors detracted from the Fund's performance during the period.
Positions | Berkshire Hathaway Inc., Class B, a financials company, and Charter Communications, Inc., Class A, a communication services company.
How Has The Fund Historically Performed?
Growth of $10,000 Investment
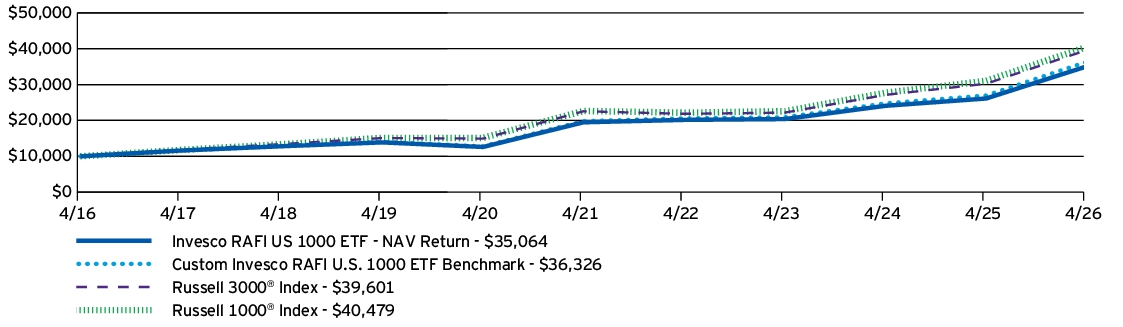
AVERAGE ANNUAL TOTAL RETURNS |
1 Year |
5 Years |
10 Years |
| Invesco RAFI US 1000 ETF — NAV Return | 34.34% | 12.48% | 13.37% |
| Custom Invesco RAFI U.S. 1000 ETF Benchmark | 34.78% | 12.88% | 13.77% |
| Russell 3000® Index | 31.01% | 11.91% | 14.75% |
| Russell 1000® Index | 30.42% | 12.32% | 15.01% |
Performance figures do not reflect deduction of taxes a shareholder would pay on Fund distributions or sale of Fund shares.
What Are Key Statistics About The Fund?
(as of April 30, 2026)
| Fund net assets | $9,527,870,563 |
| Total number of portfolio holdings | 1,006 |
| Total advisory fees paid | $24,234,500 |
| Portfolio turnover rate | 13% |
What Comprised The Fund's Holdings?
(as of April 30, 2026)
Top ten holdings*
(% of net assets)
(% of net assets)
| Alphabet, Inc., Class A | 4.79% |
| Apple, Inc. | 4.08% |
| Intel Corp. | 2.62% |
| Amazon.com, Inc. | 2.32% |
| Microsoft Corp. | 2.17% |
| Exxon Mobil Corp. | 1.88% |
| Berkshire Hathaway, Inc., Class B | 1.69% |
| JPMorgan Chase & Co. | 1.55% |
| Meta Platforms, Inc., Class A | 1.42% |
| Chevron Corp. | 1.33% |
| * Excluding money market fund holdings, if any. |
Sector allocation
(% of net assets)
(% of net assets)
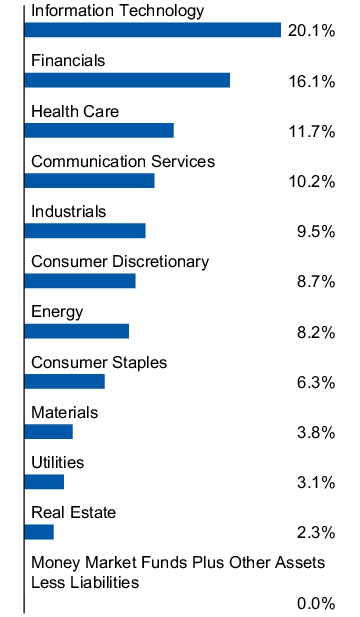
Top ten holdings*
(% of net assets)
(% of net assets)
| Alphabet, Inc., Class A | 4.79% |
| Apple, Inc. | 4.08% |
| Intel Corp. | 2.62% |
| Amazon.com, Inc. | 2.32% |
| Microsoft Corp. | 2.17% |
| Exxon Mobil Corp. | 1.88% |
| Berkshire Hathaway, Inc., Class B | 1.69% |
| JPMorgan Chase & Co. | 1.55% |
| Meta Platforms, Inc., Class A | 1.42% |
| Chevron Corp. | 1.33% |
| * Excluding money market fund holdings, if any. |
What Were The Fund Costs For The Last Year ?
(Based on a hypothetical $10,000 investment)
| Fund | Costs of a $10,000 investment | Costs paid as a percentage of a $10,000 investment |
| Invesco NASDAQ Internet ETF | $62 | 0.60% |
How Did The Fund Perform During The Period?
• During the fiscal year ended April 30, 2026, U.S. equities experienced positive returns for the majority of the year, although geopolitical conflict towards the end of the year sparked bouts of increased volatility. During the period, internet-related businesses underperformed the broader stock market. In addition to the Fund's focus on internet-related stocks, its security selection within application software and higher allocation to real estate services created a performance headwind compared to the Nasdaq-100® Index.
• The Fund is passively managed and seeks to track the investment results (before fees and expenses) of the Nasdaq CTA Internet IndexSM (the “Index”). The Fund generally will invest at least 90% of its total assets in securities that comprise the Index.
• For the fiscal year ended April 30, 2026, the Fund's performance, on a net asset value ("NAV") basis, 7.22%, differed from the return of the Index, 7.83%, primarily due to fees and expenses incurred by the Fund during the period.
What contributed to performance?
Sub-Industry Allocations | Interactive media & services sub-industry, followed by the broadline retail and technology hardware storage & peripherals sub-industries, respectively.
Positions | Alphabet Inc., Class C, an interactive media & services company, and Amazon.com, Inc., a broadline retail company.
What detracted from performance?
Sub-Industry Allocations | Application software sub-industry, followed by the real estate services and hotels resorts & cruise lines sub-industries, respectively.
Positions | Salesforce, Inc., an application software company, and Adobe, Inc., an application software company.
How Has The Fund Historically Performed?
Growth of $10,000 Investment
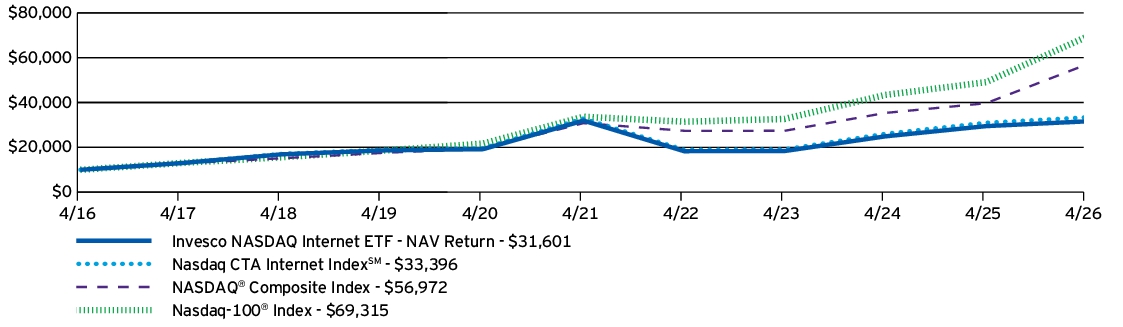
AVERAGE ANNUAL TOTAL RETURNS |
1 Year |
5 Years |
10 Years |
| Invesco NASDAQ Internet ETF — NAV Return | 7.22% | -0.20% | 12.19% |
| Nasdaq CTA Internet Index℠ | 7.83% | 0.34% | 12.82% |
| NASDAQ® Composite Index | 43.57% | 13.09% | 19.01% |
| Nasdaq-100® Index | 41.22% | 15.54% | 21.36% |
Performance figures do not reflect deduction of taxes a shareholder would pay on Fund distributions or sale of Fund shares.
What Are Key Statistics About The Fund?
(as of April 30, 2026)
| Fund net assets | $558,609,341 |
| Total number of portfolio holdings | 80 |
| Total advisory fees paid | $4,401,598 |
| Portfolio turnover rate | 17% |
What Comprised The Fund's Holdings?
(as of April 30, 2026)
Top ten holdings*
(% of net assets)
(% of net assets)
| Amazon.com, Inc. | 9.87% |
| Alphabet, Inc., Class C | 9.59% |
| Microsoft Corp. | 8.12% |
| Apple, Inc. | 8.03% |
| Meta Platforms, Inc., Class A | 7.38% |
| Shopify, Inc., Class A | 3.92% |
| Uber Technologies, Inc. | 3.87% |
| Walt Disney Co. (The) | 3.83% |
| Netflix, Inc. | 3.80% |
| Booking Holdings, Inc. | 3.69% |
| * Excluding money market fund holdings, if any. |
Sub-industry allocation
(% of net assets)
(% of net assets)
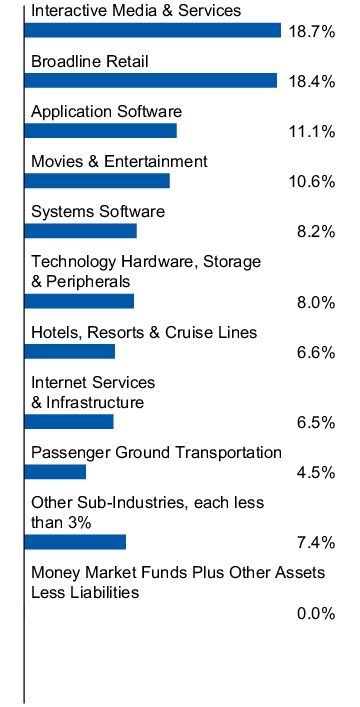
Top ten holdings*
(% of net assets)
(% of net assets)
| Amazon.com, Inc. | 9.87% |
| Alphabet, Inc., Class C | 9.59% |
| Microsoft Corp. | 8.12% |
| Apple, Inc. | 8.03% |
| Meta Platforms, Inc., Class A | 7.38% |
| Shopify, Inc., Class A | 3.92% |
| Uber Technologies, Inc. | 3.87% |
| Walt Disney Co. (The) | 3.83% |
| Netflix, Inc. | 3.80% |
| Booking Holdings, Inc. | 3.69% |
| * Excluding money market fund holdings, if any. |
What Were The Fund Costs For The Last Year ?
(Based on a hypothetical $10,000 investment)
| Fund | Costs of a $10,000 investment | Costs paid as a percentage of a $10,000 investment |
| Invesco Dorsey Wright Energy Momentum ETF | $78 | 0.60%† |
|
†
|
Reflects fee waivers and/or expense reimbursements, without which expenses would have been higher.
|
How Did The Fund Perform During The Period?
• During the fiscal year ended April 30, 2026, U.S. equities experienced positive returns for the majority of the year, although geopolitical conflict towards the end of the year sparked bouts of increased volatility. During the period, the energy sector outperformed the broader market. In addition to the Fund's focus on energy stocks, its momentum methodology led to a security selection tailwind in oil & gas refining & marketing stocks compared to the S&P 500® Energy Index.
• The Fund is passively managed and seeks to track the investment results (before fees and expenses) of the Dorsey Wright Energy Technical LeadersTM Index (the “Index”). The Fund generally will invest at least 90% of its total assets in securities that comprise the Index.
• For the fiscal year ended April 30, 2026, the Fund's performance, on a net asset value ("NAV") basis, 61.16%, differed from the return of the Index, 62.06%, primarily due to fees and expenses incurred by the Fund during the period, which was compounded during a period of strong performance.
What contributed to performance?
Sub-Industry Allocations | Oil & gas refining & marketing sub-industry, followed by the oil & gas equipment & services and oil & gas exploration & production sub-industries, respectively.
Positions | Centrus Energy Corp., Class A, a coal & consumable fuels company (no longer held at fiscal year-end), and Weatherford International PLC, an oil & gas equipment & services company (no longer held at fiscal year-end).
What detracted from performance?
Sub-Industry Allocations | Steel sub-industry.
Positions | Texas Pacific Land Corp., a oil & gas exploration & production company (no longer held at fiscal year-end), and Ramaco Resources, Inc., Class A, a steel company (no longer held at fiscal year-end).
How Has The Fund Historically Performed?
Growth of $10,000 Investment
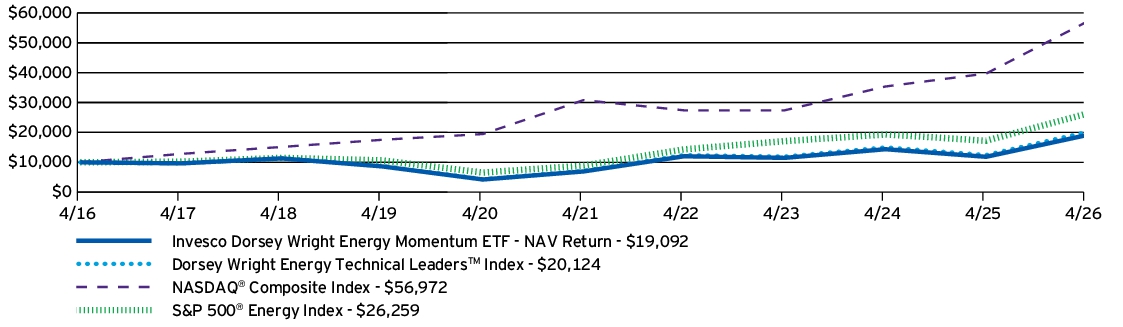
AVERAGE ANNUAL TOTAL RETURNS |
1 Year |
5 Years |
10 Years |
| Invesco Dorsey Wright Energy Momentum ETF — NAV Return | 61.16% | 22.41% | 6.68% |
| Dorsey Wright Energy Technical Leaders™ Index | 62.06% | 23.06% | 7.24% |
| NASDAQ® Composite Index | 43.57% | 13.09% | 19.01% |
| S&P 500® Energy Index | 52.40% | 24.12% | 10.14% |
Performance figures do not reflect deduction of taxes a shareholder would pay on Fund distributions or sale of Fund shares.
What Are Key Statistics About The Fund?
(as of April 30, 2026)
| Fund net assets | $84,634,256 |
| Total number of portfolio holdings | 45 |
| Total advisory fees paid | $121,183 |
| Portfolio turnover rate | 106% |
What Comprised The Fund's Holdings?
(as of April 30, 2026)
Top ten holdings*
(% of net assets)
(% of net assets)
| Targa Resources Corp. | 6.44% |
| Marathon Petroleum Corp. | 5.33% |
| Liberty Energy, Inc., Class A | 4.04% |
| Permian Resources Corp. | 4.02% |
| Viper Energy, Inc., Class A | 3.81% |
| Devon Energy Corp. | 3.52% |
| Baker Hughes Co., Class A | 3.50% |
| Transocean Ltd. | 3.50% |
| Williams Cos., Inc. (The) | 3.37% |
| PBF Energy, Inc., Class A | 3.35% |
| * Excluding money market fund holdings, if any. |
Sub-industry allocation
(% of net assets)
(% of net assets)
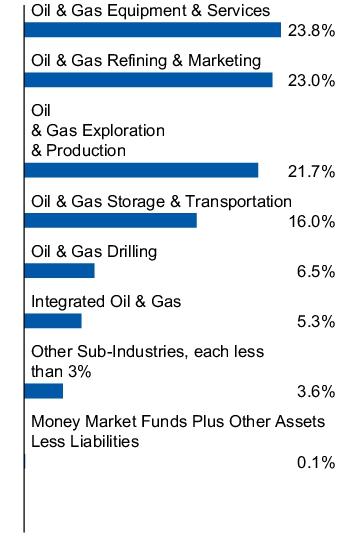
Top ten holdings*
(% of net assets)
(% of net assets)
| Targa Resources Corp. | 6.44% |
| Marathon Petroleum Corp. | 5.33% |
| Liberty Energy, Inc., Class A | 4.04% |
| Permian Resources Corp. | 4.02% |
| Viper Energy, Inc., Class A | 3.81% |
| Devon Energy Corp. | 3.52% |
| Baker Hughes Co., Class A | 3.50% |
| Transocean Ltd. | 3.50% |
| Williams Cos., Inc. (The) | 3.37% |
| PBF Energy, Inc., Class A | 3.35% |
| * Excluding money market fund holdings, if any. |
What Were The Fund Costs For The Last Year ?
(Based on a hypothetical $10,000 investment)
| Fund | Costs of a $10,000 investment | Costs paid as a percentage of a $10,000 investment |
| Invesco Dorsey Wright Financial Momentum ETF | $64 | 0.60%† |
|
†
|
Reflects fee waivers and/or expense reimbursements, without which expenses would have been higher.
|
How Did The Fund Perform During The Period?
• During the fiscal year ended April 30, 2026, U.S. equities experienced positive returns for the majority of the year, although geopolitical conflict towards the end of the year sparked bouts of increased volatility. During the period, the financials sector underperformed the broader market. The Fund's momentum methodology led to an overweight in investment banking & brokerage stocks, which created a performance tailwind compared to the S&P 500® Financials Index.
• The Fund is passively managed and seeks to track the investment results (before fees and expenses) of the Dorsey Wright Financials Technical LeadersTM Index (the “Index”). The Fund generally will invest at least 90% of its total assets in securities that comprise the Index.
• For the fiscal year ended April 30, 2026, the Fund's performance, on a net asset value ("NAV") basis, 11.77%, differed from the return of the Index, 12.48%, primarily due to fees and expenses incurred by the Fund during the period.
What contributed to performance?
Sub-Industry Allocations | Investment banking & brokerage sub-industry, followed by the diversified banks and consumer finance sub-industries, respectively.
Positions | Goldman Sachs Group, Inc. (The), an investment banking & brokerage company, and Interactive Brokers Group, Inc., Class A, an investment banking & brokerage company.
What detracted from performance?
Sub-Industry Allocations | Property & casualty insurance sub-industry, followed by the transaction & payment processing services and multi-sector holdings sub-industries, respectively.
Positions | Sezzle Inc., a transaction & payment processing services company (no longer held at fiscal year-end), and Progressive Corp., a property & casualty insurance company (no longer held at fiscal year-end).
How Has The Fund Historically Performed?
Growth of $10,000 Investment
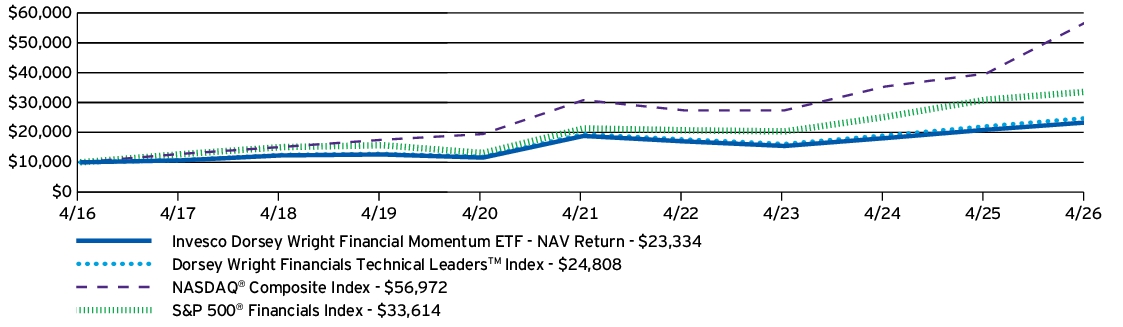
AVERAGE ANNUAL TOTAL RETURNS |
1 Year |
5 Years |
10 Years |
| Invesco Dorsey Wright Financial Momentum ETF — NAV Return | 11.77% | 4.41% | 8.84% |
| Dorsey Wright Financials Technical Leaders™ Index | 12.48% | 5.03% | 9.51% |
| NASDAQ® Composite Index | 43.57% | 13.09% | 19.01% |
| S&P 500® Financials Index | 8.58% | 9.51% | 12.89% |
Performance figures do not reflect deduction of taxes a shareholder would pay on Fund distributions or sale of Fund shares.
What Are Key Statistics About The Fund?
(as of April 30, 2026)
| Fund net assets | $33,712,504 |
| Total number of portfolio holdings | 51 |
| Total advisory fees paid | $177,669 |
| Portfolio turnover rate | 153% |
What Comprised The Fund's Holdings?
(as of April 30, 2026)
Top ten holdings*
(% of net assets)
(% of net assets)
| JPMorgan Chase & Co. | 5.33% |
| Interactive Brokers Group, Inc., Class A | 4.97% |
| Morgan Stanley | 4.84% |
| American Healthcare REIT, Inc. | 4.41% |
| Lemonade, Inc. | 4.10% |
| Goldman Sachs Group, Inc. (The) | 3.63% |
| Welltower, Inc. | 3.41% |
| Simon Property Group, Inc. | 3.21% |
| Citigroup, Inc. | 3.16% |
| Ventas, Inc. | 3.14% |
| * Excluding money market fund holdings, if any. |
Sub-industry allocation
(% of net assets)
(% of net assets)
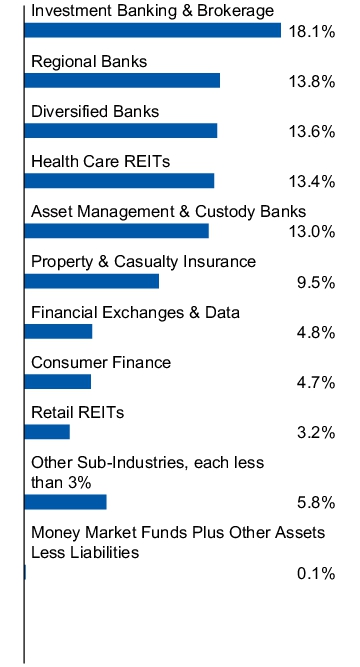
Top ten holdings*
(% of net assets)
(% of net assets)
| JPMorgan Chase & Co. | 5.33% |
| Interactive Brokers Group, Inc., Class A | 4.97% |
| Morgan Stanley | 4.84% |
| American Healthcare REIT, Inc. | 4.41% |
| Lemonade, Inc. | 4.10% |
| Goldman Sachs Group, Inc. (The) | 3.63% |
| Welltower, Inc. | 3.41% |
| Simon Property Group, Inc. | 3.21% |
| Citigroup, Inc. | 3.16% |
| Ventas, Inc. | 3.14% |
| * Excluding money market fund holdings, if any. |
What Were The Fund Costs For The Last Year ?
(Based on a hypothetical $10,000 investment)
| Fund | Costs of a $10,000 investment | Costs paid as a percentage of a $10,000 investment |
| Invesco Dorsey Wright Healthcare Momentum ETF | $69 | 0.60%† |
|
†
|
Reflects fee waivers and/or expense reimbursements, without which expenses would have been higher.
|
How Did The Fund Perform During The Period?
• During the fiscal year ended April 30, 2026, U.S. equities experienced positive returns for the majority of the year, although geopolitical conflict towards the end of the year sparked bouts of increased volatility. During the period, the health care sector underperformed the broader stock market. The Fund's momentum methodology led to better security selection within biotechnology, which created a performance tailwind compared to the S&P 500® Health Care Index.
• The Fund is passively managed and seeks to track the investment results (before fees and expenses) of the Dorsey Wright Healthcare Technical LeadersTM Index (the “Index”). The Fund generally will invest at least 90% of its total assets in securities that comprise the Index.
• For the fiscal year ended April 30, 2026, the Fund's performance, on a net asset value ("NAV") basis, 29.85%, differed from the return of the Index, 30.64%, primarily due to fees and expenses incurred by the Fund during the period, which was compounded during a period of strong performance and partially offset by income received from the securities lending program in which the Fund participates.
What contributed to performance?
Sub-Industry Allocations | Biotechnology sub-industry, followed by the health care services and pharmaceuticals sub-industries, respectively.
Positions | Insmed Inc., a biotechnology company (no longer held at fiscal year-end), and uniQure N.V., a biotechnology company (no longer held at fiscal year-end).
What detracted from performance?
Sub-Industry Allocations | Health care technology sub-industry, followed by the managed health care sub-industry and life sciences tools & services sub-industries, respectively.
Positions | agilon health, inc., a health care services company (no longer held at fiscal year-end), and Hims & Hers Health, Inc., Class A, a health care services company (no longer held at fiscal year-end).
How Has The Fund Historically Performed?
Growth of $10,000 Investment
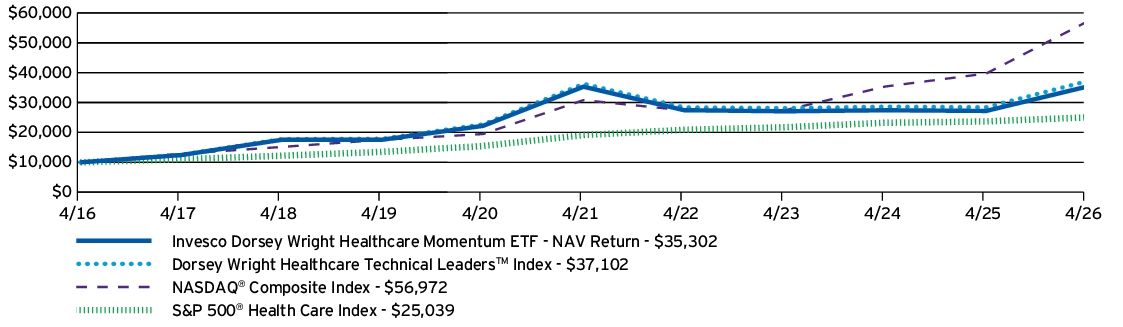
AVERAGE ANNUAL TOTAL RETURNS |
1 Year |
5 Years |
10 Years |
| Invesco Dorsey Wright Healthcare Momentum ETF — NAV Return | 29.85% | 0.01% | 13.44% |
| Dorsey Wright Healthcare Technical Leaders™ Index | 30.64% | 0.46% | 14.01% |
| NASDAQ® Composite Index | 43.57% | 13.09% | 19.01% |
| S&P 500® Health Care Index | 5.77% | 5.54% | 9.61% |
Performance figures do not reflect deduction of taxes a shareholder would pay on Fund distributions or sale of Fund shares.
What Are Key Statistics About The Fund?
(as of April 30, 2026)
| Fund net assets | $120,908,386 |
| Total number of portfolio holdings | 61 |
| Total advisory fees paid | $393,549 |
| Portfolio turnover rate | 239% |
What Comprised The Fund's Holdings?
(as of April 30, 2026)
Top ten holdings*
(% of net assets)
(% of net assets)
| Praxis Precision Medicines, Inc. | 5.06% |
| Roivant Sciences Ltd. | 4.63% |
| United Therapeutics Corp. | 3.42% |
| Tenet Healthcare Corp. | 3.03% |
| Terns Pharmaceuticals, Inc. | 2.85% |
| Tango Therapeutics, Inc. | 2.84% |
| HCA Healthcare, Inc. | 2.76% |
| Axsome Therapeutics, Inc. | 2.63% |
| Nektar Therapeutics | 2.56% |
| Celcuity, Inc. | 2.52% |
| * Excluding money market fund holdings, if any. |
Sub-industry allocation
(% of net assets)
(% of net assets)
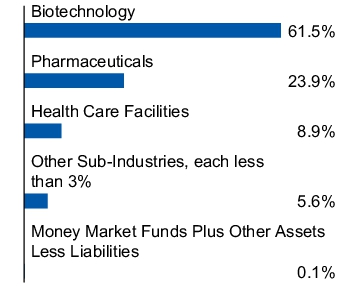
Top ten holdings*
(% of net assets)
(% of net assets)
| Praxis Precision Medicines, Inc. | 5.06% |
| Roivant Sciences Ltd. | 4.63% |
| United Therapeutics Corp. | 3.42% |
| Tenet Healthcare Corp. | 3.03% |
| Terns Pharmaceuticals, Inc. | 2.85% |
| Tango Therapeutics, Inc. | 2.84% |
| HCA Healthcare, Inc. | 2.76% |
| Axsome Therapeutics, Inc. | 2.63% |
| Nektar Therapeutics | 2.56% |
| Celcuity, Inc. | 2.52% |
| * Excluding money market fund holdings, if any. |
What Were The Fund Costs For The Last Year ?
(Based on a hypothetical $10,000 investment)
| Fund | Costs of a $10,000 investment | Costs paid as a percentage of a $10,000 investment |
| Invesco Dorsey Wright Industrials Momentum ETF | $81 | 0.60%† |
|
†
|
Reflects fee waivers and/or expense reimbursements, without which expenses would have been higher.
|
How Did The Fund Perform During The Period?
• During the fiscal year ended April 30, 2026, U.S. equities experienced positive returns for the majority of the year, although geopolitical conflict towards the end of the year sparked bouts of increased volatility. During the period, industrials outperformed the broader stock market. In addition to the Fund's focus on industrials stocks, its momentum methodology led to higher exposure to construction & engineering, which created a performance tailwind compared to the S&P 500® Industrials Index.
• The Fund is passively managed and seeks to track the investment results (before fees and expenses) of the Dorsey Wright Industrials Technical LeadersTM Index (the “Index”). The Fund generally will invest at least 90% of its total assets in securities that comprise the Index.
• For the fiscal year ended April 30, 2026, the Fund's performance, on a net asset value ("NAV") basis, 69.39%, differed from the return of the Index, 70.40%, primarily due to fees and expenses incurred by the Fund during the period, which was compounded during a period of strong performance.
What contributed to performance?
Sub-Industry Allocations | Construction & engineering sub-industry, followed by the aerospace & defense and electronic manufacturing services sub-industries, respectively.
Positions | Comfort Systems USA, Inc., a construction & engineering company, and Rocket Lab Corp., an aerospace & defense company (no longer held at fiscal year-end).
What detracted from performance?
Sub-Industry Allocations | Construction materials sub-industry, followed by the heavy electrical equipment and transaction & payment processing services sub-industries, respectively.
Positions | Axon Enterprise, Inc., an aerospace & defense company (no longer held at fiscal year-end), and Limbach Holdings, Inc., a construction & engineering company (no longer held at fiscal year-end).
How Has The Fund Historically Performed?
Growth of $10,000 Investment
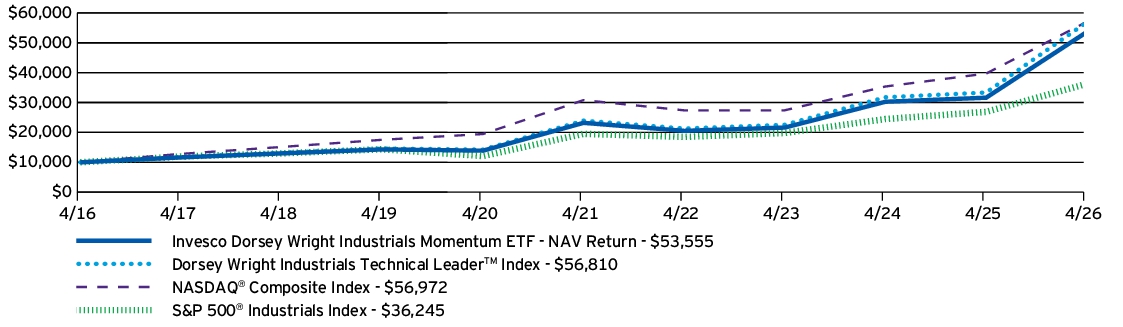
AVERAGE ANNUAL TOTAL RETURNS |
1 Year |
5 Years |
10 Years |
| Invesco Dorsey Wright Industrials Momentum ETF — NAV Return | 69.39% | 18.21% | 18.27% |
| Dorsey Wright Industrials Technical Leaders™ Index | 70.40% | 18.87% | 18.97% |
| NASDAQ® Composite Index | 43.57% | 13.09% | 19.01% |
| S&P 500® Industrials Index | 34.83% | 13.17% | 13.74% |
Performance figures do not reflect deduction of taxes a shareholder would pay on Fund distributions or sale of Fund shares.
What Are Key Statistics About The Fund?
(as of April 30, 2026)
| Fund net assets | $403,306,632 |
| Total number of portfolio holdings | 41 |
| Total advisory fees paid | $1,422,839 |
| Portfolio turnover rate | 154% |
What Comprised The Fund's Holdings?
(as of April 30, 2026)
Top ten holdings*
(% of net assets)
(% of net assets)
| TTM Technologies, Inc. | 5.23% |
| Comfort Systems USA, Inc. | 4.85% |
| Argan, Inc. | 4.57% |
| Quanta Services, Inc. | 4.31% |
| Planet Labs PBC | 4.19% |
| Jabil, Inc. | 3.90% |
| Vicor Corp. | 3.76% |
| ITT, Inc. | 3.63% |
| Cummins, Inc. | 3.38% |
| Caterpillar, Inc. | 3.35% |
| * Excluding money market fund holdings, if any. |
Sub-industry allocation
(% of net assets)
(% of net assets)
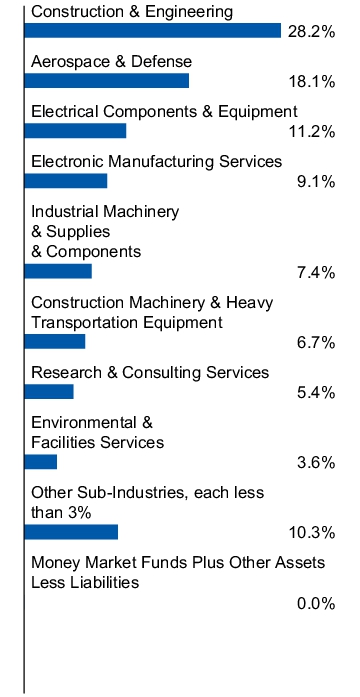
Top ten holdings*
(% of net assets)
(% of net assets)
| TTM Technologies, Inc. | 5.23% |
| Comfort Systems USA, Inc. | 4.85% |
| Argan, Inc. | 4.57% |
| Quanta Services, Inc. | 4.31% |
| Planet Labs PBC | 4.19% |
| Jabil, Inc. | 3.90% |
| Vicor Corp. | 3.76% |
| ITT, Inc. | 3.63% |
| Cummins, Inc. | 3.38% |
| Caterpillar, Inc. | 3.35% |
| * Excluding money market fund holdings, if any. |
What Were The Fund Costs For The Last Year ?
(Based on a hypothetical $10,000 investment)
| Fund | Costs of a $10,000 investment | Costs paid as a percentage of a $10,000 investment |
| Invesco S&P 100 Equal Weight ETF | $28 | 0.25%† |
|
†
|
Reflects fee waivers and/or expense reimbursements, without which expenses would have been higher.
|
How Did The Fund Perform During The Period?
• During the fiscal year ended April 30, 2026, U.S. equities experienced positive returns for the majority of the year, although geopolitical conflict towards the end of the year sparked bouts of increased volatility. During the period, the Fund's equal weighting methodology led to lower exposure to mega-cap stocks within the S&P 100® Index, which was a relative performance headwind.
• The Fund is passively managed and seeks to track the investment results (before fees and expenses) of the S&P 100® Equal Weight Index (the “Index”). The Fund generally will invest at least 90% of its total assets in securities that comprise the Index.
• For the fiscal year ended April 30, 2026, the Fund's performance, on a net asset value ("NAV") basis, 23.90%, differed from the return of the Index, 24.25%, primarily due to fees and expenses incurred by the Fund during the period.
What contributed to performance?
Sector Allocations | Information technology sector, followed by the industrials and financials sectors, respectively.
Positions | Intel Corp., an information technology company, and Advanced Micro Devices, Inc., an information technology company.
What detracted from performance?
Sector Allocations | No sector detracted from the Fund's performance during the period.
Positions | ServiceNow, Inc., an information technology company, and Accenture PLC, Class A, an information technology company.
How Has The Fund Historically Performed?
Growth of $10,000 Investment
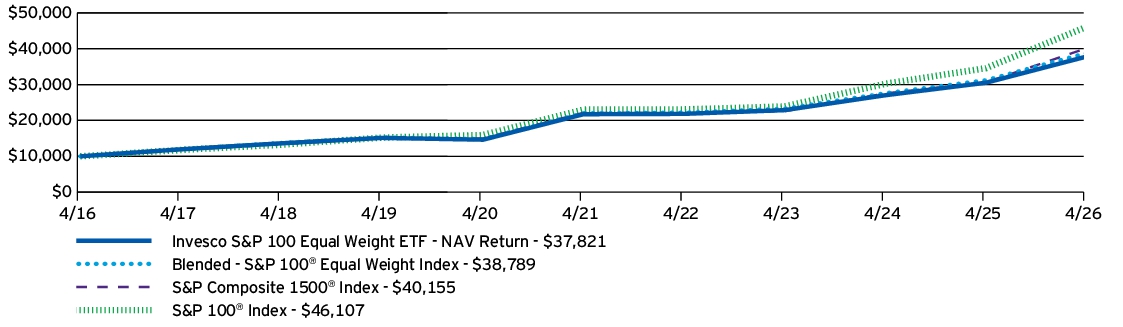
AVERAGE ANNUAL TOTAL RETURNS |
1 Year |
5 Years |
10 Years |
| Invesco S&P 100 Equal Weight ETF — NAV Return | 23.90% | 11.71% | 14.23% |
| Blended - S&P 100® Equal Weight Index | 24.25% | 12.01% | 14.52% |
| S&P Composite 1500® Index | 31.17% | 12.65% | 14.91% |
| S&P 100® Index | 33.29% | 14.90% | 16.51% |
Performance figures do not reflect deduction of taxes a shareholder would pay on Fund distributions or sale of Fund shares.
What Are Key Statistics About The Fund?
(as of April 30, 2026)
| Fund net assets | $2,481,594,328 |
| Total number of portfolio holdings | 102 |
| Total advisory fees paid | $3,639,868 |
| Portfolio turnover rate | 23% |
What Comprised The Fund's Holdings?
(as of April 30, 2026)
Top ten holdings*
(% of net assets)
(% of net assets)
| Intel Corp. | 1.89% |
| Advanced Micro Devices, Inc. | 1.67% |
| Texas Instruments, Inc. | 1.36% |
| QUALCOMM, Inc. | 1.29% |
| UnitedHealth Group, Inc. | 1.25% |
| GE Vernova, Inc. | 1.23% |
| Caterpillar, Inc. | 1.21% |
| Amazon.com, Inc. | 1.20% |
| Micron Technology, Inc. | 1.19% |
| Broadcom, Inc. | 1.18% |
| * Excluding money market fund holdings, if any. |
Sector allocation
(% of net assets)
(% of net assets)
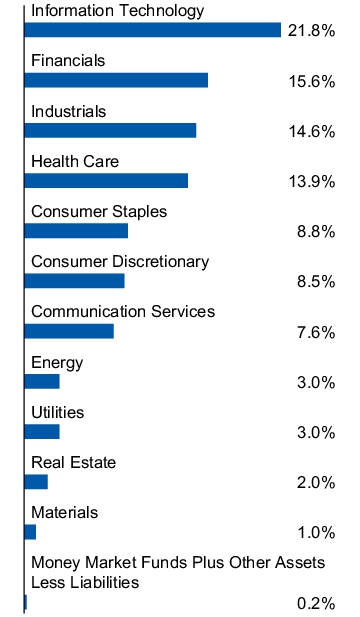
Top ten holdings*
(% of net assets)
(% of net assets)
| Intel Corp. | 1.89% |
| Advanced Micro Devices, Inc. | 1.67% |
| Texas Instruments, Inc. | 1.36% |
| QUALCOMM, Inc. | 1.29% |
| UnitedHealth Group, Inc. | 1.25% |
| GE Vernova, Inc. | 1.23% |
| Caterpillar, Inc. | 1.21% |
| Amazon.com, Inc. | 1.20% |
| Micron Technology, Inc. | 1.19% |
| Broadcom, Inc. | 1.18% |
| * Excluding money market fund holdings, if any. |
What Were The Fund Costs For The Last Year ?
(Based on a hypothetical $10,000 investment)
| Fund | Costs of a $10,000 investment | Costs paid as a percentage of a $10,000 investment |
| Invesco S&P MidCap Quality ETF | $27 | 0.25%† |
|
†
|
Reflects fee waivers and/or expense reimbursements, without which expenses would have been higher.
|
How Did The Fund Perform During The Period?
• During the fiscal year ended April 30, 2026, U.S. equities experienced positive returns for the majority of the year, although geopolitical conflict towards the end of the year sparked bouts of increased volatility. The Fund's relative underperformance to the S&P MidCap 400® Index was primarily due to security selection in the information technology and financials sectors.
• The Fund is passively managed and seeks to track the investment results (before fees and expenses) of the S&P MidCap 400® Quality Index (the “Index”). The Fund generally will invest at least 90% of its total assets in securities that comprise the Index.
• For the fiscal year ended April 30, 2026, the Fund's performance, on a net asset value ("NAV") basis, 16.80%, differed from the return of the Index, 17.11%, primarily due to fees and expenses incurred by the Fund during the period.
What contributed to performance?
Sector Allocations | Industrials sector, followed by the energy and health care sectors, respectively.
Positions | Comfort Systems USA, Inc., an industrials company (no longer held at fiscal year-end), and United Therapeutics Corp., a health care company.
What detracted from performance?
Sector Allocations | Consumer staples sector, followed by the information technology sector.
Positions | Sprouts Farmers Market, Inc., a consumer staples company, and Hims & Hers Health, Inc., a health care company (no longer held at fiscal year-end).
How Has The Fund Historically Performed?
Growth of $10,000 Investment
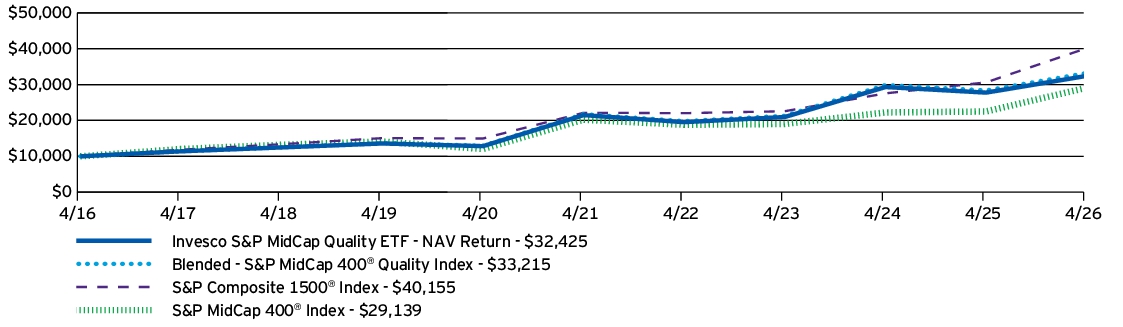
AVERAGE ANNUAL TOTAL RETURNS |
1 Year |
5 Years |
10 Years |
| Invesco S&P MidCap Quality ETF — NAV Return | 16.80% | 8.57% | 12.48% |
| Blended - S&P MidCap 400® Quality Index | 17.11% | 8.85% | 12.75% |
| S&P Composite 1500® Index | 31.17% | 12.65% | 14.91% |
| S&P MidCap 400® Index | 29.49% | 7.60% | 11.29% |
Performance figures do not reflect deduction of taxes a shareholder would pay on Fund distributions or sale of Fund shares.
What Are Key Statistics About The Fund?
(as of April 30, 2026)
| Fund net assets | $5,189,505,934 |
| Total number of portfolio holdings | 83 |
| Total advisory fees paid | $10,029,940 |
| Portfolio turnover rate | 65% |
What Comprised The Fund's Holdings?
(as of April 30, 2026)
Top ten holdings*
(% of net assets)
(% of net assets)
| TechnipFMC PLC | 4.95% |
| United Therapeutics Corp. | 3.98% |
| Illumina, Inc. | 3.55% |
| Twilio, Inc., Class A | 3.00% |
| Carlisle Cos., Inc. | 2.74% |
| Carpenter Technology Corp. | 2.72% |
| Sterling Infrastructure, Inc. | 2.61% |
| Medpace Holdings, Inc. | 2.54% |
| Nextpower, Inc., Class A | 2.53% |
| Royal Gold, Inc. | 2.38% |
| * Excluding money market fund holdings, if any. |
Sector allocation
(% of net assets)
(% of net assets)
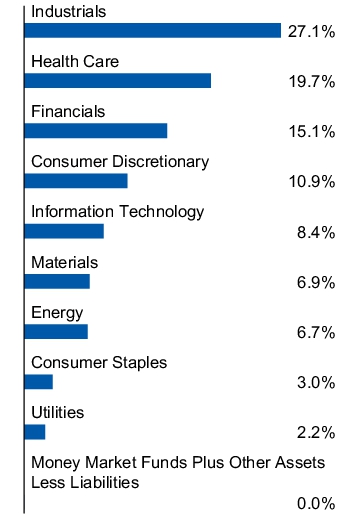
Top ten holdings*
(% of net assets)
(% of net assets)
| TechnipFMC PLC | 4.95% |
| United Therapeutics Corp. | 3.98% |
| Illumina, Inc. | 3.55% |
| Twilio, Inc., Class A | 3.00% |
| Carlisle Cos., Inc. | 2.74% |
| Carpenter Technology Corp. | 2.72% |
| Sterling Infrastructure, Inc. | 2.61% |
| Medpace Holdings, Inc. | 2.54% |
| Nextpower, Inc., Class A | 2.53% |
| Royal Gold, Inc. | 2.38% |
| * Excluding money market fund holdings, if any. |
What Were The Fund Costs For The Last Year ?
(Based on a hypothetical $10,000 investment)
| Fund | Costs of a $10,000 investment | Costs paid as a percentage of a $10,000 investment |
| Invesco Dorsey Wright Technology Momentum ETF | $87 | 0.60%† |
|
†
|
Reflects fee waivers and/or expense reimbursements, without which expenses would have been higher.
|
How Did The Fund Perform During The Period?
• During the fiscal year ended April 30, 2026, U.S. equities experienced positive returns for the majority of the year, although geopolitical conflict towards the end of the year sparked bouts of increased volatility. During the period, information technology outperformed the broader stock market. In addition to the Fund's focus on information technology stocks, its momentum methodology created a performance tailwind compared to the S&P 500® Information Technology Index.
• The Fund is passively managed and seeks to track the investment results (before fees and expenses) of the Dorsey Wright Technology Technical LeadersTM Index (the “Index”). The Fund generally will invest at least 90% of its total assets in securities that comprise the Index.
• For the fiscal year ended April 30, 2026, the Fund's performance, on a net asset value ("NAV") basis, 89.34%, differed from the return of the Index, 90.01%, primarily due to fees and expenses incurred by the Fund during the period.
What contributed to performance?
Sub-Industry Allocations | Communications equipment sub-industry, followed by the technology hardware, storage & peripherals and semiconductor materials & equipment sub-industries, respectively.
Positions | Lumentum Holdings, Inc., a communications equipment company, and Sandisk Corp., a technology hardware, storage & peripherals company.
What detracted from performance?
Sub-Industry Allocations | Real estate services sub-industry, followed by the consumer finance and wireless telecommunication services sub-industries, respectively.
Positions | Aeva Technologies, Inc., an electronic equipment & instruments company (no longer held at fiscal year-end), and BitMine Immersion Technologies Inc., an application software company (no longer held at fiscal year-end).
How Has The Fund Historically Performed?
Growth of $10,000 Investment
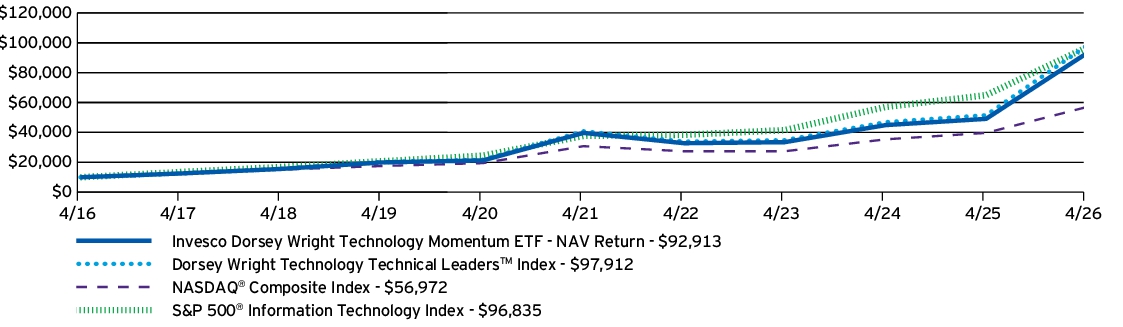
AVERAGE ANNUAL TOTAL RETURNS |
1 Year |
5 Years |
10 Years |
| Invesco Dorsey Wright Technology Momentum ETF — NAV Return | 89.34% | 18.56% | 24.97% |
| Dorsey Wright Technology Technical Leaders™ Index | 90.01% | 19.16% | 25.63% |
| NASDAQ® Composite Index | 43.57% | 13.09% | 19.01% |
| S&P 500® Information Technology Index | 49.17% | 20.77% | 25.49% |
Performance figures do not reflect deduction of taxes a shareholder would pay on Fund distributions or sale of Fund shares.
What Are Key Statistics About The Fund?
(as of April 30, 2026)
| Fund net assets | $581,752,677 |
| Total number of portfolio holdings | 41 |
| Total advisory fees paid | $1,669,203 |
| Portfolio turnover rate | 217% |
What Comprised The Fund's Holdings?
(as of April 30, 2026)
Top ten holdings*
(% of net assets)
(% of net assets)
| Sandisk Corp. | 5.71% |
| NVIDIA Corp. | 4.84% |
| Apple, Inc. | 4.55% |
| Lumentum Holdings, Inc. | 4.53% |
| Western Digital Corp. | 4.38% |
| Ciena Corp. | 4.27% |
| Seagate Technology Holdings PLC | 4.14% |
| Aehr Test Systems | 3.69% |
| Ondas, Inc. | 3.29% |
| Navitas Semiconductor Corp. | 3.07% |
| * Excluding money market fund holdings, if any. |
Sub-industry allocation
(% of net assets)
(% of net assets)
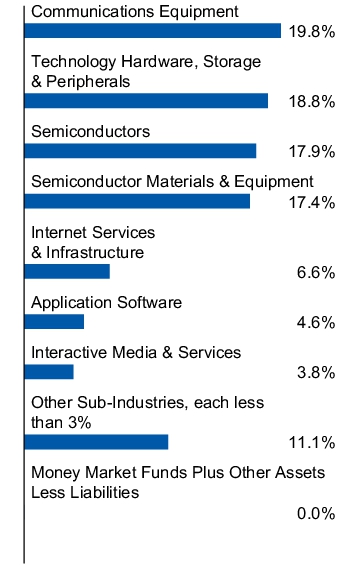
Top ten holdings*
(% of net assets)
(% of net assets)
| Sandisk Corp. | 5.71% |
| NVIDIA Corp. | 4.84% |
| Apple, Inc. | 4.55% |
| Lumentum Holdings, Inc. | 4.53% |
| Western Digital Corp. | 4.38% |
| Ciena Corp. | 4.27% |
| Seagate Technology Holdings PLC | 4.14% |
| Aehr Test Systems | 3.69% |
| Ondas, Inc. | 3.29% |
| Navitas Semiconductor Corp. | 3.07% |
| * Excluding money market fund holdings, if any. |
What Were The Fund Costs For The Last Year ?
(Based on a hypothetical $10,000 investment)
| Fund | Costs of a $10,000 investment | Costs paid as a percentage of a $10,000 investment |
| Invesco BuyBack AchieversTM ETF | $70 | 0.62% |
How Did The Fund Perform During The Period?
• During the fiscal year ended April 30, 2026, U.S. equities experienced positive returns for the majority of the year, although geopolitical conflict towards the end of the year sparked bouts of increased volatility. During the period, the Fund underperformed the S&P 500® Index primarily due to its underweight allocation to the information technology sector and overweight allocation to the financials sector.
• The Fund is passively managed and seeks to track the investment results (before fees and expenses) of the Nasdaq US BuyBack AchieversTM Index (the “Index”). The Fund generally will invest at least 90% of its total assets in securities that comprise the Index.
• For the fiscal year ended April 30, 2026, the Fund's performance, on a net asset value ("NAV") basis, 26.97%, differed from the return of the Index, 27.79%, primarily due to fees and expenses incurred by the Fund during the period, which was compounded during a period of strong performance.
What contributed to performance?
Sector Allocations | Consumer discretionary sector, followed by the industrials and energy sectors, respectively.
Positions | Caterpillar, Inc., an industrials company (no longer held at fiscal year-end), and Marathon Petroleum Corp., an energy company.
What detracted from performance?
Sector Allocations | No sectors detracted from the Fund's performance during the period.
Positions | Fiserv, Inc., a financials company, and Adobe, Inc., an information technology company.
How Has The Fund Historically Performed?
Growth of $10,000 Investment
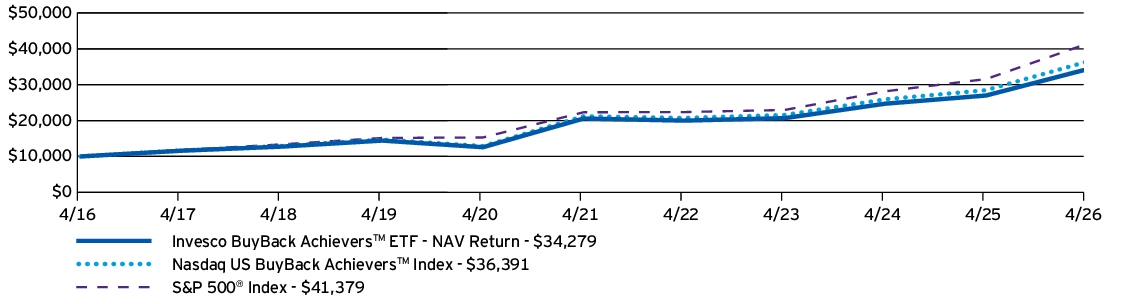
AVERAGE ANNUAL TOTAL RETURNS |
1 Year |
5 Years |
10 Years |
| Invesco BuyBack AchieversTM ETF — NAV Return | 26.97% | 10.76% | 13.11% |
| Nasdaq US BuyBack Achievers™ Index | 27.79% | 11.41% | 13.79% |
| S&P 500® Index | 31.05% | 13.14% | 15.26% |
Performance figures do not reflect deduction of taxes a shareholder would pay on Fund distributions or sale of Fund shares.
What Are Key Statistics About The Fund?
(as of April 30, 2026)
| Fund net assets | $1,648,435,473 |
| Total number of portfolio holdings | 229 |
| Total advisory fees paid | $7,397,116 |
| Portfolio turnover rate | 95% |
What Comprised The Fund's Holdings?
(as of April 30, 2026)
Top ten holdings*
(% of net assets)
(% of net assets)
| Citigroup, Inc. | 5.35% |
| Wells Fargo & Co. | 4.90% |
| Adobe, Inc. | 4.79% |
| Johnson Controls International PLC | 4.62% |
| HCA Healthcare, Inc. | 3.55% |
| Marathon Petroleum Corp. | 3.48% |
| General Motors Co. | 3.35% |
| Aflac, Inc. | 2.69% |
| PayPal Holdings, Inc. | 2.41% |
| Carrier Global Corp. | 2.25% |
| * Excluding money market fund holdings, if any. |
Sector allocation
(% of net assets)
(% of net assets)
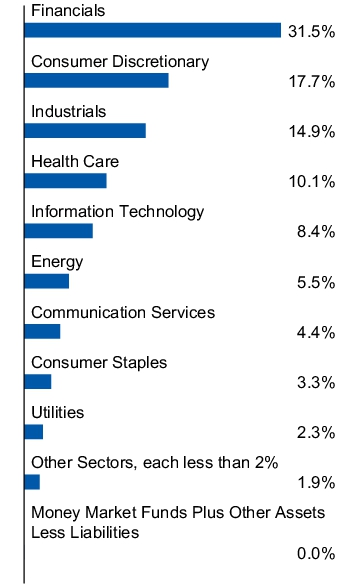
Top ten holdings*
(% of net assets)
(% of net assets)
| Citigroup, Inc. | 5.35% |
| Wells Fargo & Co. | 4.90% |
| Adobe, Inc. | 4.79% |
| Johnson Controls International PLC | 4.62% |
| HCA Healthcare, Inc. | 3.55% |
| Marathon Petroleum Corp. | 3.48% |
| General Motors Co. | 3.35% |
| Aflac, Inc. | 2.69% |
| PayPal Holdings, Inc. | 2.41% |
| Carrier Global Corp. | 2.25% |
| * Excluding money market fund holdings, if any. |
What Were The Fund Costs For The Last Year ?
(Based on a hypothetical $10,000 investment)
| Fund | Costs of a $10,000 investment | Costs paid as a percentage of a $10,000 investment |
| Invesco RAFI US 1500 Small-Mid ETF | $43 | 0.36% |
How Did The Fund Perform During The Period?
• During the fiscal year ended April 30, 2026, U.S. small- and mid-cap equities delivered solid performance, supported by broader investor sentiment and shifting rate expectations. The Fund underperformed the Russell 2000® Index due primarily to individual security selection in the industrials sector.
• The Fund is passively managed and seeks to track the investment results (before fees and expenses) of the RAFITM Fundamental Select US 1500 Index (the “Index”). The Fund generally will invest at least 90% of its total assets in securities that comprise the Index.
• For the fiscal year ended April 30, 2026, the Fund's performance, on a net asset value ("NAV") basis, 38.69%, differed from the return of the Index, 39.08%, primarily due to fees and expenses incurred by the Fund during the period.
What contributed to performance?
Sector Allocations | Industrials sector, followed by the information technology and health care sectors, respectively.
Positions | Vistance Networks, Inc., an information technology company (no longer held at fiscal year-end), and AppLovin Corp., Class A, an information technology company.
What detracted from performance?
Sector Allocations | Consumer staples sector.
Positions | HubSpot, Inc., an information technology company, and Lucid Group, Inc., a consumer discretionary company.
How Has The Fund Historically Performed?
Growth of $10,000 Investment
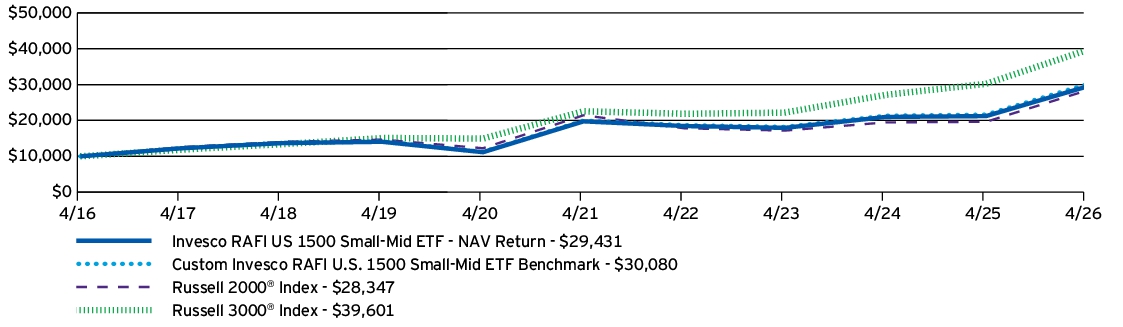
AVERAGE ANNUAL TOTAL RETURNS |
1 Year |
5 Years |
10 Years |
| Invesco RAFI US 1500 Small-Mid ETF — NAV Return | 38.69% | 8.30% | 11.40% |
| Custom Invesco RAFI U.S. 1500 Small-Mid ETF Benchmark | 39.08% | 8.55% | 11.64% |
| Russell 3000® Index | 31.01% | 11.91% | 14.75% |
| Russell 2000® Index | 44.41% | 5.75% | 10.98% |
Performance figures do not reflect deduction of taxes a shareholder would pay on Fund distributions or sale of Fund shares.
What Are Key Statistics About The Fund?
(as of April 30, 2026)
| Fund net assets | $2,878,446,318 |
| Total number of portfolio holdings | 1,545 |
| Total advisory fees paid | $7,403,557 |
| Portfolio turnover rate | 35% |
What Comprised The Fund's Holdings?
(as of April 30, 2026)
Top ten holdings*
(% of net assets)
(% of net assets)
| TTM Technologies, Inc. | 0.59% |
| Opendoor Technologies, Inc. | 0.57% |
| Viavi Solutions, Inc. | 0.57% |
| Advanced Energy Industries, Inc. | 0.53% |
| MaxLinear, Inc. | 0.51% |
| Onto Innovation, Inc. | 0.48% |
| FormFactor, Inc. | 0.44% |
| Roivant Sciences Ltd. | 0.44% |
| Crescent Energy Co., Class A | 0.42% |
| Par Pacific Holdings, Inc. | 0.42% |
| * Excluding money market fund holdings, if any. |
Sector allocation
(% of net assets)
(% of net assets)
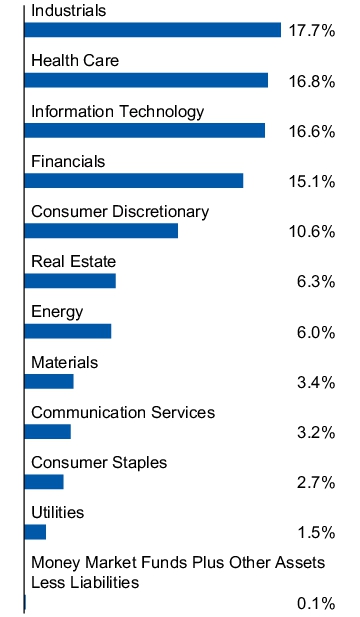
Top ten holdings*
(% of net assets)
(% of net assets)
| TTM Technologies, Inc. | 0.59% |
| Opendoor Technologies, Inc. | 0.57% |
| Viavi Solutions, Inc. | 0.57% |
| Advanced Energy Industries, Inc. | 0.53% |
| MaxLinear, Inc. | 0.51% |
| Onto Innovation, Inc. | 0.48% |
| FormFactor, Inc. | 0.44% |
| Roivant Sciences Ltd. | 0.44% |
| Crescent Energy Co., Class A | 0.42% |
| Par Pacific Holdings, Inc. | 0.42% |
| * Excluding money market fund holdings, if any. |
What Were The Fund Costs For The Last Year ?
(Based on a hypothetical $10,000 investment)
| Fund | Costs of a $10,000 investment | Costs paid as a percentage of a $10,000 investment |
| Invesco MSCI Sustainable Future ETF | $74 | 0.65%† |
|
†
|
Reflects fee waivers and/or expense reimbursements, without which expenses would have been higher.
|
How Did The Fund Perform During The Period?
• During the fiscal year ended April 30, 2026, sustainability-oriented themes faced headwinds from geopolitical conflict, which contributed to elevated traditional energy pricing. The Fund underperformed broader global equities primarily due to security selection within the automobiles and semiconductors & semiconductor equipment industries.
• The Fund is passively managed and seeks to track the investment results (before fees and expenses) of the MSCI Global Environment Select Index (the “Index”). The Fund generally will invest at least 90% of its total assets in securities that comprise the Index.
• For the fiscal year ended April 30, 2026, the Fund's performance, on a net asset value ("NAV") basis, 28.44%, differed from the return of the Index, 28.40%, primarily due to positive impact from foreign valuation and income received from the securities lending program in which the Fund participates, partially offset by fees and expenses incurred by the Fund during the period.
What contributed to performance?
Industry Allocations | Electrical equipment industry, followed by the semiconductors & semiconductor equipment and renewable electricity producers industries, respectively.
Positions | NVIDIA Corp., a semiconductors & semiconductor equipment company, and Vestas Wind Systems A/S, an electrical equipment company.
What detracted from performance?
Industry Allocations | Electronic equipment instruments & components industry, followed by the office REITs and machinery industries, respectively.
Positions | Li Auto, Inc., A Shares, an automobiles company, and BYD Co. Ltd., H Shares, an automobiles company.
How Has The Fund Historically Performed?
Growth of $10,000 Investment
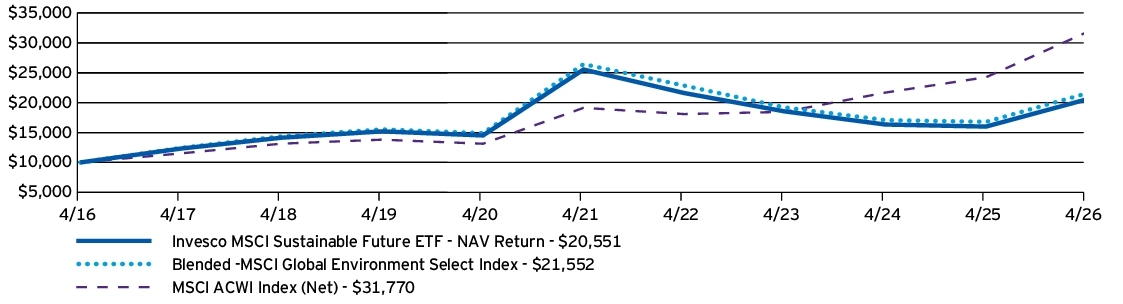
AVERAGE ANNUAL TOTAL RETURNS |
1 Year |
5 Years |
10 Years |
| Invesco MSCI Sustainable Future ETF — NAV Return | 28.44% | -4.26% | 7.47% |
| Blended -MSCI Global Environment Select Index | 28.40% | -4.01% | 7.98% |
| MSCI ACWI Index (Net) | 31.00% | 10.68% | 12.25% |
Performance figures do not reflect deduction of taxes a shareholder would pay on Fund distributions or sale of Fund shares.
What Are Key Statistics About The Fund?
(as of April 30, 2026)
| Fund net assets | $147,094,859 |
| Total number of portfolio holdings | 163 |
| Total advisory fees paid | $668,302 |
| Portfolio turnover rate | 23% |
What Comprised The Fund's Holdings?
(as of April 30, 2026)
Top ten holdings*
(% of net assets)
(% of net assets)
| Digital Realty Trust, Inc. | 5.53% |
| NVIDIA Corp. | 5.34% |
| BYD Co. Ltd., H Shares | 5.26% |
| Vestas Wind Systems A/S | 4.67% |
| Tesla, Inc. | 4.61% |
| First Solar, Inc. | 3.10% |
| Nextpower, Inc., Class A | 2.66% |
| Contemporary Amperex Technology Co. Ltd., A Shares | 2.55% |
| Unibail-Rodamco-Westfield | 2.22% |
| LG Energy Solution Ltd. | 2.21% |
| * Excluding money market fund holdings, if any. |
Industry allocation
(% of net assets)
(% of net assets)
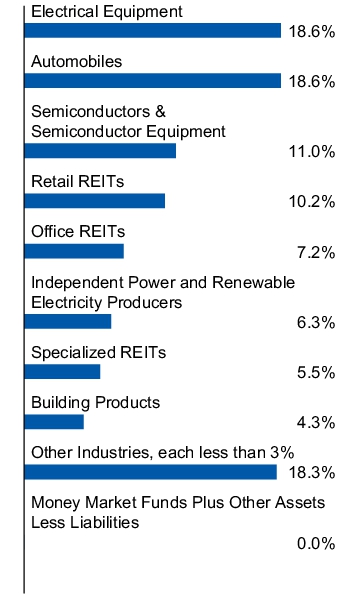
Top ten holdings*
(% of net assets)
(% of net assets)
| Digital Realty Trust, Inc. | 5.53% |
| NVIDIA Corp. | 5.34% |
| BYD Co. Ltd., H Shares | 5.26% |
| Vestas Wind Systems A/S | 4.67% |
| Tesla, Inc. | 4.61% |
| First Solar, Inc. | 3.10% |
| Nextpower, Inc., Class A | 2.66% |
| Contemporary Amperex Technology Co. Ltd., A Shares | 2.55% |
| Unibail-Rodamco-Westfield | 2.22% |
| LG Energy Solution Ltd. | 2.21% |
| * Excluding money market fund holdings, if any. |
What Were The Fund Costs For The Last Year ?
(Based on a hypothetical $10,000 investment)
| Fund | Costs of a $10,000 investment | Costs paid as a percentage of a $10,000 investment |
| Invesco Dorsey Wright Basic Materials Momentum ETF | $77 | 0.60%† |
|
†
|
Reflects fee waivers and/or expense reimbursements, without which expenses would have been higher.
|
How Did The Fund Perform During The Period?
• During the fiscal year ended April 30, 2026, U.S. equities experienced positive returns for the majority of the year, although geopolitical conflict towards the end of the year sparked bouts of increased volatility. During the period, the materials sector underperformed the broader market. The Fund's momentum methodology led to an overweight in aerospace & defense stocks, which created a performance tailwind compared to the S&P 500® Materials Index.
• The Fund is passively managed and seeks to track the investment results (before fees and expenses) of the Dorsey Wright Basic Materials Technical LeadersTM Index (the “Index”). The Fund generally will invest at least 90% of its total assets in securities that comprise the Index.
• For the fiscal year ended April 30, 2026, the Fund's performance, on a net asset value ("NAV") basis, 56.23%, differed from the return of the Index, 57.18%, primarily due to fees and expenses incurred by the Fund during the period, which was compounded during a period of strong performance.
What contributed to performance?
Sub-Industry Allocations | Gold sub-industry, followed by the specialty chemicals and aerospace & defense sub-industries, respectively.
Positions | Coeur Mining, Inc., a gold company, and Carpenter Technology Corp., an aerospace & defense company.
What detracted from performance?
Sub-Industry Allocations | Paper products sub-industry, followed by the metal glass & plastic containers and paper & plastic packaging products & materials sub-industries, respectively.
Positions | PureCycle Technologies Inc., a commodity chemicals company (no longer held at fiscal year-end), and Ivanhoe Electric Inc., a diversified metals & mining company (no longer held at fiscal year-end).
How Has The Fund Historically Performed?
Growth of $10,000 Investment
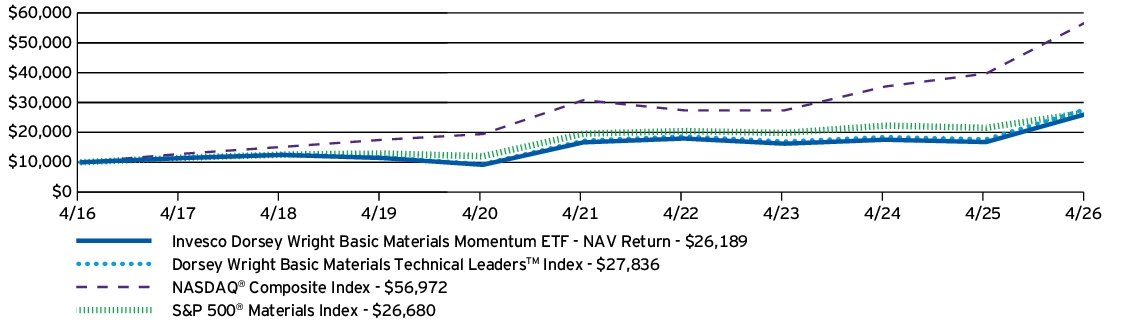
AVERAGE ANNUAL TOTAL RETURNS |
1 Year |
5 Years |
10 Years |
| Invesco Dorsey Wright Basic Materials Momentum ETF — NAV Return | 56.23% | 9.45% | 10.11% |
| Dorsey Wright Basic Materials Technical Leaders™ Index | 57.18% | 10.05% | 10.78% |
| NASDAQ® Composite Index | 43.57% | 13.09% | 19.01% |
| S&P 500® Materials Index | 23.85% | 6.37% | 10.31% |
Performance figures do not reflect deduction of taxes a shareholder would pay on Fund distributions or sale of Fund shares.
What Are Key Statistics About The Fund?
(as of April 30, 2026)
| Fund net assets | $102,698,021 |
| Total number of portfolio holdings | 45 |
| Total advisory fees paid | $218,241 |
| Portfolio turnover rate | 91% |
What Comprised The Fund's Holdings?
(as of April 30, 2026)
Top ten holdings*
(% of net assets)
(% of net assets)
| Carpenter Technology Corp. | 6.45% |
| CF Industries Holdings, Inc. | 5.32% |
| ATI, Inc. | 4.93% |
| Alcoa Corp. | 3.92% |
| USA Rare Earth, Inc. | 3.83% |
| Steel Dynamics, Inc. | 3.70% |
| Corteva, Inc. | 3.46% |
| Hecla Mining Co. | 3.12% |
| Albemarle Corp. | 3.03% |
| Solstice Advanced Materials, Inc. | 3.01% |
| * Excluding money market fund holdings, if any. |
Sub-industry allocation
(% of net assets)
(% of net assets)
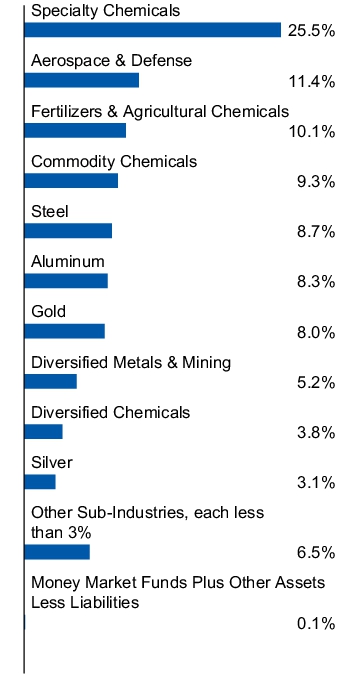
Top ten holdings*
(% of net assets)
(% of net assets)
| Carpenter Technology Corp. | 6.45% |
| CF Industries Holdings, Inc. | 5.32% |
| ATI, Inc. | 4.93% |
| Alcoa Corp. | 3.92% |
| USA Rare Earth, Inc. | 3.83% |
| Steel Dynamics, Inc. | 3.70% |
| Corteva, Inc. | 3.46% |
| Hecla Mining Co. | 3.12% |
| Albemarle Corp. | 3.03% |
| Solstice Advanced Materials, Inc. | 3.01% |
| * Excluding money market fund holdings, if any. |
What Were The Fund Costs For The Last Year ?
(Based on a hypothetical $10,000 investment)
| Fund | Costs of a $10,000 investment | Costs paid as a percentage of a $10,000 investment |
| Invesco Dorsey Wright Consumer Cyclicals Momentum ETF | $65 | 0.60%† |
|
†
|
Reflects fee waivers and/or expense reimbursements, without which expenses would have been higher.
|
How Did The Fund Perform During The Period?
• During the fiscal year ended April 30, 2026, U.S. equities experienced positive returns for the majority of the year, although geopolitical conflict towards the end of the year sparked bouts of increased volatility. During the period, the consumer cyclicals sector underperformed the broader market. The Fund's momentum methodology led to an underweight in broadline retail stocks, which created a performance headwind compared to the S&P 500® Consumer Discretionary Index.
• The Fund is passively managed and seeks to track the investment results (before fees and expenses) of the Dorsey Wright Consumer Cyclicals Technical LeadersTM Index (the “Index”). The Fund generally will invest at least 90% of its total assets in securities that comprise the Index.
• For the fiscal year ended April 30, 2026, the Fund's performance, on a net asset value ("NAV") basis, 17.30%, differed from the return of the Index, 17.93%, primarily due to fees and expenses incurred by the Fund during the period.
What contributed to performance?
Sub-Industry Allocations | Apparel, accessories & luxury goods sub-industry, followed by the movies & entertainment and hotels resorts & cruise lines sub-industries, respectively.
Positions | Tapestry, Inc., an apparel, accessories & luxury goods company, and EchoStar Corp., Class A, a cable & satellite company (no longer held at fiscal year-end).
What detracted from performance?
Sub-Industry Allocations | Restaurants sub-industry, followed by the home furnishing retail and apparel retail sub-industries, respectively.
Positions | American Eagle Outfitters, Inc., an apparel retail company (no longer held at fiscal year-end), and Brinker International, Inc., a restaurants company (no longer held at fiscal year-end).
How Has The Fund Historically Performed?
Growth of $10,000 Investment
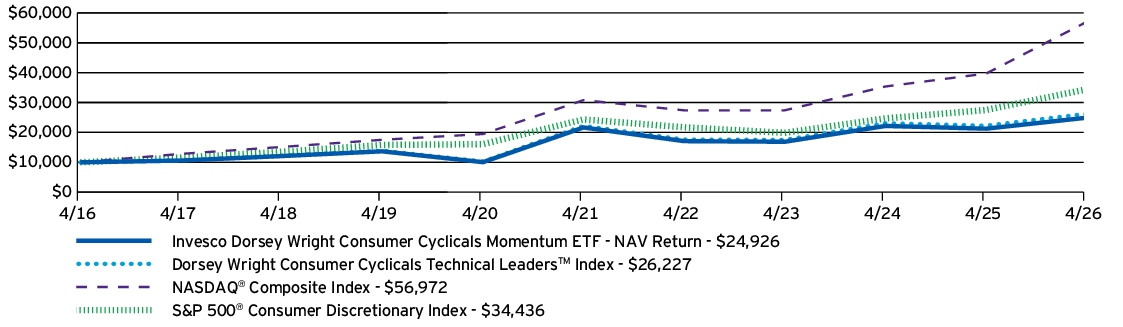
AVERAGE ANNUAL TOTAL RETURNS |
1 Year |
5 Years |
10 Years |
| Invesco Dorsey Wright Consumer Cyclicals Momentum ETF — NAV Return | 17.30% | 2.86% | 9.56% |
| Dorsey Wright Consumer Cyclicals Technical Leaders™ Index | 17.93% | 3.42% | 10.12% |
| NASDAQ® Composite Index | 43.57% | 13.09% | 19.01% |
| S&P 500® Consumer Discretionary Index | 25.23% | 7.19% | 13.16% |
Performance figures do not reflect deduction of taxes a shareholder would pay on Fund distributions or sale of Fund shares.
What Are Key Statistics About The Fund?
(as of April 30, 2026)
| Fund net assets | $23,276,106 |
| Total number of portfolio holdings | 48 |
| Total advisory fees paid | $41,583 |
| Portfolio turnover rate | 187% |
What Comprised The Fund's Holdings?
(as of April 30, 2026)
Top ten holdings*
(% of net assets)
(% of net assets)
| Tapestry, Inc. | 4.08% |
| Ralph Lauren Corp. | 3.56% |
| Netflix, Inc. | 3.54% |
| Walmart, Inc. | 3.53% |
| Cardinal Health, Inc. | 3.51% |
| Hilton Worldwide Holdings, Inc. | 3.40% |
| Marriott International, Inc., Class A | 3.37% |
| McKesson Corp. | 3.34% |
| Five Below, Inc. | 3.24% |
| Williams-Sonoma, Inc. | 2.98% |
| * Excluding money market fund holdings, if any. |
Sub-industry allocation
(% of net assets)
(% of net assets)
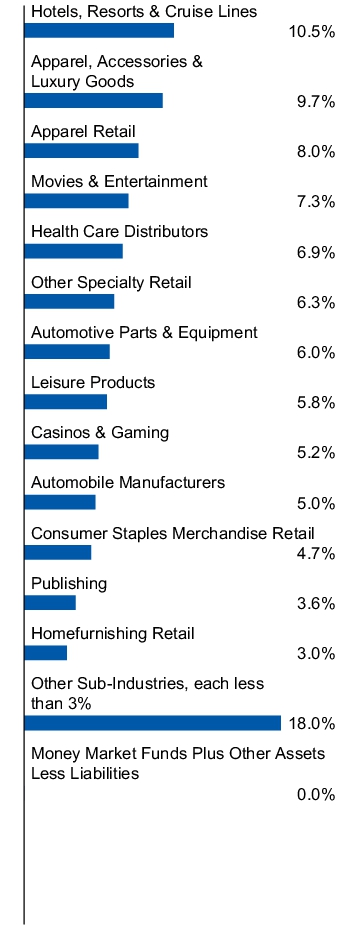
Top ten holdings*
(% of net assets)
(% of net assets)
| Tapestry, Inc. | 4.08% |
| Ralph Lauren Corp. | 3.56% |
| Netflix, Inc. | 3.54% |
| Walmart, Inc. | 3.53% |
| Cardinal Health, Inc. | 3.51% |
| Hilton Worldwide Holdings, Inc. | 3.40% |
| Marriott International, Inc., Class A | 3.37% |
| McKesson Corp. | 3.34% |
| Five Below, Inc. | 3.24% |
| Williams-Sonoma, Inc. | 2.98% |
| * Excluding money market fund holdings, if any. |
What Were The Fund Costs For The Last Year ?
(Based on a hypothetical $10,000 investment)
| Fund | Costs of a $10,000 investment | Costs paid as a percentage of a $10,000 investment |
| Invesco Dorsey Wright Consumer Staples Momentum ETF | $61 | 0.60%† |
|
†
|
Reflects fee waivers and/or expense reimbursements, without which expenses would have been higher.
|
How Did The Fund Perform During The Period?
• During the fiscal year ended April 30, 2026, U.S. equities experienced positive returns for the majority of the year, although geopolitical conflict towards the end of the year sparked bouts of increased volatility. During the period, the consumer staples sector underperformed the broader market. The Fund's momentum methodology led to an underweight in merchandise retail stocks, which created a performance headwind compared to the S&P 500® Consumer Staples Index.
• The Fund is passively managed and seeks to track the investment results (before fees and expenses) of the Dorsey Wright Consumer Staples Technical LeadersTM Index (the “Index”). The Fund generally will invest at least 90% of its total assets in securities that comprise the Index.
• For the fiscal year ended April 30, 2026, the Fund's performance, on a net asset value ("NAV") basis, 3.63%, differed from the return of the Index, 4.20%, primarily due to fees and expenses incurred by the Fund during the period.
What contributed to performance?
Sub-Industry Allocations | Food distributors sub-industry, followed by the agricultural products & services and tobacco sub-industries, respectively.
Positions | Casey's General Stores, Inc., a food retail company, and EZCORP, Inc., Class A, a consumer finance company.
What detracted from performance?
Sub-Industry Allocations | Personal care products sub-industry, followed by the packaged foods & meats and merchandise retail sub-industries, respectively.
Positions | e.l.f. Beauty, Inc., a personal care products company (no longer held at fiscal year-end), and Sprouts Farmers Market, Inc., a food retail company.
How Has The Fund Historically Performed?
Growth of $10,000 Investment
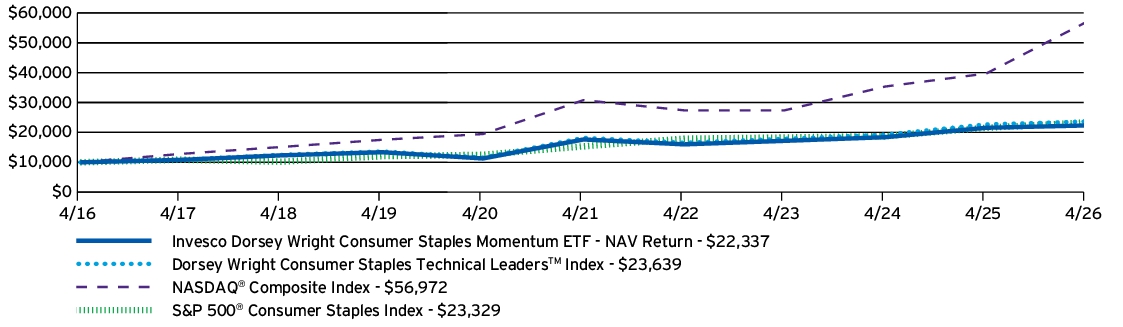
AVERAGE ANNUAL TOTAL RETURNS |
1 Year |
5 Years |
10 Years |
| Invesco Dorsey Wright Consumer Staples Momentum ETF — NAV Return | 3.63% | 4.83% | 8.37% |
| Dorsey Wright Consumer Staples Technical Leaders™ Index | 4.20% | 5.39% | 8.98% |
| NASDAQ® Composite Index | 43.57% | 13.09% | 19.01% |
| S&P 500® Consumer Staples Index | 8.27% | 8.72% | 8.84% |
Performance figures do not reflect deduction of taxes a shareholder would pay on Fund distributions or sale of Fund shares.
What Are Key Statistics About The Fund?
(as of April 30, 2026)
| Fund net assets | $84,076,824 |
| Total number of portfolio holdings | 50 |
| Total advisory fees paid | $314,882 |
| Portfolio turnover rate | 80% |
What Comprised The Fund's Holdings?
(as of April 30, 2026)
Top ten holdings*
(% of net assets)
(% of net assets)
| Casey's General Stores, Inc. | 6.12% |
| Costco Wholesale Corp. | 5.38% |
| US Foods Holding Corp. | 4.95% |
| Church & Dwight Co., Inc. | 4.64% |
| Performance Food Group Co. | 3.98% |
| Kroger Co. (The) | 3.76% |
| Darling Ingredients, Inc. | 3.54% |
| Philip Morris International, Inc. | 3.46% |
| Altria Group, Inc. | 3.35% |
| Monster Beverage Corp. | 3.14% |
| * Excluding money market fund holdings, if any. |
Sub-industry allocation
(% of net assets)
(% of net assets)
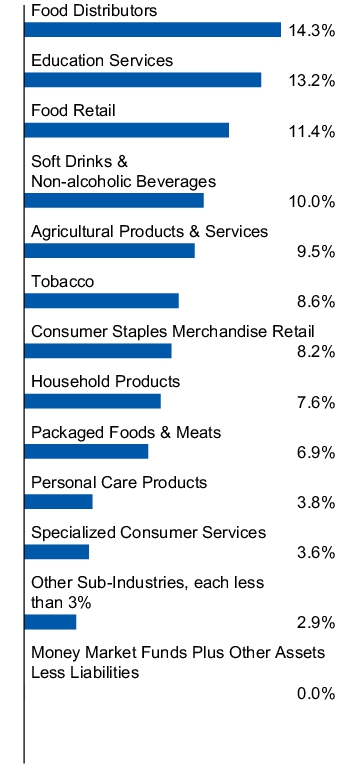
Top ten holdings*
(% of net assets)
(% of net assets)
| Casey's General Stores, Inc. | 6.12% |
| Costco Wholesale Corp. | 5.38% |
| US Foods Holding Corp. | 4.95% |
| Church & Dwight Co., Inc. | 4.64% |
| Performance Food Group Co. | 3.98% |
| Kroger Co. (The) | 3.76% |
| Darling Ingredients, Inc. | 3.54% |
| Philip Morris International, Inc. | 3.46% |
| Altria Group, Inc. | 3.35% |
| Monster Beverage Corp. | 3.14% |
| * Excluding money market fund holdings, if any. |
What Were The Fund Costs For The Last Year ?
(Based on a hypothetical $10,000 investment)
| Fund | Costs of a $10,000 investment | Costs paid as a percentage of a $10,000 investment |
| Invesco Dorsey Wright Momentum ETF | $73 | 0.62% |
How Did The Fund Perform During The Period?
• During the fiscal year ended April 30, 2026, U.S. equities experienced positive returns for the majority of the year, although geopolitical conflict towards the end of the year sparked bouts of increased volatility. The Fund's momentum methodology led to security selection which generally outperformed the broader stock market with certain information technology holdings performing well relative to the Russell 3000® Growth Index.
• The Fund is passively managed and seeks to track the investment results (before fees and expenses) of the Dorsey Wright Technical LeadersTM Index (the “Index”). The Fund generally will invest at least 90% of its total assets in securities that comprise the Index.
• For the fiscal year ended April 30, 2026, the Fund's performance, on a net asset value ("NAV") basis, 36.64%, differed from the return of the Index, 37.51%, primarily due to fees and expenses incurred by the Fund during the period, which was compounded during a period of strong performance.
What contributed to performance?
Sector Allocations | Industrials sector, followed by the information technology and financials sectors, respectively.
Positions | Comfort Systems USA, Inc., an industrials company, and AppLovin Corp., Class A, an information technology company (no longer held at fiscal year-end).
What detracted from performance?
Sector Allocations | Consumer staples sector, followed by the utilities sector.
Positions | Copart, Inc., an industrials company (no longer held at fiscal year-end), and Hims & Hers Health, Inc., a health care company (no longer held at fiscal year-end).
How Has The Fund Historically Performed?
Growth of $10,000 Investment
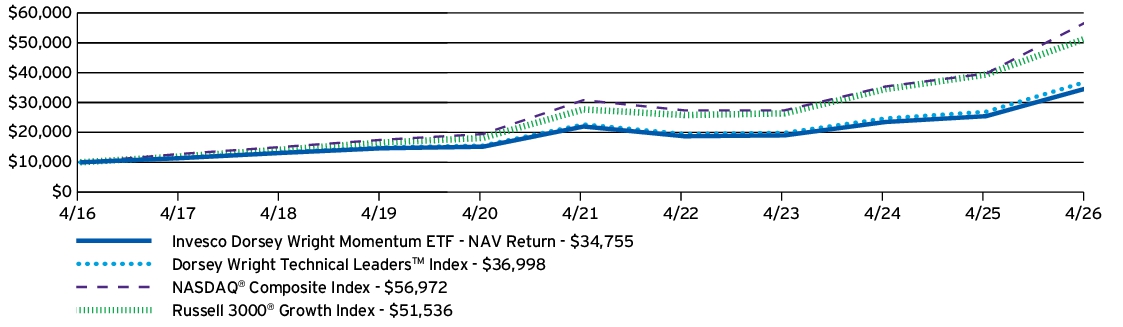
AVERAGE ANNUAL TOTAL RETURNS |
1 Year |
5 Years |
10 Years |
| Invesco Dorsey Wright Momentum ETF — NAV Return | 36.64% | 9.61% | 13.27% |
| Dorsey Wright Technical Leaders™ Index | 37.51% | 10.29% | 13.98% |
| NASDAQ® Composite Index | 43.57% | 13.09% | 19.01% |
| Russell 3000® Growth Index | 30.98% | 13.23% | 17.82% |
Performance figures do not reflect deduction of taxes a shareholder would pay on Fund distributions or sale of Fund shares.
What Are Key Statistics About The Fund?
(as of April 30, 2026)
| Fund net assets | $1,469,366,033 |
| Total number of portfolio holdings | 103 |
| Total advisory fees paid | $6,607,809 |
| Portfolio turnover rate | 154% |
What Comprised The Fund's Holdings?
(as of April 30, 2026)
Top ten holdings*
(% of net assets)
(% of net assets)
| Comfort Systems USA, Inc. | 3.20% |
| Apple, Inc. | 2.98% |
| Amphenol Corp., Class A | 2.95% |
| Targa Resources Corp. | 2.62% |
| Quanta Services, Inc. | 2.43% |
| Western Digital Corp. | 2.36% |
| Carpenter Technology Corp. | 2.22% |
| ATI, Inc. | 2.07% |
| Ciena Corp. | 2.03% |
| W.W. Grainger, Inc. | 1.99% |
| * Excluding money market fund holdings, if any. |
Sector allocation
(% of net assets)
(% of net assets)
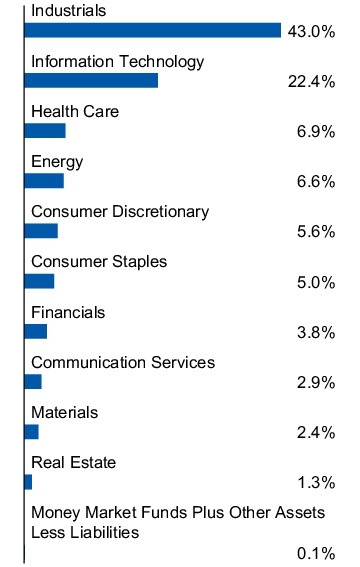
Top ten holdings*
(% of net assets)
(% of net assets)
| Comfort Systems USA, Inc. | 3.20% |
| Apple, Inc. | 2.98% |
| Amphenol Corp., Class A | 2.95% |
| Targa Resources Corp. | 2.62% |
| Quanta Services, Inc. | 2.43% |
| Western Digital Corp. | 2.36% |
| Carpenter Technology Corp. | 2.22% |
| ATI, Inc. | 2.07% |
| Ciena Corp. | 2.03% |
| W.W. Grainger, Inc. | 1.99% |
| * Excluding money market fund holdings, if any. |
What Were The Fund Costs For The Last Year ?
(Based on a hypothetical $10,000 investment)
| Fund | Costs of a $10,000 investment | Costs paid as a percentage of a $10,000 investment |
| Invesco Financial Preferred ETF | $58 | 0.56% |
How Did The Fund Perform During The Period?
• During the fiscal year ended April 30, 2026, financial issuers benefited from strong fundamentals. Lower yields also aided duration instruments and preferred securities with fixed rates. Because the Fund holds the vast majority of its portfolio in financial preferred stocks, it benefited from this broader market environment.
• The Fund is passively managed and seeks to track the investment results (before fees and expenses) of the ICE Exchange-Listed Fixed Rate Financial Preferred Securities Index (the “Index”). The Fund generally will invest at least 90% of its total assets in securities that comprise the Index.
• For the fiscal year ended April 30, 2026, the Fund's performance, on a net asset value ("NAV") basis, 6.56%, differed from the return of the Index, 7.16%, primarily due to fees and expenses incurred by the Fund during the period.
What contributed to performance?
Industry Allocations | Banks industry, followed by the capital markets and insurance industries, respectively.
Positions | Synchrony Financial, Series A, Pfd., 5.625% coupon, a consumer finance company, and JPMorgan Chase & Co., Series EE, Pfd., 6.00% coupon, a banks company.
What detracted from performance?
Industry Allocations | No industry detracted from the Fund's performance during the period.
Positions | Brighthouse Financial, Inc., Series C, Pfd., 5.375% coupon, an insurance company, and Brighthouse Financial, Inc., Series A, Pfd., 6.60% coupon, an insurance company.
How Has The Fund Historically Performed?
Growth of $10,000 Investment
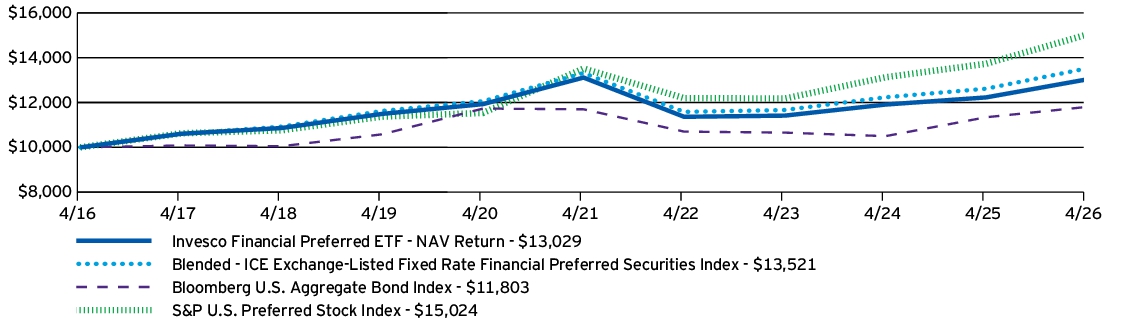
AVERAGE ANNUAL TOTAL RETURNS |
1 Year |
5 Years |
10 Years |
| Invesco Financial Preferred ETF — NAV Return | 6.56% | -0.13% | 2.68% |
| Blended - ICE Exchange-Listed Fixed Rate Financial Preferred Securities Index | 7.16% | 0.31% | 3.06% |
| Bloomberg U.S. Aggregate Bond Index | 4.06% | 0.18% | 1.67% |
| S&P U.S. Preferred Stock Index | 9.42% | 2.14% | 4.15% |
Performance figures do not reflect deduction of taxes a shareholder would pay on Fund distributions or sale of Fund shares.
What Are Key Statistics About The Fund?
(as of April 30, 2026)
| Fund net assets | $718,541,316 |
| Total number of portfolio holdings | 102 |
| Total advisory fees paid | $3,848,674 |
| Portfolio turnover rate | 14% |
What Comprised The Fund's Holdings?
(as of April 30, 2026)
Top ten holdings*
(% of net assets)
(% of net assets)
| JPMorgan Chase & Co., Series EE, Pfd., 6.00% | 2.76% |
| JPMorgan Chase & Co., Series DD, Pfd., 5.75% | 2.48% |
| Wells Fargo & Co., Series Z, Pfd., 4.75% | 2.26% |
| JPMorgan Chase & Co., Series MM, Pfd., 4.20% | 2.13% |
| JPMorgan Chase & Co., Series LL, Pfd., 4.63% | 2.12% |
| Bank of America Corp., Series GG, Pfd., 6.00% | 2.01% |
| Allstate Corp. (The), Series H, Pfd., 5.10% | 1.86% |
| Capital One Financial Corp., Series I, Pfd., 5.00% | 1.83% |
| Bank of America Corp., Series KK, Pfd., 5.38% | 1.80% |
| JPMorgan Chase & Co., Series JJ, Pfd., 4.55% | 1.69% |
| * Excluding money market fund holdings, if any. |
Industry allocation
(% of net assets)
(% of net assets)
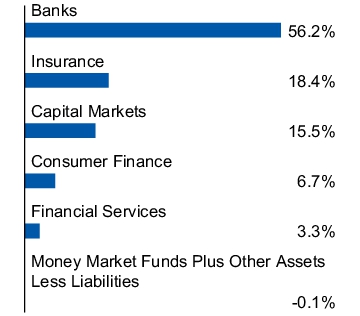
Top ten holdings*
(% of net assets)
(% of net assets)
| JPMorgan Chase & Co., Series EE, Pfd., 6.00% | 2.76% |
| JPMorgan Chase & Co., Series DD, Pfd., 5.75% | 2.48% |
| Wells Fargo & Co., Series Z, Pfd., 4.75% | 2.26% |
| JPMorgan Chase & Co., Series MM, Pfd., 4.20% | 2.13% |
| JPMorgan Chase & Co., Series LL, Pfd., 4.63% | 2.12% |
| Bank of America Corp., Series GG, Pfd., 6.00% | 2.01% |
| Allstate Corp. (The), Series H, Pfd., 5.10% | 1.86% |
| Capital One Financial Corp., Series I, Pfd., 5.00% | 1.83% |
| Bank of America Corp., Series KK, Pfd., 5.38% | 1.80% |
| JPMorgan Chase & Co., Series JJ, Pfd., 4.55% | 1.69% |
| * Excluding money market fund holdings, if any. |
What Were The Fund Costs For The Last Year ?
(Based on a hypothetical $10,000 investment)
| Fund | Costs of a $10,000 investment | Costs paid as a percentage of a $10,000 investment |
| Invesco Global Listed Private Equity ETF | $66 | 0.66% |
How Did The Fund Perform During The Period?
• During the fiscal year ended April 30, 2026, U.S. equities experienced positive returns for the majority of the year, although geopolitical conflict towards the end of the year sparked bouts of increased volatility. During the period, global listed private equity companies underperformed the broader market. The Fund's stock selection methodology within the capital markets industry created a performance headwind relative to the MSCI ACWI Index.
• The Fund is passively managed and seeks to track the investment results (before fees and expenses) of the Red Rocks Global Listed Private Equity Index (the “Index”). The Fund generally will invest at least 90% of its total assets in securities (including American depositary receipts ("ADRs") and global depositary receipts ("GDRs")) that comprise the Index.
• For the fiscal year ended April 30, 2026, the Fund's performance, on a net asset value ("NAV") basis, 0.97%, differed from the return of the Index, 1.64%, primarily due to fees and expenses incurred by the Fund during the period.
What contributed to performance?
Industry Allocations | Consumer staples distribution & retail industry, followed by the financial services and industrial conglomerates industries, respectively.
Positions | HAL Trust, a financial services company, and Carlyle Group, Inc. (The), a capital markets company.
What detracted from performance?
Industry Allocations | Capital markets industry, followed by the IT services industry.
Positions | 3i Group PLC, a capital markets company, and Blue Owl Capital, Inc., a capital markets company.
How Has The Fund Historically Performed?
Growth of $10,000 Investment
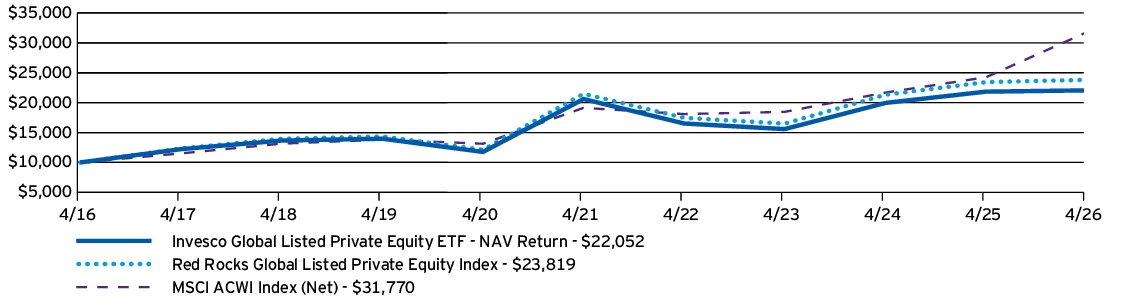
AVERAGE ANNUAL TOTAL RETURNS |
1 Year |
5 Years |
10 Years |
| Invesco Global Listed Private Equity ETF — NAV Return | 0.97% | 1.37% | 8.23% |
| Red Rocks Global Listed Private Equity Index | 1.64% | 2.09% | 9.07% |
| MSCI ACWI Index (Net) | 31.00% | 10.68% | 12.25% |
Performance figures do not reflect deduction of taxes a shareholder would pay on Fund distributions or sale of Fund shares.
What Are Key Statistics About The Fund?
(as of April 30, 2026)
| Fund net assets | $254,633,174 |
| Total number of portfolio holdings | 65 |
| Total advisory fees paid | $1,484,107 |
| Portfolio turnover rate | 27% |
What Comprised The Fund's Holdings?
(as of April 30, 2026)
Top ten holdings*
(% of net assets)
(% of net assets)
| KKR & Co., Inc., Class A | 5.21% |
| Blackstone, Inc., Class A | 5.19% |
| EQT AB | 4.79% |
| Partners Group Holding AG | 4.72% |
| TPG, Inc. | 4.62% |
| CVC Capital Partners PLC | 4.56% |
| 3i Group PLC | 4.14% |
| HAL Trust | 4.13% |
| Blue Owl Capital, Inc. | 4.02% |
| Sofina S.A. | 3.74% |
| * Excluding money market fund holdings, if any. |
Industry allocation
(% of net assets)
(% of net assets)
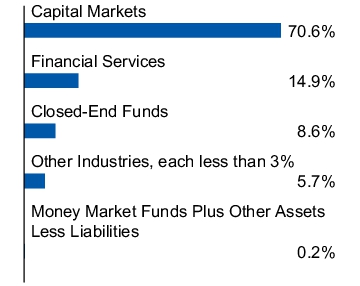
Top ten holdings*
(% of net assets)
(% of net assets)
| KKR & Co., Inc., Class A | 5.21% |
| Blackstone, Inc., Class A | 5.19% |
| EQT AB | 4.79% |
| Partners Group Holding AG | 4.72% |
| TPG, Inc. | 4.62% |
| CVC Capital Partners PLC | 4.56% |
| 3i Group PLC | 4.14% |
| HAL Trust | 4.13% |
| Blue Owl Capital, Inc. | 4.02% |
| Sofina S.A. | 3.74% |
| * Excluding money market fund holdings, if any. |
What Were The Fund Costs For The Last Year ?
(Based on a hypothetical $10,000 investment)
| Fund | Costs of a $10,000 investment | Costs paid as a percentage of a $10,000 investment |
| Invesco S&P 500 BuyWrite ETF | $31 | 0.29% |
How Did The Fund Perform During The Period?
• During the fiscal year ended April 30, 2026, the Fund's underlying equity exposure to the S&P 500® Index performed well, led by the information technology and communication services sectors. However, the call options detracted from the Fund's performance. This lack of upside was partially offset by the income generated from the call options.
• The Fund is passively managed and seeks to track the investment results (before fees and expenses) of the CBOE S&P 500 BuyWrite IndexSM (the “Index”). The Fund generally will invest at least 90% of its total assets in securities that comprise the Index and will write (sell) call options thereon.
• For the fiscal year ended April 30, 2026, the Fund's performance, on a net asset value ("NAV") basis, 17.08%, differed from the return of the Index, 17.52%, primarily due to fees and expenses incurred by the Fund during the period.
What contributed to performance?
Sector Allocations | Information technology sector, followed by the communication services and industrials sectors, respectively.
Positions | NVIDIA Corp., an information technology company, and Alphabet Inc., Class A, a communication services company.
What detracted from performance?
Sector Allocations | No sectors detracted from the Fund's performance during the period.
Positions | Berkshire Hathaway, Inc., Class B, a financials company, and ServiceNow, Inc., an information technology company.
How Has The Fund Historically Performed?
Growth of $10,000 Investment
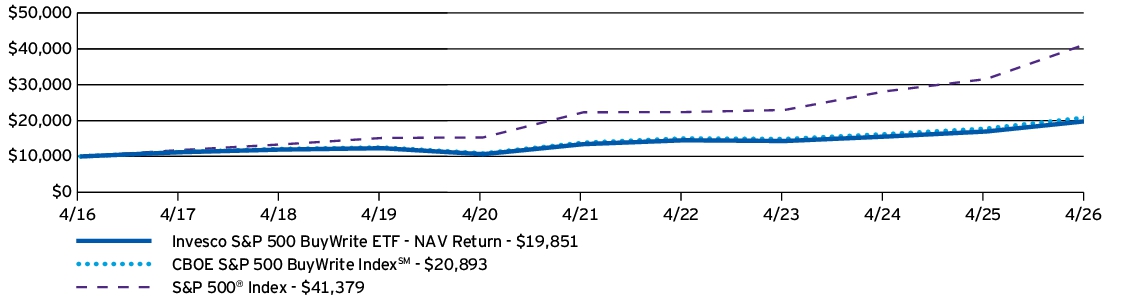
AVERAGE ANNUAL TOTAL RETURNS |
1 Year |
5 Years |
10 Years |
| Invesco S&P 500 BuyWrite ETF — NAV Return | 17.08% | 8.13% | 7.10% |
| CBOE S&P 500 BuyWrite Index℠ | 17.52% | 8.56% | 7.65% |
| S&P 500® Index | 31.05% | 13.14% | 15.26% |
Performance figures do not reflect deduction of taxes a shareholder would pay on Fund distributions or sale of Fund shares.
What Are Key Statistics About The Fund?
(as of April 30, 2026)
| Fund net assets | $337,490,207 |
| Total number of portfolio holdings | 505 |
| Total advisory fees paid | $799,922 |
| Portfolio turnover rate | 57% |
What Comprised The Fund's Holdings?
(as of April 30, 2026)
Top ten holdings*
(% of net assets)
(% of net assets)
| NVIDIA Corp. | 8.00% |
| Apple, Inc. | 6.58% |
| Microsoft Corp. | 5.00% |
| Amazon.com, Inc. | 4.27% |
| Alphabet, Inc., Class A | 3.70% |
| Broadcom, Inc. | 3.27% |
| Alphabet, Inc., Class C | 2.95% |
| Meta Platforms, Inc., Class A | 2.21% |
| Tesla, Inc. | 1.77% |
| Berkshire Hathaway, Inc., Class B | 1.43% |
| * Excluding money market fund holdings, if any. |
Sector allocation
(% of net assets)
(% of net assets)
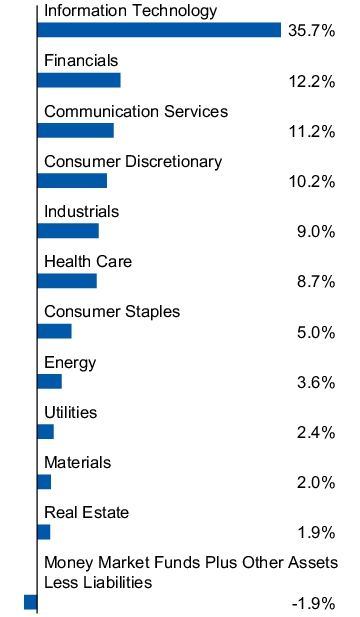
Top ten holdings*
(% of net assets)
(% of net assets)
| NVIDIA Corp. | 8.00% |
| Apple, Inc. | 6.58% |
| Microsoft Corp. | 5.00% |
| Amazon.com, Inc. | 4.27% |
| Alphabet, Inc., Class A | 3.70% |
| Broadcom, Inc. | 3.27% |
| Alphabet, Inc., Class C | 2.95% |
| Meta Platforms, Inc., Class A | 2.21% |
| Tesla, Inc. | 1.77% |
| Berkshire Hathaway, Inc., Class B | 1.43% |
| * Excluding money market fund holdings, if any. |
What Were The Fund Costs For The Last Year ?
(Based on a hypothetical $10,000 investment)
| Fund | Costs of a $10,000 investment | Costs paid as a percentage of a $10,000 investment |
| Invesco S&P 500 GARP ETF | $38 | 0.34% |
How Did The Fund Perform During The Period?
• During the fiscal year ended April 30, 2026, U.S. equities experienced positive returns for the majority of the year, although geopolitical conflict towards the end of the year sparked bouts of increased volatility. During the period, the Fund underperformed the S&P 500® Index primarily due to its underweight allocation to and security selection within the information technology sector.
• The Fund is passively managed and seeks to track the investment results (before fees and expenses) of the S&P 500® GARP Index (the “Index”). The Fund generally will invest at least 90% of its total assets in securities that comprise the Index.
• For the fiscal year ended April 30, 2026, the Fund's performance, on a net asset value ("NAV") basis, 22.53%, differed from the return of the Index, 22.98%, primarily due to fees and expenses incurred by the Fund during the period.
What contributed to performance?
Sector Allocations | Industrials sector, followed by the energy and information technology sectors, respectively.
Positions | Monolithic Power Systems, Inc., an information technology company, and Arista Networks, Inc., an information technology company.
What detracted from performance?
Sector Allocations | Health care sector.
Positions | Super Micro Computer, Inc., an information technology company, and Gartner, Inc., an information technology company.
How Has The Fund Historically Performed?
Growth of $10,000 Investment
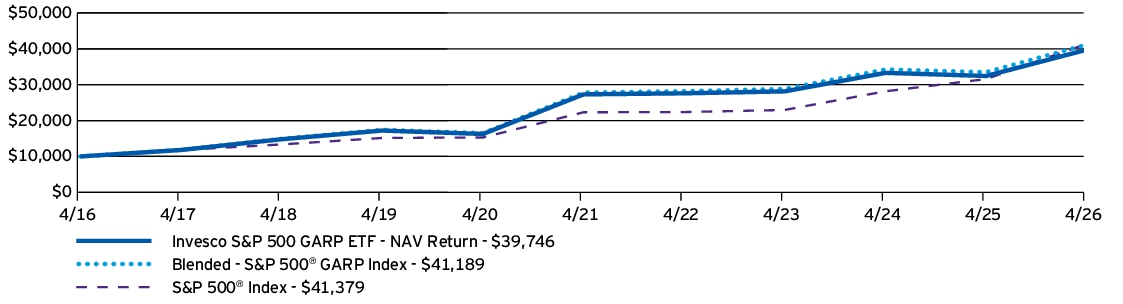
AVERAGE ANNUAL TOTAL RETURNS |
1 Year |
5 Years |
10 Years |
| Invesco S&P 500 GARP ETF — NAV Return | 22.53% | 7.80% | 14.80% |
| Blended - S&P 500® GARP Index | 22.98% | 8.17% | 15.21% |
| S&P 500® Index | 31.05% | 13.14% | 15.26% |
Performance figures do not reflect deduction of taxes a shareholder would pay on Fund distributions or sale of Fund shares.
What Are Key Statistics About The Fund?
(as of April 30, 2026)
| Fund net assets | $2,198,773,227 |
| Total number of portfolio holdings | 76 |
| Total advisory fees paid | $7,422,652 |
| Portfolio turnover rate | 90% |
What Comprised The Fund's Holdings?
(as of April 30, 2026)
Top ten holdings*
(% of net assets)
(% of net assets)
| Monolithic Power Systems, Inc. | 3.13% |
| NVIDIA Corp. | 2.71% |
| Host Hotels & Resorts, Inc. | 2.69% |
| Arista Networks, Inc. | 2.60% |
| Airbnb, Inc., Class A | 2.25% |
| Delta Air Lines, Inc. | 2.25% |
| Uber Technologies, Inc. | 2.17% |
| Northern Trust Corp. | 2.16% |
| Baker Hughes Co., Class A | 2.10% |
| EMCOR Group, Inc. | 2.05% |
| * Excluding money market fund holdings, if any. |
Sector allocation
(% of net assets)
(% of net assets)
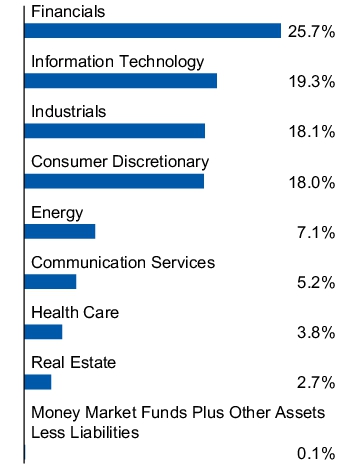
Top ten holdings*
(% of net assets)
(% of net assets)
| Monolithic Power Systems, Inc. | 3.13% |
| NVIDIA Corp. | 2.71% |
| Host Hotels & Resorts, Inc. | 2.69% |
| Arista Networks, Inc. | 2.60% |
| Airbnb, Inc., Class A | 2.25% |
| Delta Air Lines, Inc. | 2.25% |
| Uber Technologies, Inc. | 2.17% |
| Northern Trust Corp. | 2.16% |
| Baker Hughes Co., Class A | 2.10% |
| EMCOR Group, Inc. | 2.05% |
| * Excluding money market fund holdings, if any. |
What Were The Fund Costs For The Last Year ?
(Based on a hypothetical $10,000 investment)
| Fund | Costs of a $10,000 investment | Costs paid as a percentage of a $10,000 investment |
| Invesco S&P 500 Value with Momentum ETF | $45 | 0.39%† |
|
†
|
Reflects fee waivers and/or expense reimbursements, without which expenses would have been higher.
|
How Did The Fund Perform During The Period?
• During the fiscal year ended April 30, 2026, U.S. equities experienced positive returns for the majority of the year, although geopolitical conflict towards the end of the year sparked bouts of increased volatility. During the period, the Fund outperformed the S&P 500® Index primarily due to its security selection within the financials sector and relative overweight allocation to the energy sector.
• The Fund is passively managed and seeks to track the investment results (before fees and expenses) of the S&P 500® High Momentum Value Index (the “Index”). The Fund generally will invest at least 90% of its total assets in securities that comprise the Index.
• For the fiscal year ended April 30, 2026, the Fund's performance, on a net asset value ("NAV") basis, 31.28%, differed from the return of the Index, 31.58%, primarily due to fees and expenses incurred by the Fund during the period.
What contributed to performance?
Sector Allocations | Financials sector, followed by the energy and industrials sectors, respectively.
Positions | General Motors Co., a consumer discretionary company, and Warner Bros. Discovery, Inc., a communication services company.
What detracted from performance?
Sector Allocations | No sector detracted from the Fund's performance during the period.
Positions | Charter Communications, Inc., Class A , a communication services company (no longer held at fiscal year-end), and Berkshire Hathaway, Inc., Class B, a financials company.
How Has The Fund Historically Performed?
Growth of $10,000 Investment
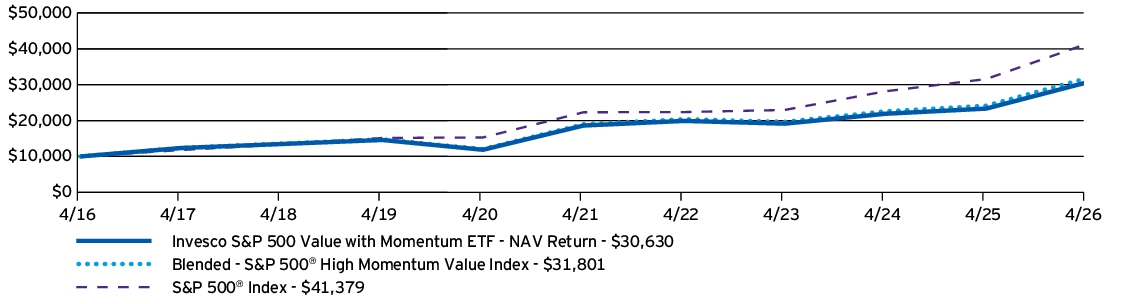
AVERAGE ANNUAL TOTAL RETURNS |
1 Year |
5 Years |
10 Years |
| Invesco S&P 500 Value with Momentum ETF — NAV Return | 31.28% | 10.47% | 11.84% |
| Blended - S&P 500® High Momentum Value Index | 31.58% | 10.87% | 12.26% |
| S&P 500® Index | 31.05% | 13.14% | 15.26% |
Performance figures do not reflect deduction of taxes a shareholder would pay on Fund distributions or sale of Fund shares.
What Are Key Statistics About The Fund?
(as of April 30, 2026)
| Fund net assets | $120,306,844 |
| Total number of portfolio holdings | 104 |
| Total advisory fees paid | $195,516 |
| Portfolio turnover rate | 58% |
What Comprised The Fund's Holdings?
(as of April 30, 2026)
Top ten holdings*
(% of net assets)
(% of net assets)
| Bunge Global S.A. | 2.78% |
| Archer-Daniels-Midland Co. | 2.06% |
| General Motors Co. | 1.82% |
| Ford Motor Co. | 1.82% |
| Verizon Communications, Inc. | 1.63% |
| Valero Energy Corp. | 1.61% |
| Marathon Petroleum Corp. | 1.55% |
| Phillips 66 | 1.54% |
| Allstate Corp. (The) | 1.49% |
| Franklin Resources, Inc. | 1.49% |
| * Excluding money market fund holdings, if any. |
Sector allocation
(% of net assets)
(% of net assets)
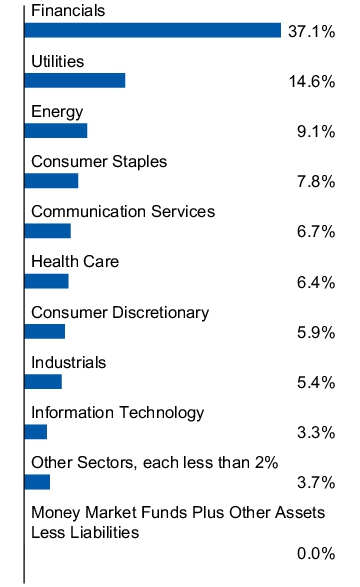
Top ten holdings*
(% of net assets)
(% of net assets)
| Bunge Global S.A. | 2.78% |
| Archer-Daniels-Midland Co. | 2.06% |
| General Motors Co. | 1.82% |
| Ford Motor Co. | 1.82% |
| Verizon Communications, Inc. | 1.63% |
| Valero Energy Corp. | 1.61% |
| Marathon Petroleum Corp. | 1.55% |
| Phillips 66 | 1.54% |
| Allstate Corp. (The) | 1.49% |
| Franklin Resources, Inc. | 1.49% |
| * Excluding money market fund holdings, if any. |
What Were The Fund Costs For The Last Year ?
(Based on a hypothetical $10,000 investment)
| Fund | Costs of a $10,000 investment | Costs paid as a percentage of a $10,000 investment |
| Invesco S&P 500® Equal Weight Real Estate ETF | $41 | 0.40% |
How Did The Fund Perform During The Period?
• During the fiscal year ended April 30, 2026, U.S. equities experienced positive returns for the majority of the year, although geopolitical conflict towards the end of the year sparked bouts of increased volatility. During the period, real estate stocks underperformed the broader market. The Fund's focus on real estate securities created a performance headwind compared to the S&P 500® Index.
• The Fund is passively managed and seeks to track the investment results (before fees and expenses) of the S&P 500® Equal Weight Real Estate Index (the “Index”). The Fund generally will invest at least 90% of its total assets in securities that comprise the Index.
• For the fiscal year ended April 30, 2026, the Fund's performance, on a net asset value ("NAV") basis, 5.87%, differed from the return of the Index, 6.32%, primarily due to fees and expenses incurred by the Fund during the period.
What contributed to performance?
Industry Allocations | Retail REITs industry, followed by the specialized REITs and hotel & resort REITs industries, respectively.
Positions | Host Hotels & Resorts, Inc., a hotel & resort REITs company, and Iron Mountain, Inc., a specialized REITs company.
What detracted from performance?
Industry Allocations | Residential REITs industry, followed by the real estate management & development industry.
Positions | CoStar Group, Inc., a real estate management & development company, and Alexandria Real Estate Equities, Inc., a health care REITs company.
How Has The Fund Historically Performed?
Growth of $10,000 Investment
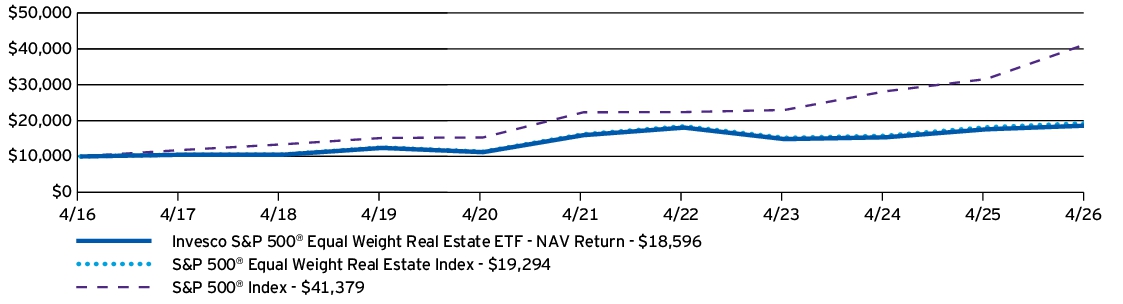
AVERAGE ANNUAL TOTAL RETURNS |
1 Year |
5 Years |
10 Years |
| Invesco S&P 500® Equal Weight Real Estate ETF — NAV Return | 5.87% | 3.14% | 6.40% |
| S&P 500® Equal Weight Real Estate Index | 6.32% | 3.54% | 6.79% |
| S&P 500® Index | 31.05% | 13.14% | 15.26% |
| S&P 500® Real Estate Index | 12.65% | 4.51% |
Performance figures do not reflect deduction of taxes a shareholder would pay on Fund distributions or sale of Fund shares.
What Are Key Statistics About The Fund?
(as of April 30, 2026)
| Fund net assets | $98,234,725 |
| Total number of portfolio holdings | 32 |
| Total advisory fees paid | $420,810 |
| Portfolio turnover rate | 14% |
What Comprised The Fund's Holdings?
(as of April 30, 2026)
Top ten holdings*
(% of net assets)
(% of net assets)
| SBA Communications Corp., Class A | 3.64% |
| Iron Mountain, Inc. | 3.64% |
| Invitation Homes, Inc. | 3.54% |
| BXP, Inc. | 3.48% |
| Digital Realty Trust, Inc. | 3.46% |
| Equinix, Inc. | 3.45% |
| Host Hotels & Resorts, Inc. | 3.42% |
| Equity Residential | 3.37% |
| CBRE Group, Inc., Class A | 3.34% |
| Simon Property Group, Inc. | 3.34% |
| * Excluding money market fund holdings, if any. |
Industry allocation
(% of net assets)
(% of net assets)
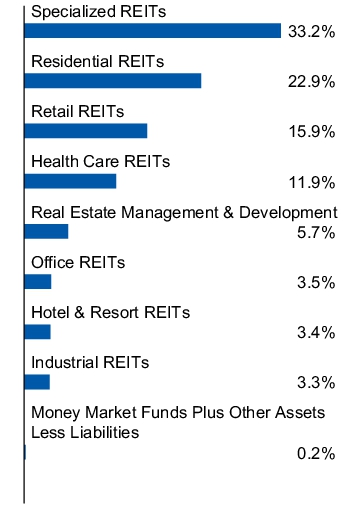
Top ten holdings*
(% of net assets)
(% of net assets)
| SBA Communications Corp., Class A | 3.64% |
| Iron Mountain, Inc. | 3.64% |
| Invitation Homes, Inc. | 3.54% |
| BXP, Inc. | 3.48% |
| Digital Realty Trust, Inc. | 3.46% |
| Equinix, Inc. | 3.45% |
| Host Hotels & Resorts, Inc. | 3.42% |
| Equity Residential | 3.37% |
| CBRE Group, Inc., Class A | 3.34% |
| Simon Property Group, Inc. | 3.34% |
| * Excluding money market fund holdings, if any. |
What Were The Fund Costs For The Last Year ?
(Based on a hypothetical $10,000 investment)
| Fund | Costs of a $10,000 investment | Costs paid as a percentage of a $10,000 investment |
| Invesco S&P 500® Equal Weight Technology ETF | $51 | 0.40% |
How Did The Fund Perform During The Period?
• During the fiscal year ended April 30, 2026, U.S. equities experienced positive returns for the majority of the year, although geopolitical conflict towards the end of the year sparked bouts of increased volatility. During the period, information technology stocks outperformed the broader market. The Fund's focus on information technology securities created a performance tailwind compared to the S&P 500® Index.
• The Fund is passively managed and seeks to track the investment results (before fees and expenses) of the S&P 500® Equal Weight Information Technology Index (the “Index”). The Fund generally will invest at least 90% of its total assets in securities that comprise the Index.
• For the fiscal year ended April 30, 2026, the Fund's performance, on a net asset value ("NAV") basis, 55.68%, differed from the return of the Index, 56.35%, primarily due to fees and expenses incurred by the Fund during the period, which was compounded during a period of strong performance.
What contributed to performance?
Industry Allocations | Semiconductors & semiconductor equipment industry, followed by the technology hardware, storage & peripherals and electronic equipment, instruments & components industries, respectively.
Positions | Western Digital Corp., a technology hardware, storage & peripherals company, and Seagate Technology Holdings PLC, a technology hardware, storage & peripherals company.
What detracted from performance?
Industry Allocations | Software industry, followed by the IT services industry.
Positions | Gartner, Inc., an IT services company, and GoDaddy, Inc., Class A, an IT services company.
How Has The Fund Historically Performed?
Growth of $10,000 Investment
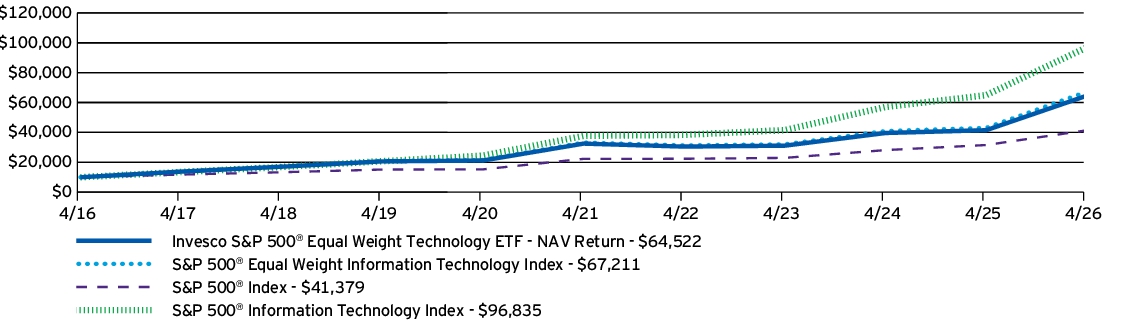
AVERAGE ANNUAL TOTAL RETURNS |
1 Year |
5 Years |
10 Years |
| Invesco S&P 500® Equal Weight Technology ETF — NAV Return | 55.68% | 14.70% | 20.50% |
| S&P 500® Equal Weight Information Technology Index | 56.35% | 15.16% | 20.99% |
| S&P 500® Index | 31.05% | 13.14% | 15.26% |
| S&P 500® Information Technology Index | 49.17% | 20.77% | 25.49% |
Performance figures do not reflect deduction of taxes a shareholder would pay on Fund distributions or sale of Fund shares.
What Are Key Statistics About The Fund?
(as of April 30, 2026)
| Fund net assets | $4,682,892,296 |
| Total number of portfolio holdings | 76 |
| Total advisory fees paid | $15,536,735 |
| Portfolio turnover rate | 31% |
What Comprised The Fund's Holdings?
(as of April 30, 2026)
Top ten holdings*
(% of net assets)
(% of net assets)
| Intel Corp. | 2.34% |
| Seagate Technology Holdings PLC | 2.08% |
| Advanced Micro Devices, Inc. | 2.06% |
| ON Semiconductor Corp. | 2.03% |
| Sandisk Corp. | 1.99% |
| Western Digital Corp. | 1.93% |
| Ciena Corp. | 1.85% |
| Monolithic Power Systems, Inc. | 1.80% |
| NXP Semiconductors N.V. | 1.75% |
| Dell Technologies, Inc., Class C | 1.69% |
| * Excluding money market fund holdings, if any. |
Industry allocation
(% of net assets)
(% of net assets)
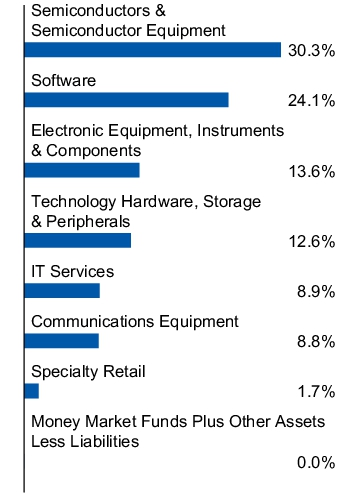
Top ten holdings*
(% of net assets)
(% of net assets)
| Intel Corp. | 2.34% |
| Seagate Technology Holdings PLC | 2.08% |
| Advanced Micro Devices, Inc. | 2.06% |
| ON Semiconductor Corp. | 2.03% |
| Sandisk Corp. | 1.99% |
| Western Digital Corp. | 1.93% |
| Ciena Corp. | 1.85% |
| Monolithic Power Systems, Inc. | 1.80% |
| NXP Semiconductors N.V. | 1.75% |
| Dell Technologies, Inc., Class C | 1.69% |
| * Excluding money market fund holdings, if any. |
What Were The Fund Costs For The Last Year ?
(Based on a hypothetical $10,000 investment)
| Fund | Costs of a $10,000 investment | Costs paid as a percentage of a $10,000 investment |
| Invesco S&P 500® Equal Weight Utilities ETF | $44 | 0.40% |
How Did The Fund Perform During The Period?
• During the fiscal year ended April 30, 2026, U.S. equities experienced positive returns for the majority of the year, although geopolitical conflict towards the end of the year sparked bouts of increased volatility. During the period, utilities stocks underperformed the broader market. The Fund's focus on utilities securities created a performance headwind compared to the S&P 500® Index.
• The Fund is passively managed and seeks to track the investment results (before fees and expenses) of the S&P 500® Equal Weight Utilities Plus Index (the “Index”). The Fund generally will invest at least 90% of its total assets in securities that comprise the Index.
• For the fiscal year ended April 30, 2026, the Fund's performance, on a net asset value ("NAV") basis, 21.11%, differed from the return of the Index, 21.59%, primarily due to fees and expenses incurred by the Fund during the period.
What contributed to performance?
Industry Allocations | Electric utilities industry, followed by the multi-utilities and independent power & renewable electricity producers industries, respectively.
Positions | NRG Energy, Inc., an electric utilities company, and AES Corp. (The), an independent power and renewable electricity producers company.
What detracted from performance?
Industry Allocations | Water utilities industry.
Positions | American Water Works Co., Inc., a water utilities company.
How Has The Fund Historically Performed?
Growth of $10,000 Investment
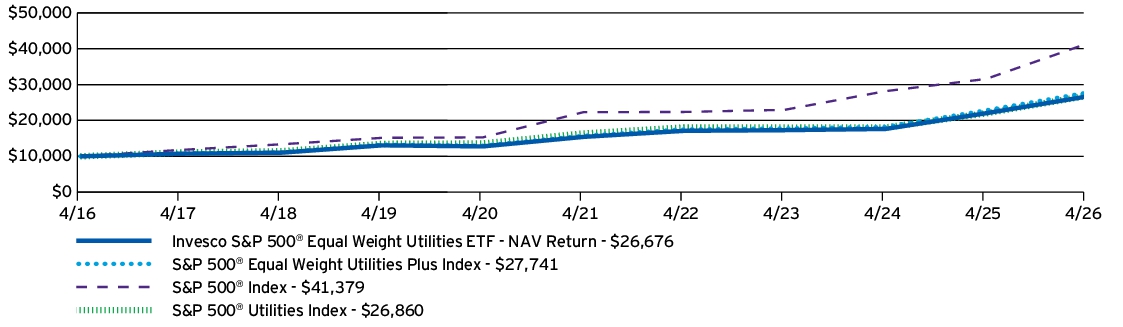
AVERAGE ANNUAL TOTAL RETURNS |
1 Year |
5 Years |
10 Years |
| Invesco S&P 500® Equal Weight Utilities ETF — NAV Return | 21.11% | 11.58% | 10.31% |
| S&P 500® Equal Weight Utilities Plus Index | 21.59% | 12.03% | 10.74% |
| S&P 500® Index | 31.05% | 13.14% | 15.26% |
| S&P 500® Utilities Index | 22.10% | 10.40% | 10.39% |
Performance figures do not reflect deduction of taxes a shareholder would pay on Fund distributions or sale of Fund shares.
What Are Key Statistics About The Fund?
(as of April 30, 2026)
| Fund net assets | $586,170,477 |
| Total number of portfolio holdings | 33 |
| Total advisory fees paid | $1,983,444 |
| Portfolio turnover rate | 9% |
What Comprised The Fund's Holdings?
(as of April 30, 2026)
Top ten holdings*
(% of net assets)
(% of net assets)
| Entergy Corp. | 3.61% |
| NextEra Energy, Inc. | 3.40% |
| NRG Energy, Inc. | 3.33% |
| American Electric Power Co., Inc. | 3.32% |
| NiSource, Inc. | 3.32% |
| Constellation Energy Corp. | 3.31% |
| WEC Energy Group, Inc. | 3.31% |
| Ameren Corp. | 3.31% |
| Alliant Energy Corp. | 3.30% |
| Dominion Energy, Inc. | 3.30% |
| * Excluding money market fund holdings, if any. |
Industry allocation
(% of net assets)
(% of net assets)
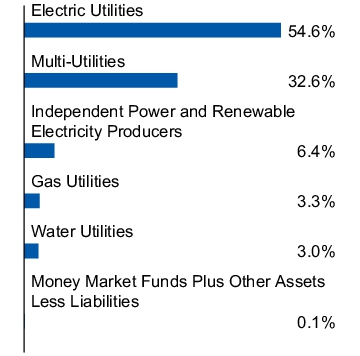
Top ten holdings*
(% of net assets)
(% of net assets)
| Entergy Corp. | 3.61% |
| NextEra Energy, Inc. | 3.40% |
| NRG Energy, Inc. | 3.33% |
| American Electric Power Co., Inc. | 3.32% |
| NiSource, Inc. | 3.32% |
| Constellation Energy Corp. | 3.31% |
| WEC Energy Group, Inc. | 3.31% |
| Ameren Corp. | 3.31% |
| Alliant Energy Corp. | 3.30% |
| Dominion Energy, Inc. | 3.30% |
| * Excluding money market fund holdings, if any. |
What Were The Fund Costs For The Last Year ?
(Based on a hypothetical $10,000 investment)
| Fund | Costs of a $10,000 investment | Costs paid as a percentage of a $10,000 investment |
| Invesco S&P 500® Pure Growth ETF | $42 | 0.35% |
How Did The Fund Perform During The Period?
• During the fiscal year ended April 30, 2026, U.S. equities experienced positive returns for the majority of the year, although geopolitical conflict towards the end of the year sparked bouts of increased volatility. The Fund outperformed the S&P 500® Growth Index primarily due to strong security selection in the information technology sector and an overweight allocation to the industrials sector.
• The Fund is passively managed and seeks to track the investment results (before fees and expenses) of the S&P 500® Pure Growth Index (the “Index”). The Fund generally will invest at least 90% of its total assets in securities that comprise the Index.
• For the fiscal year ended April 30, 2026, the Fund's performance, on a net asset value ("NAV") basis, 38.86%, differed from the return of the Index, 39.33%, primarily due to fees and expenses incurred by the Fund during the period.
What contributed to performance?
Sector Allocations | Information technology sector, followed by the industrials and consumer discretionary sectors, respectively.
Positions | Sandisk Corp., an information technology company, and Comfort Systems USA, Inc., an industrials company.
What detracted from performance?
Sector Allocations | Health care sector, followed by the energy and financials sectors, respectively.
Positions | Trade Desk, Inc. (The), Class A, a communication services company (no longer held at fiscal year-end), and Robinhood Markets, Inc., Class A, a financials company.
How Has The Fund Historically Performed?
Growth of $10,000 Investment
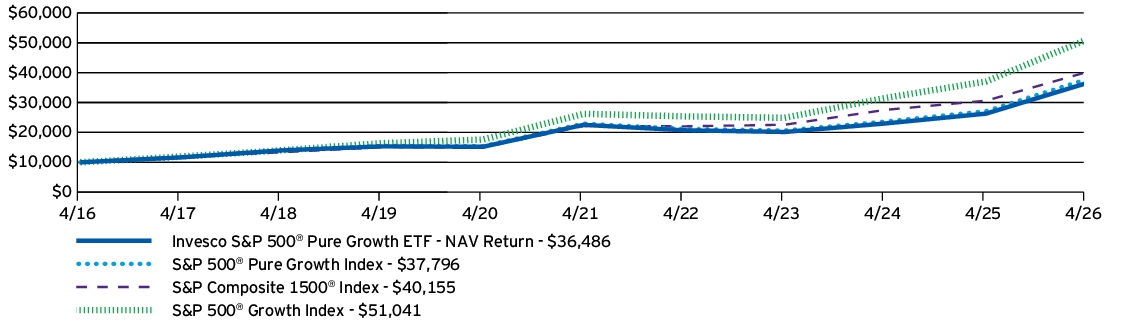
AVERAGE ANNUAL TOTAL RETURNS |
1 Year |
5 Years |
10 Years |
| Invesco S&P 500® Pure Growth ETF — NAV Return | 38.86% | 10.12% | 13.82% |
| S&P 500® Pure Growth Index | 39.33% | 10.50% | 14.22% |
| S&P Composite 1500® Index | 31.17% | 12.65% | 14.91% |
| S&P 500® Growth Index | 37.74% | 14.26% | 17.70% |
Performance figures do not reflect deduction of taxes a shareholder would pay on Fund distributions or sale of Fund shares.
What Are Key Statistics About The Fund?
(as of April 30, 2026)
| Fund net assets | $1,891,153,989 |
| Total number of portfolio holdings | 68 |
| Total advisory fees paid | $5,773,482 |
| Portfolio turnover rate | 69% |
What Comprised The Fund's Holdings?
(as of April 30, 2026)
Top ten holdings*
(% of net assets)
(% of net assets)
| Sandisk Corp. | 5.97% |
| Comfort Systems USA, Inc. | 3.71% |
| Ciena Corp. | 2.98% |
| Monolithic Power Systems, Inc. | 2.87% |
| Vertiv Holdings Co., Class A | 2.43% |
| Micron Technology, Inc. | 2.24% |
| Berkshire Hathaway, Inc., Class B | 2.17% |
| KLA Corp. | 2.12% |
| Howmet Aerospace, Inc. | 2.11% |
| Quanta Services, Inc. | 2.08% |
| * Excluding money market fund holdings, if any. |
Sector allocation
(% of net assets)
(% of net assets)
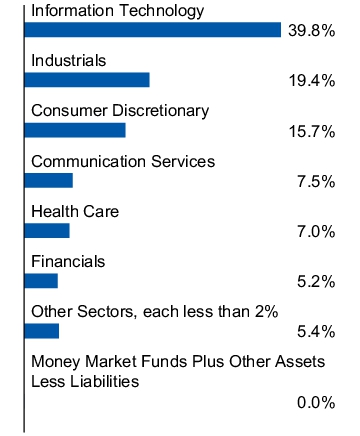
Top ten holdings*
(% of net assets)
(% of net assets)
| Sandisk Corp. | 5.97% |
| Comfort Systems USA, Inc. | 3.71% |
| Ciena Corp. | 2.98% |
| Monolithic Power Systems, Inc. | 2.87% |
| Vertiv Holdings Co., Class A | 2.43% |
| Micron Technology, Inc. | 2.24% |
| Berkshire Hathaway, Inc., Class B | 2.17% |
| KLA Corp. | 2.12% |
| Howmet Aerospace, Inc. | 2.11% |
| Quanta Services, Inc. | 2.08% |
| * Excluding money market fund holdings, if any. |
What Were The Fund Costs For The Last Year ?
(Based on a hypothetical $10,000 investment)
| Fund | Costs of a $10,000 investment | Costs paid as a percentage of a $10,000 investment |
| Invesco S&P 500® Pure Value ETF | $40 | 0.35% |
How Did The Fund Perform During The Period?
• During the fiscal year ended April 30, 2026, U.S. equities experienced positive returns for the majority of the year, although geopolitical conflict towards the end of the year sparked bouts of increased volatility. The Fund outperformed the S&P 500® Value Index primarily due to strong security selection in the financials and energy sectors.
• The Fund is passively managed and seeks to track the investment results (before fees and expenses) of the S&P 500® Pure Value Index (the “Index”). The Fund generally will invest at least 90% of its total assets in securities that comprise the Index.
• For the fiscal year ended April 30, 2026, the Fund's performance, on a net asset value ("NAV") basis, 29.06%, differed from the return of the Index, 29.14%, primarily due to fees and expenses incurred by the Fund during the period.
What contributed to performance?
Sector Allocations | Financials sector, followed by the energy and consumer staples sectors, respectively.
Positions | Warner Bros. Discovery, Inc., a communication services company, and General Motors Co., a consumer discretionary company.
What detracted from performance?
Sector Allocations | Real estate sector.
Positions | Molina Healthcare, Inc., a health care company (no longer held at fiscal year-end), and Mosaic Co., a materials company.
How Has The Fund Historically Performed?
Growth of $10,000 Investment
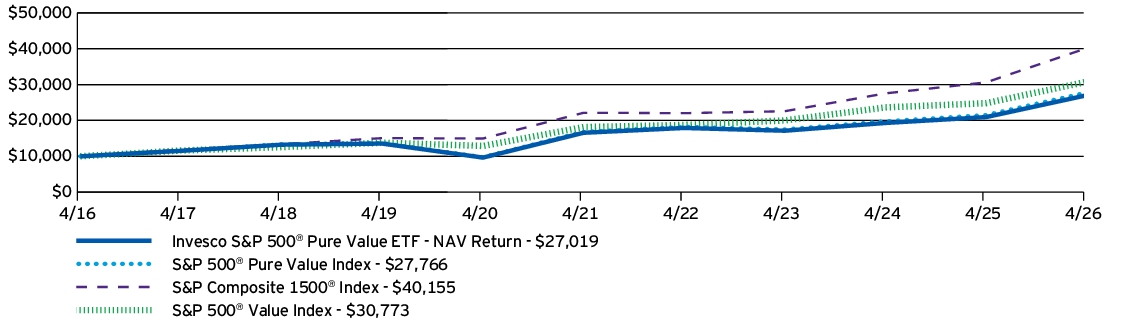
AVERAGE ANNUAL TOTAL RETURNS |
1 Year |
5 Years |
10 Years |
| Invesco S&P 500® Pure Value ETF — NAV Return | 29.06% | 10.29% | 10.45% |
| S&P 500® Pure Value Index | 29.14% | 10.57% | 10.75% |
| S&P Composite 1500® Index | 31.17% | 12.65% | 14.91% |
| S&P 500® Value Index | 23.96% | 11.13% | 11.90% |
What Are Key Statistics About The Fund?
(as of April 30, 2026)
| Fund net assets | $1,826,309,395 |
| Total number of portfolio holdings | 125 |
| Total advisory fees paid | $5,137,848 |
| Portfolio turnover rate | 38% |
What Comprised The Fund's Holdings?
(as of April 30, 2026)
Top ten holdings*
(% of net assets)
(% of net assets)
| Dow, Inc. | 2.65% |
| Bunge Global S.A. | 2.63% |
| Centene Corp. | 2.29% |
| Archer-Daniels-Midland Co. | 2.17% |
| LyondellBasell Industries N.V., Class A | 1.98% |
| Tyson Foods, Inc., Class A | 1.86% |
| Cigna Group (The) | 1.76% |
| Ford Motor Co. | 1.75% |
| CVS Health Corp. | 1.73% |
| Mosaic Co. (The) | 1.73% |
| * Excluding money market fund holdings, if any. |
Sector allocation
(% of net assets)
(% of net assets)
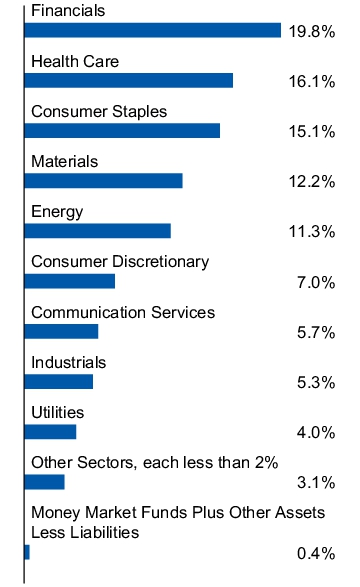
Top ten holdings*
(% of net assets)
(% of net assets)
| Dow, Inc. | 2.65% |
| Bunge Global S.A. | 2.63% |
| Centene Corp. | 2.29% |
| Archer-Daniels-Midland Co. | 2.17% |
| LyondellBasell Industries N.V., Class A | 1.98% |
| Tyson Foods, Inc., Class A | 1.86% |
| Cigna Group (The) | 1.76% |
| Ford Motor Co. | 1.75% |
| CVS Health Corp. | 1.73% |
| Mosaic Co. (The) | 1.73% |
| * Excluding money market fund holdings, if any. |
What Were The Fund Costs For The Last Year ?
(Based on a hypothetical $10,000 investment)
| Fund | Costs of a $10,000 investment | Costs paid as a percentage of a $10,000 investment |
| Invesco S&P 500® Top 50 ETF | $23 | 0.20% |
How Did The Fund Perform During The Period?
• During the fiscal year ended April 30, 2026, U.S. equities experienced positive returns for the majority of the year, although geopolitical conflict towards the end of the year sparked bouts of increased volatility. The Fund outperformed the S&P 100® Index primarily due to overweight allocations to the communication services and information technology sectors.
• The Fund is passively managed and seeks to track the investment results (before fees and expenses) of the S&P 500® Top 50 Index (the “Index”). The Fund generally will invest at least 90% of its total assets in securities that comprise the Index.
• For the fiscal year ended April 30, 2026, the Fund's performance, on a net asset value ("NAV") basis, 33.76%, differed from the return of the Index, 34.05%, primarily due to fees and expenses incurred by the Fund during the period.
What contributed to performance?
Sector Allocations | Information technology sector, followed by the communication services and consumer discretionary sectors, respectively.
Positions | NVIDIA Corp., an information technology company, and Alphabet, Inc., Class A, a communication services company.
What detracted from performance?
Sector Allocations | No sector allocations detracted from the Fund's performance during the period.
Positions | Berkshire Hathaway, Inc., Class B, a financials company, and ServiceNow, Inc., an information technology company.
How Has The Fund Historically Performed?
Growth of $10,000 Investment
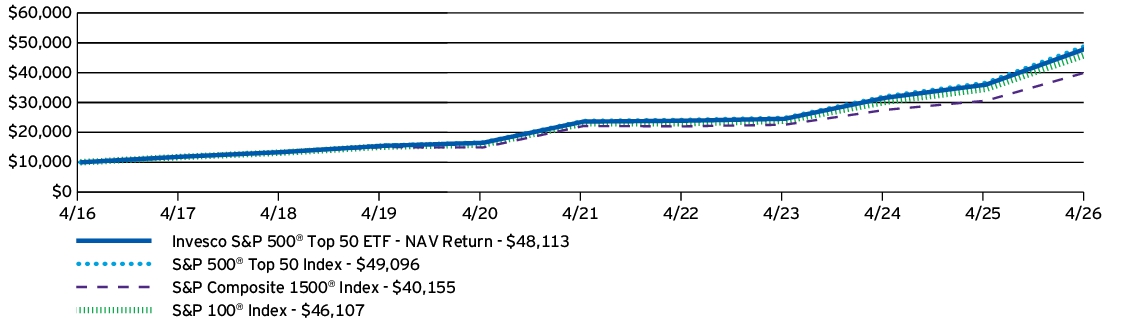
AVERAGE ANNUAL TOTAL RETURNS |
1 Year |
5 Years |
10 Years |
| Invesco S&P 500® Top 50 ETF — NAV Return | 33.76% | 15.30% | 17.01% |
| S&P 500® Top 50 Index | 34.05% | 15.52% | 17.25% |
| S&P Composite 1500® Index | 31.17% | 12.65% | 14.91% |
| S&P 100® Index | 33.29% | 14.90% | 16.51% |
Performance figures do not reflect deduction of taxes a shareholder would pay on Fund distributions or sale of Fund shares.
What Are Key Statistics About The Fund?
(as of April 30, 2026)
| Fund net assets | $10,739,566,254 |
| Total number of portfolio holdings | 52 |
| Total advisory fees paid | $20,946,239 |
| Portfolio turnover rate | 6% |
What Comprised The Fund's Holdings?
(as of April 30, 2026)
Top ten holdings*
(% of net assets)
(% of net assets)
| NVIDIA Corp. | 13.03% |
| Apple, Inc. | 10.70% |
| Microsoft Corp. | 8.13% |
| Amazon.com, Inc. | 6.96% |
| Alphabet, Inc., Class A | 6.02% |
| Broadcom, Inc. | 4.82% |
| Alphabet, Inc., Class C | 4.80% |
| Meta Platforms, Inc., Class A | 3.60% |
| Tesla, Inc. | 2.88% |
| Berkshire Hathaway, Inc., Class B | 2.33% |
| * Excluding money market fund holdings, if any. |
Sector allocation
(% of net assets)
(% of net assets)
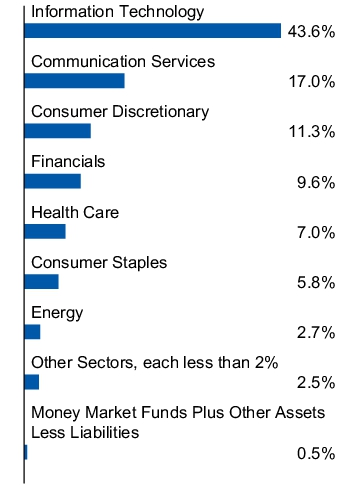
Top ten holdings*
(% of net assets)
(% of net assets)
| NVIDIA Corp. | 13.03% |
| Apple, Inc. | 10.70% |
| Microsoft Corp. | 8.13% |
| Amazon.com, Inc. | 6.96% |
| Alphabet, Inc., Class A | 6.02% |
| Broadcom, Inc. | 4.82% |
| Alphabet, Inc., Class C | 4.80% |
| Meta Platforms, Inc., Class A | 3.60% |
| Tesla, Inc. | 2.88% |
| Berkshire Hathaway, Inc., Class B | 2.33% |
| * Excluding money market fund holdings, if any. |
What Were The Fund Costs For The Last Year ?
(Based on a hypothetical $10,000 investment)
| Fund | Costs of a $10,000 investment | Costs paid as a percentage of a $10,000 investment |
| Invesco S&P MidCap 400® GARP ETF | $40 | 0.35% |
How Did The Fund Perform During The Period?
• During the fiscal year ended April 30, 2026, U.S. equities experienced positive returns for the majority of the year, although geopolitical conflict towards the end of the year sparked bouts of increased volatility. The Fund's underperformance relative to the S&P MidCap 400® Index was primarily due to its security selection within the information technology sector and underweight allocation to the industrials sector, which resulted from its growth and value multifactor security selection methodology.
• The Fund is passively managed and seeks to track the investment results (before fees and expenses) of the S&P MidCap 400® GARP Index (the “Index”). The Fund generally will invest at least 90% of its total assets in securities that comprise the Index.
• For the fiscal year ended April 30, 2026, the Fund's performance, on a net asset value ("NAV") basis, 26.47%, differed from the return of the Index, 26.92%, primarily due to fees and expenses incurred by the Fund during the period.
What contributed to performance?
Sector Allocations | Energy sector, followed by the financials and industrials sectors, respectively.
Positions | Valaris Ltd., an energy company, and Comfort Systems USA, Inc., an industrials company (no longer held at fiscal year-end).
What detracted from performance?
Sector Allocations | Health care sector, followed by the materials sector.
Positions | Him & Hers Health, Inc., Class A, a health care company (no longer held at fiscal year-end), and Duolingo, Inc., a consumer discretionary company.
How Has The Fund Historically Performed?
Growth of $10,000 Investment
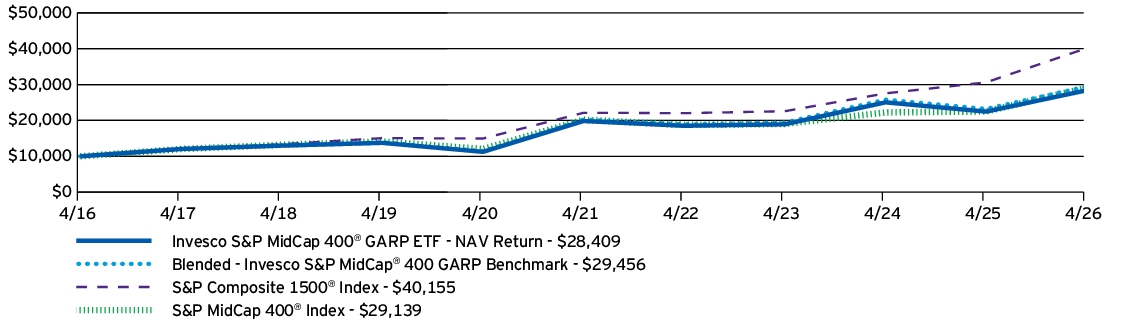
AVERAGE ANNUAL TOTAL RETURNS |
1 Year |
5 Years |
10 Years |
| Invesco S&P MidCap 400® GARP ETF — NAV Return | 26.47% | 7.44% | 11.01% |
| Blended - Invesco S&P MidCap 400® GARP Benchmark | 26.92% | 7.82% | 11.41% |
| S&P Composite 1500® Index | 31.17% | 12.65% | 14.91% |
| S&P MidCap 400® Index | 29.49% | 7.60% | 11.29% |
Performance figures do not reflect deduction of taxes a shareholder would pay on Fund distributions or sale of Fund shares.
What Are Key Statistics About The Fund?
(as of April 30, 2026)
| Fund net assets | $485,990,330 |
| Total number of portfolio holdings | 61 |
| Total advisory fees paid | $1,656,131 |
| Portfolio turnover rate | 75% |
What Comprised The Fund's Holdings?
(as of April 30, 2026)
Top ten holdings*
(% of net assets)
(% of net assets)
| Lantheus Holdings, Inc. | 3.71% |
| TechnipFMC PLC | 3.10% |
| Valaris Ltd. | 3.08% |
| Permian Resources Corp. | 2.98% |
| RenaissanceRe Holdings Ltd. | 2.89% |
| Carpenter Technology Corp. | 2.65% |
| Rambus, Inc. | 2.39% |
| East West Bancorp, Inc. | 2.24% |
| Sterling Infrastructure, Inc. | 2.15% |
| Halozyme Therapeutics, Inc. | 2.13% |
| * Excluding money market fund holdings, if any. |
Sector allocation
(% of net assets)
(% of net assets)
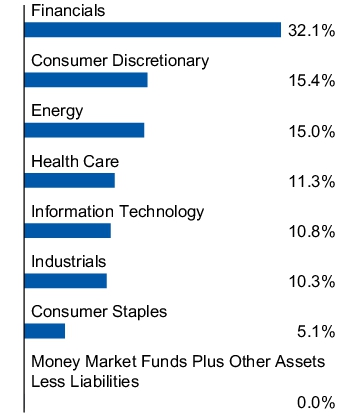
Top ten holdings*
(% of net assets)
(% of net assets)
| Lantheus Holdings, Inc. | 3.71% |
| TechnipFMC PLC | 3.10% |
| Valaris Ltd. | 3.08% |
| Permian Resources Corp. | 2.98% |
| RenaissanceRe Holdings Ltd. | 2.89% |
| Carpenter Technology Corp. | 2.65% |
| Rambus, Inc. | 2.39% |
| East West Bancorp, Inc. | 2.24% |
| Sterling Infrastructure, Inc. | 2.15% |
| Halozyme Therapeutics, Inc. | 2.13% |
| * Excluding money market fund holdings, if any. |
What Were The Fund Costs For The Last Year ?
(Based on a hypothetical $10,000 investment)
| Fund | Costs of a $10,000 investment | Costs paid as a percentage of a $10,000 investment |
| Invesco S&P MidCap 400® Pure Growth ETF | $41 | 0.35% |
How Did The Fund Perform During The Period?
• During the fiscal year ended April 30, 2026, U.S. equities experienced positive returns for the majority of the year, although geopolitical conflict towards the end of the year sparked bouts of increased volatility. The Fund outperformed the S&P MidCap 400® Growth Index primarily due to its strong security selection in the industrials and energy sectors.
• The Fund is passively managed and seeks to track the investment results (before fees and expenses) of the S&P MidCap 400® Pure Growth Index (the “Index”). The Fund generally will invest at least 90% of its total assets in securities that comprise the Index.
• For the fiscal year ended April 30, 2026, the Fund's performance, on a net asset value ("NAV") basis, 35.01%, differed from the return of the Index, 35.41%, primarily due to fees and expenses incurred by the Fund during the period.
What contributed to performance?
Sector Allocations | Industrials sector, followed by information technology and energy sectors, respectively.
Positions | Comfort Systems USA, Inc., an industrials company (no longer held at fiscal year-end), and Valaris Ltd., an energy company.
What detracted from performance?
Sector Allocations | Consumer staples sector.
Positions | Sarepta Therapeutics, Inc., a health care company (no longer held at fiscal year-end), and Sprouts Farmers Market, Inc., a consumer staples company (no longer held at fiscal year-end).
How Has The Fund Historically Performed?
Growth of $10,000 Investment
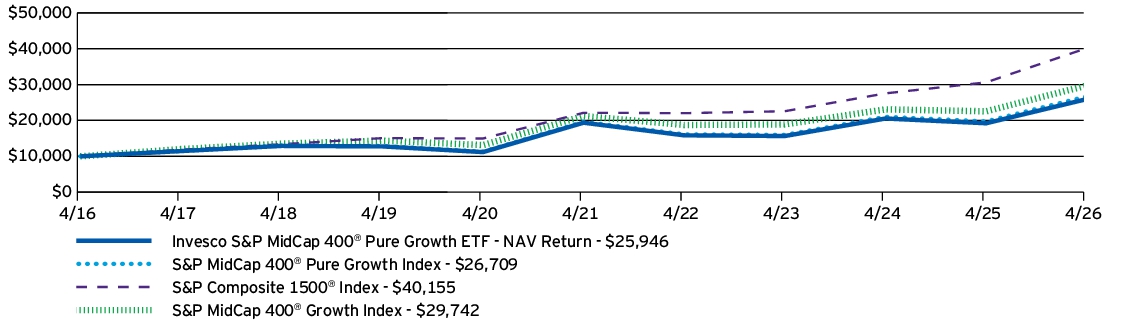
AVERAGE ANNUAL TOTAL RETURNS |
1 Year |
5 Years |
10 Years |
| Invesco S&P MidCap 400® Pure Growth ETF — NAV Return | 35.01% | 6.02% | 10.00% |
| S&P MidCap 400® Pure Growth Index | 35.41% | 6.36% | 10.32% |
| S&P Composite 1500® Index | 31.17% | 12.65% | 14.91% |
| S&P MidCap 400® Growth Index | 31.95% | 6.98% | 11.52% |
Performance figures do not reflect deduction of taxes a shareholder would pay on Fund distributions or sale of Fund shares.
What Are Key Statistics About The Fund?
(as of April 30, 2026)
| Fund net assets | $334,595,745 |
| Total number of portfolio holdings | 98 |
| Total advisory fees paid | $1,045,548 |
| Portfolio turnover rate | 77% |
What Comprised The Fund's Holdings?
(as of April 30, 2026)
Top ten holdings*
(% of net assets)
(% of net assets)
| TechnipFMC PLC | 2.44% |
| Valaris Ltd. | 2.32% |
| Arrowhead Pharmaceuticals, Inc. | 2.32% |
| MasTec, Inc. | 2.30% |
| Sterling Infrastructure, Inc. | 2.13% |
| Fabrinet | 2.08% |
| TTM Technologies, Inc. | 2.07% |
| Vicor Corp. | 1.98% |
| Carpenter Technology Corp. | 1.97% |
| Woodward, Inc. | 1.97% |
| * Excluding money market fund holdings, if any. |
Sector allocation
(% of net assets)
(% of net assets)
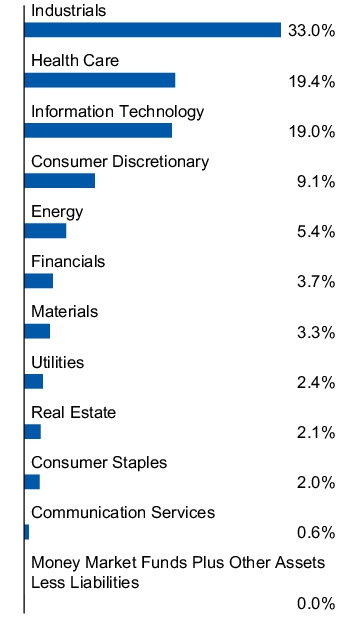
Top ten holdings*
(% of net assets)
(% of net assets)
| TechnipFMC PLC | 2.44% |
| Valaris Ltd. | 2.32% |
| Arrowhead Pharmaceuticals, Inc. | 2.32% |
| MasTec, Inc. | 2.30% |
| Sterling Infrastructure, Inc. | 2.13% |
| Fabrinet | 2.08% |
| TTM Technologies, Inc. | 2.07% |
| Vicor Corp. | 1.98% |
| Carpenter Technology Corp. | 1.97% |
| Woodward, Inc. | 1.97% |
| * Excluding money market fund holdings, if any. |
What Were The Fund Costs For The Last Year ?
(Based on a hypothetical $10,000 investment)
| Fund | Costs of a $10,000 investment | Costs paid as a percentage of a $10,000 investment |
| Invesco S&P MidCap 400® Pure Value ETF | $41 | 0.35% |
How Did The Fund Perform During The Period?
• During the fiscal year ended April 30, 2026, U.S. equities experienced positive returns for the majority of the year, although geopolitical conflict towards the end of the year sparked bouts of increased volatility. The Fund outperformed the S&P MidCap 400® Value Index primarily due to its strong security selection in the energy sector and overweight allocation to the energy and consumer discretionary sectors.
• The Fund is passively managed and seeks to track the investment results (before fees and expenses) of the S&P MidCap 400® Pure Value Index (the “Index”). The Fund generally will invest at least 90% of its total assets in securities that comprise the Index.
• For the fiscal year ended April 30, 2026, the Fund's performance, on a net asset value ("NAV") basis, 31.99%, differed from the return of the Index, 32.43%, primarily due to fees and expenses incurred by the Fund during the period.
What contributed to performance?
Sector Allocations | Energy sector, followed by the consumer discretionary and information technology sectors, respectively.
Positions | HF Sinclair Corp., an energy company, and PBF Energy, Inc., Class A, an energy company.
What detracted from performance?
Sector Allocations | Health care sector.
Positions | Concentrix Corp., an industrials company, and Goodyear Tire & Rubber Co., a consumer discretionary company.
How Has The Fund Historically Performed?
Growth of $10,000 Investment
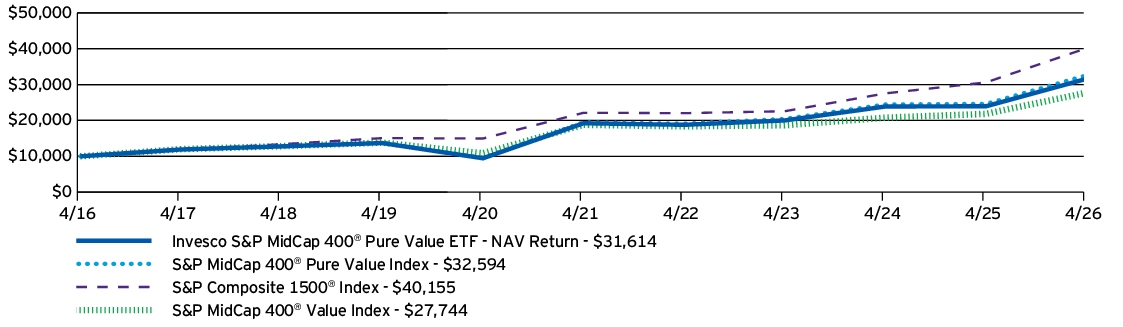
AVERAGE ANNUAL TOTAL RETURNS |
1 Year |
5 Years |
10 Years |
| Invesco S&P MidCap 400® Pure Value ETF — NAV Return | 31.99% | 10.47% | 12.20% |
| S&P MidCap 400® Pure Value Index | 32.43% | 10.84% | 12.54% |
| S&P Composite 1500® Index | 31.17% | 12.65% | 14.91% |
| S&P MidCap 400® Value Index | 26.94% | 8.10% | 10.74% |
Performance figures do not reflect deduction of taxes a shareholder would pay on Fund distributions or sale of Fund shares.
What Are Key Statistics About The Fund?
(as of April 30, 2026)
| Fund net assets | $318,014,719 |
| Total number of portfolio holdings | 101 |
| Total advisory fees paid | $982,531 |
| Portfolio turnover rate | 61% |
What Comprised The Fund's Holdings?
(as of April 30, 2026)
Top ten holdings*
(% of net assets)
(% of net assets)
| Avnet, Inc. | 3.75% |
| Arrow Electronics, Inc. | 3.57% |
| PBF Energy, Inc., Class A | 2.83% |
| HF Sinclair Corp. | 2.41% |
| TD SYNNEX Corp. | 2.40% |
| Lear Corp. | 2.20% |
| Olin Corp. | 2.18% |
| PVH Corp. | 2.09% |
| Brighthouse Financial, Inc. | 1.93% |
| Chord Energy Corp. | 1.87% |
| * Excluding money market fund holdings, if any. |
Sector allocation
(% of net assets)
(% of net assets)
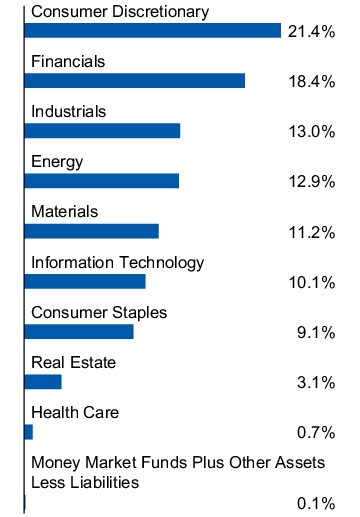
Top ten holdings*
(% of net assets)
(% of net assets)
| Avnet, Inc. | 3.75% |
| Arrow Electronics, Inc. | 3.57% |
| PBF Energy, Inc., Class A | 2.83% |
| HF Sinclair Corp. | 2.41% |
| TD SYNNEX Corp. | 2.40% |
| Lear Corp. | 2.20% |
| Olin Corp. | 2.18% |
| PVH Corp. | 2.09% |
| Brighthouse Financial, Inc. | 1.93% |
| Chord Energy Corp. | 1.87% |
| * Excluding money market fund holdings, if any. |
What Were The Fund Costs For The Last Year ?
(Based on a hypothetical $10,000 investment)
| Fund | Costs of a $10,000 investment | Costs paid as a percentage of a $10,000 investment |
| Invesco S&P 500® Equal Weight Consumer Discretionary ETF | $43 | 0.40% |
How Did The Fund Perform During The Period?
• During the fiscal year ended April 30, 2026, U.S. equities experienced positive returns for the majority of the year, although geopolitical conflict towards the end of the year sparked bouts of increased volatility. During the period, consumer discretionary stocks underperformed the broader market. The Fund's focus on consumer discretionary securities created a performance headwind relative to the S&P 500® Index.
• The Fund is passively managed and seeks to track the investment results (before fees and expenses) of the S&P 500® Equal Weight Consumer Discretionary Index (the “Index”). The Fund generally will invest at least 90% of its total assets in securities that comprise the Index.
• For the fiscal year ended April 30, 2026, the Fund's performance, on a net asset value ("NAV") basis, 14.41%, differed from the return of the Index, 14.87%, primarily due to fees and expenses incurred by the Fund during the period.
What contributed to performance?
Industry Allocations | Hotels, restaurants & leisure industry, followed by the automobiles and broadline retail industries, respectively.
Positions | Tapestry, Inc., a textiles, apparel & luxury goods company, and General Motors Co., an automobiles company.
What detracted from performance?
Industry Allocations | Distributors industry.
Positions | lululemon athletica, Inc., a textiles, apparel & luxury goods company, and CarMax, Inc., a specialty retail company (no longer held at fiscal year-end).
How Has The Fund Historically Performed?
Growth of $10,000 Investment
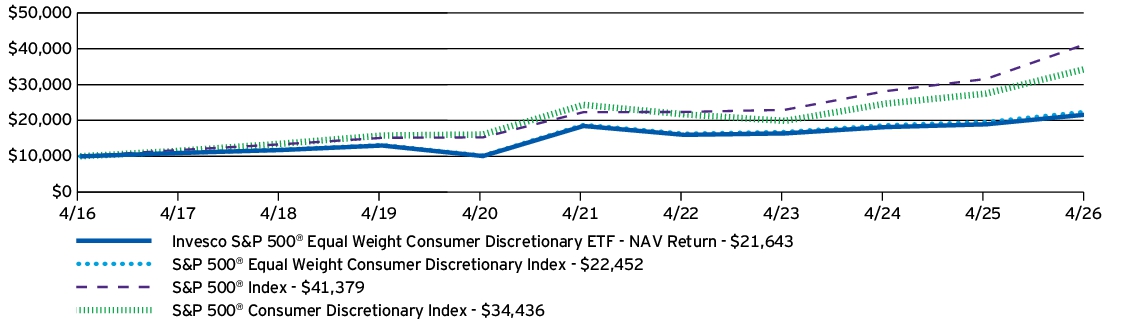
AVERAGE ANNUAL TOTAL RETURNS |
1 Year |
5 Years |
10 Years |
| Invesco S&P 500® Equal Weight Consumer Discretionary ETF — NAV Return | 14.41% | 3.24% | 8.03% |
| S&P 500® Equal Weight Consumer Discretionary Index | 14.87% | 3.64% | 8.42% |
| S&P 500® Index | 31.05% | 13.14% | 15.26% |
| S&P 500® Consumer Discretionary Index | 25.23% | 7.19% | 13.16% |
Performance figures do not reflect deduction of taxes a shareholder would pay on Fund distributions or sale of Fund shares.
What Are Key Statistics About The Fund?
(as of April 30, 2026)
| Fund net assets | $277,538,222 |
| Total number of portfolio holdings | 49 |
| Total advisory fees paid | $906,200 |
| Portfolio turnover rate | 27% |
What Comprised The Fund's Holdings?
(as of April 30, 2026)
Top ten holdings*
(% of net assets)
(% of net assets)
| Carvana Co. | 2.67% |
| Amazon.com, Inc. | 2.60% |
| eBay, Inc. | 2.36% |
| Marriott International, Inc., Class A | 2.31% |
| Hilton Worldwide Holdings, Inc. | 2.28% |
| D.R. Horton, Inc. | 2.25% |
| Expedia Group, Inc. | 2.25% |
| MGM Resorts International | 2.24% |
| Wynn Resorts Ltd. | 2.23% |
| Ross Stores, Inc. | 2.23% |
| * Excluding money market fund holdings, if any. |
Industry allocation
(% of net assets)
(% of net assets)
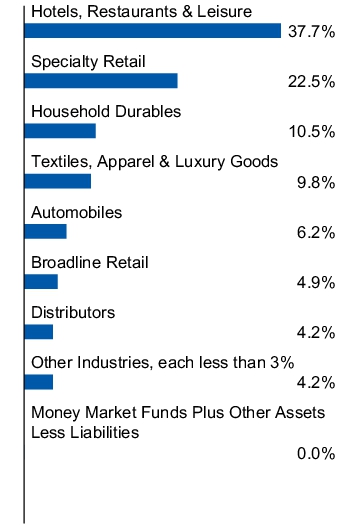
Top ten holdings*
(% of net assets)
(% of net assets)
| Carvana Co. | 2.67% |
| Amazon.com, Inc. | 2.60% |
| eBay, Inc. | 2.36% |
| Marriott International, Inc., Class A | 2.31% |
| Hilton Worldwide Holdings, Inc. | 2.28% |
| D.R. Horton, Inc. | 2.25% |
| Expedia Group, Inc. | 2.25% |
| MGM Resorts International | 2.24% |
| Wynn Resorts Ltd. | 2.23% |
| Ross Stores, Inc. | 2.23% |
| * Excluding money market fund holdings, if any. |
What Were The Fund Costs For The Last Year ?
(Based on a hypothetical $10,000 investment)
| Fund | Costs of a $10,000 investment | Costs paid as a percentage of a $10,000 investment |
| Invesco S&P SmallCap 600® Pure Growth ETF | $42 | 0.35% |
How Did The Fund Perform During The Period?
• During the fiscal year ended April 30, 2026, U.S. equities experienced positive returns for the majority of the year, although geopolitical conflict towards the end of the year sparked bouts of increased volatility. The Fund outperformed the S&P SmallCap 600® Growth Index primarily due to its strong security selection in the financials and industrials sectors.
• The Fund is passively managed and seeks to track the investment results (before fees and expenses) of the S&P SmallCap 600® Pure Growth Index (the “Index”). The Fund generally will invest at least 90% of its total assets in securities that comprise the Index.
• For the fiscal year ended April 30, 2026, the Fund's performance, on a net asset value ("NAV") basis, 39.77%, differed from the return of the Index, 40.28%, primarily due to fees and expenses incurred by the Fund during the period.
What contributed to performance?
Sector Allocations | Industrials sector, followed by information technology and financials sectors, respectively.
Positions | Powell Industries, Inc., an industrials company, and Protagonist Therapeutics, Inc., a health care company.
What detracted from performance?
Sector Allocations | Consumer staples sector.
Positions | TG Therapeutics, Inc., a health care company, and ADMA Biologics, Inc., a health care company.
How Has The Fund Historically Performed?
Growth of $10,000 Investment
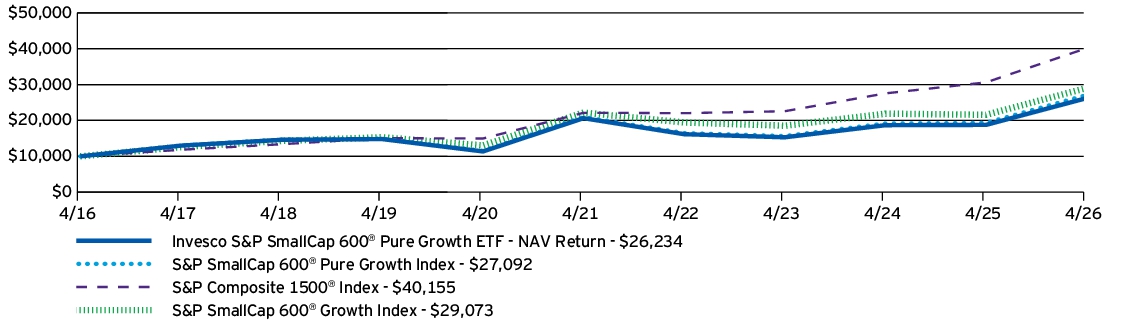
AVERAGE ANNUAL TOTAL RETURNS |
1 Year |
5 Years |
10 Years |
| Invesco S&P SmallCap 600® Pure Growth ETF — NAV Return | 39.77% | 4.93% | 10.13% |
| S&P SmallCap 600® Pure Growth Index | 40.28% | 5.26% | 10.48% |
| S&P Composite 1500® Index | 31.17% | 12.65% | 14.91% |
| S&P SmallCap 600® Growth Index | 34.80% | 5.56% | 11.26% |
Performance figures do not reflect deduction of taxes a shareholder would pay on Fund distributions or sale of Fund shares.
What Are Key Statistics About The Fund?
(as of April 30, 2026)
| Fund net assets | $121,800,817 |
| Total number of portfolio holdings | 133 |
| Total advisory fees paid | $366,821 |
| Portfolio turnover rate | 81% |
What Comprised The Fund's Holdings?
(as of April 30, 2026)
Top ten holdings*
(% of net assets)
(% of net assets)
| Powell Industries, Inc. | 2.15% |
| Argan, Inc. | 1.86% |
| ACM Research, Inc., Class A | 1.68% |
| Uniti Group, Inc. | 1.65% |
| Primoris Services Corp. | 1.63% |
| StoneX Group, Inc. | 1.61% |
| Clear Secure, Inc., Class A | 1.61% |
| DXP Enterprises, Inc. | 1.55% |
| Adeia, Inc. | 1.54% |
| Adamas Trust, Inc. | 1.45% |
| * Excluding money market fund holdings, if any. |
Sector allocation
(% of net assets)
(% of net assets)
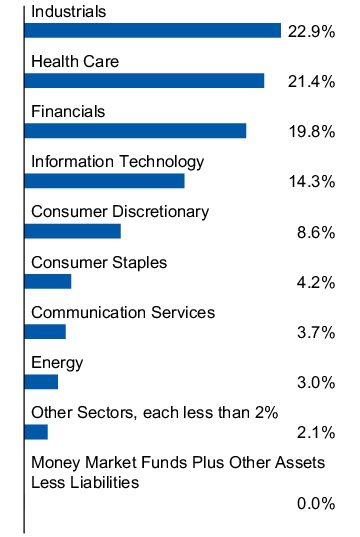
Top ten holdings*
(% of net assets)
(% of net assets)
| Powell Industries, Inc. | 2.15% |
| Argan, Inc. | 1.86% |
| ACM Research, Inc., Class A | 1.68% |
| Uniti Group, Inc. | 1.65% |
| Primoris Services Corp. | 1.63% |
| StoneX Group, Inc. | 1.61% |
| Clear Secure, Inc., Class A | 1.61% |
| DXP Enterprises, Inc. | 1.55% |
| Adeia, Inc. | 1.54% |
| Adamas Trust, Inc. | 1.45% |
| * Excluding money market fund holdings, if any. |
What Were The Fund Costs For The Last Year ?
(Based on a hypothetical $10,000 investment)
| Fund | Costs of a $10,000 investment | Costs paid as a percentage of a $10,000 investment |
| Invesco S&P SmallCap 600® Pure Value ETF | $44 | 0.35% |
How Did The Fund Perform During The Period?
• During the fiscal year ended April 30, 2026, U.S. equities experienced positive returns for the majority of the year, although geopolitical conflict towards the end of the year sparked bouts of increased volatility. The Fund outperformed the S&P SmallCap 600® Value Index primarily due to its strong security selection in and overweight allocation to the consumer discretionary and energy sectors.
• The Fund is passively managed and seeks to track the investment results (before fees and expenses) of the S&P SmallCap 600® Pure Value Index (the “Index”). The Fund generally will invest at least 90% of its total assets in securities that comprise the Index.
• For the fiscal year ended April 30, 2026, the Fund's performance, on a net asset value ("NAV") basis, 51.70%, differed from the return of the Index, 52.07%, primarily due to fees and expenses incurred by the Fund during the period.
What contributed to performance?
Sector Allocations | Consumer discretionary sector, followed by the energy and industrials sectors, respectively.
Positions | Viasat, Inc., an information technology company (no longer held at fiscal year-end), and Par Pacific Holdings, Inc., an energy company (no longer held at fiscal year-end).
What detracted from performance?
Sector Allocations | No sector allocations detracted from the Fund's performance during the period.
Positions | B&G Foods, Inc., a consumer staples company (no longer held at fiscal year-end), and Grocery Outlet Holding Corp., a consumer staples company.
How Has The Fund Historically Performed?
Growth of $10,000 Investment
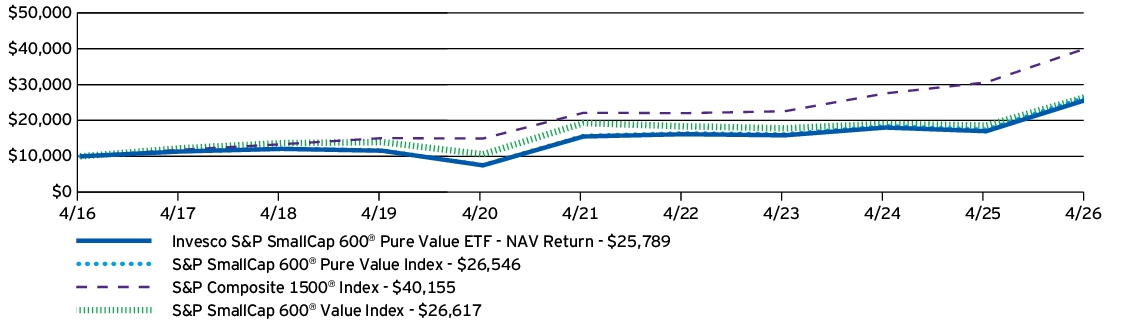
AVERAGE ANNUAL TOTAL RETURNS |
1 Year |
5 Years |
10 Years |
| Invesco S&P SmallCap 600® Pure Value ETF — NAV Return | 51.70% | 10.68% | 9.94% |
| S&P SmallCap 600® Pure Value Index | 52.07% | 11.04% | 10.26% |
| S&P Composite 1500® Index | 31.17% | 12.65% | 14.91% |
| S&P SmallCap 600® Value Index | 43.27% | 6.67% | 10.28% |
Performance figures do not reflect deduction of taxes a shareholder would pay on Fund distributions or sale of Fund shares.
What Are Key Statistics About The Fund?
(as of April 30, 2026)
| Fund net assets | $267,333,971 |
| Total number of portfolio holdings | 162 |
| Total advisory fees paid | $790,911 |
| Portfolio turnover rate | 69% |
What Comprised The Fund's Holdings?
(as of April 30, 2026)
Top ten holdings*
(% of net assets)
(% of net assets)
| Ichor Holdings Ltd. | 1.93% |
| Acadia Healthcare Co., Inc. | 1.76% |
| Patterson-UTI Energy, Inc. | 1.61% |
| ArcBest Corp. | 1.41% |
| Edgewell Personal Care Co. | 1.39% |
| Molina Healthcare, Inc. | 1.34% |
| Koppers Holdings, Inc. | 1.23% |
| AdaptHealth Corp. | 1.22% |
| MarineMax, Inc. | 1.20% |
| ManpowerGroup, Inc. | 1.20% |
| * Excluding money market fund holdings, if any. |
Sector allocation
(% of net assets)
(% of net assets)
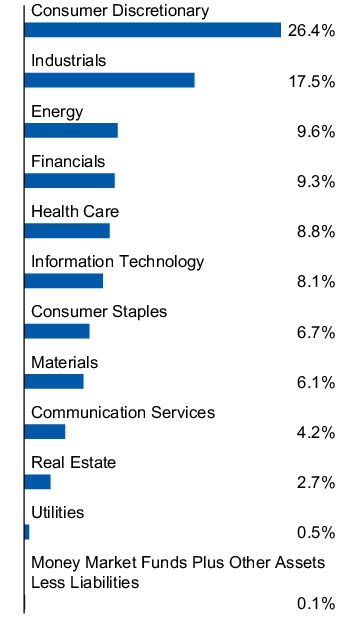
Top ten holdings*
(% of net assets)
(% of net assets)
| Ichor Holdings Ltd. | 1.93% |
| Acadia Healthcare Co., Inc. | 1.76% |
| Patterson-UTI Energy, Inc. | 1.61% |
| ArcBest Corp. | 1.41% |
| Edgewell Personal Care Co. | 1.39% |
| Molina Healthcare, Inc. | 1.34% |
| Koppers Holdings, Inc. | 1.23% |
| AdaptHealth Corp. | 1.22% |
| MarineMax, Inc. | 1.20% |
| ManpowerGroup, Inc. | 1.20% |
| * Excluding money market fund holdings, if any. |
What Were The Fund Costs For The Last Year ?
(Based on a hypothetical $10,000 investment)
| Fund | Costs of a $10,000 investment | Costs paid as a percentage of a $10,000 investment |
| Invesco Dow Jones Industrial Average Dividend ETF | $8 | 0.07% |
How Did The Fund Perform During The Period?
• During the fiscal year ended April 30, 2026, U.S. equities experienced positive returns for the majority of the year, although geopolitical conflict towards the end of the year sparked bouts of increased volatility. During the period, the Fund underperformed the Dow Jones Industrial Average Index primarily due to its security selection in and relative underweight allocation to the industrials sector.
• The Fund is passively managed and seeks to track the investment results (before fees and expenses) of the Dow Jones Industrial Average Yield Weighted Index (the “Index”). The Fund generally will invest at least 90% of its total assets in securities that comprise the Index.
• For the fiscal year ended April 30, 2026, the Fund's performance, on a net asset value ("NAV") basis, 23.63%, differed from the return of the Index, 23.76%, primarily due to fees and expenses incurred by the Fund during the period.
What contributed to performance?
Sector Allocations | Health care sector, followed by the financials and industrials sectors, respectively.
Positions | Caterpillar, Inc., an industrials company, and Chevron Corp., an energy company.
What detracted from performance?
Sector Allocations | Consumer discretionary sector, followed by the materials sector.
Positions | NIKE, Inc., Class B, a consumer discretionary company, and Salesforce, Inc., an information technology company.
How Has The Fund Historically Performed?
Growth of $10,000 Investment
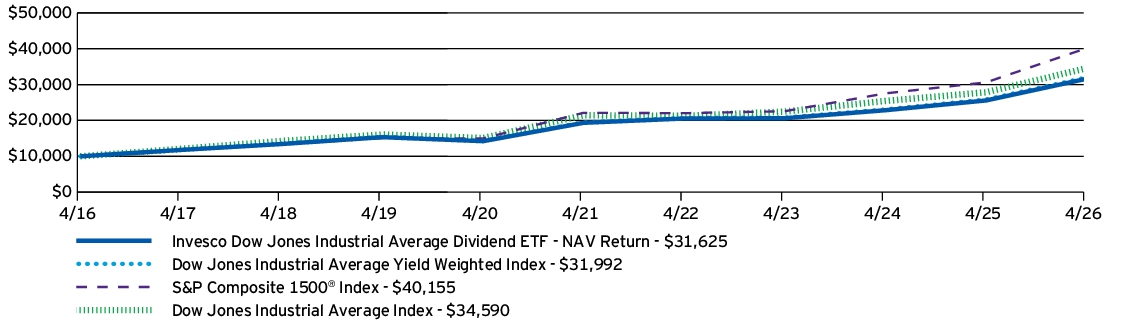
AVERAGE ANNUAL TOTAL RETURNS |
1 Year |
5 Years |
10 Years |
| Invesco Dow Jones Industrial Average Dividend ETF — NAV Return | 23.63% | 10.33% | 12.20% |
| Dow Jones Industrial Average Yield Weighted Index | 23.76% | 10.41% | 12.33% |
| S&P Composite 1500® Index | 31.17% | 12.65% | 14.91% |
| Dow Jones Industrial Average Index | 24.17% | 10.03% | 13.21% |
Performance figures do not reflect deduction of taxes a shareholder would pay on Fund distributions or sale of Fund shares.
What Are Key Statistics About The Fund?
(as of April 30, 2026)
| Fund net assets | $454,305,469 |
| Total number of portfolio holdings | 29 |
| Total advisory fees paid | $267,378 |
| Portfolio turnover rate | 18% |
What Comprised The Fund's Holdings?
(as of April 30, 2026)
Top ten holdings*
(% of net assets)
(% of net assets)
| Verizon Communications, Inc. | 9.80% |
| UnitedHealth Group, Inc. | 7.18% |
| Chevron Corp. | 7.04% |
| Coca-Cola Co. (The) | 4.83% |
| International Business Machines Corp. | 4.76% |
| Merck & Co., Inc. | 4.73% |
| Cisco Systems, Inc. | 4.54% |
| Procter & Gamble Co. (The) | 4.45% |
| Amgen, Inc. | 4.36% |
| Goldman Sachs Group, Inc. (The) | 4.30% |
| * Excluding money market fund holdings, if any. |
Sector allocation
(% of net assets)
(% of net assets)
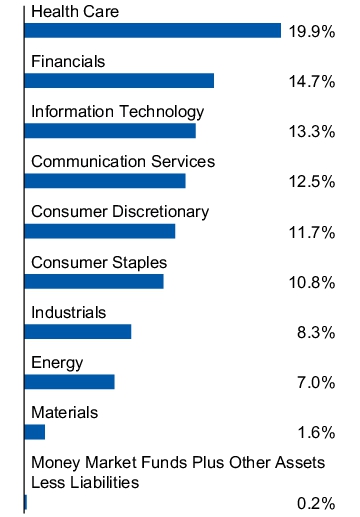
Top ten holdings*
(% of net assets)
(% of net assets)
| Verizon Communications, Inc. | 9.80% |
| UnitedHealth Group, Inc. | 7.18% |
| Chevron Corp. | 7.04% |
| Coca-Cola Co. (The) | 4.83% |
| International Business Machines Corp. | 4.76% |
| Merck & Co., Inc. | 4.73% |
| Cisco Systems, Inc. | 4.54% |
| Procter & Gamble Co. (The) | 4.45% |
| Amgen, Inc. | 4.36% |
| Goldman Sachs Group, Inc. (The) | 4.30% |
| * Excluding money market fund holdings, if any. |
What Were The Fund Costs For The Last Year ?
(Based on a hypothetical $10,000 investment)
| Fund | Costs of a $10,000 investment | Costs paid as a percentage of a $10,000 investment |
| Invesco Zacks Mid-Cap ETF | $75 | 0.69% |
How Did The Fund Perform During The Period?
• During the fiscal year ended April 30, 2026, U.S. equities experienced positive returns for the majority of the year, although geopolitical conflict towards the end of the year sparked bouts of increased volatility. The Fund underperformed the Russell Midcap® Index primarily due to poor security selection within the information technology and energy sectors.
• The Fund is passively managed and seeks to track the investment results (before fees and expenses) of the Zacks Mid-Cap Core Index (the “Index”). The Fund generally will invest at least 90% of its total assets in securities that comprise the Index, as well as American depositary receipts (“ADRs”) that represent securities in the Index.
• For the fiscal year ended April 30, 2026, the Fund's performance, on a net asset value ("NAV") basis, 17.89%, differed from the return of the Index, 18.79%, primarily due to fees and expenses incurred by the Fund during the period, which was compounded during a period of strong performance.
What contributed to performance?
Sector Allocations | Financials sector, followed by the information technology and industrials sectors, respectively.
Positions | Keysight Technologies, Inc., an information technology company (no longer held at fiscal year-end), and State Street Corp., a financials company.
What detracted from performance?
Sector Allocations | Real estate sector, followed by the health care sector.
Positions | Centene Corp., a health care company, and Brown & Brown, Inc., a financials company (no longer held at fiscal year-end).
How Has The Fund Historically Performed?
Growth of $10,000 Investment
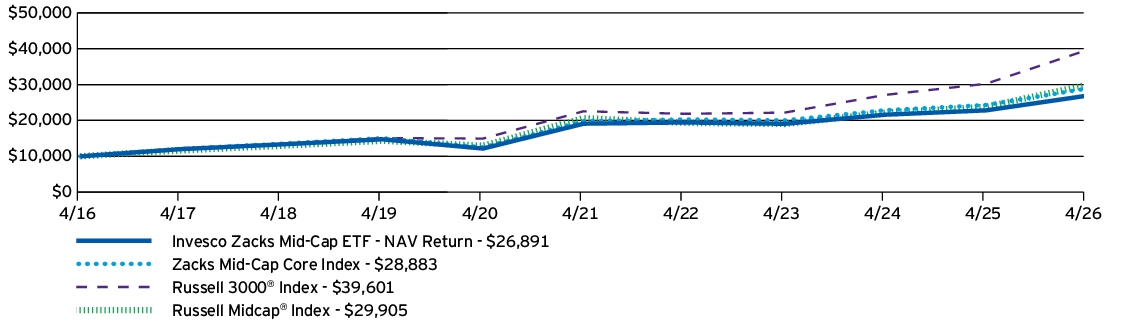
AVERAGE ANNUAL TOTAL RETURNS |
1 Year |
5 Years |
10 Years |
| Invesco Zacks Mid-Cap ETF — NAV Return | 17.89% | 7.09% | 10.40% |
| Zacks Mid-Cap Core Index | 18.79% | 7.86% | 11.19% |
| Russell 3000® Index | 31.01% | 11.91% | 14.75% |
| Russell Midcap® Index | 25.78% | 7.72% | 11.58% |
Performance figures do not reflect deduction of taxes a shareholder would pay on Fund distributions or sale of Fund shares.
What Are Key Statistics About The Fund?
(as of April 30, 2026)
| Fund net assets | $186,045,010 |
| Total number of portfolio holdings | 104 |
| Total advisory fees paid | $921,969 |
| Portfolio turnover rate | 140% |
What Comprised The Fund's Holdings?
(as of April 30, 2026)
Top ten holdings*
(% of net assets)
(% of net assets)
| State Street Corp. | 2.08% |
| American International Group, Inc. | 2.02% |
| Public Service Enterprise Group, Inc. | 2.02% |
| Hartford Insurance Group, Inc. (The) | 1.86% |
| Las Vegas Sands Corp. | 1.86% |
| Roper Technologies, Inc. | 1.85% |
| PG&E Corp. | 1.83% |
| Trip.com Group Ltd., ADR | 1.81% |
| Sysco Corp. | 1.77% |
| Viking Holdings Ltd. | 1.74% |
| * Excluding money market fund holdings, if any. |
Sector allocation
(% of net assets)
(% of net assets)
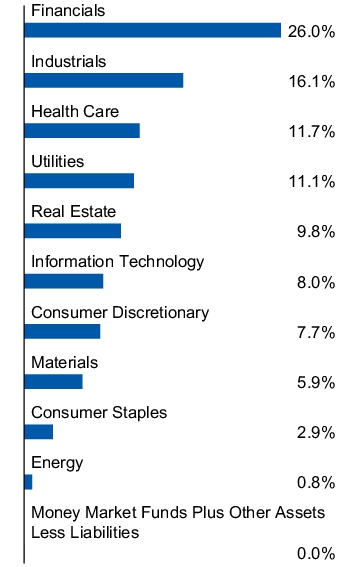
Top ten holdings*
(% of net assets)
(% of net assets)
| State Street Corp. | 2.08% |
| American International Group, Inc. | 2.02% |
| Public Service Enterprise Group, Inc. | 2.02% |
| Hartford Insurance Group, Inc. (The) | 1.86% |
| Las Vegas Sands Corp. | 1.86% |
| Roper Technologies, Inc. | 1.85% |
| PG&E Corp. | 1.83% |
| Trip.com Group Ltd., ADR | 1.81% |
| Sysco Corp. | 1.77% |
| Viking Holdings Ltd. | 1.74% |
| * Excluding money market fund holdings, if any. |
What Were The Fund Costs For The Last Year ?
(Based on a hypothetical $10,000 investment)
| Fund | Costs of a $10,000 investment | Costs paid as a percentage of a $10,000 investment |
| Invesco Zacks Multi-Asset Income ETF | $81 | 0.73% |
How Did The Fund Perform During The Period?
• During the fiscal year ended April 30, 2026, high dividend paying and preferred equities, as well as closed-end funds, underperformed the broader market. The Fund underperformed the S&P 500® Index primarily due to a significant underweight allocation to the information technology sector.
• The Fund is passively managed and seeks to track the investment results (before fees and expenses) of the Zacks Multi-Asset Income Index (the “Index”). The Fund generally will invest at least 90% of its total assets in securities that comprise the Index, as well as American depositary receipts (“ADRs”) that represent securities in the Index.
• For the fiscal year ended April 30, 2026, the Fund's performance, on a net asset value ("NAV") basis, 22.86%, differed from the return of the Index, 23.91%, primarily due to fees and expenses incurred by the Fund during the period.
What contributed to performance?
Sector Allocations | Energy sector, followed by financials and consumer discretionary sectors, respectively.
Positions | Peabody Energy Corp., an energy company (no longer held at fiscal year-end), and Signet Jewelers Ltd., a consumer discretionary company (no longer held at fiscal year-end).
What detracted from performance?
Sector Allocations | Consumer staples sector.
Positions | Concentrix Corp., an industrials company, and Graphic Packaging Holding Co., a materials company.
How Has The Fund Historically Performed?
Growth of $10,000 Investment
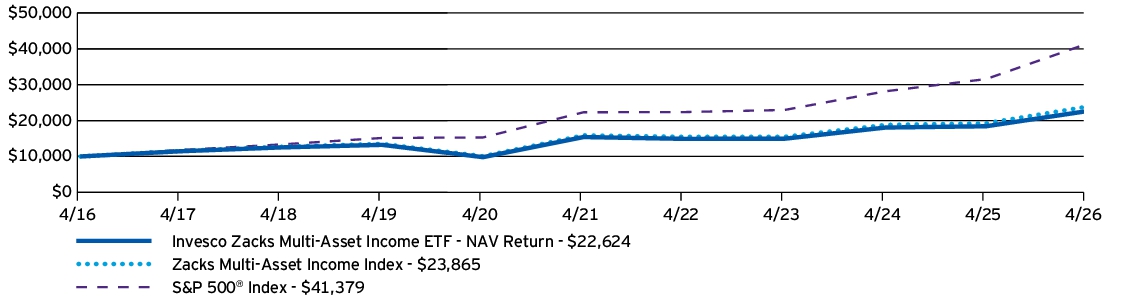
AVERAGE ANNUAL TOTAL RETURNS |
1 Year |
5 Years |
10 Years |
| Invesco Zacks Multi-Asset Income ETF — NAV Return | 22.86% | 7.98% | 8.51% |
| Zacks Multi-Asset Income Index | 23.91% | 8.47% | 9.09% |
| S&P 500® Index | 31.05% | 13.14% | 15.26% |
Performance figures do not reflect deduction of taxes a shareholder would pay on Fund distributions or sale of Fund shares.
What Are Key Statistics About The Fund?
(as of April 30, 2026)
| Fund net assets | $120,285,479 |
| Total number of portfolio holdings | 152 |
| Total advisory fees paid | $572,035 |
| Portfolio turnover rate | 159% |
What Comprised The Fund's Holdings?
(as of April 30, 2026)
Top ten holdings*
(% of net assets)
(% of net assets)
| SM Energy Co. | 1.35% |
| Matador Resources Co. | 1.23% |
| Virtu Financial, Inc., Class A | 1.19% |
| BP PLC, ADR | 1.15% |
| SLM Corp. | 1.14% |
| Dell Technologies, Inc., Class C | 1.14% |
| KKR & Co., Inc., Series D, Conv. Pfd., 6.25% | 1.13% |
| Icahn Enterprises L.P. | 1.11% |
| Plains All American Pipeline L.P. | 1.10% |
| Tortoise Energy Infrastructure Corp. | 1.09% |
| * Excluding money market fund holdings, if any. |
Sector allocation
(% of net assets)
(% of net assets)
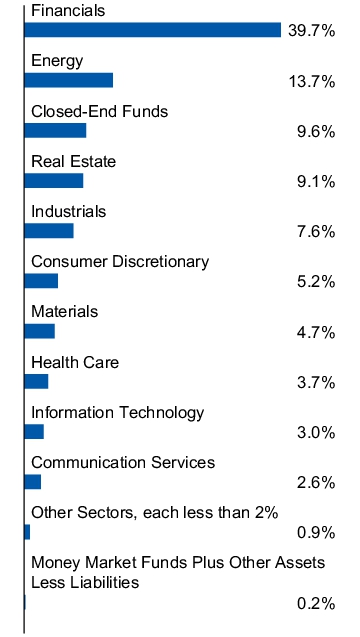
Top ten holdings*
(% of net assets)
(% of net assets)
| SM Energy Co. | 1.35% |
| Matador Resources Co. | 1.23% |
| Virtu Financial, Inc., Class A | 1.19% |
| BP PLC, ADR | 1.15% |
| SLM Corp. | 1.14% |
| Dell Technologies, Inc., Class C | 1.14% |
| KKR & Co., Inc., Series D, Conv. Pfd., 6.25% | 1.13% |
| Icahn Enterprises L.P. | 1.11% |
| Plains All American Pipeline L.P. | 1.10% |
| Tortoise Energy Infrastructure Corp. | 1.09% |
| * Excluding money market fund holdings, if any. |
What Were The Fund Costs For The Last Year ?
(Based on a hypothetical $10,000 investment)
| Fund | Costs of a $10,000 investment | Costs paid as a percentage of a $10,000 investment |
| Invesco Bloomberg Analyst Rating Improvers ETF | $43 | 0.40% |
How Did The Fund Perform During The Period?
• During the fiscal year ended April 30, 2026, U.S. equities experienced positive returns for the majority of the year, although geopolitical conflict towards the end of the year sparked bouts of increased volatility. During the period, companies included in the Bloomberg ANR Improvers Index pursuant to the proprietary security selection methodology generally underperformed the broader stock market, although certain holdings performed well relative to the S&P MidCap 400® Index.
• The Fund is passively managed and seeks to track the investment results (before fees and expenses) of the Bloomberg ANR Improvers Index (the “Index”). The Fund generally will invest at least 90% of its total assets in securities that comprise the Index.
• For the fiscal year ended April 30, 2026, the Fund's performance, on a net asset value ("NAV") basis, 15.89%, differed from the return of the Index, 16.40%, primarily due to fees and expenses incurred by the Fund during the period.
What contributed to performance?
Sector Allocations | Industrials sector, followed by the consumer discretionary and information technology sectors, respectively.
Positions | Caterpillar, Inc., an industrials company, and Intel Corp., an information technology company.
What detracted from performance?
Sector Allocations | Consumer staples sector, followed by the financials and materials sectors, respectively.
Positions | Gartner, Inc., an information technology company (no longer held at fiscal year-end), and DocuSign, Inc., an information technology company (no longer held at fiscal year-end).
How Has The Fund Historically Performed?
Growth of $10,000 Investment
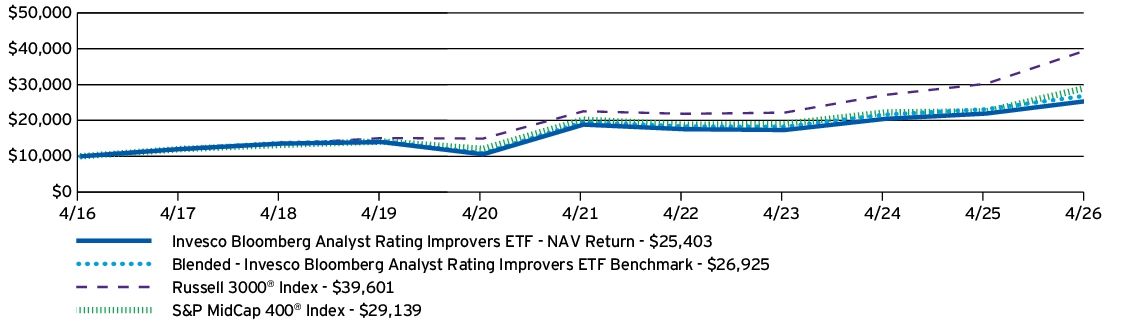
AVERAGE ANNUAL TOTAL RETURNS |
1 Year |
5 Years |
10 Years |
| Invesco Bloomberg Analyst Rating Improvers ETF — NAV Return | 15.89% | 6.16% | 9.77% |
| Blended - Invesco Bloomberg Analyst Rating Improvers ETF Benchmark | 16.40% | 6.63% | 10.41% |
| Russell 3000® Index | 31.01% | 11.91% | 14.75% |
| S&P MidCap 400® Index | 29.49% | 7.60% | 11.29% |
Performance figures do not reflect deduction of taxes a shareholder would pay on Fund distributions or sale of Fund shares.
What Are Key Statistics About The Fund?
(as of April 30, 2026)
| Fund net assets | $112,553,766 |
| Total number of portfolio holdings | 52 |
| Total advisory fees paid | $432,649 |
| Portfolio turnover rate | 170% |
What Comprised The Fund's Holdings?
(as of April 30, 2026)
Top ten holdings*
(% of net assets)
(% of net assets)
| Intel Corp. | 4.22% |
| Caterpillar, Inc. | 2.40% |
| F5, Inc. | 2.37% |
| Cummins, Inc. | 2.30% |
| Airbnb, Inc., Class A | 2.29% |
| Dick's Sporting Goods, Inc. | 2.27% |
| Old Dominion Freight Line, Inc. | 2.22% |
| NetApp, Inc. | 2.22% |
| American Electric Power Co., Inc. | 2.19% |
| Trane Technologies PLC | 2.18% |
| * Excluding money market fund holdings, if any. |
Sector allocation
(% of net assets)
(% of net assets)
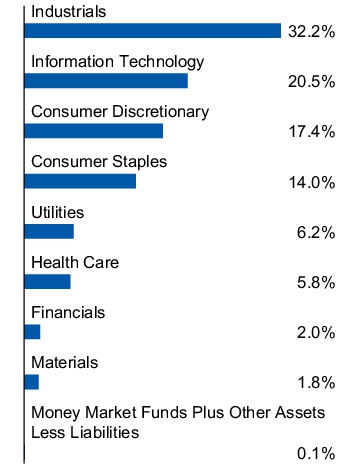
Top ten holdings*
(% of net assets)
(% of net assets)
| Intel Corp. | 4.22% |
| Caterpillar, Inc. | 2.40% |
| F5, Inc. | 2.37% |
| Cummins, Inc. | 2.30% |
| Airbnb, Inc., Class A | 2.29% |
| Dick's Sporting Goods, Inc. | 2.27% |
| Old Dominion Freight Line, Inc. | 2.22% |
| NetApp, Inc. | 2.22% |
| American Electric Power Co., Inc. | 2.19% |
| Trane Technologies PLC | 2.18% |
| * Excluding money market fund holdings, if any. |
What Were The Fund Costs For The Last Year ?
(Based on a hypothetical $10,000 investment)
| Fund | Costs of a $10,000 investment | Costs paid as a percentage of a $10,000 investment |
| Invesco S&P Spin-Off ETF | $89 | 0.65%† |
|
† |
Reflects fee waivers and/or expense reimbursements, without which expenses would have been higher. |
How Did The Fund Perform During The Period?
• During the fiscal year ended April 30, 2026, spin-off activity performed well, with increased scale and complexity. Security selection within the information technology sector and overweight allocation to the industrials sector created a tailwind to the Fund's performance relative to the Russell Midcap® Index.
• The Fund is passively managed and seeks to track the investment results (before fees and expenses) of the S&P U.S. Spin-Off Index (the “Index”). The Fund generally will invest at least 90% of its total assets in securities that comprise the Index.
• For the fiscal year ended April 30, 2026, the Fund's performance, on a net asset value ("NAV") basis, 74.01%, differed from the return of the Index, 75.15%, primarily due to fees and expenses incurred by the Fund during the period, which was compounded during a period of strong performance.
What contributed to performance?
Sector Allocations | Information technology sector, followed by the industrials and utilities sectors, respectively.
Positions | Sandisk Corp., an information technology company, and GE Vernova, Inc., an industrials company.
What detracted from performance?
Sector Allocations | Health care sector.
Positions | Kyndryl Holdings, Inc., an information technology company (no longer held at fiscal year-end), and Organon & Co., a health care company (no longer held at fiscal year-end).
How Has The Fund Historically Performed?
Growth of $10,000 Investment
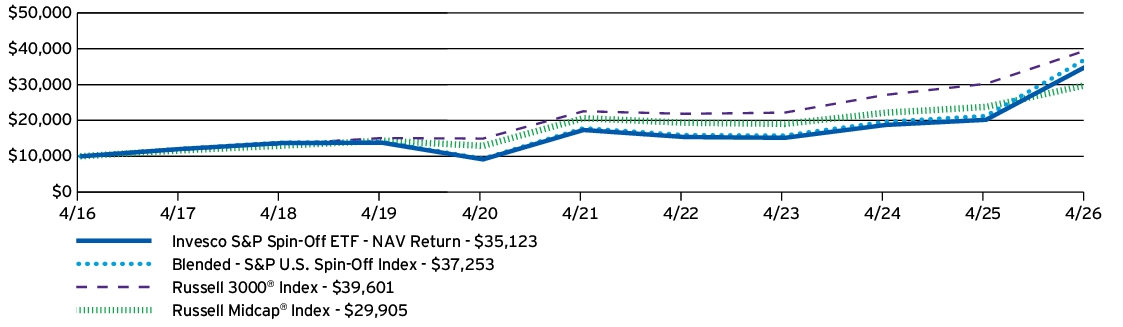
AVERAGE ANNUAL TOTAL RETURNS |
1 Year |
5 Years |
10 Years |
| Invesco S&P Spin-Off ETF — NAV Return | 74.01% | 15.17% | 13.39% |
| Blended - S&P U.S. Spin-Off Index | 75.15% | 15.87% | 14.06% |
| Russell 3000® Index | 31.01% | 11.91% | 14.75% |
| Russell Midcap® Index | 25.78% | 7.72% | 11.58% |
Performance figures do not reflect deduction of taxes a shareholder would pay on Fund distributions or sale of Fund shares.
What Are Key Statistics About The Fund?
(as of April 30, 2026)
| Fund net assets | $149,305,722 |
| Total number of portfolio holdings | 28 |
| Total advisory fees paid | $415,153 |
| Portfolio turnover rate | 117% |
What Comprised The Fund's Holdings?
(as of April 30, 2026)
Top ten holdings*
(% of net assets)
(% of net assets)
| Sandisk Corp. | 9.92% |
| GE Vernova, Inc. | 8.18% |
| Qnity Electronics, Inc. | 7.03% |
| Veralto Corp. | 6.12% |
| GE HealthCare Technologies, Inc. | 5.70% |
| Everus Construction Group, Inc. | 4.87% |
| Solstice Advanced Materials, Inc. | 4.49% |
| Solventum Corp. | 4.38% |
| Ralliant Corp. | 4.34% |
| U-Haul Holding Co., Series N | 4.34% |
| * Excluding money market fund holdings, if any. |
Sector allocation
(% of net assets)
(% of net assets)
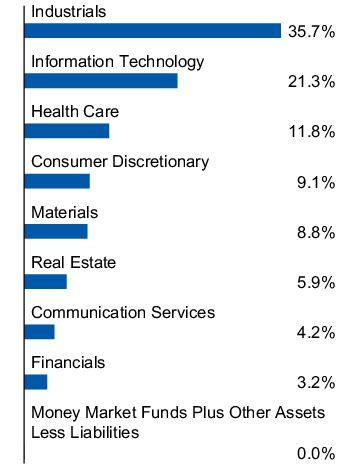
Top ten holdings*
(% of net assets)
(% of net assets)
| Sandisk Corp. | 9.92% |
| GE Vernova, Inc. | 8.18% |
| Qnity Electronics, Inc. | 7.03% |
| Veralto Corp. | 6.12% |
| GE HealthCare Technologies, Inc. | 5.70% |
| Everus Construction Group, Inc. | 4.87% |
| Solstice Advanced Materials, Inc. | 4.49% |
| Solventum Corp. | 4.38% |
| Ralliant Corp. | 4.34% |
| U-Haul Holding Co., Series N | 4.34% |
| * Excluding money market fund holdings, if any. |
What Were The Fund Costs For The Last Year ?
(Based on a hypothetical $10,000 investment)
| Fund | Costs of a $10,000 investment | Costs paid as a percentage of a $10,000 investment |
| Invesco S&P 500® Equal Weight Consumer Staples ETF | $40 | 0.40% |
How Did The Fund Perform During The Period?
• During the fiscal year ended April 30, 2026, U.S. equities experienced positive returns for the majority of the year, although geopolitical conflict towards the end of the year sparked bouts of increased volatility. During the period, consumer staples stocks underperformed the broader market. The Fund's focus on consumer staples securities created a performance headwind relative to the S&P 500® Index.
• The Fund is passively managed and seeks to track the investment results (before fees and expenses) of the S&P 500® Equal Weight Consumer Staples Index (the “Index”). The Fund generally will invest at least 90% of its total assets in securities that comprise the Index.
• For the fiscal year ended April 30, 2026, the Fund's performance, on a net asset value ("NAV") basis, 0.77%, differed from the return of the Index, 1.10%, primarily due to fees and expenses incurred by the Fund during the period.
What contributed to performance?
Industry Allocations | Consumer staples distribution & retail industry, followed by the tobacco and personal care products industries, respectively.
Positions | Bunge Global S.A., a food products company, and Archer-Daniels-Midland Co., a food products company.
What detracted from performance?
Industry Allocations | Food products industry, followed by the household products industry.
Positions | Campbell's Co. (The), a food products company, and Conagra Brands, Inc., a food products company.
How Has The Fund Historically Performed?
Growth of $10,000 Investment
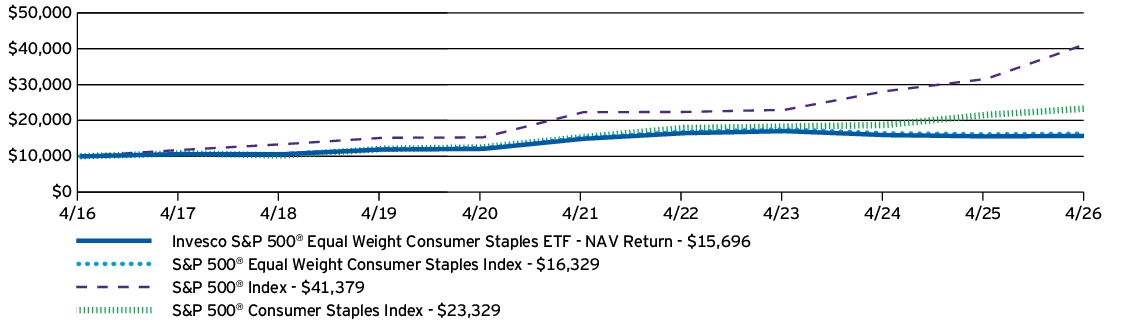
AVERAGE ANNUAL TOTAL RETURNS |
1 Year |
5 Years |
10 Years |
| Invesco S&P 500® Equal Weight Consumer Staples ETF — NAV Return | 0.77% | 1.05% | 4.61% |
| S&P 500® Equal Weight Consumer Staples Index | 1.10% | 1.46% | 5.03% |
| S&P 500® Index | 31.05% | 13.14% | 15.26% |
| S&P 500® Consumer Staples Index | 8.27% | 8.72% | 8.84% |
Performance figures do not reflect deduction of taxes a shareholder would pay on Fund distributions or sale of Fund shares.
What Are Key Statistics About The Fund?
(as of April 30, 2026)
| Fund net assets | $239,325,498 |
| Total number of portfolio holdings | 38 |
| Total advisory fees paid | $1,005,473 |
| Portfolio turnover rate | 29% |
What Comprised The Fund's Holdings?
(as of April 30, 2026)
Top ten holdings*
(% of net assets)
(% of net assets)
| Mondelez International, Inc., Class A | 3.17% |
| Altria Group, Inc. | 3.13% |
| Casey's General Stores, Inc. | 3.12% |
| Target Corp. | 3.12% |
| Tyson Foods, Inc., Class A | 3.06% |
| Walmart, Inc. | 3.05% |
| Brown-Forman Corp., Class B | 3.04% |
| Keurig Dr Pepper, Inc. | 3.04% |
| Archer-Daniels-Midland Co. | 3.01% |
| Constellation Brands, Inc., Class A | 2.98% |
| * Excluding money market fund holdings, if any. |
Industry allocation
(% of net assets)
(% of net assets)
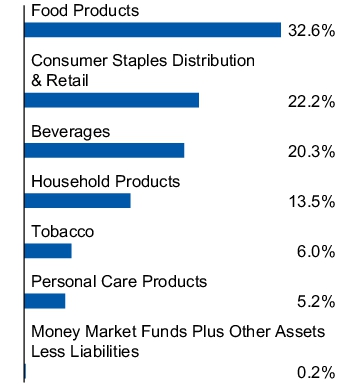
Top ten holdings*
(% of net assets)
(% of net assets)
| Mondelez International, Inc., Class A | 3.17% |
| Altria Group, Inc. | 3.13% |
| Casey's General Stores, Inc. | 3.12% |
| Target Corp. | 3.12% |
| Tyson Foods, Inc., Class A | 3.06% |
| Walmart, Inc. | 3.05% |
| Brown-Forman Corp., Class B | 3.04% |
| Keurig Dr Pepper, Inc. | 3.04% |
| Archer-Daniels-Midland Co. | 3.01% |
| Constellation Brands, Inc., Class A | 2.98% |
| * Excluding money market fund holdings, if any. |
What Were The Fund Costs For The Last Year ?
(Based on a hypothetical $10,000 investment)
| Fund | Costs of a $10,000 investment | Costs paid as a percentage of a $10,000 investment |
| Invesco S&P 500® Equal Weight Energy ETF | $52 | 0.40% |
How Did The Fund Perform During The Period?
• During the fiscal year ended April 30, 2026, U.S. equities experienced positive returns for the majority of the year, although geopolitical conflict towards the end of the year sparked bouts of increased volatility. During the period, energy stocks outperformed the broader market. The Fund's focus on energy securities created a performance tailwind relative to the S&P 500® Index.
• The Fund is passively managed and seeks to track the investment results (before fees and expenses) of the S&P 500® Equal Weight Energy Plus Index (the “Index”). The Fund generally will invest at least 90% of its total assets in securities that comprise the Index.
• For the fiscal year ended April 30, 2026, the Fund's performance, on a net asset value ("NAV") basis, 60.44%, differed from the return of the Index, 61.16%, primarily due to fees and expenses incurred by the Fund during the period, which was compounded during a period of strong performance.
What contributed to performance?
Industry Allocations | Oil, gas & consumable fuels industry, followed by the energy equipment & services industry.
Positions | APA Corp., an oil, gas & consumable fuels company, and Valero Energy Corp., an oil, gas & consumable fuels company.
What detracted from performance?
Industry Allocations | No industries detracted from the Fund's performance during the period.
Positions | No positions detracted from the Fund's performance during the period.
How Has The Fund Historically Performed?
Growth of $10,000 Investment
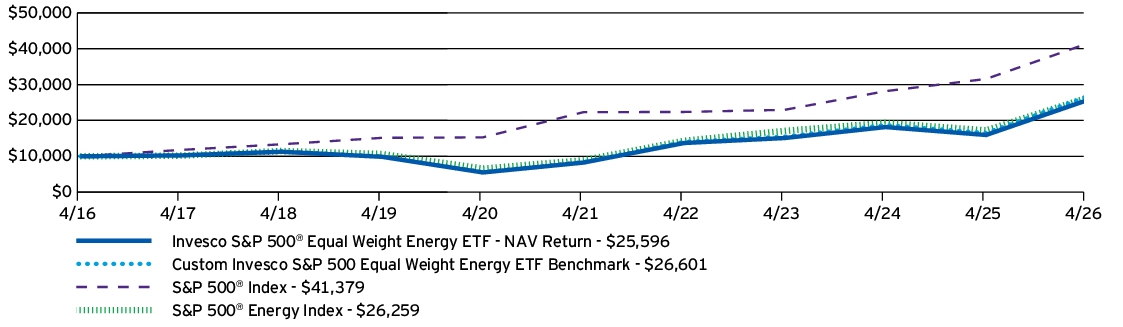
AVERAGE ANNUAL TOTAL RETURNS |
1 Year |
5 Years |
10 Years |
| Invesco S&P 500® Equal Weight Energy ETF — NAV Return | 60.44% | 25.37% | 9.85% |
| Custom Invesco S&P 500 Equal Weight Energy ETF Benchmark | 61.16% | 25.93% | 10.28% |
| S&P 500® Index | 31.05% | 13.14% | 15.26% |
| S&P 500® Energy Index | 52.40% | 24.12% | 10.14% |
Performance figures do not reflect deduction of taxes a shareholder would pay on Fund distributions or sale of Fund shares.
What Are Key Statistics About The Fund?
(as of April 30, 2026)
| Fund net assets | $628,520,338 |
| Total number of portfolio holdings | 25 |
| Total advisory fees paid | $1,877,773 |
| Portfolio turnover rate | 21% |
What Comprised The Fund's Holdings?
(as of April 30, 2026)
Top ten holdings*
(% of net assets)
(% of net assets)
| APA Corp. | 5.22% |
| Baker Hughes Co., Class A | 5.00% |
| SLB Ltd. | 4.99% |
| Halliburton Co. | 4.98% |
| Diamondback Energy, Inc. | 4.92% |
| Coterra Energy, Inc. | 4.84% |
| Devon Energy Corp. | 4.79% |
| Targa Resources Corp. | 4.65% |
| Marathon Petroleum Corp. | 4.63% |
| Valero Energy Corp. | 4.62% |
| * Excluding money market fund holdings, if any. |
Industry allocation
(% of net assets)
(% of net assets)
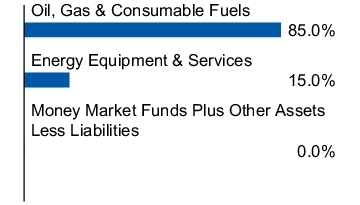
Top ten holdings*
(% of net assets)
(% of net assets)
| APA Corp. | 5.22% |
| Baker Hughes Co., Class A | 5.00% |
| SLB Ltd. | 4.99% |
| Halliburton Co. | 4.98% |
| Diamondback Energy, Inc. | 4.92% |
| Coterra Energy, Inc. | 4.84% |
| Devon Energy Corp. | 4.79% |
| Targa Resources Corp. | 4.65% |
| Marathon Petroleum Corp. | 4.63% |
| Valero Energy Corp. | 4.62% |
| * Excluding money market fund holdings, if any. |
What Were The Fund Costs For The Last Year ?
(Based on a hypothetical $10,000 investment)
| Fund | Costs of a $10,000 investment | Costs paid as a percentage of a $10,000 investment |
| Invesco S&P 500® Equal Weight ETF | $22 | 0.20% |
How Did The Fund Perform During The Period?
• During the fiscal year ended April 30, 2026, U.S. equities experienced positive returns for the majority of the year, although geopolitical conflict towards the end of the year sparked bouts of increased volatility. During the period, the Fund's equal weighting methodology led to lower exposure to mega cap stocks, creating a performance headwind relative to the S&P 500® Index.
• The Fund is passively managed and seeks to track the investment results (before fees and expenses) of the S&P 500® Equal Weight Index (the “Index”). The Fund generally will invest at least 90% of its total assets in securities that comprise the Index.
• For the fiscal year ended April 30, 2026, the Fund's performance, on a net asset value ("NAV") basis, 22.17%, differed from the return of the Index, 22.39%, primarily due to fees and expenses incurred by the Fund during the period.
What contributed to performance?
Sector Allocations | Information technology sector, followed by the industrials and energy sectors, respectively.
Positions | Western Digital Corp., an information technology company, and Seagate Technology Holdings PLC, an information technology company.
What detracted from performance?
Sector Allocations | No sectors detracted from the Fund's performance during the period.
Positions | Trade Desk, Inc. (The), Class A, a communication services company, and Gartner, Inc., an information technology company.
How Has The Fund Historically Performed?
Growth of $10,000 Investment
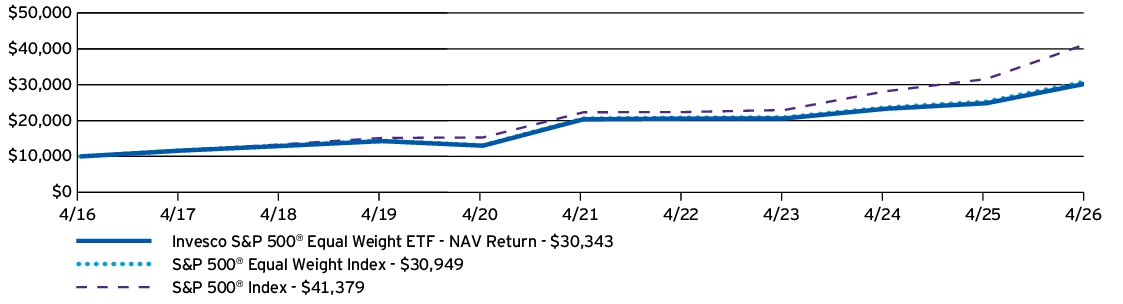
AVERAGE ANNUAL TOTAL RETURNS |
1 Year |
5 Years |
10 Years |
| Invesco S&P 500® Equal Weight ETF — NAV Return | 22.17% | 8.29% | 11.74% |
| S&P 500® Equal Weight Index | 22.39% | 8.50% | 11.96% |
| S&P 500® Index | 31.05% | 13.14% | 15.26% |
Performance figures do not reflect deduction of taxes a shareholder would pay on Fund distributions or sale of Fund shares.
What Are Key Statistics About The Fund?
(as of April 30, 2026)
| Fund net assets | $87,863,828,921 |
| Total number of portfolio holdings | 508 |
| Total advisory fees paid | $154,034,826 |
| Portfolio turnover rate | 27% |
What Comprised The Fund's Holdings?
(as of April 30, 2026)
Top ten holdings*
(% of net assets)
(% of net assets)
| Intel Corp. | 0.38% |
| Seagate Technology Holdings PLC | 0.34% |
| Advanced Micro Devices, Inc. | 0.33% |
| ON Semiconductor Corp. | 0.33% |
| Sandisk Corp. | 0.32% |
| Western Digital Corp. | 0.31% |
| Ciena Corp. | 0.30% |
| Monolithic Power Systems, Inc. | 0.29% |
| Centene Corp. | 0.29% |
| NXP Semiconductors N.V. | 0.28% |
| * Excluding money market fund holdings, if any. |
Sector allocation
(% of net assets)
(% of net assets)
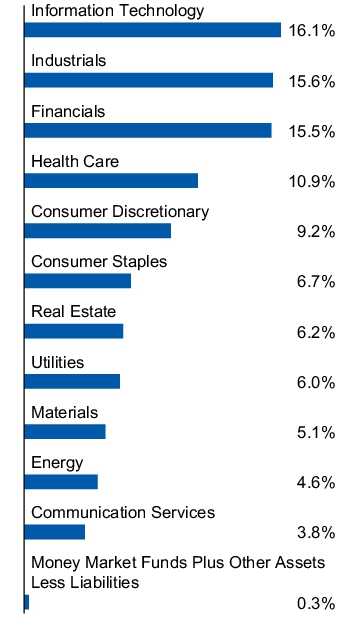
Top ten holdings*
(% of net assets)
(% of net assets)
| Intel Corp. | 0.38% |
| Seagate Technology Holdings PLC | 0.34% |
| Advanced Micro Devices, Inc. | 0.33% |
| ON Semiconductor Corp. | 0.33% |
| Sandisk Corp. | 0.32% |
| Western Digital Corp. | 0.31% |
| Ciena Corp. | 0.30% |
| Monolithic Power Systems, Inc. | 0.29% |
| Centene Corp. | 0.29% |
| NXP Semiconductors N.V. | 0.28% |
| * Excluding money market fund holdings, if any. |
What Were The Fund Costs For The Last Year ?
(Based on a hypothetical $10,000 investment)
| Fund | Costs of a $10,000 investment | Costs paid as a percentage of a $10,000 investment |
| Invesco S&P 500® Equal Weight Financials ETF | $42 | 0.40% |
How Did The Fund Perform During The Period?
• During the fiscal year ended April 30, 2026, U.S. equities experienced positive returns for the majority of the year, although geopolitical conflict towards the end of the year sparked bouts of increased volatility. During the period, financials stocks underperformed the broader market. The Fund's focus on financials securities created a performance headwind compared to the S&P 500® Index.
• The Fund is passively managed and seeks to track the investment results (before fees and expenses) of the S&P 500® Equal Weight Financials Index (the “Index”). The Fund generally will invest at least 90% of its total assets in securities that comprise the Index.
• For the fiscal year ended April 30, 2026, the Fund's performance, on a net asset value ("NAV") basis, 11.00%, differed from the return of the Index, 11.49%, primarily due to fees and expenses incurred by the Fund during the period.
What contributed to performance?
Industry Allocations | Banks industry, followed by capital markets and consumer finance industries, respectively.
Positions | Invesco Ltd., a capital markets company, and Citigroup, Inc., a banks company.
What detracted from performance?
Industry Allocations | Financial services industry, followed by the insurance industry.
Positions | Fiserv, Inc., a financial services company, and Brown & Brown, Inc., an insurance company.
How Has The Fund Historically Performed?
Growth of $10,000 Investment
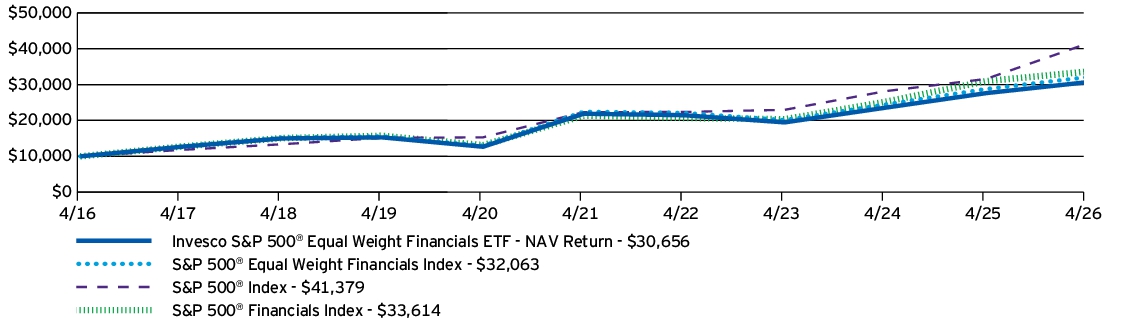
AVERAGE ANNUAL TOTAL RETURNS |
1 Year |
5 Years |
10 Years |
| Invesco S&P 500® Equal Weight Financials ETF — NAV Return | 11.00% | 6.99% | 11.85% |
| S&P 500® Equal Weight Financials Index | 11.49% | 7.42% | 12.36% |
| S&P 500® Index | 31.05% | 13.14% | 15.26% |
| S&P 500® Financials Index | 8.58% | 9.51% | 12.89% |
What Are Key Statistics About The Fund?
(as of April 30, 2026)
| Fund net assets | $276,798,716 |
| Total number of portfolio holdings | 79 |
| Total advisory fees paid | $1,218,335 |
| Portfolio turnover rate | 24% |
What Comprised The Fund's Holdings?
(as of April 30, 2026)
Top ten holdings*
(% of net assets)
(% of net assets)
| Apollo Global Management, Inc. | 1.50% |
| State Street Corp. | 1.50% |
| Franklin Resources, Inc. | 1.49% |
| KKR & Co., Inc., Class A | 1.48% |
| Morgan Stanley | 1.47% |
| Northern Trust Corp. | 1.46% |
| Citigroup, Inc. | 1.45% |
| Blackstone, Inc., Class A | 1.45% |
| Synchrony Financial | 1.45% |
| Interactive Brokers Group, Inc., Class A | 1.44% |
| * Excluding money market fund holdings, if any. |
Industry allocation
(% of net assets)
(% of net assets)
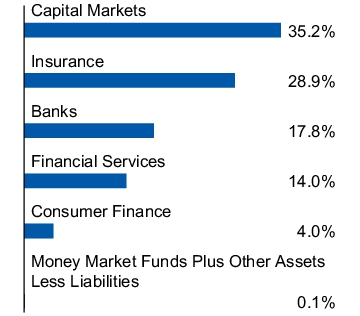
Top ten holdings*
(% of net assets)
(% of net assets)
| Apollo Global Management, Inc. | 1.50% |
| State Street Corp. | 1.50% |
| Franklin Resources, Inc. | 1.49% |
| KKR & Co., Inc., Class A | 1.48% |
| Morgan Stanley | 1.47% |
| Northern Trust Corp. | 1.46% |
| Citigroup, Inc. | 1.45% |
| Blackstone, Inc., Class A | 1.45% |
| Synchrony Financial | 1.45% |
| Interactive Brokers Group, Inc., Class A | 1.44% |
| * Excluding money market fund holdings, if any. |
What Were The Fund Costs For The Last Year ?
(Based on a hypothetical $10,000 investment)
| Fund | Costs of a $10,000 investment | Costs paid as a percentage of a $10,000 investment |
| Invesco S&P 500® Equal Weight Health Care ETF | $41 | 0.40% |
How Did The Fund Perform During The Period?
• During the fiscal year ended April 30, 2026, U.S. equities experienced positive returns for the majority of the year, although geopolitical conflict towards the end of the year sparked bouts of increased volatility. During the period, health care stocks underperformed the broader market. The Fund's focus on health care securities created a performance headwind compared to the S&P 500® Index.
• The Fund is passively managed and seeks to track the investment results (before fees and expenses) of the S&P 500® Equal Weight Health Care Index (the “Index”). The Fund generally will invest at least 90% of its total assets in securities that comprise the Index.
• For the fiscal year ended April 30, 2026, the Fund's performance, on a net asset value ("NAV") basis, 7.16%, differed from the return of the Index, 7.55%, primarily due to fees and expenses incurred by the Fund during the period.
What contributed to performance?
Industry Allocations | Biotechnology industry, followed by pharmaceuticals and life sciences tools & services industries, respectively.
Positions | Viatris, Inc., a pharmaceuticals company, and Moderna, Inc., a biotechnology company.
What detracted from performance?
Industry Allocations | Health care equipment & supplies industry.
Positions | Molina Healthcare, Inc., a health care providers & services company (no longer held at fiscal year-end), and Boston Scientific Corp., a health care equipment & supplies company.
How Has The Fund Historically Performed?
Growth of $10,000 Investment
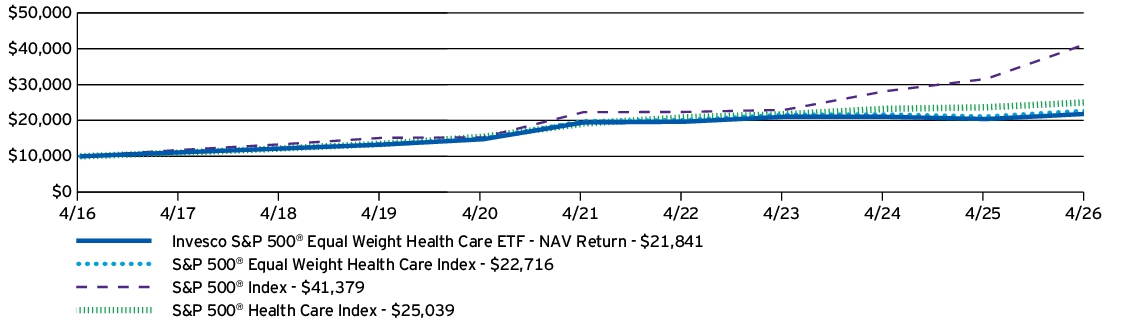
AVERAGE ANNUAL TOTAL RETURNS |
1 Year |
5 Years |
10 Years |
| Invesco S&P 500® Equal Weight Health Care ETF — NAV Return | 7.16% | 2.35% | 8.13% |
| S&P 500® Equal Weight Health Care Index | 7.55% | 2.76% | 8.55% |
| S&P 500® Index | 31.05% | 13.14% | 15.26% |
| S&P 500® Health Care Index | 5.77% | 5.54% | 9.61% |
What Are Key Statistics About The Fund?
(as of April 30, 2026)
| Fund net assets | $689,439,567 |
| Total number of portfolio holdings | 62 |
| Total advisory fees paid | $2,928,674 |
| Portfolio turnover rate | 24% |
What Comprised The Fund's Holdings?
(as of April 30, 2026)
Top ten holdings*
(% of net assets)
(% of net assets)
| Centene Corp. | 2.65% |
| Humana, Inc. | 2.44% |
| UnitedHealth Group, Inc. | 2.30% |
| Elevance Health, Inc. | 2.30% |
| West Pharmaceutical Services, Inc. | 2.21% |
| Cigna Group (The) | 1.97% |
| CVS Health Corp. | 1.94% |
| Viatris, Inc. | 1.89% |
| Mettler-Toledo International, Inc. | 1.84% |
| Waters Corp. | 1.84% |
| * Excluding money market fund holdings, if any. |
Industry allocation
(% of net assets)
(% of net assets)
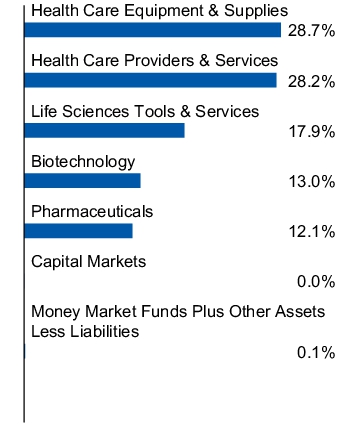
Top ten holdings*
(% of net assets)
(% of net assets)
| Centene Corp. | 2.65% |
| Humana, Inc. | 2.44% |
| UnitedHealth Group, Inc. | 2.30% |
| Elevance Health, Inc. | 2.30% |
| West Pharmaceutical Services, Inc. | 2.21% |
| Cigna Group (The) | 1.97% |
| CVS Health Corp. | 1.94% |
| Viatris, Inc. | 1.89% |
| Mettler-Toledo International, Inc. | 1.84% |
| Waters Corp. | 1.84% |
| * Excluding money market fund holdings, if any. |
What Were The Fund Costs For The Last Year ?
(Based on a hypothetical $10,000 investment)
| Fund | Costs of a $10,000 investment | Costs paid as a percentage of a $10,000 investment |
| Invesco S&P 500® Equal Weight Industrials ETF | $45 | 0.40% |
How Did The Fund Perform During The Period?
• During the fiscal year ended April 30, 2026, U.S. equities experienced positive returns for the majority of the year, although geopolitical conflict towards the end of the year sparked bouts of increased volatility. During the period, industrials stocks outperformed the broader market. Despite this, Fund's equal weighting methodology created a performance headwind compared to the S&P 500® Index.
• The Fund is passively managed and seeks to track the investment results (before fees and expenses) of the S&P 500® Equal Weight Industrials Index (the “Index”). The Fund generally will invest at least 90% of its total assets in securities that comprise the Index.
• For the fiscal year ended April 30, 2026, the Fund's performance, on a net asset value ("NAV") basis, 27.21%, differed from the return of the Index, 27.74%, primarily due to fees and expenses incurred by the Fund during the period.
What contributed to performance?
Industry Allocations | Machinery industry, followed by electrical equipment and aerospace & defense industries, respectively.
Positions | GE Vernova, Inc., an electrical equipment company, and Caterpillar, Inc., a machinery company
What detracted from performance?
Industry Allocations | Professional services industry, followed by the commercial services & supplies industry.
Positions | Copart, Inc., a commercial services & supplies company, and Paycom Software, Inc., a professional services company (no longer held at fiscal year-end).
How Has The Fund Historically Performed?
Growth of $10,000 Investment
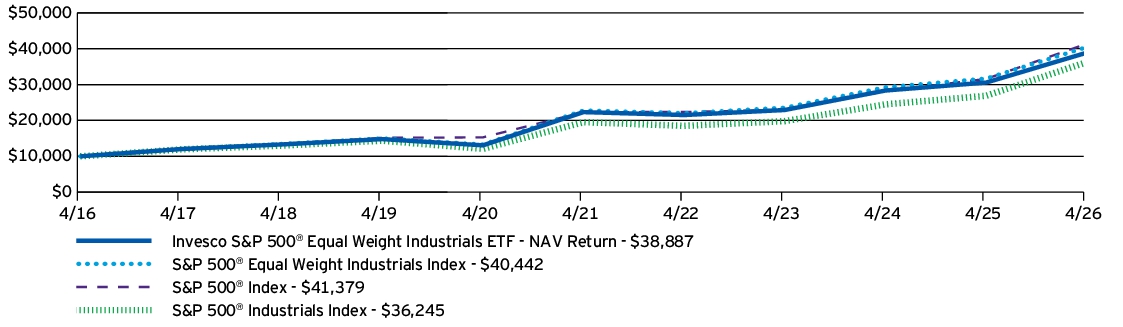
AVERAGE ANNUAL TOTAL RETURNS |
1 Year |
5 Years |
10 Years |
| Invesco S&P 500® Equal Weight Industrials ETF — NAV Return | 27.21% | 11.73% | 14.55% |
| S&P 500® Equal Weight Industrials Index | 27.74% | 12.17% | 15.00% |
| S&P 500® Index | 31.05% | 13.14% | 15.26% |
| S&P 500® Industrials Index | 34.84% | 13.17% | 13.74% |
Performance figures do not reflect deduction of taxes a shareholder would pay on Fund distributions or sale of Fund shares.
What Are Key Statistics About The Fund?
(as of April 30, 2026)
| Fund net assets | $1,002,288,442 |
| Total number of portfolio holdings | 82 |
| Total advisory fees paid | $2,981,051 |
| Portfolio turnover rate | 23% |
What Comprised The Fund's Holdings?
(as of April 30, 2026)
Top ten holdings*
(% of net assets)
(% of net assets)
| Comfort Systems USA, Inc. | 1.62% |
| Quanta Services, Inc. | 1.59% |
| GE Vernova, Inc. | 1.58% |
| Caterpillar, Inc. | 1.56% |
| EMCOR Group, Inc. | 1.53% |
| United Rentals, Inc. | 1.52% |
| Vertiv Holdings Co., Class A | 1.51% |
| Generac Holdings, Inc. | 1.51% |
| Eaton Corp. PLC | 1.51% |
| Cummins, Inc. | 1.49% |
| * Excluding money market fund holdings, if any. |
Industry allocation
(% of net assets)
(% of net assets)
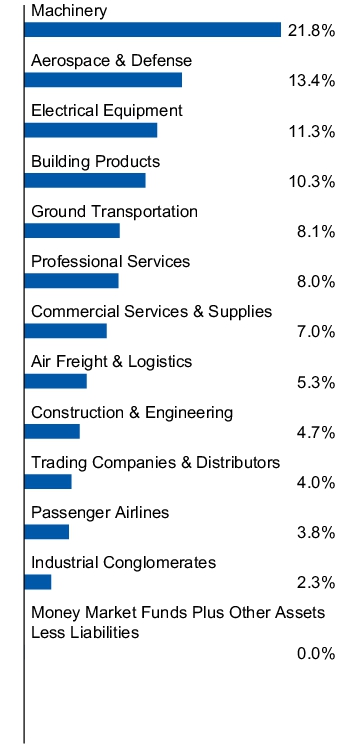
Top ten holdings*
(% of net assets)
(% of net assets)
| Comfort Systems USA, Inc. | 1.62% |
| Quanta Services, Inc. | 1.59% |
| GE Vernova, Inc. | 1.58% |
| Caterpillar, Inc. | 1.56% |
| EMCOR Group, Inc. | 1.53% |
| United Rentals, Inc. | 1.52% |
| Vertiv Holdings Co., Class A | 1.51% |
| Generac Holdings, Inc. | 1.51% |
| Eaton Corp. PLC | 1.51% |
| Cummins, Inc. | 1.49% |
| * Excluding money market fund holdings, if any. |
What Were The Fund Costs For The Last Year ?
(Based on a hypothetical $10,000 investment)
| Fund | Costs of a $10,000 investment | Costs paid as a percentage of a $10,000 investment |
| Invesco S&P 500® Equal Weight Materials ETF | $46 | 0.40% |
How Did The Fund Perform During The Period?
• During the fiscal year ended April 30, 2026, U.S. equities experienced positive returns for the majority of the year, although geopolitical conflict towards the end of the year sparked bouts of increased volatility. During the period, materials stocks underperformed the broader market. The Fund's focus on material securities created a performance headwind compared to the S&P 500® Index.
• The Fund is passively managed and seeks to track the investment results (before fees and expenses) of the S&P 500® Equal Weight Materials Index (the “Index”). The Fund generally will invest at least 90% of its total assets in securities that comprise the Index.
• For the fiscal year ended April 30, 2026, the Fund's performance, on a net asset value ("NAV") basis, 30.05%, differed from the return of the Index, 30.58%, primarily due to fees and expenses incurred by the Fund during the period.
What contributed to performance?
Industry Allocations | Chemicals industry, followed by metals & mining and construction materials industries, respectively.
Positions | Albemarle Corp., a chemicals company, and Newmont Corp., a metals & mining company.
What detracted from performance?
Industry Allocations | No industries detracted from the Fund's performance during the period.
Positions | International Paper Co., a containers & packaging company, and Eastman Chemical Co., a chemicals company (no longer held at fiscal year-end).
How Has The Fund Historically Performed?
Growth of $10,000 Investment
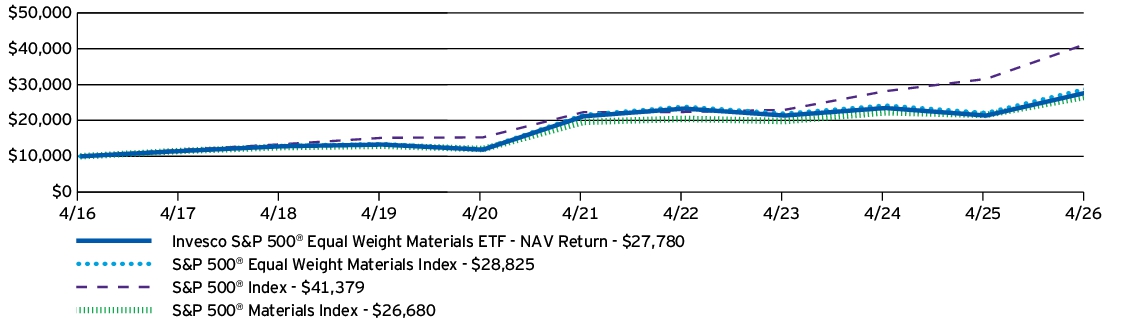
AVERAGE ANNUAL TOTAL RETURNS |
1 Year |
5 Years |
10 Years |
| Invesco S&P 500® Equal Weight Materials ETF — NAV Return | 30.05% | 5.61% | 10.76% |
| S&P 500® Equal Weight Materials Index | 30.58% | 5.99% | 11.17% |
| S&P 500® Index | 31.05% | 13.14% | 15.26% |
| S&P 500® Materials Index | 23.85% | 6.37% | 10.31% |
Performance figures do not reflect deduction of taxes a shareholder would pay on Fund distributions or sale of Fund shares.
What Are Key Statistics About The Fund?
(as of April 30, 2026)
| Fund net assets | $180,895,576 |
| Total number of portfolio holdings | 29 |
| Total advisory fees paid | $665,605 |
| Portfolio turnover rate | 34% |
What Comprised The Fund's Holdings?
(as of April 30, 2026)
Top ten holdings*
(% of net assets)
(% of net assets)
| Nucor Corp. | 4.92% |
| Steel Dynamics, Inc. | 4.65% |
| Dow, Inc. | 4.42% |
| Albemarle Corp. | 4.39% |
| CRH PLC | 4.27% |
| Vulcan Materials Co. | 4.25% |
| LyondellBasell Industries N.V., Class A | 4.15% |
| Air Products and Chemicals, Inc. | 4.05% |
| PPG Industries, Inc. | 3.91% |
| Linde PLC | 3.90% |
| * Excluding money market fund holdings, if any. |
Industry allocation
(% of net assets)
(% of net assets)
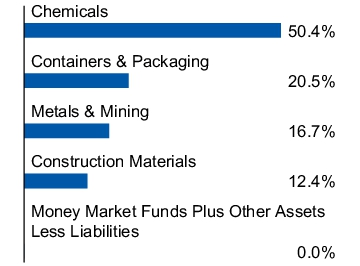
Top ten holdings*
(% of net assets)
(% of net assets)
| Nucor Corp. | 4.92% |
| Steel Dynamics, Inc. | 4.65% |
| Dow, Inc. | 4.42% |
| Albemarle Corp. | 4.39% |
| CRH PLC | 4.27% |
| Vulcan Materials Co. | 4.25% |
| LyondellBasell Industries N.V., Class A | 4.15% |
| Air Products and Chemicals, Inc. | 4.05% |
| PPG Industries, Inc. | 3.91% |
| Linde PLC | 3.90% |
| * Excluding money market fund holdings, if any. |
What Were The Fund Costs For The Last Year ?
(Based on a hypothetical $10,000 investment)
| Fund | Costs of a $10,000 investment | Costs paid as a percentage of a $10,000 investment |
| Invesco S&P 500® Equal Weight Communication Services ETF | $42 | 0.40% |
How Did The Fund Perform During The Period?
• During the fiscal year ended April 30, 2026, U.S. equities experienced positive returns for the majority of the year, although geopolitical conflict towards the end of the year sparked bouts of increased volatility. During the period, communication services stocks outperformed the broader market. Despite this, Fund's equal weighting methodology created a performance headwind compared to the S&P 500® Index.
• The Fund is passively managed and seeks to track the investment results (before fees and expenses) of the S&P 500® Equal Weight Communication Services Plus Index (the “Index”). The Fund generally will invest at least 90% of its total assets in securities that comprise the Index.
• For the fiscal year ended April 30, 2026, the Fund's performance, on a net asset value ("NAV") basis, 10.39%, differed from the return of the Index, 10.19%, primarily due to income received from the securities lending program in which the Fund participates, partially offset by fees and expenses incurred by the Fund during the period.
What contributed to performance?
Industry Allocations | Entertainment industry, followed by the interactive media & services and diversified telecommunication services industries, respectively.
Positions | Warner Bros. Discovery, Inc., an entertainment company, and Alphabet, Inc., Class A, an interactive media & services company.
What detracted from performance?
Industry Allocations | Media industry, followed by the wireless telecommunication services industry.
Positions | Trade Desk, Inc. (The), Class A, a media company, and Charter Communications, Inc., Class A, a media company.
How Has The Fund Historically Performed?
Growth of $10,000 Investment
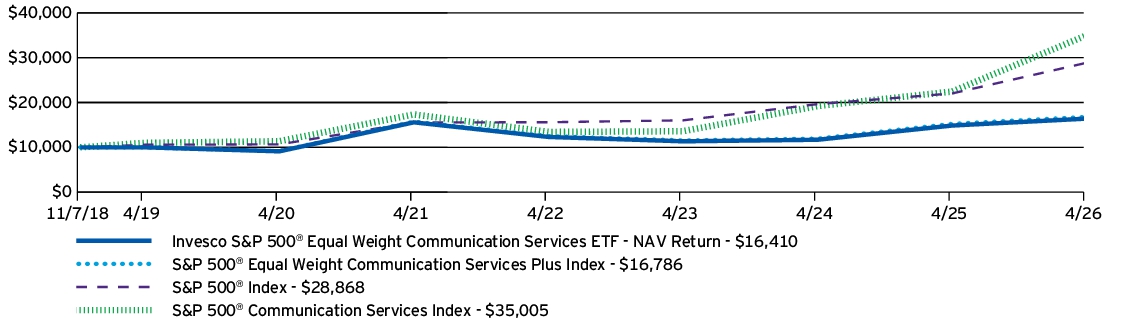
AVERAGE ANNUAL TOTAL RETURNS |
1 Year |
5 Years |
Since Inception (11/7/18) |
| Invesco S&P 500® Equal Weight Communication Services ETF — NAV Return | 10.39% | 1.04% | 6.84% |
| S&P 500® Equal Weight Communication Services Plus Index | 10.19% | 1.30% | 7.17% |
| S&P 500® Index | 31.05% | 13.14% | 15.23% |
| S&P 500® Communication Services Index | 55.91% | 15.08% | 18.23% |
Performance figures do not reflect deduction of taxes a shareholder would pay on Fund distributions or sale of Fund shares.
What Are Key Statistics About The Fund?
(as of April 30, 2026)
| Fund net assets | $64,223,952 |
| Total number of portfolio holdings | 28 |
| Total advisory fees paid | $277,687 |
| Portfolio turnover rate | 38% |
What Comprised The Fund's Holdings?
(as of April 30, 2026)
Top ten holdings*
(% of net assets)
(% of net assets)
| EchoStar Corp., Class A | 5.06% |
| Paramount Skydance Corp. | 4.75% |
| Walt Disney Co. (The) | 4.74% |
| Pinterest, Inc., Class A | 4.67% |
| Take-Two Interactive Software, Inc. | 4.67% |
| Electronic Arts, Inc. | 4.66% |
| New York Times Co. (The), Class A | 4.66% |
| Netflix, Inc. | 4.55% |
| Warner Bros. Discovery, Inc. | 4.48% |
| AT&T, Inc. | 4.43% |
| * Excluding money market fund holdings, if any. |
Industry allocation
(% of net assets)
(% of net assets)
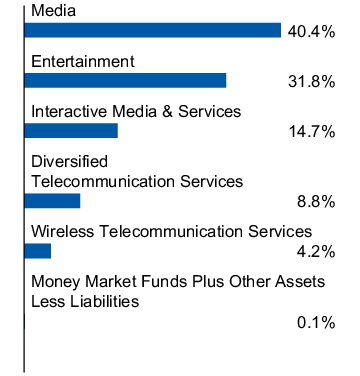
Top ten holdings*
(% of net assets)
(% of net assets)
| EchoStar Corp., Class A | 5.06% |
| Paramount Skydance Corp. | 4.75% |
| Walt Disney Co. (The) | 4.74% |
| Pinterest, Inc., Class A | 4.67% |
| Take-Two Interactive Software, Inc. | 4.67% |
| Electronic Arts, Inc. | 4.66% |
| New York Times Co. (The), Class A | 4.66% |
| Netflix, Inc. | 4.55% |
| Warner Bros. Discovery, Inc. | 4.48% |
| AT&T, Inc. | 4.43% |
| * Excluding money market fund holdings, if any. |
| [1] | Reflects fee waivers and/or expense reimbursements, without which expenses would have been higher. |
| [2] | Reflects fee waivers and/or expense reimbursements, without which expenses would have been higher. |
| [3] | Reflects fee waivers and/or expense reimbursements, without which expenses would have been higher. |
| [4] | Reflects fee waivers and/or expense reimbursements, without which expenses would have been higher. |
| [5] | Reflects fee waivers and/or expense reimbursements, without which expenses would have been higher. |
| [6] | Reflects fee waivers and/or expense reimbursements, without which expenses would have been higher. |
| [7] | Reflects fee waivers and/or expense reimbursements, without which expenses would have been higher. |
| [8] | Reflects fee waivers and/or expense reimbursements, without which expenses would have been higher. |
| [9] | Reflects fee waivers and/or expense reimbursements, without which expenses would have been higher. |
| [10] | Reflects fee waivers and/or expense reimbursements, without which expenses would have been higher. |
| [11] | Reflects fee waivers and/or expense reimbursements, without which expenses would have been higher. |
| [12] | Reflects fee waivers and/or expense reimbursements, without which expenses would have been higher. |
| [13] | Reflects fee waivers and/or expense reimbursements, without which expenses would have been higher. |
| [14] | Reflects fee waivers and/or expense reimbursements, without which expenses would have been higher. |
| [15] | Reflects fee waivers and/or expense reimbursements, without which expenses would have been higher. |
| [16] | Reflects fee waivers and/or expense reimbursements, without which expenses would have been higher. |
| [17] | Reflects fee waivers and/or expense reimbursements, without which expenses would have been higher. |
| [18] | Reflects fee waivers and/or expense reimbursements, without which expenses would have been higher. |
| [19] | Reflects fee waivers and/or expense reimbursements, without which expenses would have been higher. |